EP0568351B1 - Verfahren und Vorrichtung zur optischen Anzeige von Röntgenstrahlung. - Google Patents
Verfahren und Vorrichtung zur optischen Anzeige von Röntgenstrahlung. Download PDFInfo
- Publication number
- EP0568351B1 EP0568351B1 EP93303333A EP93303333A EP0568351B1 EP 0568351 B1 EP0568351 B1 EP 0568351B1 EP 93303333 A EP93303333 A EP 93303333A EP 93303333 A EP93303333 A EP 93303333A EP 0568351 B1 EP0568351 B1 EP 0568351B1
- Authority
- EP
- European Patent Office
- Prior art keywords
- pixel
- ray
- colour
- colour component
- visual
- Prior art date
- Legal status (The legal status is an assumption and is not a legal conclusion. Google has not performed a legal analysis and makes no representation as to the accuracy of the status listed.)
- Expired - Lifetime
Links
Images


Classifications
-
- H—ELECTRICITY
- H01—ELECTRIC ELEMENTS
- H01J—ELECTRIC DISCHARGE TUBES OR DISCHARGE LAMPS
- H01J37/00—Discharge tubes with provision for introducing objects or material to be exposed to the discharge, e.g. for the purpose of examination or processing thereof
- H01J37/252—Tubes for spot-analysing by electron or ion beams; Microanalysers
- H01J37/256—Tubes for spot-analysing by electron or ion beams; Microanalysers using scanning beams
-
- G—PHYSICS
- G01—MEASURING; TESTING
- G01N—INVESTIGATING OR ANALYSING MATERIALS BY DETERMINING THEIR CHEMICAL OR PHYSICAL PROPERTIES
- G01N23/00—Investigating or analysing materials by the use of wave or particle radiation, e.g. X-rays or neutrons, not covered by groups G01N3/00 – G01N17/00, G01N21/00 or G01N22/00
- G01N23/22—Investigating or analysing materials by the use of wave or particle radiation, e.g. X-rays or neutrons, not covered by groups G01N3/00 – G01N17/00, G01N21/00 or G01N22/00 by measuring secondary emission from the material
- G01N23/223—Investigating or analysing materials by the use of wave or particle radiation, e.g. X-rays or neutrons, not covered by groups G01N3/00 – G01N17/00, G01N21/00 or G01N22/00 by measuring secondary emission from the material by irradiating the sample with X-rays or gamma-rays and by measuring X-ray fluorescence
-
- G—PHYSICS
- G01—MEASURING; TESTING
- G01N—INVESTIGATING OR ANALYSING MATERIALS BY DETERMINING THEIR CHEMICAL OR PHYSICAL PROPERTIES
- G01N23/00—Investigating or analysing materials by the use of wave or particle radiation, e.g. X-rays or neutrons, not covered by groups G01N3/00 – G01N17/00, G01N21/00 or G01N22/00
- G01N23/22—Investigating or analysing materials by the use of wave or particle radiation, e.g. X-rays or neutrons, not covered by groups G01N3/00 – G01N17/00, G01N21/00 or G01N22/00 by measuring secondary emission from the material
- G01N23/225—Investigating or analysing materials by the use of wave or particle radiation, e.g. X-rays or neutrons, not covered by groups G01N3/00 – G01N17/00, G01N21/00 or G01N22/00 by measuring secondary emission from the material using electron or ion
- G01N23/2251—Investigating or analysing materials by the use of wave or particle radiation, e.g. X-rays or neutrons, not covered by groups G01N3/00 – G01N17/00, G01N21/00 or G01N22/00 by measuring secondary emission from the material using electron or ion using incident electron beams, e.g. scanning electron microscopy [SEM]
- G01N23/2252—Measuring emitted X-rays, e.g. electron probe microanalysis [EPMA]
-
- G—PHYSICS
- G01—MEASURING; TESTING
- G01N—INVESTIGATING OR ANALYSING MATERIALS BY DETERMINING THEIR CHEMICAL OR PHYSICAL PROPERTIES
- G01N2223/00—Investigating materials by wave or particle radiation
- G01N2223/07—Investigating materials by wave or particle radiation secondary emission
- G01N2223/076—X-ray fluorescence
Definitions
- the invention relates to apparatus and methods for displaying a visual image of the X-ray response of a specimen.
- X-ray maps These images are commonly referred to as "X-ray maps” and are commonly displayed using a computer monitor using a separate colour or hue for each element.
- the "silicon” map could be displayed in yellow, the “iron” map in red, the “titanium” map in green etc.
- An example of such a system is described in US-A-4857731.
- Images have also been combined by processing to show where certain elements co-exist in regions of a specimen. That is, once the original X-ray map data have been acquired, the images are inspected (either by the user, or by some automatic mathematical technique such as principal component analysis) and then recombined in suitable combinations to reveal the distribution of phases in the specimen (where each phase consists of elements occurring in specific ratios and is shown in a suitable colour).
- US-A-4439680 describes a system in which detected X-ray energy is converted to electrical pulses, the height of which is proportional to the detected X-ray energy.
- the pulse signals are coded so as to trigger or energise the guns of a conventional colour cathode ray tube.
- This system achieves "real-time” display but requires that the X-ray energy pulses be converted to hue and displayed "on the fly", at the speed of a conventional TV scan.
- X-ray photons arrive with a random (Poisson) time distribution so that "pile up" in the spectrometer can occur before each photon is measured.
- Intensity information is distorted if the beam moves significantly during the time it takes to measure a single photon which is typically several to tens of microseconds with a Si(Li) detection system. Furthermore, measured photon rates are invariably low ( ⁇ 100kHz) so images will only be scattered "dots" if the average number of photons per pixel is less than one. Thus, a live TV-rate scan (roughly 0.1 microseconds per pixel) gives a very noisy X-ray image with the potential for substantial intensity distortion.
- the apparatus for displaying a visual image of the X-ray response of a specimen, the apparatus comprising means for exciting X-ray emissions from a specimen; detection means for detecting X-ray photons emitted from pixels defined by the specimen; visual colour component generating means responsive to the detected X-ray photons to generate visual colour component signals and display means, characterised in that the visual colour component generating means generates for each pixel sets of visual colour component signals related to the energies of x-ray photons emitted from the pixel and detected by the detector, wherein the range of detected X-ray energies is mapped into a range of visual colours; in that accumulator means is provided for combining for each pixel the respective colour component signals of each set into a single set of colour components for the pixel; and in that the display means is responsive to the colour component signals from the accumulator means to display an image in which the colour of each displayed pixel is defined by the combined effect of the single set of colour components for the
- a method for displaying a visual image of the X-ray response of a specimen comprising exciting X-ray emissions from a specimen; detecting X-ray photons emitted by the specimen;
- the generating step comprises generating, for each pixel defined by the specimen, sets of visual colour component signals related to the energies of detected X-ray photons emitted from the pixel wherein the range of detected X-ray energies is mapped into a range of visual colours; and in that the method further comprises combining for each pixel the respective colour component signals of each set into a single set of colour components for that pixel, and in that the displaying step comprise displaying an image in which the colour of each displayed pixel is defined by the combined effect of the single set of colour components for the corresponding specimen pixel.
- the X-ray spectrum which is invisible to the human observer, is converted or mapped into the spectrum of visible colours.
- long wavelengths (low energy) X-rays can be converted to red and higher energies are converted to the standard optical "rainbow" of colours so that the highest energy X-rays may appear in blue.
- accumulator means it is possible to build up a representation of the range of energies of X-ray photons received from each pixel, these ranges then being individually mapped into the corresponding range of visual colours leading to a more useful display of the elements present in the specimen.
- the accumulator means allows us to dwell for as long as we like on a single pixel to accumulate sufficient X-ray data to get a clear estimate of compositional colour and also to make corrections for pile-up which will be accurate for that pixel.
- the detection means detects individual photons and outputs signals representing the energy of each photon
- the visual colour component generating means generating a set of colour component signals for each photon.
- the apparatus further comprises second accumulator means including an accumulator for each of a number of X-ray energy bands, each accumulator storing, during the period for which a pixel is scanned, the number of photons generated in the corresponding energy band, wherein the visual colour component generating means generates a set of colour component signals for each energy band scaled by the values stored in the respective accumulators.
- the plurality of energy bands will be adjacent to one another although in some cases, these could be spaced apart (e.g. 1-3keV, 4-5 keV, 6-10 keV).
- energy is used to refer to the energy of a single X-ray photon.
- the resulting image defined by the colour component signals can be displayed in full colour on a display device such as a CRT and the image will display all the normal properties of real colour objects that human operators are used to seeing.
- objects which have the same chemical composition tend to have a characteristic colour which is independent of signal intensity.
- this characteristic colour is only slightly affected by surface topography and orientation of the sample.
- Objects with different chemical composition often show different colours.
- the processing can be accomplished within the acquisition time for a single pixel so a continuously updating image can be viewed "real time".
- the means for exciting X-ray emissions comprises a focused beam of electrons but other excitation means could be used, for example a micro-collimated X-ray beam or a focused photon beam.
- the beam would be scanned across the specimen in a step-wise manner so as to excite a response from discrete pixels, that response being processed as described resulting in a set of colour component control signals which are then used to generate a resultant colour for that pixel.
- the detection means can comprise any conventional X-ray energy dispersive detector system such as the Link eXL or Link ISIS manufactured by Oxford Instruments, Microanalysis Group.
- the output signal generated by the detection means may represent the energy of an individual photon or the mean intensity for a restricted range of photon energies.
- the visual colour component control signal generating means will typically comprise a mixture of hardware and software components.
- the visual colour component generating means includes one or more look-up tables (LUTs) which contain data defining the visual colour component control signal values corresponding to each X-ray energy value output by the detector or each mean energy band level.
- LUTs look-up tables
- the precise mapping between the X-ray energies and corresponding colour component intensities is not critical but is preferably arranged such that the resultant images show a realistic and reproducible colour effect and different compositions will present different visual colours in the displayed image.
- n i is proportional to the number of x-rays in energy band i, with mean energy E i , which are detected in the total pixel dwell time
- C i is the colour vector (r,g,b components) which should be used for photons of energy E i and Sum i indicates the sum for all energy bands i detected.
- Another way of reducing the noise is to acquire a digital X-ray image and by computer processing, replace each pixel intensity with the average intensity for all pixels in a small region surrounding the pixel. Obviously, this has a "blurring" effect on the final image and the degree of blurring depends on both the method of averaging and the size of the region around each pixel. The more the image is blurred, the better the level of noise reduction so there is an effective limit on attainable resolution set by the degree of noise in the original data.
- the apparatus further comprises an auxiliary detector for detecting another characteristic of the specimen; and modifying means for modifying the colour component signals from the accumulator means so as to modify the luminance of each pixel while leaving the hue and saturation substantially unchanged.
- This extension of the invention makes use of the fact that although the intensity information in the X-ray data is very noisy, the hue and saturation are usually determined with higher precision. This can be seen by considering a spectrum from a pure element where most X-rays emerge with the characteristic X-ray energy for that element; although we may accumulate only a few photons, n, in a small measurement interval so the statistical fluctuation (n 0.5 ) is large, photons of the same energy are converted to the same R,G,B result so the proportions of R,G,B which affect hue and saturation are the same, however long the acquisition interval. Furthermore, the human eye has more resolution sensitivity to intensity variation or luminance than to variations in hue and saturation or chromaticity.
- the additional information is generated by monitoring backscattered electrons (BSED) or secondary electrons (SED) emitted by the specimen.
- BSED backscattered electrons
- SED secondary electrons
- These signals are used conventionally to generate high resolution images on electron microscopes and are of high resolution and relatively free of noise but are essentially monochrome.
- SCD Specimen current detector (measures absorbed specimen current); or transmitted electron detector (measures electrons that have passed through the sample).
- the preferred arrangements make use of the accumulated X-ray data at each pixel to determine the chromaticity (balance of red, green and blue) and uses the auxiliary signals such as an electron signal to determine the luminance of the pixel as displayed in the final image. Even if the image acquisition time is short, the colour content provided by the X-ray data will be sufficiently well resolved to "paint" the high resolution electron image in the appropriate colours. In general, the electron signal data would be acquired at the same time as the X-ray data. If greater scan speeds are required, the X-ray data can be obtained at fewer points than the electron signal data, the intervening points being determined by interpolation.
- This preferred technique retains the advantage of the original in that compounds exhibit a characteristic colour, even though two compounds may fortuitously give the same colour.
- the degree of colour content in the image could be left for the operator to adjust.
- the original b/w image of the electron signal would show the best possible resolution and no colour whatsoever.
- the colour of a pixel would be completely determined by the X-ray data. In between, the operator would be effectively adjusting the degree of "saturation" of the available colour signal.
- processing aspects of the invention can be implemented in hardware or software.
- the apparatus shown in Figure 1 comprises a conventional X-ray acquisition system 1 which is shown schematically in the drawing.
- the system 1 includes a support 2 on which is provided a specimen 3.
- a specimen 3 Above the specimen 3 is an electron beam source 4 while an energy dispersive X-ray detector 5 is positioned to receive X-rays or X-ray photons emitted by the specimen 3.
- a suitable detection system is the "Link eXL” or “Link ISIS” (Registered Trade Marks) manufactured by Link Analytical Limited.
- the components so far described would normally be housed in a vacuum chamber (not shown).
- the electron beam source 4 can be deflected, alternatively, the support 2 can be moved relative to the electron beam, so that the beam scans the specimen 3.
- the scan would be an orthogonal raster scan achieved under the control of a controller 6.
- the detector 5 outputs analogue signals which depend upon the energies of incoming X-ray photons. In this case, the detector 5 detects individual photons so that the output signal will represent the energy of each individual photon in sequence as it is received.
- coarser resolution detectors could also be used which generate a series of output signals, where each signal represents the average energy of x-rays received within a particular range of intensity during the dwell time while the electron beam from the source 4 impinges on a particular pixel position on the specimen 3. This will be described later.
- Each photon measurement signal from the detector 5 is digitised in an analogue-to-digital converter 7 and the resultant, digitised signal fed to a group of three look-up tables LUTs 8 which convert the energy into three visual colour component values red (R), green (G) and blue (B).
- the content of a suitable set of the LUTs 8 is shown in Figure 2.
- a separate LUT is provided for each of the three colour components red, green, and blue and for example if the incoming value represents an energy of E 1 then the output data values from the LUTs 8 will have the values R 1 , G 1 , B 1 .
- the output colour component values from the LUTs 8 are fed to an accumulator 9 which sums them with the corresponding R, G and B values respectively received since the start of the dwell time for the current pixel to generate final R, G, B values for this pixel.
- this accumulator 9 adds up the results for every photon that arrives while the electron beam dwells at this pixel position on the specimen 3.
- the accumulator 9 will hold three totals for R, G and B which are used to represent the colour component densities which will be used for display of that pixel.
- the frame store provides additional signal averaging for multiple scans over the field of view.
- the colour component values control the display of an image of the pixel on a monitor 11 in a conventional manner.
- Conventional scaling and quantisation removal techniques may be required so that the display system provides an optimal representation of the colour described by the colour component values in the frame store.
- the dwell time per pixel will be about 1 millisecond although with the best detectors currently available, this could be reduced to 100 microseconds thus providing a very quick scan of the specimen.
- the detector 5 is a single detector which can detect individual photons and output signals representing the energy of those individual photons, those energy signals being fed directly to the LUTs 8 for conversion to R,G,B colour components.
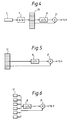
- Figure 4 illustrates an alternative configuration in which the output signals from the A/D convertor 7 are fed to a set of accumulators 20 (for example 32) each of which is associated with the respective band of X-ray energies. Each accumulator is incremented when a photon with an energy falling within the corresponding energy band determined by the A/D result is detected. At the end of the pixel dwell time, the accumulators 20 will hold values defining the total numbers of photons received in each energy band for that pixel.
- the controller 6 causes the accumulators 20 to be down loaded in sequence to a multiplier 21 while at the same time a mean energy value for the energy band is fed to the LUTs 8.
- the resulting set of colour component signals R,G,B from the LUTs 8 are then multiplied by the value from the accumulator 20 by the multiplier 21 and the resultant, modified colour components are then fed to the accumulator 9.
- Figure 5 illustrates a further alternative in which the detector 5 is replaced by a multi-segment detector 5' (for example a CCD array) which not only detects photons but stores a signal proportional to the number of photons received in each element.
- a dispersive element such as curved "Bragg" reflecting crystal, (not shown), can be used as a "prism” to direct photons of different energy on to different segments of the multi-segment detector.
- the different segments will store signals proportional to the number of photons received in each of a number of energy bands in a similar way to the accumulator 20 of Figure 4.
- These counts are then down loaded in sequence to the multiplier 21 while signals defining the mean energy level of the corresponding energy band are fed to the LUTs 8 which generates R,G,B values which are multiplied in the multiplier 21 as in Figure 4.
- Figure 6 illustrates a further alternative in which the detector 5 is replaced by a set of individual detectors 5'', for example Bragg Crystal Spectrometers which are responsive to photons in respective energy bands and generate signals from corresponding counters constituting the number of photons received in the energy band concerned. These signals are fed to the multiplier 21 while the mean energy level for the energy band in question is fed to the LUTs 8 as in the Figure 5 example.
- a set of individual detectors 5'' for example Bragg Crystal Spectrometers which are responsive to photons in respective energy bands and generate signals from corresponding counters constituting the number of photons received in the energy band concerned.
- the various examples of the invention described can be further modified to obtain sophisticated display by detecting backscattered or secondary electrons using a conventional detector 12 whose output signal is fed to an A/D converter 13, the digital output of which is then fed to a colour mixer 14.
- the detector 12 could be a Link Tetra (Registered Trade Mark) manufactured by Oxford Instruments, Microanalysis Group to detect backscattered electrons.
- the colour component signals R,G,B from the accumulator 9 are fed instead to the colour mixer 14 where they are modified, as will be explained below, the resultant colour component signals then being fed to the frame store 10.
- the detector 12 detects the intensity of the electron signal obtained from each pixel and this is used to control the luminance of the colour signal derived from the X-ray data which controls hue and saturation or chromaticity.
- One way of combining the signals is to allow the operator to select how much of the colour signal is to be combined with the electron signal.
- a prescribed proportion, f, of the X-ray colour signal (X r , X g , X b ) is added to the electron signal E r , E g , E b ) and the result scaled so that the luminance matches that for the electron signal.
- the overall system shown in Figure 1 can achieve scanning at a rate greater than one ms per pixel.
- the X-ray data would be obtained on a coarser grid than the electron image and the X-ray image would then be interpolated up in a conventional manner to the same resolution of the electron image before applying the colour mixer.
- two separate scans of the specimen could be carried out, one for the electron image and one for the X-ray image and then the result combined.
- the invention may be used with any X-ray detection system that, by whatever means, produces an output which gives some indication of the spectral energy distribution for emitted X-rays.
- a unique aspect of the invention is in the use of X-ray spectral energy information to, objectively, colour code a high resolution luminance signal.
Landscapes
- Chemical & Material Sciences (AREA)
- Analytical Chemistry (AREA)
- Physics & Mathematics (AREA)
- Health & Medical Sciences (AREA)
- Life Sciences & Earth Sciences (AREA)
- Biochemistry (AREA)
- General Health & Medical Sciences (AREA)
- General Physics & Mathematics (AREA)
- Immunology (AREA)
- Pathology (AREA)
- Analysing Materials By The Use Of Radiation (AREA)
Description
Claims (16)
- Apparatus for displaying a visual image of the X-ray response of a specimen, the apparatus comprising means (4) for exciting X-ray emissions from a specimen; detection means (5) for detecting X-ray photons emitted from pixels defined by the specimen; visual colour component generating means (8) responsive to the detected X-ray photons to generate visual colour component signals, and display means (11), characterised in that the visual colour component generating means generates for each pixel sets of visual colour component signals related to the energies of x-ray photons emitted from the pixel and detected by the detector, wherein the range of detected X-ray energies is mapped into a range of visual colours; in that accumulator means (9) is provided for combining for each pixel the respective colour component signals of each set into a single set of colour components for the pixel; and in that the display means (11) is responsive to the colour component signals from the accumulator means to display an image in which the colour of each displayed pixel is defined by the combined effect of the single set of colour components for the corresponding specimen pixel.
- Apparatus according to claim 1, wherein the means for exciting X-ray emissions comprises a focused beam of electrons.
- Apparatus according to claim 1 or claim 2, wherein the means for exciting X-ray emissions comprises a radiation beam which is scanned across the specimen in a step-wise manner so as to excite a response from discrete pixels.
- Apparatus according to any of claims 1 to 3, wherein the detection means (5) detects individual photons and outputs signals representing the energy of each photon, the visual colour component generating means generating a set of colour component signals for each photon.
- Apparatus according to claim 4, further comprising second accumulator means (20) including an accumulator for each of a number of X-ray energy bands, each accumulator storing, during the period for which a pixel is scanned, the number of photons generated in the corresponding energy band, wherein the visual colour component generating means (8) generates a set of colour component signals for each energy band scaled by the values stored in the respective accumulators.
- Apparatus according to any of claims 1 to 3, wherein the detection means (5) determines, during the period for which a pixel is scanned, the number of photons generated in each of a plurality of energy bands, wherein the visual colour component generating means (8) generates a set of colour component signals for each energy band scaled by the number of photons generated in that energy band.
- Apparatus according to claim 6, wherein the detection means (5',5'') comprises a plurality of individual detectors, one for each energy band.
- Apparatus according to any of the preceding claims, wherein the visual colour component generating means (8) includes one or more look-up tables (LUTs) which contain data defining the visual colour component control signal values corresponding to each X-ray energy value or mean X-ray energy band.
- Apparatus according to claim 8, when dependent on any of claims 5 to 7, wherein the output from the or each LUT (8) is fed to a multiplier (21) where it is multiplied by a value defining the number of photons in the corresponding energy band.
- Apparatus according to any of the preceding claims, further comprising an auxiliary detector (12) for detecting another characteristic of the specimen; and modifying means (14) for modifying the colour component signals from the accumulator means (9) so as to modify the luminance of each pixel while leaving the hue and saturation substantially unchanged.
- Apparatus according to claim 10, wherein the auxiliary detector (12) detects back scattered electrons or secondary electrons emitted by the specimen.
- Apparatus according to claim 11, wherein the colour component signals supplied to the display means for each pixel are generated in accordance with the formula:X is a vector representing the single set of colour components for the pixel,E is a vector representing the electron signal (Er, Eg, Eb, where Er = Eg = Eb as it is monochrome) for the pixel,XB and EB are the mean luminances for the two signals (e.g. XB = (Xr + Xg + Xb)/3) andf is the proportion of X-ray colour to include in the final mix.
- Apparatus according to claim 11, wherein the colour component signals supplied to the display means for each pixel are generated in accordance with the formula:X is a vector representing the single set of colour components for the pixel,E is a vector representing the electron signal (Er, Eg, Eb, where Er = Eg = Eb as it is monochrome) for that pixel,XB and EB are the mean luminances for the two signals (e.g. XB = (Xr + Xg + Xb)/3) andf is the proportion of X-ray colour to include in the final mix.
- A method for displaying a visual image of the X-ray response of a specimen, the method comprising exciting X-ray emissions from a specimen; detecting X-ray photons emitted by the specimen; generating visual colour component signals responsive to the detected X-ray photons, and displaying a colour image, characterised in that the generating step comprises generating, for each pixel defined by the specimen, sets of visual colour component signals related to the energies of detected X-ray photons emitted from the pixel wherein the range of detected X-ray energies is mapped into a range of visual colours; and in that the method further comprises combining for each pixel the respective colour component signals of each set into a single set of colour components for that pixel, and in that the displaying step comprises displaying an image in which the colour of each displayed pixel is defined by the combined effect of the single set of colour components for the corresponding specimen pixel.
- A method according to claim 14, wherein the detecting step comprises detecting individual photons and generating signals representing the energy of each photon, wherein a set of colour component signals is generated for each photon.
- A method according to claim 15, further comprising storing, during the period for which a pixel is scanned, the number of photons generated in each of a number of X-ray energy bands, the visual colour component generating step comprising generating a set of colour component signals for each energy band scaled by the values stored for that energy band.
Applications Claiming Priority (2)
| Application Number | Priority Date | Filing Date | Title |
|---|---|---|---|
| GB9209500 | 1992-05-01 | ||
| GB929209500A GB9209500D0 (en) | 1992-05-01 | 1992-05-01 | X-ray analysis apparatus |
Publications (2)
| Publication Number | Publication Date |
|---|---|
| EP0568351A1 EP0568351A1 (en) | 1993-11-03 |
| EP0568351B1 true EP0568351B1 (en) | 1998-02-18 |
Family
ID=10714896
Family Applications (1)
| Application Number | Title | Priority Date | Filing Date |
|---|---|---|---|
| EP93303333A Expired - Lifetime EP0568351B1 (en) | 1992-05-01 | 1993-04-28 | Verfahren und Vorrichtung zur optischen Anzeige von Röntgenstrahlung. |
Country Status (5)
| Country | Link |
|---|---|
| US (1) | US5357110A (en) |
| EP (1) | EP0568351B1 (en) |
| JP (1) | JP3314182B2 (en) |
| DE (1) | DE69317010T2 (en) |
| GB (1) | GB9209500D0 (en) |
Cited By (1)
| Publication number | Priority date | Publication date | Assignee | Title |
|---|---|---|---|---|
| US10705031B2 (en) | 2015-08-27 | 2020-07-07 | Shenzhen Xpectvision Technology Co., Ltd. | X-ray imaging with a detector capable of resolving photon energy |
Families Citing this family (42)
| Publication number | Priority date | Publication date | Assignee | Title |
|---|---|---|---|---|
| WO1996003641A1 (en) * | 1994-07-28 | 1996-02-08 | Kley Victor B | Scanning probe microscope assembly |
| US6337479B1 (en) | 1994-07-28 | 2002-01-08 | Victor B. Kley | Object inspection and/or modification system and method |
| US6265711B1 (en) | 1994-07-28 | 2001-07-24 | General Nanotechnology L.L.C. | Scanning probe microscope assembly and method for making spectrophotometric near-field optical and scanning measurements |
| US5751683A (en) | 1995-07-24 | 1998-05-12 | General Nanotechnology, L.L.C. | Nanometer scale data storage device and associated positioning system |
| US6339217B1 (en) * | 1995-07-28 | 2002-01-15 | General Nanotechnology Llc | Scanning probe microscope assembly and method for making spectrophotometric, near-field, and scanning probe measurements |
| US6255654B1 (en) * | 1995-10-23 | 2001-07-03 | Science Applications International Corporation | Density detection using discrete photon counting |
| US6236050B1 (en) * | 1996-02-02 | 2001-05-22 | TüMER TüMAY O. | Method and apparatus for radiation detection |
| US6466687B1 (en) * | 1997-02-12 | 2002-10-15 | The University Of Iowa Research Foundation | Method and apparatus for analyzing CT images to determine the presence of pulmonary tissue pathology |
| JP3896188B2 (en) * | 1997-06-13 | 2007-03-22 | 株式会社日立製作所 | Image processing device for radiation therapy planning |
| US6752008B1 (en) | 2001-03-08 | 2004-06-22 | General Nanotechnology Llc | Method and apparatus for scanning in scanning probe microscopy and presenting results |
| US6802646B1 (en) | 2001-04-30 | 2004-10-12 | General Nanotechnology Llc | Low-friction moving interfaces in micromachines and nanomachines |
| US6923044B1 (en) | 2001-03-08 | 2005-08-02 | General Nanotechnology Llc | Active cantilever for nanomachining and metrology |
| US7196328B1 (en) | 2001-03-08 | 2007-03-27 | General Nanotechnology Llc | Nanomachining method and apparatus |
| US6787768B1 (en) | 2001-03-08 | 2004-09-07 | General Nanotechnology Llc | Method and apparatus for tool and tip design for nanomachining and measurement |
| AU6061100A (en) | 1999-07-01 | 2001-01-22 | General Nanotechnology, Llc | Object inspection and/or modification system and method |
| US6931710B2 (en) | 2001-01-30 | 2005-08-23 | General Nanotechnology Llc | Manufacturing of micro-objects such as miniature diamond tool tips |
| US7253407B1 (en) | 2001-03-08 | 2007-08-07 | General Nanotechnology Llc | Active cantilever for nanomachining and metrology |
| JP4665335B2 (en) * | 2001-04-26 | 2011-04-06 | 株式会社島津製作所 | Electron beam analyzer |
| US6584413B1 (en) | 2001-06-01 | 2003-06-24 | Sandia Corporation | Apparatus and system for multivariate spectral analysis |
| US6675106B1 (en) | 2001-06-01 | 2004-01-06 | Sandia Corporation | Method of multivariate spectral analysis |
| US7053369B1 (en) | 2001-10-19 | 2006-05-30 | Rave Llc | Scan data collection for better overall data accuracy |
| US6813937B2 (en) | 2001-11-28 | 2004-11-09 | General Nanotechnology Llc | Method and apparatus for micromachines, microstructures, nanomachines and nanostructures |
| JP2005538855A (en) | 2002-09-09 | 2005-12-22 | ジェネラル ナノテクノロジー エルエルシー | Fluid delivery of a scanning probe microscope |
| DE102006033662A1 (en) * | 2006-07-20 | 2008-01-24 | Forschungszentrum Dresden - Rossendorf E.V. | Method for determining a material composition of a material sample |
| US8013869B2 (en) * | 2006-09-13 | 2011-09-06 | Adobe Systems Incorporated | Color selection interface |
| US8154561B1 (en) | 2007-03-22 | 2012-04-10 | Adobe Systems Incorporated | Dynamic display of a harmony rule list |
| DE102009009602A1 (en) * | 2008-10-27 | 2010-04-29 | Ifg - Institute For Scientific Instruments Gmbh | Spectral-resolution electronic X-ray camera |
| GB201102614D0 (en) | 2011-02-15 | 2011-03-30 | Oxford Instr Nanotechnology Tools Ltd | Material identification using multiple images |
| EP2605005A1 (en) * | 2011-12-14 | 2013-06-19 | FEI Company | Clustering of multi-modal data |
| DE102014106887B3 (en) * | 2014-05-15 | 2015-11-05 | Carl Zeiss Ag | Method and apparatus for X-ray spectroscopy |
| TWI573165B (en) * | 2014-12-09 | 2017-03-01 | 財團法人工業技術研究院 | Electron microscope, reader and acquiring elemental spectrum method |
| US9899185B1 (en) * | 2015-04-21 | 2018-02-20 | Applied Materials Israel Ltd. | Resolving ambiguities in an energy spectrum |
| GB201711621D0 (en) | 2017-07-19 | 2017-08-30 | Oxford Instr Nanotechnology Tools Ltd | Improved navigation for electron microscopy |
| EP3614414A1 (en) * | 2018-08-20 | 2020-02-26 | FEI Company | Method of examining a sample using a charged particle microscope |
| US10714309B1 (en) * | 2019-04-04 | 2020-07-14 | Fei Company | Using images from secondary microscope detectors to automatically generate labeled images from primary microscope detectors |
| EP3736562A1 (en) | 2019-05-06 | 2020-11-11 | FEI Company | Method of examining a sample using a charged particle microscope |
| US10928336B1 (en) * | 2019-07-29 | 2021-02-23 | Applied Materials Israel Ltd. | X-ray based evaluation of a status of a structure of a substrate |
| EP3772085A1 (en) * | 2019-08-01 | 2021-02-03 | FEI Company | A method of examining a sample using a charged particle microscope |
| KR102230737B1 (en) * | 2020-06-25 | 2021-03-22 | 대한민국 | Method for determine the atom using 4-color x-ray equipment |
| EP4179301B1 (en) | 2020-07-09 | 2025-10-22 | Oxford Instruments Nanotechnology Tools Limited | Material analysis with multiple detectors |
| WO2023002226A1 (en) | 2021-07-23 | 2023-01-26 | Oxford Instruments Nanotechnology Tools Limited | Improved navigation for electron microscopy |
| CN116359256B (en) * | 2023-04-03 | 2026-04-10 | 苏州亿现电子科技有限公司 | An Integral Detection X-ray Color Imaging Method |
Family Cites Families (9)
| Publication number | Priority date | Publication date | Assignee | Title |
|---|---|---|---|---|
| US2982814A (en) * | 1958-02-14 | 1961-05-02 | Philips Corp | Apparatus for determining the composition and condition of a specimen of material |
| US3812288A (en) * | 1972-11-21 | 1974-05-21 | Edax Int Inc | Television display system |
| US4439680A (en) * | 1980-06-26 | 1984-03-27 | Regents Of The University Of Minnesota | Color-coded mapping system and method for identifying elements in a specimen |
| JPS5736762A (en) * | 1980-08-13 | 1982-02-27 | Matsushita Electric Ind Co Ltd | Color discriminating scan type electron microscope |
| US4857731A (en) * | 1987-04-17 | 1989-08-15 | Jeol Ltd. | Instrument for analyzing specimen |
| JPS6465760A (en) * | 1987-09-03 | 1989-03-13 | Shimadzu Corp | Image display of surface analyzing device |
| JPH0198471U (en) * | 1987-12-22 | 1989-06-30 | ||
| JPH01243352A (en) * | 1988-03-25 | 1989-09-28 | Jeol Ltd | X-ray microanalyzer |
| US5212383A (en) * | 1991-07-29 | 1993-05-18 | David Scharf | Color synthesizing scanning electron microscope |
-
1992
- 1992-05-01 GB GB929209500A patent/GB9209500D0/en active Pending
-
1993
- 1993-04-16 US US08/048,387 patent/US5357110A/en not_active Expired - Lifetime
- 1993-04-28 EP EP93303333A patent/EP0568351B1/en not_active Expired - Lifetime
- 1993-04-28 DE DE69317010T patent/DE69317010T2/en not_active Expired - Lifetime
- 1993-05-06 JP JP12773493A patent/JP3314182B2/en not_active Expired - Fee Related
Cited By (2)
| Publication number | Priority date | Publication date | Assignee | Title |
|---|---|---|---|---|
| US10705031B2 (en) | 2015-08-27 | 2020-07-07 | Shenzhen Xpectvision Technology Co., Ltd. | X-ray imaging with a detector capable of resolving photon energy |
| CN108449982B (en) * | 2015-08-27 | 2020-12-15 | 深圳帧观德芯科技有限公司 | X-ray imaging with detectors capable of resolving photon energies |
Also Published As
| Publication number | Publication date |
|---|---|
| GB9209500D0 (en) | 1992-06-17 |
| EP0568351A1 (en) | 1993-11-03 |
| DE69317010T2 (en) | 1998-06-04 |
| JPH06265490A (en) | 1994-09-22 |
| DE69317010D1 (en) | 1998-03-26 |
| US5357110A (en) | 1994-10-18 |
| JP3314182B2 (en) | 2002-08-12 |
Similar Documents
| Publication | Publication Date | Title |
|---|---|---|
| US5357110A (en) | Visual color mapping X-ray analysis apparatus | |
| US6201240B1 (en) | SEM image enhancement using narrow band detection and color assignment | |
| US7884980B2 (en) | System for capturing graphical images using hyperspectral illumination | |
| US4631576A (en) | Nonuniformity correction system for color CRT display | |
| US4253154A (en) | Line scan and X-ray map enhancement of SEM X-ray data | |
| US4963828A (en) | Picture quality testing method and apparatus for color cathode-ray tube | |
| EP0564008A2 (en) | Improvements in and relating to charged particle beam scanning apparatus | |
| US4034220A (en) | Process and apparatus for the elementary and chemical analysis of a sample by spectrum analysis of the energy of the secondary electrons | |
| KÖRTJE | Image‐EELS: Simultaneous recording of multiple electron energy‐loss spectra from series of electron spectroscopic images | |
| JP2000214187A (en) | Adjustment method and apparatus for digital test and measurement equipment | |
| EP0452825B1 (en) | Method and apparatus for background correction in analysis of a specimen surface | |
| JP2005004995A (en) | Scanning electron microscope | |
| Mollon et al. | The use of CRT displays in research on colour vision | |
| AU2383892A (en) | Color synthesizing scanning electron microscope | |
| JP2722464B2 (en) | Convergence measuring device for color CRT | |
| JP4085370B2 (en) | Image correction method and image correction apparatus | |
| Mott et al. | Saving the photons: mapping X‐rays by position‐tagged spectrometry | |
| EP0664655B1 (en) | Automatic generation of vector reference graticule boxes for a vector scope display | |
| US20260002895A1 (en) | Evaluation Method and Analyzer Apparatus | |
| JPH08222169A (en) | Transmission electron microscope and element distribution observation method | |
| JPH11183380A (en) | Color image display device | |
| US12431325B2 (en) | Sample image observation device and method for same | |
| USRE28153E (en) | Field emission scanning microscope display | |
| Odom et al. | A comparison of camera-based and quantized detectors for image processing on an ion microscope | |
| Crone et al. | New technique for the simultaneous correction of topographical and backscattering artefacts in electron‐excited Auger spectroscopy and microscopy |
Legal Events
| Date | Code | Title | Description |
|---|---|---|---|
| PUAI | Public reference made under article 153(3) epc to a published international application that has entered the european phase |
Free format text: ORIGINAL CODE: 0009012 |
|
| AK | Designated contracting states |
Kind code of ref document: A1 Designated state(s): DE FR GB NL |
|
| 17P | Request for examination filed |
Effective date: 19940426 |
|
| 17Q | First examination report despatched |
Effective date: 19960730 |
|
| GRAG | Despatch of communication of intention to grant |
Free format text: ORIGINAL CODE: EPIDOS AGRA |
|
| GRAG | Despatch of communication of intention to grant |
Free format text: ORIGINAL CODE: EPIDOS AGRA |
|
| GRAH | Despatch of communication of intention to grant a patent |
Free format text: ORIGINAL CODE: EPIDOS IGRA |
|
| GRAH | Despatch of communication of intention to grant a patent |
Free format text: ORIGINAL CODE: EPIDOS IGRA |
|
| GRAA | (expected) grant |
Free format text: ORIGINAL CODE: 0009210 |
|
| AK | Designated contracting states |
Kind code of ref document: B1 Designated state(s): DE FR GB NL |
|
| REF | Corresponds to: |
Ref document number: 69317010 Country of ref document: DE Date of ref document: 19980326 |
|
| ET | Fr: translation filed | ||
| PLBE | No opposition filed within time limit |
Free format text: ORIGINAL CODE: 0009261 |
|
| STAA | Information on the status of an ep patent application or granted ep patent |
Free format text: STATUS: NO OPPOSITION FILED WITHIN TIME LIMIT |
|
| 26N | No opposition filed | ||
| PGFP | Annual fee paid to national office [announced via postgrant information from national office to epo] |
Ref country code: NL Payment date: 20010430 Year of fee payment: 9 |
|
| REG | Reference to a national code |
Ref country code: GB Ref legal event code: IF02 |
|
| PG25 | Lapsed in a contracting state [announced via postgrant information from national office to epo] |
Ref country code: NL Free format text: LAPSE BECAUSE OF NON-PAYMENT OF DUE FEES Effective date: 20021101 |
|
| NLV4 | Nl: lapsed or anulled due to non-payment of the annual fee |
Effective date: 20021101 |
|
| REG | Reference to a national code |
Ref country code: DE Ref legal event code: R082 Ref document number: 69317010 Country of ref document: DE Representative=s name: HAUCK PATENT- UND RECHTSANWAELTE, DE |
|
| REG | Reference to a national code |
Ref country code: GB Ref legal event code: 732E Free format text: REGISTERED BETWEEN 20110616 AND 20110622 |
|
| REG | Reference to a national code |
Ref country code: DE Ref legal event code: R082 Ref document number: 69317010 Country of ref document: DE Representative=s name: HAUCK PATENT- UND RECHTSANWAELTE, DE Effective date: 20110712 Ref country code: DE Ref legal event code: R081 Ref document number: 69317010 Country of ref document: DE Owner name: OXFORD INSTRUMENTS NANOTECHNOLOGY TOOLS LIMITE, GB Free format text: FORMER OWNER: LINK ANALYTICAL LTD., WITNEY, GB Effective date: 20110712 |
|
| PGFP | Annual fee paid to national office [announced via postgrant information from national office to epo] |
Ref country code: DE Payment date: 20120502 Year of fee payment: 20 |
|
| PGFP | Annual fee paid to national office [announced via postgrant information from national office to epo] |
Ref country code: GB Payment date: 20120425 Year of fee payment: 20 Ref country code: FR Payment date: 20120504 Year of fee payment: 20 |
|
| REG | Reference to a national code |
Ref country code: DE Ref legal event code: R071 Ref document number: 69317010 Country of ref document: DE |
|
| REG | Reference to a national code |
Ref country code: GB Ref legal event code: PE20 Expiry date: 20130427 |
|
| PG25 | Lapsed in a contracting state [announced via postgrant information from national office to epo] |
Ref country code: GB Free format text: LAPSE BECAUSE OF EXPIRATION OF PROTECTION Effective date: 20130427 Ref country code: DE Free format text: LAPSE BECAUSE OF EXPIRATION OF PROTECTION Effective date: 20130430 |