EP0551134A1 - Method for evaluating formations and bit conditions - Google Patents
Method for evaluating formations and bit conditions Download PDFInfo
- Publication number
- EP0551134A1 EP0551134A1 EP93100233A EP93100233A EP0551134A1 EP 0551134 A1 EP0551134 A1 EP 0551134A1 EP 93100233 A EP93100233 A EP 93100233A EP 93100233 A EP93100233 A EP 93100233A EP 0551134 A1 EP0551134 A1 EP 0551134A1
- Authority
- EP
- European Patent Office
- Prior art keywords
- bit
- drilling
- tor
- rop
- rpm
- Prior art date
- Legal status (The legal status is an assumption and is not a legal conclusion. Google has not performed a legal analysis and makes no representation as to the accuracy of the status listed.)
- Withdrawn
Links
- 230000015572 biosynthetic process Effects 0.000 title claims abstract description 166
- 238000005755 formation reaction Methods 0.000 title claims abstract description 166
- 238000000034 method Methods 0.000 title claims abstract description 158
- 238000005553 drilling Methods 0.000 claims abstract description 268
- 230000004044 response Effects 0.000 claims abstract description 147
- 230000000694 effects Effects 0.000 claims abstract description 40
- 230000035515 penetration Effects 0.000 claims abstract description 31
- 239000011148 porous material Substances 0.000 claims abstract description 30
- 230000008569 process Effects 0.000 claims abstract description 22
- 238000004458 analytical method Methods 0.000 claims abstract description 20
- 230000002159 abnormal effect Effects 0.000 claims abstract description 16
- 239000011435 rock Substances 0.000 claims description 63
- 238000005259 measurement Methods 0.000 claims description 32
- NCAIGTHBQTXTLR-UHFFFAOYSA-N phentermine hydrochloride Chemical compound [Cl-].CC(C)([NH3+])CC1=CC=CC=C1 NCAIGTHBQTXTLR-UHFFFAOYSA-N 0.000 claims description 11
- 230000001419 dependent effect Effects 0.000 claims description 8
- 238000010297 mechanical methods and process Methods 0.000 claims 16
- 230000005226 mechanical processes and functions Effects 0.000 claims 16
- 101150118300 cos gene Proteins 0.000 description 47
- 230000006870 function Effects 0.000 description 15
- 238000005056 compaction Methods 0.000 description 12
- 230000005251 gamma ray Effects 0.000 description 12
- 235000015076 Shorea robusta Nutrition 0.000 description 11
- 244000166071 Shorea robusta Species 0.000 description 11
- 239000004576 sand Substances 0.000 description 10
- 208000004188 Tooth Wear Diseases 0.000 description 8
- 238000005520 cutting process Methods 0.000 description 8
- 229920000535 Tan II Polymers 0.000 description 6
- 230000009471 action Effects 0.000 description 6
- 230000007423 decrease Effects 0.000 description 5
- 239000003381 stabilizer Substances 0.000 description 5
- 101100234408 Danio rerio kif7 gene Proteins 0.000 description 4
- 101100221620 Drosophila melanogaster cos gene Proteins 0.000 description 4
- 101100398237 Xenopus tropicalis kif11 gene Proteins 0.000 description 4
- 238000004140 cleaning Methods 0.000 description 4
- 230000033001 locomotion Effects 0.000 description 4
- 238000007790 scraping Methods 0.000 description 4
- 239000004215 Carbon black (E152) Substances 0.000 description 3
- 238000012937 correction Methods 0.000 description 3
- 230000003247 decreasing effect Effects 0.000 description 3
- 229930195733 hydrocarbon Natural products 0.000 description 3
- 150000002430 hydrocarbons Chemical class 0.000 description 3
- 239000011159 matrix material Substances 0.000 description 3
- 238000012544 monitoring process Methods 0.000 description 3
- 239000002245 particle Substances 0.000 description 3
- 238000012545 processing Methods 0.000 description 3
- 238000010008 shearing Methods 0.000 description 3
- XLYOFNOQVPJJNP-UHFFFAOYSA-N water Substances O XLYOFNOQVPJJNP-UHFFFAOYSA-N 0.000 description 3
- 239000002131 composite material Substances 0.000 description 2
- 238000013461 design Methods 0.000 description 2
- 238000010586 diagram Methods 0.000 description 2
- 229910003460 diamond Inorganic materials 0.000 description 2
- 239000010432 diamond Substances 0.000 description 2
- 239000012530 fluid Substances 0.000 description 2
- 239000000314 lubricant Substances 0.000 description 2
- 238000011326 mechanical measurement Methods 0.000 description 2
- 101100523500 Arabidopsis thaliana ARAC4 gene Proteins 0.000 description 1
- 230000005856 abnormality Effects 0.000 description 1
- 230000005540 biological transmission Effects 0.000 description 1
- 230000008859 change Effects 0.000 description 1
- 239000000470 constituent Substances 0.000 description 1
- 230000001186 cumulative effect Effects 0.000 description 1
- 235000021438 curry Nutrition 0.000 description 1
- 230000007812 deficiency Effects 0.000 description 1
- 238000009795 derivation Methods 0.000 description 1
- 238000001514 detection method Methods 0.000 description 1
- 238000011156 evaluation Methods 0.000 description 1
- 238000007373 indentation Methods 0.000 description 1
- 239000000203 mixture Substances 0.000 description 1
- 238000012986 modification Methods 0.000 description 1
- 230000004048 modification Effects 0.000 description 1
- 238000006467 substitution reaction Methods 0.000 description 1
- 230000001131 transforming effect Effects 0.000 description 1
Images


Classifications
-
- E—FIXED CONSTRUCTIONS
- E21—EARTH DRILLING; MINING
- E21B—EARTH DRILLING, e.g. DEEP DRILLING; OBTAINING OIL, GAS, WATER, SOLUBLE OR MELTABLE MATERIALS OR A SLURRY OF MINERALS FROM WELLS
- E21B49/00—Testing the nature of borehole walls; Formation testing; Methods or apparatus for obtaining samples of soil or well fluids, specially adapted to earth drilling or wells
- E21B49/003—Testing the nature of borehole walls; Formation testing; Methods or apparatus for obtaining samples of soil or well fluids, specially adapted to earth drilling or wells by analysing drilling variables or conditions
-
- E—FIXED CONSTRUCTIONS
- E21—EARTH DRILLING; MINING
- E21B—EARTH DRILLING, e.g. DEEP DRILLING; OBTAINING OIL, GAS, WATER, SOLUBLE OR MELTABLE MATERIALS OR A SLURRY OF MINERALS FROM WELLS
- E21B12/00—Accessories for drilling tools
- E21B12/02—Wear indicators
-
- E—FIXED CONSTRUCTIONS
- E21—EARTH DRILLING; MINING
- E21B—EARTH DRILLING, e.g. DEEP DRILLING; OBTAINING OIL, GAS, WATER, SOLUBLE OR MELTABLE MATERIALS OR A SLURRY OF MINERALS FROM WELLS
- E21B21/00—Methods or apparatus for flushing boreholes, e.g. by use of exhaust air from motor
- E21B21/08—Controlling or monitoring pressure or flow of drilling fluid, e.g. automatic filling of boreholes, automatic control of bottom pressure
-
- E—FIXED CONSTRUCTIONS
- E21—EARTH DRILLING; MINING
- E21B—EARTH DRILLING, e.g. DEEP DRILLING; OBTAINING OIL, GAS, WATER, SOLUBLE OR MELTABLE MATERIALS OR A SLURRY OF MINERALS FROM WELLS
- E21B44/00—Automatic control systems specially adapted for drilling operations, i.e. self-operating systems which function to carry out or modify a drilling operation without intervention of a human operator, e.g. computer-controlled drilling systems; Systems specially adapted for monitoring a plurality of drilling variables or conditions
Definitions
- This invention relates to a method for evaluating drilling conditions while drilling a borehole. More particularly, this invention relates to a method for evaluating formations and bit condition while drilling. Further, this invention relates to a method for providing drilling alerts when inefficient drilling conditions are identified.
- a drill string generally has a lower portion which is comprised of relatively heavy lengths of uniform diameter drill collar.
- a drill bit is attached to the downhole end of the drill collar, where a portion of the weight of the collar is applied causing the bit to gouge and crush into the earth as the drill string is rotated from the surface (e.g., a rotary table with slips).
- a downhole motor is employed to rotate the bit.
- the downhole motor is generally employed in directional drilling applications.
- Measurement-while-drilling (MWD) systems are known for identifying and evaluating rock formations and monitoring the trajectory of the borehole in real time.
- An MWD tool is generally located in the lower portion of the drill string near the bit. The tool is either housed in a section of drill collar or formed so as to be compatible with the drill collar. It is desirable to provide information of the formation as close to the drill bit as is feasible.
- Several methods for evaluating the formation using the drill bit have been employed. These methods eliminate the time lag between the time the bit penetrates the formation and the time the MWD tool senses that area of the formation.
- the measurements available are rate of penetration (ROP) and bit revolutions per minute (RPM) which are determined at the surface and, downhole weight on bit (WOB) and downhole torque on the bit (TOR) which are derived from real time insitu measurements made by an MWD tool.
- WOB and TOR may be measured by the MWD tools described in U.S. Patent Nos. 4,821,563 and 4,958,517, both of which are assigned to the assignee hereof.
- ROP, RPM, WOB and TOR measurements have been developed to determine certain formation characteristics at the drill bit.
- One such method is disclosed in U.S. Patent No. 4,883,914 to Rasmus.
- the Rasmus patent employs the aforementioned measurements (i.e., ROP, RPM, WOB, and TOR), a gamma ray measurement and a resistivity measurement to detect an overpressure porosity condition.
- the gamma ray and resistivity measurements are included in order to account for the volume of shale and the apparent resistivity in the formation. It is known that an overpressure condition occurs when water is trapped in a porous formation (i.e., overburden).
- U.S. Patent No. 4,852,399 to Falconer discloses a method for distinguishing between argillaceous, porous and tight formations by computing formation strength from ROP, RPM, WOB and TOR.
- the formations are distinguished by setting upper and lower shale limits.
- EP 0351902A1 to Curry et al discloses a method for determining formation porosity from WOB and TOR measurements which factor in the geometry of the drill bit.
- U.S. Patent No. 4,697,650 to Fontenot discloses a method of compiling a history of ROP, RPM, WOB and TOR measurements.
- U.S. Patent No. 4,685,329 to Burgess discloses a method of compiling a history of TOR/WOB and ROP/RPM based ratios in order to identify trends such as bit wear, pore pressure variation and changes in lithology.
- U.S. Patent No. 4,627,276 to Burgess et al discloses a method for determining wear of milled tooth bits from a bit efficiency term which is derived from ROP, RPM, WOB and TOR measurements and bit geometry.
- an MWD tool located near the bit of the drill string provides measurements of downhole weight on bit (WOB) and downhole torque (TOR). Additionally, rate of penetration (ROP) and bit revolutions (RPM) are measured and calculated at the surface. Provisions are made for drag and impact drill bits.
- WB D downhole weight on bit
- ROP rate of penetration
- RPM bit revolutions
- These measurements and bit geometry data are processed by a processor to generate the following outputs: normalized torque (TOR / (WOB D)), rock drillability (ROP D / (WOB RPM)) and drilling response (TOR ROP / (WOB2 RPM)). From these output signals a plurality of processed signals and logs are generated by a plotter. These logs aid in evaluating the formation and the bit.
- lithologies can be identified so that drilling operations can be adjusted accordingly.
- drilling problems e.g., bit balling, stabilizer caught on a borehole ledge, drill string sticking
- Such a plot can be generated at the processor and plotted by a plotter.
- the above signals are further processed with the additional measurements of gamma ray and mud density (mud pressure is derived from mud density) the following signal outputs are provided: drilling response, porosity, porosity compensated for formation effects, differential pressure, pore pressure, drilling alert, bit wear factor (i.e., tooth/cutter wear), torque analysis (i.e., abnormal torque increase or loss) and bearing wear.
- drilling response porosity, porosity compensated for formation effects
- differential pressure i.e., tooth/cutter wear
- torque analysis i.e., abnormal torque increase or loss
- the drilling response log can be used to identify formation changes, underbalance and overbalance drilling conditions, and other drilling problems at the bit while drilling.
- the porosity log provides an early indication of the porosity of the formation to reinforce/substitute other prior art porosity analyses, so that drilling conditions can be modified accordingly for the formation.
- the porosity log compensated for formation effects provides a better indication of a possible commercial hydrocarbon formation.
- the differential pressure log provides an early indication of formation pressure so that drilling conditions can be optimized (e.g., adjust mud density).
- the drilling alert log can be used as an indicator of a potential drilling problem while drilling. The specific drilling problem or problems can be further evaluated by monitoring other logs commonly provided in drilling operations.
- the drilling alert log may indicate that drilling operations should cease and the drill string tripped or that drilling conditions be otherwise modified while drilling continues.
- the torque analysis log provides an early indication of such problems as undergage stablizers, formation squeeze, cutter wear (i.e., tooth wear) and sloughing shales.
- the bearing wear log only applies to impact bits and provides an early indication of bearing wear.
- the bit wear factor log represents the degree of cutter/tooth wear in a bit for both bit types. The drill string would be tripped and the bit changed in response to the excess bit/bearing wear indications by the corresponding log.
- Tool 16 for detection of downhole weight on bit (WOB) and downward torque (TOR).
- Tool 16 comprises a first MWD tool such as described in U.S. Patent Nos. 4,821,563 and 4,958,517, both of which are assigned to the assignee hereof and incorporated herein by reference, to provide WOB and TOR measurements.
- Tool 16 also comprises a second MWD tool such as described in U.S. Patent No. 4,716,973, which is assigned to the assignee hereof and incorporated herein by reference, to provide a gamma ray measurement.
- the output of tool 16 is fed to a transmitter 18 (e.g., a mud pulse telemetry system such as described in U.S. Patent Nos. 3,982,431; 4,013,945 and 4,021,774, all of which are assigned to the assignee hereof and incorporated herein by reference).
- the transmitter 18 is located and attached within a special drill collar section and functions to provide (in the drilling fluid being circulated downwardly within the drill string 10) an acoustic signal that is modulated in accordance with sensed data.
- the signal is detected at the surface by a receiving system 20 and processed by a processing means 22 to provide recordable data representative of the downhole measurements.
- a processing means 22 to provide recordable data representative of the downhole measurements.
- an acoustic data transmission system is mentioned herein, other types of telemetry systems may be employed, providing they are capable of transmitting an intelligible signal from downhole to the surface during the drilling operation.
- the drill collar may also include a section 24 which carries other downhole sensors (e.g., neutron, gamma ray and formation resistivity). Each of these additional tools in section 24 may also be coupled to the telemetry apparatus of transmitter 18 in order that signals indicative of the measured formation properties may be telemetered to the earth's surface.
- Other downhole sensors e.g., neutron, gamma ray and formation resistivity.
- Each of these additional tools in section 24 may also be coupled to the telemetry apparatus of transmitter 18 in order that signals indicative of the measured formation properties may be telemetered to the earth's surface.
- FIGURE 2 illustrates the processing functions performed within the surface processing means 22.
- Processor 22 is a suitably programmed general purpose digital computer.
- the functions performed by the software programming of processor 22 are generally indicated in functional block form at 26 and 28.
- functional block 26 represents that portion of the software of processor 22 which receives as inputs WOB, TOR, RPM, ROP and bit geometry and generates the following outputs: normalized torque TOR / (WOB D), rock drillability ROP D / (WOB RPM) and drilling response TOR ROP /(WOB2 RPM).
- Functional block 28 further processes the outputs of block 26 and includes inputs of mud density, gamma ray, directional data (e.g., true vertical depth, TVD) and generates the following output signals: drilling response, porosity, porosity compensated for formation effects, differential pressure, pore pressure, drilling alert, bit wear factor (i.e., tooth/cutter wear), torque analysis (i.e., torque increase or torque loss) and bearing wear. Each of these signals may be employed to optimize the drilling process. These signals are still further processed to provide the following logs: drilling response log, porosity log, porosity log compensated for formation effects, differential pressure log, drilling alert log, bit wear factor log, torque analysis log and bearing wear log. Each of these logs are displayed by a plotter 30 and are used to monitor and correct drilling operations. The procedures of each of these blocks will be described in more detail below.
- Drag bits are generally polycrystalline diamond compact bits which have no moving parts and drill by a scraping motion.
- Impact bits include single or multi-cone bits which may include insert and milled tooth bits and which drill by a chipping and crushing motion and/or by a gouging and scraping motion.
- the response of the bit to drilling at the formation is dependent upon cutter design (i.e., bit geometry).
- Cutter design factors include bit diameter, type of bit (i.e., impact or drag) and bit wear.
- Drilling response also depends on WOB and RPM. The more weight applied to the bit the greater the ROP. The higher the RPM, the greater the ROP.
- WOB WOB
- RPM RPM
- the higher the RPM the greater the ROP.
- these factors are limited by how quickly the cuttings can be removed from the cutting surface of the bit (i.e., cleaning of the bit). If the cuttings are not removed, they will be regrinded.
- the type of formation i.e., porous, shale or hardrock
- mud pressure is greater than pore pressure it is harder to drill the formation (e.g., chip hold-down theory). Accordingly, when pore pressure is greater than mud pressure it is easier to drill the formation. However, this may result in a blow out or borehole collapse. In practice and for safety considerations, it is desirable to maintain a slightly greater mud pressure relative to pore pressure to avoid these problems without a significant impact in drilling response.
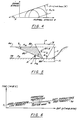
- FIGURE 3 for purposes of modeling a PDC bit, a single cutter model is used. Hydraulic cleaning effects are not included in the model and it is assumed that the bit hydraulics are sufficient to remove all drilled particles and cuttings.
- a cutter 50 is shown moving relative to rock formation 52. The direction of movement is indicated by an arrow 54. It is assumed that a chip 56 is formed by the shearing process of cutter 50 against formation 52. The shearing process is confined to a single plane 58 (i.e., failure plane) extending from a cutting edge 60 to a surface 62. Chip 56 is held in equilibrium by a plurality of forces exerted by formation 52 and cutter 50.
- a single plane 58 i.e., failure plane
- Forces (Fv) and (Fh) represent the respective normal and horizontal components of the erternal forces acting on cutter 50.
- Angles ( ⁇ ) and ( ⁇ ) represent the back and side rake angles respectively.
- Angle ( ⁇ ) represents the angle of the failure surface 58.
- the stresses are in equilibrium and are defined by the Mohr-Coulomb failure criteria. Drilling mud pressure (Pm) is assumed to act on the free surface 62.
- Ac Ap cos( ⁇ ) cos( ⁇ ) where Ap is the area on cutting edge 63 corresponding to the area of cut Ac.
- Rock formation 52 fails when shear stress exceeds a critical threshold value.
- V ( ⁇ D2/4) ROP / RPM
- TOR / (WOB D) ( ⁇ e /4) cos( ⁇ ) + ( ⁇ /8 c1) (1- ⁇ e ( ⁇ / ⁇ )) (tan( ⁇ ) c1) (ROP D / (WOB RPM)) where (ROP D / (WOB RPM)) is referred to herein as rock drillability.
- the normalized torque signal and the rock drillability signal for a drag bit are defined by the above described relationship.
- log (TOR ROP / (WOB2 RPM)) log ( ⁇ / ⁇ 2) + log ((1/ (2 c1 tan2( ⁇ ))) + log ( ⁇ (f( ⁇ ))) + log C
- C cos2( ⁇ ) / (tan2( ⁇ ) 2 c1)
- log ( ⁇ / ⁇ 2) is referred to herein as the formation response
- log (cos2( ⁇ ) / (tan2( ⁇ ) 2 c1)) is a bit related constant and the term log ( ⁇ (f( ⁇ )), is related to formation compaction/bit wear. Therefore, the drilling response log represents a formation response curve superimposed on a formation compaction curve.
- the drilling response signal and the drilling response log are defined by the above described relationships. It will be noted that the effect of bit/cutter on the drilling response is compensated for by introducing a shale base line (to be described hereinafter).
- the model for impact bits is based on the penetration of a wedge into rock formation and is divided into two parts: (1) where the formations is drilled by the crushing or chipping action of the bit (e.g. for medium to hard formations), and (2) where the formation is drilled by the gouging action of the teeth (e.g., for soft formations).
- the model is combined for the case where both crushing and gouging are present.
- hydraulic cleaning effects are not included and it is assumed that the bit hydraulics are sufficient to remove all drilled particles and cuttings.
- FIGURE 5 wherein terms common to the drag bit (PDC) model are also used for the impact bit model.
- PDC drag bit
- a cutter 76 is shown moving relative to rock formation 78.
- stresses develop which are sufficient to cause the rock formation to fail.
- the cutter 76 chips a region of formation 78 when a depth (x) is reached, a chip 80 is formed having a failure plane 82. It is assumed that the failure plane 82 extends from a flat portion 84 of cutter 76 to a surface 86.
- Force (P) represents the external force acting on the cutter 76.
- An angle ( ⁇ ) represents half the wedge angle, an angle ( ⁇ ) represents the angle of the failure surface 82 and L represents the wedge length.
- Cutter or tooth 76 penetrates formation 78 at depth x. Along the failure surface 82 the stresses are in equilibrium and are defined by the Mohr-Coulomb failure criteria.
- Drilling mud pressure (Pm) is assumed to act on surface 80.
- N R sin( ⁇ + ⁇ f+ ⁇ ) + Fm cos( ⁇ )
- T R cos( ⁇ + ⁇ f+ ⁇ ) - Fm sin( ⁇ )
- ⁇ f tan ( ⁇ f).
- ⁇ f (sin( ⁇ )/x L) (R sin( ⁇ + ⁇ f+ ⁇ )+Fm cos( ⁇ ))
- ⁇ f (sin( ⁇ )/x L) (R cos( ⁇ + ⁇ f+ ⁇ )-Fm sin( ⁇ ))
- the Mohr-Coulomb criteria states that failure occurs when shearing stress ⁇ f exceeds the sum of cohesive strength c and frictional resistance to slip along the failure plane and is expressed by:
- - ⁇ f tan( ⁇ ) c - Pp tan( ⁇ ) where ⁇ is the angle of internal friction.
- the effective cohesive strength c (Sc / 2 (1 - sin( ⁇ )) / cos( ⁇ ) where Sc is the rock compressive strength. Eqs.
- Vt ⁇ 1 Vg + (1- ⁇ 1) Vc
- Vg the volume of rock removed by gouging
- Vc the volume of rock removed by crushing
- the cones and cutters on a bit are designed such that each tooth contacts the formation only once per revolution.
- the total work done (W) per revolution is given by:
- the total volume or rock removed (v) per revolution is given by:
- S1 ( ⁇ 1 c2 / 4) ( ⁇ (( ⁇ / ⁇ ) (1/c1 tan ( ⁇ ))) - tan( ⁇ ) / tan ( ⁇ )) + ⁇ (1- ⁇ ))
- S2 ( ⁇ tan( ⁇ )) / (8 tan( ⁇ ))
- the normalized torque signal and the rock drillability signal for an impact bit are defined by the above described relationship.
- the slope S2 is a constant and is function rock properties only.
- the intercept S1 which is a function of ⁇ 1 and ⁇ is representive of the contribution from gouging which changes with bit wear.
- the intercept S1 on the normalized torque TOR / (WOB D) versus rock drillability ROP D / (WOB RPM) plot (FIGURE 6) can be positive or negative.
- the drilling response signal and the drilling response log are defined by the above described relationships.
- FIGURE 6 a plot of normalized torque TOR / (WOB D) versus rock drillability ROP D / (WOB RPM) is shown.
- the slope (S2) of the plot is a function of rock stresses ( ⁇ , ⁇ ). The plot indicates that both normalized torque TOR / (WOB D) and rock drillability ROP D / (WOB RPM) increase for high porosity/soft formations and decrease for low porosity/hard formations.
- This plot provides formation evaluation at the bit in real time with only a mechanical response and may be provided by plotter 30 along with other drilling data.
- Lithologies can be determined by locating the normalized torque TOR / (WOB D) versus rock drillability ROP D / (WOB RPM) ratio on a line 90.
- the plot at the left indicates a low porosity formation and at the right indicates a high porosity formation. It will be appreciated that as the cutters wear or the compaction of the formation increases the formation will appear to be harder to drill, thus the data points merge closer to the origin. A number of drilling problems will also cause the formation to appear harder to drill. Bit balling or imperfect cleaning are indicated by both ROP and TOR decreasing and WOB / TOR increasing.
- a drill string stabilizer caught on a ledge will cause ROP and normalized torque TOR / (WOB D) to decrease while WOB is increasing. Further, the drill string sticking at a bend is indicated by WOB, TOR, ROP and normalized torque TOR / (WOB D) decreasing. Similarly an undergage bit is indicated by ROP decreasing and TOR increasing.
- the above list is offered for purpose of illustration and is not intended to be a complete list of possible drilling problems.
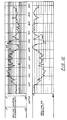
- FIGURE 7 an example of a drilling response log produced by plotter 30 in accordance with the present invention is shown generally at 91.
- This log 91 represents formation response at the bit in real time, thus identifying lithology changes and detecting problems at the bit prior to indication by standard MWD tools (located above the bit). From log 91 it can be seen that shale formations can be identified at 92 and sand formations can be identified at 94. Further, low porosity or hard to drill formations can be identified at 96.
- a normal trend line 98 (i.e., the shale base line to be described hereinafter) represents normal shale compaction.
- Line 98 is to be initially orientated with log 91 to establish a reference for evaluating log 91. Excursions above line 98 indicate porous/low density/low strength formations. Excursion below line 98 represent hard/low porosity formations. However, excursions below line 98 could also indicate other drilling problems.
- Slope changes in log 91 represent underbalance (i.e., Pp > Pm) and overbalance (i.e., Pp ⁇ Pm) conditions and are identified at 100 and 102 respectively. It will be appreciated that there is less resistance to drilling above the normal trend line 98 than below the normal trend line 98. Therefore, excursions above line 98 could be associated with easier/efficient drilling and excursions below line 98 could be associated with less efficient drilling. Inefficient drilling can be caused by any of the aforementioned drilling problems and/or other drilling problems.
- Porosity can now be determined wherein all porosities are converted to an equivalent porosity (e.g., sand) for purposes of modeling.
- log (TOR ROP / (WOB2 RPM)) log (TOR / (WOB D)) M ⁇ 0 1/N - log (WOB RPM / (ROP D)) M (1 - ⁇ 0 1/N ) where N is an integer, (TOR/(WOB D)) M and (WOB RPM/(ROP D)) M are matrix constants, and ⁇ 0 is porosity.
- ⁇ 0 A1 (log(TOR ROP / (WOB2 RPM)))2 + A2 (log(TOR ROP / (WOB2 RPM))) + A3 where A1, A2 and A3 are constants which may be determined empirically or from data.
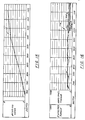
- the porosity signal and the porosity log are defined by the above described relationship. Referring to FIGURE 8, an example of a porosity log produced by plotter 30 in accordance with the present invention is shown generally at 104. Log 104 is shown in relation to drilling response log 103. This log 104 represents formation porosity, thus identifying lithology changes and detecting drillings problems.
- FIGURE 9 a plot of the drilling response log versus porosity in accordance with Eq. 77 is shown.
- the three constants A1, A2 and A3 in Eq. 77 were determined by cross plotting known formation porosity with log (TOR ROP / (WOB2 RPM)) for clean sand-shale sequences (with a new bit & balanced conditions).
- log TOR ROP / (WOB2 RPM)
- WOB2 RPM log
- Overbalance conditions, bit wear and compaction will reduce the log's value and underbalance conditions will increase it.
- Corresponding to each depth the shale porosity can be obtained from Eq. 78.
- the corresponding expected log of the drilling response (log (TOR ROP / (WOB2 RPM)) can be computed from Eq. 77.
- log (TOR ROP / (WOB2 RPM) By keeping track of shales and their corresponding log (TOR ROP / (WOB2 RPM)) values while drilling, an average value of log (TOR ROP / (WOB2 RPM)) can be computed for shale at each depth. If the average value of log (TOR ROP / (WOB2 RPM)) for shale is different from the expected value at any depth from Eq. 78, then the difference between the two values gives the correction necessary to compensate for pore pressure, bit, bit wear and compaction effects. To correct for these effects, a curve 87 given by Eq.
- ⁇ sd ⁇ comp - vsh ⁇ sh
- ⁇ sd the drilling sandstone porosity (effects of shale removed)
- ⁇ comp the computed drilling porosity (which includes shale effects)
- ⁇ sh the shale porosity from Eq. 78
- vsh the percentage of shales in the formation (from gamma ray measurements).
- drilling porosity or drilling sandstone porosity thus found is compensated for bit wear, bit, compaction and pore pressure effects.
- drilling porosity is not compensated for other drilling problems (e.g. bit balling, hanging stabilizers).
- Both the porosity signal and the porosity log can be compensated for formation effects (i.e., shale effects) by the above described relationships.
- the three constants A1, A2 and A3 may be obtained by plotting known formation porosity with log (TOR ROP / (WOB2 RPM)) for clean sand-shale sequences (with a new bit & balanced conditions).
- An important feature of this invention is the sand porosity with the effects of shale removed.
- Prior art porosity measurements i.e., density log derived porosity assuming one matrix
- the effects of shale be removed since generally hydrocarbon deposits are found in the sand and not in the shale. Therefore, the sand porosity with the shale effects removed provides a more precise indication of a typical commercial hydrocarbon formation than does the prior art density log derived porosity using a constant matrix.
- the porosity signal and the porosity log both of which are compensated for formation effects are defined by the above described relationship.
- FIGURE 10 an example of a porosity log compensated for formation effects produced by plotter 30 in accordance with the present invention is shown generally at 104.
- Log 106 is shown in relation to drilling response log 103. This log 106 represents formation porosity compensated for formation effects, thus identifying lithology changes and detecting drilling problems.
- the insitu porosity is derived from mechanical measurements only (i.e., WOB, ROP, RPM, TOR and TVD).
- the sand porosity with the shale effects removed requires gamma ray measurement to account for the percentage of shale in the formation (Eq. 79). Accordingly, two porosity signals and logs are provided.
- Differential pressure can be determined from the drilling response wherein continuous pore pressure is determined under the assumption of the one lithology (e.g., shale).
- f(Pp, Pm) (TOR ROP / (WOB2 RPM)) A / ( TOR ROP / (WOB2 RPM)) N
- differential pressure ⁇ P is plotted as a function of shale volume (vsh) for clean sand shale sequences where gamma ray measurements are employed to determine vsh.
- the curve 107 ( ⁇ P T ) is used to transform resulting data into 100% shale.
- differential pressure signal and the differential pressure log are defined by the above described relationships.
- FIGURE 13 an example of a differential pressure log produced by plotter 30 in accordance with the present invention is shown generally at 108.
- Log 108 is shown in relation to drilling response Log 103.
- This log 108 represents differential pressure and is used to detect drilling problems.
- the pore pressure signal can be derived from differential pressure (including differential pressure compensated for formation effects) by the relationship of Eq. 88.
- differential pressure and the formation pore pressure derived from WOB, TOR, ROP, RPM and gamma ray measurements, wherein the gamma ray measurements are used to compensate for formation effects.
- the formation pore pressure and the differential pressure can be employed to determine desired mud density to be used during drilling operations.
- the overpressure porosity is the supernormal pressure caused by overburdening (i.e., formation compaction stress increases when water is trapped in the porous formation).
- a drilling alert log which provides an early warning of drilling problems is presented. Drilling alerts are associated with a lower than normal drilling response.
- the drilling alert log can be expressed as either a severity ratio (TOR ROP / (WOB2 RPM)) N / (TOR ROP / (WOB2 RPM)) A or a sudden increase in derived differential pressure ⁇ P.
- a sudden increase in differential pressure implies a low formation pore pressure Pp, since mud pressure Pm is controlled by the operator.
- a maximum differential pressure &P max associated with standard drilling operations is selected by the operator. This ( ⁇ P max) is required during drilling operations in order to maintain a mud pressure Pm in excess of the formation pore pressure Pp, thus avoiding a blow out or borehole collapse (described hereinbefore). Accordingly, any value above ⁇ P max is generally attributed to drilling problems.
- ⁇ P prob ⁇ [(TOR ROP / (WOB2 RPM)) N / ((TOR ROP / (WOB2 RPM)) A2 - 1)] where (TOR ROP / (WOB2 RPM)) A2 is the drilling response at any location with drilling problems (i.e., abnormal operating conditions).
- DPR ⁇ (TOR ROP / (WOB2 RPM)) N [(1 / (TOR ROP / (WOB2 RPM)) A2 ) - (1 / (TOR ROP / (WOB2 RPM)) A1 )]
- the drilling alert signal and the drilling alert log are defined by the above described relationship.
- drilling alerts can be expressed as a severity ratio log (TOR ROP / (WOB2 RPM)) A / (TOR ROP / (WOB2 RPM)) N . It will be appreciated that the severity ratio log does not employ gamma ray measurements and, therefore, is in real time at the depth of the bit.
- FIGURE 14 an example of a drilling alert log produced by plotter 30 in accordance with the present invention is shown generally at 110.
- Log 110 is shown in relation to drilling response Log 103.
- the drilling alert log 110 provides continuous monitoring while corrections are being applied. Further, the log provides an indication of the severity of the problem. While the drilling alert log does not identify the source of the drilling problem, it does alert the operator of a drilling problem.
- Bit wear factor is an indicator of the extent of tooth wear in a bit. It varies from 1 for a new bit to 0 for a completely worn bit.
- Eq. 93 also expresses a bit wear factor log when plotted as a function of depth.
- bit wear factor signal and the bit wear factor log are defined by the above described relationships. It should be noted that the bit wear factor ⁇ may be affected by other drilling problems.
- FIGURE 17 an example of a bit wear factor log produced by plotter 30 in accordance with the present invention is shown generally at 111.
- Log 111 detects bit wear and is used to indicate when the bit is to be replaced. This is indicated by a line 111a being prior to bit replcement and line 111b being after bit replacement. Log 111 is shown in relation to vsh.
- bearing life/wear can be expressed in terms of total revolutions (provided no appreciable temperature increases occur).
- bearing wear is linearly related to bit revolutions.
- Bearing life is also dependent on the load applied.
- Each bearing has a finite service life which is specified by its load specifications.
- mud properties in case of non-sealed bearings also affect the bearing life.
- the cones start wobbling thereby causing intermeshing of teeth on the cones. This causes tooth wear and breakage, thus associating bearing wear with tooth wear or breakage.
- a bearing failure which is a result of some form of mechanical abuse can be related to or expressed by an increase in torque-to-weight ratio as a result of increase in friction at the bearing surfaces.
- the resulting temperature increase can cause a seal or lubricant failure.
- the bearing may still roll on (continue to wear loose) with increased torque or it may lock up. If a bearing locks up, the cone can act as a partial drag bit; in this case increased torque is generated since normal torque is higher for drag bits than for impact bits. Accordingly, bit torque is an important factor in bearing related problems.
- dB/dt K WOB ⁇ 2 RPM
- K a constant depending on operating conditions and exponent ⁇ 2 expresses effect of bit weight on bearing wear and is known to vary between 1.5 and 2, depending on the type of bearing and the mud properties.
- a bearing wear log results when Eq. 97 is plotted as a function of depth.
- Eq. 94 The inclusion of torque in the model (Eq. 94) is an important feature of the present invention. This allows (a) prediction of and/or onset of a bearing failure into the model and (b) demonstrates the potential use of drilling response for bearing wear predictions.
- T a T e . Therefore, bearing wear is given by:
- B K L1 [(WOB2 RPM / ROP)1 + (WOB2 RPM / ROP)2 + ...]
- bearing wear/failure is inversely proportional to drilling response. Therefore, as bearing wear increases, drilling response decreases. It will be appreciated that drilling response decreases as the teeth wear out. Thus, drilling response is effected by both bearing wear and tooth wear. Drilling response increase can be caused by higher than expected torque increase. This abnormal increase in torque caused by friction at the bearing surfaces could cause the bearings to fail (seal or lubricant failure due to temperature increase as a result of friction). The bearing could lock up causing the cone to act as a partial drag bit. Under normal conditions bearing wear should increase uniformly with depth.
- An increase in the rate of bearing wear may be associated with lower than normal ROP and TOR (low drilling response) implying a harder to drill formation and so is associated with higher than normal bit wear.
- a decrease in the rate of bearing wear may be associated with higher than normal TOR and/or ROP (higher drilling response) implying an easier to drill formation and so associated with lower than normal bit wear.
- the bearing wear signal and the bearing wear log are defined by the above described relationships. Referring to FIGURE 15, an example of a bearing wear log produced by plotter 30 in accordance with the present invention is shown generally at 112.
- abnormal torque increase i.e., abnormal torque increase and abnormal torque loss
- Abnormal torque loss can be a useful indicator of some drilling problems.
- the expected value of TOR / (WOB D) is determined from the shifted (adjusted) curve (Eq. 100).
- the expected torque TOR e at the bit is then compared to the actual (measured) torque TOR a at the bit to generate a torque analysis log (i.e., TOR a - TOR e ). If the expected torque is lower than the measured torque, the difference is then the abnormal torque increase generated at the bit due to bit problems. If the actual torque is lower than expected torque, the difference (or "torque loss”) could be due to tooth wear/breakage. Lithology changes are compensated for in the model.
- MWD measured torque is an important indicator of any drilling abnormalities near the bit.
- bearing wear and drilling response curves it is possible to recognize, isolate and distinguish between various bit related problems while drilling (e.g., bearing wear/failure, undergage bits and cutter, i.e., tooth wear) with rock bits.
- an abnormal increase or loss of torque indicates undergage stabilizers, formation squeeze, cutter wear or sloughing shales.
- the torque analysis signal and the torque analysis log are defined by the above described relationships. Referring to FIGURE 16, an example of an a torque analysis log produced by plotter 30 in accordance with the present invention is shown generally at 114. This log 114 represents an abnormal increase or loss of torque and can be used to detect drilling problems.
Abstract
A method for evaluating formations and bit conditions is presented. The present invention processes signals indicative of downhole weight on bit (WOB), downhole torque (TOR), rate of penetration (ROP) and bit rotations (RPM), while taking into account bit geometry to provide a plurality of well logs and to optimize the drilling process. Drilling operations are monitored and adjusted in response to these processed signals and logs. The processed signals may include the following signals: drilling response, differential pressure, pore pressure, porosity, porosity compensated for formation effects, drilling alert, bit wear factor, abnormal torque, and bearing wear. The logs may include a drilling response log, a differential pressure log, a porosity log, a porosity log compensated for formation effects, a drilling alert log, a wear factor log, a torque analysis log and a bearing wear log.
Description
- This invention relates to a method for evaluating drilling conditions while drilling a borehole. More particularly, this invention relates to a method for evaluating formations and bit condition while drilling. Further, this invention relates to a method for providing drilling alerts when inefficient drilling conditions are identified.
- A drill string generally has a lower portion which is comprised of relatively heavy lengths of uniform diameter drill collar. A drill bit is attached to the downhole end of the drill collar, where a portion of the weight of the collar is applied causing the bit to gouge and crush into the earth as the drill string is rotated from the surface (e.g., a rotary table with slips). Alternatively, a downhole motor is employed to rotate the bit. The downhole motor is generally employed in directional drilling applications.
- Measurement-while-drilling (MWD) systems are known for identifying and evaluating rock formations and monitoring the trajectory of the borehole in real time. An MWD tool is generally located in the lower portion of the drill string near the bit. The tool is either housed in a section of drill collar or formed so as to be compatible with the drill collar. It is desirable to provide information of the formation as close to the drill bit as is feasible. Several methods for evaluating the formation using the drill bit have been employed. These methods eliminate the time lag between the time the bit penetrates the formation and the time the MWD tool senses that area of the formation. The measurements available are rate of penetration (ROP) and bit revolutions per minute (RPM) which are determined at the surface and, downhole weight on bit (WOB) and downhole torque on the bit (TOR) which are derived from real time insitu measurements made by an MWD tool. WOB and TOR may be measured by the MWD tools described in U.S. Patent Nos. 4,821,563 and 4,958,517, both of which are assigned to the assignee hereof.
- Methods employing ROP, RPM, WOB and TOR measurements have been developed to determine certain formation characteristics at the drill bit. One such method is disclosed in U.S. Patent No. 4,883,914 to Rasmus. The Rasmus patent employs the aforementioned measurements (i.e., ROP, RPM, WOB, and TOR), a gamma ray measurement and a resistivity measurement to detect an overpressure porosity condition. The gamma ray and resistivity measurements are included in order to account for the volume of shale and the apparent resistivity in the formation. It is known that an overpressure condition occurs when water is trapped in a porous formation (i.e., overburden). This overburden condition prevents the shale in the formation from further compaction, whereby the compressive stress is transmitted to the interstitial water. Therefore, this portion of the formation will have a supernormal pressure when compared to that of the surrounding formation. The method of U.S. Patent No. 4,883,914 employs this overpressure porosity to determine desired drilling mud pressure, pore pressure (i.e., formation pressure) and formation strength.
- U.S. Patent No. 4,852,399 to Falconer discloses a method for distinguishing between argillaceous, porous and tight formations by computing formation strength from ROP, RPM, WOB and TOR. The formations are distinguished by setting upper and lower shale limits.
- European Patent No. EP 0351902A1 to Curry et al discloses a method for determining formation porosity from WOB and TOR measurements which factor in the geometry of the drill bit.
- U.S. Patent No. 4,697,650 to Fontenot discloses a method of compiling a history of ROP, RPM, WOB and TOR measurements. U.S. Patent No. 4,685,329 to Burgess discloses a method of compiling a history of TOR/WOB and ROP/RPM based ratios in order to identify trends such as bit wear, pore pressure variation and changes in lithology.
- U.S. Patent No. 4,627,276 to Burgess et al discloses a method for determining wear of milled tooth bits from a bit efficiency term which is derived from ROP, RPM, WOB and TOR measurements and bit geometry.
- The above discussed and other drawbacks and deficiencies of the prior art are overcome or alleviated by the method of the present invention for evaluating formations and bit condition while drilling. In accordance with the present invention, an MWD tool located near the bit of the drill string provides measurements of downhole weight on bit (WOB) and downhole torque (TOR). Additionally, rate of penetration (ROP) and bit revolutions (RPM) are measured and calculated at the surface. Provisions are made for drag and impact drill bits. These measurements and bit geometry data are processed by a processor to generate the following outputs: normalized torque (TOR / (WOB D)), rock drillability (ROP D / (WOB RPM)) and drilling response (TOR ROP / (WOB² RPM)). From these output signals a plurality of processed signals and logs are generated by a plotter. These logs aid in evaluating the formation and the bit.
- For example, from a plot of normalized torque TOR / (WOB D) versus rock drillability ROP D / (WOB RPM), lithologies can be identified so that drilling operations can be adjusted accordingly. Further, drilling problems (e.g., bit balling, stabilizer caught on a borehole ledge, drill string sticking) can also be identified from this plot by noting any excursions away from the normal trend line. Such a plot can be generated at the processor and plotted by a plotter.
- The above signals are further processed with the additional measurements of gamma ray and mud density (mud pressure is derived from mud density) the following signal outputs are provided: drilling response, porosity, porosity compensated for formation effects, differential pressure, pore pressure, drilling alert, bit wear factor (i.e., tooth/cutter wear), torque analysis (i.e., abnormal torque increase or loss) and bearing wear. Each of these signals may be employed to optimize the drilling process.
- These signals are still further processed to provide the following logs: drilling response log, porosity log, porosity log compensated for formation effects, differential pressure log, drilling alert log, bit wear factor log, torque analysis log and bearing wear log. Each of these logs are generated by the graphical plotter.
- The drilling response log can be used to identify formation changes, underbalance and overbalance drilling conditions, and other drilling problems at the bit while drilling. The porosity log provides an early indication of the porosity of the formation to reinforce/substitute other prior art porosity analyses, so that drilling conditions can be modified accordingly for the formation. The porosity log compensated for formation effects provides a better indication of a possible commercial hydrocarbon formation. The differential pressure log provides an early indication of formation pressure so that drilling conditions can be optimized (e.g., adjust mud density). The drilling alert log can be used as an indicator of a potential drilling problem while drilling. The specific drilling problem or problems can be further evaluated by monitoring other logs commonly provided in drilling operations. The drilling alert log may indicate that drilling operations should cease and the drill string tripped or that drilling conditions be otherwise modified while drilling continues. The torque analysis log provides an early indication of such problems as undergage stablizers, formation squeeze, cutter wear (i.e., tooth wear) and sloughing shales. The bearing wear log only applies to impact bits and provides an early indication of bearing wear. The bit wear factor log represents the degree of cutter/tooth wear in a bit for both bit types. The drill string would be tripped and the bit changed in response to the excess bit/bearing wear indications by the corresponding log.
- The above-discussed and other features and advantages of the present invention will be appreciated and understood by those skilled in the art from the following detailed description and drawings.
-
- FIGURE 1 is a combined side elevational view and block diagram depicting a drill string while drilling a borehole employing a MWD scheme in accordance with the present invention.
- FIGURE 2 is a block diagram of the processor shown in FIGURE 1, illustrating the functions performed by the processor;
- FIGURE 3 is a side elevational view of the single tooth of a drag bit for use with the drill string of FIGURE 1;
- FIGURE 4 is a plot of the Coulomb-Mohr failure envelope;
- FIGURE 5 is a side elevational view of a single tooth of an impact bit for use with the drill string of FIGURE 1;
- FIGURE 6 is a plot of normalized torque versus rock drillability for the drill string of FIGURE 1;
- FIGURE 7 is a drilling response log in accordance with the present invention;
- FIGURE 8 is a porosity log in accordance with the present invention;
- FIGURE 9 is a plot of porosity versus the logrithmic value of a drilling response for a formation;
- FIGURE 10 is a porosity log compensated for formation effects in accordance with the present invention;
- FIGURE 11 is a drilling response log in accordance with the present invention;
- FIGURE 12 is a plot of a transformed differential pressure curve versus volume of shale in a formation;
- FIGURE 13 is a differential pressure log in accordance with the present invention;
- FIGURE 14 is a drilling alert log in accordance with the present invention;
- FIGURE 15 is a bearing wear log in accordance with the present invention;
- FIGURE 16 is an torque analysis log in accordance with the present invention; and
- FIGURE 17 is a bit wear factor log in accordance with the present invention.
- Referring initially to FIGURE 1, there is shown a
drill string 10 suspended in a borehole 12 and having atypical drill bit 14 attached to its lower end. Immediately above thebit 14 is atool 16 for detection of downhole weight on bit (WOB) and downward torque (TOR).Tool 16 comprises a first MWD tool such as described in U.S. Patent Nos. 4,821,563 and 4,958,517, both of which are assigned to the assignee hereof and incorporated herein by reference, to provide WOB and TOR measurements.Tool 16 also comprises a second MWD tool such as described in U.S. Patent No. 4,716,973, which is assigned to the assignee hereof and incorporated herein by reference, to provide a gamma ray measurement. The output oftool 16 is fed to a transmitter 18 (e.g., a mud pulse telemetry system such as described in U.S. Patent Nos. 3,982,431; 4,013,945 and 4,021,774, all of which are assigned to the assignee hereof and incorporated herein by reference). Thetransmitter 18 is located and attached within a special drill collar section and functions to provide (in the drilling fluid being circulated downwardly within the drill string 10) an acoustic signal that is modulated in accordance with sensed data. The signal is detected at the surface by a receivingsystem 20 and processed by a processing means 22 to provide recordable data representative of the downhole measurements. Although an acoustic data transmission system is mentioned herein, other types of telemetry systems may be employed, providing they are capable of transmitting an intelligible signal from downhole to the surface during the drilling operation. - The drill collar may also include a
section 24 which carries other downhole sensors (e.g., neutron, gamma ray and formation resistivity). Each of these additional tools insection 24 may also be coupled to the telemetry apparatus oftransmitter 18 in order that signals indicative of the measured formation properties may be telemetered to the earth's surface. - Reference is now made to FIGURE 2 for a detailed representation of a preferred embodiment of the present invention. FIGURE 2 illustrates the processing functions performed within the surface processing means 22.
Processor 22 is a suitably programmed general purpose digital computer. The functions performed by the software programming ofprocessor 22 are generally indicated in functional block form at 26 and 28. Specifically,functional block 26 represents that portion of the software ofprocessor 22 which receives as inputs WOB, TOR, RPM, ROP and bit geometry and generates the following outputs: normalized torque TOR / (WOB D), rock drillability ROP D / (WOB RPM) and drilling response TOR ROP /(WOB² RPM).Functional block 28 further processes the outputs ofblock 26 and includes inputs of mud density, gamma ray, directional data (e.g., true vertical depth, TVD) and generates the following output signals: drilling response, porosity, porosity compensated for formation effects, differential pressure, pore pressure, drilling alert, bit wear factor (i.e., tooth/cutter wear), torque analysis (i.e., torque increase or torque loss) and bearing wear. Each of these signals may be employed to optimize the drilling process. These signals are still further processed to provide the following logs: drilling response log, porosity log, porosity log compensated for formation effects, differential pressure log, drilling alert log, bit wear factor log, torque analysis log and bearing wear log. Each of these logs are displayed by aplotter 30 and are used to monitor and correct drilling operations. The procedures of each of these blocks will be described in more detail below. - A method for evaluating formations and bit condition at the bit while drilling is presented. Provisions are made for drag and impact bits. Drag bits are generally polycrystalline diamond compact bits which have no moving parts and drill by a scraping motion. Impact bits include single or multi-cone bits which may include insert and milled tooth bits and which drill by a chipping and crushing motion and/or by a gouging and scraping motion.
- The response of the bit to drilling at the formation (i.e., drilling response) is dependent upon cutter design (i.e., bit geometry). Cutter design factors include bit diameter, type of bit (i.e., impact or drag) and bit wear. Drilling response also depends on WOB and RPM. The more weight applied to the bit the greater the ROP. The higher the RPM, the greater the ROP. However, these factors are limited by how quickly the cuttings can be removed from the cutting surface of the bit (i.e., cleaning of the bit). If the cuttings are not removed, they will be regrinded. The type of formation (i.e., porous, shale or hardrock) also needs to be considered when determining drilling response.
- The difference between mud pressure and pore pressure also affects the drilling response. When mud pressure is greater than pore pressure it is harder to drill the formation (e.g., chip hold-down theory). Accordingly, when pore pressure is greater than mud pressure it is easier to drill the formation. However, this may result in a blow out or borehole collapse. In practice and for safety considerations, it is desirable to maintain a slightly greater mud pressure relative to pore pressure to avoid these problems without a significant impact in drilling response.
- General drilling models have been developed and are described below for the impact and drag bits. Initially, these models are based on the analysis of a single cutter. Thereafter, the models are integrated to provide a model for a complete bit. These models are to be stored in the memory portion of
processor 22. - Referring now to FIGURE 3, for purposes of modeling a PDC bit, a single cutter model is used. Hydraulic cleaning effects are not included in the model and it is assumed that the bit hydraulics are sufficient to remove all drilled particles and cuttings. A
cutter 50 is shown moving relative torock formation 52. The direction of movement is indicated by anarrow 54. It is assumed that achip 56 is formed by the shearing process ofcutter 50 againstformation 52. The shearing process is confined to a single plane 58 (i.e., failure plane) extending from acutting edge 60 to a surface 62.Chip 56 is held in equilibrium by a plurality of forces exerted byformation 52 andcutter 50. - Forces (Fv) and (Fh) represent the respective normal and horizontal components of the erternal forces acting on
cutter 50. Angles (ϑ) and (φ) represent the back and side rake angles respectively. Angle (δ) represents the angle of the failure surface 58. Along surface 58 the stresses are in equilibrium and are defined by the Mohr-Coulomb failure criteria. Drilling mud pressure (Pm) is assumed to act on the free surface 62. - The normal and horizontal external forces Fv and Fh acting on
cutter 50 are defined by:

where R is the resultant force acting on surface 58, and ϑf is the angle of friction and is related to the coefficient of friction (µf) between the bit and the cutter by:
The area of cut (Ac) information 52 is defined by:
where Ap is the area on cuttingedge 63 corresponding to the area of cut Ac. - The resultant force Fa on surface 58 due to the effective mud pressure Pm is defined by:

The normal force (N) and shear force (T) on surface 58 are defined by:

-
Rock formation 52 fails when shear stress exceeds a critical threshold value. The Mohr-Coulomb failure criteria is shown in FIGURE 4 and is defined as follows:
where Pp is the pore pressure.
The average shear stress (τf) and the average normal stress (σf) are defined by:

The coefficient of internal friction (µ) is defined by:
where φ is the angle of internal friction, FIGURE 2. The cohesive strength (c) is defined by:
where Sc is the rock compressive strength.
Substituting Eqs. 9 and 10 into Eq. 8 gives:
Failure will occur when the maximum value of the shear stress equals the cohesive strength c. The maximum value of (τf-(σf-Pp) tan(φ)) occurs on a plane inclined at failure angle δ. Using the resulting equation and Eq. 12a, the resultant force R at surface 58 can be expressed as:
where the differential pressure factor f(Pp, Pm) is given by:
f(Pp, Pm) = 1 / (1 + (Pm - Pp) α) and,
α = (cos(ϑf) + sin(φ-ϑ))/(2c cos(ϑ) cos(φ)) - If rock drilling strength is defined as:

by solving Eqs. 4, 12 and 13 for Ac and substituting Ac and Fv (Eq. 1) into Eq. 14 the normal stress σ is expressed as:
Rock shear strength can be defined as:
assuming that the shear force Fh is proportional to the area of cut Ac and where c1 is a constant. Then by solving Eqs. 4, 12 and 13 for Ac and substituting Ac and Fh (Eq. 2) into Eq. 16, the shear stress τ is expressed as:
It will be appreciated that both normal stress σ and shear stress τ are a function of δP which is the difference between the mud pressure Pm and the pore pressure Pp. δP is referred to herein as differential pressure and is an important feature of the present invention. - The effect of cutter wear can be included in Eqs. 14 and 16 as follows:

where Aw is the area of the wear surface oncutter 60, and
where µe is the effective coefficient of friction caused by the cutting angle. Eliminating Aw from Eqs. 18 and 19 results in the following equation:
- The model for a single cutter is now expanded to provide a model for a complete bit. It is assumed that all cutters on the bit can be arranged such that they form a single cutter of radius D/2 where D is the bit diameter. The force dFv acting on a small element of
cutter 50 of a length dr is given by:
- The force dFh required to gouge
cutter 50 throughformation 52 is derived from Eq. 20 as follows:
the torque dTOR required to gougecutter 50 throughformation 52 is given by:
Substituting dFh (Eq. 22) into Eq. 23 then integrating Eq. 23 results in the following expression for torque on the bit (TOR):
- A volume (dV) of
rock 52 cut bycutter 50 of length (dr) at a radius (r) from the center of the bit in one revolution of the bit is expressed as:
- The volume (V) of rock removed by the bit in one revolution can be expressed as:

- Eqs. 24-26 can be solved to result in the following expression for normalized torque TOR / (WOB D):

where (ROP D / (WOB RPM)) is referred to herein as rock drillability. Eq. 27 can be expressed as:
where:

- The normalized torque signal and the rock drillability signal for a drag bit are defined by the above described relationship.
- Eq. 18 can also be expressed as:

where the wear factor η is an indicator of bit/cutter condition and can be expressed as:
where η varies from 1 (for a new bit) to 0 (for a completely worn bit). - The term (WOB RPM / (ROP D)) which is the inverse of rock drillability ROP D / (WOB RPM) is related to rock strength σ and wear factor η by:

- Normalized torque TOR / (WOB D) is expressed below incorporating the wear factor term η as:

where:
- Drilling response is defined as (TOR ROP / (WOB² RPM)) and is given by:

wherein:
for a new bit (where η = 1) and,
TOR ROP / (WOB² RPM) = 0; for a completely worn bit (where η = 0). An expression for a drilling response log is defined by:
where:
log (τ/σ²) is referred to herein as the formation response; and log (cos²(φ) / (tan²(ϑ) 2 c1)) is a bit related constant and the term log (η(f(η)), is related to formation compaction/bit wear. Therefore, the drilling response log represents a formation response curve superimposed on a formation compaction curve. The drilling response signal and the drilling response log are defined by the above described relationships. It will be noted that the effect of bit/cutter on the drilling response is compensated for by introducing a shale base line (to be described hereinafter). - The model for impact bits is based on the penetration of a wedge into rock formation and is divided into two parts: (1) where the formations is drilled by the crushing or chipping action of the bit (e.g. for medium to hard formations), and (2) where the formation is drilled by the gouging action of the teeth (e.g., for soft formations). The model is combined for the case where both crushing and gouging are present. In the derivation of the model hydraulic cleaning effects are not included and it is assumed that the bit hydraulics are sufficient to remove all drilled particles and cuttings.
- Referring to FIGURE 5 wherein terms common to the drag bit (PDC) model are also used for the impact bit model. For purpose of modeling an impact bit a single cutter model is used. A
cutter 76 is shown moving relative torock formation 78. During the chipping process when a depth of penetration is reached stresses develop which are sufficient to cause the rock formation to fail. Thecutter 76 chips a region offormation 78 when a depth (x) is reached, achip 80 is formed having afailure plane 82. It is assumed that thefailure plane 82 extends from aflat portion 84 ofcutter 76 to a surface 86. - Force (P) represents the external force acting on the
cutter 76. An angle (ϑ) represents half the wedge angle, an angle (δ) represents the angle of thefailure surface 82 and L represents the wedge length. Cutter ortooth 76 penetratesformation 78 at depth x. Along thefailure surface 82 the stresses are in equilibrium and are defined by the Mohr-Coulomb failure criteria. - Drilling mud pressure (Pm) is assumed to act on
surface 80. The external force P acting oncutter 76 is related to the resultant force R acting at the surface 86 and is given by:
where ϑf is the angle of friction. - The force Fm on
surface 82 due to the effective mud pressure Pm is defined by:
- The normal force (N) and shear force (T) on
surface 82 are expressed as:

where the angle of friction ϑf is related to coefficient of friction µf between the rock and tooth by µf = tan (ϑf).
The average shear stress (τf) and the average normal stress (σf) alongsurface 82 are defined by:

- The Mohr-Coulomb criteria states that failure occurs when shearing stress τf exceeds the sum of cohesive strength c and frictional resistance to slip along the failure plane and is expressed by:

where φ is the angle of internal friction. - Thus, failure will occur when the maximum value of shear stresses equal the cohesive strength c, the maximum value occurring at the failure angle δ. The effective cohesive strength c is defined by:

where Sc is the rock compressive strength.
Eqs. 39-42 can be solved to provide the following expression for the resultant force R:
where:

- The same result can be obtained when the gouging action of the tooth is also present. In that case:


where P is the force required to maintain the depth of penetration and H is the gouging force. The effective area (Ae) under the cutter with crushing only is expressed as:
The effective area Ae (Eq. 47) including the affects of gouging and crushing is expressed as:
If rock drilling strength is defined as:
σ = P / L x tan(ϑ)
and rock shear strength is defined as τ = H / C1 L x where C₁ is a constant of proportionality. In either case normal stress σ and shear stress τ can be expressed as:

- The effect of cutter wear on force P can be included as follows:

and, the effect of cutter wear on force H can be factored in as follows:
where Aw = 2 L x1 tan (ϑ) - If it is assumed that all cones of the tricone bit act as one composite cone then all teeth in contact on the three cones can be treated as a continuous set of teeth having a length approximately equal to the bit radius on one row of the composite cone. Thus, P = 2 c2 W L / D where c2 is a constant for the bit. Also as the bit rotates, each tooth under the influence of applied weight crushes the rock first and then scrapes it. Since crushing and scraping follow each other almost simultaneously, the resultant weight applied to the formation is through the flat 84 (FIGURE 5) and one side of the tooth. The scraping action is caused by the cone offset. In general, particularly for softer formations, a greater percentage of rock removed per revolution (and consequently the amount of work done in removing the rock), is believed to be due to the gouging action of the teeth. For purposes of modeling it may be assumed that total work (Wt) done by the bit in one revolution during crushing and gouging is divided as follows:

where α1 is a factor dependent on rock and bit, Wg is the work done by gouging, and Wc is the work done by crushing. The work done per revolution during gouging Wg₀ can be expressed as:
The work done per revolution in crushing Wcr can be expressed as:
where:
P = σ L y tan(ϑ); and
Ni is the number of tooth impacts per revolution;
x1 is the wear depth as is shown in FIGURE 5;
x is the penetration depth as is shown in FIGURE 5. - Further, it is assumed that the total volume (Vt) of rock removed is contributed in a similar manner by both gouging and crushing action and is expressed as:

where Vg is the volume of rock removed by gouging, and Vc is the volume of rock removed by crushing. The volume of rock removed during gouging Vg₀ can be expressed as:
The volume of rock removed during crushing/chipping Vcr can be expressed as:
where:
When crushing without chipping Cr = 1 and (ϑ+δ)< 90°. The cones and cutters on a bit are designed such that each tooth contacts the formation only once per revolution. The total number of indentations per revolution Ni is given by:
where ϑc is the cone angle and Nt is the total number of teeth on the three cones. - The total work done (W) per revolution is given by:

The total volume or rock removed (v) per revolution is given by:
- Eq. 51 can also be expressed as:

where η is the wear factor which is an indicator of bit condition. It can be expressed as:
where η varies from 1 (for a new bit) to 0 (for a completely worn bit). - Using Eqs. 60, 62 and 52 the following expression for torque TOR is obtained:

- From equations 61, 62 and 64, the following relation between normalized torque TOR / (WOB D) and rock drillability ROP D / (WOB RPM) can be obtained:

where:

The normalized torque signal and the rock drillability signal for an impact bit are defined by the above described relationship. - The slope S₂ is a constant and is function rock properties only. The intercept S₁ which is a function of α1 and η is representive of the contribution from gouging which changes with bit wear. Depending upon the sign of ((τ/σ) (1 / c1 tan(ϑ)) - (tan (ϑ) / tan (δ)) the intercept S₁ on the normalized torque TOR / (WOB D) versus rock drillability ROP D / (WOB RPM) plot (FIGURE 6) can be positive or negative. However, data indicates that the intercept is positive, thereby implying that (τ/σ) (1 /c1 tan(ϑ))≧(tan (ϑ) / tan(δ)) Normalized torque TOR / (WOB D) and rock drillability ROP D / (WOB RPM) can be expressed as:

and
where:


where Bi = (2 c2 Ni L) / (π D² tan(ϑ)); is a bit dependent constant. - A drilling response term (TOR ROP / (WOB² RPM)) is defined as:

wherein:
TOR ROP / (WOB² RPM) = (TOR ROP / (WOB² RPM))₀; for a new bit (η = 1), and TOR ROP / (WOB² RPM) = 0; for a completely worn bit (η = o). A drilling response log is defined by:
where log (CC) is a bit dependent term, log (τ/σ²) is the formation dependent term, log (η f(η)) is the wear/compaction dependent term and log (f1) and log (f2) are generally small. The drilling response signal and the drilling response log are defined by the above described relationships. - Referring to FIGURE 6 a plot of normalized torque TOR / (WOB D) versus rock drillability ROP D / (WOB RPM) is shown. The intercept (S₁) for ROP = O is a function of the wear factor η and the coefficient µ, which may vary for different formations. The slope (S₂) of the plot is a function of rock stresses (τ,σ). The plot indicates that both normalized torque TOR / (WOB D) and rock drillability ROP D / (WOB RPM) increase for high porosity/soft formations and decrease for low porosity/hard formations.
- This plot provides formation evaluation at the bit in real time with only a mechanical response and may be provided by
plotter 30 along with other drilling data. Lithologies can be determined by locating the normalized torque TOR / (WOB D) versus rock drillability ROP D / (WOB RPM) ratio on aline 90. The plot at the left indicates a low porosity formation and at the right indicates a high porosity formation. It will be appreciated that as the cutters wear or the compaction of the formation increases the formation will appear to be harder to drill, thus the data points merge closer to the origin. A number of drilling problems will also cause the formation to appear harder to drill. Bit balling or imperfect cleaning are indicated by both ROP and TOR decreasing and WOB / TOR increasing. A drill string stabilizer caught on a ledge (below the MWD tool) will cause ROP and normalized torque TOR / (WOB D) to decrease while WOB is increasing. Further, the drill string sticking at a bend is indicated by WOB, TOR, ROP and normalized torque TOR / (WOB D) decreasing. Similarly an undergage bit is indicated by ROP decreasing and TOR increasing. The above list is offered for purpose of illustration and is not intended to be a complete list of possible drilling problems. - Referring now to FIGURE 7, an example of a drilling response log produced by
plotter 30 in accordance with the present invention is shown generally at 91. This log 91 represents formation response at the bit in real time, thus identifying lithology changes and detecting problems at the bit prior to indication by standard MWD tools (located above the bit). From log 91 it can be seen that shale formations can be identified at 92 and sand formations can be identified at 94. Further, low porosity or hard to drill formations can be identified at 96. For a constant WOB and RPM a high ROP and TOR indicates a porous formation (i.e., formation identified at 94) and a low ROP and TOR indicates a hard to drill formation (i.e., formation identified at 96). A normal trend line 98 (i.e., the shale base line to be described hereinafter) represents normal shale compaction.Line 98 is to be initially orientated with log 91 to establish a reference for evaluating log 91. Excursions aboveline 98 indicate porous/low density/low strength formations. Excursion belowline 98 represent hard/low porosity formations. However, excursions belowline 98 could also indicate other drilling problems. Slope changes in log 91 represent underbalance (i.e., Pp > Pm) and overbalance (i.e., Pp < Pm) conditions and are identified at 100 and 102 respectively. It will be appreciated that there is less resistance to drilling above thenormal trend line 98 than below thenormal trend line 98. Therefore, excursions aboveline 98 could be associated with easier/efficient drilling and excursions belowline 98 could be associated with less efficient drilling. Inefficient drilling can be caused by any of the aforementioned drilling problems and/or other drilling problems. - Porosity can now be determined wherein all porosities are converted to an equivalent porosity (e.g., sand) for purposes of modeling. The drilling log can be expressed by:

If it is assumed that a new bit is used (i.e., η = 1), normal pressure conditions exist (i.e., Pm - Pp = 0) and only one lithology with varying porosity is being evaluated, then (WOB RPM / (ROP D))₀ and (TOR / (WOB D))₀ depend only on formation porosity and Eq. 75 can be expressed as:
where N is an integer, (TOR/(WOB D))M and (WOB RPM/(ROP D))M are matrix constants, and Φ₀ is porosity. Solving Eq. 76 for Φ₀ and letting N = 2 (the quadratic form was found to best fit field results) provides the following expression for porosity Φ₀:
where A1, A2 and A3 are constants which may be determined empirically or from data. The porosity signal and the porosity log are defined by the above described relationship. Referring to FIGURE 8, an example of a porosity log produced byplotter 30 in accordance with the present invention is shown generally at 104.Log 104 is shown in relation todrilling response log 103. Thislog 104 represents formation porosity, thus identifying lithology changes and detecting drillings problems. - Since Eq. 77 is good for only one lithology, to evaluate porosity for a sand-shale sequence the formation must be reduced to one lithology (e.g. sand porosity). The porosity of shale φsh at any depth is defined by:

where Φmax is the equivalent sand surface porosity of shale and C3 is a constant. These constants Φmax and C3 are determined from boundary conditions. Eq.78 is evaluated from a depth versus bulk density (σb) relationship for shales by the following relationship:
(σsh - σb) / (σsh-1) = Φshe e-(C3 TVD)
where σsh is the shale bulk density and Φshe is the equivalent maximum (sand) porosity of shales and is obtained by assuming that the bulk density behavior of shales is the same as the bulk density behavior of sands. - Referring to FIGURE 9, a plot of the drilling response log versus porosity in accordance with Eq. 77 is shown. The three constants A1, A2 and A3 in Eq. 77 were determined by cross plotting known formation porosity with log (TOR ROP / (WOB² RPM)) for clean sand-shale sequences (with a new bit & balanced conditions). In general, log (TOR ROP / (WOB² RPM)) is effected by pore pressure, bit wear, compaction and drilling problems. Overbalance conditions, bit wear and compaction will reduce the log's value and underbalance conditions will increase it. Corresponding to each depth the shale porosity can be obtained from Eq. 78. The corresponding expected log of the drilling response (log (TOR ROP / (WOB² RPM)) can be computed from Eq. 77. By keeping track of shales and their corresponding log (TOR ROP / (WOB² RPM)) values while drilling, an average value of log (TOR ROP / (WOB² RPM)) can be computed for shale at each depth. If the average value of log (TOR ROP / (WOB² RPM)) for shale is different from the expected value at any depth from Eq. 78, then the difference between the two values gives the correction necessary to compensate for pore pressure, bit, bit wear and compaction effects. To correct for these effects, a
curve 87 given by Eq. 77 is then shifted by the amount of thecorrection 88 generating a shifted curve 89. The formation drilling porosity corresponding to the actual (measured) value of log(TOR ROP / (WOB² RPM)) at that depth is then obtained from the shifted curve. - Since the formation at any depth is a mixture of sands and shales in different proportions, the computed drilling porosity reflects the effect of both these constituents. The porosity contribution from sands only (drilling sandstone porosity) is then obtained by eliminating the effect of shale as follows:

where Φsd is the drilling sandstone porosity (effects of shale removed), Φcomp is the computed drilling porosity (which includes shale effects), Φsh is the shale porosity from Eq. 78, and vsh is the percentage of shales in the formation (from gamma ray measurements). - Using the above procedure, drilling porosity or drilling sandstone porosity thus found is compensated for bit wear, bit, compaction and pore pressure effects. However, drilling porosity is not compensated for other drilling problems (e.g. bit balling, hanging stabilizers). Both the porosity signal and the porosity log can be compensated for formation effects (i.e., shale effects) by the above described relationships.
- As discussed above, the three constants A1, A2 and A3 may be obtained by plotting known formation porosity with log (TOR ROP / (WOB² RPM)) for clean sand-shale sequences (with a new bit & balanced conditions).
- An important feature of this invention is the sand porosity with the effects of shale removed. Prior art porosity measurements (i.e., density log derived porosity assuming one matrix) included the effects of shale. It is desirable that the effects of shale be removed since generally hydrocarbon deposits are found in the sand and not in the shale. Therefore, the sand porosity with the shale effects removed provides a more precise indication of a typical commercial hydrocarbon formation than does the prior art density log derived porosity using a constant matrix. The porosity signal and the porosity log both of which are compensated for formation effects are defined by the above described relationship. Referring to FIGURE 10, an example of a porosity log compensated for formation effects produced by
plotter 30 in accordance with the present invention is shown generally at 104.Log 106 is shown in relation todrilling response log 103. Thislog 106 represents formation porosity compensated for formation effects, thus identifying lithology changes and detecting drilling problems. - It will be appreciated that the insitu porosity is derived from mechanical measurements only (i.e., WOB, ROP, RPM, TOR and TVD). However, the sand porosity with the shale effects removed (porosity compensated for formation effects) requires gamma ray measurement to account for the percentage of shale in the formation (Eq. 79). Accordingly, two porosity signals and logs are provided.
- Differential pressure can be determined from the drilling response wherein continuous pore pressure is determined under the assumption of the one lithology (e.g., shale). The drilling response log for normal conditions (i.e., Pm = Pp) can be expressed as:

where C₁ = log (0.5 tan(ϑ)), and σ₀ = insitu rock strength. - Referring now to FIGURE 11, log (TOR ROP / (WOB² RPM))N is the drilling response log 103 for shale under normal conditions (i.e., Pm = Pp) and
line 98 is the shale base line. The shale base line (i.e., shale response curve) 98 is characterized by the geostatic load (i.e., overburden curve) for the region.Line 98 is superimposed ondrilling response curve 103 at a shale location where δP = 0 or is known. The drilling response for other than normal conditions (i.e., Pm ≠ Pp) can be expressed as:
where:
log (TOR ROP / (WOB² RPM))A is the drilling response log for other than normal conditions (i.e., Pm ≠ Pp). - From Eqs. 80 and 81 f(Pp, Pm) can also be expressed as:

Solving Eq. 82 for δP results in:
where α is a function of bit and rock properties, α = 1 was found to provide good results in shales. δP can also be expressed as:
by substituting f(Pp, Pm) (Eq. 83) into Eq. 84. - For a continuous differential pressure the dependence on α in Eq. 85 is eliminated by transforming sand/shale sequences into one lithology (e.g., shale).
- Referring to FIGURE 12 differential pressure δP is plotted as a function of shale volume (vsh) for clean sand shale sequences where gamma ray measurements are employed to determine vsh. The curve 107 (δPT) is used to transform resulting data into 100% shale. The calculated differential pressure (δPc) is expressed as:

Accordingly the differential pressure (δP) is determined by:
Differential pressure is thus compensated for formation and compaction effects by the above described procedure. Also, the differential pressure signal and the differential pressure log are defined by the above described relationships. Referring to FIGURE 13, an example of a differential pressure log produced byplotter 30 in accordance with the present invention is shown generally at 108.Log 108 is shown in relation todrilling response Log 103. Thislog 108 represents differential pressure and is used to detect drilling problems. Moreover with a known mud pressure Pm the formation pore pressure Pp is determined by:
and is shown in FIGURE 13 at 109. - It will be appreciated that the pore pressure signal can be derived from differential pressure (including differential pressure compensated for formation effects) by the relationship of Eq. 88.
- Important features of the present invention are the differential pressure, and the formation pore pressure derived from WOB, TOR, ROP, RPM and gamma ray measurements, wherein the gamma ray measurements are used to compensate for formation effects. The formation pore pressure and the differential pressure can be employed to determine desired mud density to be used during drilling operations. It will be further appreciated that differential pressure (i.e., δP = Pm - Pp) is different from the overpressure porosity described in U.S. Patent No. 4,883,914 to Rasmus (described hereinbefore). More particularly, the overpressure porosity is the supernormal pressure caused by overburdening (i.e., formation compaction stress increases when water is trapped in the porous formation).
- A drilling alert log which provides an early warning of drilling problems is presented. Drilling alerts are associated with a lower than normal drilling response. The drilling alert log can be expressed as either a severity ratio (TOR ROP / (WOB² RPM))N / (TOR ROP / (WOB² RPM))A or a sudden increase in derived differential pressure δP. A sudden increase in differential pressure implies a low formation pore pressure Pp, since mud pressure Pm is controlled by the operator.
- A maximum differential pressure &Pmax associated with standard drilling operations is selected by the operator. This (δP max) is required during drilling operations in order to maintain a mud pressure Pm in excess of the formation pore pressure Pp, thus avoiding a blow out or borehole collapse (described hereinbefore). Accordingly, any value above δPmax is generally attributed to drilling problems. The maximum differential pressure δPmax during normal drilling is expressed as:

where (TOR ROP / (WOB² RPM))N is the drilling response when Pm = Pp (i.e., shale base line) and (TOR ROP / (WOB² RPM))A1 is the drilling response when δP = δPmax. - The differential pressure at a location contributed by drilling problems is expressed as:

where (TOR ROP / (WOB² RPM))A2 is the drilling response at any location with drilling problems (i.e., abnormal operating conditions).
A drilling alert (DPR) can be expressed as:
Substituting Eqs. 89 and 90 provides:
- Drilling alerts can be represented on a log as a difference between the drilling problems and the actual drilling response curve, as follows:

The drilling alert signal and the drilling alert log are defined by the above described relationship. - Alternatively, drilling alerts can be expressed as a severity ratio log (TOR ROP / (WOB² RPM))A / (TOR ROP / (WOB² RPM))N. It will be appreciated that the severity ratio log does not employ gamma ray measurements and, therefore, is in real time at the depth of the bit.
- Referring to FIGURE 14, an example of a drilling alert log produced by
plotter 30 in accordance with the present invention is shown generally at 110. Log 110 is shown in relation todrilling response Log 103. The drilling alert log 110 provides continuous monitoring while corrections are being applied. Further, the log provides an indication of the severity of the problem. While the drilling alert log does not identify the source of the drilling problem, it does alert the operator of a drilling problem. - Bit wear factor is an indicator of the extent of tooth wear in a bit. It varies from 1 for a new bit to 0 for a completely worn bit. The bit wear factor η can be determined by solving Eq. 33 as follows:

where (ROP D / (WOB RPM))n1 is the rock drillability at the start of a bit run, (TOR ROP / (WOB² RPM))n1 is the drilling response at the start of a bit run, and µe is assumed from empirical data or obtained as the intercept from the normalized torque TOR / (WOB D) versus rock drillability ROP D / (WOB RPM) crossplot (FIGURE 6). While drilling in a shale formation, the normalized torque and rock drillability on the shale base line at any depth can be taken as the values corresponding to a new bit condition and the measured value of the the drilling response will be used to represent the start of the bit run. Eq. 93 also expresses a bit wear factor log when plotted as a function of depth. - The bit wear factor signal and the bit wear factor log are defined by the above described relationships. It should be noted that the bit wear factor η may be affected by other drilling problems. Referring to FIGURE 17, an example of a bit wear factor log produced by
plotter 30 in accordance with the present invention is shown generally at 111. Log 111 detects bit wear and is used to indicate when the bit is to be replaced. This is indicated by a line 111a being prior to bit replcement and line 111b being after bit replacement. Log 111 is shown in relation to vsh. - For single and multi-cone bits (i.e., impact bit) the amount of bearing wear can be determined from the mechanical measurements described herein. With a known WOB, bearing life/wear can be expressed in terms of total revolutions (provided no appreciable temperature increases occur). Thus, bearing wear is linearly related to bit revolutions. Bearing life is also dependent on the load applied. Each bearing has a finite service life which is specified by its load specifications. However, in a drilling process where drilling mud contains abrasive particles, mud properties (in case of non-sealed bearings) also affect the bearing life. As the bearing wears, the cones start wobbling thereby causing intermeshing of teeth on the cones. This causes tooth wear and breakage, thus associating bearing wear with tooth wear or breakage.
- A bearing failure which is a result of some form of mechanical abuse, can be related to or expressed by an increase in torque-to-weight ratio as a result of increase in friction at the bearing surfaces. The resulting temperature increase can cause a seal or lubricant failure. The bearing may still roll on (continue to wear loose) with increased torque or it may lock up. If a bearing locks up, the cone can act as a partial drag bit; in this case increased torque is generated since normal torque is higher for drag bits than for impact bits. Accordingly, bit torque is an important factor in bearing related problems.
- The following well known expression is used in estimating bearing wear:

where K = a constant depending on operating conditions and exponent α2 expresses effect of bit weight on bearing wear and is known to vary between 1.5 and 2, depending on the type of bearing and the mud properties.
The cumulative bearing wear is expressed as:
where α2 = 2 is assumed and the constant K is assumed to be a function of the type of bearing and fluid properties.
- This expression can be expressed in terms of torque by including the expression for drilling response as follows:

where Dr = TORa ROP / (WOB² RPM) (i.e., drilling response), TORa is the measured torque, L1 is the depth interval over which ROP and other drilling measurements are assumed constant, TORe it the expected bit torque; and K is a constant depending on the bearing. A bearing wear log results when Eq. 97 is plotted as a function of depth. - The inclusion of torque in the model (Eq. 94) is an important feature of the present invention. This allows (a) prediction of and/or onset of a bearing failure into the model and (b) demonstrates the potential use of drilling response for bearing wear predictions. Eq. (97) can also be expressed as:

where TORr = (TORe/TORa).
Thus for no bearing failure or excessive tooth/cutter wear, Ta = Te. Therefore, bearing wear is given by:
- Accordingly, bearing wear/failure is inversely proportional to drilling response. Therefore, as bearing wear increases, drilling response decreases. It will be appreciated that drilling response decreases as the teeth wear out. Thus, drilling response is effected by both bearing wear and tooth wear. Drilling response increase can be caused by higher than expected torque increase. This abnormal increase in torque caused by friction at the bearing surfaces could cause the bearings to fail (seal or lubricant failure due to temperature increase as a result of friction). The bearing could lock up causing the cone to act as a partial drag bit. Under normal conditions bearing wear should increase uniformly with depth.
- An increase in the rate of bearing wear may be associated with lower than normal ROP and TOR (low drilling response) implying a harder to drill formation and so is associated with higher than normal bit wear. A decrease in the rate of bearing wear may be associated with higher than normal TOR and/or ROP (higher drilling response) implying an easier to drill formation and so associated with lower than normal bit wear. The bearing wear signal and the bearing wear log are defined by the above described relationships. Referring to FIGURE 15, an example of a bearing wear log produced by
plotter 30 in accordance with the present invention is shown generally at 112. - Depending on the bit, formation and WOB, a certain torque at the bit could be generated. However, more than expected (abnormal torque increase) or less than expected torque (abnormal torque loss) can result under certain conditions. Abnormal torque increase at the bit can be associated with the following: (1) locked/failed bearing, (2) undergage bit behind a NB stabilizer, or (3) a lithology change. Abnormal torque loss however, can also be associated with tooth/cutter wear. Therefore, abnormal torque (i.e., abnormal torque increase and abnormal torque loss) can be a useful indicator of some drilling problems.
- The TOR / (WOB D) ratio for clean sand-shale sequences under normal pore pressure conditions as a function of vsh can be expressed as:

where TOR / (WOB D) is set so that TOR / (WOB D) = 0 for vsh = 1. - While keeping track of shales while drilling an average value of TOR / (WOB D) is computed for each depth. At each depth, Eq. 100 is adjusted so that the (TOR / WOB D) value at vsh=1 equals the actual value of TOR / (WOB D) for shales at that depth.
- Corresponding to actual vsh at each depth, the expected value of TOR / (WOB D) is determined from the shifted (adjusted) curve (Eq. 100). The expected torque is then computed using the measured value of WOB at that depth, thus expected torque (TORe) is expressed as:

The expected torque TORe at the bit is then compared to the actual (measured) torque TORa at the bit to generate a torque analysis log (i.e., TORa - TORe). If the expected torque is lower than the measured torque, the difference is then the abnormal torque increase generated at the bit due to bit problems. If the actual torque is lower than expected torque, the difference (or "torque loss") could be due to tooth wear/breakage. Lithology changes are compensated for in the model. - Accordingly, MWD measured torque is an important indicator of any drilling abnormalities near the bit. Moreover, by simultaneously analyzing abnormal increase or loss of torque, bearing wear and drilling response curves it is possible to recognize, isolate and distinguish between various bit related problems while drilling (e.g., bearing wear/failure, undergage bits and cutter, i.e., tooth wear) with rock bits. However, with drag bits, an abnormal increase or loss of torque indicates undergage stabilizers, formation squeeze, cutter wear or sloughing shales. The torque analysis signal and the torque analysis log are defined by the above described relationships. Referring to FIGURE 16, an example of an a torque analysis log produced by
plotter 30 in accordance with the present invention is shown generally at 114. Thislog 114 represents an abnormal increase or loss of torque and can be used to detect drilling problems. - While preferred embodiments have been shown and described, various modifications and substitutions may be made thereto without departing from the spirit and scope of the invention. Accordingly, it is to be understood that the present invention has been described by way of illustrations and not limitations.
Claims (108)
- CLAIM 1. A method for investigating properties of subsurface formations traversed by a borehole, the method comprising the steps of:
generating while drilling a plurality of signals indicative of formation properties derivable from measurements made while drilling;
in response to said plurality of signals, generating a drilling response signal; and
in response to said drilling response signal, optimizing the drilling process. - CLAIM 2. The method of claim 1 further comprising the step of:
in response to said drilling response signal, generating a drilling response log. - CLAIM 3. A drilling response log produced in accordance with the method of claim 2.
- CLAIM 4. The method of claim 1 wherein said derivable formation properties comprise properties representative of the mechanical process of drilling the borehole.
- CLAIM 5. The method of claim 4 wherein said properties representative of the mechanical process of drilling the borehole include weight on bit (WOB), bit torque (TOR), bit revolutions (RPM) and rate of penetration (ROP).
- CLAIM 6. The method of claim 2 wherein said drilling response log comprises the following relationship:
drilling response log = log (TOR ROP / (WOB² RPM))
where,
TOR = bit torque,
ROP = rate of penetration,
WOB = weight on bit,
RPM = bit revolutions. - CLAIM 7. The method of claim 2 wherein said drilling response log includes a shale base line.
- CLAIM 8. The method of claim 7 further including the step of:
orientating said shale base line relative to said drilling response log. - CLAIM 9. The method of claim 1 further comprising the steps of:
in response to said drilling response signal, generating a porosity signal; and
in response to said porosity signal, optimizing the drilling process. - CLAIM 10. The method of claim 9 further comprising the step of:
in response to said porosity signal, generating a porosity log. - CLAIM 11. A porosity log produced in accordance with the method of claim 10.
- CLAIM 12. The method of claim 9 further including the step of:
compensating said porosity signal for formation effects. - CLAIM 13. The method of claim 12 further comprising the step of:
in response to said porosity signal, generating a porosity log. - CLAIM 14. A porosity log produced in accordance with the method of claim 13.
- CLAIM 15. The method of claim 12 wherein at least one of said derivable formation properties comprise a property representative of natural radioactivity of the formation.
- CLAIM 16. The method of claim 15 wherein said property representative of natural radioactivity comprises:
measuring a plurality of emitted gamma rays to provide a signal indicative of the shale volume in the formation. - CLAIM 17. The method of claim 16 wherein said compensating said porosity signal comprises:
reducing said porosity signal by a product of said shale volume signal and a shale porosity signal. - CLAIM 18. The method of claim 17 wherein said shale porosity signal comprises the following relationship:
shale porosity = Φmaxe-(C3 TVD)
where,
Φmax is the equivalent surface porosity of shale,
C3 is a constant,
TVD = true vertical depth. - CLAIM 19. The method of claim 10 wherein said porosity log comprises the following relationship:

TOR ROP / (WOB² RPM) = drilling response,
TOR = bit torque,
ROP = rate of penetration,
WOB = weight of bit,
RPM = bit revolutions,
A1, A2 and A3 are constants. - CLAIM 20. The method of claim 13 wherein said porosity log comprises the following relationship:

TOR ROP / (WOB² RPM) = drilling response,
TOR = bit torque,
ROP = rate of penetration,
WOB = weight of bit,
RPM = bit revolutions,
A1, A2 and A3 are constants. - CLAIM 21. The method of claim 1 further comprising the steps of:
in response to said drilling response signal, generating a differential pressure signal; and
in response to said differential pressure signal, optimizing the drilling process. - CLAIM 22. The method of claim 21 further comprising the step of:
in response to said differential pressure signal, generating a differential pressure log. - CLAIM 23. A differential pressure log produced in accordance with the method of claim 22.
- CLAIM 24. The method of claim 21 further including the step of:
determining formation pore pressure from said differential pressure signal. - CLAIM 25. The method of claim 21 further including the steps of:
determining desired drilling mud density from said differential pressure signal; and
adjusting drilling mud density to said desired drilling mud density. - CLAIM 26. The method of claim 21 further including the step of:
compensating said differential pressure signal for formation effects. - CLAIM 27. The method of claim 26 wherein at least one of said derivable formation properties comprise a property representative of natural radioactivity of the formation.
- CLAIM 28. The method of claim 27 wherein said property representative of natural radioactivity comprises:
measuring a plurality of emitted gamma rays to provide a signal indicative of the shale volume in the formation. - CLAIM 29. The method of claim 28 further including the step of:
deriving a transformed differential pressure signal to correspond to said shale volume signal. - CLAIM 30. The method of claim 29 wherein said compensating said differential pressure signal comprises:
reducing said differential pressure signal by said transformed differential pressure signal. - CLAIM 31. The method of claim 22 wherein said differential pressure log comprises the following relationship:

(TOR ROP / (WOB² RPM))N = drilling response under normal pore pressure conditions,
(TOR ROP / (WOB² RPM))A = drilling response under other than normal conditions,
TOR = bit torque,
ROP = rate of penetration,
WOB = weight on bit,
RPM = bit revolutions,
α is a function of bit geometry and rock properties. - CLAIM 32. The method of claim 1 furt
in response to said drilling response signal, generating a drilling alert signal; and
in response to said drilling alert signal, optimizing the drilling process. - CLAIM 33. The method of claim 32 further comprising the step of:
in response to said drilling alert signal, generating a drilling alert log. - CLAIM 34. A drilling alert log produced in accordance with the method of claim 33.
- CLAIM 35. The method of claim 33 wherein said drilling alert log comprises the following relationship:

(TOR ROP / (WOB² RPM))N = drilling response for pore pressure equivalent to mud pressure,
(TOR ROP / (WOB² RPM))A1 = drilling response for a selected maximum differential pressure,
(TOR ROP / (WOB² RPM))A2 = drilling response for a drilling problem,
TOR = bit torque,
ROP = rate of penetration,
WOB = weight on bit,
RPM = bit rotations,
α is a function of bit geometry and rock properties. - CLAIM 36. The method of claim 33 wherein said drilling alert log comprises a severity ratio, said severity ratio comprising the following relationship:

(TOR ROP / (WOB² RPM))A = drilling response under other than normal conditions,
(TOR ROP / (WOB² RPM))N = drilling response under normal pore pressure conditions,
TOR = bit torque,
ROP = rate of penetration,
WOB = weight on bit,
RPM = bit rotations. - CLAIM 37. The method of claim 1 further comprising the steps of:
in response to said drilling response signal, generating a bit wear factor signal; and
in response to said bit wear factor signal, optimizing the drilling process. - CLAIM 38. The method of claim 37 further comprising the step of:
in response to said bit wear factor signal, replacing the bit. - CLAIM 39. The method of claim 37 further comprising the step of:
in response to said bit wear factor signal, generating a bit wear factor log. - CLAIM 40. A bit wear factor log produced in accordance with the method of claim 39.
- CLAIM 41. The method of claim 39 wherein said bit wear factor log comprises the following relationship when plotted as a function of depth:

(ROP D / (WOB RPM))n1 = rock drillability at the start of a bit run,
(TOR ROP / (WOB² RPM))n1 = drilling response at the start of a bit run,
µe = effective coefficient of friction between the bit and the formation,
TOR = bit torque,
ROP = rate of penetration,
WOB = weight on bit,
RPM = bit rotations. - CLAIM 42. The method of claim 1 further comprising the steps of:
in response to said drilling response signal, generating a bearing wear signal; and
in response to said bearing wear signal optimizing the drilling process. - CLAIM 43. The method of claim 42 further comprising the step of:
in response to said bearing wear signal, replacing the bit. - CLAIM 44. The method of claim 42 further comprising the step of:
in response to said bearing wear signal, generating a bearing wear log. - CLAIM 45. A bearing wear log produced in accordance with the method of claim 44.
- CLAIM 46. The method of claim 44 wherein said bearing wear log comprises the following relationship when plotted as a function of depth:

TORe = bit torque expected,
TORa ROP / (WOB² RPM) = drilling response,
L1 = depth interval,
K = a constant depending on bearing wear,
TORa = measured bit torque,
ROP = rate of penetration,
WOB = weight on bit,
RPM = bit revolutions. - CLAIM 47. A method for investigating properties of subsurface formations traversed by a borehole, the method comprising the steps of:
generating while drilling a plurality of signals indicative of formation properties derivable from measurements made while drilling;
in response to said plurality of signals, generating a porosity signal; and
in response to said porosity signal, optimizing the drilling process. - CLAIM 48. The method of claim 47 further comprising the step of:
in response to said porosity signal, generating a porosity log. - CLAIM 49. A porosity log produced in accordance with the method of claim 48.
- CLAIM 50. The method of claim 47 wherein said derivable formation properties comprises properties representative of the mechanical process of drilling the borehole.
- CLAIM 51. The method of claim 50 wherein said properties representative of the mechanical process of drilling the borehole include weight on bit (WOB), bit torque (TOR), bit revolutions (RPM) and rate of penetration (ROP).
- CLAIM 52. The method of claim 47 further including the step of:
compensating said porosity signal for formation effects. - CLAIM 53. The method of claim 52 further comprising the step of:
in response to said porosity signal, generating a porosity log. - CLAIM 54. A porosity log produced in accordance with the method of claim 53.
- CLAIM 55. The method of claim 52 wherein at least one of said derivable formation properties comprise a property representative of natural radioactivity of the formation.
- CLAIM 56. The method of claim 55 wherein said property representative of natural radioactivity comprises:
measuring a plurality of emitted gamma rays to provide a signal indicative of the shale volume in the formation. - CLAIM 57. The method of claim 56 wherein said compensating said porosity signal comprises:
reducing said porosity signal by a product of said shale volume signal and a shale porosity signal. - CLAIM 58. The method of claim 57 wherein said shale porosity signal comprises the following relationship:
shale porosity = Φmax e-(C3 TVD)
where,
Φmax is the equivalent surface porosity of shale,
C3 is a constant,
TVD = true vertical depth. - CLAIM 59. The method of claim 48 wherein said porosity log comprises the following relationship:

TOR ROP / (WOB² RPM) = drilling response,
TOR = bit torque,
ROP = rate of penetration,
WOB = weight of bit,
RPM = bit revolutions,
A1, A2 and A3 are constants. - CLAIM 60. The method of claim 53 wherein said porosity log comprises the following relationship:

TOR ROP / (WOB² RPM) = drilling response,
TOR = bit torque,
ROP = rate of penetration,
WOB = weight of bit,
RPM = bit revolutions,
A1, A2 and A3 are constants. - CLAIM 61. A method for investigating properties of subsurface formations traversed by a borehole, the method comprising the steps of:
generating while drilling a plurality of signals indicative of formation properties derivable form measurements made while drilling;
in response to said plurality of signals, generating a differential pressure signal; and
in response to said differential pressure signal, optimizing the drilling process. - CLAIM 62. The method of claim 61 further comprising the step of:
in response to said differential pressure signal, generating a differential pressure log. - CLAIM 63. A differential pressure log produced in accordance with the method of claim 62.
- CLAIM 64. The method of claim 61 further including the step of:
determining formation pore pressure from said differential pressure signal. - CLAIM 65. The method of claim 61 further including the steps of:
determining desired drilling mud density from said differential pressure signal; and
adjusting drilling mud density to said desired drilling mud density. - CLAIM 66. The method of claim 61 wherein said derivable formation properties comprises properties representative of the mechanical process of drilling the borehole.
- CLAIM 67. The method of claim 66 wherein said properties representative of the mechanical process of drilling the borehole include weight on bit (WOB), bit torque (TOR), bit revolutions (RPM) and rate of penetration (ROP).
- CLAIM 68. The method of claim 61 further including the step of:
compensating said differential pressure signal for formation effects. - CLAIM 69. The method of claim 68 wherein at least one of said derivable formation properties comprise a property representative of natural radioactivity of the formation.
- CLAIM 70. The method of claim 69 wherein said property representative of natural radioactivity comprises:
measuring a plurality of emitted gamma rays to provide a signal indicative of the shale volume in the formation. - CLAIM 71. The method of claim 70 further including the step of:
deriving a transformed differential pressure signal to correspond to said shale volume signal. - CLAIM 72. The method of claim 71 wherein said compensating said differential pressure signal comprises:
reducing said differential pressure signal by said transformed differential pressure signal. - CLAIM 73. The method of claim 62 wherein said differential pressure log comprises the following relationship:

(TOR ROP / (WOB² RPM))N = drilling response under normal pore pressure conditions,
(TOR ROP / (WOB² RPM))A = drilling response under other than normal conditions,
TOR = bit torque,
ROP = rate of penetration,
WOB = weight on bit,
RPM = bit revolutions,
α is a function of bit geometry and rock properties. - CLAIM 74. A method for investigating properties of subsurface formations traversed by a borehole, the method comprising the steps of:
generating while drilling a plurality of signals indicative of formation properties derivable from measurements made while drilling;
in response to said plurality of signals, generating a drilling alert signal; and
in response to said drilling alert signal, optimizing the drilling process. - CLAIM 75. The method of claim 74 further comprising the step of:
in response to said drilling alert signal, generating a drilling alert log. - CLAIM 76. A drilling alert log produced in accordance with the method of claim 75.
- CLAIM 77. The method of claim 74 wherein said derivable formation properties comprises properties representative of the mechanical process of drilling the borehole.
- CLAIM 78. The method of claim 77 wherein said properties representative of the mechanical process of drilling the borehole include weight on bit (WOB), bit torque (TOR), bit revolutions (RPM) and rate of penetration (ROP).
- CLAIM 79. The method of claim 75 wherein said drilling alert log comprises the following relationship:

(TOR ROP / (WOB² RPM))N = drilling response for pore pressure equivalent to mud pressure,
(TOR ROP / (WOB² RPM))A1 = drilling response for desired operating conditions,
(TOR ROP / (WOB² RPM))A₂ = drilllng response for a drilling problem,
TOR = bit torque,
ROP = rate of penetration,
WOB = weight on bit,
RPM = bit rotations;
α is a function of bit geometry and rock properties. - CLAIM 80. The method of claim 75 wherein said drilling alert log comprises a severity ratio, said severity ratio comprising the following relationship:

(TOR ROP / (WOB² RPM))A = drilling response under other than normal conditions,
(TOR ROP / (WOB² RPM))N = drilling response under normal pore pressure conditions,
TOR = bit torque,
ROP = rate of penetration,
WOB = weight on bit,
RPM = bit rotations. - CLAIM 81. A method for investigating properties of subsurface formations traversed by a borehole, the method comprising the steps of:
generating while drilling a plurality of signals indicative of formation properties derivable from measurements made while drilling;
in response to said plurality of signals, generating a bit wear factor signal; and
in response to said bit wear factor signal, optimizing the drilling process. - CLAIM 82. The method of claim 81 further comprising the step of:
in response to said bit wear factor signal, replacing the bit. - CLAIM 83. The method of claim 81 further comprising the step of:
in response to said bit wear factor signal, generating a bit wear factor log. - CLAIM 84. A bit wear factor log produced in accordance with the method of claim 83.
- CLAIM 85. The method of claim 81 wherein said derivable formation properties comprises properties representative of the mechanical process of drilling the borehole.
- CLAIM 86. The method of claim 85 wherein said properties representative of the mechanical process of drilling the borehole include weight on bit (WOB), bit torque (TOR), bit revolutions (RPM) and rate of penetration (ROP).
- CLAIM 87. The method of claim 83 wherein said bit wear factor log comprises the following relationship when plotted as a function of depth:

(ROP D / (WOB RPM))n1 = rock drillability at the start of a bit run,
(TOR ROP / (WOB² RPM))n1 = drilling response at the start of a bit run,
µe = effective coefficient of friction between the bit and the formation,
TOR = bit torque,
ROP = rate of penetration,
WOB = weight on bit,
RPM = bit rotations. - CLAIM 88. A method for investigating properties of subsurface formations traversed by a borehole, the method comprising the steps of:
generating while drilling a plurality of signals indicative of formation properties derivable from measurements made while drilling;
in response to said plurality of signals, generating a torque analysis signal; and
in response to said torque analysis signal, optimizing the drilling process. - CLAIM 89. The method of claim 88 further comprising the step of:
in response to said torque analysis signal, generating a torque analysis log. - CLAIM 90. A torque analysis log produced in accordance with the method of claim 89.
- CLAIM 91. The method of claim 88 wherein said derivable formation properties comprises properties representative of the mechanical process of drilling the borehole.
- CLAIM 92. The method of claim 91 wherein said properties representative of the mechanical process of drilling the borehole include weight on bit (WOB), bit torque (TOR), bit revolutions (RPM) and rate of penetration (ROP).
- CLAIM 93. The method of claim 89 wherein said abnormal torque log comprises the following relationship:
torque analysis log = TORa - TORe
where,
TORa = measured bit torque,
TORe = expected bit torque. - CLAIM 94. A method for investigating properties of subsurface formations traversed by a borehole, the method comprising the steps of:
generating while drilling a plurality of signals indicative of formation properties derivable from measurements made while drilling;
in response to said plurality of signals, generating a bearing bear signal; and
in response to said bearing wear signal, optimizing the drilling process. - CLAIM 95. The method of claim 94 further comprising the step of:
in response to said bearing wear signal, generating a bearing wear log. - CLAIM 96. The method of claim 95 further comprising the step of:
in response to said bearing wear signal, replacing the bit. - CLAIM 97. A bearing wear log produced in accordance with the method of claim 95.
- CLAIM 98. The method of claim 94 wherein said derivable formation properties comprises properties representative of the mechanical process of drilling the borehole.
- CLAIM 99. The method of claim 98 wherein said properties representative of the mechanical process of drilling the borehole include weight on bit (WOB), bit torque (TOR), bit revolutions (RPM) and rate of penetration (ROP).
- CLAIM 100. The method of claim 95 wherein said bearing wear log comprises the following relationship when plotted as a function of depth:

TORe = bit torque expected,
TORa ROP / (WOB² RPM) = drilling response,
L1 = depth interval over which ROP is measured,
K = a constant depending on bearing wear,
TORa = measured bit torque,
ROP = rate of penetration,
WOB = weight on bit,
RPM = bit revolutions. - CLAIM 101. A method for investigating properties of subsurface formations traversed by a borehole, the method comprising the steps of:
generating while drilling a plurality of signals indicative of formation properties derivable from measurements made while drilling;
in response to said plurality of signals, generating a normalized torque signal;
in response to said plurality of signals, generating a rock drillability signal;
in response to said normalized torque signal and said rock drillability signal, optimizing the drilling process. - CLAIM 102. The method of claim 101 wherein said derivable formation properties comprises properties representative of the mechanical process of drilling the borehole.
- CLAIM 103. The method of claim 102 wherein said properties representative of the mechanical process of drilling the borehole include weight on bit (WOB), bit torque (TOR), bit revolutions (RPM) and rate of penetration (ROP).
- CLAIM 104. The method of claim 101 wherein said normalized torque comprises the following relationship:
normalized torque = TOR / (WOB D)
where:TOR = bit torque,WOB = bit revolutions,D = bit diameter. - CLAIM 105. The method of claim 101 wherein said rock drillability signal comprises the following relationship:
rock drillability = ROP D / (WOB RPM)
where:ROP = rate of penetration,D = bit diameter,WOB = weight on bit,RPM = bit revolutions. - CLAIM 106. The method of claim 101 wherein said rock drillability signal and said normalized torque signal comprise the following linear relationship:

TOR / (WOB D) = normalized torque,
ROP D / (WOB RPM) = rock drillability,TOR = bit torque,WOB = weight on bit,D = bit diameter,ROP = bit revolutions,RPM = bit revolutions,S₁ = y intercept,S₂ = slope,f(η) = bit wear function. - CLAIM 107. The method of claim 106 wherein said y intercept comprises the following relationship for a drag bit:

µe = effective coefficient of friction between the bit and the formation,
φ = side rake angle for the bit; and
wherein said slope comprises the following relationship;
τ = insitu shear strength,
c1 = a constant,
σ = insitu rock strength,
ϑ = back rake angle for the bit,
f(η) = 1. - CLAIM 108. The method of claim 106 wherein said slope comprises the following relationship for an impact bit:

ϑ = half wedge angle for the tooth,
σ = insitu rock strength,
δ = angle of failure for the formation; and
wherein said y intercept comprises the following relationship;
α1 = is a factor dependent on rock and bit,
c2 = a bit constant,
η = bit wear factor,
τ = insitu shear strength,
c1 = a proportionality constant,
µ = coefficient of friction.
Applications Claiming Priority (2)
| Application Number | Priority Date | Filing Date | Title |
|---|---|---|---|
| US81937892A | 1992-01-09 | 1992-01-09 | |
| US819378 | 1992-01-09 |
Publications (1)
| Publication Number | Publication Date |
|---|---|
| EP0551134A1 true EP0551134A1 (en) | 1993-07-14 |
Family
ID=25227989
Family Applications (1)
| Application Number | Title | Priority Date | Filing Date |
|---|---|---|---|
| EP93100233A Withdrawn EP0551134A1 (en) | 1992-01-09 | 1993-01-08 | Method for evaluating formations and bit conditions |
Country Status (5)
| Country | Link |
|---|---|
| US (1) | US5415030A (en) |
| EP (1) | EP0551134A1 (en) |
| AU (1) | AU3109593A (en) |
| MX (1) | MX9300087A (en) |
| NO (1) | NO930044L (en) |
Cited By (10)
| Publication number | Priority date | Publication date | Assignee | Title |
|---|---|---|---|---|
| EP0743423A1 (en) * | 1995-05-15 | 1996-11-20 | Institut Français du Pétrole | Metod for determining drilling conditions using a model |
| US5679894A (en) * | 1993-05-12 | 1997-10-21 | Baker Hughes Incorporated | Apparatus and method for drilling boreholes |
| WO1998016712A1 (en) * | 1996-10-11 | 1998-04-23 | Baker Hughes Incorporated | Apparatus and method for drilling boreholes |
| FR2790511A1 (en) * | 1999-03-04 | 2000-09-08 | Geophysique Cie Gle | Drill comprises measuring device for measuring at least one parameter of ground being drilled |
| EP1428976A3 (en) * | 2002-12-11 | 2004-12-15 | Schlumberger Holdings Limited | System and method for processing and transmitting information from measurements made while drilling |
| EP1653044A3 (en) * | 2000-09-22 | 2008-11-19 | Weatherford/Lamb, Inc. | System for communicating information between a rig location and a computer network and methods using the system |
| US9051781B2 (en) | 2009-08-13 | 2015-06-09 | Smart Drilling And Completion, Inc. | Mud motor assembly |
| CN104727815A (en) * | 2015-03-15 | 2015-06-24 | 河北百冠钻井设备有限公司 | Real-time well drilling formation correction method and device |
| EP1834065A4 (en) * | 2004-12-16 | 2015-07-15 | Method for estimating confined compressive strength for rock formations utilizing skempton theory | |
| US9745799B2 (en) | 2001-08-19 | 2017-08-29 | Smart Drilling And Completion, Inc. | Mud motor assembly |
Families Citing this family (111)
| Publication number | Priority date | Publication date | Assignee | Title |
|---|---|---|---|---|
| US5864058A (en) * | 1994-09-23 | 1999-01-26 | Baroid Technology, Inc. | Detecting and reducing bit whirl |
| EP0728915B1 (en) * | 1995-02-16 | 2006-01-04 | Baker Hughes Incorporated | Method and apparatus for monitoring and recording of operating conditions of a downhole drill bit during drilling operations |
| US6047784A (en) * | 1996-02-07 | 2000-04-11 | Schlumberger Technology Corporation | Apparatus and method for directional drilling using coiled tubing |
| US5670711A (en) * | 1996-03-08 | 1997-09-23 | Regents Of The University Of Minnesota | Portable rock strength evaluation device |
| US5704436A (en) * | 1996-03-25 | 1998-01-06 | Dresser Industries, Inc. | Method of regulating drilling conditions applied to a well bit |
| US6612382B2 (en) * | 1996-03-25 | 2003-09-02 | Halliburton Energy Services, Inc. | Iterative drilling simulation process for enhanced economic decision making |
| US6109368A (en) * | 1996-03-25 | 2000-08-29 | Dresser Industries, Inc. | Method and system for predicting performance of a drilling system for a given formation |
| US5767399A (en) * | 1996-03-25 | 1998-06-16 | Dresser Industries, Inc. | Method of assaying compressive strength of rock |
| US5794720A (en) * | 1996-03-25 | 1998-08-18 | Dresser Industries, Inc. | Method of assaying downhole occurrences and conditions |
| US6408953B1 (en) * | 1996-03-25 | 2002-06-25 | Halliburton Energy Services, Inc. | Method and system for predicting performance of a drilling system for a given formation |
| US7032689B2 (en) * | 1996-03-25 | 2006-04-25 | Halliburton Energy Services, Inc. | Method and system for predicting performance of a drilling system of a given formation |
| US6390210B1 (en) * | 1996-04-10 | 2002-05-21 | Smith International, Inc. | Rolling cone bit with gage and off-gage cutter elements positioned to separate sidewall and bottom hole cutting duty |
| US20040236553A1 (en) * | 1998-08-31 | 2004-11-25 | Shilin Chen | Three-dimensional tooth orientation for roller cone bits |
| US6412577B1 (en) * | 1998-08-31 | 2002-07-02 | Halliburton Energy Services Inc. | Roller-cone bits, systems, drilling methods, and design methods with optimization of tooth orientation |
| US6095262A (en) * | 1998-08-31 | 2000-08-01 | Halliburton Energy Services, Inc. | Roller-cone bits, systems, drilling methods, and design methods with optimization of tooth orientation |
| US20040230413A1 (en) * | 1998-08-31 | 2004-11-18 | Shilin Chen | Roller cone bit design using multi-objective optimization |
| US8437995B2 (en) * | 1998-08-31 | 2013-05-07 | Halliburton Energy Services, Inc. | Drill bit and design method for optimizing distribution of individual cutter forces, torque, work, or power |
| US7334652B2 (en) * | 1998-08-31 | 2008-02-26 | Halliburton Energy Services, Inc. | Roller cone drill bits with enhanced cutting elements and cutting structures |
| US20040140130A1 (en) * | 1998-08-31 | 2004-07-22 | Halliburton Energy Services, Inc., A Delaware Corporation | Roller-cone bits, systems, drilling methods, and design methods with optimization of tooth orientation |
| US20040045742A1 (en) * | 2001-04-10 | 2004-03-11 | Halliburton Energy Services, Inc. | Force-balanced roller-cone bits, systems, drilling methods, and design methods |
| EP1371811B1 (en) * | 1998-08-31 | 2011-03-30 | Halliburton Energy Services, Inc. | Roller cone drill bit, method of designing the same and rotary drilling system |
| US20030051917A1 (en) * | 1998-08-31 | 2003-03-20 | Halliburton Energy Services, Inc. | Roller cone bits, methods, and systems with anti-tracking variation in tooth orientation |
| WO2000012859A2 (en) * | 1998-08-31 | 2000-03-09 | Halliburton Energy Services, Inc. | Force-balanced roller-cone bits, systems, drilling methods, and design methods |
| US6386297B1 (en) | 1999-02-24 | 2002-05-14 | Baker Hughes Incorporated | Method and apparatus for determining potential abrasivity in a wellbore |
| US6276465B1 (en) | 1999-02-24 | 2001-08-21 | Baker Hughes Incorporated | Method and apparatus for determining potential for drill bit performance |
| US6353799B1 (en) | 1999-02-24 | 2002-03-05 | Baker Hughes Incorporated | Method and apparatus for determining potential interfacial severity for a formation |
| FR2792363B1 (en) * | 1999-04-19 | 2001-06-01 | Inst Francais Du Petrole | METHOD AND SYSTEM FOR DETECTING THE LONGITUDINAL MOVEMENT OF A DRILLING TOOL |
| JP2001117909A (en) * | 1999-10-21 | 2001-04-27 | Oki Electric Ind Co Ltd | Transposing circuit for matrix form data |
| AU3640901A (en) * | 1999-11-03 | 2001-05-14 | Halliburton Energy Services, Inc. | Method for optimizing the bit design for a well bore |
| CA2376544A1 (en) * | 1999-11-05 | 2001-05-10 | Halliburton Energy Services, Inc. | Drilling formation tester, apparatus and methods of testing and monitoring status of tester |
| US8589124B2 (en) * | 2000-08-09 | 2013-11-19 | Smith International, Inc. | Methods for modeling wear of fixed cutter bits and for designing and optimizing fixed cutter bits |
| US6631772B2 (en) | 2000-08-21 | 2003-10-14 | Halliburton Energy Services, Inc. | Roller bit rearing wear detection system and method |
| US6634441B2 (en) | 2000-08-21 | 2003-10-21 | Halliburton Energy Services, Inc. | System and method for detecting roller bit bearing wear through cessation of roller element rotation |
| US6817425B2 (en) | 2000-11-07 | 2004-11-16 | Halliburton Energy Serv Inc | Mean strain ratio analysis method and system for detecting drill bit failure and signaling surface operator |
| US7357197B2 (en) * | 2000-11-07 | 2008-04-15 | Halliburton Energy Services, Inc. | Method and apparatus for monitoring the condition of a downhole drill bit, and communicating the condition to the surface |
| US6722450B2 (en) | 2000-11-07 | 2004-04-20 | Halliburton Energy Svcs. Inc. | Adaptive filter prediction method and system for detecting drill bit failure and signaling surface operator |
| US6648082B2 (en) | 2000-11-07 | 2003-11-18 | Halliburton Energy Services, Inc. | Differential sensor measurement method and apparatus to detect a drill bit failure and signal surface operator |
| US6712160B1 (en) | 2000-11-07 | 2004-03-30 | Halliburton Energy Services Inc. | Leadless sub assembly for downhole detection system |
| US7284623B2 (en) * | 2001-08-01 | 2007-10-23 | Smith International, Inc. | Method of drilling a bore hole |
| JP4016796B2 (en) * | 2002-10-22 | 2007-12-05 | オムロン株式会社 | In-vehicle imaging device and vehicle driving support device using the same |
| DE10254942B3 (en) * | 2002-11-25 | 2004-08-12 | Siemens Ag | Method for automatically determining the coordinates of images of marks in a volume data set and medical device |
| CA2471796A1 (en) * | 2003-06-20 | 2004-12-20 | Smith International, Inc. | Drill bit performance analysis tool |
| US8995224B2 (en) * | 2003-08-22 | 2015-03-31 | Schlumberger Technology Corporation | Real-time velocity and pore-pressure prediction ahead of drill bit |
| US7195086B2 (en) * | 2004-01-30 | 2007-03-27 | Anna Victorovna Aaron | Anti-tracking earth boring bit with selected varied pitch for overbreak optimization and vibration reduction |
| US7031841B2 (en) * | 2004-01-30 | 2006-04-18 | Schlumberger Technology Corporation | Method for determining pressure of earth formations |
| US7360612B2 (en) | 2004-08-16 | 2008-04-22 | Halliburton Energy Services, Inc. | Roller cone drill bits with optimized bearing structures |
| US7434632B2 (en) * | 2004-03-02 | 2008-10-14 | Halliburton Energy Services, Inc. | Roller cone drill bits with enhanced drilling stability and extended life of associated bearings and seals |
| GB2413403B (en) | 2004-04-19 | 2008-01-09 | Halliburton Energy Serv Inc | Field synthesis system and method for optimizing drilling operations |
| US20060020390A1 (en) * | 2004-07-22 | 2006-01-26 | Miller Robert G | Method and system for determining change in geologic formations being drilled |
| US7412331B2 (en) * | 2004-12-16 | 2008-08-12 | Chevron U.S.A. Inc. | Method for predicting rate of penetration using bit-specific coefficient of sliding friction and mechanical efficiency as a function of confined compressive strength |
| US7604072B2 (en) * | 2005-06-07 | 2009-10-20 | Baker Hughes Incorporated | Method and apparatus for collecting drill bit performance data |
| US8100196B2 (en) * | 2005-06-07 | 2012-01-24 | Baker Hughes Incorporated | Method and apparatus for collecting drill bit performance data |
| US8376065B2 (en) * | 2005-06-07 | 2013-02-19 | Baker Hughes Incorporated | Monitoring drilling performance in a sub-based unit |
| US7849934B2 (en) * | 2005-06-07 | 2010-12-14 | Baker Hughes Incorporated | Method and apparatus for collecting drill bit performance data |
| WO2007019471A1 (en) | 2005-08-08 | 2007-02-15 | Halliburton Energy Services, Inc. | Methods and systems for designing and/or selecting drilling equipment with desired drill bit steerability |
| US20090229888A1 (en) * | 2005-08-08 | 2009-09-17 | Shilin Chen | Methods and systems for designing and/or selecting drilling equipment using predictions of rotary drill bit walk |
| US7860693B2 (en) | 2005-08-08 | 2010-12-28 | Halliburton Energy Services, Inc. | Methods and systems for designing and/or selecting drilling equipment using predictions of rotary drill bit walk |
| US8522897B2 (en) | 2005-11-21 | 2013-09-03 | Schlumberger Technology Corporation | Lead the bit rotary steerable tool |
| US8408336B2 (en) | 2005-11-21 | 2013-04-02 | Schlumberger Technology Corporation | Flow guide actuation |
| US8360174B2 (en) | 2006-03-23 | 2013-01-29 | Schlumberger Technology Corporation | Lead the bit rotary steerable tool |
| US8316964B2 (en) | 2006-03-23 | 2012-11-27 | Schlumberger Technology Corporation | Drill bit transducer device |
| US8297378B2 (en) | 2005-11-21 | 2012-10-30 | Schlumberger Technology Corporation | Turbine driven hammer that oscillates at a constant frequency |
| US8297375B2 (en) | 2005-11-21 | 2012-10-30 | Schlumberger Technology Corporation | Downhole turbine |
| US8225883B2 (en) | 2005-11-21 | 2012-07-24 | Schlumberger Technology Corporation | Downhole percussive tool with alternating pressure differentials |
| US8528664B2 (en) | 2005-11-21 | 2013-09-10 | Schlumberger Technology Corporation | Downhole mechanism |
| US7571780B2 (en) | 2006-03-24 | 2009-08-11 | Hall David R | Jack element for a drill bit |
| US8011457B2 (en) * | 2006-03-23 | 2011-09-06 | Schlumberger Technology Corporation | Downhole hammer assembly |
| US7404457B2 (en) * | 2006-06-30 | 2008-07-29 | Baker Huges Incorporated | Downhole abrading tools having fusible material and methods of detecting tool wear |
| US7484571B2 (en) * | 2006-06-30 | 2009-02-03 | Baker Hughes Incorporated | Downhole abrading tools having excessive wear indicator |
| US7424910B2 (en) * | 2006-06-30 | 2008-09-16 | Baker Hughes Incorporated | Downhole abrading tools having a hydrostatic chamber and uses therefor |
| US7464771B2 (en) | 2006-06-30 | 2008-12-16 | Baker Hughes Incorporated | Downhole abrading tool having taggants for indicating excessive wear |
| US20080230221A1 (en) * | 2007-03-21 | 2008-09-25 | Schlumberger Technology Corporation | Methods and systems for monitoring near-wellbore and far-field reservoir properties using formation-embedded pressure sensors |
| US7866416B2 (en) | 2007-06-04 | 2011-01-11 | Schlumberger Technology Corporation | Clutch for a jack element |
| US8447523B2 (en) * | 2007-08-29 | 2013-05-21 | Baker Hughes Incorporated | High speed data transfer for measuring lithology and monitoring drilling operations |
| US7721826B2 (en) | 2007-09-06 | 2010-05-25 | Schlumberger Technology Corporation | Downhole jack assembly sensor |
| US8274399B2 (en) * | 2007-11-30 | 2012-09-25 | Halliburton Energy Services Inc. | Method and system for predicting performance of a drilling system having multiple cutting structures |
| BRPI0821259A2 (en) * | 2007-12-14 | 2015-06-16 | Halliburton Energy Serv Inc | Methods and systems for predicting rotary drill bit advance and for designing rotary drill bits and other downhole tools. |
| US7946357B2 (en) * | 2008-08-18 | 2011-05-24 | Baker Hughes Incorporated | Drill bit with a sensor for estimating rate of penetration and apparatus for using same |
| US8245792B2 (en) * | 2008-08-26 | 2012-08-21 | Baker Hughes Incorporated | Drill bit with weight and torque sensors and method of making a drill bit |
| EP2331904B1 (en) * | 2008-10-03 | 2018-04-18 | Halliburton Energy Services, Inc. | Method and system for predicting performance of a drilling system |
| US8210280B2 (en) * | 2008-10-13 | 2012-07-03 | Baker Hughes Incorporated | Bit based formation evaluation using a gamma ray sensor |
| US8215384B2 (en) * | 2008-11-10 | 2012-07-10 | Baker Hughes Incorporated | Bit based formation evaluation and drill bit and drill string analysis using an acoustic sensor |
| WO2010078282A1 (en) * | 2008-12-31 | 2010-07-08 | Shell Oil Company | Apparatus and method for characterizing stresses of a formation |
| US8082104B2 (en) * | 2009-01-23 | 2011-12-20 | Varel International Ind., L.P. | Method to determine rock properties from drilling logs |
| US8162077B2 (en) * | 2009-06-09 | 2012-04-24 | Baker Hughes Incorporated | Drill bit with weight and torque sensors |
| US8245793B2 (en) * | 2009-06-19 | 2012-08-21 | Baker Hughes Incorporated | Apparatus and method for determining corrected weight-on-bit |
| US9238958B2 (en) * | 2009-09-10 | 2016-01-19 | Baker Hughes Incorporated | Drill bit with rate of penetration sensor |
| US20110108325A1 (en) * | 2009-11-11 | 2011-05-12 | Baker Hughes Incorporated | Integrating Multiple Data Sources for Drilling Applications |
| US20110155463A1 (en) * | 2009-12-31 | 2011-06-30 | Sergey Khromov | System and apparatus for directing a survey of a well |
| US8381838B2 (en) * | 2009-12-31 | 2013-02-26 | Pason Systems Corp. | System and apparatus for directing the drilling of a well |
| WO2011083501A1 (en) * | 2010-01-05 | 2011-07-14 | Halliburton Energy Services, Inc. | Reamer and bit interaction model system and method |
| US8573327B2 (en) | 2010-04-19 | 2013-11-05 | Baker Hughes Incorporated | Apparatus and methods for estimating tool inclination using bit-based gamma ray sensors |
| CA2819319A1 (en) * | 2010-12-13 | 2012-06-21 | Schlumberger Canada Limited | Optimized drilling |
| US8899350B2 (en) | 2010-12-16 | 2014-12-02 | Caterpillar Inc. | Method and apparatus for detection of drill bit wear |
| US9041547B2 (en) | 2011-08-26 | 2015-05-26 | Baker Hughes Incorporated | System and method for stick-slip correction |
| US9436173B2 (en) | 2011-09-07 | 2016-09-06 | Exxonmobil Upstream Research Company | Drilling advisory systems and methods with combined global search and local search methods |
| US9169697B2 (en) | 2012-03-27 | 2015-10-27 | Baker Hughes Incorporated | Identification emitters for determining mill life of a downhole tool and methods of using same |
| CN102691497B (en) * | 2012-05-28 | 2013-06-12 | 中国石油大学(北京) | Method for predicting drillable level value of rock under different well bottom differential pressures |
| US9482084B2 (en) | 2012-09-06 | 2016-11-01 | Exxonmobil Upstream Research Company | Drilling advisory systems and methods to filter data |
| US9022140B2 (en) | 2012-10-31 | 2015-05-05 | Resource Energy Solutions Inc. | Methods and systems for improved drilling operations using real-time and historical drilling data |
| US10072481B2 (en) | 2013-08-29 | 2018-09-11 | Baker Hughes, A Ge Company, Llc | Modeling and production of tight hydrocarbon reservoirs |
| US10094210B2 (en) * | 2013-10-01 | 2018-10-09 | Rocsol Technologies Inc. | Drilling system |
| US9506317B2 (en) * | 2014-01-21 | 2016-11-29 | Baker Hughes Incorporated | Method of improving cleanout of a wellbore |
| WO2015119875A1 (en) * | 2014-02-07 | 2015-08-13 | Halliburton Energy Services, Inc. | Model for estimating drilling tool wear |
| US10119337B2 (en) | 2014-11-20 | 2018-11-06 | Halliburton Energy Services, Inc. | Modeling of interactions between formation and downhole drilling tool with wearflat |
| US10494913B2 (en) | 2014-11-20 | 2019-12-03 | Halliburton Energy Services, Inc. | Earth formation crushing model |
| EP3320177B1 (en) * | 2015-07-09 | 2022-11-02 | ConocoPhillips Company | Rock strength and in-situ stresses from drilling response |
| AU2015402206A1 (en) * | 2015-07-13 | 2017-12-21 | Landmark Graphics Corporation | Underbalanced drilling through formations with varying lithologies |
| AU2015418924A1 (en) * | 2015-12-31 | 2018-06-07 | Landmark Graphics Corporation | Drilling control based on brittleness index correlation |
| US20220268152A1 (en) * | 2021-02-22 | 2022-08-25 | Saudi Arabian Oil Company | Petro-physical property prediction |
| CN117420150B (en) * | 2023-12-18 | 2024-03-08 | 西安石油大学 | Analysis and prediction system and prediction method based on drilling parameters |
Citations (8)
| Publication number | Priority date | Publication date | Assignee | Title |
|---|---|---|---|---|
| DE2350612A1 (en) * | 1972-10-10 | 1974-04-25 | Texaco Development Corp | METHOD AND DEVICE FOR OPTIMIZATION OF MEASURED VALUES OVERDAY FOR THE PURPOSE OF DETERMINING THE DRILLING PROFILE DURING DRILLING WORK |
| US4064749A (en) * | 1976-11-11 | 1977-12-27 | Texaco Inc. | Method and system for determining formation porosity |
| EP0163426A1 (en) * | 1984-05-03 | 1985-12-04 | Anadrill International SA | Assessment of drilling conditions |
| US4627276A (en) * | 1984-12-27 | 1986-12-09 | Schlumberger Technology Corporation | Method for measuring bit wear during drilling |
| US4697650A (en) * | 1984-09-24 | 1987-10-06 | Nl Industries, Inc. | Method for estimating formation characteristics of the exposed bottomhole formation |
| US4949575A (en) * | 1988-04-29 | 1990-08-21 | Anadrill, Inc. | Formation volumetric evaluation while drilling |
| US4981036A (en) * | 1988-07-20 | 1991-01-01 | Anadrill, Inc. | Method of determining the porosity of an underground formation being drilled |
| EP0466255A2 (en) * | 1990-07-13 | 1992-01-15 | Anadrill International SA | Method of determining the drilling conditions associated with the drilling of a formation with a drag bit |
Family Cites Families (3)
| Publication number | Priority date | Publication date | Assignee | Title |
|---|---|---|---|---|
| US4876886A (en) * | 1988-04-04 | 1989-10-31 | Anadrill, Inc. | Method for detecting drilling events from measurement while drilling sensors |
| US4833914A (en) * | 1988-04-29 | 1989-05-30 | Anadrill, Inc. | Pore pressure formation evaluation while drilling |
| US4852399A (en) * | 1988-07-13 | 1989-08-01 | Anadrill, Inc. | Method for determining drilling conditions while drilling |
-
1993
- 1993-01-07 NO NO93930044A patent/NO930044L/en unknown
- 1993-01-08 AU AU31095/93A patent/AU3109593A/en not_active Abandoned
- 1993-01-08 MX MX9300087A patent/MX9300087A/en unknown
- 1993-01-08 EP EP93100233A patent/EP0551134A1/en not_active Withdrawn
-
1994
- 1994-04-08 US US08/225,423 patent/US5415030A/en not_active Expired - Lifetime
Patent Citations (8)
| Publication number | Priority date | Publication date | Assignee | Title |
|---|---|---|---|---|
| DE2350612A1 (en) * | 1972-10-10 | 1974-04-25 | Texaco Development Corp | METHOD AND DEVICE FOR OPTIMIZATION OF MEASURED VALUES OVERDAY FOR THE PURPOSE OF DETERMINING THE DRILLING PROFILE DURING DRILLING WORK |
| US4064749A (en) * | 1976-11-11 | 1977-12-27 | Texaco Inc. | Method and system for determining formation porosity |
| EP0163426A1 (en) * | 1984-05-03 | 1985-12-04 | Anadrill International SA | Assessment of drilling conditions |
| US4697650A (en) * | 1984-09-24 | 1987-10-06 | Nl Industries, Inc. | Method for estimating formation characteristics of the exposed bottomhole formation |
| US4627276A (en) * | 1984-12-27 | 1986-12-09 | Schlumberger Technology Corporation | Method for measuring bit wear during drilling |
| US4949575A (en) * | 1988-04-29 | 1990-08-21 | Anadrill, Inc. | Formation volumetric evaluation while drilling |
| US4981036A (en) * | 1988-07-20 | 1991-01-01 | Anadrill, Inc. | Method of determining the porosity of an underground formation being drilled |
| EP0466255A2 (en) * | 1990-07-13 | 1992-01-15 | Anadrill International SA | Method of determining the drilling conditions associated with the drilling of a formation with a drag bit |
Cited By (16)
| Publication number | Priority date | Publication date | Assignee | Title |
|---|---|---|---|---|
| US5679894A (en) * | 1993-05-12 | 1997-10-21 | Baker Hughes Incorporated | Apparatus and method for drilling boreholes |
| FR2734315A1 (en) * | 1995-05-15 | 1996-11-22 | Inst Francais Du Petrole | METHOD FOR DETERMINING DRILLING CONDITIONS INCLUDING A DRILLING MODEL |
| US5730234A (en) * | 1995-05-15 | 1998-03-24 | Institut Francais Du Petrole | Method for determining drilling conditions comprising a drilling model |
| EP0743423A1 (en) * | 1995-05-15 | 1996-11-20 | Institut Français du Pétrole | Metod for determining drilling conditions using a model |
| WO1998016712A1 (en) * | 1996-10-11 | 1998-04-23 | Baker Hughes Incorporated | Apparatus and method for drilling boreholes |
| GB2333793A (en) * | 1996-10-11 | 1999-08-04 | Baker Hughes Inc | Apparatus and method for drilling boreholes |
| GB2333793B (en) * | 1996-10-11 | 2001-05-30 | Baker Hughes Inc | Apparatus and method for drilling boreholes |
| FR2790511A1 (en) * | 1999-03-04 | 2000-09-08 | Geophysique Cie Gle | Drill comprises measuring device for measuring at least one parameter of ground being drilled |
| EP1653044A3 (en) * | 2000-09-22 | 2008-11-19 | Weatherford/Lamb, Inc. | System for communicating information between a rig location and a computer network and methods using the system |
| US9745799B2 (en) | 2001-08-19 | 2017-08-29 | Smart Drilling And Completion, Inc. | Mud motor assembly |
| EP1428976A3 (en) * | 2002-12-11 | 2004-12-15 | Schlumberger Holdings Limited | System and method for processing and transmitting information from measurements made while drilling |
| US7556104B2 (en) | 2002-12-11 | 2009-07-07 | Schlumberger Technology Corporation | System and method for processing and transmitting information from measurements made while drilling |
| US7363988B2 (en) | 2002-12-11 | 2008-04-29 | Schlumberger Technology Corporation | System and method for processing and transmitting information from measurements made while drilling |
| EP1834065A4 (en) * | 2004-12-16 | 2015-07-15 | Method for estimating confined compressive strength for rock formations utilizing skempton theory | |
| US9051781B2 (en) | 2009-08-13 | 2015-06-09 | Smart Drilling And Completion, Inc. | Mud motor assembly |
| CN104727815A (en) * | 2015-03-15 | 2015-06-24 | 河北百冠钻井设备有限公司 | Real-time well drilling formation correction method and device |
Also Published As
| Publication number | Publication date |
|---|---|
| NO930044L (en) | 1993-07-12 |
| AU3109593A (en) | 1993-07-15 |
| US5415030A (en) | 1995-05-16 |
| NO930044D0 (en) | 1993-01-07 |
| MX9300087A (en) | 1994-03-31 |
Similar Documents
| Publication | Publication Date | Title |
|---|---|---|
| US5415030A (en) | Method for evaluating formations and bit conditions | |
| EP0350978B1 (en) | Method for determining drilling conditions while drilling | |
| CA2322118C (en) | Method for optimizing drill bit and drilling parameter selection using rock strength measurements made from drill cuttings | |
| EP0336491B1 (en) | Method for detecting drilling events from measurement while drilling sensors | |
| US6374926B1 (en) | Method of assaying downhole occurrences and conditions | |
| US5216917A (en) | Method of determining the drilling conditions associated with the drilling of a formation with a drag bit | |
| CA2250185C (en) | Method of regulating drilling conditions applied to a well bit | |
| US4685329A (en) | Assessment of drilling conditions | |
| US6480118B1 (en) | Method of drilling in response to looking ahead of drill bit | |
| US4914591A (en) | Method of determining rock compressive strength | |
| US6386297B1 (en) | Method and apparatus for determining potential abrasivity in a wellbore | |
| CN101116009A (en) | Method for predicting rate of penetration using bit-specific coefficients of sliding friction and mechanical efficiency as a function of confined compressive strength | |
| US11704453B2 (en) | Drill bit design selection and use | |
| CN103975125A (en) | Method for detecting and mitigating drilling inefficiencies | |
| EP3059385A1 (en) | Systems and methods for determining and/or using estimate of drilling efficiency | |
| WO2001025597A1 (en) | Method for selecting drilling parameters | |
| EP0351902B1 (en) | Method of determining the porosity of an underground formation being drilled | |
| Peck | Performance monitoring of rotary blasthole drills | |
| US11761320B2 (en) | Method and system to drill a wellbore and identify drill bit failure by deconvoluting sensor data | |
| Jogi et al. | The application of a new drilling model for evaluating formation and downhole drilling conditions | |
| Fasheloum | Investigation of drilling parameters indicators | |
| Aghassi | Investigation of qualitative methods for diagnosis of poor bit performance using surface drilling parameters | |
| Robson et al. | Benefits of Complementary Surface Vibration and MWD Drilling Mechanics Measurements in a Horizontal Well | |
| Karrari et al. | Reply to discussion on ‘Predicting tunnel-boring machine penetration rate utilizing geomechanical properties’ by Karrari et al. 2022 (QJEGH, 55, qjegh2021-126) | |
| Kenupp et al. | DURING LOSS OF BIT STABILIZATION EVENTS |
Legal Events
| Date | Code | Title | Description |
|---|---|---|---|
| PUAI | Public reference made under article 153(3) epc to a published international application that has entered the european phase |
Free format text: ORIGINAL CODE: 0009012 |
|
| AK | Designated contracting states |
Kind code of ref document: A1 Designated state(s): BE DE FR GB NL |
|
| STAA | Information on the status of an ep patent application or granted ep patent |
Free format text: STATUS: THE APPLICATION IS DEEMED TO BE WITHDRAWN |
|
| 18D | Application deemed to be withdrawn |
Effective date: 19940115 |