EP0484102A2 - System and method for image enhancement - Google Patents
System and method for image enhancement Download PDFInfo
- Publication number
- EP0484102A2 EP0484102A2 EP91309976A EP91309976A EP0484102A2 EP 0484102 A2 EP0484102 A2 EP 0484102A2 EP 91309976 A EP91309976 A EP 91309976A EP 91309976 A EP91309976 A EP 91309976A EP 0484102 A2 EP0484102 A2 EP 0484102A2
- Authority
- EP
- European Patent Office
- Prior art keywords
- image
- histogram
- best fit
- function
- capture
- Prior art date
- Legal status (The legal status is an assumption and is not a legal conclusion. Google has not performed a legal analysis and makes no representation as to the accuracy of the status listed.)
- Withdrawn
Links
Images


Classifications
-
- G—PHYSICS
- G06—COMPUTING OR CALCULATING; COUNTING
- G06T—IMAGE DATA PROCESSING OR GENERATION, IN GENERAL
- G06T5/00—Image enhancement or restoration
- G06T5/90—Dynamic range modification of images or parts thereof
- G06T5/92—Dynamic range modification of images or parts thereof based on global image properties
-
- G—PHYSICS
- G06—COMPUTING OR CALCULATING; COUNTING
- G06T—IMAGE DATA PROCESSING OR GENERATION, IN GENERAL
- G06T5/00—Image enhancement or restoration
- G06T5/40—Image enhancement or restoration using histogram techniques
-
- G—PHYSICS
- G06—COMPUTING OR CALCULATING; COUNTING
- G06T—IMAGE DATA PROCESSING OR GENERATION, IN GENERAL
- G06T2207/00—Indexing scheme for image analysis or image enhancement
- G06T2207/10—Image acquisition modality
- G06T2207/10016—Video; Image sequence
Definitions
- This invention relates to a system and method of automatic image enhancement.
- Such technology provides a high entropy image and is quite helpful with respect to images encountered in space exploration.
- the result can often include very disturbing and unnatural appearing artifacts associated with the capture process as, for example, in a grainy appearance of the sky in an outdoor image.
- a correction curve employed by the equipment may be adjusted by hand, for example, in a commercial slide service establishment, wherein an operator may raise highlights, lower shadows, raise medium grays, lower middle grays, or the like, so as to enhance or reduce undesirable characteristics of the photograph such as saturation.
- the invention provides a method for automatic image enhancement of an image, comprising generating a histogram from video data representing said image; generating a best fit regression function of said histogram; and modifying said video data as a function of said regression function.
- the invention further provides a system for automatic image enhancement comprising means for generating a histogram from video data representing said image, means for generating a best bit regression function of said histogram; and means for modifying said video data as a function of said regression function.
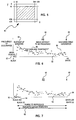
- Fig. 1 is a functional block diagram depicting a computerised video image capture and processing system.
- Fig. 2 is a more detailed block diagram of the system of Fig. 1.
- Fig. 3 is a schematic representation of the process for capturing an image and effecting automatic gamma correction to generate a corrected digital image in accordance with the invention.
- Fig. 4 is a more detailed flow diagram of the step of establishing a second order best fit depicted in Fig. 3.
- Fig. 5 is a schematic illustration of a captured image illustrating the cropping of the edge data.
- Fig. 6 is a simplified illustration of a histogram of gray scale levels derived from the captured image of Fig. 5.
- Fig. 7 is another illustration of the histogram of gray scale levels of Fig. 6 indicating establishment of white-black references and the calculated white-black range on the histogram employed to gather statistics in accordance with the invention.
- Fig. 8 is another histogram of gray scale levels derived from that of Fig. 7 wherein normalisation and sample limiting has been effected, whereby at the high end excess contrast giving rise to noise and single high points giving rise to uncorrectable saturation are avoided and further whereby low ends are limited to ensure a positive best fit curve.
- Fig. 9 is an illustrative second order best fit curve of the data depicted in Fig. 8.
- Fig. 10 is a pair of delta arrays derived from the data of Fig. 9, used to correct the image of Fig. 5.
- Fig. 11 depicts the histogram of Fig. 6 in an integrated transfer curve more common to those familiar with film-based images.
- the system to be described provides the artistic function heuristically without user intervention by automatically performing basic contrast correction on a captured image.
- the system operates to analyse the image, determine limitations in the capture process, separate anomalies caused by capture system limitations from desirable features of the image, and thence remove artifacts introduced by the capture process.
- a particular embodiment disclosed is concerned with operating only on the shape of the gray scale, (thereby effecting contrast) colour and sharpness will simultaneously be improved subjectively as a consequence.
- test image often is simply not available.
- an image in a book we desire to digitise has already been captured by the camera which includes the capture anomalies, along with the information we want to preserve defining the image also added in.
- the system disclosed herein seeks to see through the characteristics of the image to the underlying defects of the capture process. It then seeks to essentially regenerate the test histogram we would have obtained if a plain gray scale test image had first been captured from which to calibrate.
- a second assumption relates to the degree of smoothness desired in the curve fitting to the histogram which in the preferred embodiment is effected by means of a second order or quadratic fit.
- Higher order curve fitting employing terms such as X3 and X4 are empirically found not to map to definite physical capture defects. This is contrasted with X and X2 terms which are found empirically to map quite closely to gamma and saturation in the types of images normally encountered with respect to conventional multimedia work.
- the capture process warps the gray scale curve with a quadratic of the form A + Bx + Cx2.
- the "A” term simply relates to the number of pels in the image and is algorithmically uninteresting. The remaining terms, however, represent the two major factors which can go wrong in image capture which are contrast and saturation.
- the "B” empirically measures or maps to gamma, i.e. true contrast. If this "B" coefficient is negative, this implies there are too many dark pels and not enough light pels and thus the image appears dark and "contrasty".
- a negative B quantifies a very common problem when videographically capturing from a print or slide, for example, in which the gamma of both the photographic media and the electronic media add together.
- a positive B quantifies an image with too little true contrast. The image may still have full blacks and whites, but in between the image is too light, highlight detail is faint, and the image looks lifeless.
- a negative B image typically corresponds to a high gamma containing lots of dark values, referred to as "low key” in the art, while a positive B image would be low gamma and contain lots of white values, referred to as "high key”.
- the “C” term quantifies saturation, seen as the "toe” toward the intersection of the axis in the gray scale curve toward black, and the “shoulder” of the curve at the rightmost end thereof.
- a positive “C” typically indicates that either or both the highlights or shadows are saturating, indicated by a rise at the end of the gray scale graph.
- the “B” term works with the “C” term to specify if the shadows, highlights, or both are being compressed by saturation. It is for this reason that the B term needs to be interpreted in light of the C term value in accordance with the invention.
- the process of the invention is comprised of three steps.
- a gray scale histogram is created.
- the creation of histogram in this first step essentially builds a graph showing the frequency of occurrence for each level in the gray scale.
- a schematic of such a representative histogram may be seen in Fig. 6. This graph will contain all information about the image employed in the image processing steps utilised to generate the corrected image.
- the image is thence corrected by redistributing gray levels so the gray scale graph is more uniform.
- each gray scale step in the shadows of the original might translate to two gray scale steps in the shadows of the corrected image, thereby spreading steps over a wider range and reducing the hump at the bottom of the graph.
- the top of the gray scale would be compressed during correction, compressing rarified gray scale steps into former steps, thus raising the number of pels at each step up to a norm.
- the process is seeking to synthesise a gray scale histogram, e.g. to recover what would have been obtained as a histogram from the test gray scale disposed in front of the camera.
- this regression from the histogram of the capture is seeking to predict the histogram of the ideal test gray scale, in other words, what the gray scale histogram would have looked like based upon a priority knowledge of what artifacts would belong to the image and which artifacts would belong to defects in the capture process.
- the process seeks to sort out these differing image and capture artifacts in performing this regression.
- the image is thereby corrected according to the best fit.
- one of the most difficult problems addressed by the subject invention is in the determination of which artifacts of the curve are caused by the image which are desired to be preserved versus those caused by defects in the capture process itself. Examples of the latter include underexposing film, excessive gamma, or some portion of the image which has saturated. Certain characteristics of the image have been discovered to indicate which sort of artifact is present and are employed in the image processing in an effort to attempt to separate them in the best fit.
- FIG. 1 One such system which may be employed in the manner depicted in Figs. 1 and 2 is the IBM Audio Visual Connection (AVC) system which includes both the hardware and software necessary for the capture, processing, and display of analog video data.
- AVC IBM Audio Visual Connection
- This system is manufactured by the IBM Corporation of Armonk, New York. Supporting documentation for such a system may be found in the following publications which are herein incorporated by reference: IBM Audio Visual Connection User's Guide and the Video Capture Adapter Installation and Technical Reference Manual , both of which are available from the IBM Corporation.'
- Fig. 1 depicts in block diagram form a digital computer system 10, such as the AVC system.
- System 10 may take the form of a digital personal computer and includes a keyboard 6 for providing user input which is coupled to a central processing unit or host PC 4 in a conventional manner.
- host 4 includes memory devices, which may comprise both volatile and non-volatile memory storage devices and which may include auxiliary memory devices such as magnetic disk or tape storage.
- Host 4 is also coupled to one or more display drivers (not shown) which are utilised, in a conventional manner, to provide a visual display of video images by coupling appropriate control and data signals from the host 4 to the display 5 and one or more monitors 7.
- display 5 and monitor 7 may be provided by a variety of devices such as those adapted to receive analog video in varying formats such as RGB, Y/C, NTSC, and the like.
- a video camera 3 is further included having an analog video link 32 to the host 4.
- the camera 3 is shown to be trained on an object 2 having visual images to be digitised by the system 10.
- the camera 3 transfers the visual image of object 2 into analog electronic signals carried on the link 32 to the host 4 wherein they will subsequently be digitised, processed and reconverted into analog form for output on analog output link 34 after which they are displayed on one or more monitors 7.
- the system 10 may, of course, include other components.
- the general digital computer and display portions of the system 10 may be be provided for example by means of an IBM Model 80 PS/2 computer (IBM and PS/2 are trade marks of InternationalBusiness Machines Corporation of Armonk, New York.)
- the host 4 includes a bus system facilitating data, control, and address I/O to various components of the system in a manner well known in the art.
- a bus system facilitating data, control, and address I/O to various components of the system in a manner well known in the art.
- an IBM Micro Channel bus system is preferably employed.
- Microsoft Channel is a trademark of the International Business Machines Corporation.
- the invention is not intended to be so limited to a particular bus structure and contemplates use with other bus structures. More detailed information regarding this microchannel bus structure and operation may be obtained with reference to the technical manuals accompanying the Model 80 PS/2 machine.
- analog video input signals on link 32 have been shown as originating from the camera 3, it will be readily appreciated that such analog video source material may be generated from a number of other sources such as the familiar VCR, VTR (video tape recorder), or the like. These sources of analog video signals may be in a number of formats such as the aforementioned RGB, Y/C, composite video. Although only one source of such formatted video information is shown in Fig. 1, a plurality of multiformat sources may be accommodated for subsequent digitising in the host 4 of their respective video images or data, processed and subsequently re-converted back to analog video signals for simultaneous display on one or more display devices.
- a computer monitor 5 has been shown in Fig. 1 which conventionally comprises a portion of a general personal computer system including the host 4 and is used for conventional purposes of I/O with the host 4. However, as hereinbefore noted, a monitor 7 has further been included for display of these re-converted analog video signals.
- an adapter card in one of the slots may carry connectors for receiving raw analog video source data in multiple formats and multiplexing/control hardware and the like on the card which, under computer control by interfacing with the aforementioned bus, will select one of these signals for digitisation.
- This adapter card may further include the analog-to-digital circuitry necessary to digitise this preselected signal.
- encoder circuitry is provided on the adapter card in order to convert the digitised video signals into multiple analog formats.
- Multiple connectors are provided on the card each carrying a different one of these re-converted digitised signals in a different one of the conventional analog video formats. In this manner, by connecting a monitor to each such connector adapted to receive that connector's particular signal format, simultaneous display of the video image in multiple formats results. It will be noted that this re-conversion is also under computer 4 control inasmuch as the adapter card and associated encoder circuitry is plugged into the interface bus of the computer 4.
- FIG. 2 a more detailed functional block diagram of the system 10 of Fig. 1 is illustrated which will now be described.
- analog video input signals in a variety of formats are received by the video adapter 16 of the invention.
- the video adapter 16 is connected to the host system 12 by the video device driver 18 which receives status from the adapter on lines 36 and sends commands and data to registers of adapter 16 on line 38.
- the bus of the system 10 is illustrated graphically in part by output on line 26 going from adapter 16 into the video buffers 28 inside the host processor 12. Further function of this bus is illustrated by line 30 indicating information stored in this video buffer 28 may be loaded into host storage such as a PC hard disk 22. From storage 22 via the bus, again illustrated by a line, 24, data can be received from the disk and put back into the buffer 28 of host 12. From these buffers 28 data may also be read and then sent back via the host bus connection to the adapter 16 on line 32 to load video data into the video memory of the adapter 16.
- a video device driver 18 has a video application programming interface 20 which directly interfaces as shown by line 15 with the video capture and edit capability or function 14 of the host system 10.
- the application programming interface 20 provides microcommands for the video capture and edit process that are ultimately delivered to the video adapter 16 via the device driver box 18.
- commands are sent via lines 40 to and status information is received via lines 42 from the system processor of host 12. This results in an image being displayed on the screen of one or more monitors 7, Fig. 1.
- the screen 17 of host 12 will generally be reserved for display of on-source material, i.e., the more conventional I/O data associated with personal computer systems. Such data includes operator input from keyboard 6, and user-interface information from the host 12 for operating the capture and display features of the invention.
- the displayed image may be live or a composite image including images controlled by the function selected by the video capture and edit module.
- the path 15 between the video capture and edit function 14 and the application programming interface 20 is via microcommands which are then in turn converted into individual separate commands and status requests across lines 36 and 38.
- functions indicated by lines 32, 30, 24 and 26 are all actually handled via the bus itself of system 10 and generally represent disk 22 I/O and adapter card 16 I/O.
- the pels are stored in the PC disk 22 and buffers 28 prior their restorage on PC disk 22 or being output through video adapter 16 as analog 34 for display of an enhanced image.
- the system 10, in accordance with the invention, has thus generated an enhanced image eliminating the undesirable capture artifacts by the processing software interacting with the system 10.
- Fig. 3 there may be see a schematic representation of the foregoing general description of the capture and processing of the invention.
- the image captured by a suitable source such as a camera 50 is digitised as shown as block 52, whereupon the video system constructs the histogram at block 54 to be hereinafter detailed with greater specificity.
- the histogram thus created thence has a best fit curve generated to model it, shown at block 56.
- the original image digitised at block 52 is then functionally altered in accordance with the best fit curve generated at block 56 as shown schematically by the arrows 58 and block 60, resulting in a digital image corrected automatically for contrast.
- the best fit block 56 of Fig. 3 is further expanded in Fig. 4.
- the gray scale range is limited to an appropriate range in block 62. Within this range, extremely high or low histogram counts are limited in block 66, and the quadratic best fit of the resulting histogram within the limited gray scale range is computed in block 68.
- the range and best fit date are integrated in block 70 to give the overall best fit, from which the gray scale correction function is found in block 72 that will be applied to correct the original image.
- the second detailed step in the image processing of the invention effects the previously described building of a histogram of gray scale levels as shown in Fig. 6 from the captured "cropped" image of Fig. 5. For each pel in the cropped image of fig. 5, a red, green, and blue level will be determined. The gray scale graph elements pointed to by the red, green, and blue levels will each be incremented by 4, 4, and 1 respectively.
- Fig. 6 Before discussing the numerous rationales behind construction of a histogram in such a manner, several characteristics of an example the image reflected by the resultant histogram may be noted with reference to Fig. 6. These include the presence of "weak" blacks at reference numeral 82 wherein contrast is so low that shadows all appear substantially the same.
- Such a image exhibits further characteristics in need of correction such as blocked up shadows at 84, portions of the image at 86 which are too dark and "contrasty" and elements of the image evidencing uncorrectable saturation such as those shown as reference numeral 88. It will also be noted that depicted in the histogram of Fig. 6 are representative image artifacts 90 which are desirably to be preserved while at the same time eliminating those associated with a defective capture process.
- green may typically have more visual "weighting" and contain the least noise
- the red image is frequently more important in many scenes, tends to have a higher contrast record, and is a better indicator of problems so in net, both green and red have been counted equally.
- Blue on the other hand, frequently has the highest noise and the lowest visual weight, and images more randomly, and is accordingly ascribed little weight.
- a total is derived representing the sum of the 64 gray levels, i.e. the total number of all colours counted which is equal to (total number of pels) x (4+4+1).
- a number "black 200" is determined as the highest gray scale value number, such that the umber of all lower levels are less than or equal to total/200.
- the process will desirably count up from black zero and when the sum of all R, G, B is greater than total/200, that level is thence assigned as the value of black 200 shown at reference numeral 92 in Fig. 7.
- a black 32 value will be determined and ascribed at the value representing total/32, depicted schematically in Fig. 7 as reference numeral 94.
- values for white 32 and white 200 at the top of the histogram are determined shown as reference numeral 96.
- specular reflections include those of chrome and sunlight. If such highlights are captured, one frequently has to darken the image to cover the full range from black to white such that a white wall for example will appear undesirably darkened. Whereas specular reflections cannot be ignored completely, in accordance with this step of the method they are not used to set the pure white value and are thus desirably represented by a small range beyond the normal white level.
- a black cutoff point is usually not abrupt but rather darker values will tend to saturate into black, evidencing some vignetting caused by the camera and other capture anomalies.
- a histogram would not be expected to rise to saturation and drop immediately to zero but rather will roll off as shown in Fig. 7.
- it is desirable for the process of the curve fitting not to see this rolloff but rather to see more uniform curve to fit to or otherwise an inappropriate best fit will result. It is for this reason that rolloff is eliminated in accordance with this step of setting white and black references.
- the next step in this detailed embodiment of the image processing is to normalise the histogram so the counts at all gray scale levels average one. This may be effected by multiplying all gray scale counts by (white 32 minus black 32 plus one) / (total count times 63/64). It will be observed that this 63/64 term is actually between 62/64 and 1 for any specific image.
- white 32 and black 32 gray scale points normalises the values within the range 98 of Fig. 7. This is the range within which the best fit will be derived.
- limiting of the curve is effected thereby limiting the extreme points of the histogram which are probably image artifacts such as those shown at reference numeral 90 in Fig. 7 and 100 in Fig. 8.
- a comparison of the ordinates of these image artifacts at 90 and 100 and uncorrectable saturation elements at 88 and 102 of Figs. 7 and 8, respectively, will graphically illustrate this limiting function.
- the low points in a histogram in like manner will be pulled up as shown from a comparison of Figs. 7 and 8.
- limiting at the high end is found necessary because by boosting contrast too high, this simply results in noise in the image.
- the next step in the image processing is to effect the previously described best fit in the form A + Bx + Cx2.
- This second order best fit is performed between the black 32 level and white 32 level shown at references numerals 94 and 96 of Fig. 9, with the resulting best fit curve being depicted therein as curve 104.
- This curve fitting may be effected in a number of manners well known in the mathematical arts with the assistance of computer processing provided by the system depicted in Figs. 1 and 2.
- a smooth gray scale graph is created, i.e. given the second order best fit curve 104 of Fig. 9, and the overall range of black 200 at 95 to white 200 at 97, the best fit curve is "smoothed" by providing an overall best fit over the entire range by tapering the edges off as shown for example at 106 in Fig. 9.
- a "delta" array is created with elements at 0.5, 1.5, 2.5, ... 61.5 and 62.5.
- the value of the function f(x) A + Bc + Cx2 with A, B, C determined in the previous step, is evaluated and the results are placed in this delta array 108.
- this f(x) is eveluated at black 32 and assigned a value Y. If black 32 does not equal black 200, then the process will step by one between black 200 plus 0.5 and black 3.2 minus 0.5 and the delta array is then set equal to Y x (N - black 200) / (black 32 - black 200).
- the delta array is zeroed between 0.5 and black 200 - 0.5.
- the function f(x) is evaluated at white 32 and assigned a value Y. If white 32 is not equal to white 200, then between white 32 + 0.5 and white 200 - 0.5, the delta array is set to equal the value Y x (white 200 - N) / (white 200 - white 32). If white 200 is not 63 then the delta array is zeroed between white 200 plus 0.5 and 62.5.
- the curve in Fig. 9 comprising segments 104, 106, 107, and 105 is the gray scale graph that needs to be corrected.
- the step has removed both image artifacts we desire to preserve as well as uncorrectable capture anomalies. Sections of the gray scale with high concentration of pels need to be expanded proportionally to that concentration.
- the delta, or difference array holds the difference which must be obtained between the converted gray scale of two states and the final convert array to flatten the curve of the final converted image. Still further, at the ends between the 32 and the ultimate 200 points, a smooth descent is provided and wherein beyond the 200 points, no gray scale is allocated.
- a correction lookup table is generated based upon the overall best fit and utilised to correct the image.
- the convert array has been normalised between 0.0 to 1.0.
- the convert array is intergized. If colour values must be 6 bits each, each element of the convert array is translated using a function of the form truncate (convert array (N) x 63.99). Finally, the actual conversion from the original image to the corrected image that is the product of this invention is performed with this convert array. For each colour of each pel of the original image, the 6 bit value of the colour is utilised as a pointer into the convert array, and a new 6 bit value is received back to replace the old value.
- pels corresponding to a corrected image are thereby created which may be utilised in any desired manner thereafter such as in the display of the corrected image on the monitors 5 or 7 in Fig. 1.
- image processing of the invention may also be understood in terms of a more conventional approach of transfer function theory associated with negatives, for example in the photographic art, such a transfer function 110 being shown in Fig. 11.
- This function typically has several areas associated with it including an area 112 resulting in underexposed areas, a low contrast toe 114, a high contrast middle 116, a low contrast shoulder 118 and a saturation level 120.
- this transfer function may be seen as the integral of the previously described histogram.
- integration of the f(x) yields a function of the form Z + Ax + Bx2 + Cx3.
- These coefficients Z, A, B, and C map to a black level, white level, gamma, and saturation, respectively.
- the extreme points 90 of Fig. 6 of the histogram have been limited, however the invention is not intended to be limited in scope to such treatment of these points.
- these points may, rather than be limited, simply be decreased in weight as the best fit is performed which may yield an equivalent but slightly different result.
- an iterative best fit may also be desirable in some applications.
- a first pass best fit would accordingly be performed.
- a second pass fit would be performed wherein they are simply weighted less as a function of their distance from the curve fit by the first pass. It will be seen from the foregoing by simply limiting the extreme points this is merely an expedient in taking these extreme points into account which may be refined by such weighting of these points.
- a method and system has been described in which analog video data input is received by a video capture system and digitised. From the pels of the captured image, a gray scale level histogram is constructed with the system processor, and normalised to established white-black references similar to the contrast control function usually available at image capture time. Peaks likely to be attributable to image artifacts are limited. The image processor then performs a second order best fit regression of the histogram from which the image is thereafter corrected. An automatic correction of the image contrast is thereby effected, wherein capture artifacts are reduced while retaining those of the image. In an alternate embodiment described, instead of limiting peaks, an iterative best fit is performed, wherein the peaks are weighted in a subsequent best fit pass as a function of their distances from the curve fit from a prior best fit pass.
Landscapes
- Physics & Mathematics (AREA)
- General Physics & Mathematics (AREA)
- Engineering & Computer Science (AREA)
- Theoretical Computer Science (AREA)
- Image Processing (AREA)
- Image Input (AREA)
- Complex Calculations (AREA)
Abstract
Description
- This invention relates to a system and method of automatic image enhancement.
- In the field of digital video technology, a problem often arises with captured images similar to that encountered in the photographic arts, namely the contrast of the image is defective and in need of correction.
- Several methods have been employed in the past to correct such defects. For example, it is known in the satellite image processing art to effectively flatten the gray scale histogram of the image without attempting to sort out and treat differently the artifacts attributable to the image, which are desirable, from those of the image capture process which are undesirable anomalies.
- Such technology provides a high entropy image and is quite helpful with respect to images encountered in space exploration. However, when applied to natural images more typically encountered in multimedia work, the result can often include very disturbing and unnatural appearing artifacts associated with the capture process as, for example, in a grainy appearance of the sky in an outdoor image.
- Technology has further been developed to permit manual adjustment of contrast levels as, for example, in equipment employed in photographic film processing to produce photographic images. A correction curve employed by the equipment may be adjusted by hand, for example, in a commercial slide service establishment, wherein an operator may raise highlights, lower shadows, raise medium grays, lower middle grays, or the like, so as to enhance or reduce undesirable characteristics of the photograph such as saturation.
- In a related area, it has been known to provide various forms of video signal processing equipment which permits the operator to manually adjust the contrast or gamma of the captured video signal. While such manual techniques provide the opportunity for great flexibility and artistic input these same characteristics also give rise to numerous problems. Perhaps the most obvious of these is the need for skilled operators and their subjective judgement, as well as the repeatability and consistency of the artistic judgements which are being made.
- It was accordingly highly desirable in some applications, such as in commercial multimedia systems, to make provision for some form of automatic gamma or contrast adjustments in the video image whereby these artistic functions might be performed heuristically without user intervention. Certainly various automatic contrast schemes have been devised in the image processing and photographic arts in seeking to remove the human variable, as, for example, in the automatic range setting of black-white levels or automatic brightness controls in some forms of video equipment. In some cases, for example in commercial photography, an average of gray scales in the image is sometimes taken and the brightness level set as a function of this average. In more sophisticated equipment, automatic processing circuitry may examine the image for the brightest and darkest levels and set the contrast as a function of these levels.
- A serious problem with these automated approaches, however, is that again there is no attention given to seeking to discriminate between image artifacts and undesirable capture artifacts. A technique was thus highly desired which could automatically perform basic contrast correction on captured images without user intervention while at the same time removing from the image only the artifacts introduced by the capture process.
- The invention provides a method for automatic image enhancement of an image, comprising generating a histogram from video data representing said image; generating a best fit regression function of said histogram; and modifying said video data as a function of said regression function.
- The invention further provides a system for automatic image enhancement comprising means for generating a histogram from video data representing said image, means for generating a best bit regression function of said histogram; and means for modifying said video data as a function of said regression function.
- In order that the invention may be understood, preferred embodiment thereof will now be described by way of example with reference to the accompanying drawings, in which:
- Fig. 1 is a functional block diagram depicting a computerised video image capture and processing system.
- Fig. 2 is a more detailed block diagram of the system of Fig. 1.
- Fig. 3 is a schematic representation of the process for capturing an image and effecting automatic gamma correction to generate a corrected digital image in accordance with the invention.
- Fig. 4 is a more detailed flow diagram of the step of establishing a second order best fit depicted in Fig. 3.
- Fig. 5 is a schematic illustration of a captured image illustrating the cropping of the edge data.
- Fig. 6 is a simplified illustration of a histogram of gray scale levels derived from the captured image of Fig. 5.
- Fig. 7 is another illustration of the histogram of gray scale levels of Fig. 6 indicating establishment of white-black references and the calculated white-black range on the histogram employed to gather statistics in accordance with the invention.
- Fig. 8 is another histogram of gray scale levels derived from that of Fig. 7 wherein normalisation and sample limiting has been effected, whereby at the high end excess contrast giving rise to noise and single high points giving rise to uncorrectable saturation are avoided and further whereby low ends are limited to ensure a positive best fit curve.
- Fig. 9 is an illustrative second order best fit curve of the data depicted in Fig. 8.
- Fig. 10 is a pair of delta arrays derived from the data of Fig. 9, used to correct the image of Fig. 5.
- Fig. 11 depicts the histogram of Fig. 6 in an integrated transfer curve more common to those familiar with film-based images.
- First, a description of the problem addressed will be provided along with a more general description of the system for effecting automatic gamma correction. This will then be followed by a description of a video capture and processing system with reference to Figs. 1 and 2 adapted for use in effecting the invention. Next, a high level description of the digital processing of the captured image will be given with reference to Figs. 3 and 4. This will then be followed by a more detailed description of a particular embodiment of the digital signal processing with reference to Figs. 5-10.
- The system to be described provides the artistic function heuristically without user intervention by automatically performing basic contrast correction on a captured image. In order to do so, as a broad overview of the functions to be performed (which will be disclosed later in more detail), the system operates to analyse the image, determine limitations in the capture process, separate anomalies caused by capture system limitations from desirable features of the image, and thence remove artifacts introduced by the capture process. Although a particular embodiment disclosed is concerned with operating only on the shape of the gray scale, (thereby effecting contrast) colour and sharpness will simultaneously be improved subjectively as a consequence.
- In order to more clearly understand the problem addressed by the present invention, it will be appreciated that if a test image containing all levels of gray uniformly distributed therein was captured with a system having capture anomalies, a histogram built from the capture of this test image could be used directly in correction routines for subsequent more useful images to remove these capture anomalies.
- One problem in the real world, however, is that such a test image often is simply not available. As but one example, an image in a book we desire to digitise has already been captured by the camera which includes the capture anomalies, along with the information we want to preserve defining the image also added in. In the simplest terms, the system disclosed herein seeks to see through the characteristics of the image to the underlying defects of the capture process. It then seeks to essentially regenerate the test histogram we would have obtained if a plain gray scale test image had first been captured from which to calibrate.
- Before further discussing broadly the technique implemented herein, certain assumptions must be noted about the capture process itself. It is first assumed that peaks in the gray scale histogram of an image imply areas of relatively solid colours indicating an image artifact and not a capture artifact. These peaks will accordingly be ignored as described in the limiting step of the preferred embodiment.
- A second assumption relates to the degree of smoothness desired in the curve fitting to the histogram which in the preferred embodiment is effected by means of a second order or quadratic fit. The higher the order, i.e. the larger the n in Xn employed in the curve fit, the more detailed variations of the actual histogram curve are being accounted for in the curve fitting. Higher order curve fitting (employing terms such as X³ and X⁴) are empirically found not to map to definite physical capture defects. This is contrasted with X and X² terms which are found empirically to map quite closely to gamma and saturation in the types of images normally encountered with respect to conventional multimedia work. By accounting for these faster changes in the histogram curve by higher order curve fitting, the danger is increased that image artifacts are being picked up. Consequently it is a feature of the invention that second order fitting has been applied so as to ignore these artifacts. In other words by performing a second order best fit, this effectively serves as a way of seeing through a class of image anomalies as we otherwise would have done if the aforementioned test gray scale was available.
- It is thus assumed, as one feature of the invention, that the capture process warps the gray scale curve with a quadratic of the form A + Bx + Cx². Any higher order terms, i.e. any more abrupt changes, arise from image features we desire to preserve or from uncorrectable capture defects such as saturated whites and blacks as previously noted. The "A" term simply relates to the number of pels in the image and is algorithmically uninteresting. The remaining terms, however, represent the two major factors which can go wrong in image capture which are contrast and saturation.
- The "B" empirically measures or maps to gamma, i.e. true contrast. If this "B" coefficient is negative, this implies there are too many dark pels and not enough light pels and thus the image appears dark and "contrasty". A negative B quantifies a very common problem when videographically capturing from a print or slide, for example, in which the gamma of both the photographic media and the electronic media add together. A positive B quantifies an image with too little true contrast. The image may still have full blacks and whites, but in between the image is too light, highlight detail is faint, and the image looks lifeless. Stated differently a negative B image typically corresponds to a high gamma containing lots of dark values, referred to as "low key" in the art, while a positive B image would be low gamma and contain lots of white values, referred to as "high key".
- The "C" term quantifies saturation, seen as the "toe" toward the intersection of the axis in the gray scale curve toward black, and the "shoulder" of the curve at the rightmost end thereof. A positive "C" typically indicates that either or both the highlights or shadows are saturating, indicated by a rise at the end of the gray scale graph. The "B" term works with the "C" term to specify if the shadows, highlights, or both are being compressed by saturation. It is for this reason that the B term needs to be interpreted in light of the C term value in accordance with the invention. Sometimes an image produces a negative C, it will be noted, as could happen if there were brilliant highlights which should not be clipped but rather need to be compressed to allow gray scale room for the rest of the image to be seen.
- Broadly, the process of the invention is comprised of three steps. First the image is digitised or captured with an appropriate digital video capture system such as that hereinafter described generally. With the thus-captured pels in storage, a gray scale histogram is created. The creation of histogram in this first step essentially builds a graph showing the frequency of occurrence for each level in the gray scale. A schematic of such a representative histogram may be seen in Fig. 6. This graph will contain all information about the image employed in the image processing steps utilised to generate the corrected image. As an example, if the original image included too many dark shadows, a hump would appear at the bottom of the graph in the vicinity of
reference numeral 84, whereas if the original image was underexposed, the top of the graph would approach 0 as indicated asreference numeral 85 in Fig. 6. - As a next step in the image processing, the image is thence corrected by redistributing gray levels so the gray scale graph is more uniform. For example, if the original had too many dark shadows, each gray scale step in the shadows of the original might translate to two gray scale steps in the shadows of the corrected image, thereby spreading steps over a wider range and reducing the hump at the bottom of the graph. In like manner, if the original was underexposed, the top of the gray scale would be compressed during correction, compressing rarified gray scale steps into former steps, thus raising the number of pels at each step up to a norm. By making each state in the gray scale more nearly equal in probability across the image, the "information content" of the image goes up in accordance with formulas from information theory well known in the art. Because the human eye desires to perceive "information" presented clearly, the aesthetic appeal of the image will thereby usually be improved.
- Thus, it will be appreciated that in the second step of the process, stated differently, the process is seeking to synthesise a gray scale histogram, e.g. to recover what would have been obtained as a histogram from the test gray scale disposed in front of the camera. In regressing to such a synthesised gray scale histogram, it should be readily apparent that this regression from the histogram of the capture is seeking to predict the histogram of the ideal test gray scale, in other words, what the gray scale histogram would have looked like based upon a priority knowledge of what artifacts would belong to the image and which artifacts would belong to defects in the capture process. Thus the process seeks to sort out these differing image and capture artifacts in performing this regression.
- An extreme correction would rearrange the gray scale so that each gray step in the corrected image had the same number of image pixels associated with it. Such an extreme correction would, in a mathematical sense, yield the most "information" since each state would now have equal probability. However, the gray scale curve could become disjointed causing small area artifacts. Moreover, large areas of the image with the same gray level such as the aforementioned sky in the prior art associated with space exploration image processing, would be assigned too much contrast and would therefore appear grainy. Accordingly, a difficult aspect of the processing of the invention is in the determination of what characteristics of the gray scale graph are in fact from these capture artifacts which should be corrected and which parts are from capture artifacts which cannot be corrected, and further which parts are from image characteristics that should not be corrected. As an example of portions which cannot be corrected, highlights may have been so overexposed and saturated as to essentially have disappeared.
- As a third step in the image processing in accordance with the invention, from aforementioned regression to the gray scale histogram which the process seeks to synthesise and from the captured image, the image is thereby corrected according to the best fit. Relative to effecting this best fit, one of the most difficult problems addressed by the subject invention is in the determination of which artifacts of the curve are caused by the image which are desired to be preserved versus those caused by defects in the capture process itself. Examples of the latter include underexposing film, excessive gamma, or some portion of the image which has saturated. Certain characteristics of the image have been discovered to indicate which sort of artifact is present and are employed in the image processing in an effort to attempt to separate them in the best fit.
- Now that a general overview of the image processing of the invention has been presented, a representative digital video capture and processing system adapted to the present invention will be described with reference to Figs. 1 and 2 after which will follow a more detailed description of a particular preferred embodiment of the processing. One such system which may be employed in the manner depicted in Figs. 1 and 2 is the IBM Audio Visual Connection (AVC) system which includes both the hardware and software necessary for the capture, processing, and display of analog video data. This system is manufactured by the IBM Corporation of Armonk, New York. Supporting documentation for such a system may be found in the following publications which are herein incorporated by reference: IBM Audio Visual Connection User's Guide and the Video Capture Adapter Installation and Technical Reference Manual, both of which are available from the IBM Corporation.'
- Fig. 1 depicts in block diagram form a
digital computer system 10, such as the AVC system.System 10 may take the form of a digital personal computer and includes akeyboard 6 for providing user input which is coupled to a central processing unit orhost PC 4 in a conventional manner. Included in thehost 4 are memory devices, which may comprise both volatile and non-volatile memory storage devices and which may include auxiliary memory devices such as magnetic disk or tape storage. -
Host 4 is also coupled to one or more display drivers (not shown) which are utilised, in a conventional manner, to provide a visual display of video images by coupling appropriate control and data signals from thehost 4 to thedisplay 5 and one or more monitors 7. It will be appreciated that thedisplay 5 and monitor 7 may be provided by a variety of devices such as those adapted to receive analog video in varying formats such as RGB, Y/C, NTSC, and the like. - In the
system 10 shown in Fig. 1, avideo camera 3 is further included having ananalog video link 32 to thehost 4. Thecamera 3 is shown to be trained on anobject 2 having visual images to be digitised by thesystem 10. Thecamera 3 transfers the visual image ofobject 2 into analog electronic signals carried on thelink 32 to thehost 4 wherein they will subsequently be digitised, processed and reconverted into analog form for output onanalog output link 34 after which they are displayed on one or more monitors 7. Thesystem 10 may, of course, include other components. The general digital computer and display portions of thesystem 10 may be be provided for example by means of anIBM Model 80 PS/2 computer (IBM and PS/2 are trade marks of InternationalBusiness Machines Corporation of Armonk, New York.) - The
host 4, as is common in personal computers, includes a bus system facilitating data, control, and address I/O to various components of the system in a manner well known in the art. In particular with respect to theaforementioned Model 80 PS/2 computer, an IBM Micro Channel bus system is preferably employed. (Micro Channel is a trademark of the International Business Machines Corporation.) However, the invention is not intended to be so limited to a particular bus structure and contemplates use with other bus structures. More detailed information regarding this microchannel bus structure and operation may be obtained with reference to the technical manuals accompanying theModel 80 PS/2 machine. - Although analog video input signals on
link 32 have been shown as originating from thecamera 3, it will be readily appreciated that such analog video source material may be generated from a number of other sources such as the familiar VCR, VTR (video tape recorder), or the like. These sources of analog video signals may be in a number of formats such as the aforementioned RGB, Y/C, composite video. Although only one source of such formatted video information is shown in Fig. 1, a plurality of multiformat sources may be accommodated for subsequent digitising in thehost 4 of their respective video images or data, processed and subsequently re-converted back to analog video signals for simultaneous display on one or more display devices. Acomputer monitor 5 has been shown in Fig. 1 which conventionally comprises a portion of a general personal computer system including thehost 4 and is used for conventional purposes of I/O with thehost 4. However, as hereinbefore noted, amonitor 7 has further been included for display of these re-converted analog video signals. - Referring again briefly to the bus structures associated with
personal computer systems 10, it is conventional to provide in the various available hosts 4 a plurality of adapter card or expansion slots. The purpose of these slots is to enable a user to custom configure a system to perform desired functions. An adapter card in one of the slots may carry connectors for receiving raw analog video source data in multiple formats and multiplexing/control hardware and the like on the card which, under computer control by interfacing with the aforementioned bus, will select one of these signals for digitisation. This adapter card may further include the analog-to-digital circuitry necessary to digitise this preselected signal. By interconnection of the adapter card with the bus, processing and editing of the thereby digitised image under control of thehost 4 computer through the bus to eliminate motion artifacts is provided. A further function of the adapter card is to then re-convert the processed/edited digitised video information into analog form, such function also being performed on board on the card by provision of appropriate digital-to-analog conversion circuitry. - Finally, encoder circuitry is provided on the adapter card in order to convert the digitised video signals into multiple analog formats. Multiple connectors are provided on the card each carrying a different one of these re-converted digitised signals in a different one of the conventional analog video formats. In this manner, by connecting a monitor to each such connector adapted to receive that connector's particular signal format, simultaneous display of the video image in multiple formats results. It will be noted that this re-conversion is also under
computer 4 control inasmuch as the adapter card and associated encoder circuitry is plugged into the interface bus of thecomputer 4. - With reference now to Fig. 2, a more detailed functional block diagram of the
system 10 of Fig. 1 is illustrated which will now be described. - As shown at
line 32 analog video input signals in a variety of formats are received by thevideo adapter 16 of the invention. Thevideo adapter 16 is connected to thehost system 12 by thevideo device driver 18 which receives status from the adapter onlines 36 and sends commands and data to registers ofadapter 16 online 38. The bus of thesystem 10 is illustrated graphically in part by output online 26 going fromadapter 16 into the video buffers 28 inside thehost processor 12. Further function of this bus is illustrated byline 30 indicating information stored in thisvideo buffer 28 may be loaded into host storage such as a PChard disk 22. Fromstorage 22 via the bus, again illustrated by a line, 24, data can be received from the disk and put back into thebuffer 28 ofhost 12. From thesebuffers 28 data may also be read and then sent back via the host bus connection to theadapter 16 online 32 to load video data into the video memory of theadapter 16. - A
video device driver 18 has a videoapplication programming interface 20 which directly interfaces as shown byline 15 with the video capture and edit capability or function 14 of thehost system 10. Theapplication programming interface 20 provides microcommands for the video capture and edit process that are ultimately delivered to thevideo adapter 16 via thedevice driver box 18. As a result of execution of the video capture and editprogram 14 commands are sent vialines 40 to and status information is received vialines 42 from the system processor ofhost 12. This results in an image being displayed on the screen of one ormore monitors 7, Fig. 1. The screen 17 ofhost 12 will generally be reserved for display of on-source material, i.e., the more conventional I/O data associated with personal computer systems. Such data includes operator input fromkeyboard 6, and user-interface information from thehost 12 for operating the capture and display features of the invention. The displayed image may be live or a composite image including images controlled by the function selected by the video capture and edit module. Thepath 15 between the video capture and editfunction 14 and theapplication programming interface 20 is via microcommands which are then in turn converted into individual separate commands and status requests acrosslines lines system 10 and generally represent disk 22 I/O and adapter card 16 I/O. - It will be appreciated from the foregoing that once the image has been captured in the form of digitised representations of pels of various frames of video data by means of the system depicted in Figs. 1 and 2, software may be provided for the
host processor 12 for manipulating such data in any desired manner. It is of course a feature of the invention to provide such a computerised process for operating on this digitised data in the manner herein described in accordance with the invention to effect the desired image correction. Thus an imageprocessing application program 21 of the invention may be provided to interface with the videoapplication programming interface 20 so as to effect the desired manipulation and transformation of these digital representations of the pels. The pels are stored in thePC disk 22 andbuffers 28 prior their restorage onPC disk 22 or being output throughvideo adapter 16 asanalog 34 for display of an enhanced image. Thesystem 10, in accordance with the invention, has thus generated an enhanced image eliminating the undesirable capture artifacts by the processing software interacting with thesystem 10. - Now that a description of the capture system has been provided having the capability of image capture, processing in accordance with invention under software control and display, the detailed description of the processing of these digital representations of capture pels by the processing application in accordance with the invention will be provided.
- In Fig. 3 there may be see a schematic representation of the foregoing general description of the capture and processing of the invention. The image captured by a suitable source such as a
camera 50 is digitised as shown asblock 52, whereupon the video system constructs the histogram atblock 54 to be hereinafter detailed with greater specificity. The histogram thus created thence has a best fit curve generated to model it, shown atblock 56. The original image digitised atblock 52 is then functionally altered in accordance with the best fit curve generated atblock 56 as shown schematically by thearrows 58 andblock 60, resulting in a digital image corrected automatically for contrast. - The best
fit block 56 of Fig. 3 is further expanded in Fig. 4. First, the gray scale range is limited to an appropriate range inblock 62. Within this range, extremely high or low histogram counts are limited inblock 66, and the quadratic best fit of the resulting histogram within the limited gray scale range is computed inblock 68. The range and best fit date are integrated inblock 70 to give the overall best fit, from which the gray scale correction function is found inblock 72 that will be applied to correct the original image. - In the detailed illustration of the processing of the captured image, such a digitised image may he seen schematically depicted as
image 80 in Fig. 5. The processing to effect image correction of the invention may be implemented in theapplication program 21 of Fig. 2. This program may be readily implemented by one skilled in the programming arts with reference to the accompanying description and figures. - In the first detailed step of the processing, which may, for illustrative purposes be a 480 x 640 image system, the centre of the image of Fig. 5 would first be scaned as, for example, from X = 40 to 599 and Y = 40 to 439. Doing so eliminates potential problems associated with image edges well known in the art. As one example, by international standard, a conventional 35 millimetre negative film area is defined by 24 x 36 millimetres. The outer portion of this area is typically covered by the frame and thus in the processing herein described, these edges would be deleted from the image. As but another brief example of edge problems obviated in this step, captured images may frequently include too much undesired image characteristics such as sky or extreme shadows.
- In this detailed example, it is assumed that the red, green, and blue records of
image 5 are digitised to 6 bits and therefore can take on 2⁶ = 64 possible values. These discrete values are represented as discrete points along the horizontal axis in Figs. 6-9. - The second detailed step in the image processing of the invention effects the previously described building of a histogram of gray scale levels as shown in Fig. 6 from the captured "cropped" image of Fig. 5. For each pel in the cropped image of fig. 5, a red, green, and blue level will be determined. The gray scale graph elements pointed to by the red, green, and blue levels will each be incremented by 4, 4, and 1 respectively. Before discussing the numerous rationales behind construction of a histogram in such a manner, several characteristics of an example the image reflected by the resultant histogram may be noted with reference to Fig. 6. These include the presence of "weak" blacks at
reference numeral 82 wherein contrast is so low that shadows all appear substantially the same. Such a image exhibits further characteristics in need of correction such as blocked up shadows at 84, portions of the image at 86 which are too dark and "contrasty" and elements of the image evidencing uncorrectable saturation such as those shown asreference numeral 88. It will also be noted that depicted in the histogram of Fig. 6 arerepresentative image artifacts 90 which are desirably to be preserved while at the same time eliminating those associated with a defective capture process. - As to the rationale for construction of the histogram in such a manner, first, in effecting a gray scale level, wherein all colours are lumped together, it has been empirically observed that brightly coloured scenes are low key under one colour and high key under another colour. Correcting each colour image separately would in many applications result in decolourising many scenes. Still further it will be noted that the gray scale has been incremented by dissimilar values relative to the red, green, and blue levels. It has further been observed empirically that in some colour-mapped images, the blue record has higher noise and therefore blue is an unreliable indicator of saturation and has ascribed thereto a lower incrementing value relative to red and green. Moreover, red, green, and blue are each counted separately rather than just counting luminance. In this manner, bright colours are correctly accounted for at both ends of the histogram even though luminance would count incorrectly in the middle of the histogram. It will be noted how monochrome images of colour prints seem to have more grays than images photographed originally in black and white.
- Finally, although green may typically have more visual "weighting" and contain the least noise, the red image is frequently more important in many scenes, tends to have a higher contrast record, and is a better indicator of problems so in net, both green and red have been counted equally. Blue, on the other hand, frequently has the highest noise and the lowest visual weight, and images more randomly, and is accordingly ascribed little weight.
- Referring now to Fig. 7, this figure is intended to schematically illustrate the next step in the image processing, namely the establishment of white and black references. First, a total is derived representing the sum of the 64 gray levels, i.e. the total number of all colours counted which is equal to (total number of pels) x (4+4+1). Next a number "black 200" is determined as the highest gray scale value number, such that the umber of all lower levels are less than or equal to total/200. In order to do this, the process will desirably count up from black zero and when the sum of all R, G, B is greater than total/200, that level is thence assigned as the value of black 200 shown at
reference numeral 92 in Fig. 7. - Similarly, a black 32 value will be determined and ascribed at the value representing total/32, depicted schematically in Fig. 7 as
reference numeral 94. Similarly, values for white 32 and white 200 at the top of the histogram are determined shown asreference numeral 96. There are several rationales for the foregoing establishment of black and white references. Essentially this step is performing the same normalisation available with the contrast controls at image capture time. Usually, if an image was captured correctly, the "200" points will be at the extreme values of 0 and 63 and the "32" points will be very close to these extreme points. The "200" cutoff points will be the new white-black levels, however statistics will be drawn from the narrower range so that saturation effects are more clearly concentrated at the ends. The difference between the "32" and "200" points allows a smooth rolloff for specular reflections in live images wherein the correction for these specular artifacts are not available at capture time. Examples of specular reflections include those of chrome and sunlight. If such highlights are captured, one frequently has to darken the image to cover the full range from black to white such that a white wall for example will appear undesirably darkened. Whereas specular reflections cannot be ignored completely, in accordance with this step of the method they are not used to set the pure white value and are thus desirably represented by a small range beyond the normal white level. In like manner, in a real world image, a black cutoff point is usually not abrupt but rather darker values will tend to saturate into black, evidencing some vignetting caused by the camera and other capture anomalies. In other words, a histogram would not be expected to rise to saturation and drop immediately to zero but rather will roll off as shown in Fig. 7. However, in the curve fitting in accordance with the invention, it is desirable for the process of the curve fitting not to see this rolloff but rather to see more uniform curve to fit to or otherwise an inappropriate best fit will result. It is for this reason that rolloff is eliminated in accordance with this step of setting white and black references. - The next step in this detailed embodiment of the image processing is to normalise the histogram so the counts at all gray scale levels average one. This may be effected by multiplying all gray scale counts by (white 32 minus black 32 plus one) / (
total count times 63/64). It will be observed that this 63/64 term is actually between 62/64 and 1 for any specific image. These use of white 32 and black 32 gray scale points normalises the values within therange 98 of Fig. 7. This is the range within which the best fit will be derived. - Next, limiting of the curve is effected thereby limiting the extreme points of the histogram which are probably image artifacts such as those shown at
reference numeral 90 in Fig. 7 and 100 in Fig. 8. A comparison of the ordinates of these image artifacts at 90 and 100 and uncorrectable saturation elements at 88 and 102 of Figs. 7 and 8, respectively, will graphically illustrate this limiting function. In addition to the aforementioned limiting or pulling down of the extreme high points, the low points in a histogram in like manner will be pulled up as shown from a comparison of Figs. 7 and 8. There are several rationales for the foregoing limiting process. First, limiting at the high end is found necessary because by boosting contrast too high, this simply results in noise in the image. Also, it is desirable to ignore single points which are very high because this saturation is uncorrectable. Also, limiting at the low end is provided to ensure that the best fit curve remains positive. A typical limiting function reassigns the count at each level of the gray scale as follows. If the count is less than 0.5, then the count is assigned 0.25 + count/2. But if the count is greater than 2, then count = 1 + count/2, and if the count is still greater than 3, then count = 3. - The next step in the image processing is to effect the previously described best fit in the form A + Bx + Cx². This second order best fit is performed between the black 32 level and white 32 level shown at
references numerals curve 104. This curve fitting may be effected in a number of manners well known in the mathematical arts with the assistance of computer processing provided by the system depicted in Figs. 1 and 2. - Next in accordance with the invention a smooth gray scale graph is created, i.e. given the second order best
fit curve 104 of Fig. 9, and the overall range of black 200 at 95 to white 200 at 97, the best fit curve is "smoothed" by providing an overall best fit over the entire range by tapering the edges off as shown for example at 106 in Fig. 9. - In order to translate the curve of fig. 9 into a look-up table to conveniently apply the correction of that curve to each pixel of
image 5, first a "delta" array is created with elements at 0.5, 1.5, 2.5, ... 61.5 and 62.5. Betweenblock 32 plus 0.5 and white 3.2 minus 0.5, the value of the function f(x) = A + Bc + Cx² with A, B, C determined in the previous step, is evaluated and the results are placed in thisdelta array 108. Next this f(x) is eveluated at black 32 and assigned a value Y. If black 32 does not equal black 200, then the process will step by one between black 200 plus 0.5 and black 3.2 minus 0.5 and the delta array is then set equal to Y x (N - black 200) / (black 32 - black 200). - Continuing with this step of creating the delta array, if black 200 does not equal 0 then the delta array is zeroed between 0.5 and black 200 - 0.5. Next, the function f(x) is evaluated at white 32 and assigned a value Y. If white 32 is not equal to white 200, then between white 32 + 0.5 and white 200 - 0.5, the delta array is set to equal the value Y x (white 200 - N) / (white 200 - white 32). If white 200 is not 63 then the delta array is zeroed between white 200 plus 0.5 and 62.5.
- The previous two paragraphs are stated algorithmically. Their effect is to place in the
delta array 105 numbers corresponding tocurve 104 of Fig. 9, complete with tapered ends 106 and 107, and 0segments 105. - There are several rationales for this step of the process. The curve in Fig. 9 comprising
segments - As a final step in the processing method, a correction lookup table is generated based upon the overall best fit and utilised to correct the image. First a
convert array 109 in Fig. 10 is generated with elements from 0 to 63. The first element of the convert array is set = 0. Then, for N from 1 to 63, the method sets the convert array (N) = convert array (N - 1) + delta array (N - 0.5). Next, the process again scans for N = 0 to 63, and sets the convert array (N) = convert array (N) / convert array (63). This produces the normalised lookup convert array. Essentially, it integrates the delta array to give the biggest jump in gray scale at those levels of gray that had the highest concentration of pels. - Up to this point, the convert array has been normalised between 0.0 to 1.0. Next, in accordance with the image processing of the invention, the convert array is intergized. If colour values must be 6 bits each, each element of the convert array is translated using a function of the form truncate (convert array (N) x 63.99). Finally, the actual conversion from the original image to the corrected image that is the product of this invention is performed with this convert array. For each colour of each pel of the original image, the 6 bit value of the colour is utilised as a pointer into the convert array, and a new 6 bit value is received back to replace the old value. In this manner, pels corresponding to a corrected image are thereby created which may be utilised in any desired manner thereafter such as in the display of the corrected image on the
monitors transfer function 110 being shown in Fig. 11. This function typically has several areas associated with it including anarea 112 resulting in underexposed areas, alow contrast toe 114, a high contrast middle 116, alow contrast shoulder 118 and asaturation level 120. - It will be appreciated that this transfer function may be seen as the integral of the previously described histogram. In other words, integration of the f(x) yields a function of the form Z + Ax + Bx² + Cx³. These coefficients Z, A, B, and C map to a black level, white level, gamma, and saturation, respectively. In other words the coefficient C of the integration maps to the C of the histogram function inasmuch as the integral of Cx² = Cx³/3. Thus the foregoing should remove any confusion with respect to use of an X³ term for gamma correction in the prior art.
- In the foregoing, it will be appreciated that the
extreme points 90 of Fig. 6 of the histogram have been limited, however the invention is not intended to be limited in scope to such treatment of these points. As an example, these points may, rather than be limited, simply be decreased in weight as the best fit is performed which may yield an equivalent but slightly different result. In other words, an iterative best fit may also be desirable in some applications. A first pass best fit would accordingly be performed. Then based upon how far these extreme points are from the first pass curve fit, a second pass fit would be performed wherein they are simply weighted less as a function of their distance from the curve fit by the first pass. It will be seen from the foregoing by simply limiting the extreme points this is merely an expedient in taking these extreme points into account which may be refined by such weighting of these points. - A method and system has been described in which analog video data input is received by a video capture system and digitised. From the pels of the captured image, a gray scale level histogram is constructed with the system processor, and normalised to established white-black references similar to the contrast control function usually available at image capture time. Peaks likely to be attributable to image artifacts are limited. The image processor then performs a second order best fit regression of the histogram from which the image is thereafter corrected. An automatic correction of the image contrast is thereby effected, wherein capture artifacts are reduced while retaining those of the image. In an alternate embodiment described, instead of limiting peaks, an iterative best fit is performed, wherein the peaks are weighted in a subsequent best fit pass as a function of their distances from the curve fit from a prior best fit pass.
Claims (15)
- A method for automatic image enhancement of image data, comprising
generating a histogram from video data representing said image
generating a best fit regression function of said histogram; and
modifying said video data as a function of said regression function. - The method as claimed in Claim 1 wherein said best fit regression function is polynomial.
- The method as claimed in Claim 2 wherein said polynomial is a second order.
- The method as claimed in Claim 3 wherein said best fit is completed over a range less than the full gray scale range.
- The method as claimed in Claim 1 wherein said range is between limits selected to include a selected percentage of said histogram.
- The method as claimed in Claim 1 wherein said iterative best fit comprises
generating a plurality of second order best fit functions of said histogram; and
wherein, for each said function, peaks are weighted as a function of their distances from corresponding points on a previous one of said best fit functions. - The method as claimed in Claim 1 wherein prior to generation of said regression function, peaks of said histogram are weighted as a function of their deviation from the norm.
- The method as claimed in Claim 7 wherein said normalising adjusts contrasts of said image data to set white and black reference levels.
- The method as claimed in Claim 1 wherein said best fit is iterative.
- The method as claimed in Claim 9 wherein said iterative best fit comprises
generating a plurality of second order best fit functions of said histogram; and
wherein, for each said function, histogram values are weighted as a function of their distances from corresponding points on a previous one of said best fit functions. - The method as claimed in Claim 1 further including operating on a colour image in which said histogram is a weighted average of histograms of each colour record individually.
- The method as claimed in Claim 11 wherein the weight assigned to the colour blue is less than the weight assigned to the colours red or green.
- The method as claimed in Claim 4 wherein said area comprising a selective percentage of said histogram encompasses a range from black to white in said image.
- The method as claimed in Claim 13 wherein said best fit curve outside said area of said polynomial fit decreases from polynomial values at the edges of said area to zero at the ends of said histogram.
- A system for automatic image enhancement incorporating the method as claimed in any one of the preceding claims.
Applications Claiming Priority (2)
| Application Number | Priority Date | Filing Date | Title |
|---|---|---|---|
| US07/608,124 US5265200A (en) | 1990-11-01 | 1990-11-01 | System and method for automatic image saturation, gamma, and exposure correction in a digitizing video capture system |
| US608124 | 1990-11-01 |
Publications (2)
| Publication Number | Publication Date |
|---|---|
| EP0484102A2 true EP0484102A2 (en) | 1992-05-06 |
| EP0484102A3 EP0484102A3 (en) | 1993-12-01 |
Family
ID=24435143
Family Applications (1)
| Application Number | Title | Priority Date | Filing Date |
|---|---|---|---|
| EP19910309976 Withdrawn EP0484102A3 (en) | 1990-11-01 | 1991-10-29 | System and method for image enhancement |
Country Status (3)
| Country | Link |
|---|---|
| US (1) | US5265200A (en) |
| EP (1) | EP0484102A3 (en) |
| JP (1) | JPH04274573A (en) |
Cited By (5)
| Publication number | Priority date | Publication date | Assignee | Title |
|---|---|---|---|---|
| EP0568743A1 (en) * | 1992-05-08 | 1993-11-10 | International Business Machines Corporation | PAL video signal processing apparatus |
| WO1999000648A1 (en) * | 1997-06-27 | 1999-01-07 | Minnesota Mining And Manufacturing Company | Characterization of color imaging systems |
| CN1075917C (en) * | 1996-03-09 | 2001-12-05 | 三星电子株式会社 | Image enhancing method using mean-separate histogram equalization and circuit therefor |
| CN102496152A (en) * | 2011-12-01 | 2012-06-13 | 四川虹微技术有限公司 | Self-adaptive image contrast enhancement method based on histograms |
| AU2013205426B2 (en) * | 2007-08-24 | 2016-05-12 | Aristocrat Technologies Australia Pty Limited | Gaming apparatus and method including hidden objects |
Families Citing this family (35)
| Publication number | Priority date | Publication date | Assignee | Title |
|---|---|---|---|---|
| DE4129656C2 (en) * | 1991-09-06 | 1994-02-10 | Siemens Ag | Video signal display device on a monitor |
| DE69213380T2 (en) * | 1991-09-27 | 1997-03-20 | Agfa Gevaert Nv | Reproduction process for medical images that produces optimal image quality for diagnosis |
| US5544284A (en) * | 1992-02-11 | 1996-08-06 | Eastman Kodak Company | Sequential product code quantization of digital color image |
| CA2093448C (en) * | 1992-07-17 | 1999-03-09 | Albert D. Edgar | Expert system for image enhancement |
| JPH0668219A (en) * | 1992-08-17 | 1994-03-11 | Fuji Xerox Co Ltd | Color value processor |
| JP3490490B2 (en) * | 1994-01-28 | 2004-01-26 | 株式会社東芝 | Pattern image processing apparatus and image processing method |
| US5808669A (en) * | 1995-02-07 | 1998-09-15 | Adaptive Optics Associates, Inc. | Telecine with dual digitizers and multiple scanning beams |
| US6510240B1 (en) * | 1995-05-09 | 2003-01-21 | Texas Instruments Incorporated | Automatic detection of die absence on the wire bonding machine |
| US5812286A (en) * | 1995-08-30 | 1998-09-22 | Hewlett-Packard Company | Automatic color processing to correct hue shift and incorrect exposure |
| US5737032A (en) * | 1995-09-05 | 1998-04-07 | Videotek, Inc. | Serial digital video processing with concurrent adjustment in RGB and luminance/color difference |
| US5901243A (en) * | 1996-09-30 | 1999-05-04 | Hewlett-Packard Company | Dynamic exposure control in single-scan digital input devices |
| US6166782A (en) | 1997-01-29 | 2000-12-26 | Apple Computer, Inc. | Method and apparatus for reducing visibility of damping wires in aperture grill display tubes |
| US6181321B1 (en) * | 1997-04-23 | 2001-01-30 | Canon Kabushiki Kaisha | Combined color cast removal and contrast enhancement for digital color images |
| US5956436A (en) * | 1997-05-23 | 1999-09-21 | Umax Data Systems Inc. | Method for dynamically scanning an image |
| US6310983B1 (en) * | 1998-06-16 | 2001-10-30 | Xerox Corporation | Efficient search for a gray-level pattern in an image using ranges of sums |
| US6535648B1 (en) * | 1998-12-08 | 2003-03-18 | Intel Corporation | Mathematical model for gray scale and contrast enhancement of a digital image |
| EP1148810B1 (en) * | 1999-01-26 | 2005-11-16 | Newton Laboratories, Inc. | Autofluorescence imaging system for endoscopy |
| JP2001126075A (en) * | 1999-08-17 | 2001-05-11 | Fuji Photo Film Co Ltd | Image processing method and apparatus, and recording medium |
| US6628330B1 (en) | 1999-09-01 | 2003-09-30 | Neomagic Corp. | Color interpolator and horizontal/vertical edge enhancer using two line buffer and alternating even/odd filters for digital camera |
| US6642962B1 (en) | 1999-09-01 | 2003-11-04 | Neomagic Corp. | Merged pipeline for color interpolation and edge enhancement of digital images |
| JP2001243464A (en) * | 2000-02-29 | 2001-09-07 | Canon Inc | Image processing apparatus, image processing system, image processing method, and storage medium |
| US6681042B1 (en) | 2000-08-29 | 2004-01-20 | Eastman Kodak Company | Digital color image processing method |
| US6771311B1 (en) | 2000-12-11 | 2004-08-03 | Eastman Kodak Company | Automatic color saturation enhancement |
| US6771839B2 (en) | 2001-02-20 | 2004-08-03 | Sharp Laboratories Of America, Inc. | Efficient method of computing gamma correction tables |
| US6826310B2 (en) | 2001-07-06 | 2004-11-30 | Jasc Software, Inc. | Automatic contrast enhancement |
| GB0120489D0 (en) * | 2001-08-23 | 2001-10-17 | Eastman Kodak Co | Tone scale adjustment of digital images |
| US7085008B2 (en) * | 2002-03-20 | 2006-08-01 | Eastman Kodak Company | Digital color image processing method for improved tone scale reproduction |
| US7085007B2 (en) * | 2002-03-20 | 2006-08-01 | Eastman Kodak Company | Digital color image processing method |
| JP4359844B2 (en) * | 2004-11-24 | 2009-11-11 | ノーリツ鋼機株式会社 | Film base density detection method and apparatus |
| US7844100B2 (en) * | 2004-11-29 | 2010-11-30 | Applied Materials Israel, Ltd. | Method for filtering nuisance defects |
| TWI455106B (en) * | 2008-01-31 | 2014-10-01 | Innolux Corp | Color calibrating method, color calibrating circuit and display apparatus |
| US8311360B2 (en) * | 2008-11-13 | 2012-11-13 | Seiko Epson Corporation | Shadow remover |
| JP6540240B2 (en) * | 2015-06-03 | 2019-07-10 | 凸版印刷株式会社 | Color estimation system, plate making data creation system, color estimation method and plate making data creation method |
| US10469176B2 (en) * | 2017-07-07 | 2019-11-05 | Inphi Corporation | Histogram based optimization for optical modulation |
| US11265484B1 (en) | 2020-12-16 | 2022-03-01 | Waymo Llc | Systems and methods for automatic exposure of images |
Family Cites Families (23)
| Publication number | Priority date | Publication date | Assignee | Title |
|---|---|---|---|---|
| DE3408107C2 (en) * | 1983-03-06 | 1996-05-30 | Canon Kk | Halftone color image recorder |
| DE3408336A1 (en) * | 1983-03-08 | 1984-09-13 | Canon K.K., Tokio/Tokyo | IMAGE REPRODUCTION SYSTEM |
| JPS60139080A (en) * | 1983-12-27 | 1985-07-23 | Canon Inc | Picture forming device |
| US4866511A (en) * | 1984-04-09 | 1989-09-12 | Corporate Communications Consultants, Inc. | Color correction system with color level modification and corresponding method |
| US5083204A (en) * | 1984-10-01 | 1992-01-21 | Hughes Aircraft Company | Signal processor for an imaging sensor system |
| US4729016A (en) * | 1985-05-06 | 1988-03-01 | Eastman Kodak Company | Digital color image processing method and apparatus employing three color reproduction functions for adjusting both tone scale and color balance |
| US4903145A (en) * | 1986-08-06 | 1990-02-20 | Canon Kabushiki Kaisha | Image quality control apparatus capable of density-correcting plural areas of different types |
| JPS63167983A (en) * | 1986-12-29 | 1988-07-12 | Fuji Electric Co Ltd | Automatic lut setting system |
| JPS63210713A (en) * | 1987-02-27 | 1988-09-01 | Yokogawa Electric Corp | Formation of correction curve |
| JPH0677572B2 (en) * | 1987-04-20 | 1994-10-05 | 富士写真フイルム株式会社 | Medical image capturing posture determination method |
| US4903310A (en) * | 1987-04-20 | 1990-02-20 | Fuji Photo Film Co. Ltd. | Method of automatically determining imaged body posture in medical image display |
| US4996591A (en) * | 1987-05-15 | 1991-02-26 | Canon Kabushiki Kaisha | Method of and apparatus for processing color image |
| US4989079A (en) * | 1987-10-23 | 1991-01-29 | Ricoh Company, Ltd. | Color correction device and method having a hue area judgement unit |
| US4961117A (en) * | 1987-11-13 | 1990-10-02 | New Dest Corporation | Document scanner |
| JPH01157172A (en) * | 1987-12-14 | 1989-06-20 | Konica Corp | Color image processor |
| US4868651A (en) * | 1988-05-17 | 1989-09-19 | S&S Inficon, Inc. | Digital radiography with image brightness and contrast normalization |
| JPH02145085A (en) * | 1988-11-25 | 1990-06-04 | Fuji Xerox Co Ltd | Film picture reader |
| JPH0683373B2 (en) * | 1988-12-09 | 1994-10-19 | 大日本スクリーン製造株式会社 | How to set the reference concentration point |
| US5008739A (en) * | 1989-02-13 | 1991-04-16 | Eastman Kodak Company | Real-time digital processor for producing full resolution color signals from a multi-color image sensor |
| US4970598A (en) * | 1989-05-30 | 1990-11-13 | Eastman Kodak Company | Method for correcting shading effects in video images |
| US5060061A (en) * | 1989-06-30 | 1991-10-22 | Victor Company Of Japan, Ltd. | Method of reading an image recorded in a photographic film tone characteristic correcting method in reproducing an image recorded in a photographic film |
| US5081485A (en) * | 1989-07-14 | 1992-01-14 | Fuji Photo Film Co., Ltd. | Method for determining exposure amount in image copying apparatus |
| US5047861A (en) * | 1990-07-31 | 1991-09-10 | Eastman Kodak Company | Method and apparatus for pixel non-uniformity correction |
-
1990
- 1990-11-01 US US07/608,124 patent/US5265200A/en not_active Expired - Fee Related
-
1991
- 1991-08-30 JP JP3219981A patent/JPH04274573A/en active Pending
- 1991-10-29 EP EP19910309976 patent/EP0484102A3/en not_active Withdrawn
Cited By (7)
| Publication number | Priority date | Publication date | Assignee | Title |
|---|---|---|---|---|
| EP0568743A1 (en) * | 1992-05-08 | 1993-11-10 | International Business Machines Corporation | PAL video signal processing apparatus |
| CN1075917C (en) * | 1996-03-09 | 2001-12-05 | 三星电子株式会社 | Image enhancing method using mean-separate histogram equalization and circuit therefor |
| WO1999000648A1 (en) * | 1997-06-27 | 1999-01-07 | Minnesota Mining And Manufacturing Company | Characterization of color imaging systems |
| US6108442A (en) * | 1997-06-27 | 2000-08-22 | Minnesota Mining And Manufacturing Company | Characterization of color imaging systems |
| AU2013205426B2 (en) * | 2007-08-24 | 2016-05-12 | Aristocrat Technologies Australia Pty Limited | Gaming apparatus and method including hidden objects |
| CN102496152A (en) * | 2011-12-01 | 2012-06-13 | 四川虹微技术有限公司 | Self-adaptive image contrast enhancement method based on histograms |
| CN102496152B (en) * | 2011-12-01 | 2014-08-27 | 四川虹微技术有限公司 | Self-adaptive image contrast enhancement method based on histograms |
Also Published As
| Publication number | Publication date |
|---|---|
| US5265200A (en) | 1993-11-23 |
| JPH04274573A (en) | 1992-09-30 |
| EP0484102A3 (en) | 1993-12-01 |
Similar Documents
| Publication | Publication Date | Title |
|---|---|---|
| US5265200A (en) | System and method for automatic image saturation, gamma, and exposure correction in a digitizing video capture system | |
| US5978519A (en) | Automatic image cropping | |
| US10298857B2 (en) | Image processing method and apparatus, integrated circuitry and recording medium for applying gain to a pixel | |
| US7068853B2 (en) | Tone scale adjustment of digital images | |
| US8009195B2 (en) | Information processing apparatus, information processing system, image input apparatus, image input system and information exchange method for modifying a look-up table | |
| US7646931B2 (en) | Automatic analysis and adjustment of digital images with exposure problems | |
| DE60215097T2 (en) | A method and apparatus for the sound translation of numerical images using an adaptive sigmoidal function based on particular perceptual guidelines | |
| US6735330B1 (en) | Automatic digital radiographic bright light | |
| US20070247474A1 (en) | Method, apparatus and recording medium for image processing | |
| US7130462B2 (en) | Output and store processed image data | |
| US20050195291A1 (en) | Digital photography system and method of controlling photography | |
| US8885935B2 (en) | Image processing apparatus and image processing method | |
| US20060092474A1 (en) | System and method for image processing | |
| US7471847B2 (en) | Image processing method and apparatus for correcting image brightness distribution | |
| US5282063A (en) | Method and apparatus for automatic brightness and contrast control in an image capture system | |
| JP4208767B2 (en) | Image processing apparatus and image processing method | |
| JP2948974B2 (en) | Imaging system, electronic camera, computer system for controlling electronic camera, and control method thereof | |
| CN100492152C (en) | Method and device for converting high dynamic range image into low dynamic range image | |
| US20050047650A1 (en) | Image processing apparatus, method and program | |
| CN118918198B (en) | Photo preview method, electronic device and storage medium | |
| KR100520970B1 (en) | Method and apparatus for transforming a high dynamic range image into a low dynamic range image | |
| JPH0512432A (en) | Digital image display device | |
| Alsheimer et al. | Highest Quality Capture: Workflow Phase I | |
| GB2287373A (en) | Electronic video processing system |
Legal Events
| Date | Code | Title | Description |
|---|---|---|---|
| PUAI | Public reference made under article 153(3) epc to a published international application that has entered the european phase |
Free format text: ORIGINAL CODE: 0009012 |
|
| AK | Designated contracting states |
Kind code of ref document: A2 Designated state(s): DE FR GB |
|
| 17P | Request for examination filed |
Effective date: 19920917 |
|
| PUAL | Search report despatched |
Free format text: ORIGINAL CODE: 0009013 |
|
| AK | Designated contracting states |
Kind code of ref document: A3 Designated state(s): DE FR GB |
|
| 17Q | First examination report despatched |
Effective date: 19951211 |
|
| STAA | Information on the status of an ep patent application or granted ep patent |
Free format text: STATUS: THE APPLICATION IS DEEMED TO BE WITHDRAWN |
|
| 18D | Application deemed to be withdrawn |
Effective date: 19960423 |