EP0420135B1 - Appareil spectrophotométrique à correction des distorsions de la balayage rapide - Google Patents
Appareil spectrophotométrique à correction des distorsions de la balayage rapide Download PDFInfo
- Publication number
- EP0420135B1 EP0420135B1 EP90118365A EP90118365A EP0420135B1 EP 0420135 B1 EP0420135 B1 EP 0420135B1 EP 90118365 A EP90118365 A EP 90118365A EP 90118365 A EP90118365 A EP 90118365A EP 0420135 B1 EP0420135 B1 EP 0420135B1
- Authority
- EP
- European Patent Office
- Prior art keywords
- output signal
- photodetecting means
- incremental
- spectrum
- values
- Prior art date
- Legal status (The legal status is an assumption and is not a legal conclusion. Google has not performed a legal analysis and makes no representation as to the accuracy of the status listed.)
- Expired - Lifetime
Links
- 238000012937 correction Methods 0.000 title description 18
- 238000001228 spectrum Methods 0.000 claims description 30
- 238000012360 testing method Methods 0.000 claims description 18
- 230000004044 response Effects 0.000 claims description 9
- 230000001678 irradiating effect Effects 0.000 claims description 6
- 238000000034 method Methods 0.000 claims description 4
- 238000002329 infrared spectrum Methods 0.000 description 8
- 238000002310 reflectometry Methods 0.000 description 5
- 102000004169 proteins and genes Human genes 0.000 description 3
- 108090000623 proteins and genes Proteins 0.000 description 3
- XLYOFNOQVPJJNP-UHFFFAOYSA-N water Substances O XLYOFNOQVPJJNP-UHFFFAOYSA-N 0.000 description 3
- 238000012935 Averaging Methods 0.000 description 2
- 238000004590 computer program Methods 0.000 description 2
- 230000003287 optical effect Effects 0.000 description 2
- 239000000470 constituent Substances 0.000 description 1
- 238000005259 measurement Methods 0.000 description 1
- 238000012986 modification Methods 0.000 description 1
- 230000004048 modification Effects 0.000 description 1
Images

Classifications
-
- G—PHYSICS
- G01—MEASURING; TESTING
- G01J—MEASUREMENT OF INTENSITY, VELOCITY, SPECTRAL CONTENT, POLARISATION, PHASE OR PULSE CHARACTERISTICS OF INFRARED, VISIBLE OR ULTRAVIOLET LIGHT; COLORIMETRY; RADIATION PYROMETRY
- G01J3/00—Spectrometry; Spectrophotometry; Monochromators; Measuring colours
- G01J3/28—Investigating the spectrum
- G01J3/2889—Rapid scan spectrometers; Time resolved spectrometry
-
- G—PHYSICS
- G01—MEASURING; TESTING
- G01J—MEASUREMENT OF INTENSITY, VELOCITY, SPECTRAL CONTENT, POLARISATION, PHASE OR PULSE CHARACTERISTICS OF INFRARED, VISIBLE OR ULTRAVIOLET LIGHT; COLORIMETRY; RADIATION PYROMETRY
- G01J3/00—Spectrometry; Spectrophotometry; Monochromators; Measuring colours
- G01J3/28—Investigating the spectrum
- G01J2003/2866—Markers; Calibrating of scan
- G01J2003/2876—Correcting linearity of signal
-
- G—PHYSICS
- G01—MEASURING; TESTING
- G01J—MEASUREMENT OF INTENSITY, VELOCITY, SPECTRAL CONTENT, POLARISATION, PHASE OR PULSE CHARACTERISTICS OF INFRARED, VISIBLE OR ULTRAVIOLET LIGHT; COLORIMETRY; RADIATION PYROMETRY
- G01J3/00—Spectrometry; Spectrophotometry; Monochromators; Measuring colours
- G01J3/28—Investigating the spectrum
- G01J3/42—Absorption spectrometry; Double beam spectrometry; Flicker spectrometry; Reflection spectrometry
- G01J3/433—Modulation spectrometry; Derivative spectrometry
-
- G—PHYSICS
- G01—MEASURING; TESTING
- G01N—INVESTIGATING OR ANALYSING MATERIALS BY DETERMINING THEIR CHEMICAL OR PHYSICAL PROPERTIES
- G01N21/00—Investigating or analysing materials by the use of optical means, i.e. using sub-millimetre waves, infrared, visible or ultraviolet light
- G01N21/17—Systems in which incident light is modified in accordance with the properties of the material investigated
- G01N21/47—Scattering, i.e. diffuse reflection
- G01N21/4738—Diffuse reflection, e.g. also for testing fluids, fibrous materials
Definitions
- This invention relates to a spectrophotometric instrument of the type in which a narrow band of the spectrum is detected by a photodetector and this narrow band is rapidly scanned through the spectrum.
- One type of instrument to which the present invention relates employs an optical grating, which receives light through an entrance slit and disperses the received light into a spectrum directed toward an exit slit.
- the optical grating is oscillated to rapidly scan the light transmitted through the exit slit through the spectrum dispersed by the grating.
- Such an instrument is disclosed in U.S. Patent No. 4,285,596 to Isaac J. Landa.
- Another such instrument is disclosed in copending application published as US-A-4 969 739 invented by Philip A. McGee and assigned to the assignee of the present invention.
- the present invention is also applicable to the instruments which employ filters, which are tilted as they pass through a light beam to scan the transmitted light through a spectrum.
- the narrow bandwidth of light which is transmitted through the exit slit illuminates a sample to be analyzed.
- Light reflected from the sample is detected by photodetectors and the resulting photodetector signal is amplified and then converted to a sequence of digital values, each representing the energy reflected at an incremental point distributed along the spectrum being scanned as the grating oscillates.
- the digital values are applied to a computer, where they are received and are used to analyze the sample such as to determine the oil, protein, and water content of a grain sample.
- a limit on how fast a spectrum can be scanned over the photodetector is determined by the response time of the photodetectors and the amplifier connected to amplify the output signal from the photodetectors.
- the output signal of the amplifier will fail to reach its equilibrium value at each incremental point at which the output value is converted to a digital value.
- the digital values received by the computer will be distorted and will fail to accurately represent the reflected energy from the sample at each increment of the spectrum at which the output signal from the amplifier is converted to a digital value.
- the first derivative of the output signal from the amplifier is determined as the narrow wavelength band being received by the photodetector is scanned through the spectrum at a rapid rate faster than would normally be permitted by the response time of the photodetectors and amplifier.
- the first derivative is determined by subtracting from the output signal of the amplifier at each incremental point, the output signal of the amplifier at the preceding incremental point to determine a set of difference values representing the first derivative of the output signal at each incremental point.
- the difference values are determined by the digital computer and then each difference value is multiplied by a correction factor to determine a correction value for each incremental point on the spectrum for which a digital value representing reflectance is received.
- the correction values are then added to the digital values representing the amplifier output at each incremental point to provide a corrected set of values for each incremental point along the spectrum.
- the system corrects for the distortion of the output signal caused by the rapid scanning.
- the corrected set of values are then employed in a conventional analysis of the sample. With the system of the invention, an accurate analysis of the sample is obtained even though the spectrum is scanned at a rate which is faster than that normally permitted for the response time of the photodetectors and the amplifier.
- a standard sample is scanned by the instrument at a slow rate, that is sufficiently slow for the output signal of the amplifier each incremental point to reach the equilibrium value.
- the same sample is then scanned at a rapid rate, that is at the same rate that a test sample to be analyzed is to be scanned.
- the correction factor is then determined by least squares averaging from the data at several points distributed along the spectrum.
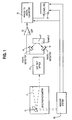
- FIG. 1 schematically illustrates an instrument of the type to which the present invention is applicable.
- the instrument comprises a near infrared spectrophotometer 11 having an oscillating diffraction grating 13.
- the spectrophotometer 11 directs light with a narrow wavelength band through exit slit optics 15 to a sample 17.
- the center wavelength of the light that irradiates the sample is swept through the near infrared spectrum.
- Light from the diffraction grating that is reflected by the sample 17 is detected by infrared photodetectors 19.
- Photodetectors 19 generate a signal that is transmitted to an analog-to-digital converter 22 by an amplifier 20.
- An indexing system 23 generates pulses as the grating 13 oscillates and applies these pulses to a computer 21 and to the analog-to-digital converter 22.
- the analog-to-digital converter converts successive samples of the output signal of the amplifier 20 to digital values, which are stored in the computer 21. Each digital value thus corresponds to the output of the amplifier 20 at a specific wavelength in the near infrared irradiating the sample.
- the computer 21 monitors the angular position of the grating 13, and accordingly, the wavelength irradiating the sample, as the grating oscillates, by counting the pulses produced by the indexing system 13.
- the pulses produced by the indexing system 13 define incremental index points, at which values of the output signal of the amplifier 20 are converted to digital values and stored in the computer 21.
- the index points are distributed incrementally throughout the near infrared spectrum, each index point corresponding to a different wavelength at which the sample is irradiated.
- the grating is oscillated at such a high rate that the output signal from the photodetectors 19, as well as from the amplifier 20 is distorted; that is these signals do not have time to reach their equilibrium values and accordingly, the output signal of the amplifier 20 does not correctly represent the reflected intensity from the sample 17.
- a standard sample is repeatedly scanned at a high rate, for example 20 times to acquire 20 sets of data from the standard sample, each set of data comprising a set of digital values with each digital value of the set corresponding to the output signal from the amplifier at each incremental index point in the spectrum for one scan through the spectrum.
- the program controlling the computer 22 in instruction sequence 31 acquires and stores the 20 sets of data from the standard sample as the standard sample is being scanned at a rapid rate.
- the program of the computer proceeds into instruction sequence 33 in which the data at each incremental index point in the 20 sets of data is averaged to get an average value for each incremental point.
- the standard sample receiving the light from the exit slit optics is then replaced by the test sample, that is the sample which is to be analyzed by the instrument.
- the grating 13 is then again oscillated at a high rate to scan the light irradiating the test sample through the near infrared spectrum. This scanning is repeated 20 times so that the computer acquires and stores 20 sets of data from the test sample.
- This step of the program in Fig. 2 is represented by instruction sequence 37. Following the acquisition of the data from the test sample, the computer enters instruction sequence 39, in which it averages the values obtained from each incremental point in the 20 sets of data from the test sample to obtain an average value of the output signal from the amplifier 20 at each incremental point distributed throughout the infrared spectrum for the test sample.
- the intensity of the reflected energy from the sample will vary up and down in a continuous curve as the grating scans the wavelength through the spectrum.
- the set of average values at each incremental point stored for the standard sample in instruction sequence 33 and stored for the test sample in instruction sequence 37 will represent incremental points along the continuous curves representing the average output signal of the amplifier 20 as the wavelength irradiating the sample is scanned through the near infrared spectrum.
- the program enters instruction sequence 41, in which the first derivative of the curve representing the variations in the signal from the amplifier 20 for the standard sample and the corresponding first derivative for the test sample are determined.
- the average value from the immediately preceding point is subtracted from the average value at the incremental point.
- the difference represents the derivative at the incremental point.
- the program enters instruction sequence 43, in which the difference values determined in instruction sequence 41 are each multiplied by a correction factor.
- the resulting product is added to the average value representing the average output value from the amplifier 20 determined at the corresponding incremental point in instruction sequence 44.
- the resulting sum at each incremental point will represent the intensity of the reflected energy at the incremental point corrected for the distortion caused by the rapid scanning through the near infrared spectrum.
- This step of multiplying the difference values representing the first derivative times the correction factor and adding the resulting product back to the original average value obtained from the incremental point is done both for the averaged set of data from the standard sample and the averaged set of data from the test sample so as to obtain a corrected set of intensity values for both the standard sample and the test sample.
- the ratio of the corrected data from the test sample to the corrected data from the standard sample is then determined at each incremental point in instruction sequence 45.
- the resulting set of ratios will represent the reflectivity of the test sample at each incremental point.
- the sample is analyzed in instruction sequence 47. For example, in a grain sample, the percentages of oil,protein, and water can be determined.
- the method of using the reflectivity data to determine the constituents of grain sample is disclosed in U.S. Patent No. 3,861,788.
- the program for computing the correction coefficient is shown in Fig. 3.
- data is acquired from the standard sample by scanning the sample several times, e.g. 20 times at a slow rate, to obtain 20 sets of values, each set representing the intensities of reflection at the incremental points distributed throughout the infrared spectrum.
- the values obtained in step 51 are then averaged for each incremental point in instruction sequence 53 to obtain an average intensity value at each incremental point.
- instruction sequence 55 data is acquired from the standard sample by scanning the standard sample at a high speed 20 times to obtain 20 sets of values, each set representing the output of the amplifier 20 at each of the incremental points as the light incident on the sample is scanned through the infrared spectrum.
- the data obtained in instruction sequence 55 is averaged at each incremental point in instruction sequence 57 to obtain a set of average values representing the average output of the amplifier 20 at each of the incremental points during the high speed scan.
- the program enters instruction sequence 59, in which the first derivative of the curve represented by the average values obtained in instruction sequence 57 is determined. This step is carried out by subtracting from each value the value at the preceding incremental point to obtain a difference value.
- the program enters instruction sequence 61, in which the program computes the difference between the average data values obtained in instruction sequence 53 from the average values at the same points in the data obtained in instruction sequence 57 at five selected incremental points.
- the average intensity values determined in instruction sequence 53 are assumed to represent the undistorted values of the reflected intensity at each incremental point.
- the correction factor to be used in the program of Fig. 2 is computed by least squares regression in instruction sequence 62.
- the formula for computing the correction factor is as follows: In the above formula, the correction factor is represented by K, the first derivative values at the five selected points are represented by X1 through X5, the difference values at each of the five selected points determined in instruction sequence 61 are represented by Y1 through Y5. When this correction coefficient has been computed, it is stored in the computer memory in instruction sequence 65.
- the instrument may repeatedly analyze samples at the high speed scanning rate, at which the output of the amplifier 20 would be considerably distorted and accurate values of reflectivity of the instrument at each of the incremental points on the spectrum will be obtained.
- the degree of distortion correction achieved by the invention can be appreciated by observing the reduction in the shift in the output signal peaks produced in response to reflected energy peaks from a calibration sample.
- a typical instrument is operated at about four times the rate at which accurate measurements can be made, a peak in the output signal will be shifted an apparent 0.75 nanometers from the wavelength at which the peak in reflected intensity occurs.
- the apparent waveshift is reduced to 0.09 namometers.
- the detected energy is described as being reflected from the sample to be analyzed.
- the energy may be transmitted through the sample.
- the system for carrying out the computation to correct the distortion is described as a digital system in the preferred embodiment.
- the correction can be carried out by analog circuitry components.
- analog circuits would determine the first derivative, multiply the first derivative times a correction factor and add the resulting product to the amplifier output as the wavelength is being scanned through the spectrum.
- the sample can be irradiated with constant wide band light and the light transmitted through or reflected from the sample applied to the spectrophotometer.
Landscapes
- Physics & Mathematics (AREA)
- Spectroscopy & Molecular Physics (AREA)
- General Physics & Mathematics (AREA)
- Investigating Or Analysing Materials By Optical Means (AREA)
- Spectrometry And Color Measurement (AREA)
Claims (4)
- Appareil spectrophotométrique comprenant des moyens spectroscopiques pour balayer les longueurs d'onde d'une bande étroite de longueurs d'onde de lumière dans tout un spectre prédéterminé à une vitesse rapide, des moyens photodétecteurs pour détecter l'intensité de l'énergie dans ladite bande dans tout ledit spectre et produire un signal de sortie variable en réponse à celle-ci, la vitesse de balayage par lesdits moyens spectroscopiques étant suffisamment grande par rapport au temps de réponse desdits moyens photodétecteurs pour qu'il y ait une distorsion sensible dans le signal de sortie desdits moyens photodétecteurs par rapport à l'intensité de l'énergie dans la bande étroite détectée de longueurs d'onde, des moyens formant calculateur pour 1o) déterminer une valeur d'amplitude variant avec l'amplitude du signal de sortie desdits moyens photodétecteurs à chaque point d'une multiplicité de points incrémentaux répartis dans tout ledit spectre, 2o) soustraire de la valeur déterminée à chaque point incrémental la valeur déterminée au point incrémental immédiatement précédent pour déterminer un ensemble de valeurs de différence, une pour chaque point incrémental, 3o) multiplier les valeurs de différence par une constante prédéterminée, et 4o) ajouter le produit résultant à chaque point incrémental à la valeur d'amplitude correspondante.
- Appareil spectrophotométrique selon la revendication 1, dans lequel l'intensité de l'énergie détectée par lesdits moyens photodétecteurs est réfléchie par un échantillon.
- Procédé d'utilisation d'un appareil spectrophotométrique du type à balayage qui balaie la longueur d'onde d'une bande étroite de longueurs d'onde de lumière détectée par des moyens photodétecteurs dans tout un spectre prédéterminé, dans lequel lesdits moyens photodétecteurs produisent un signal de sortie en réponse à l'intensité de l'énergie lumineuse détectée, comprenant les étapes consistant à balayer ladite longueur d'onde dans tout ledit spectre à une vitesse suffisamment grande pour que le signal de sortie desdits moyens photodétecteurs soit déformé par rapport à l'intensité de l'énergie lumineuse détectée par lesdits moyens photodétecteurs, déterminer une valeur d'amplitude variant avec l'amplitude du signal de sortie desdits moyens photodétecteurs à chaque point d'une multiplicité de points incrémentaux répartis dans tout ledit spectre, soustraire de la valeur d'amplitude déterminée à chaque point incrémental la valeur d'amplitude déterminée au point incrémental immédiatement précédent pour déterminer un ensemble de valeurs de différence, une pour chaque point incrémental, multiplier chacune desdites valeurs de différence par une constante sélectionnée pour corriger la distorsion, et ajouter le produit résultant déterminé pour chaque point incrémental à la valeur d'amplitude déterminée à ce point incrémental.
- Procédé d'analyse d'un échantillon d'essai, comprenant les étapes consistant à irradier ledit échantillon d'essai avec une bande étroite de longueurs d'onde de lumière, balayer rapidement la longueur d'onde de ladite bande étroite de longueurs d'onde dans tout un spectre prédéterminé, détecter l'intensité de l'énergie lumineuse réfléchie par ledit échantillon avec des moyens photodétecteurs et produire un signal de sortie en réponse à celle-ci, ladite étape de balayage étant effectuée à une vitesse suffisamment grande pour que le signal de sortie desdits moyens photodétecteurs soit sensiblement déformé par rapport à l'intensité de l'énergie lumineuse détectée par lesdits moyens photodétecteurs, déterminer un ensemble de valeurs d'amplitude variant avec l'amplitude du signal de sortie desdits moyens photodétecteurs, déterminer un premier ensemble de valeurs représentant la dérivée première de la fonction représentée par ledit ensemble de valeurs d'amplitude, multiplier ledit ensemble de valeurs représentant les dérivées premières par une constante sélectionnée pour corriger ladite distorsion, et ajouter les produits résultants aux valeurs d'amplitude correspondantes déterminée à chaque point incrémental.
Applications Claiming Priority (2)
| Application Number | Priority Date | Filing Date | Title |
|---|---|---|---|
| US07/413,063 US4997280A (en) | 1989-09-27 | 1989-09-27 | Spectrophotometric instrument with rapid scanning distortion correction |
| US413063 | 1989-09-27 |
Publications (2)
| Publication Number | Publication Date |
|---|---|
| EP0420135A1 EP0420135A1 (fr) | 1991-04-03 |
| EP0420135B1 true EP0420135B1 (fr) | 1994-04-06 |
Family
ID=23635673
Family Applications (1)
| Application Number | Title | Priority Date | Filing Date |
|---|---|---|---|
| EP90118365A Expired - Lifetime EP0420135B1 (fr) | 1989-09-27 | 1990-09-25 | Appareil spectrophotométrique à correction des distorsions de la balayage rapide |
Country Status (5)
| Country | Link |
|---|---|
| US (1) | US4997280A (fr) |
| EP (1) | EP0420135B1 (fr) |
| JP (1) | JP3098768B2 (fr) |
| CA (1) | CA2026327C (fr) |
| DE (1) | DE69007923T2 (fr) |
Families Citing this family (17)
| Publication number | Priority date | Publication date | Assignee | Title |
|---|---|---|---|---|
| US5243546A (en) * | 1991-01-10 | 1993-09-07 | Ashland Oil, Inc. | Spectroscopic instrument calibration |
| US5251006A (en) * | 1991-03-07 | 1993-10-05 | Nirsystems Incorporated | Automatic spectrophotometer calibration system |
| US5132538A (en) * | 1991-05-24 | 1992-07-21 | Nirsystems Incorporated | Measuring percentage of protein in whole grain samples |
| EP0535700B1 (fr) * | 1991-10-04 | 1997-03-26 | The Perkin-Elmer Corporation | Méthode appareil pour comparer des spectres |
| US6100526A (en) * | 1996-12-30 | 2000-08-08 | Dsquared Development, Inc. | Grain quality monitor |
| US6483583B1 (en) | 1997-02-27 | 2002-11-19 | Textron Systems Corporation | Near infrared spectrometry for real time analysis of substances |
| US5751421A (en) * | 1997-02-27 | 1998-05-12 | Pioneer Hi-Bred International, Inc. | Near infrared spectrometer used in combination with a combine for real time grain analysis |
| US5991025A (en) * | 1997-02-27 | 1999-11-23 | Pioneer Hi-Bred International, Inc. | Near infrared spectrometer used in combination with an agricultural implement for real time grain and forage analysis |
| US6836325B2 (en) | 1999-07-16 | 2004-12-28 | Textron Systems Corporation | Optical probes and methods for spectral analysis |
| US6424416B1 (en) | 1999-10-25 | 2002-07-23 | Textron Systems Corporation | Integrated optics probe for spectral analysis |
| US6845326B1 (en) | 1999-11-08 | 2005-01-18 | Ndsu Research Foundation | Optical sensor for analyzing a stream of an agricultural product to determine its constituents |
| US6418805B1 (en) | 1999-11-18 | 2002-07-16 | Textron Systems Corporation | Constituent sensing system |
| US6624888B2 (en) * | 2000-01-12 | 2003-09-23 | North Dakota State University | On-the-go sugar sensor for determining sugar content during harvesting |
| CA2402230C (fr) | 2000-03-10 | 2009-02-03 | Textron Systems Corporation | Sondes optiques et procedes d'analyse spectrale |
| US6921897B1 (en) | 2000-09-21 | 2005-07-26 | Lockheed Martin Corporation | Circuit and method for varying the integration time of moving charges from a photodetector |
| KR100896096B1 (ko) * | 2001-06-20 | 2009-05-06 | 다이니폰 인사츠 가부시키가이샤 | 전지용 포장재료 |
| AU2006200712B1 (en) * | 2006-02-21 | 2006-09-28 | Rosewood Research Pty Ltd | Spectographic sample monitoring |
Family Cites Families (5)
| Publication number | Priority date | Publication date | Assignee | Title |
|---|---|---|---|---|
| WO1981001464A1 (fr) * | 1979-11-19 | 1981-05-28 | Varian Techtron Pty Ltd | Procede et dispositif pour obtenir des derivees de signaux photometriques |
| US4627008A (en) * | 1984-04-25 | 1986-12-02 | Trebor Industries, Inc. | Optical quantitative analysis using curvilinear interpolation |
| US4804266A (en) * | 1985-07-26 | 1989-02-14 | Barspec Ltd. | Continuously rotating grating rapid-scan spectrophotometer |
| US4883963A (en) * | 1986-04-28 | 1989-11-28 | Bran+Luebbe Gmbh | Optical analysis method and apparatus having programmable rapid random wavelength access |
| JPH01155221A (ja) * | 1987-12-14 | 1989-06-19 | Shimadzu Corp | 分光光度計の波長走査方法 |
-
1989
- 1989-09-27 US US07/413,063 patent/US4997280A/en not_active Expired - Lifetime
-
1990
- 1990-09-25 EP EP90118365A patent/EP0420135B1/fr not_active Expired - Lifetime
- 1990-09-25 DE DE69007923T patent/DE69007923T2/de not_active Expired - Fee Related
- 1990-09-26 JP JP02258795A patent/JP3098768B2/ja not_active Expired - Fee Related
- 1990-09-27 CA CA002026327A patent/CA2026327C/fr not_active Expired - Fee Related
Also Published As
| Publication number | Publication date |
|---|---|
| CA2026327C (fr) | 2000-08-22 |
| EP0420135A1 (fr) | 1991-04-03 |
| JP3098768B2 (ja) | 2000-10-16 |
| CA2026327A1 (fr) | 1991-03-28 |
| DE69007923T2 (de) | 1994-11-10 |
| DE69007923D1 (de) | 1994-05-11 |
| US4997280A (en) | 1991-03-05 |
| JPH03183918A (ja) | 1991-08-09 |
Similar Documents
| Publication | Publication Date | Title |
|---|---|---|
| EP0420135B1 (fr) | Appareil spectrophotométrique à correction des distorsions de la balayage rapide | |
| US4866644A (en) | Optical instrument calibration system | |
| US5132538A (en) | Measuring percentage of protein in whole grain samples | |
| US4627008A (en) | Optical quantitative analysis using curvilinear interpolation | |
| US5489980A (en) | Apparatus for rapid and accurate analysis of the composition of samples | |
| CA2368940C (fr) | Filtre anti-rayonnement, spectrometre et imageur utilisant un reseau de micro-miroirs | |
| US5251006A (en) | Automatic spectrophotometer calibration system | |
| US7903252B2 (en) | Noise cancellation in fourier transform spectrophotometry | |
| US8213012B2 (en) | Stability for optical computing system | |
| US6424416B1 (en) | Integrated optics probe for spectral analysis | |
| EP0543160B1 (fr) | Analyseur d'un spectre optique | |
| EP0682242A1 (fr) | Procédé et appareil pour mesurer l'absorbance, la concentration de composants ou la gravité spécifique d'un échantillon liquide | |
| US4225233A (en) | Rapid scan spectrophotometer | |
| EP1679496A1 (fr) | Spectrophotometre | |
| KR100571825B1 (ko) | 가변형 스펙트럼의 분해능 향상을 위한 분광 성분 분석방법 및 그 장치 | |
| CA2067248C (fr) | Pyrometre a longueur d'ondes multiples | |
| GB2141536A (en) | Photodiode arrray spectrophotometric detector | |
| US4944589A (en) | Method of reducing the susceptibility to interference of a measuring instrument | |
| Stark et al. | NIR instrumentation technology | |
| EP0461862A1 (fr) | Colorimètre industriel à système de compensation de vieillissement pour la lampe | |
| JPH0414298B2 (fr) | ||
| GB2119086A (en) | Reduction of measuring errors in spectrophotometers | |
| JP2000097774A (ja) | 分光光度計 | |
| US4272197A (en) | Apparatus and method for measuring the ratio of two signals | |
| CA1184652A (fr) | Analyseur optique a monochromateur a reseau pour l'infrarouge proche |
Legal Events
| Date | Code | Title | Description |
|---|---|---|---|
| PUAI | Public reference made under article 153(3) epc to a published international application that has entered the european phase |
Free format text: ORIGINAL CODE: 0009012 |
|
| AK | Designated contracting states |
Kind code of ref document: A1 Designated state(s): DE DK FR GB IT |
|
| 17P | Request for examination filed |
Effective date: 19910927 |
|
| 17Q | First examination report despatched |
Effective date: 19921113 |
|
| GRAA | (expected) grant |
Free format text: ORIGINAL CODE: 0009210 |
|
| AK | Designated contracting states |
Kind code of ref document: B1 Designated state(s): DE DK FR GB IT |
|
| PG25 | Lapsed in a contracting state [announced via postgrant information from national office to epo] |
Ref country code: IT Free format text: LAPSE BECAUSE OF FAILURE TO SUBMIT A TRANSLATION OF THE DESCRIPTION OR TO PAY THE FEE WITHIN THE PRE;WARNING: LAPSES OF ITALIAN PATENTS WITH EFFECTIVE DATE BEFORE 2007 MAY HAVE OCCURRED AT ANY TIME BEFORE 2007. THE CORRECT EFFECTIVE DATE MAY BE DIFFERENT FROM THE ONE RECORDED.SCRIBED TIME-LIMIT Effective date: 19940406 Ref country code: DK Effective date: 19940406 |
|
| REF | Corresponds to: |
Ref document number: 69007923 Country of ref document: DE Date of ref document: 19940511 |
|
| ET | Fr: translation filed | ||
| PLBE | No opposition filed within time limit |
Free format text: ORIGINAL CODE: 0009261 |
|
| STAA | Information on the status of an ep patent application or granted ep patent |
Free format text: STATUS: NO OPPOSITION FILED WITHIN TIME LIMIT |
|
| 26N | No opposition filed | ||
| REG | Reference to a national code |
Ref country code: GB Ref legal event code: IF02 |
|
| PGFP | Annual fee paid to national office [announced via postgrant information from national office to epo] |
Ref country code: FR Payment date: 20040908 Year of fee payment: 15 |
|
| PGFP | Annual fee paid to national office [announced via postgrant information from national office to epo] |
Ref country code: GB Payment date: 20040922 Year of fee payment: 15 |
|
| PGFP | Annual fee paid to national office [announced via postgrant information from national office to epo] |
Ref country code: DE Payment date: 20040923 Year of fee payment: 15 |
|
| PG25 | Lapsed in a contracting state [announced via postgrant information from national office to epo] |
Ref country code: GB Free format text: LAPSE BECAUSE OF NON-PAYMENT OF DUE FEES Effective date: 20050925 |
|
| PG25 | Lapsed in a contracting state [announced via postgrant information from national office to epo] |
Ref country code: DE Free format text: LAPSE BECAUSE OF NON-PAYMENT OF DUE FEES Effective date: 20060401 |
|
| GBPC | Gb: european patent ceased through non-payment of renewal fee |
Effective date: 20050925 |
|
| PG25 | Lapsed in a contracting state [announced via postgrant information from national office to epo] |
Ref country code: FR Free format text: LAPSE BECAUSE OF NON-PAYMENT OF DUE FEES Effective date: 20060531 |
|
| REG | Reference to a national code |
Ref country code: FR Ref legal event code: ST Effective date: 20060531 |