EP0400919B1 - Hydroacoustic sonar equipment and method - Google Patents
Hydroacoustic sonar equipment and method Download PDFInfo
- Publication number
- EP0400919B1 EP0400919B1 EP90305727A EP90305727A EP0400919B1 EP 0400919 B1 EP0400919 B1 EP 0400919B1 EP 90305727 A EP90305727 A EP 90305727A EP 90305727 A EP90305727 A EP 90305727A EP 0400919 B1 EP0400919 B1 EP 0400919B1
- Authority
- EP
- European Patent Office
- Prior art keywords
- target
- fish
- khz
- targets
- equipment
- Prior art date
- Legal status (The legal status is an assumption and is not a legal conclusion. Google has not performed a legal analysis and makes no representation as to the accuracy of the status listed.)
- Expired - Lifetime
Links
Images


Classifications
-
- G—PHYSICS
- G01—MEASURING; TESTING
- G01S—RADIO DIRECTION-FINDING; RADIO NAVIGATION; DETERMINING DISTANCE OR VELOCITY BY USE OF RADIO WAVES; LOCATING OR PRESENCE-DETECTING BY USE OF THE REFLECTION OR RERADIATION OF RADIO WAVES; ANALOGOUS ARRANGEMENTS USING OTHER WAVES
- G01S7/00—Details of systems according to groups G01S13/00, G01S15/00, G01S17/00
- G01S7/52—Details of systems according to groups G01S13/00, G01S15/00, G01S17/00 of systems according to group G01S15/00
- G01S7/523—Details of pulse systems
- G01S7/526—Receivers
- G01S7/529—Gain of receiver varied automatically during pulse-recurrence period
Definitions
- This invention relates to hydroacoustic sonar equipment and to the detection and examination of underwater targets by the use of such equipment.
- the invention is especially applicable to the examination of fish populations in environmental studies, but is not necessarily limited to such applications.
- hydroacoustic sonar equipment which comprises a 420 kHz dual beam transducer, sounder with time varied gain amplifier, and have noted that substantial filtering of the received signal occurs prior to both the intermediate frequency and detector stages of the receiver. This filtering results in a rounding off of the received pulses, with loss of amplitude especially at lower pulse widths.
- the selectable bandwidth filter of the sounder has a bandwidth of only 10 kHz, which is inadequate for pulses of the order of 0.1 ms pulse width.
- a hydroacoustic sonar system comprising transmitter-receiver means for beaming an acoustic signal comprising a carrier in the radiofrequency band and which is pulse modulated towards a target and receiving a time varied gain corrected echo signal reflected from the target, and means for deriving from the received echo signal a corresponding electrical signal to be demodulated and recorded, characterised by means for demodulating said derived electrical signal comprising an input amplifier having a bandwidth of at least 500 kHz (and preferably at least 1.2 MHz), a full wave detector means having a bandwidth of at least 500 kHz (and preferably at least 1.2 MHz), the detector being coupled to the output of the amplifier, and an active low pass filter coupled to the output of the detector, the low pass filter having a cut off frequency of at least 50 kHz.
- the present invention therefore provides a hydroacoustic sonar system in which RF components of the received signals are retained up to the detector stage, thereby to retain the information provided by RF components and also to enable use of low pulse widths so as to obtain higher resolution.
- the conventional equipment is of the type comprising a Biosonics 420 kHz dual beam transducer (6 degree, 15 degree), a sounder (Biosonics 101) with time varied gain amplifier, a transducer rotator (Biosonics RC), a tape recorder interface (Biosonics 171), a digital audio tape recorder (Sony DTC 1000), a frequency modulation recorder (Racal Store 7), an oscilloscope (Philips PM 320), a plotter (Hewlett-Packard 7046A), a dual beam processor (Biosonics ESP 181), a PC computer (AT compatible 40 mB), and a printer (Epson FX).
- the system per se is well known in the art and need not be described in detail. For an understanding of the present invention it will be sufficient to consider the sounder and signal processing stages
- Figure 1 shows the dual beam transducer 10, coupled to a transceiver 11 and operable, during transmission, to direct a beam of sonar pulses of selected pulse width towards a target. Echo pulses are converted to incoming RF pulses by the transducer.
- the RF pulses are amplified by the preamplifier 12 and channelled via a 20 log R time varied gain receiver 13 (or 40 log R time varied gain receiver 13′) and a 20 log R bandpass filter 14 (or 40 log R bandpass filter 14′), according to the setting of a selector switch 15, to a selectable gain amplifier 16.
- the RF signal from the amplifier 16 is gated in known manner via a blanker 17 to a mixer 18, fed by a local oscillator 19, the resultant IF signal being filtered by a selectable bandwidth filter 20.
- the filtered output is applied to a full wave detector 21, the detected output pulse passing by a low pass filter 22 to data processing and recording equipment 23.
- the present invention provides a signal processing system which overcomes this disadvantage.
- the modified system according to the present invention is illustrated in Figure 2, wherein components which are common to the system of Figure 1 are denoted by the same reference numerals.
- the RF signal downstream of the blanker 17 is received by a wideband sonar detector module 24, which replaces the components 18, 19, 20, 21 and 22 of Figure 1.
- This module 24 consists essentially of a wideband input amplifier 25, a wideband full wave detector 26, and a low pass filter 27.
- the module 24 eliminates an intermediate stage and provides demodulation of the received pulses at a wide enough bandwidth to conserve valuable information which would otherwise be lost by elimination of the higher fourier components of the signal.
- the module 24 is illustrated in greater detail in Figure 3.
- the input amplifier 25 of the module 24 preferably has a bandwidth of at least 1.2 MHz, in which case it will accommodate sonar frequencies of 420 kHz and lower, but in any event must have a bandwidth of at least 500 kHz.
- the amplifier 25 has a typical gain of 20 dB.
- the output of the amplifier is applied to the input of the full wave detector 26, consisting of two integrated circuits 28, 29 connected in circuit as shown so as to incorporate a 50 kHz filter for the detected signal.
- the output of the detector 26 is applied to the filter 27, which is an active low pass filter having a cut off frequency of 50 kHz.
- Single targets included a ping pong ball, a steel ball, a styrofoam ball, air bubbles, a leaf and other shapes. Some shapes were similar in diameter (e.g. ping pong ball with and without water, styrofoam ball #5), while others were not (e.g. air bubble wand, leaf).
- the intent here was to determine whether the equipment could show differences, at least qualitatively, in the reflected signals of various targets.
- Data collected on sturgeon Acipenser fluvescens
- walleye Stizostedion vitreum
- Both single and multiple target experiments involved transmitted pulse widths of 0.5 ms and 0.1 ms which theoretically corresponded to spatial resolutions of targets at 37.5 and 7.5 cm., respectively.
- comparisons were made of the reflected signals between the two methods expressed as both time domain plots and power spectra (fast fourier transformation of FFT's).
- Taped time domain signals for both transmitted pulse widths were plotted off either Racal or DAT recorders using a HP 7460A plotter. The plot for each target was based on only one signal, and was assumed to be representable of signal, during the experimental period.
- mean pulse width at -6 dB level
- Peak amplitude levels were also estimated (at 0 dB level) using the ESP.
- Typical power spectra were constructed from the recorded signals using a Nicolet 660B analyzer.
- the dual beam transducer 10 was used to estimate target strength since it could correct for the target being off-axis.
- ESP dual beam processing
- the echoes were received on both the 6 and 15 degree elements.
- the signals were amplified using a time varied gain amplifier and analyzed.
- Target strengths were estimated for most shapes approximately 3.1 m from the transducer which was expected to be in a "free-field" measurement zone.
- Target strengths of sturgeon, walleye and other species were also estimated for both individuals and groups. Comparisons were made of the estimated target strengths of the ping pong balls using both the existing and modified sounder with a 0.5 ms transmitted pulse.
- FIG. 5-27 consists of four diagrams showing comparative results obtained using the two equipments, and wherein:
- Figures 5a-5d show the results obtained from experiments involving four sets of three ping pong balls, the sets being spaced approximately 10-15 cm apart at various distances from the transducers.
- the experiments were conducted at transmitted pulse widths of 0.1 ms and 0.5 ms, which theoretically correspond to spatial resolutions of approximately 7.5 cm. and 37.5 cm. respectively.
- Figures 6-10 show comparative results obtained using the two equipments, operating at the two transmitted pulse widths 0.5 ms and 0.1 ms as previously discussed.
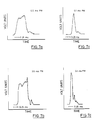
- the curves shown in the diagrams are time domain plots of selected single targets, namely, a ping pong ball (Figure 6), a ping pong ball filled with water (Figure 7), a styrofoam ball (Figure 8), a leaf ( Figure 9) and air bubbles ( Figure 10).
- the plots are obtained for both equipments at 0.5 ms pulse width are better defined than those obtained at 0.1 ms pulse width.
- the signals obtained using the equipment of the present invention differ from those obtained using the known equipment.
- the rise times are considerably sharper for all targets than those obtained using the known equipment.
- the signals obtained using the new equipment are better defined - see particularly Figures 7-10.
- Figures 11-27 relates to a specific target, which is identified in Table 2.
- Table 2 The comparative results illustrated in Figures 11-27 clearly show the better definition of targets using the new equipment at 0.5 ms pulse width ( Figures 11b-27b) and at 0.1 ms. ( Figures 11d-27d) as compared with the known equipment ( Figures 11a-27a and Figures 11c-27c).
- the better definition can be attributed to the fact that high fourier components of the received pulses are largely conserved with the new equipment, which offers the possibility of identifying targets so that it may be used to speciate fish and to distinguish fish from debris.
- Figure 28 shows power spectrum plots, using the known equipment, for sturgeon 80 cm. long oriented in three different aspects.
- Figure 29 shows the plots obtained with the same targets using the equipment of the present invention. It will be noted that the new equipment can more readily differentiate between the fish orientations.
- Figure 30 shows power spectrum plots, using the new equipment, for various sizes of sturgeon, 42 cm., 50 cm., cm., 70 cm., and 80 cm.
- Figure 31 shows for comparison two power spectrum plots, using both the known equipment and the new equipment, where the target is a steel ball. It is evident that the new equipment preserves more information provided by the received signals.
- Figure 32 shows the comparative power spectrum plots for the two equipments where the target is a bark chip.
- Figure 33 similarly shows the comparative plots where the target is a leaf.
- Figure 34 similarly shows the comparative plots where the target is a ping pong ball.
- Figure 35 similarly shows the comparative plots where the target is a ping pong ball filled with water.
- Figure 36 similarly shows the comparative plots where the target is a styrofoam ball.
- Figure 37 shows the comparative plots where air bubbles are the target.
Abstract
Description
- This invention relates to hydroacoustic sonar equipment and to the detection and examination of underwater targets by the use of such equipment. The invention is especially applicable to the examination of fish populations in environmental studies, but is not necessarily limited to such applications.
- To comply with regulatory agencies' requirements, biological studies must be conducted in the vicinity of hydroelectric, nuclear and thermal power stations. Most studies are directed towards fish, with netting being used as the principal method of determining fish composition and abundance in each area under examination. While netting methods cannot be dispensed with entirely, they are labour-intensive and inevitably involve destruction of fish. Hydroacoustics may offer an alternative method for the examination of fish population and distribution which is cost-effective and non-destructive.
- Considerable advances have been made in the use of hydroacoustics for fish management. Advances have been made in the areas of developing real time data collection and analysis systems. Another significant contribution has been the development of the dual beam and split beam systems which allow for off-axis correction of target strengths. These latter systems are currently being used for both sizing fish and estimating fish populations in situ. Presently there are concerns whether these systems can be used for estimating fish populations when fish schools are dense. Other concerns exist regarding the possibility of errors associated with estimating target strengths and sizing fish when fish are in different orientations (e.g. lateral versus dorsal aspect, and tilt angle). Furthermore, it is questionable whether commercial sonar systems have the ability to speciate fish and/or distinguish fish from debris based solely on target strengths. The need to speciate fish is critical if hydroacoustics is ever to be used truly remotely.
- The present applicants have made a critical study of existing hydroacoustic sonar equipment, which comprises a 420 kHz dual beam transducer, sounder with time varied gain amplifier, and have noted that substantial filtering of the received signal occurs prior to both the intermediate frequency and detector stages of the receiver. This filtering results in a rounding off of the received pulses, with loss of amplitude especially at lower pulse widths. In addition, the selectable bandwidth filter of the sounder has a bandwidth of only 10 kHz, which is inadequate for pulses of the order of 0.1 ms pulse width.
- It was concluded that the shortcomings of the existing equipment resulted from the loss of valuable information because of the nature of the filtering.
- In accordance with the present invention there is provided a hydroacoustic sonar system comprising transmitter-receiver means for beaming an acoustic signal comprising a carrier in the radiofrequency band and which is pulse modulated towards a target and receiving a time varied gain corrected echo signal reflected from the target, and means for deriving from the received echo signal a corresponding electrical signal to be demodulated and recorded, characterised by means for demodulating said derived electrical signal comprising an input amplifier having a bandwidth of at least 500 kHz (and preferably at least 1.2 MHz), a full wave detector means having a bandwidth of at least 500 kHz (and preferably at least 1.2 MHz), the detector being coupled to the output of the amplifier, and an active low pass filter coupled to the output of the detector, the low pass filter having a cut off frequency of at least 50 kHz.
- The present invention therefore provides a hydroacoustic sonar system in which RF components of the received signals are retained up to the detector stage, thereby to retain the information provided by RF components and also to enable use of low pulse widths so as to obtain higher resolution.
- A specific embodiment of hydroacoustic sonar detection equipment in accordance with the invention and its use to detect and identify fish and other underwater targets will now be described, by way of example, with reference to the accompanying drawings, in which:
- Figure 1 is a simplified schematic of a conventional hydroacoustic sonar system used to collect information on fish populations;
- Figure 2 is a simplified schematic of a modified hydroacoustic sonar detection equipment incorporating a wideband sonar detection module according to the invention;
- Figure 3 is a wiring diagram of the wideband sonar detection module represented in Figure 2;
- Figure 4 is a schematic top plan view of an experimental test facility used in comparing the performance of the modified system shown in Figure 2 with that of the conventional system shown in Figure 1;
- Figures 5a-5d respectively illustrate typical sonar displays of the conventional and the modified systems using two different pulse widths;
- Figures 6a-27a illustrate backscattering curves obtained for various targets using the conventional hydroacoustic sonar system with a pulse width of 5 ms;
- Figures 6b-27b illustrate backscattering curves obtained for the same targets using the modified system with a pulse width of 0.5 ms;
- Figures 6c-27c illustrate backscattering curves obtained for the same targets using the conventional system with a pulse width of 0.1 ms;
- Figures 6d-27d illustrate backscattering curves obtained for the same targets using the modified hydroacoustic system with a
pulse width 1 ms; and - Figures 28-37 illustrate typical power spectra of the various targets using both the conventional and the modified hydroacoustic systems.
- In the following description, the performance of a hydroacoustic sonar equipment in accordance with the present invention will be compared with that of a conventional hydroacoustic sonar equipment. The conventional equipment is of the type comprising a Biosonics 420 kHz dual beam transducer (6 degree, 15 degree), a sounder (Biosonics 101) with time varied gain amplifier, a transducer rotator (Biosonics RC), a tape recorder interface (Biosonics 171), a digital audio tape recorder (Sony DTC 1000), a frequency modulation recorder (Racal Store 7), an oscilloscope (Philips PM 320), a plotter (Hewlett-Packard 7046A), a dual beam processor (Biosonics ESP 181), a PC computer (AT compatible 40 mB), and a printer (Epson FX). The system per se is well known in the art and need not be described in detail. For an understanding of the present invention it will be sufficient to consider the sounder and signal processing stages of the system.
- Thus, Figure 1 shows the
dual beam transducer 10, coupled to a transceiver 11 and operable, during transmission, to direct a beam of sonar pulses of selected pulse width towards a target. Echo pulses are converted to incoming RF pulses by the transducer. The RF pulses are amplified by thepreamplifier 12 and channelled via a 20 log R time varied gain receiver 13 (or 40 log R timevaried gain receiver 13′) and a 20 log R bandpass filter 14 (or 40 logR bandpass filter 14′), according to the setting of aselector switch 15, to aselectable gain amplifier 16. The RF signal from theamplifier 16 is gated in known manner via ablanker 17 to amixer 18, fed by a local oscillator 19, the resultant IF signal being filtered by aselectable bandwidth filter 20. The filtered output is applied to afull wave detector 21, the detected output pulse passing by alow pass filter 22 to data processing andrecording equipment 23. - As previously mentioned, with this system much useful information is lost due to filtering out of RF components prior to the detector stage. The present invention provides a signal processing system which overcomes this disadvantage. The modified system according to the present invention is illustrated in Figure 2, wherein components which are common to the system of Figure 1 are denoted by the same reference numerals.
- Referring to Figure 2, the RF signal downstream of the
blanker 17 is received by a widebandsonar detector module 24, which replaces thecomponents module 24 consists essentially of awideband input amplifier 25, a widebandfull wave detector 26, and alow pass filter 27. Themodule 24 eliminates an intermediate stage and provides demodulation of the received pulses at a wide enough bandwidth to conserve valuable information which would otherwise be lost by elimination of the higher fourier components of the signal. Themodule 24 is illustrated in greater detail in Figure 3. - Referring to Figure 3, the
input amplifier 25 of themodule 24 preferably has a bandwidth of at least 1.2 MHz, in which case it will accommodate sonar frequencies of 420 kHz and lower, but in any event must have a bandwidth of at least 500 kHz. Theamplifier 25 has a typical gain of 20 dB. The output of the amplifier is applied to the input of thefull wave detector 26, consisting of two integrated circuits 28, 29 connected in circuit as shown so as to incorporate a 50 kHz filter for the detected signal. The output of thedetector 26 is applied to thefilter 27, which is an active low pass filter having a cut off frequency of 50 kHz. - In order to compare the performance of the modified equipment with the conventional equipment, experiments were conducted in the tank shown in Figure 4. The tank measured approximately 15 m wide, 15 m long, and 1.5 m deep. The
tank 30 was made semi-anechoic by constructing aperimeter wall 31 of 25 cm. concrete blocks approximately 1 metre inside the tank. Thedual beam transducer 10 of each equipment was placed at one end of the tank, and information on targets was obtained generally within 3-9 metres from the transducer. In experiments involving fish a net was used to maintain the fish within the acoustic beam. Anunderwater camera 32 and anoverhead camera 33 were used to obtain visual records of the positions of the targets. - Experiments focussed on the capabilities of the conventional equipment (Figure 1) and the modified equipment (Figure 2) to provide information allowing recognition of various geometric shapes and different fish species. The various targets used in the experiments are listed in Table 1.


- Experiments involved both single and multiple targets. Single targets included a ping pong ball, a steel ball, a styrofoam ball, air bubbles, a leaf and other shapes. Some shapes were similar in diameter (e.g. ping pong ball with and without water, styrofoam ball #5), while others were not (e.g. air bubble wand, leaf). The intent here was to determine whether the equipment could show differences, at least qualitatively, in the reflected signals of various targets. Data collected on sturgeon (Acipenser fluvescens) and walleye (Stizostedion vitreum) were recorded from individual tranquilized (MS222) fish suspended approximately 6 m from the transducer using monofilament. The monofilament line did not appear to be detected using the 420 kHz transducer. The reflected signals of fish positioned both laterally, frontally and at 45 degrees to the transducer were recorded.
- Multiple target experiments were conducted using only ping pong balls and live fish. Three balls each approximately 10-15 cm. apart, were placed 3, 5, 8 and 9 m from the transducer (i.e. a total of 12 targets). In the sturgeon and walleye tests, 15 to 20 different sized fish were released in the tank and were allowed to swim randomly throughout the caged area.
- Both single and multiple target experiments involved transmitted pulse widths of 0.5 ms and 0.1 ms which theoretically corresponded to spatial resolutions of targets at 37.5 and 7.5 cm., respectively. In these preliminary experiments, comparisons were made of the reflected signals between the two methods expressed as both time domain plots and power spectra (fast fourier transformation of FFT's). Taped time domain signals for both transmitted pulse widths (using the 6 degree transducer) were plotted off either Racal or DAT recorders using a HP 7460A plotter. The plot for each target was based on only one signal, and was assumed to be representable of signal, during the experimental period. For each recorded target, mean pulse width (at -6 dB level) was estimated based on 150 or more signals using the ESP. Peak amplitude levels were also estimated (at 0 dB level) using the ESP. Typical power spectra were constructed from the recorded signals using a Nicolet 660B analyzer.
- In addition to time domain and power frequency statistics, information was obtained on the reflecting power of each target (geometric shape or fish) or the target's backscattering cross section. The
dual beam transducer 10 was used to estimate target strength since it could correct for the target being off-axis. For dual beam processing (ESP), the echoes were received on both the 6 and 15 degree elements. The signals were amplified using a time varied gain amplifier and analyzed. Target strengths were estimated for most shapes approximately 3.1 m from the transducer which was expected to be in a "free-field" measurement zone. Target strengths of sturgeon, walleye and other species were also estimated for both individuals and groups. Comparisons were made of the estimated target strengths of the ping pong balls using both the existing and modified sounder with a 0.5 ms transmitted pulse. - The results of the experiments will now be discussed with reference to Figures 5-37. Each of Figures 5-27 consists of four diagrams showing comparative results obtained using the two equipments, and wherein:
- Figures 5a-27a show results obtained with the known equipment using transmitted pulses at 0.5 ms pulse width;
- Figures 5b-27b show results obtained with the new equipment using transmitted pulses at 0.5 ms pulse width;
- Figures 5c-27c show results obtained with the known equipment using transmitted pulses at 0.1 ms pulse width; and
- Figures 5d-27d show results obtained with the new equipment using transmitted pulses at 0.1 ms pulse width.
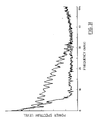
- Figures 5a-5d show the results obtained from experiments involving four sets of three ping pong balls, the sets being spaced approximately 10-15 cm apart at various distances from the transducers. The experiments were conducted at transmitted pulse widths of 0.1 ms and 0.5 ms, which theoretically correspond to spatial resolutions of approximately 7.5 cm. and 37.5 cm. respectively.
- By comparing Figures 5a and 5c with Figures 5b and 5d one can readily see that the new equipment of the 25 present invention gives much better resolution of targets, more particularly at the lower pulse width of 0.1 ms. This can be attributed to the fact that the wideband system of the present invention can recognize the higher fourier components of the received pulses.
- Figures 6-10 show comparative results obtained using the two equipments, operating at the two transmitted pulse widths 0.5 ms and 0.1 ms as previously discussed. The curves shown in the diagrams are time domain plots of selected single targets, namely, a ping pong ball (Figure 6), a ping pong ball filled with water (Figure 7), a styrofoam ball (Figure 8), a leaf (Figure 9) and air bubbles (Figure 10). As would be expected, the plots are obtained for both equipments at 0.5 ms pulse width are better defined than those obtained at 0.1 ms pulse width. More significantly, however, the signals obtained using the equipment of the present invention differ from those obtained using the known equipment. In particular, the rise times are considerably sharper for all targets than those obtained using the known equipment. Furthermore, the signals obtained using the new equipment are better defined - see particularly Figures 7-10.
- In the same way, the performances of the two equipments were compared using other targets, including sturgeon oriented in three different aspects. Figures 11-27, each consisting of four diagrams, show the respective time domain plots for comparison.
- Each of Figures 11-27 relates to a specific target, which is identified in Table 2.

The comparative results illustrated in Figures 11-27 clearly show the better definition of targets using the new equipment at 0.5 ms pulse width (Figures 11b-27b) and at 0.1 ms. (Figures 11d-27d) as compared with the known equipment (Figures 11a-27a and Figures 11c-27c). The better definition can be attributed to the fact that high fourier components of the received pulses are largely conserved with the new equipment, which offers the possibility of identifying targets so that it may be used to speciate fish and to distinguish fish from debris. - Typical power spectrum plots for a variety of targets, using both the new and the known equipments are illustrated in Figures 28-37.
- Figure 28 shows power spectrum plots, using the known equipment, for sturgeon 80 cm. long oriented in three different aspects. Figure 29 shows the plots obtained with the same targets using the equipment of the present invention. It will be noted that the new equipment can more readily differentiate between the fish orientations.
- Figure 30 shows power spectrum plots, using the new equipment, for various sizes of sturgeon, 42 cm., 50 cm., cm., 70 cm., and 80 cm.
- Figure 31 shows for comparison two power spectrum plots, using both the known equipment and the new equipment, where the target is a steel ball. It is evident that the new equipment preserves more information provided by the received signals.
- Figure 32 shows the comparative power spectrum plots for the two equipments where the target is a bark chip.
- Figure 33 similarly shows the comparative plots where the target is a leaf.
- Figure 34 similarly shows the comparative plots where the target is a ping pong ball.
- Figure 35 similarly shows the comparative plots where the target is a ping pong ball filled with water.
- Figure 36 similarly shows the comparative plots where the target is a styrofoam ball.
- Figure 37 shows the comparative plots where air bubbles are the target.
- An inspection of the various backscattering curves shown in the drawings reveals important differences between the known sonar system and the modified system according to the present invention. In the known system considerable filtering occurs in both the intermediate frequency and detected outputs. This filtering does not appear to affect target strength estimates, at least when the transmitted pulses are of 0.5 ms pulse width, but does result in loss of valuable information in the received signals. For this reason the known sonar system probably cannot provide sufficient data either to classify fish or to distinguish fish from debris on the basis of the reflected signal alone. The modified system of the present invention, on the other hand, which uses the radio frequency output of the sounder, gives more detailed information in the backscattering curves of individual targets. The comparative results suggest qualitative differences among some of the targets; the differences are more particularly evident in the power spectrum plots, Figures 28-37. For example, from a comparison of the power spectrum plots for sturgeon (Figure 29) and for air bubbles (Figure 37), it appears that it may be possible to filter out or remove the influence of reflected signals from air bubbles in echo returns and so identify echo counts as actual fish counts.
- Other important advantages of the modified system are the improved spatial resolution of targets, and the ability to estimate target strengths at lower pulse widths. These advantages are significant if biomass estimates are based on echo counting techniques rather than echo integration techniques.
Claims (2)
- A hydroacoustic sonar system comprising transmitter-receiver means (11) for beaming an acoustic signal comprising a carrier in the ratio frequency band and which is pulse modulated towards a target and receiving a time varied gain corrected echo signal reflected from the target, and means for deriving from the received echo signal a corresponding electrical signal to be demodulated and recorded, characterised by means for demodulating said derived electrical signal comprising an input amplifier (25) having a bandwidth of at least 500 kHz, a full wave detector means (26) having a bandwidth of at least 500 kHz, the detector being coupled to the output of the amplifier (25), and an active low pass filter coupled to the output of the detector, the low pass filter (27) having a cut off frequency of at least 50 kHz.
- A hydroacoustic sonar system according to claim 1, wherein the input amplifier (25) and the full wave detector means (26) each have a bandwidth of at least 1.2 MHz.
Applications Claiming Priority (2)
| Application Number | Priority Date | Filing Date | Title |
|---|---|---|---|
| US07/360,200 US4949318A (en) | 1989-06-01 | 1989-06-01 | Hydroacoustic sonar equipment |
| US360200 | 1994-12-21 |
Publications (3)
| Publication Number | Publication Date |
|---|---|
| EP0400919A2 EP0400919A2 (en) | 1990-12-05 |
| EP0400919A3 EP0400919A3 (en) | 1992-02-12 |
| EP0400919B1 true EP0400919B1 (en) | 1995-08-23 |
Family
ID=23416997
Family Applications (1)
| Application Number | Title | Priority Date | Filing Date |
|---|---|---|---|
| EP90305727A Expired - Lifetime EP0400919B1 (en) | 1989-06-01 | 1990-05-25 | Hydroacoustic sonar equipment and method |
Country Status (13)
| Country | Link |
|---|---|
| US (1) | US4949318A (en) |
| EP (1) | EP0400919B1 (en) |
| JP (1) | JP2505911B2 (en) |
| AT (1) | ATE126896T1 (en) |
| AU (1) | AU617281B2 (en) |
| CA (1) | CA1292305C (en) |
| DE (1) | DE69021777T2 (en) |
| DK (1) | DK0400919T3 (en) |
| ES (1) | ES2076316T3 (en) |
| FI (1) | FI902509A0 (en) |
| GR (1) | GR3017938T3 (en) |
| NO (1) | NO902397L (en) |
| NZ (1) | NZ233872A (en) |
Families Citing this family (10)
| Publication number | Priority date | Publication date | Assignee | Title |
|---|---|---|---|---|
| TW218046B (en) * | 1991-04-16 | 1993-12-21 | Midoriboshisya Kk | |
| US5260912A (en) * | 1991-05-17 | 1993-11-09 | Computrol, Inc. | Side-looking fish finder |
| US6325020B1 (en) * | 1999-10-28 | 2001-12-04 | Guigne International, Ltd. | Fish sizing sonar system |
| US7688675B2 (en) * | 2006-03-24 | 2010-03-30 | University Of Mississippi | Underwater biomass assessment device and method |
| CN101813771B (en) * | 2009-12-08 | 2013-04-24 | 中国科学院声学研究所 | Dolphin biomimetic sonar signal processing method |
| EP2771710B1 (en) * | 2011-10-26 | 2018-10-17 | Flir Systems, Inc. | Wideband sonar receiver and sonar signal processing algorithms |
| US10444354B2 (en) | 2011-10-26 | 2019-10-15 | Flir Systems, Inc. | Sonar data enhancement systems and methods |
| WO2013063515A2 (en) | 2011-10-26 | 2013-05-02 | Flir Systems, Inc. | Wideband sonar with pulse compression |
| CN106886015B (en) * | 2017-02-23 | 2018-02-09 | 山东科技大学 | A kind of detection means and detection method of multibeam sonar primary acoustic index |
| CN113433552A (en) * | 2021-08-25 | 2021-09-24 | 宁波博海深衡科技有限公司武汉分公司 | Multi-channel signal transmitting and receiving electronic system |
Family Cites Families (10)
| Publication number | Priority date | Publication date | Assignee | Title |
|---|---|---|---|---|
| US3952280A (en) * | 1974-01-10 | 1976-04-20 | Esl Incorporated | Radiation monitoring of an object space with a clutter suppression technique |
| JPS5132667A (en) * | 1974-09-13 | 1976-03-19 | Masaki Yoshimura | CHOONPAIDOBUTSUTAIKENSHUTSUKI |
| US4081783A (en) * | 1975-09-26 | 1978-03-28 | Keisuke Honda | Fish finder capable of discriminating sizes of fish |
| US4016750B1 (en) * | 1975-11-06 | 1994-04-05 | Stanford Research Inst | Ultrasonic imaging method and apparatus |
| US4069468A (en) * | 1976-09-24 | 1978-01-17 | Raytheon Company | Doppler spectral measurement |
| US4119941A (en) * | 1977-08-08 | 1978-10-10 | The United States Of America As Represented By The Secretary Of The Navy | Acoustic coupler |
| JPS58112533A (en) * | 1981-12-25 | 1983-07-05 | 横河電機株式会社 | Reflected wave receiving system |
| JPS5960378A (en) * | 1982-09-30 | 1984-04-06 | Yokogawa Hokushin Electric Corp | Reception system of reflected wave signal |
| JPS60104109U (en) * | 1983-12-21 | 1985-07-16 | 横河メディカルシステム株式会社 | Multi-beam imager |
| FR2596163B1 (en) * | 1986-03-19 | 1988-06-17 | Onera (Off Nat Aerospatiale) | METHOD AND APPARATUS FOR REMOTE DISCRIMINATION OF TARGETS |
-
1989
- 1989-06-01 US US07/360,200 patent/US4949318A/en not_active Expired - Lifetime
- 1989-06-14 CA CA000602788A patent/CA1292305C/en not_active Expired - Lifetime
-
1990
- 1990-05-21 FI FI902509A patent/FI902509A0/en not_active IP Right Cessation
- 1990-05-24 AU AU55866/90A patent/AU617281B2/en not_active Ceased
- 1990-05-25 EP EP90305727A patent/EP0400919B1/en not_active Expired - Lifetime
- 1990-05-25 ES ES90305727T patent/ES2076316T3/en not_active Expired - Lifetime
- 1990-05-25 DK DK90305727.1T patent/DK0400919T3/en active
- 1990-05-25 AT AT90305727T patent/ATE126896T1/en active
- 1990-05-25 DE DE69021777T patent/DE69021777T2/en not_active Expired - Fee Related
- 1990-05-30 NO NO90902397A patent/NO902397L/en unknown
- 1990-05-30 NZ NZ233872A patent/NZ233872A/en unknown
- 1990-06-01 JP JP2144237A patent/JP2505911B2/en not_active Expired - Lifetime
-
1995
- 1995-11-01 GR GR950403046T patent/GR3017938T3/en unknown
Also Published As
| Publication number | Publication date |
|---|---|
| NZ233872A (en) | 1992-07-28 |
| FI902509A0 (en) | 1990-05-21 |
| DK0400919T3 (en) | 1995-09-25 |
| AU5586690A (en) | 1990-12-06 |
| GR3017938T3 (en) | 1996-02-29 |
| DE69021777T2 (en) | 1996-02-22 |
| NO902397L (en) | 1990-12-03 |
| DE69021777D1 (en) | 1995-09-28 |
| ES2076316T3 (en) | 1995-11-01 |
| CA1292305C (en) | 1991-11-19 |
| AU617281B2 (en) | 1991-11-21 |
| EP0400919A2 (en) | 1990-12-05 |
| NO902397D0 (en) | 1990-05-30 |
| JP2505911B2 (en) | 1996-06-12 |
| US4949318A (en) | 1990-08-14 |
| EP0400919A3 (en) | 1992-02-12 |
| JPH0387682A (en) | 1991-04-12 |
| ATE126896T1 (en) | 1995-09-15 |
Similar Documents
| Publication | Publication Date | Title |
|---|---|---|
| EP0400919B1 (en) | Hydroacoustic sonar equipment and method | |
| JPH06347547A (en) | Sonar system | |
| US7526048B2 (en) | Energy threshold selection for UWB TOA estimation | |
| JP3413905B2 (en) | Radar detection threshold adjustment method and apparatus | |
| Traynor et al. | Evaluation of the dual beam acoustic fish target strength measurement method | |
| US20120263018A1 (en) | Underwater detection device and underwater detecting method | |
| US8638641B2 (en) | Real-time robust method for determining the trajectory of one or more cetaceans by means of passive acoustics, using a laptop computer | |
| EP0156636B1 (en) | The processing of reflected signals | |
| CN111046025B (en) | Unmanned aerial vehicle signal detection method and device | |
| US7161528B2 (en) | Device and method for the suppression of pulsed wireless signals | |
| Pezzopane et al. | Software for the automatic scaling of critical frequency f0F2 and MUF (3000) F2 from ionograms appliedat the Ionospheric Observatory of Gibilmanna | |
| JP2770814B2 (en) | Active sonar device | |
| CA2383760A1 (en) | Fish detection method using sonar data | |
| Hartsfield et al. | A comparison of CW field intensity and backscatter delay | |
| Patrick et al. | Range detection of targets using hydroacoustics in the laboratory | |
| Stewart | Use of crosspolar returns to enhance target detectability | |
| JP3050200B2 (en) | Sonar signal processing device and processing method | |
| Holtz et al. | Digitizer Performance under Conditions of Linear and Circular Antenna Polarization. | |
| AU651663B2 (en) | Back-scatter sounding | |
| Horne | Maximizing Single Target Resolution and Signal to Noise Ratios in Fisheries Acoustic Data | |
| Bozzano et al. | Underwater vegetation detection in high frequency sonar images: A preliminary approach | |
| Vent | Fish school target strength and Doppler measurements | |
| Hassan et al. | Pelagic stock assessment by hydroacoustic method in the South China Sea, Area IV: Vietnamese waters | |
| JPH09304500A (en) | Signal detection system | |
| JPH0458587B2 (en) |
Legal Events
| Date | Code | Title | Description |
|---|---|---|---|
| PUAI | Public reference made under article 153(3) epc to a published international application that has entered the european phase |
Free format text: ORIGINAL CODE: 0009012 |
|
| AK | Designated contracting states |
Kind code of ref document: A2 Designated state(s): AT BE CH DE DK ES FR GB GR IT LI LU NL SE |
|
| PUAL | Search report despatched |
Free format text: ORIGINAL CODE: 0009013 |
|
| AK | Designated contracting states |
Kind code of ref document: A3 Designated state(s): AT BE CH DE DK ES FR GB GR IT LI LU NL SE |
|
| 17P | Request for examination filed |
Effective date: 19920731 |
|
| RIN1 | Information on inventor provided before grant (corrected) |
Inventor name: SIM, BLAIR F. Inventor name: HUNT, GERALD A. Inventor name: PATRICK, PAUL H. |
|
| RAP1 | Party data changed (applicant data changed or rights of an application transferred) |
Owner name: ONTARIO HYDRO |
|
| 17Q | First examination report despatched |
Effective date: 19940207 |
|
| GRAA | (expected) grant |
Free format text: ORIGINAL CODE: 0009210 |
|
| AK | Designated contracting states |
Kind code of ref document: B1 Designated state(s): AT BE CH DE DK ES FR GB GR IT LI LU NL SE |
|
| PG25 | Lapsed in a contracting state [announced via postgrant information from national office to epo] |
Ref country code: GR Free format text: LAPSE BECAUSE OF FAILURE TO SUBMIT A TRANSLATION OF THE DESCRIPTION OR TO PAY THE FEE WITHIN THE PRESCRIBED TIME-LIMIT Effective date: 19950823 |
|
| REF | Corresponds to: |
Ref document number: 126896 Country of ref document: AT Date of ref document: 19950915 Kind code of ref document: T |
|
| REG | Reference to a national code |
Ref country code: DK Ref legal event code: T3 |
|
| REF | Corresponds to: |
Ref document number: 69021777 Country of ref document: DE Date of ref document: 19950928 |
|
| ET | Fr: translation filed | ||
| REG | Reference to a national code |
Ref country code: ES Ref legal event code: FG2A Ref document number: 2076316 Country of ref document: ES Kind code of ref document: T3 |
|
| ITF | It: translation for a ep patent filed |
Owner name: MARIETTI E GISLON S.R.L. |
|
| REG | Reference to a national code |
Ref country code: GR Ref legal event code: FG4A Free format text: 3017938 |
|
| PG25 | Lapsed in a contracting state [announced via postgrant information from national office to epo] |
Ref country code: DK Effective date: 19960525 Ref country code: AT Effective date: 19960525 |
|
| REG | Reference to a national code |
Ref country code: DK Ref legal event code: EBP |
|
| PG25 | Lapsed in a contracting state [announced via postgrant information from national office to epo] |
Ref country code: SE Effective date: 19960526 |
|
| PG25 | Lapsed in a contracting state [announced via postgrant information from national office to epo] |
Ref country code: ES Free format text: LAPSE BECAUSE OF NON-PAYMENT OF DUE FEES Effective date: 19960527 |
|
| PG25 | Lapsed in a contracting state [announced via postgrant information from national office to epo] |
Ref country code: LU Free format text: LAPSE BECAUSE OF NON-PAYMENT OF DUE FEES Effective date: 19960531 Ref country code: LI Effective date: 19960531 Ref country code: CH Effective date: 19960531 Ref country code: BE Effective date: 19960531 |
|
| PLBE | No opposition filed within time limit |
Free format text: ORIGINAL CODE: 0009261 |
|
| STAA | Information on the status of an ep patent application or granted ep patent |
Free format text: STATUS: NO OPPOSITION FILED WITHIN TIME LIMIT |
|
| 26N | No opposition filed | ||
| BERE | Be: lapsed |
Owner name: ONTARIO HYDRO Effective date: 19960531 |
|
| PG25 | Lapsed in a contracting state [announced via postgrant information from national office to epo] |
Ref country code: NL Effective date: 19961201 |
|
| REG | Reference to a national code |
Ref country code: GR Ref legal event code: MM2A Free format text: 3017938 |
|
| REG | Reference to a national code |
Ref country code: CH Ref legal event code: PL |
|
| EUG | Se: european patent has lapsed |
Ref document number: 90305727.1 |
|
| NLV4 | Nl: lapsed or anulled due to non-payment of the annual fee |
Effective date: 19961201 |
|
| PGFP | Annual fee paid to national office [announced via postgrant information from national office to epo] |
Ref country code: FR Payment date: 19970522 Year of fee payment: 8 |
|
| PGFP | Annual fee paid to national office [announced via postgrant information from national office to epo] |
Ref country code: GB Payment date: 19970523 Year of fee payment: 8 |
|
| PGFP | Annual fee paid to national office [announced via postgrant information from national office to epo] |
Ref country code: DE Payment date: 19970623 Year of fee payment: 8 |
|
| PG25 | Lapsed in a contracting state [announced via postgrant information from national office to epo] |
Ref country code: GB Free format text: LAPSE BECAUSE OF NON-PAYMENT OF DUE FEES Effective date: 19980525 |
|
| PG25 | Lapsed in a contracting state [announced via postgrant information from national office to epo] |
Ref country code: FR Free format text: LAPSE BECAUSE OF NON-PAYMENT OF DUE FEES Effective date: 19980531 |
|
| GBPC | Gb: european patent ceased through non-payment of renewal fee |
Effective date: 19980525 |
|
| PG25 | Lapsed in a contracting state [announced via postgrant information from national office to epo] |
Ref country code: DE Free format text: LAPSE BECAUSE OF NON-PAYMENT OF DUE FEES Effective date: 19990302 |
|
| REG | Reference to a national code |
Ref country code: FR Ref legal event code: ST |
|
| REG | Reference to a national code |
Ref country code: ES Ref legal event code: FD2A Effective date: 19990301 |
|
| PG25 | Lapsed in a contracting state [announced via postgrant information from national office to epo] |
Ref country code: IT Free format text: LAPSE BECAUSE OF NON-PAYMENT OF DUE FEES;WARNING: LAPSES OF ITALIAN PATENTS WITH EFFECTIVE DATE BEFORE 2007 MAY HAVE OCCURRED AT ANY TIME BEFORE 2007. THE CORRECT EFFECTIVE DATE MAY BE DIFFERENT FROM THE ONE RECORDED. Effective date: 20050525 |