EP0399482B1 - Liver function testing apparatus - Google Patents
Liver function testing apparatus Download PDFInfo
- Publication number
- EP0399482B1 EP0399482B1 EP90109734A EP90109734A EP0399482B1 EP 0399482 B1 EP0399482 B1 EP 0399482B1 EP 90109734 A EP90109734 A EP 90109734A EP 90109734 A EP90109734 A EP 90109734A EP 0399482 B1 EP0399482 B1 EP 0399482B1
- Authority
- EP
- European Patent Office
- Prior art keywords
- accordance
- liver function
- testing apparatus
- photoelectric conversion
- function testing
- Prior art date
- Legal status (The legal status is an assumption and is not a legal conclusion. Google has not performed a legal analysis and makes no representation as to the accuracy of the status listed.)
- Expired - Lifetime
Links
Images


Classifications
-
- A—HUMAN NECESSITIES
- A61—MEDICAL OR VETERINARY SCIENCE; HYGIENE
- A61B—DIAGNOSIS; SURGERY; IDENTIFICATION
- A61B5/00—Measuring for diagnostic purposes; Identification of persons
-
- A—HUMAN NECESSITIES
- A61—MEDICAL OR VETERINARY SCIENCE; HYGIENE
- A61B—DIAGNOSIS; SURGERY; IDENTIFICATION
- A61B5/00—Measuring for diagnostic purposes; Identification of persons
- A61B5/02—Detecting, measuring or recording for evaluating the cardiovascular system, e.g. pulse, heart rate, blood pressure or blood flow
- A61B5/026—Measuring blood flow
- A61B5/0261—Measuring blood flow using optical means, e.g. infrared light
-
- A—HUMAN NECESSITIES
- A61—MEDICAL OR VETERINARY SCIENCE; HYGIENE
- A61B—DIAGNOSIS; SURGERY; IDENTIFICATION
- A61B5/00—Measuring for diagnostic purposes; Identification of persons
- A61B5/0059—Measuring for diagnostic purposes; Identification of persons using light, e.g. diagnosis by transillumination, diascopy, fluorescence
-
- A—HUMAN NECESSITIES
- A61—MEDICAL OR VETERINARY SCIENCE; HYGIENE
- A61B—DIAGNOSIS; SURGERY; IDENTIFICATION
- A61B5/00—Measuring for diagnostic purposes; Identification of persons
- A61B5/42—Detecting, measuring or recording for evaluating the gastrointestinal, the endocrine or the exocrine systems
- A61B5/4222—Evaluating particular parts, e.g. particular organs
- A61B5/4244—Evaluating particular parts, e.g. particular organs liver
Definitions
- the present invention relates to a liver function testing apparatus. More specifically, it relates to a liver function testing apparatus for automatically performing measurement for testing and diagnosing a liver function by injecting a specific dye, which is selectively taken in and removed by only the liver, into blood to calculate a value correlating with concentration of the specific dye in the blood.
- ICG indocyanine green
- intravenous injection of ICG is applied to a testee to perform blood collection three times after lapses of five, ten and 15 minutes from the injection, and blood serum is separated upon coagulation of a blood clot so that absorbance at a wavelength of 805 nm is measured through a spectrophotometer to obtain ICG concentration values in the blood serum after the lapses of five, ten and 15 minutes from a previously obtained calibration curve (corresponding ICG concentration in blood vs absorbance), thereby to calculate the blood plasma disappearance rate and the retention rate.
- Japanese Patent Publication No. 60-58649 has proposed a method of measuring the blood plasma disappearance rate and the retention rate without performing blood collection. According to this method, light is applied through the body surface of an organism, which in turn transmits light of a wavelength having high ICG absorption sensitivity and light of a wavelength having substantially no ICG absorption sensitivity. The respective quantities of transmitted light are measured to obtain the blood plasma disappearance rate and the retention rate from time change (dye disappearance curve) of the light quantities.
- Japanese Patent Laying-Open No. 64-17630 discloses an apparatus in which light is applied through the body surface of an organism, absorbance of ICG is measured to obtain the blood plasma disappearance rate and the retention rate based on a time change (dye disappearance curve) in the measurement of the absorbance.
- this apparatus calibration is performed before measurement so that changes in blood quantities in the organism can be canceled.
- the index R MAx measuring method of measuring the blood plasma disappearance rate several times by changing the quantity of ICG injection is often used these days but this method requires blood collection several times and the burdens on the testee are further increased.
- the output of a sensor actually attached to an organism is fluctuated by influence such as blood flow disturbance caused by oppression on a blood vessel, vibration of the organism subjected to measurement, pulsation in the organism, change of blood volume in the vital tissue (for example, the blood volume being changed by mere vertical movement of an arm) etc., making it difficult to obtain a correct dye disappearance curve.
- the apparatus disclosed in Japanese Patent Laying-Open NO. 64-17630 requires calibration before measurement and therefore the operation is complicated.
- the change of blood volume in the vital tissue can be compensated for to some extent but not in a satisfactory manner. This is because the calibration is preferably performed immediately before injection of a specific dye but since the injection of the specific dye takes time in reality, the calibration does not effectively contribute to increase of the measurement precision.
- EP-A-0 298 122 discloses a liver function inspection apparatus using a first ray of light having wavelength absorbed by a specific dye and a second ray not absorbed by the dye. After the injection of the dye into the living tissue the concentration of the dye is calculated by means of regression analysis on the basis of the intensities of the light transmitted through the issue. The the dissapearance ratio and the retention ratio of plasma are calculated on the basis of coefficients which have been derived by least square fitting.
- the known liver function inspection apparatus comprises in particular light source means for exposing vital tissue to first light of a wavelength absorbed by specific dye dosed into blood of said vital tissue to be taken in and removed by the liver and second light of a wavelength not absorbed by said specific dye; photoelectric conversion means for outputting first and second photoelectric conversion signals corresponding to said first light and said second light applied to said vital tissue by said light source means and obtained from said vital tissue; sampling means for sampling first and second photoelectric conversion signals from said photoelectric conversion means; decision means for deciding a coefficient of a regression line expression between the logarithms of the intensities of said first and second photoelectric conversion signals; and arithmetic means for calculating a value correlated with specific dye concentration in said blood on the basis of an output of said sampling means during a prescribed period from the injection of said specific dye and said coefficient of the regression line expression decided by said decision means.
- a principal object of the present invention is to provide a liver function testing apparatus which can remove artifacts such as blood flow disturbance, vibration, or pulsation in an organism and change of blood volume in the vital tissue when a sensor is attached to the organism and which enables correct measurement.
- vital tissue is exposed to first light of a wavelength absorbed by specific dye which is dosed into blood of the vital tissue to be taken in and removed by the liver and second light of a wavelength not absorbed by the dye.
- First and second photoelectric conversion signals corresponding to the first light and the second light obtained from the vital tissue are sampled and only pulsation components are detected.
- the regression coefficient of a linear regression expression between the logarithms of the pulsation components of the first and second photoelectric conversion signals immediately before injection of the specific dye, and a base value using the sampled first and second photoelectric conversion signals are determined.
- a value correlated with specific dye concentration in the blood is calculated based on a sampling signal during a prescribed period from the injection of the specific dye and the determined coefficient and base value.
- the present invention there is no necessity of collecting blood and the testee needs only to be subjected to injection of specific dye, which makes it possible to considerably reduce the mental and physical burdens on the testee. Furthermore, it is possible to remove artifacts such as blood flow disturbance, vibration or pulsation in an organism to which a sensor is attached.
- first and second photoelectric conversion signals are detected several times and if intensities of pulsation components of the detected first and second photoelectric conversion signals are represented as T 1P and T 2 p, a linear regression analysis is performed according to the following equation:
- the maximum value of the first photoelectric conversion signal sampled several times is obtained as T 10 .
- the value Cg correlated with the specific dye concentration is calculated by the below indicated equation based on the constant A, base value So' and maximum value T 10 obtained as described above.
- the blood plasma disappearance rate of the specific dye or at the same time the retention rate in a prescribed period of the specific dye can be obtained based on a calculated coefficient of a simulation function.
- Figs. 1 to 4 are diagrams for illustrating the principle of biocalibration in the present invention.
- symbols I 1 and 1 2 indicate quantities of light having a wavelength ⁇ 1 which is largely absorbed by specific dye and light of a wavelength X 2 which is not absorbed by the specific dye incident upon vital tissue
- symbols T 1 and T 2 indicate light quantities after passage through a prescribed optical path in the vital tissue.
- Relations between the incident light quantities I 1 and 1 2 and the passing light quantities T 1 and T 2 in injection of the specific dye are as follows: where kg represents an absorption coefficient of the specific dye at wavelength ⁇ 1 ; ⁇ t2 represents absorbance of tissue at wavelength ⁇ 2; vb represents a blood volume in sample; Cb represents a blood concentration in sample; and Cg represents a specific dye concentration.
- Symbols f 1 and f 2 represent functions which are determined by characteristics of blood at the wavelengths ⁇ 1 , and x 2 .
- the expression (6) can be represented as follows:
- a signal of the function S can be obtained by using the diagram of Fig. 3 as a biocalibration curve.
- the absorption coefficient Kg is constant, it can be considered that the blood volume Vb is changed from time to time, and an accurate value of the specific dye concentration can not be obtained, because the value of Cg is influenced by the blood volume Vb in the organism.
- AB represents a calibration curve.
- a signal of only logT 1 is fluctuated, to reach a point E, for example.
- DE which is the value of the function S after a lapse of t 1 minutes becomes the function S as shown in the expression (9).
- the blood volume Vb in the expression (9) can be interpreted as CD, and hence, normalizing the Y coordinate of a point A as Tio, the same is expressed as follows:
- Fig. 5 is a schematic block diagram showing an embodiment of the present invention.
- a liver function testing apparatus is formed by a sensor part 10 and a measurement processing part 20.
- the sensor part 10 includes a first light source 11, a second light source 12, a light receiving element 13 and a preamplifier 14.
- the first light source 11 and the second light source 12 generate optical pulses of a wavelength ⁇ 1 having large absorbance to specific dye and optical pulses of a wavelength X 2 having no absorbance, respectively.
- the light receiving element 13 receives light applied to vital tissue 15 from the light sources 11 and 12 to pass through a prescribed optical path.
- the light sources 11 and 12 are driven by the measurement processing part 20 to alternately emit light by pulse operation, respectively.
- the measurement processing part 20 includes a CPU 34 which operates as arithmetic means.
- the CPU 34 supplies a start signal to an oscillation circuit 24 and a timing circuit 23 through an I/O port 32.
- the oscillation circuit 24 regularly oscillates to produce a prescribed clock signal.
- This clock signal and the aforementioned start signal are utilized to supply constant currents ii and i 2 to the first light source 11 and the second light source 12 from a constant current circuit 21 through the timing circuit 23 and a decoder 22 at timings TM 1 ' and TM 1 " in Fig. 6.
- the light emitted from the first light source 11 and the light emitted from the second light source 12 pass through the prescribed optical path in the vital tissue 15, to be incident upon the light receiving element 13.
- a current generated from the light receiving element 13 is supplied to the preamplifier 14 and it is subjected to current-to-voltage conversion, while being amplified.
- An output signal of the preamplifier 14 is amplified to a level within a prescribed range by an amplifier 16 provided in the measurement processing part 20, whereby output such as V f ⁇ in Fig. 6 is obtained.
- a sample-and-hold circuit 28 samples and holds the output at timing TM 2 ', shown in Fig. 6, generated by the timing circuit 23 and a decoder 25.
- the signal thus sampled and held is selected by a multiplexer 29 with voltages T 1 and T 2 shown in Fig. 6 being maintained and the selected signal is converted into a digital signal by an A-D converter 30, to be latched by a data latch 31.
- the multiplexer 29, the A-D converter 30 and the data latch 31 are controlled in timing by the timing circuit 23 and the decoder 26.
- the latched data are timed by a decoder 27 by a select signal outputted from the CPU 34 through the I/O port 32, to be taken in a RAM 35 as digital signals T 1 and T 2 .
- the I/O port 32 is connected with a buzzer 33, which informs timing for injecting the specific dye.
- the CPU 34 is connected with the RAM 35, a ROM 36, a display part 37 and an operation part 28.
- a slow component is removed from the sampled and held signal by using a high-bandpass filter HPF and an amplifier as shown in Fig. 5, whereby only the pulsation component is taken out.
- HPF high-bandpass filter
- This operation is performed for both of T 1 and T 2 and the respective outputs are amplified by the amplifier 16 and taken in the RAM 35 as digital signals as described above by means of the multiplexer 29.
- the RAM 35 stores data as shown in Fig. 7 as hereinafter described, and the ROM 36 stores programs based on flow charts as shown in Figs. 8A to 8C as hereinafter described.
- the display part 37 displays data as shown in Figs. 9 to 12, as hereinafter described.
- a printer 38 prints the result of a liver function test.
- the function part 39 includes an alarm LED 40, a calibration key 41, a start key 42 and a print key 43.
- the alarm LED 40 displays an alarm when reliability of the test result is small.
- the calibration key 41 is used to set a biocalibration mode.
- the start key 42 is used to command start of a measurement mode and the print key 43 is used to command printout of the test result.
- Fig. 7 illustrates data stored in the RAM 35 as shown in Fig. 5 and Figs. 8A to 8C are flow charts for illustrating an operation of the embodiment of the present invention.
- Figs. 9 to 12 are illustrative of exemplary displays on the display part as shown in Fig. 5.
- steps SP11 to SP16 shown in Fig. 8A are employed to sample quantities of light of a pair of wavelengths ⁇ 1 and ⁇ 2 after passage through a measured object and to store the same in the RAM 35. More specifically, the CPU 34 outputs the start signal from a line as shown in Fig. 5 through the I/O port 23 in step SP11. The voltages T 1 and T 2 are latched by the start signal, as hereinabove described. The CPU 34 waits until the data are latched in step SP12.
- step SP13 the CPU 34 outputs the select signal to a select line as shown in Fig. 5 through the I/O port 32, to read the data of T 1 through the I/O port 32 in step SP14, thereby to store the same in a storage area 8a1 of the RAM 35 as shown in Fig. 6.
- the CPU 34 stores the data of T 2 in a storage area 8a2 of the RAM 35 in steps SP15 and SP16.
- step SP16 Upon completion of the aforementioned operation in step SP16, the CPU 36 returns to the original step. This will be described with reference to Fig. 8B showing the biocalibration mode.
- the biocalibration mode is started before operation of a measurement mode shown in Fig. 8C as hereinafter described.
- the CPU 34 displays the biocalibration mode on the display part 37. This display indicates that the apparatus enters the biocalibration mode and indicates mounting of the sensor part 10 as shown in Fig. 9, for example. In accordance with this indication, an operator attaches the sensor part 10 to the object 13 to be tested.
- step SP22 the CPU 34 waits until the calibration key 41 is operated in step SP22.
- the CPU 34 advances to step SP23, to execute the data sampling subroutine as shown in Fig. 8A, as hereinabove described.
- the CPU 34 controls the constant current circuit 21 by using lines Si1 and Si2 as shown in Fig. 5 so that the data T 1 and T 2 read in step SP23 are within ranges of light quantity data T MAx and T MIN stored in storage areas 8bl and 8b2 of the RAM 35.
- the CPU 34 then stores set values of currents of the lines Si1 and Si2 in storage areas 8c1 and 8c2 in the RAM 35. Thereafter the currents of the lines Si1 and Si2 regularly flow to the light sources 11 and 12.
- the CPU 34 sounds the buzzer in step SP25, to inform that power setting is completed. Then, it proceeds to the measurement mode.
- Steps SP26 to SP29 in Fig. 8C are shown as a flow chart for performing the above mentioned biocalibration. More specifically, the values of CT 1 and CT 2 converted as the pulsation signals in steps SP26 and SP27 are sampled n times, so that CT1 (1) to CT 1 (n) are stored in the areas 8d1 to 8dn of the RAM 35 and CT 2 (1) to CT 2 (n) are stored in the areas 8e1 to 8en.
- step SP29 the CPU 34 determines whether the correlation coefficient r 1 is at least 0.998 in order to verify reliability of the biocalibration. If it is less than 0.998, the CPU 34 advances to step SP30 to light the alarm LED 40 and returns to step SP22 to perform again biocalibration.
- the CPU 34 proceeds to the measurement mode shown in Fig. 8C.
- the reference value 0.998 of the correlation coefficient r 1 herein employed is a mere example, which is determined by performance of the entire apparatus.
- a display for injection of the specific dye is made on the display part 37.
- This display is made for example to indicate injection of a specific dye, e.g., ICG.
- the operator prepares for injection of the specific dye to the testee.
- the CPU 34 waits until the start key 42 is operated. During this waiting, the operation in steps SP26 to SP29, namely, the biocalibration is performed repeatedly and the calibration values (A, So' and T io ) immediately before depression of the start key 42 are stored in the areas 8f1 to 8f4 in the RAM 35.
- the CPU 34 Upon determination that the start key 42 is operated, the CPU 34 displays timing for injecting the specific dye in step SP43, while sounding the buzzer 33.
- the operator Upon generation of the sound and display, the operator injects the specific dye.
- the CPU 34 sets "0" as the initial value of a timer in step SP44.
- step SP45 the CPU 34 executes a data sampling program, which is the subroutine as hereinabove described with reference to Fig. 8A. Then, the sampling data are stored in the areas 8a1 to 8a2 of the RAM 35 as T 1 to T 2 , respectively.
- step SP46 the CPU 34 performs operation based on the following operation expression by using the coefficients A, So', and T 10 stored in the areas 8f1, 8f2 and 8f4 of the RAM 35 in the biocalibration mode as hereinabove described with reference to Fig. 8B, to store Cg(l) in an area 8g1 of the RAM 35:
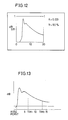
- Cg(l) is displayed on the display part 37 in step SP46 in a mode as shown in Fig. 12, for example.
- the abscissa indicates the elapsed time from injection of the specific dye and the ordinate indicates the value of Cg(I).
- m represents the sampling number of a disappearance curve of the specific dye
- symbol I indicates integers 1 to m.
- t s represents a measuring time of the disappearance curve
- the CPU 34 waits during this sampling ITM.
- the CPU 34 determines whether or not i is greater than m in step SP48.
- the CPU 34 advances to step SP49 if i is greater than m while the same again returns to step SP45 to repeat sampling if the former is less than the latter.
- the data Cg(l) stored in the areas 8g1 to 8gm of the RAM 35 draw a disappearance curve of the specific dye as shown in Fig. 13, for example, and the leading edge thereof is detected so that the preceding data are subtracted as baselines from the respective values of Cg(I), to be again stored in the areas 8g1 go 8gm.
- T 1 to T 2 in step SP45 may be average values of k times, in order to to improve the accuracy of measurement.
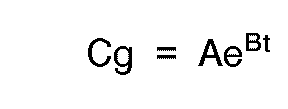
- step SP51 the CPU 34 finds the constants A and B by using the method of least squares in a simulation curve of: with respect to data between times t 1 to t 2 (0 ⁇ t 1 ⁇ t 2 ⁇ t s ) within the data Cg(l) stored in the areas 8g1 to 8gm.
- the values k and R thus evaluated are stored in areas 8jl and 8j2 of the RAM 35, respectively.
- the CPU 34 evaluates a correlation coefficient r 2 by the method of least squares, to make the obtained correlation coefficient r 2 stored in a storage area 8j3 of the RAM 35.
- the CPU 34 further generates an end sound from the buzzer 14.
- the CPU 34 makes the values k and R appear on the display part 26 in a mode as shown in Fig. 12, for example. Then, in step SP53, the CPU 34 determines whether or not the correlation coefficient r 2 is less than -0.95, for example. This determination is made to check the degree of correlation since correlation is improved as the correlation coefficient r 2 approaches -1.
- the value -0.95 is provisionally selected between zero and -1, and reliability of the apparatus is improved as the value comes closer to -1.
- the CPU 34 determines that reliability is insufficient and lights the alarm LED 40 in step SP54. On the other hand, if the correlation coefficient r 2 is less than -0.95, for example, in step SP53, the CPU 34 advances to step SP55 without flashing the alarm LED 281, since the measurement is reliable.
- step SP55 the CPU 34 determines whether or not the print key 43 is operated, to make the printer 38 print the values k and R % if the determination is of YES.
- the CPU 34 also makes characteristic dye disappearance curves of Cg(l) stored in the areas 8gl to 8gn of the RAM 35 printed, to advance to the biocalibration mode as shown in Fig. 8B.
- the CPU 34 advances to the calibration mode.
- the apparatus of the present invention is applicable to an apparatus for measuring R MAX by calculating the value k for various amounts of ICG injection.
- vital tissue is exposed to optical pulses of a wavelength considerably absorbed by a specific dye and optical pulses of a wavelength not absorbed by the dye at prescribed levels and the optical pulses transmitted through a prescribed optical path in the vital tissue are detected so that biocalibration is performed based on the detection output.
- the blood plasma disappearance rate and the retention rate of the specific dye after injection thereof are obtained according to a prescribed calculation expression based on an output of received light in a prescribed period from the injection. Consequently, it is possible to correctly control the time related with the disappearance curve of the specific dye and to obtain correct data.
- the present invention makes it possible to obtain the blood plasma disappearance rate and the retention rate from many data of disappearance curves, not from several samples as in the conventional blood collection method.
- the measurement method can be simplified compared with the conventional testing method in which the quantity of ICG injection is changed and measured several times to obtain the blood plasma disappearance rate and the retention rate.
- the present invention makes it possible to remove artifacts such as blood flow disturbance, vibration and pulsation of an organism and change in blood volume in the organism in attachment of a sensor to the organism, which are problems in the prior art, and thus correct measurement can be made. Since calibration is performed immediately before measurement, the precision of measurement is further improved. Accordingly, the apparatus of the present invention can be effectively utilized in the technical fields of measurement of specific dye in vital tissue in a non-invasive manner.
Landscapes
- Health & Medical Sciences (AREA)
- Life Sciences & Earth Sciences (AREA)
- Surgery (AREA)
- Animal Behavior & Ethology (AREA)
- Pathology (AREA)
- Engineering & Computer Science (AREA)
- Biomedical Technology (AREA)
- Heart & Thoracic Surgery (AREA)
- Medical Informatics (AREA)
- Molecular Biology (AREA)
- Physics & Mathematics (AREA)
- Biophysics (AREA)
- General Health & Medical Sciences (AREA)
- Public Health (AREA)
- Veterinary Medicine (AREA)
- Gastroenterology & Hepatology (AREA)
- Physiology (AREA)
- Endocrinology (AREA)
- Hematology (AREA)
- Cardiology (AREA)
- Measurement Of The Respiration, Hearing Ability, Form, And Blood Characteristics Of Living Organisms (AREA)
- Investigating Or Analysing Biological Materials (AREA)
Description
- The present invention relates to a liver function testing apparatus. More specifically, it relates to a liver function testing apparatus for automatically performing measurement for testing and diagnosing a liver function by injecting a specific dye, which is selectively taken in and removed by only the liver, into blood to calculate a value correlating with concentration of the specific dye in the blood.
- In general, the blood plasma disappearance rate and the retention rate for testing and diagnosing of a liver function have been measured by a method of blood collection through use of indocyanine green (hereinafter referred to as ICG) serving as specific dye.
- According to this method, intravenous injection of ICG is applied to a testee to perform blood collection three times after lapses of five, ten and 15 minutes from the injection, and blood serum is separated upon coagulation of a blood clot so that absorbance at a wavelength of 805 nm is measured through a spectrophotometer to obtain ICG concentration values in the blood serum after the lapses of five, ten and 15 minutes from a previously obtained calibration curve (corresponding ICG concentration in blood vs absorbance), thereby to calculate the blood plasma disappearance rate and the retention rate.
- Japanese Patent Publication No. 60-58649 has proposed a method of measuring the blood plasma disappearance rate and the retention rate without performing blood collection. According to this method, light is applied through the body surface of an organism, which in turn transmits light of a wavelength having high ICG absorption sensitivity and light of a wavelength having substantially no ICG absorption sensitivity. The respective quantities of transmitted light are measured to obtain the blood plasma disappearance rate and the retention rate from time change (dye disappearance curve) of the light quantities.
- Japanese Patent Laying-Open No. 64-17630 discloses an apparatus in which light is applied through the body surface of an organism, absorbance of ICG is measured to obtain the blood plasma disappearance rate and the retention rate based on a time change (dye disappearance curve) in the measurement of the absorbance. In this apparatus, calibration is performed before measurement so that changes in blood quantities in the organism can be canceled.
- In the conventional method of blood collection, it is necessary to correctly measure the blood collection time after injection. However, the time can not be accurately measured in actual test and the operation for such measurement is complicated. Further, the testee is subjected to heavy mental and physical burdens by blood collection. In addition, the index RMAx measuring method of measuring the blood plasma disappearance rate several times by changing the quantity of ICG injection is often used these days but this method requires blood collection several times and the burdens on the testee are further increased.
- According to the measuring method without blood collection as disclosed in Japanese patent Publication No. 60-58649 mentioned above or Japanese Patent Laying-Open No. 61-162934, the output of a sensor actually attached to an organism is fluctuated by influence such as blood flow disturbance caused by oppression on a blood vessel, vibration of the organism subjected to measurement, pulsation in the organism, change of blood volume in the vital tissue (for example, the blood volume being changed by mere vertical movement of an arm) etc., making it difficult to obtain a correct dye disappearance curve.
- Consequently, the blood plasma disappearance rate and the retention rate obtained by the dye disappearance curve can not be said to be correct.
- The apparatus disclosed in Japanese Patent Laying-Open NO. 64-17630 requires calibration before measurement and therefore the operation is complicated. In addition, the change of blood volume in the vital tissue can be compensated for to some extent but not in a satisfactory manner. This is because the calibration is preferably performed immediately before injection of a specific dye but since the injection of the specific dye takes time in reality, the calibration does not effectively contribute to increase of the measurement precision.
- EP-A-0 298 122 discloses a liver function inspection apparatus using a first ray of light having wavelength absorbed by a specific dye and a second ray not absorbed by the dye. After the injection of the dye into the living tissue the concentration of the dye is calculated by means of regression analysis on the basis of the intensities of the light transmitted through the issue. The the dissapearance ratio and the retention ratio of plasma are calculated on the basis of coefficients which have been derived by least square fitting. The known liver function inspection apparatus comprises in particular light source means for exposing vital tissue to first light of a wavelength absorbed by specific dye dosed into blood of said vital tissue to be taken in and removed by the liver and second light of a wavelength not absorbed by said specific dye; photoelectric conversion means for outputting first and second photoelectric conversion signals corresponding to said first light and said second light applied to said vital tissue by said light source means and obtained from said vital tissue; sampling means for sampling first and second photoelectric conversion signals from said photoelectric conversion means; decision means for deciding a coefficient of a regression line expression between the logarithms of the intensities of said first and second photoelectric conversion signals; and arithmetic means for calculating a value correlated with specific dye concentration in said blood on the basis of an output of said sampling means during a prescribed period from the injection of said specific dye and said coefficient of the regression line expression decided by said decision means.
- Therefore, a principal object of the present invention is to provide a liver function testing apparatus which can remove artifacts such as blood flow disturbance, vibration, or pulsation in an organism and change of blood volume in the vital tissue when a sensor is attached to the organism and which enables correct measurement.
- Briefly stated, in the apparatus of the present invention, vital tissue is exposed to first light of a wavelength absorbed by specific dye which is dosed into blood of the vital tissue to be taken in and removed by the liver and second light of a wavelength not absorbed by the dye. First and second photoelectric conversion signals corresponding to the first light and the second light obtained from the vital tissue are sampled and only pulsation components are detected. The regression coefficient of a linear regression expression between the logarithms of the pulsation components of the first and second photoelectric conversion signals immediately before injection of the specific dye, and a base value using the sampled first and second photoelectric conversion signals are determined. A value correlated with specific dye concentration in the blood is calculated based on a sampling signal during a prescribed period from the injection of the specific dye and the determined coefficient and base value.
- Therefore, according to the present invention, there is no necessity of collecting blood and the testee needs only to be subjected to injection of specific dye, which makes it possible to considerably reduce the mental and physical burdens on the testee. Furthermore, it is possible to remove artifacts such as blood flow disturbance, vibration or pulsation in an organism to which a sensor is attached.
- In a preferred embodiment of the present invention, first and second photoelectric conversion signals are detected several times and if intensities of pulsation components of the detected first and second photoelectric conversion signals are represented as T1P and T2p, a linear regression analysis is performed according to the following equation:
- log T1P = A. log T2P,
- At the same time, the maximum value of the first photoelectric conversion signal sampled several times is obtained as T10.
- According to another preferred embodiment of the invention, if the values of the sampled first and second photoelectric conversion signals are represented as T1 and T2, the value Cg correlated with the specific dye concentration is calculated by the below indicated equation based on the constant A, base value So' and maximum value T10 obtained as described above.

- In this preferred embodiment of the invention, the blood plasma disappearance rate of the specific dye or at the same time the retention rate in a prescribed period of the specific dye can be obtained based on a calculated coefficient of a simulation function.
- The foregoing and other objects, features, aspects and advantages of the present invention will become more apparent from the following detailed description of the present invention when taken in conjunction with the accompanying drawings.
-
- Figs. 1 to 4 are diagrams for explaining the principle of the present invention.
- Fig. 5 is a schematic block diagram showing an embodiment of the present invention.
- Fig. 6 is a timing chart for detecting light quantities of wavelengths λ1 and X2 after passage through a prescribed optical path in a tested object.
- Fig. 7 is a diagram showing data stored in a RAM as shown in Fig. 5.
- Figs. 8A to 8C are flow charts for explaining a specified operation of the embodiment of the present invention, in which Fig. 8A shows a data sampling subroutine, Fig. 8B shows a calibration mode, and Fig. 8C shows a measurement mode.
- Figs. 9 to 12 illustrate exemplary displays on a display part as shown in Fig. 5.
- Fig. 13 shows an example of a disappearance curve of specific dye measured by the present invention.
- Figs. 1 to 4 are diagrams for illustrating the principle of biocalibration in the present invention.
- In the following description, symbols I1 and 12 indicate quantities of light having a wavelength λ1 which is largely absorbed by specific dye and light of a wavelength X2 which is not absorbed by the specific dye incident upon vital tissue, and symbols T1 and T2 indicate light quantities after passage through a prescribed optical path in the vital tissue. Relations between the incident light quantities I1 and 12 and the passing light quantities T1 and T2 in injection of the specific dye are as follows:


- On the other hand, relations between the incident light quantities I1 and 12 and the passing light quantities T1 and T2 before injection of the specific dye are as follows:


- If only the pulsation components of the passing light quantities T1 and T2 are detected, the above indicated equations (3) and (4) become as follows:


- This relation is measured as shown in Fig. 2, to be in the linear relation as shown in Fig. 3. This is the data in case of attaching a sensor to an organism and fluctuating the blood volume in the organism. It has been confirmed that such linearity has reproducibility, with no individual difference.
- Therefore, the expressions (3) and (4) would appear as follows:

- Thus, it is expressed as follows:

- Since the main component changing in the expressions (3) and (4) before injection of the specific dye is the blood, the expression (6) can be represented as follows:

- Then, by using the expressions (1) and (2) after injection of the specific dye to obtain


- If the expression (6) is used in the above indicated expression (8), the following expression is obtained:

- In addition, if the value So' before injection of the specific dye is represented as: So' = γt1 - γt2 and a relation of S' - So' is set, the function S is expressed as follows:

- In consequence, it is understood that a signal of the function S can be obtained by using the diagram of Fig. 3 as a biocalibration curve.
- As to the function S, although the absorption coefficient Kg is constant, it can be considered that the blood volume Vb is changed from time to time, and an accurate value of the specific dye concentration can not be obtained, because the value of Cg is influenced by the blood volume Vb in the organism.
- Referring to Fig. 4, AB represents a calibration curve. When the specific dye is injected, a signal of only logT1 is fluctuated, to reach a point E, for example. At this time, DE which is the value of the function S after a lapse of t1 minutes becomes the function S as shown in the expression (9). The blood volume Vb in the expression (9) can be interpreted as CD, and hence, normalizing the Y coordinate of a point A as Tio, the same is expressed as follows:

- Hence, a signal Cg corresponding to the specific dye concentration Cg can be found by the expressions (7) and (10) as follows:

- Fig. 5 is a schematic block diagram showing an embodiment of the present invention.
- Referring to Fig. 5, a liver function testing apparatus is formed by a
sensor part 10 and ameasurement processing part 20. Thesensor part 10 includes afirst light source 11, a secondlight source 12, alight receiving element 13 and apreamplifier 14. - The
first light source 11 and the secondlight source 12 generate optical pulses of a wavelength À1 having large absorbance to specific dye and optical pulses of a wavelength X2 having no absorbance, respectively. Thelight receiving element 13 receives light applied tovital tissue 15 from thelight sources light sources measurement processing part 20 to alternately emit light by pulse operation, respectively. - The
measurement processing part 20 includes aCPU 34 which operates as arithmetic means. TheCPU 34 supplies a start signal to anoscillation circuit 24 and atiming circuit 23 through an I/O port 32. Theoscillation circuit 24 regularly oscillates to produce a prescribed clock signal. - This clock signal and the aforementioned start signal are utilized to supply constant currents ii and i2 to the
first light source 11 and the secondlight source 12 from a constantcurrent circuit 21 through thetiming circuit 23 and adecoder 22 at timings TM1' and TM1" in Fig. 6. - The light emitted from the
first light source 11 and the light emitted from the secondlight source 12 pass through the prescribed optical path in thevital tissue 15, to be incident upon thelight receiving element 13. A current generated from thelight receiving element 13 is supplied to thepreamplifier 14 and it is subjected to current-to-voltage conversion, while being amplified. - An output signal of the
preamplifier 14 is amplified to a level within a prescribed range by anamplifier 16 provided in themeasurement processing part 20, whereby output such as Vfα in Fig. 6 is obtained. A sample-and-hold circuit 28 samples and holds the output at timing TM2', shown in Fig. 6, generated by thetiming circuit 23 and a decoder 25. - The signal thus sampled and held is selected by a
multiplexer 29 with voltages T1 and T2 shown in Fig. 6 being maintained and the selected signal is converted into a digital signal by anA-D converter 30, to be latched by adata latch 31. At this time, themultiplexer 29, theA-D converter 30 and the data latch 31 are controlled in timing by thetiming circuit 23 and thedecoder 26. - The latched data are timed by a
decoder 27 by a select signal outputted from theCPU 34 through the I/O port 32, to be taken in aRAM 35 as digital signals T1 and T2. The I/O port 32 is connected with abuzzer 33, which informs timing for injecting the specific dye. Further, theCPU 34 is connected with theRAM 35, aROM 36, adisplay part 37 and anoperation part 28. - A slow component is removed from the sampled and held signal by using a high-bandpass filter HPF and an amplifier as shown in Fig. 5, whereby only the pulsation component is taken out. This operation is performed for both of T1 and T2 and the respective outputs are amplified by the
amplifier 16 and taken in theRAM 35 as digital signals as described above by means of themultiplexer 29. - The
RAM 35 stores data as shown in Fig. 7 as hereinafter described, and theROM 36 stores programs based on flow charts as shown in Figs. 8A to 8C as hereinafter described. Thedisplay part 37 displays data as shown in Figs. 9 to 12, as hereinafter described. Aprinter 38 prints the result of a liver function test. - The
function part 39 includes analarm LED 40, acalibration key 41, astart key 42 and aprint key 43. Thealarm LED 40 displays an alarm when reliability of the test result is small. Thecalibration key 41 is used to set a biocalibration mode. Thestart key 42 is used to command start of a measurement mode and theprint key 43 is used to command printout of the test result. - Fig. 7 illustrates data stored in the
RAM 35 as shown in Fig. 5 and Figs. 8A to 8C are flow charts for illustrating an operation of the embodiment of the present invention. Figs. 9 to 12 are illustrative of exemplary displays on the display part as shown in Fig. 5. - With reference to Figs. 5, 8A to 8C and 13, description is now made of the operation of the embodiment of the present invention.
- First of all, steps SP11 to SP16 shown in Fig. 8A are employed to sample quantities of light of a pair of wavelengths λ1 and λ2 after passage through a measured object and to store the same in the
RAM 35. More specifically, theCPU 34 outputs the start signal from a line as shown in Fig. 5 through the I/O port 23 in step SP11. The voltages T1 and T2 are latched by the start signal, as hereinabove described. TheCPU 34 waits until the data are latched in step SP12. - Then, in step SP13, the
CPU 34 outputs the select signal to a select line as shown in Fig. 5 through the I/O port 32, to read the data of T1 through the I/O port 32 in step SP14, thereby to store the same in a storage area 8a1 of theRAM 35 as shown in Fig. 6. - Similarly, the
CPU 34 stores the data of T2 in a storage area 8a2 of theRAM 35 in steps SP15 and SP16. - Upon completion of the aforementioned operation in step SP16, the
CPU 36 returns to the original step. This will be described with reference to Fig. 8B showing the biocalibration mode. - The biocalibration mode is started before operation of a measurement mode shown in Fig. 8C as hereinafter described. In step SP21, the
CPU 34 displays the biocalibration mode on thedisplay part 37. This display indicates that the apparatus enters the biocalibration mode and indicates mounting of thesensor part 10 as shown in Fig. 9, for example. In accordance with this indication, an operator attaches thesensor part 10 to theobject 13 to be tested. - Thereafter the
CPU 34 waits until thecalibration key 41 is operated in step SP22. When thecalibration key 41 is operated, theCPU 34 advances to step SP23, to execute the data sampling subroutine as shown in Fig. 8A, as hereinabove described. - Then, the
CPU 34 controls the constantcurrent circuit 21 by using lines Si1 and Si2 as shown in Fig. 5 so that the data T1 and T2 read in step SP23 are within ranges of light quantity data TMAx and TMIN stored in storage areas 8bl and 8b2 of theRAM 35. TheCPU 34 then stores set values of currents of the lines Si1 and Si2 in storage areas 8c1 and 8c2 in theRAM 35. Thereafter the currents of the lines Si1 and Si2 regularly flow to thelight sources - Then, the
CPU 34 sounds the buzzer in step SP25, to inform that power setting is completed. Then, it proceeds to the measurement mode. - Next, the measurement mode will be described with reference to Fig. 8C.
- Steps SP26 to SP29 in Fig. 8C are shown as a flow chart for performing the above mentioned biocalibration. More specifically, the values of CT1 and CT2 converted as the pulsation signals in steps SP26 and SP27 are sampled n times, so that CT1 (1) to CT1(n) are stored in the areas 8d1 to 8dn of the
RAM 35 and CT2(1) to CT2(n) are stored in the areas 8e1 to 8en. - In the subsequent step SP28, the
CPU 34 performs 2-variable statistical calculation with respect to logCT1 (I) and logCT2(1) (I = 1 to n) in the following manner:
- Then, using the value A thus obtained, a correlation coefficient r1 and the n values of T1(I) and T2(1) calculated at the same time, the value So' is calculated by the following expression:

RAM 35. Then, in step SP29, theCPU 34 determines whether the correlation coefficient r1 is at least 0.998 in order to verify reliability of the biocalibration. If it is less than 0.998, theCPU 34 advances to step SP30 to light thealarm LED 40 and returns to step SP22 to perform again biocalibration. On the other hand, if the correlation coefficient r1 is 0.998 or more, theCPU 34 proceeds to the measurement mode shown in Fig. 8C. The reference value 0.998 of the correlation coefficient r1 herein employed is a mere example, which is determined by performance of the entire apparatus. In step SP43, a display for injection of the specific dye is made on thedisplay part 37. - This display is made for example to indicate injection of a specific dye, e.g., ICG. In accordance with the display, the operator prepares for injection of the specific dye to the testee. In step SP42, the
CPU 34 waits until thestart key 42 is operated. During this waiting, the operation in steps SP26 to SP29, namely, the biocalibration is performed repeatedly and the calibration values (A, So' and Tio) immediately before depression of the start key 42 are stored in the areas 8f1 to 8f4 in theRAM 35. - When the
start key 42 is depressed, the calibration data immediately before the depression are employed for the subsequent measurement. - Upon determination that the
start key 42 is operated, theCPU 34 displays timing for injecting the specific dye in step SP43, while sounding thebuzzer 33. - This is displayed as 1 → 2 → 3 → 4 → 5 as shown in in Fig. 11, for example, so that the operator injects the specific dye upon display of "5". The
CPU 34 generates a first sound from thebuzzer 33 with the displays of "1 ", "2", "3" and "4", while generating a different sound from thebuzzer 33 upon display of "5". - Upon generation of the sound and display, the operator injects the specific dye. The
CPU 34 sets "0" as the initial value of a timer in step SP44. - In step SP45, the
CPU 34 executes a data sampling program, which is the subroutine as hereinabove described with reference to Fig. 8A. Then, the sampling data are stored in the areas 8a1 to 8a2 of theRAM 35 as T1 to T2, respectively. In step SP46, theCPU 34 performs operation based on the following operation expression by using the coefficients A, So', and T10 stored in the areas 8f1, 8f2 and 8f4 of theRAM 35 in the biocalibration mode as hereinabove described with reference to Fig. 8B, to store Cg(l) in an area 8g1 of the RAM 35:
- The value of Cg(l) is displayed on the
display part 37 in step SP46 in a mode as shown in Fig. 12, for example. Referring to Fig. 12, the abscissa indicates the elapsed time from injection of the specific dye and the ordinate indicates the value of Cg(I). If m represents the sampling number of a disappearance curve of the specific dye, symbol I indicatesintegers 1 to m. If ts represents a measuring time of the disappearance curve, a single sampling time is ITM = ts/ (m - 1). The same coincides with the injection time of the specific dye in the case of I = 1, as a matter of course. In step SP47, theCPU 34 waits during this sampling ITM. - Upon a lapse of this standby time, the
CPU 34 determines whether or not i is greater than m in step SP48. TheCPU 34 advances to step SP49 if i is greater than m while the same again returns to step SP45 to repeat sampling if the former is less than the latter. The data Cg(l) stored in the areas 8g1 to 8gm of theRAM 35 draw a disappearance curve of the specific dye as shown in Fig. 13, for example, and the leading edge thereof is detected so that the preceding data are subtracted as baselines from the respective values of Cg(I), to be again stored in the areas 8g1 go 8gm. Needless to say, T1 to T2 in step SP45 may be average values of k times, in order to to improve the accuracy of measurement. - Then, in step SP51, the
CPU 34 finds the constants A and B by using the method of least squares in a simulation curve of:

- Then, the
CPU 34 performs calculation of the blood plasma disappearance rate k = -B and the t-minute (t = 15) retention rate
RAM 35, respectively. At this time, theCPU 34 evaluates a correlation coefficient r2 by the method of least squares, to make the obtained correlation coefficient r2 stored in a storage area 8j3 of theRAM 35. TheCPU 34 further generates an end sound from thebuzzer 14. - Further, the
CPU 34 makes the values k and R appear on thedisplay part 26 in a mode as shown in Fig. 12, for example. Then, in step SP53, theCPU 34 determines whether or not the correlation coefficient r2 is less than -0.95, for example. This determination is made to check the degree of correlation since correlation is improved as the correlation coefficient r2 approaches -1. The value -0.95 is provisionally selected between zero and -1, and reliability of the apparatus is improved as the value comes closer to -1. - If the correlation coefficient r2 is greater than -0.95, for example, the
CPU 34 determines that reliability is insufficient and lights thealarm LED 40 in step SP54. On the other hand, if the correlation coefficient r2 is less than -0.95, for example, in step SP53, theCPU 34 advances to step SP55 without flashing the alarm LED 281, since the measurement is reliable. - In step SP55, the
CPU 34 determines whether or not theprint key 43 is operated, to make theprinter 38 print the values k and R % if the determination is of YES. - If necessary, the
CPU 34 also makes characteristic dye disappearance curves of Cg(l) stored in the areas 8gl to 8gn of theRAM 35 printed, to advance to the biocalibration mode as shown in Fig. 8B. - Also when a determination is made that the
print key 43 is not operated in step SP55, theCPU 34 advances to the calibration mode. - By using the value k obtained according to the present invention, the apparatus of the present invention is applicable to an apparatus for measuring RMAX by calculating the value k for various amounts of ICG injection.
- As described in the foregoing, according to the embodiment of the present invention, vital tissue is exposed to optical pulses of a wavelength considerably absorbed by a specific dye and optical pulses of a wavelength not absorbed by the dye at prescribed levels and the optical pulses transmitted through a prescribed optical path in the vital tissue are detected so that biocalibration is performed based on the detection output. Thus, using the coefficient thus obtained, the blood plasma disappearance rate and the retention rate of the specific dye after injection thereof are obtained according to a prescribed calculation expression based on an output of received light in a prescribed period from the injection. Consequently, it is possible to correctly control the time related with the disappearance curve of the specific dye and to obtain correct data.
- In addition, the present invention makes it possible to obtain the blood plasma disappearance rate and the retention rate from many data of disappearance curves, not from several samples as in the conventional blood collection method.
- In addition, the measurement method can be simplified compared with the conventional testing method in which the quantity of ICG injection is changed and measured several times to obtain the blood plasma disappearance rate and the retention rate.
- Furthermore, the present invention makes it possible to remove artifacts such as blood flow disturbance, vibration and pulsation of an organism and change in blood volume in the organism in attachment of a sensor to the organism, which are problems in the prior art, and thus correct measurement can be made. Since calibration is performed immediately before measurement, the precision of measurement is further improved. Accordingly, the apparatus of the present invention can be effectively utilized in the technical fields of measurement of specific dye in vital tissue in a non-invasive manner.
whereby a constant A is obtained. If the sampled first and second photoelectric conversion signals are represented as T1c and T2α, the base value So' is obtained by the equation:

Claims (20)

said sampling means (28) includes means for sampling said first and second photoelectric conversion signals a plurality of times, and means for obtaining said base value So' according to the following operation expression:

said arithmetic means (34) includes means for calculating said value Cg correlated with said specific dye concentration on the basis of said constant A obtained by said obtaining means in accordance with the following operation expression:

said coefficient calculating means includes means for calculating constants A and B on the basis of the following operation expression:
said means for obtaining said blood plasma disappearance rate includes means for performing calculation of the following operation expression:

said means for obtaining said retention rate includes means for performing calculation of the following operation expression:

said decision means includes means (SP28) for calculating a correlation coefficient r1 of said regression line expression.
said coefficient calculating means includes means (SP52) for calculating a correlation coefficient (r2) of said simulation function.
Applications Claiming Priority (2)
| Application Number | Priority Date | Filing Date | Title |
|---|---|---|---|
| JP1132345A JPH02309929A (en) | 1989-05-24 | 1989-05-24 | Liver function testing device |
| JP132345/89 | 1989-05-24 |
Publications (3)
| Publication Number | Publication Date |
|---|---|
| EP0399482A2 EP0399482A2 (en) | 1990-11-28 |
| EP0399482A3 EP0399482A3 (en) | 1991-05-02 |
| EP0399482B1 true EP0399482B1 (en) | 1995-01-04 |
Family
ID=15079173
Family Applications (1)
| Application Number | Title | Priority Date | Filing Date |
|---|---|---|---|
| EP90109734A Expired - Lifetime EP0399482B1 (en) | 1989-05-24 | 1990-05-22 | Liver function testing apparatus |
Country Status (7)
| Country | Link |
|---|---|
| US (1) | US5178141A (en) |
| EP (1) | EP0399482B1 (en) |
| JP (1) | JPH02309929A (en) |
| KR (1) | KR930010545B1 (en) |
| CN (1) | CN1025452C (en) |
| CA (1) | CA2017413A1 (en) |
| DE (1) | DE69015694T2 (en) |
Cited By (1)
| Publication number | Priority date | Publication date | Assignee | Title |
|---|---|---|---|---|
| WO2012013247A1 (en) | 2010-07-30 | 2012-02-02 | Pulsion Medical Systems Ag | Measurement method for determining an organ function |
Families Citing this family (15)
| Publication number | Priority date | Publication date | Assignee | Title |
|---|---|---|---|---|
| US5337745A (en) * | 1992-03-10 | 1994-08-16 | Benaron David A | Device and method for in vivo qualitative or quantative measurement of blood chromophore concentration using blood pulse spectrophotometry |
| JP3270917B2 (en) * | 1994-06-02 | 2002-04-02 | 日本光電工業株式会社 | Oxygen saturation measuring device, blood light absorbing substance concentration measuring device, and biological signal processing method |
| US6228344B1 (en) | 1997-03-13 | 2001-05-08 | Mallinckrodt Inc. | Method of measuring physiological function |
| US6280703B1 (en) | 1997-03-13 | 2001-08-28 | Mallinckrodt Inc. | Simultaneous multimodal measurement of physiological function |
| ES2220105T3 (en) * | 1998-07-01 | 2004-12-01 | Andreas Prof. Dr. Med. Hoeft | DETERMINATION OF HEPATIC FUNCTION THROUGH A DISASSEMBLY RATE OF PLASMA. |
| US6339714B1 (en) * | 1999-09-13 | 2002-01-15 | Bo Chen | Apparatus and method for measuring concentrations of a dye in a living organism |
| US6519485B2 (en) * | 2000-12-13 | 2003-02-11 | The General Hospital Corporation | Minimally invasive system for assessment of organ function |
| DE60127810T2 (en) | 2001-04-27 | 2007-12-27 | CSEM Centre Suisse d`Electronique et de Microtechnique S.A. - Recherche et Développement | Time-keeping device with automatic time correction and method for time correction of such a device |
| US7074190B2 (en) * | 2002-10-09 | 2006-07-11 | Industrial Technology Research Institute | Non-invasive apparatus system for monitoring drug hepatoxicity and uses thereof |
| JP5115855B2 (en) * | 2008-06-19 | 2013-01-09 | 日本光電工業株式会社 | Pulse oximetry and pulse oximeter |
| US8951781B2 (en) * | 2011-01-10 | 2015-02-10 | Illumina, Inc. | Systems, methods, and apparatuses to image a sample for biological or chemical analysis |
| CN102488525B (en) * | 2011-12-14 | 2014-04-16 | 吉林大学 | Hepatic functional reserve detector capable of removing blood oxygen fluctuation interference |
| CN102551670A (en) * | 2011-12-23 | 2012-07-11 | 北京华亘安邦科技有限公司 | Liver reserving function analyzer |
| CN107072505B (en) | 2014-04-05 | 2021-03-12 | 手术感应设备公司 | Devices, systems, and methods for mapping of tissue oxygenation |
| CN104688234A (en) * | 2015-03-17 | 2015-06-10 | 吉林大学 | Noninvasive and disturbance-resistant detection method for ICG pigment concentration spectrum |
Family Cites Families (7)
| Publication number | Priority date | Publication date | Assignee | Title |
|---|---|---|---|---|
| GB1095114A (en) * | 1963-12-09 | 1967-12-13 | Atlas Werke Ag | Apparatus for the measurement of dye dilution in blood |
| US4017192A (en) * | 1975-02-06 | 1977-04-12 | Neotec Corporation | Optical analysis of biomedical specimens |
| US4602641A (en) * | 1983-08-15 | 1986-07-29 | The Regents Of The University Of California | Method and apparatus for NMR detection and imaging of flowing fluid nuclei |
| IL84356A (en) * | 1986-11-05 | 1991-08-16 | Sumitomo Electric Industries | Liver function testing apparatus |
| JPH01129838A (en) * | 1987-11-13 | 1989-05-23 | Sumitomo Electric Ind Ltd | Liver function examination apparatus |
| KR910002651B1 (en) * | 1987-11-13 | 1991-04-27 | 스미또모 덴끼 고교 가부시끼가이샤 | Liver function search instrument |
| JPH0657216B2 (en) * | 1988-09-14 | 1994-08-03 | 住友電気工業株式会社 | Liver function test device |
-
1989
- 1989-05-24 JP JP1132345A patent/JPH02309929A/en active Pending
-
1990
- 1990-05-21 US US07/526,885 patent/US5178141A/en not_active Expired - Fee Related
- 1990-05-22 DE DE69015694T patent/DE69015694T2/en not_active Expired - Fee Related
- 1990-05-22 EP EP90109734A patent/EP0399482B1/en not_active Expired - Lifetime
- 1990-05-23 CN CN90104093A patent/CN1025452C/en not_active Expired - Fee Related
- 1990-05-23 CA CA002017413A patent/CA2017413A1/en not_active Abandoned
- 1990-05-24 KR KR1019900007493A patent/KR930010545B1/en not_active Expired - Fee Related
Cited By (2)
| Publication number | Priority date | Publication date | Assignee | Title |
|---|---|---|---|---|
| WO2012013247A1 (en) | 2010-07-30 | 2012-02-02 | Pulsion Medical Systems Ag | Measurement method for determining an organ function |
| US9671340B2 (en) | 2010-07-30 | 2017-06-06 | Smartdyelivery Gmbh | Measurement method for determining an organ function |
Also Published As
| Publication number | Publication date |
|---|---|
| CN1047571A (en) | 1990-12-05 |
| KR930010545B1 (en) | 1993-10-28 |
| KR900017550A (en) | 1990-12-19 |
| US5178141A (en) | 1993-01-12 |
| CA2017413A1 (en) | 1990-11-24 |
| CN1025452C (en) | 1994-07-13 |
| DE69015694T2 (en) | 1995-05-11 |
| JPH02309929A (en) | 1990-12-25 |
| DE69015694D1 (en) | 1995-02-16 |
| EP0399482A3 (en) | 1991-05-02 |
| EP0399482A2 (en) | 1990-11-28 |
Similar Documents
| Publication | Publication Date | Title |
|---|---|---|
| US5178141A (en) | Liver function testing apparatus | |
| US5154176A (en) | Liver function testing apparatus | |
| JP3270917B2 (en) | Oxygen saturation measuring device, blood light absorbing substance concentration measuring device, and biological signal processing method | |
| EP0808605A2 (en) | An optimal diagnosis point detector for noninvasive diagnosis of blood constituents and a noninvasive diagnostic device | |
| EP0316812B1 (en) | Liver function testing apparatus | |
| JPS63252239A (en) | reflective oximeter | |
| JP2003194714A (en) | Measuring apparatus for blood amount in living-body tissue | |
| EP0298122B1 (en) | Liver function inspection apparatus | |
| US5054916A (en) | Liver function testing apparatus | |
| EP0276477B1 (en) | Apparatus for measuring the change in the concentration of a pigment in blood | |
| JPH0534978B2 (en) | ||
| JPH01129839A (en) | Liver function testing device | |
| JPS63177843A (en) | Liver function testing device |
Legal Events
| Date | Code | Title | Description |
|---|---|---|---|
| PUAI | Public reference made under article 153(3) epc to a published international application that has entered the european phase |
Free format text: ORIGINAL CODE: 0009012 |
|
| AK | Designated contracting states |
Kind code of ref document: A2 Designated state(s): DE FR GB IT |
|
| 17P | Request for examination filed |
Effective date: 19901219 |
|
| PUAL | Search report despatched |
Free format text: ORIGINAL CODE: 0009013 |
|
| AK | Designated contracting states |
Kind code of ref document: A3 Designated state(s): DE FR GB IT |
|
| 17Q | First examination report despatched |
Effective date: 19930924 |
|
| GRAA | (expected) grant |
Free format text: ORIGINAL CODE: 0009210 |
|
| AK | Designated contracting states |
Kind code of ref document: B1 Designated state(s): DE FR GB IT |
|
| REF | Corresponds to: |
Ref document number: 69015694 Country of ref document: DE Date of ref document: 19950216 |
|
| ITF | It: translation for a ep patent filed | ||
| ET | Fr: translation filed | ||
| PLBE | No opposition filed within time limit |
Free format text: ORIGINAL CODE: 0009261 |
|
| STAA | Information on the status of an ep patent application or granted ep patent |
Free format text: STATUS: NO OPPOSITION FILED WITHIN TIME LIMIT |
|
| 26N | No opposition filed | ||
| PGFP | Annual fee paid to national office [announced via postgrant information from national office to epo] |
Ref country code: GB Payment date: 19970513 Year of fee payment: 8 Ref country code: FR Payment date: 19970513 Year of fee payment: 8 |
|
| PGFP | Annual fee paid to national office [announced via postgrant information from national office to epo] |
Ref country code: DE Payment date: 19970530 Year of fee payment: 8 |
|
| PG25 | Lapsed in a contracting state [announced via postgrant information from national office to epo] |
Ref country code: GB Free format text: LAPSE BECAUSE OF NON-PAYMENT OF DUE FEES Effective date: 19980522 |
|
| PG25 | Lapsed in a contracting state [announced via postgrant information from national office to epo] |
Ref country code: FR Free format text: LAPSE BECAUSE OF NON-PAYMENT OF DUE FEES Effective date: 19980531 |
|
| GBPC | Gb: european patent ceased through non-payment of renewal fee |
Effective date: 19980522 |
|
| PG25 | Lapsed in a contracting state [announced via postgrant information from national office to epo] |
Ref country code: DE Free format text: LAPSE BECAUSE OF NON-PAYMENT OF DUE FEES Effective date: 19990302 |
|
| REG | Reference to a national code |
Ref country code: FR Ref legal event code: ST |
|
| PG25 | Lapsed in a contracting state [announced via postgrant information from national office to epo] |
Ref country code: IT Free format text: LAPSE BECAUSE OF NON-PAYMENT OF DUE FEES;WARNING: LAPSES OF ITALIAN PATENTS WITH EFFECTIVE DATE BEFORE 2007 MAY HAVE OCCURRED AT ANY TIME BEFORE 2007. THE CORRECT EFFECTIVE DATE MAY BE DIFFERENT FROM THE ONE RECORDED. Effective date: 20050522 |