EP0318292A2 - Anzeigegerät und Bilderzeugung - Google Patents
Anzeigegerät und Bilderzeugung Download PDFInfo
- Publication number
- EP0318292A2 EP0318292A2 EP88311144A EP88311144A EP0318292A2 EP 0318292 A2 EP0318292 A2 EP 0318292A2 EP 88311144 A EP88311144 A EP 88311144A EP 88311144 A EP88311144 A EP 88311144A EP 0318292 A2 EP0318292 A2 EP 0318292A2
- Authority
- EP
- European Patent Office
- Prior art keywords
- data
- image
- interpolation
- scaling
- pixel size
- Prior art date
- Legal status (The legal status is an assumption and is not a legal conclusion. Google has not performed a legal analysis and makes no representation as to the accuracy of the status listed.)
- Withdrawn
Links
Images
Classifications
-
- G—PHYSICS
- G06—COMPUTING; CALCULATING OR COUNTING
- G06T—IMAGE DATA PROCESSING OR GENERATION, IN GENERAL
- G06T17/00—Three dimensional [3D] modelling, e.g. data description of 3D objects
Definitions
- the present invention relates to display apparatus and to generating images. It relates, by way of example, to three-dimensional (3-D) display of tomographic data, and more especially to producing artifact-free images using the dividing cubes method for extracting surface definitions from tomographic data.
- Tomographic medical imaging employs the collection of data representing cross sections of a body.
- a plurality of object interrogations can be processed mathematically to produce representations of contiguous cross-sectional images.
- Such cross-sectional images are of great value to the medical diagnostician in a non-invasive investigation of internal body structure.
- the technique employed to collect the data is a matter of indifference to the present invention. Any technique such as, for example, X-ray computed tomography, nuclear magnetic resonance tomography, single-photon emission tomography, positron emission tomography, or ultrasound tomography may serve equally.
- a body to be imaged exists in three dimensions.
- Tomographic devices process data for presentation as a series of contiguous cross-sectional slices along selectable axes through the body.
- Each cross-sectional slice is made up of a number of rows and columns of voxels (parallelepiped volumes with certain faces corresponding to pixel spacing within each slice and others corresponding to slice spacing), each represented by a digitally stored number related to a computed signal intensity in the voxel.
- voxels parallelepiped volumes with certain faces corresponding to pixel spacing within each slice and others corresponding to slice spacing
- an array of, for example, 64 slices may each contain 512 and 512 voxels.
- a diagnostician reviews images of a number of individual slices to derive the desired information.
- the diagnostician In cases where information about a surface within the body is desired, the diagnostician relies on inferences of the 3-D nature of the object derived from interrogating the cross-sectional slices. At times, if is difficult or impossible to attain the required inference from reviewing contiguous slices. In such cases, a synthesized 3-D image would be valuable.
- Synthesizing a 3-D image from tomographic data is a two-step process.
- a mathematical description of the desired object is extracted from the tomographic data.
- the image is synthesized from the mathematical description.
- the mathematical description of the object is made up of the union of a large number of surface elements (SURFELS).
- the SURFELS are operated on by conventional computer graphics softward, having its genesis in computer-aided design and computer-aided manufacturing, to apply surface shading to objects to aid in image interpretation through a synthesized two-dimensional image.
- the computer graphic software projects the SURFELS onto a rasterized image and determines which pixels of the rasterized image are tuned on, and with what intensity of color.
- the shading is lightest (i.e., most intense) for image elements having surface normals along an operator-selected line of sight and successively darker for those elements inclined to the line of sight.
- Image elements having surface normals inclined more than 90 degrees from the selected line of sight are hidden in a 3-D object and are suppressed from the display.
- Foreground objects on the line of sight hide background objects.
- the shading gives a realistic illusion of three dimensions.
- this step is broken down into two subtasks, namely the extraction of the object from the tomographic data, and the fitting of the surface to the extracted object.
- a number of ways are available to do the first subtask. For example, it is possible to search through the signal intensities in the voxels of a slice to discern regions where the material forming the object has sufficient signal contrast with surrounding regions. For example, signal intensities characteristic of bone in X-ray computed tomography have high contrast with surrounding tissue. A threshold may then be applied to the voxels to identify each one in the complete array lying in the desired object from all voxels not in the object.
- the dividing cubes method which is disclosed in EP-A-216156 (U.S. Patent Application Serial No. 770,164, filed August 28, 1985) which is hereby incorporated by reference.
- the surface of interest is represented by the union of a large number of directed points.
- the directed points are obtained by considering in turn each set of eight cubically adjacent voxels in the data base of contiguous slices. Gradient values are calculated for the cube vertices using difference equations. If the surface passes through a cube, then it is subdivided to form a number of smaller cubes, referred to as subcubes or subvoxels.
- densities are calculated for the subcube vertices and a gradient is calculated for the center of the subcube.
- the densitites are tested (e.g., compared to a threshold). If some are greater and some less than the threshold, then the surface passes through the subcube. In that case, the location of the subcube is output with its normalized gradient, as a directed point. It is also possible to define the surface using a range of densities (e.g., an upper and lower threshold).
- the union of all directed points generated by testing all subcubes provides the surface representation.
- the directed points are then rendered (i.e., rasterized) for display on a CRT, for example.
- subcube size degree of interpolation performed
- image quality i.e., resolution and smoothness
- an operator can perform various functions on the image, such as scaling (or zooming) and rotation, thereby defining a viewing perspective. These functions are typically achieved using a Current Transformation Matrix (CTM) that operates on the data in a renderer before being sent to the display.
- CTM Current Transformation Matrix
- a further consequence of the amount of data interpolation relates to the appearance of image artifacts at certain rotational positions.
- a set of directed points may have sufficient interpolation to view the object from one angle, but not enough for another viewing angle.
- the image artifact usually encountered is a structured pattern of holes in the image.
- An aspect of the present invention seeks to provide artifact-free images while minimizing data-handling requirements and the amount of computations.
- a further aspect of the invention seeks to minimize the number of directed points generated by the dividing cubes method of extracting a surface definition from 3-D tomographic data.
- Another aspect seeks to eliminate holes in an image resulting from insufficient interpolation.
- the size of subcube faces are matched to a size greater than about 1/ ⁇ 2 of the 3-D pixel size. If the object is viewed along an axis of the tomographic data, then a minimum number of directed points without image artifacts is achieved when the subcubes are matched to 3-D pixel size.
- image size can be reduced to a degree where the artifacts are eliminated.
- a constant amount of interpolation may be used while providing maximum resolution and image quality for the primary viewing angles.
- an artifact-free image is displayed with some loss of resolution. Those images that are reduced in size by scaling during image rendering can thereafter be magnified back to its original size for continuity of presentation, although the small loss of resolution cannot be recovered.
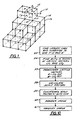
- FIGURE 1 there is shown, generally at 10, a part of a tomographic array incuding an array of cubes 12 defined by nodes 14 connected by edges 16.
- Each node 14 represents a signal amplitude of a voxel of tomographic data and each edge 16 represents the distance from one voxel to its neighbor.
- edges 16 are not necessarily all of equal length and are probably not since slice thickness is usually not equal to pixel resolution within the slice. Pixel spacings P and Q and slice spacing S are shown for cube 12.
- Each large cube is subdivided by integer factors (greater than or equal to zero) into a number of subcubes.
- the vertices of the subcubes are compared to a threshold to identify subcubes through which the surface passes. For such identified subcubes, the subcube location and normalized gradient for the subcube center are concatenated resulting in a directed point.
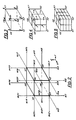
- the process of subdivision uses a large cube and adjacent points as shown in FIG. 2. Cubically adjacent voxels from the tomographic data are selected to represent the vertices V1-V8 of the large cube. Points W1-W24 are adjacent to V1-V8 and are used in conjuction with V1-V8 to calculate the gradients at the vertices of the large cube. Interpolation can then be performed on the cube and the gradients.
- FIG. 3 shows examples of gradients associated with the vertices of a cube.
- FIG. 4 represents interpolated points and gradient normals which define the subcubes within the large cube.
- FIG. 5 shows subcubes having different interpolation factors along different axes.
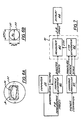
- An aspect of the invention involves the determination of effective interpolation factors according to a method which will be described with reference to FIG. 6.
- An object or region of interest 30 contained in a 3-D data base of contiguous slices is to be displayed (FIG. 6A). Its size is approximated by user input during display of several slices and a bounding box 31 is found which encloses the estimated object. Bounding box 31 is the smallest parallelopiped that contains object 30. A sphere 32 is then found which is the smallest sphere containing bounding box 31.
- the diameter D s of sphere 32 is projected onto a virtual display 33 (FIG. 6B) in order to approximate the 3-D pixel size corresponding to object 30.
- D s is calculated as a distance measurement, preferably in the same units as pixel spacings P and Q and slice spacing S (e.g., millimeters).
- Diameter D s is then divided by the number of pixels, NPIC, corresponding to the display size.
- the typical display has an equal number of pixel rows and columns (e.g., 512 x 512 or 1024 x 1024), or a size of NPIC by NPIC. If the display is not square, then the smaller number is chosen for NPIC.
- the proportions of a subcube depend on the data spacing along each spatial dimension and the interpolation factor used for the respective dimension. With P, Q and S being the data spacings (as in FIG. 1) and defining respective interpolation factors as A, B and C, we then have the size of subcube faces equalling P/A, Q/B and S/C. Relating subcube size to 3-D pixel size, we have where A, B and C are the smallest integers satisfying the relationships and where ⁇ is a constant multiplier for varying the amount of interpolation, as desired. If any one of the data spacings P, Q or S is not constant throughout the data base, then its largest value is used to ensure that the biggest large cube is properly subdivided.
- subcube faces greater than 1/ ⁇ 2 of 3-D pixel size up to and including subcube faces equal to 3-D pixel size ie., 1/ ⁇ 2 ⁇ ⁇ ⁇ 1
- there will be some viewing angles that will be artifact free primarily those perpendicular to a major plane of the tomographic data
- there will be viewing angles that result in artifacts primarily those rotated by 45 degrees from perpendicular to a major plane).
- FIG. 7 A first embodiment for a processing hardware implementation of the invention is shown in FIG. 7.
- Two-dimensional tomographic slices are provided to a surface generator 40.
- Also input to surface generator 40 are the interpolation factors determined from 3-D pixel size according to the method described above by other processing equipment, such as a general-purpose computer 39.
- Surface generator 40 implements the dividing cubes method to generate a number of directed points defining the surface that are fed to a display processor 41 which includes a Current-Transformation-Matrix (CTM) generator 42 and a renderer 43.
- CTM Current-Transformation-Matrix
- CTM generator 42 receives a viewer's commands via a command processor 45 for scaling, moving and rotating the object and forms the CTM which is provided to renderer 43 to operate on the directed points.
- Renderer 43 synthesizes the 3-D image (including projecting directed points onto 3-D pixels and determining shading of illuminated pixels) which is rasterized and sent to display 44 which could be a cathode-ray tube (CRT), for example.
- CTR cathode-ray tube
- Interpolation factors corresponding to ⁇ equal to 1/ ⁇ 2 approximately doubles the number of directed points (and, consequently, processing time and/or capacity) as compared to interpolation factors corresponding to ⁇ equal to one.
- a further embodiment of the invention removes image artifacts that would otherwise appear when using lesser amounts of interpolation. This is achieved by reducing the size of objects viewed from angles expected to otherwise produce artifacts. After rendering, the 3-D image can be magnified back to the viewer-commanded size before presentation on the display.
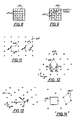
- FIG. 8 shows a display pixel array 50 comprising a plurality of pixels, each represented by a box, which are selectively intensified to display an image.
- a plurality of directed points 51 are shown as crosses mapped onto the pixel display as part of a solid square in a 3-D image.
- FIG. 9 shows the same surface rotated about the z-axis (i.e., viewing axis) to a point where an empty hole artifact results in the image when directed points 51 are mapped onto array 50.
- Artifacts are avoided in the embodiment by analyzing the rotation and scaling matrices commanded by the viewer in order to determine the degree of abnormality of the viewing position.
- the viewer commanded scale factor is denoted by ⁇ and rotation by ROT.
- a scaling factor ⁇ ′ (typically between 1 and 1/ ⁇ 2) is found that will remove the artifacts by shrinking the image when concatenated with scale factor ⁇ .
- a preferred method for obtaining the scale factor ⁇ ′ involves projecting a subcube onto a virtual 3-D image space. This is done by defining representative basic lattice polygons (BLPs) for each of the xy-, yz-, and zx-planes containing the subcube faces. If there are other sets of planar voxels in the tomographic data, then basic lattice polygons can also be formed in those planes to avoid artifacts coming from those planes.
- BLPs basic lattice polygons
- the basic lattice polygons are represented in each respective plane by projected lattice vectors. These vectors are used to determine the needed scale factor for each plane. Of the three (or more) scale factors, the one corresponding to the greatest amount of object shrinkage gives the value of ⁇ ′.
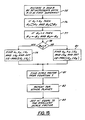
- the method is summarized in general terms with reference to FIG. 10.
- the largest subdivided cube in the tomographic data is found in step 55.
- the slices are evenly spaced so that all cubes are the same size.
- the cube is subdivided to give largest subcube pixel spacings P′ and Q′ and slice spacing S′.
- lattice vectors LV1 and LV2 in each of the xy-, yz-, and xz-planes, respectively, of the tomographic data are given by:
- Scale factors are determined from each transformed lattice vector in step 58.
- the smallest scale factor ⁇ ′ i.e., the most shrinkage
- the image is rendered in step 60 and magnified in step 61.
- the lattice vectors LV1 and LV2 define a lattice of points corresponding to the subcube size in the original tomographic data space. Following transformation, the three pairs of lattice vectors A and B define new lattices of points as rotated by the ROT portion of the CTM.
- FIG. 11 shows a lattice of points 65 after rotation, each lattice point being represented by a cross. Two different basic lattice polygons 66 and 67 are shown, of which both are equally valid and both can generate the lattice of points.
- FIG. 12 shows a basic lattice polygon 68 for a set of lattice points 69.
- lattice vectors A and B have non-zero components A x , A y , and B x and B y , respectively.
- the lattice is then searched for the smallest vector magnitude
- the remaining vector D to be found points from the origin to a line of lattice points which is parallel to vector C. By finding the closest parallel line to C and by finding the single point in the parallel line which is closest to the origin, the remaining vector D is derived.
- the scale factor corresponding to each plane can now be found.
- the largest square LQ is grown that can be placed into the lattice without any lattice points inside it as shown in FIG. 14.
- the minimum scale factor for the three data planes gives ⁇ ′.
- vector A must be rotated into the first quadrant in the xy-image space by using from zero to three 90° rotations in step 75.
- Vector B receives the same number of 90° rotations.
- step 76 if A y > A x , then the values of A x and A y are switched and the values of B x and B y are switched.
- step 77 if B y ⁇ O, then B y is set to -B y and B x is set to -B x .
- a family of rectangles are generated from the values of A and B resulting after step 77 in order to determine the largest square.
- step 78 determines whether B x is less than zero. If the answer is yes, then step 79 is done. In step 79, k1, K2, LQ1, and LQ2 are found from Equations (2) - (9) and LQ is set to the maximum of LQ1 and LQ2. If the answer in step 78 is no, then in step 80 we determine k3, k4, LQ3 and LQ4 and set LQ to the maximum of LQ3 and LQ4. In step 81, the scale factor for the plane under consideration is found from plugging the value for LQ into Equation (1).
- step 82 the procedure in steps 75 to 81 are repeated for the other data planes.
- Scale factor ⁇ ′ is determined in step 83 by taking the smallest previously calculated scale factor.
- This scale factor ⁇ ′ is concatenated with the current scale factor ⁇ and sent to the CTM generator.
- the displayed image will be artifact free.
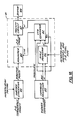
- FIG. 16 A further hardware implementation is shown in FIG. 16. Additional components in display processor 41 include a scale processor 46 and a magnify circuit 47.
- Scale processor 46 receives the ROT and ⁇ values from command processor 45 and interpolation factors and 3-D pixel size from external hardware. The calculated value of ⁇ ′ is output to CTM generator 42 which concatenates ⁇ ′ with ⁇ and then provides the CTM to renderer 43.
- CTM generator 42 which concatenates ⁇ ′ with ⁇ and then provides the CTM to renderer 43.
- Magnify circuit 47 receives the scale factor ⁇ ′ from scale processor 46 and the 3-D image from renderer 43. Magnify circuit 47 magnifies the 3-D image by the inverse of the scale factor ⁇ ′ and provides the new image to display 44.
- the foregoing embodiment has provided artifact-free images in dividing cubes images. This can also be done while minimizing data handling and computations without sacrificing image quality at normal viewing positions. Automatic scaling of the object according to the current transformation matrix corrects for under-interpolation of the data, if any.
Landscapes
- Physics & Mathematics (AREA)
- Engineering & Computer Science (AREA)
- Computer Graphics (AREA)
- Geometry (AREA)
- Software Systems (AREA)
- General Physics & Mathematics (AREA)
- Theoretical Computer Science (AREA)
- Apparatus For Radiation Diagnosis (AREA)
- Image Generation (AREA)
- Controls And Circuits For Display Device (AREA)
- Ultra Sonic Daignosis Equipment (AREA)
Applications Claiming Priority (2)
| Application Number | Priority Date | Filing Date | Title |
|---|---|---|---|
| US125510 | 1987-11-25 | ||
| US07/125,510 US4885688A (en) | 1987-11-25 | 1987-11-25 | Minimization of directed points generated in three-dimensional dividing cubes method |
Publications (2)
| Publication Number | Publication Date |
|---|---|
| EP0318292A2 true EP0318292A2 (de) | 1989-05-31 |
| EP0318292A3 EP0318292A3 (de) | 1991-02-06 |
Family
ID=22420052
Family Applications (1)
| Application Number | Title | Priority Date | Filing Date |
|---|---|---|---|
| EP19880311144 Withdrawn EP0318292A3 (de) | 1987-11-25 | 1988-11-24 | Anzeigegerät und Bilderzeugung |
Country Status (5)
| Country | Link |
|---|---|
| US (1) | US4885688A (de) |
| EP (1) | EP0318292A3 (de) |
| JP (1) | JPH02899A (de) |
| CA (1) | CA1315902C (de) |
| IL (1) | IL87963A (de) |
Cited By (1)
| Publication number | Priority date | Publication date | Assignee | Title |
|---|---|---|---|---|
| EP0476409A2 (de) * | 1990-09-04 | 1992-03-25 | Kabushiki Kaisha Toshiba | Bildanzeigevorrichtung |
Families Citing this family (23)
| Publication number | Priority date | Publication date | Assignee | Title |
|---|---|---|---|---|
| FR2639211A1 (fr) * | 1988-11-18 | 1990-05-25 | Hennson Int | Procede de correlation des saisies tridimensionnelles d'organes humains et dispositif pour sa mise en oeuvre |
| US5357429A (en) * | 1992-04-02 | 1994-10-18 | Levy Richard A | Three-dimensional model generation using multiple angle tomographic scan planes |
| US5454069A (en) * | 1992-08-25 | 1995-09-26 | University Of Kentucky Research Foundation | Process for converting serial image to the sterolithography apparatus (SLA) slice file with automatic base and support generation |
| US5898793A (en) * | 1993-04-13 | 1999-04-27 | Karron; Daniel | System and method for surface rendering of internal structures within the interior of a solid object |
| GB2278524B (en) * | 1993-05-28 | 1997-12-10 | Nihon Unisys Ltd | Method and apparatus for rendering visual images employing area calculation and blending of fractional pixel lists for anti-aliasing and transparency |
| US5690106A (en) * | 1995-06-30 | 1997-11-25 | Siemens Corporate Research, Inc. | Flexible image registration for rotational angiography |
| US5647360A (en) * | 1995-06-30 | 1997-07-15 | Siemens Corporate Research, Inc. | Digital subtraction angiography for 3D diagnostic imaging |
| US5754618A (en) * | 1995-12-22 | 1998-05-19 | Matsushita Electric Industrial | Image processing apparatus and image processing method for favorably enhancing continuous boundaries which are affected by noise |
| US6510435B2 (en) | 1996-09-02 | 2003-01-21 | Rudolf Bayer | Database system and method of organizing an n-dimensional data set |
| US6084593A (en) * | 1998-05-14 | 2000-07-04 | Mitsubishi Electric Information Technology Center America, Inc. | Surface net smoothing for surface representation from binary sampled data |
| US6771841B1 (en) * | 1999-12-29 | 2004-08-03 | Intel Corporation | Determining a bounding shape for a collection of points |
| US6529574B1 (en) * | 2001-07-18 | 2003-03-04 | Ge Medical Systems Global Technology Company, Llc | Methods and apparatus for FOV-dependent aliasing artifact reduction |
| GB2399703B (en) * | 2003-02-04 | 2006-09-27 | British Broadcasting Corp | Method and system for providing a volumetric representation of a three-dimensional object |
| US7228525B2 (en) * | 2003-02-14 | 2007-06-05 | Sap Ag | Generic rendering framework |
| US6990169B2 (en) * | 2003-12-23 | 2006-01-24 | General Electric Company | Method and system for viewing a rendered volume |
| EP1603076A1 (de) * | 2004-05-13 | 2005-12-07 | Aalborg Universitet | Rechnergestützte Hirnrindengrenzextraktion aus MR-Bildern |
| GB2418827B (en) * | 2004-09-28 | 2010-11-10 | British Broadcasting Corp | Method and system for providing a volumetric representation of a 3-Dimensional object |
| DE102005012094A1 (de) | 2005-03-16 | 2006-09-21 | Technische Universität München | Verfahren und Vorrichtung zur Konturfeinermittlung eines Objekts bei bildgebenden Untersuchungsverfahren |
| JP4894369B2 (ja) * | 2006-06-19 | 2012-03-14 | 富士通株式会社 | 3次元モデルの画像処理装置 |
| US7588089B2 (en) * | 2006-10-26 | 2009-09-15 | Cnh America Llc | Implement weight and center of gravity determination based on hitch cylinder pressure |
| EP2026106B2 (de) | 2007-08-02 | 2015-03-04 | Vallon GmbH | Verfahren zur georeferenzierten Darstellung von mittels Bodendetektoren ermittelten Messwerten eines Messfeldes sowie Detektor zur Anwendung |
| US10996358B2 (en) * | 2017-08-18 | 2021-05-04 | Saudi Arabian Oil Company | Image-guided velocity interpolation using a mask cube |
| US11309992B2 (en) * | 2018-07-17 | 2022-04-19 | Qualcomm Incorporated | Using lattice reduction for reduced decoder complexity |
Citations (2)
| Publication number | Priority date | Publication date | Assignee | Title |
|---|---|---|---|---|
| EP0182237A2 (de) * | 1984-11-19 | 1986-05-28 | General Electric Company | Verfahren und Mittel zur räumlichen Eigenschaftsveränderung eines digitalen Bildes |
| EP0216156A2 (de) * | 1985-08-28 | 1987-04-01 | General Electric Company | Kubusteilungssystem und Verfahren zur Anzeige von im Innengebiet eines massiven Körpers enthaltenen Flächenstrukturen |
Family Cites Families (4)
| Publication number | Priority date | Publication date | Assignee | Title |
|---|---|---|---|---|
| US4402012A (en) * | 1981-11-16 | 1983-08-30 | General Electric Company | Two-dimensional digital linear interpolation system |
| US4739481A (en) * | 1984-03-15 | 1988-04-19 | Yokogawa Medical Systems, Limited | X-ray CT image processing apparatus |
| US4710876A (en) * | 1985-06-05 | 1987-12-01 | General Electric Company | System and method for the display of surface structures contained within the interior region of a solid body |
| US4751643A (en) * | 1986-08-04 | 1988-06-14 | General Electric Company | Method and apparatus for determining connected substructures within a body |
-
1987
- 1987-11-25 US US07/125,510 patent/US4885688A/en not_active Expired - Fee Related
-
1988
- 1988-10-07 IL IL87963A patent/IL87963A/xx not_active IP Right Cessation
- 1988-11-03 CA CA000582160A patent/CA1315902C/en not_active Expired - Fee Related
- 1988-11-11 JP JP63284087A patent/JPH02899A/ja active Pending
- 1988-11-24 EP EP19880311144 patent/EP0318292A3/de not_active Withdrawn
Patent Citations (2)
| Publication number | Priority date | Publication date | Assignee | Title |
|---|---|---|---|---|
| EP0182237A2 (de) * | 1984-11-19 | 1986-05-28 | General Electric Company | Verfahren und Mittel zur räumlichen Eigenschaftsveränderung eines digitalen Bildes |
| EP0216156A2 (de) * | 1985-08-28 | 1987-04-01 | General Electric Company | Kubusteilungssystem und Verfahren zur Anzeige von im Innengebiet eines massiven Körpers enthaltenen Flächenstrukturen |
Cited By (2)
| Publication number | Priority date | Publication date | Assignee | Title |
|---|---|---|---|---|
| EP0476409A2 (de) * | 1990-09-04 | 1992-03-25 | Kabushiki Kaisha Toshiba | Bildanzeigevorrichtung |
| EP0476409A3 (en) * | 1990-09-04 | 1992-12-09 | Kabushiki Kaisha Toshiba | Image display apparatus |
Also Published As
| Publication number | Publication date |
|---|---|
| JPH02899A (ja) | 1990-01-05 |
| CA1315902C (en) | 1993-04-06 |
| US4885688A (en) | 1989-12-05 |
| IL87963A0 (en) | 1989-03-31 |
| IL87963A (en) | 1992-03-29 |
| EP0318292A3 (de) | 1991-02-06 |
Similar Documents
| Publication | Publication Date | Title |
|---|---|---|
| US4885688A (en) | Minimization of directed points generated in three-dimensional dividing cubes method | |
| EP0365141B1 (de) | System und Verfahren zur Anzeige von windschiefen Schnittebenen im Innern eines massiven Körpers | |
| US4989142A (en) | Three-dimensional images obtained from tomographic slices with gantry tilt | |
| US4914589A (en) | Three-dimensional images obtained from tomographic data using a variable threshold | |
| US4985834A (en) | System and method employing pipelined parallel circuit architecture for displaying surface structures of the interior region of a solid body | |
| US4831528A (en) | Apparatus and method for improvement of 3D images derived from tomographic data | |
| EP0412748B1 (de) | Verfahren und Geräte zur dreidimensionalen Bilderzeugung | |
| EP0318176B1 (de) | Bildverarbeitungsverfahren und -gerät | |
| US4821213A (en) | System for the simultaneous display of two or more internal surfaces within a solid object | |
| US4719585A (en) | Dividing cubes system and method for the display of surface structures contained within the interior region of a solid body | |
| US4729098A (en) | System and method employing nonlinear interpolation for the display of surface structures contained within the interior region of a solid body | |
| US4953087A (en) | Three-dimensional images obtained from tomographic data having unequally spaced slices | |
| EP0204225B1 (de) | Anlage und Verfahren zur Anzeige von im Inneren eines Festkörpers eingeschlossenen Oberflächenstrukturen | |
| EP0318293B1 (de) | Vorrichtung und Verfahren zur tomographischen Datenverarbeitung | |
| US6876361B2 (en) | Architecture for real-time texture look up's for volume rendering | |
| EP0318291B1 (de) | Vorrichting und Verfahren zur Erzeugung von Bilder aus tomographischen Daten | |
| EP0373854B1 (de) | Vorrichtung und Verfahren zur Ermittlung von inneren Strukturen innerhalb eines festen Objekts | |
| JP2519779B2 (ja) | 3次元画像表示装置 |
Legal Events
| Date | Code | Title | Description |
|---|---|---|---|
| PUAI | Public reference made under article 153(3) epc to a published international application that has entered the european phase |
Free format text: ORIGINAL CODE: 0009012 |
|
| AK | Designated contracting states |
Kind code of ref document: A2 Designated state(s): DE FR GB NL |
|
| PUAL | Search report despatched |
Free format text: ORIGINAL CODE: 0009013 |
|
| AK | Designated contracting states |
Kind code of ref document: A3 Designated state(s): DE FR GB NL |
|
| 17P | Request for examination filed |
Effective date: 19910715 |
|
| 17Q | First examination report despatched |
Effective date: 19921207 |
|
| STAA | Information on the status of an ep patent application or granted ep patent |
Free format text: STATUS: THE APPLICATION IS DEEMED TO BE WITHDRAWN |
|
| 18D | Application deemed to be withdrawn |
Effective date: 19930618 |