EP0240974A2 - Injection control system of flocculating agent - Google Patents
Injection control system of flocculating agent Download PDFInfo
- Publication number
- EP0240974A2 EP0240974A2 EP87105076A EP87105076A EP0240974A2 EP 0240974 A2 EP0240974 A2 EP 0240974A2 EP 87105076 A EP87105076 A EP 87105076A EP 87105076 A EP87105076 A EP 87105076A EP 0240974 A2 EP0240974 A2 EP 0240974A2
- Authority
- EP
- European Patent Office
- Prior art keywords
- floc
- flocs
- image
- basis
- luminance
- Prior art date
- Legal status (The legal status is an assumption and is not a legal conclusion. Google has not performed a legal analysis and makes no representation as to the accuracy of the status listed.)
- Granted
Links
Images


Classifications
-
- C—CHEMISTRY; METALLURGY
- C02—TREATMENT OF WATER, WASTE WATER, SEWAGE, OR SLUDGE
- C02F—TREATMENT OF WATER, WASTE WATER, SEWAGE, OR SLUDGE
- C02F1/00—Treatment of water, waste water, or sewage
- C02F1/68—Treatment of water, waste water, or sewage by addition of specified substances, e.g. trace elements, for ameliorating potable water
- C02F1/685—Devices for dosing the additives
-
- C—CHEMISTRY; METALLURGY
- C02—TREATMENT OF WATER, WASTE WATER, SEWAGE, OR SLUDGE
- C02F—TREATMENT OF WATER, WASTE WATER, SEWAGE, OR SLUDGE
- C02F1/00—Treatment of water, waste water, or sewage
- C02F1/52—Treatment of water, waste water, or sewage by flocculation or precipitation of suspended impurities
- C02F1/5281—Installations for water purification using chemical agents
Definitions
- the present invention relates to an injection control system of a flocculating agent for forming flocs by flocculating a suspended substance in a water purifying plant, sewage treatment plant, and industrial sewer treatment plant and, more particularly, to a system for highly accurately recognizing an image of flocs to thereby accurately control the injection thereof.
- a flocculating agent is added into the collected raw water, a suspended substance is flocculated, a coagulated matter (hereinafter, referred to as flocs) is formed, and these flocs are precipitated and removed.
- flocs a coagulated matter
- the raw water is led into the floc forming pool and slowly stirred, thereby forming flocs.
- the raw water drains out of the floc forming pool and is led into the precipitation pool.
- the flocs are precipitated in this pool to thereby remove the suspended substance.
- the particulates which were not precipitated in the precipitation pool are removed in the filter bed.
- an injection amount of the flocculating agent is controlled to preferably form flocs. Hitherto, as disclosed in JP-B 59-298281, for example, the injection amount of the flocculating agent is controlled on the basis of the turbidity of the raw water and the diameter and surface area of the suspended substance.
- the formation of flocs is influenced by the temperature, turbidity, diameter, pH, alkalinity, and the like, so that flocs cannot be always preferably formed.
- the flocculating agent is injected without directly measuring the floc forming state, the floc formation cannot be always preferably maintained.
- the idea such that flocs are recognized as images is well known.
- the portion of the floc image which is brighter than the threshold value is regarded as a floc.
- the portion which is darker than the threshold value is regarded as a background.
- the binarization if performed.
- the bright floc can be binarized even if the threshold value is set to a high value
- the dark floc is regarded as a background because ifs brightness is below the threshold value.
- the threshold value is set to a low value
- the dark floc can be also binarized, the noise existing in the background is also binarized as a flock.
- the threshold value when the threshold value is set to a low value, the background portion around the bright floc is regarded as a part of the floc.
- this floc is binarized larger than the actual size or separate flocs existing closely are binarized as one floc.
- the conventional technique has a problem such that the floc cannot be accurately binarized.
- the floc diameter distribution in the floc forming pool is adapted to the log-normal distribution.
- the log-normal distribution is expressed as two variables of a mean value and a standard deviation.
- the standard deviation was constant to a change in injection amount of the flocculating agent, but the means value increased with an increase in injection amount of the flocculating agent.
- the formation of flocs can be controlled by operating the injection amount of the flocculating agent using the mean value of the log-normal distribution as an index.
- Another object of the invention is to provide an image recognizing system of flocs in which flocs and the background can be clearly distinguished and recognized and the flocs can be accurately detected.
- the brightness of the background portion is set to a value near the "0" level and at the same time, the luminance gradient of the portion whose brightness changes is emphasized, thereby enabling the boundary between the light and dark portions to be clarified. Accordingly, by further brightening the brightness of the small dark floc, the floc can be more easily recognized and at the same time, the boundary between the large floc and the background can be clarified.
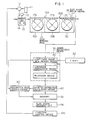
- Fig. 1 shows an embodiment of the present invention.
- the raw water flows into a high speed admixture pool 10.
- a liquid high molecular coagulant polyaluminum chloride
- an inorganic coagulant such as aluminum sulfate, or the like stored in a flocculating agent tank 11 is injected by a flocculating agent injection pump 12.
- an alkali agent such as calcium hydroxide, sodium carbonate, or the like is also injected in order to promote the formation of flocs.
- the raw water in the admixture pool 10 is stirred by a stirring wing 14.
- the stirring wing 14 is driven by a stirrer 13.
- the water injected with the flocculating agent and stirred is led into a flocculating pool (hereinafter, referred to as "floc forming pool") 15.
- the floc forming pool 15 is constituted by three pools 15A, 15B and 15C which are partitioned by flow adjusting walls 16A and 16B having a plurality of holes.
- Stirring paddles 17A, 17B and 17C are provided in the pools 15A, 15B, and 15C, respectively.
- a floc image pickup means 18 such as an underwater camera or the like is attached in the pool 15C on the last downstream side of the floc forming pool 15.
- the light/dark image signal (analog signal) of the flocs photographed by the floc image pickup means 18 is input to image recognizing means 30.
- the image pickup means 18 may be also attached in the first pool 15A without being limited to the last pool 15C.
- the image recognizing means 30 comprises: a timer 35 to instruct the image process on a predetermined time unit basis; light/dark image memory means 40; luminance emphasizing means 60; and binarizing means 70.
- the floc image pickup means 18 will be explained in detail hereinafter.
- the image signal binarized by the binarizing means 70 is input to diameter distribution calculating means 80.
- the calculating means 80 calculates a diameter distribution of the flocs on the basis of the binarized image signal and stores the result of the calculation into a volume concentration distribution memory 92.
- Recognition end deciding means 90 discriminates whether the number of recognized floc images has reached a predetermined value or not. When the number of recognized floc images is below the predetermined value, the deciding means 90 instructs the image memory means 40 so as to store the light/dark images photographed by the image pickup means 18. If the deciding means 90 determines that the number of recognized images has reached the predetermined value (e.g., ten), the volume concentration distribution stored in the memory 92 is input to a flocculation state deciding circuit 94.
- the deciding circuit 94 obtains the geometric means diameter of the flocs from the volume concentration distribution and adds to an injection control device 100.
- the injection control device 100 obtains the injection amount of the flocculating agent on the basis of the geometric mean diameter and controls the injection pump 12.
- Fig. 2 shows a constitution of an example of the image recognizing means.
- the light/dark image memory means 40 consists of an A/D converter 41 and a light/dark original image memory 42.
- the A/D converter 41 converts the analog light/dark image data obtained from the image pickup means 18 into the digital value and stores into the memory 42.
- the memory 42 stores the original image signal in response to storage commands from the timer 35 and deciding means 90.
- the memory 42 transfers the floc light/dark image data stored to a spatial filtering circuit 61.
- the luminance emphasizing means 60 comprises the spatial filtering circuit 61 and a filtering light/dark image memory 62.
- the spatial filtering circuit 61 executes the arithmetic operation of the spatial filtering and stores the result into the memory 62.
- the stored filtering light/dark image is input to a binarizing circuit 71.
- the binarizing means 70 consists of the binarizing circuit 71 and a binarization memory 72. when the binarizing circuit 71 receives the filtering light/dark image from the memory 62, it binarizes this image and stores the result of the binarization into the binarization memory 72.
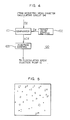
- Fig. 3 shows a constitution of an example of the diameter distribution calculating means 80.
- a labeling circuit 81 receives an image signal B from the binarization memory 72 and adds the number to each floc.
- An area calculating circuit 82 calculates the area of each floc every number and stores the result of the calculation into an area memory 82M.
- a diameter calculating circuit 84 calculates the diameter from the area of the floc and stores the result of the calculation into a diameter memory 84M.
- a volume calculating circuit 86 calculates the volume of each floc and stores the result of the calculation into a volume memory 86M.
- a diameter distribution calculating circuit 88 receives the floc diameters from the volume memory 86M, calculates the diameter distribution of the flocs, and stores into a diameter distribution memory 88M.
- a volume concentration distribution calculating circuit 89 calculates the volume concentration distribution from the values stored in the diameter distribution memory 88M. After completion of the calculation, the calculating circuit 89 supplies the end signal to the recognition end deciding means 90 and also stores the calculated volume concentration distribution into the volume concentration distribution memory 92.
- Fig. 4 shows a constitution of an example of the injection control device 100.
- the control device 100 comprises a comparator 101, a target value setting device 102, and an injection control circuit 103.
- the raw water is led from the river, lake, or marsh (not shown) into the sand precipitated pond (not shown) and the sands and large particles are precipitated and removed from the raw water in this pond. Thereafter, the raw water flows into the high speed admixture pool 10.
- the particulates having diameters of about 1 to 10 ⁇ m are contained in the raw water flowing into the pool 10 so as to have a concentration of 2 to 200 mg/l.
- a high molecular coagulant (polyaluminum chloride) or an inorganic coagulant such as aluminum sulfate or the like stored in the flocculating agent tank 11 is supplied into the raw water in the pool 10 by the injection pump 12.
- the raw water in the pool 10 is stirred by the stirring wing 14, so that the flocculating agent is dispersed into the raw water.
- the suspended particulates are the negative colloid such that the surface of each particulate is negatively charged. Numberless suspended particulates are mutually coupled (flocculated) by the flocculating agent having the positive charges.
- the residence time in the pool 10 is one to five minutes. The suspended particulates are flocculated for this residence time, so that microflocs (nuclei of flocs) having diameters of 10 to 100 ⁇ m are formed.
- the mixture liquid containing the microflocs is led into the floc forming pool 15 and sequentially flows through the three pools 15A, 15B, and 15C.
- the flow adjusting walls 16A and 16B prevent that the mixture liquid flows out from the outlet by shortcircuiting the regions near the water surface without being sufficiently mixed in the floc forming pool 15.
- Each residence time of the pools 15A to 15C is 5 to 15 minutes (the total residence time is 15 to 45 minutes).
- the raw waters in the pools 15A to 15C are slowly stirred by the stirring paddles 17A to 17C.
- a sufficient amount of flocculating agent is supplied into the pool 10, so that the flocculating agent is adhered onto the surface of each microfloc. Therefore, the microflocs in the floc forming pool 15 collide or are come into contact with each other by the stirring and are flocculated.
- the state of flocs in the pool 15C is photographed by the floc image pickup means 18.
- the light/dark image signal of the flocs obtained from the image pickup means 18 is input to the A/D converter 41 of the image recognizing means 30.
- the A/D converter 41 always converts the light/dark image signal into the digital signal and input to the memory 42. If the A/D converter 41 converts the analog image signal into the digital signal of seven bits, the luminance of each pixel is digitized into 128 levels.
- the light/dark image data stored in the memory 42 is supplied to the spatial filtering circuit 61.
- the circuit 61 receives the image signal from the memory 42 and emphasizes the luminance gradient between the flocs and the background.
- the result of the calculation of the spatial filtering circuit 61 is stored into the memory 62.
- the luminance g*(i,j) can be expressed by the following equation.
- S is a scaling coefficient and is selected such that the result of the calculation does not become a value above, e.g., 128.
- k and l are symbols to change the elements of the array.
- the pixel having the luminance above the threshold value L t is recognized as a pixel corresponding to the floc and is set to the "1" level.
- the portion having the luminance lower than the threshold value L t is recognized as a pixel other than the floc and is set to the "0" level. Consequently, a set of pixels which are represented by the "1" level are recognized as flocs.
- this image B is stored into the binarization memory 72.
- the image B is input to the diameter distribution calculating means 80 as shown in Fig. 1 and the floc diameter distribution is calculated.
- the calculating means 80 obtains the diameter distribution in the following manner.
- the labeling circuit 81 adds the number to each of the flocs existing in the image B such as 1, 2, 3, ..., m (m denotes the total number of flocs).
- the area calculating circuit 82 calculates the areas of flocs every labeled number by the following equation.
- A k1 ⁇ A p . (4)
- A is a projection area (the unit is mm2) of the floc
- a p is the number of pixels of each floc (the unit is pixel)
- the k1 is a conversion constant (the unit is mm2/pixel).
- "pixel” is the unit indicative of the pixel.
- the calculation of the equation (4) is executed with respect to each floc numbered by the labeling circuit 81. The result is stored into the area memory 82M.
- the diameter calculating circuit 84 calculates the diameter d of each floc by the following equation by assuming a circle having the same area as that of the floc.
- the diameter d is calculated with regard to each area and the result is stored into the diameter memory 84M.
- the result of the calculation of the volume for the diameter is stored into the volume memory 86M.
- the diameter distribution calculating circuit 88 receives the volume v of each floc from the volume memory 86M and determines to which grade the diameter of each floc belongs. Then, the calculating circuit 88 adds the volume of each floc into the relevant storage area in the diameter distribution memory 88M. Assuming that the grade width of the diameter is 0.1 mm, the grade is divided into, e.g., the following fifty-one grades. Therefore, the memory 88M aso has 51 storage areas. D1 : 0 to 0.1 mm D2 : 0.1 to 0.2 mm D3 : 0.2 to 0.3 m . . . . D50 : 4.9 to 5.0 mm D51 : 5.0 mm ---
- the volume is 0.00818 mm3 from the equation (6).
- the volume data of 0.00818 is stored into the storage area corresponding to the diameter D3 of the diameter distribution memory 88M. While the grade of the diameter of each floc is determined, the results of the decisions are sequentially added into the respective areas in the memory 88M, thereby obtaining the diameter distribution of the flocs.
- the volume concentration distribution calculating circuit 89 calculates the volume concentration distribution V i ⁇ of the flocs (the distribution indicative of the volume V i of the floc having the diameter D i in the unit volume) on the basis of the volume value V i stored in the memory 88M in accordance with the following equation.
- V i ⁇ V i /(N ⁇ V w ) / (7)
- N denotes the number of recognition times (the number of processing images)
- V w represents the volume photographed in one picture plane.
- Fig. 6 shows an example of the resultant volume concentration distribution (axis of ordinate shows the diameter D i and an axis of abscissa denotes the volume concentration V i ⁇ ).
- volume concentration distribution is calculated every recognition picture plane.
- the calculation of the equation (7) may be also executed after completion of the recognition of a predetermined number of times.
- the flocculation state deciding circuit 94 calculates the geometric mean diameter D l of the floc diameter distribution from the values in the memory 92 on the basis of the following equation.
- the geometric mean diameter D l obtained by the deciding circuit 94 is input to the injection control device 100.
- the geometric mean diameter D l output from the deciding circuit 94 is input to the comparator 101.
- the injection control circuit 103 operates the injection pump 12 on the basis of the deviation ⁇ D l and controls the injection amount of the flocculating agent. Practically speaking, when the deviation ⁇ D l has a negative value, the injection amount of the flocculating agent is increased. On the contrary, when the deviation ⁇ D l has a positive value, the injection amount of the flocculating agent is decreased. There is such a characteristic relation as shown in Fig. 7 between the geometric means diameter D l and the injection amount P of the flocculating agent. The abnormal injection of the flocculating agent is prevented by setting the maximum injection amount P max and the minimum injection amount P min for the injection amount of the flocculating agent.
- the injection amount of the flocculating agent is controlled.
- the flocs can be preferably formed. The reason why the floc formation can be desirably executed will now be explained hereinbelow with reference to Figs. 8 and 9.
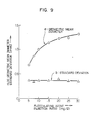
- Fig. 8 shows a characteristic diagram based on the actual measured values of a change in floc volume concentration distribution in association with a change in injection ratio of the flocculating agent.
- Fig. 8 shows the actual measured values of the floc volume concentration distribution when the flocculating agent injection ratio was changed from 5 mg/l to 30 mg/l.
- the diameter and the distribution peak also increase. This means that a large quantity of large flocs were formed with an increase in injection ratio.
- the change in floc volume concentration distribution to the change in flocculating agent injection ratio was actually measured. Practically speaking, the geometric mean diameter and the standard deviation were calculated from the actual measured values shown in Fig. 8. Then, the geometric means diameter and the standard deviation to the change in injection ratio were obtained. The results are as shown in Fig. 9.
- the standard deviation shown as a characteristic b in Fig. 9 represents the index indicative of the degree of extent of the distribution.
- the geometric mean diameter of the characteristic a increases with an increase in injection ratio, but the standard deviation of the characteristic b is constant. Therefore, by changing the flocculating agent injection ratio, only the geometric mean diameter is varied. Accordingly, by measuring the geometric mean diameter by an image and changing the flocculating agent injection ratio such that the value of the measured geometric mean diameter becomes the target value as in the present invention, the flocs can be always certainly formed.
- the flocs can be also recognized by clearly distinguishing the flocs from the background.
- the diameter distribution of the flocs is measured by recognizing the image of flocs and the geometric mean diameter is derived.
- the increase or decrease of the injection amount of the flocculating agent is controlled in accordance with the geometric mean diameter. Therefore, since the flocculating agent injection amount is controlled while directly discriminating the state of the actual floc formation, the flocs can be certainly stably formed.
- the present invention can be applied to the flocculating agent injection control in the flocculating process in a plant other than the water purifying plant.
- the invention in the sewage treatment plant, can be also applied to the process to improve the precipitation efficiency be injecting the flocculating agent into the active sludge, the refining process in the sludge process by injecting the flocculating agent, the pelletizing process of dust coal, and the like.
- the picture plane consists of 256 pixels of eight bits in each of the lateral and vertical directions.
- the luminance g0(i,j) of each pixel is digitized into 128 levels.
- the light/dark image data stored in the memory 42 is supplied to the spatial filtering circuit 61.
- the spatial filtering circuit 61 receives the image signal from the memory 42 and emphasizes the luminance gradient between the flocs and the background. The result of the calculation of the spatial filtering circuit 61 is stored into the memory 62.
- the memory 62 has the storage areas as many as the pixels of 256 x 256.
- a local image area which is subjected to the spatial filtering process is an area of n x n consisting of n pixels in each of the horizontal and vertical directions.
- Fig. 11 shows a local image area of 3 x 3.
- a load coefficient matrix of the spatial filtering is similarly defined by the area of n x n consisting of n pixels in each of the X and Y directions.
- the load coefficient matrix is the matrix of 3 x 3.
- the load product sum matrix (load coefficient matrix) of this spatial filtering is F.
- Fig. 12 shows a load product sum matrix F of 3 x 3.
- the luminances g0(i,j) of each pixel of the light/dark image and the load product sum matrices f(i,j) of the spatial filtering are respectively multiplied and all of the results of the multiplications are further added, thereby calculating the spatial filtering.
- the result g*(2,2) of the calculation of the spatial filtering is stored into the area in the memory 62 corresponding to the central pixel.
- g*(2, 2) [g0(1, 1) x f(1, 1) +g0(1, 2) x f(1, 2) +g0(1, 3) x f(1, 3) +g0(2, 1) x f(2, 1) +g0(2, 2) x f(2, 2) +g0(2, 3) x f(2, 3) +g0(3, 1) x f(3, 1) +g0(3, 2) x f(3, 2) +g0(3, 3) x f(3, 3)]/S Jerusalem (10)
- S is a coefficient of the scaling.
- the coefficient S is set to a value within 127 such that the result of the calculation does not become a value above 128.
- Equation (10) will be summarized by the following equation. where, k and l are symbols to change the array elements.
- the value of g*(2,3) which is adjacent by only one pixel is then calculated as shown in Fig. 13.
- the local image area of 3 x 3 such that the value g0(2,3) is located at the center is calculated.
- g*(2,3) is calculated.
- the calculation is executed in the column (horizontal) direction while sequentially shifting one pixel by one.
- the similar calculations are also subsequently executed with respect to the second row.
- the calculating equation of the pixels of the ith row and the jth column is as follows.
- ⁇ g*(i, j) [g0(i-1, j-1) x f(1, 1) +g0(i-1, j) x f(1, 2) +g0(i-1, j+1) x f(1, 3) +g0(i, j-1) x f(2, 1) +g0(i, j) x f(2, 2) +g0(i, j+1) x f(2, 3) +g0(i+1, j-1) x f(3, 1) +g0(i+1, j) x f(3, 2) +g0(i+1, j+1) x f(3, 3)]/S ; (12)
- the spatial filtering circuit 61 calculates the equations (10) and (12).
- the luminances as the results of the calculations are stored into the memory 62.
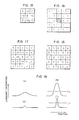
- the operation of this example will now be explained with respect to the case of a light/dark image whose luminance g0(i,j) is as shown in Fig. 16.
- a square block in Fig. 16 represents a pixel and the numerical value written in the block indicates the luminance of the pixel.
- Fig. 16 shows the state in which there is a floc having the luminance 3 and the size of one pixel in the background of the luminance 1.
- the luminance difference between the background and the floc is equal to two levels.
- the equation (12) is calculated using the load product sum matrix F shown in Fig. 15 for the image of Fig. 16, the result of the calculation will be as shown in Fig. 17.
- S is set to 1 and the values of the luminances of the pixels indicated by u and arranged in the peripheral portion in Fig. 17 cannot be calculated; therefore, the value of u is set to 0.
- the spatial filtering circuit 61 executes the calculation as described above and the luminance as the result of the calculation is stored into the image memory 62.
- the light/dark image signal whose luminance gradient was emphasized by the spatial filtering process as explained above is input to the binarizing circuit 71.
- the binarizing circuit 71 receives the filtering light/dark image g*(i,j) stored in the memory 62 and binarizes this image. Namely, assuming that the binarization threshold value is L t , when the luminance value of the pixel is above L t , this pixel is set to the "1" level. On the contrary, if it is lower than L t , this pixel is set to the "0" level.
- the binarized signal having either the "0" level or the "1" level assumes b(i,j).
- Fig. 18 shows the result of the binarization of the luminance values of Fig. 17 when the threshold value L t is set to 2.
- the image B is stored into the binarization memory 72.
- the image B is input to the diameter distribution calculating means 80 as shown in Fig. 1 and the floc diameter distribution is calculated.
- the diameter distribution calculating means 80 obtains the diameter distribution in the following manner.
- the luminance values are binarized. Therefore, the flocs can be recognized by clearly distinguishing the flocs from the background. This point will be practically explained hereinbelow with reference to Fig. 19.
- Fig. 19(A) shows a luminance distribution in one-dimensional direction of a large floc in the case of the luminance g0(i,j) of a light/dark image.
- the luminance g*(i,j) which is derived after such a bright floc image was subjected to the spatial filtering increases, namely, the floc further becomes bright since the luminance gradient between the floc and the background is emphasized as shown in Fig. 19(B).
- the luminance of the floc is also similarly emphasized as shown in Fig. 19(D). Therefore, by binarizing the luminance values on the basis of the threshold value L t as shown in Figs. 19(B) and 19(D), the floc can be binarized irrespective of the size of floc.
- the load product sum matrix is set such that the sum of load product sum coefficients becomes 0
- the luminance of the background having a gentle luminance gradient can be set to 0.
- the luminance of the background changes in dependence on the intensity of illumination, its luminance level is always set to 0 by the spatial filtering, so that the contrast between the floc and the background can be effectively emphasized.
- this operation does not change even if the intensity of the illumination varies. Therefore, even if the intensity of illumination is gradually weakened due to the measurement for a long time, the floc can be stably recognized without being influenced by the reduction of the illumination.
- the luminances of the flocs are emphasized by the spatial filtering.
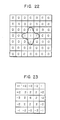
- the light/dark image after completion of the filtering process shown in Fig. 21 is binarized on the basis of the threshold value of 2, the result will be as shown in Fig. 22.
- Fig. 24(A) shows an exmaple in which there is a flat luminance peak in the luminance distribution in one-dimensional direction of the floc. Since the luminance change is small in the case of such a peak, when the spatial filtering is executed using the load product sum matrix F shown in Fig. 15, the luminance of the peak becomes 0 as shown in Fig. 25(B). However, when the spatial filtering is performed using the load product sum matrix shown in Fig. 23, the peak portion does not become 0 but is emphasized as shown in Fig. 26(C). Therefore, the binarization can be effectively performed using the emphasized portion as a floc.
- Fig. 25(A) shows a luminance distribution in one-dimensional direction of the noise of a one-pixel unit which is caused in the image pickup camera.
- the luminance of the noise is emphasized as shown in Fig. 25(B).
- the luminance of the noise of one pixel is also emphasized since only the value of the central pixel is positive.
- the luminance can be set to 0 as shown in Fig. 25(C). Namely, the influence by the noise can be eliminated.
- Fig. 26(A) shows the case where a small floc exists in the noise.
- Fig. 26(B) shows the result of the process using the load product sum matrix shown in Fig. 15.
- Fig. 26(C) shows the result of the process using the load product sum matrix shown in Fig. 23.
- the noise can be eliminated and at the same time, the luminance of the small floc can be emphasized.
- the luminance of floc (the luminance of the central pixel is high and the luminances of the pixels around the central pixel are low) can be effectively emphasized.
- a load product sum matrix of n of 5 or more is used, the similar effect can be also derived.
- the luminance of floc is emphasized by the spatial filtering and the luminances of the background are uniformed, thereby clarifying the boundary between the flocs and the background.
- the luminance of the noise other than the flocs can be relatively suppressed. Therefore, only the luminance of the floc can be selectively emphasized without being influenced by a gentle change in luminance of the background due to a fluctuation, a time-dependent change, or the like of the illumination and further by the noise of the image pickup system.
- the floc is recognized by the binarization as described above. Therefore, the floc image can be accurately recognized.
- the present invention can be applied to the image recognition of flocculated particles and particle-shaped matters other than the flocs in the water purifying plant.
- the invention can be applied to the image measurement of active sludge flocs in the sewage treatment plant, the diameter measurement of immobilized particles which are formed by immobilizing microorganisms so as to become particles by use of an immobilizing agent such as sodium alginate or the like, the measurement of agglutinated matters in the immunoreaction, or the like.
- the invention can be also applied to the measurement of any powder such as dust coal, flour, and the like.
- a turbidity signal T u obtained from a turbidimeter 5 is input to the target value setting device 102.
- a control target value D* l of the floc diameter is determined as shown in a graph of Fig. 27A on the basis of the value of T u . Namely, the control target value D* l of the floc diameter is increased as the turbidity T u rises.
- the control target value D* l of the floc diameter is determined for the turbidity on the basis of such a characteristic as shown in Fig. 27A.
- the comparator 101 obtains the deviation ⁇ D l between the calculated value D l and the target value D* l of the geometric mean diameter which is set by the target value setting device 102 in accordance with the following equation.
- ⁇ D l D l - D* l . (9)
- the injection control circuit 103 operates the injection pump 12 on the basis of the deviation ⁇ D l , thereby controlling an injection amount of the flocculating agent. Practically speaking, when the deviation ⁇ D l has a negative value, the injection amount is increased. On the contrary, when it has a positive value, the injection amount is decreased. There is such a characteristic relation as shown in Fig. 8 between the geometric mean diameter D l and the flocculating agent injection amount P. The abnormal injection is prevented by setting the maximum injection amount P max and the minimum injection amount P min for the flocculating agent injection amount.
- the injection of the flocculating agent is controlled as described above. Since the flocculating agent injection amount is controlled by changing the control target value of the diameter of floc in accordance with the degree of the turbidity of the raw water, flocs can be preferably formed. Thus, the turbidity of the precipitation pool can be stably maintained to a value below a predetermined value.
- the flocs can be also recognized by clearly distinguishing the flocs from the background.
- the injection amount of the flocculating agent is controlled on the basis of the turbidity T u of the raw water and the number m of flocs.
- the floc number concentration may be used as the number of flocs.
- the number m of flocs is input to the injection control device 100 in Fig. 1 from the labeling circuit 81 of the diameter distribution calculating means 80.
- the turbidity signal T u from the turbidimeter 5 is input to the injection control device 100.
- the flocculating agent injection amount is controlled on the basis of those values.
- Fig. 27B shows a constitution of the injection control device 100.
- the number m of flocs is input to a comparator 101A.
- the turbidity value T u measured by the turbidimeter 5 is input to a target value setting circuit 102A.
- the setting circuit 102A determines a target value m* of the floc number m on the basis of the turbidity value T u as shown in a graph of Fig. 28. Namely, when the turbidity value T u is high, there is such a tendency that the number of flocs increases; therefore, the floc number target value m* is increased as the turbidity value T u rises.
- the flocculating agent is injected such that the flocs as many as the high turbidity are formed.
- the floc number target value m* which is set by the target value setting circuit 102A is input to the comparator 101A.
- the measured value m indicative of the actual number of flocs is also input to the comparator 101A.
- An injection control circuit 103A receives the deviation ⁇ m and controls the injection amount of the flocculating agent in the following manner.
- the value of ⁇ m is positive, the measured value m of the floc number is larger than the target value m*; therefore, this means that the flocculating agent injected is too much. In this case, the injection amount is reduced.
- the value of ⁇ m is negative, m is smaller than m*. Therefore, the injection amount is increased, thereby allowing a number of flocs to be formed. By increasing the injection amount of the flocculating agent, a more number of flocs are formed.
- the flocs can be always preferably formed irrespective of the turbidity of the raw water, the turbidity at the outlet of the precipitation pool can be stably maintained to a value below a predetermined value.
- a large effect can be also derived by measuring the turbidity at the outlet of the precipitation pool and by further increasing the flocculating agent injection amount when the turbidity at the outlet exceeds a predetermined value in order to enhance the safety.
- detection signals of an alkalinity measuring instrument 6 and a pH measuring instrument 7 as shown in Fig. 31 are input to the injection control device 100, thereby controlling the target value of the floc number and the geometric mean diameter.
- Fig. 28 is a graph showing the results of the measurement of the suspended matter concentration (i.e., turbidity) T u of the raw water and of the number of flocs when the injection amount of the flocculating agent was properly maintained. It will be understood from Fig. 28 that the number of flocs increases as the concentration T u rises and there is a correlation therebetween.
- Fig. 29 shows a change in number of flocs to a change in alkalinity when the flocculating agent injection amount and the suspended matter concentration T u were maintained constant.
- Fig. 30 shows the result of the measurement of the number of flocs when the other water quality condition and the injection amount were maintained to values within special ranges and pH was changed. It will be understood from this graph that the number of flocs also varies by a change in pH. It will be understood from those results that although the number of flocs formed increases as the concentration T u of the suspended matters of the inflow raw water rises, but the increases in alkalinity and pH function as restrainers.
- Fig. 31 shows a constitutional diagram of an example of the injection control device 100.
- the concentration T u of the suspended matters detected by the turbidity detecting means 5 is input to a calculating circuit 111.
- the optimum value m* of the number of flocs is calculated for the turbidity T u and output to a target value calculating circuit 118.
- the floc number optimum value m* is calculated when the alkalinity is set to a reference value Al* and the pH is set to a reference value pH*.
- the alkalinity Al detected by the alkalinity detecting means 6 is input to a comparator 112 and compared with the reference alkalinity value Al* which is preset by a setting circuit 113.
- the deviation ⁇ Al is output to a calculating circuit 114.
- the calculating circuit 114 calculates a correction amount ⁇ M a of the number of flocs corresponding to the deviation ⁇ Al of the alkalinity and outputs to the target value calculating circuit 118.
- the pH detected by the pH detecting means 7 is input to a comparator 115 and compared with the pH reference value pH* which is preset by a setting circuit 116.
- the deviation ⁇ pH is output to a calculating circuit 117.
- a correction amount ⁇ M p of the number of flocs corresponding to the deviation ⁇ pH of the pH is calculated in the calculating circuit 117 and output to the target value calculating circuit 118.
- the calculating circuit 118 calculates the target value M* of the number of flocs on the basis of the floc number optimum value m* and the correction amounts ⁇ M a and ⁇ M p and inputs to an injection control circuit 119.
- the injection control circuit 119 operates the flocculating agent injection pump 12, thereby increasing or decreasing the injection amount of the flocculating agent.
- An electric conductivity measuring instrument may be also used in place of the alkalinity measuring instrument.
- the volume of floc can be also used as a parameter indicative of the floc formation state.
- the flocculating agent is injected in accordance with the water quality and the floc formation state, so that the flocs can be preferably formed.
Landscapes
- Chemical & Material Sciences (AREA)
- Environmental & Geological Engineering (AREA)
- Life Sciences & Earth Sciences (AREA)
- Hydrology & Water Resources (AREA)
- Engineering & Computer Science (AREA)
- Water Supply & Treatment (AREA)
- Organic Chemistry (AREA)
- General Chemical & Material Sciences (AREA)
- Chemical Kinetics & Catalysis (AREA)
- Health & Medical Sciences (AREA)
- Medicinal Chemistry (AREA)
- Separation Of Suspended Particles By Flocculating Agents (AREA)
- Investigating Or Analysing Materials By Optical Means (AREA)
- Investigating Materials By The Use Of Optical Means Adapted For Particular Applications (AREA)
Abstract
Description
- The present invention relates to an injection control system of a flocculating agent for forming flocs by flocculating a suspended substance in a water purifying plant, sewage treatment plant, and industrial sewer treatment plant and, more particularly, to a system for highly accurately recognizing an image of flocs to thereby accurately control the injection thereof.
- In the water purifying plant, a flocculating agent is added into the collected raw water, a suspended substance is flocculated, a coagulated matter (hereinafter, referred to as flocs) is formed, and these flocs are precipitated and removed. Practically speaking, after the flocculating agent was injected into the high speed admixture pool, the raw water is led into the floc forming pool and slowly stirred, thereby forming flocs. The raw water drains out of the floc forming pool and is led into the precipitation pool. The flocs are precipitated in this pool to thereby remove the suspended substance. The particulates which were not precipitated in the precipitation pool are removed in the filter bed.
- In execution of the water treatment as mentioned above, it no floc is formed in the floc forming pool, the filter bed will be sooner or later choked. It is known that an injection amount of the flocculating agent is controlled to preferably form flocs. Hitherto, as disclosed in JP-B 59-298281, for example, the injection amount of the flocculating agent is controlled on the basis of the turbidity of the raw water and the diameter and surface area of the suspended substance.
- On the other hand, for example, as shown in JP-A-54-143296, a method whereby the shape and size of floc are monitored by the image processes has been proposed. Practically speaking, on the basis of the floc image photographed by an industrial camera or the like, the portion (pixel) which is brighter than a predetermined brightness (threshold value) is set to the "1" level and this portion is recognized as a floc. On the contrary, the portion (pixel) which is darker than the predetermined value is set to the "0" level and this portion is recognized as a matter other than the floc. In this manner, the floc image is binarized and image processed, thereby monitoring the floc forming situation.
- In the case where the injection amount of the flocculating gent was merely controlled on the basis of the turbidity of the raw water and the diameter and surface area of the suspended substance as in the foregoing conventional technique, the formation of flocs is influenced by the temperature, turbidity, diameter, pH, alkalinity, and the like, so that flocs cannot be always preferably formed. In other words, since the flocculating agent is injected without directly measuring the floc forming state, the floc formation cannot be always preferably maintained. On the other hand, the idea such that flocs are recognized as images is well known. However, nothing is known with respect to how to evaluate the state of the floc formation from the recognized floc image and how to control the injection amount of the flocculating agent in order to preferably form flocs. Therefore, it is difficult to desirably control the floc formation on the basis of the floc iamge recognized.
- On the other hand, according to the conventional technique, the portion of the floc image which is brighter than the threshold value is regarded as a floc. On the contrary, the portion which is darker than the threshold value is regarded as a background. In this manner, the binarization if performed. In this case, although the bright floc can be binarized even if the threshold value is set to a high value, the dark floc is regarded as a background because ifs brightness is below the threshold value. On the contrary, when the threshold value is set to a low value, although the dark floc can be also binarized, the noise existing in the background is also binarized as a flock. In addition, when the threshold value is set to a low value, the background portion around the bright floc is regarded as a part of the floc. Thus, this floc is binarized larger than the actual size or separate flocs existing closely are binarized as one floc. As described above, the conventional technique has a problem such that the floc cannot be accurately binarized.
- To solve the foregoing problems in the conventional technique, it is an object of the present invention to calculate a characteristic amount of a diameter distribution from the result of the recognition of a floc image and thereby to control an injection amount of a flocculating agent on the basis of the characteristic amount. Practically speaking, when the mean value of the floc diameters calculated on the assumption of a log-normal distribution is small, the injection amount of the flocculating agent is increased and on the contrary, if the diameter is large, the injection amount of the flocculating agent is decreased.
- The floc diameter distribution in the floc forming pool is adapted to the log-normal distribution. The log-normal distribution is expressed as two variables of a mean value and a standard deviation. As the result of the experiments, the standard deviation was constant to a change in injection amount of the flocculating agent, but the means value increased with an increase in injection amount of the flocculating agent. Therefore, the formation of flocs can be controlled by operating the injection amount of the flocculating agent using the mean value of the log-normal distribution as an index.
- Another object of the invention is to provide an image recognizing system of flocs in which flocs and the background can be clearly distinguished and recognized and the flocs can be accurately detected.
- After the luminance gradient of the floc portion of the photographed floc image was emphasized by the luminance gradient emphasizing means, it is compared with a threshold value and binarized. Thus, the boundary between the flocs and the background can be clarified. This method is based on that the inventors of the present invention has found out that the luminance levels of the flocs differ as the result of the experiments.
- Since a change in brightness of the background is very small, the brightness of the background portion is set to a value near the "0" level and at the same time, the luminance gradient of the portion whose brightness changes is emphasized, thereby enabling the boundary between the light and dark portions to be clarified. Accordingly, by further brightening the brightness of the small dark floc, the floc can be more easily recognized and at the same time, the boundary between the large floc and the background can be clarified.
-
- Fig. 1 is a block constitutional diagram showing an embodiment of the present invention;
- Fig. 2 is a detailed constitutional diagram showing an example of image recognizing means;
- Fig. 3 is a detailed constitutional diagram showing an example of a diameter distribution calculating means;
- Fig. 4 is a detailed constitutional diagram showing an example of a control device;
- Fig. 5 is an explanatory diagram of a labeling;
- Fig. 6 is a characteristic diagram of a floc volume concentration and a diameter;
- Fig. 7 is a characteristic diagram of the injection of a flocculating agent;
- Figs. 8 and 9 are characteristic diagrams based on the actual measured values for explaining effects of the invention;
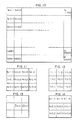
- Fig. 10 is a table showing luminances of light and dark images;
- Figs. 11 to 18 are tables for explaining the calculations of a spatial filtering;
- Figs. 19 to 26 are diagrams and tables for explaining the calculations and operations of the spatial filtering;
- Fig. 27A is a graph showing the relation between the control target value of a floc diameter and the turbidity;
- Fig. 27B is a constitutional diagram showing an example of an injection control device;
- Fig. 28 is a graph showing the relation between the target value of the number of flocs and the turbidity;
- Fig. 29 is a graph showing the relation between the number of flocs and the alkalinity of the raw water;
- Fig. 30 is a graph showing the relation between the number of flocs and the value of pH of the raw water; and
- Fig. 31 is a constitutional diagram showing another example of the injection control device.
- Fig. 1 shows an embodiment of the present invention.
- In Fig. 1, the raw water flows into a high
speed admixture pool 10. A liquid high molecular coagulant (polyaluminum chloride), or an inorganic coagulant such as aluminum sulfate, or the like stored in a flocculating agent tank 11 is injected by a flocculatingagent injection pump 12. On the other hand, an alkali agent such as calcium hydroxide, sodium carbonate, or the like is also injected in order to promote the formation of flocs. The raw water in theadmixture pool 10 is stirred by a stirringwing 14. The stirringwing 14 is driven by a stirrer 13. The water injected with the flocculating agent and stirred is led into a flocculating pool (hereinafter, referred to as "floc forming pool") 15. Thefloc forming pool 15 is constituted by threepools flow adjusting walls 16A and 16B having a plurality of holes. Stirring paddles 17A, 17B and 17C are provided in thepools - A floc image pickup means 18 such as an underwater camera or the like is attached in the
pool 15C on the last downstream side of thefloc forming pool 15. The light/dark image signal (analog signal) of the flocs photographed by the floc image pickup means 18 is input to image recognizingmeans 30. The image pickup means 18 may be also attached in thefirst pool 15A without being limited to thelast pool 15C. Theimage recognizing means 30 comprises: atimer 35 to instruct the image process on a predetermined time unit basis; light/dark image memory means 40;luminance emphasizing means 60; and binarizing means 70. The floc image pickup means 18 will be explained in detail hereinafter. The image signal binarized by the binarizing means 70 is input to diameter distribution calculating means 80. The calculating means 80 calculates a diameter distribution of the flocs on the basis of the binarized image signal and stores the result of the calculation into a volumeconcentration distribution memory 92. Recognitionend deciding means 90 discriminates whether the number of recognized floc images has reached a predetermined value or not. When the number of recognized floc images is below the predetermined value, the decidingmeans 90 instructs the image memory means 40 so as to store the light/dark images photographed by the image pickup means 18. If the decidingmeans 90 determines that the number of recognized images has reached the predetermined value (e.g., ten), the volume concentration distribution stored in thememory 92 is input to a flocculationstate deciding circuit 94. The decidingcircuit 94 obtains the geometric means diameter of the flocs from the volume concentration distribution and adds to aninjection control device 100. Theinjection control device 100 obtains the injection amount of the flocculating agent on the basis of the geometric mean diameter and controls theinjection pump 12. - Fig. 2 shows a constitution of an example of the image recognizing means.
- In Fig. 2, the light/dark image memory means 40 consists of an A/
D converter 41 and a light/darkoriginal image memory 42. The A/D converter 41 converts the analog light/dark image data obtained from the image pickup means 18 into the digital value and stores into thememory 42. Thememory 42 stores the original image signal in response to storage commands from thetimer 35 and decidingmeans 90. Thememory 42 transfers the floc light/dark image data stored to aspatial filtering circuit 61. Theluminance emphasizing means 60 comprises thespatial filtering circuit 61 and a filtering light/dark image memory 62. In response to the image signal from thememory 42, thespatial filtering circuit 61 executes the arithmetic operation of the spatial filtering and stores the result into thememory 62. The stored filtering light/dark image is input to abinarizing circuit 71. The binarizing means 70 consists of thebinarizing circuit 71 and abinarization memory 72. when thebinarizing circuit 71 receives the filtering light/dark image from thememory 62, it binarizes this image and stores the result of the binarization into thebinarization memory 72. - Fig. 3 shows a constitution of an example of the diameter distribution calculating means 80.
- A
labeling circuit 81 receives an image signal B from thebinarization memory 72 and adds the number to each floc. Anarea calculating circuit 82 calculates the area of each floc every number and stores the result of the calculation into anarea memory 82M. Adiameter calculating circuit 84 calculates the diameter from the area of the floc and stores the result of the calculation into adiameter memory 84M. Avolume calculating circuit 86 calculates the volume of each floc and stores the result of the calculation into avolume memory 86M. A diameterdistribution calculating circuit 88 receives the floc diameters from thevolume memory 86M, calculates the diameter distribution of the flocs, and stores into adiameter distribution memory 88M. A volume concentrationdistribution calculating circuit 89 calculates the volume concentration distribution from the values stored in thediameter distribution memory 88M. After completion of the calculation, the calculatingcircuit 89 supplies the end signal to the recognitionend deciding means 90 and also stores the calculated volume concentration distribution into the volumeconcentration distribution memory 92. - Fig. 4 shows a constitution of an example of the
injection control device 100. Thecontrol device 100 comprises acomparator 101, a target value setting device 102, and aninjection control circuit 103. - The operation will now be explained.
- The raw water is led from the river, lake, or marsh (not shown) into the sand precipitated pond (not shown) and the sands and large particles are precipitated and removed from the raw water in this pond. Thereafter, the raw water flows into the high
speed admixture pool 10. The particulates having diameters of about 1 to 10 µm are contained in the raw water flowing into thepool 10 so as to have a concentration of 2 to 200 mg/ℓ. A high molecular coagulant (polyaluminum chloride) or an inorganic coagulant such as aluminum sulfate or the like stored in the flocculating agent tank 11 is supplied into the raw water in thepool 10 by theinjection pump 12. The raw water in thepool 10 is stirred by the stirringwing 14, so that the flocculating agent is dispersed into the raw water. The suspended particulates are the negative colloid such that the surface of each particulate is negatively charged. Numberless suspended particulates are mutually coupled (flocculated) by the flocculating agent having the positive charges. The residence time in thepool 10 is one to five minutes. The suspended particulates are flocculated for this residence time, so that microflocs (nuclei of flocs) having diameters of 10 to 100 µm are formed. The mixture liquid containing the microflocs is led into thefloc forming pool 15 and sequentially flows through the threepools flow adjusting walls 16A and 16B prevent that the mixture liquid flows out from the outlet by shortcircuiting the regions near the water surface without being sufficiently mixed in thefloc forming pool 15. Each residence time of thepools 15A to 15C is 5 to 15 minutes (the total residence time is 15 to 45 minutes). The raw waters in thepools 15A to 15C are slowly stirred by the stirring paddles 17A to 17C. A sufficient amount of flocculating agent is supplied into thepool 10, so that the flocculating agent is adhered onto the surface of each microfloc. Therefore, the microflocs in thefloc forming pool 15 collide or are come into contact with each other by the stirring and are flocculated. While the raw water remains and is stirred in thefloc forming pool 15 for 15 to 45 minutes, the microflocs are grown so as to become the flocs having diameters of 100 to 5000 µm. The state of flocs in thepool 15C is photographed by the floc image pickup means 18. The light/dark image signal of the flocs obtained from the image pickup means 18 is input to the A/D converter 41 of theimage recognizing means 30. The A/D converter 41 always converts the light/dark image signal into the digital signal and input to thememory 42. If the A/D converter 41 converts the analog image signal into the digital signal of seven bits, the luminance of each pixel is digitized into 128 levels. The case where a picture plane consists of 256 pixels of eight bits in each of the lateral and vertical directions will now be explained as an example hereinbelow in this embodiment. Thememory 42 has storage areas corresponding to the pixels of 256 x 256. Assuming that the pixels of i rows are arranged in the horizontal direction and the pixels of j columns are arranged in the vertical direction, the values of g₀(i,j) (where, i = 1 to 256 and j = 1 to 256) of the brightness (luminance) of the picture plane are stored into the respective storage areas of i rows and j columns in the light/darkoriginal image memory 42. The luminance value g₀(i,j) of each pixel is digitized into 128 levels. The light/dark image data stored in thememory 42 is supplied to thespatial filtering circuit 61. Thecircuit 61 receives the image signal from thememory 42 and emphasizes the luminance gradient between the flocs and the background. The result of the calculation of thespatial filtering circuit 61 is stored into thememory 62. Thememory 62 has memory storage areas corresponding to the pixels of 256 x 256. Since the spatial filtering method is well known and its detailed description is omitted. However, briefly speaking, the luminance g₀(i,j) of each pixel of the light/dark image and the load product sum matrix F = f(i,j) of the spatial filtering are respectively multiplied and all of the results of the multiplication are further added. When the load product sum matrix F consists of three rows and three columns, the luminance g*(i,j) can be expressed by the following equation.
- By calculating the equation (1) with respect to i = 2 to 255 and j = 2 to 255 until the luminance g*(255, 255) of the pixel of the 255th row and the 255th column is obtained, all of the calculations of one picture plane are finished. The calculation of the spatial filtering is not executed with regard to all of the pixels of the first and 256th rows and all of the pixels of the first and 256th columns. In this manner, the
spatial filtering circuit 61 executes the calculations. The luminances as the results of the calculations are stored into thememory 62. The light/dark image signal whose luminance gradient was emphasized by the spatial filtering method as described above is input to thebinarizing circuit 71. Thebinarizing circuit 71 receives the filtering light/dark image g*(i,j) stored in the filtering light/dark image memory 62 and binarizes it. Namely, assuming that the threshold value of binarization is Lt, the pixel whose level is above Lt is set to the "1" level. On the contrary, the pixel whose level is lower than Lt is set to the "0" level. The binarized signal having the value of eigher the "0" level or the "1" level is set to b(i,j). Thebinarizing circuit 71 executes the calculation of either one of the following equations (2) and (3).
If g*(i,j) ≧ Lt : b(i,j) = 1 ..... (2)
If g*(i,j) < Lt : b(i,j) = 0 ..... (3) - Therefore, on the basis of the light/dark luminance g*(i,j) as the result of the spatial filtering, the pixel having the luminance above the threshold value Lt is recognized as a pixel corresponding to the floc and is set to the "1" level. On the contrary, the portion having the luminance lower than the threshold value Lt is recognized as a pixel other than the floc and is set to the "0" level. Consequently, a set of pixels which are represented by the "1" level are recognized as flocs. Assuming that the whole image constituted by the result b(i,j) of the binarization is B, this image B is stored into the
binarization memory 72. The image B is input to the diameter distribution calculating means 80 as shown in Fig. 1 and the floc diameter distribution is calculated. - The calculating means 80 obtains the diameter distribution in the following manner.
- First, as shown in Fig. 5, the
labeling circuit 81 adds the number to each of the flocs existing in the image B such as 1, 2, 3, ..., m (m denotes the total number of flocs). Thearea calculating circuit 82 calculates the areas of flocs every labeled number by the following equation.
A = k₁ · Ap ..... (4)
where, A is a projection area (the unit is mm²) of the floc, Ap is the number of pixels of each floc (the unit is pixel), the k₁ is a conversion constant (the unit is mm²/pixel). "pixel" is the unit indicative of the pixel. The calculation of the equation (4) is executed with respect to each floc numbered by thelabeling circuit 81. The result is stored into thearea memory 82M. Thediameter calculating circuit 84 calculates the diameter d of each floc by the following equation by assuming a circle having the same area as that of the floc.
- The diameter d is calculated with regard to each area and the result is stored into the
diameter memory 84M. Thevolume calculating circuit 86 receives the diameters of the respective flocs from thediameter memory 84M and calculates the volume v of each floc by the following equation.
v = πd³/6 ..... (6) - The result of the calculation of the volume for the diameter is stored into the
volume memory 86M. The diameterdistribution calculating circuit 88 receives the volume v of each floc from thevolume memory 86M and determines to which grade the diameter of each floc belongs. Then, the calculatingcircuit 88 adds the volume of each floc into the relevant storage area in thediameter distribution memory 88M. Assuming that the grade width of the diameter is 0.1 mm, the grade is divided into, e.g., the following fifty-one grades. Therefore, thememory 88M aso has 51 storage areas.
D₁ : 0 to 0.1 mm
D₂ : 0.1 to 0.2 mm
D₃ : 0.2 to 0.3 m
.
.
.
.
D₅₀ : 4.9 to 5.0 mm
D₅₁ : 5.0 mm --- - For example, assuming that the diameter of a certain floc is 0.25 mm, the volume is 0.00818 mm³ from the equation (6). Assuming that the volume of the floc having the diameter of Di is vi, the volume data of 0.00818 is stored into the storage area corresponding to the diameter D₃ of the
diameter distribution memory 88M. While the grade of the diameter of each floc is determined, the results of the decisions are sequentially added into the respective areas in thememory 88M, thereby obtaining the diameter distribution of the flocs. - The volume concentration
distribution calculating circuit 89 calculates the volume concentration distribution Viʹ of the flocs (the distribution indicative of the volume Vi of the floc having the diameter Di in the unit volume) on the basis of the volume value Vi stored in thememory 88M in accordance with the following equation.
Viʹ = Vi/(N·Vw) ..... (7)
where, N denotes the number of recognition times (the number of processing images) and Vw represents the volume photographed in one picture plane. - Fig. 6 shows an example of the resultant volume concentration distribution (axis of ordinate shows the diameter Di and an axis of abscissa denotes the volume concentration Viʹ). A curve a in Fig. 6 in a theoretical curve of the log-normal distribution obtained from the histogram of the volume concentration distribution of Fig. 6. Each time the diameter distribution calculating means 80 finishes the calculation of the volume concentration distribution every picture plane as described above, the recognition
end deciding means 90 discriminates whether the recognition of the image of the flocs has been finished or not with respect to N picture planes. If the number of recognition times is smaller than N, the image photographed by the floc image pickup means 18 at that time is stored into the memory means 40 and the foregoing floc image processes are repeated. If the number of recognition times has reached N, the value of the volume concentration distribution calculated by the equation (7) is stored into the volumeconcentration distribution memory 92. - The example in which the volume concentration distribution is calculated every recognition picture plane has been described above. However, the calculation of the equation (7) may be also executed after completion of the recognition of a predetermined number of times.
- The flocculation
state deciding circuit 94 calculates the geometric mean diameter Dℓ of the floc diameter distribution from the values in thememory 92 on the basis of the following equation.
- The geometric mean diameter Dℓ obtained by the deciding
circuit 94 is input to theinjection control device 100. The geometric mean diameter Dℓ output from the decidingcircuit 94 is input to thecomparator 101. Thecomparator 101 calculates the deviation ΔDℓ between the target value D*ℓ of the geometric mean diameter which is set by the target value setting device 102 and the calculated value Dℓ in accordance with the following equation.
ΔDℓ = Dℓ - D*ℓ ..... (9) - The
injection control circuit 103 operates theinjection pump 12 on the basis of the deviation ΔDℓ and controls the injection amount of the flocculating agent. Practically speaking, when the deviation ΔDℓ has a negative value, the injection amount of the flocculating agent is increased. On the contrary, when the deviation ΔDℓ has a positive value, the injection amount of the flocculating agent is decreased. There is such a characteristic relation as shown in Fig. 7 between the geometric means diameter Dℓ and the injection amount P of the flocculating agent. The abnormal injection of the flocculating agent is prevented by setting the maximum injection amount Pmax and the minimum injection amount Pmin for the injection amount of the flocculating agent. - In this manner, the injection amount of the flocculating agent is controlled. In this case, since the injection amount of the flocculating agent is controlled by the geometric mean diameter of the flocs, the flocs can be preferably formed. The reason why the floc formation can be desirably executed will now be explained hereinbelow with reference to Figs. 8 and 9.
- Fig. 8 shows a characteristic diagram based on the actual measured values of a change in floc volume concentration distribution in association with a change in injection ratio of the flocculating agent.
- Fig. 8 shows the actual measured values of the floc volume concentration distribution when the flocculating agent injection ratio was changed from 5 mg/ℓ to 30 mg/ℓ. As will be obvious from Fig. 8, when the injection ratio increases, the diameter and the distribution peak also increase. This means that a large quantity of large flocs were formed with an increase in injection ratio. Next, the change in floc volume concentration distribution to the change in flocculating agent injection ratio was actually measured. Practically speaking, the geometric mean diameter and the standard deviation were calculated from the actual measured values shown in Fig. 8. Then, the geometric means diameter and the standard deviation to the change in injection ratio were obtained. The results are as shown in Fig. 9. The standard deviation shown as a characteristic b in Fig. 9 represents the index indicative of the degree of extent of the distribution. As will be obvious from Fig. 9, the geometric mean diameter of the characteristic a increases with an increase in injection ratio, but the standard deviation of the characteristic b is constant. Therefore, by changing the flocculating agent injection ratio, only the geometric mean diameter is varied. Accordingly, by measuring the geometric mean diameter by an image and changing the flocculating agent injection ratio such that the value of the measured geometric mean diameter becomes the target value as in the present invention, the flocs can be always certainly formed.
- In this embodiment, after the luminance gradient of the floc image was emphasized using the load product sum matrix in the
spatial filtering circuit 61, it is binarized. Therefore, the flocs can be also recognized by clearly distinguishing the flocs from the background. - As described above, the diameter distribution of the flocs is measured by recognizing the image of flocs and the geometric mean diameter is derived. The increase or decrease of the injection amount of the flocculating agent is controlled in accordance with the geometric mean diameter. Therefore, since the flocculating agent injection amount is controlled while directly discriminating the state of the actual floc formation, the flocs can be certainly stably formed.
- The present invention can be applied to the flocculating agent injection control in the flocculating process in a plant other than the water purifying plant. For example, in the sewage treatment plant, the invention can be also applied to the process to improve the precipitation efficiency be injecting the flocculating agent into the active sludge, the refining process in the sludge process by injecting the flocculating agent, the pelletizing process of dust coal, and the like.
- In the foregoing embodiment of the invention, the case where the picture plane consists of 256 pixels of eight bits in each of the lateral and vertical directions has been described. In Fig. 10, assuming that the pixels of i rows are arranged in the horizontal direction and the pixels of j columns are arranged in the vertical direction, the values g₀(i,j) (where, i = 1 to 256 and j = 1 to 256) of the brightness (luminance) of the picture plane are stored into the respective storage areas of i rows and j columns in the light/dark
original image memory 42. The luminance g₀(i,j) of each pixel is digitized into 128 levels. The light/dark image data stored in thememory 42 is supplied to thespatial filtering circuit 61. Thespatial filtering circuit 61 receives the image signal from thememory 42 and emphasizes the luminance gradient between the flocs and the background. The result of the calculation of thespatial filtering circuit 61 is stored into thememory 62. Thememory 62 has the storage areas as many as the pixels of 256 x 256. - The operation of the
spatial filtering circuit 61 will now be explained in detail. - It is assumed that a local image area which is subjected to the spatial filtering process is an area of n x n consisting of n pixels in each of the horizontal and vertical directions. When n = 3, the local image area consists of three pixels in each of the horizontal and vertical directions. Fig. 11 shows a local image area of 3 x 3. On the other hand, a load coefficient matrix of the spatial filtering is similarly defined by the area of n x n consisting of n pixels in each of the X and Y directions. When n = 3, the load coefficient matrix is the matrix of 3 x 3. It is assumed that the load product sum matrix (load coefficient matrix) of this spatial filtering is F. Fig. 12 shows a load product sum matrix F of 3 x 3. As shown in the following equation (10), the luminances g₀(i,j) of each pixel of the light/dark image and the load product sum matrices f(i,j) of the spatial filtering are respectively multiplied and all of the results of the multiplications are further added, thereby calculating the spatial filtering.
- As shown in Fig. 15, the result g*(2,2) of the calculation of the spatial filtering is stored into the area in the
memory 62 corresponding to the central pixel.
g*(2, 2) = [g₀(1, 1) x f(1, 1)
+g₀(1, 2) x f(1, 2)
+g₀(1, 3) x f(1, 3)
+g₀(2, 1) x f(2, 1)
+g₀(2, 2) x f(2, 2)
+g₀(2, 3) x f(2, 3)
+g₀(3, 1) x f(3, 1)
+g₀(3, 2) x f(3, 2)
+g₀(3, 3) x f(3, 3)]/S ..... (10)
where, S is a coefficient of the scaling. The coefficient S is set to a value within 127 such that the result of the calculation does not become a value above 128. - The equation (10) will be summarized by the following equation.

- After completion of the calculation of the pixel g*(2,2), the value of g*(2,3) which is adjacent by only one pixel is then calculated as shown in Fig. 13. At this time, as shown in Fig. 14, the local image area of 3 x 3 such that the value g₀(2,3) is located at the center is calculated. In a manner similar to the equation (10), g*(2,3) is calculated. As described above, the calculation is executed in the column (horizontal) direction while sequentially shifting one pixel by one. After completion of the calcualtions of one column, the similar calculations are also subsequently executed with respect to the second row. The calculating equation of the pixels of the ith row and the jth column is as follows.
∴g*(i, j) = [g₀(i-1, j-1) x f(1, 1)
+g₀(i-1, j) x f(1, 2)
+g₀(i-1, j+1) x f(1, 3)
+g₀(i, j-1) x f(2, 1)
+g₀(i, j) x f(2, 2)
+g₀(i, j+1) x f(2, 3)
+g₀(i+1, j-1) x f(3, 1)
+g₀(i+1, j) x f(3, 2)
+g₀(i+1, j+1) x f(3, 3)]/S ..... (12)
- The above equations (10) and (12) are calculated with respect to i = 2 to 255 and j = 2 to 255 until the luminance g*(255, 255) of the pixel of the 255th row and the 255th column is derived. After all of the calculations were finished, the calculations of one picture plane is completed. The spatial filtering is not calculated with respect to all of the pixels of the first and 256th rows and all of the pixels of the first and 256th columns.
- In this manner, the
spatial filtering circuit 61 calculates the equations (10) and (12). The luminances as the results of the calculations are stored into thememory 62. - The load coefficient f(i,j) as an important factor in execution of the spatial filtering will be explained. Fig. 15 shows an example of the load product sum matrix F when n = 3 in the load product sum matrix F of the spatial filtering having the load coefficient f(i,j) as an element. The operation of this example will now be explained with respect to the case of a light/dark image whose luminance g₀(i,j) is as shown in Fig. 16. A square block in Fig. 16 represents a pixel and the numerical value written in the block indicates the luminance of the pixel. Fig. 16 shows the state in which there is a floc having the
luminance 3 and the size of one pixel in the background of theluminance 1. In this case, the luminance difference between the background and the floc is equal to two levels. When the equation (12) is calculated using the load product sum matrix F shown in Fig. 15 for the image of Fig. 16, the result of the calculation will be as shown in Fig. 17. In the calculation, S is set to 1 and the values of the luminances of the pixels indicated by u and arranged in the peripheral portion in Fig. 17 cannot be calculated; therefore, the value of u is set to 0. - As will be obvious from Fig. 17, since the luminance of the floc is increased to 16, the brightness of the floc is emphasized. However, the luminances of the pixels around the floc are 0 or -4. Therefore, the luminance difference between the background and the floc is 16 or more. Accordingly, it will be appreciated that the floc becomes further brighter than the background.
- The
spatial filtering circuit 61 executes the calculation as described above and the luminance as the result of the calculation is stored into theimage memory 62. - The light/dark image signal whose luminance gradient was emphasized by the spatial filtering process as explained above is input to the
binarizing circuit 71. Thebinarizing circuit 71 receives the filtering light/dark image g*(i,j) stored in thememory 62 and binarizes this image. Namely, assuming that the binarization threshold value is Lt, when the luminance value of the pixel is above Lt, this pixel is set to the "1" level. On the contrary, if it is lower than Lt, this pixel is set to the "0" level. The binarized signal having either the "0" level or the "1" level assumes b(i,j). Thebinarizing circuit 71 executes the calculation of either one of the following equations.
If g*(i,j) ≧ Lt : b(i,j) = 1 ..... (14)
If g*(i,j) < Lt : b(i,j) = 0 ..... (15) - Therefore, on the basis of the light/dark luminance g*(i,j) after completion of the spatial filtering, the pixel whose luminance value is above the threshold value Lt is recognized as a pixel corresponding to the floc and is set to the "1" level. On the contrary, the portion whose luminance value is lower than the threshold value Lt is recognized as a pixel other than the floc and is set to the "0" level. Consequently, a set of pixels which are represented by the "1" level are recognized flocs. Fig. 18 shows the result of the binarization of the luminance values of Fig. 17 when the threshold value Lt is set to 2. Assuming that the whole image constituted by b(i,j) as the result of the binarization is B, the image B is stored into the
binarization memory 72. The image B is input to the diameter distribution calculating means 80 as shown in Fig. 1 and the floc diameter distribution is calculated. - The diameter distribution calculating means 80 obtains the diameter distribution in the following manner.
- In the embodiment, after the luminance gradient of the floc image was emphasized using the load product sum matrix in the
spatial filtering circuit 61, the luminance values are binarized. Therefore, the flocs can be recognized by clearly distinguishing the flocs from the background. This point will be practically explained hereinbelow with reference to Fig. 19. - Fig. 19(A) shows a luminance distribution in one-dimensional direction of a large floc in the case of the luminance g₀(i,j) of a light/dark image. The luminance g*(i,j) which is derived after such a bright floc image was subjected to the spatial filtering increases, namely, the floc further becomes bright since the luminance gradient between the floc and the background is emphasized as shown in Fig. 19(B). In the case of a small floc shown in Fig. 19(C), the luminance of the floc is also similarly emphasized as shown in Fig. 19(D). Therefore, by binarizing the luminance values on the basis of the threshold value Lt as shown in Figs. 19(B) and 19(D), the floc can be binarized irrespective of the size of floc.
- In the foregoing embodiment, the description has been made with respect to that the luminance of the floc can be emphasized using the load product sum matrix F as shown in Fig. 15. However, since the load product sum matrix is set such that the sum of load product sum coefficients becomes 0, the luminance of the background having a gentle luminance gradient can be set to 0. Although the luminance of the background changes in dependence on the intensity of illumination, its luminance level is always set to 0 by the spatial filtering, so that the contrast between the floc and the background can be effectively emphasized. Also, this operation does not change even if the intensity of the illumination varies. Therefore, even if the intensity of illumination is gradually weakened due to the measurement for a long time, the floc can be stably recognized without being influenced by the reduction of the illumination.
- The foregoing embodiment has been described with respect to the case where the size of floc corresponds to about one pixel. An explanation will now be made with regard to the example of such an image that flocs are constituted by a plurality of pixels and the light/dark image data g₀(i,j) is as shown in Fig. 20. Fig. 20 shows the case where the flocs having the luminance values of 3 to 4 exist in the background of the luminance value of 1. As the result of that the image of Fig. 20 was subjected to the spatial filtering by the equation (11) using the load product sum matrix F of Fig. 15, g*(i,j) becomes as shown in Fig. 21. As will be understood from Figs. 20 and 21, the luminances of the flocs are emphasized by the spatial filtering. When the light/dark image after completion of the filtering process shown in Fig. 21 is binarized on the basis of the threshold value of 2, the result will be as shown in Fig. 22.
- An example in which the size n of the load product sum matrix is 3 or more in this invention will now be explained. According to this example, n is set to 5 and the luminance of floc can be further accurately emphasized than the case where n = 3.
- In this example, it is assumed that the load product sum matrix F of the
spatial filtering circuit 61 was given by Fig. 23. With this matrix F, the following effects are obtained. (1) The floc consisting of a plurality of pixels can be also emphasized. (Namely, the luminance of a flat floc whose peak portion consists of about three pixels can be also emphasized.) (2) The noise of about one pixel can be eliminated. (3) The luminance of a small floc consisting of about one to two pixels can be emphasized. - The operation of the above items (1) to (3) will now be explained hereinbelow.
- The operation when the load product sum matrix F (n = 5) shown in Fig. 23 and the load product sum matrix (n = 3) shown in Fig 15 are applied will be described with reference to Figs. 24 to 26.
- Fig. 24(A) shows an exmaple in which there is a flat luminance peak in the luminance distribution in one-dimensional direction of the floc. Since the luminance change is small in the case of such a peak, when the spatial filtering is executed using the load product sum matrix F shown in Fig. 15, the luminance of the peak becomes 0 as shown in Fig. 25(B). However, when the spatial filtering is performed using the load product sum matrix shown in Fig. 23, the peak portion does not become 0 but is emphasized as shown in Fig. 26(C). Therefore, the binarization can be effectively performed using the emphasized portion as a floc.
- The noise removing operation will now be explained. Fig. 25(A) shows a luminance distribution in one-dimensional direction of the noise of a one-pixel unit which is caused in the image pickup camera. By processing such a noise by use of the load product sum matrix F shown in Fig. 15, the luminance of the noise is emphasized as shown in Fig. 25(B). This is because in the case of the load product sum matrix shown in Fig. 15, the luminance of the noise of one pixel is also emphasized since only the value of the central pixel is positive. However, by calculating the spatial filtering using the load product sum matrix (n = 5) shown in Fig. 23, the luminance can be set to 0 as shown in Fig. 25(C). Namely, the influence by the noise can be eliminated.
- Fig. 26(A) shows the case where a small floc exists in the noise. Fig. 26(B) shows the result of the process using the load product sum matrix shown in Fig. 15. Fig. 26(C) shows the result of the process using the load product sum matrix shown in Fig. 23.
- As described above, the noise can be eliminated and at the same time, the luminance of the small floc can be emphasized.
- As described above, by executing the spatial filtering using the load product sum matrix of n = 5, the luminance of floc can be further effectively emphasized than the case where n = 3.
- In the load product sum matrix F, by setting the value of the central pixel to be high and by setting the values of the pixels around the central pixel to be low as shown in Fig. 23, the luminance of floc (the luminance of the central pixel is high and the luminances of the pixels around the central pixel are low) can be effectively emphasized. When a load product sum matrix of n of 5 or more is used, the similar effect can be also derived.
- According to this embodiment, the luminance of floc is emphasized by the spatial filtering and the luminances of the background are uniformed, thereby clarifying the boundary between the flocs and the background. Also, the luminance of the noise other than the flocs can be relatively suppressed. Therefore, only the luminance of the floc can be selectively emphasized without being influenced by a gentle change in luminance of the background due to a fluctuation, a time-dependent change, or the like of the illumination and further by the noise of the image pickup system. According to the invention, after the luminance of floc was emphasized, the floc is recognized by the binarization as described above. Therefore, the floc image can be accurately recognized.
- The present invention can be applied to the image recognition of flocculated particles and particle-shaped matters other than the flocs in the water purifying plant. For example, the invention can be applied to the image measurement of active sludge flocs in the sewage treatment plant, the diameter measurement of immobilized particles which are formed by immobilizing microorganisms so as to become particles by use of an immobilizing agent such as sodium alginate or the like, the measurement of agglutinated matters in the immunoreaction, or the like. Moreover, the invention can be also applied to the measurement of any powder such as dust coal, flour, and the like.
- On the other hand, a turbidity signal Tu obtained from a
turbidimeter 5 is input to the target value setting device 102. A control target value D*ℓ of the floc diameter is determined as shown in a graph of Fig. 27A on the basis of the value of Tu. Namely, the control target value D*ℓ of the floc diameter is increased as the turbidity Tu rises. However, even if the turbidity is high, the floc is not grown to a diameter in excess of a predetermined value but only the number of flocs increases. Therefore, a number of relatively large flocs appear, so that the average diameter of floc slowly increases. The control target value D*ℓ of the floc diameter is determined for the turbidity on the basis of such a characteristic as shown in Fig. 27A. - The
comparator 101 obtains the deviation ΔDℓ between the calculated value Dℓ and the target value D*ℓ of the geometric mean diameter which is set by the target value setting device 102 in accordance with the following equation.
ΔDℓ = Dℓ - D*ℓ ..... (9) - The
injection control circuit 103 operates theinjection pump 12 on the basis of the deviation ΔDℓ, thereby controlling an injection amount of the flocculating agent. Practically speaking, when the deviation ΔDℓ has a negative value, the injection amount is increased. On the contrary, when it has a positive value, the injection amount is decreased. There is such a characteristic relation as shown in Fig. 8 between the geometric mean diameter Dℓ and the flocculating agent injection amount P. The abnormal injection is prevented by setting the maximum injection amount Pmax and the minimum injection amount Pmin for the flocculating agent injection amount. - The injection of the flocculating agent is controlled as described above. Since the flocculating agent injection amount is controlled by changing the control target value of the diameter of floc in accordance with the degree of the turbidity of the raw water, flocs can be preferably formed. Thus, the turbidity of the precipitation pool can be stably maintained to a value below a predetermined value.
- In the foregoing embodiment, after the luminance gradient of the floc image was emphasized by use of the load product sum matrix in the
spatial filtering circuit 61, the luminance values are binarized. Therefore, the flocs can be also recognized by clearly distinguishing the flocs from the background. - An explanation will now be made with respect to an embodiment of an example in which the injection amount of the flocculating agent is controlled on the basis of the turbidity Tu of the raw water and the number m of flocs. In general, the floc number concentration may be used as the number of flocs. In this embodiment, the number m of flocs is input to the
injection control device 100 in Fig. 1 from thelabeling circuit 81 of the diameter distribution calculating means 80. The turbidity signal Tu from theturbidimeter 5 is input to theinjection control device 100. The flocculating agent injection amount is controlled on the basis of those values. Fig. 27B shows a constitution of theinjection control device 100. The number m of flocs is input to a comparator 101A. On the other hand, the turbidity value Tu measured by theturbidimeter 5 is input to a targetvalue setting circuit 102A. Thesetting circuit 102A determines a target value m* of the floc number m on the basis of the turbidity value Tu as shown in a graph of Fig. 28. Namely, when the turbidity value Tu is high, there is such a tendency that the number of flocs increases; therefore, the floc number target value m* is increased as the turbidity value Tu rises. As described above, when the turbidity is high, the flocculating agent is injected such that the flocs as many as the high turbidity are formed. Practically speaking, the floc number target value m* which is set by the targetvalue setting circuit 102A is input to the comparator 101A. The measured value m indicative of the actual number of flocs is also input to the comparator 101A. The deviation Δm between measured value m and the target value m* is calculated by the following equation.
Δm = m - m* ..... (10ʹ) - An
injection control circuit 103A receives the deviation Δm and controls the injection amount of the flocculating agent in the following manner. When the value of Δm is positive, the measured value m of the floc number is larger than the target value m*; therefore, this means that the flocculating agent injected is too much. In this case, the injection amount is reduced. On the contrary, when the value of Δm is negative, m is smaller than m*. Therefore, the injection amount is increased, thereby allowing a number of flocs to be formed. By increasing the injection amount of the flocculating agent, a more number of flocs are formed. - As described above, since the flocs can be always preferably formed irrespective of the turbidity of the raw water, the turbidity at the outlet of the precipitation pool can be stably maintained to a value below a predetermined value. In addition, although not shown, a large effect can be also derived by measuring the turbidity at the outlet of the precipitation pool and by further increasing the flocculating agent injection amount when the turbidity at the outlet exceeds a predetermined value in order to enhance the safety.
- On the other hand, when the floc image pickup means 18 is attached in the
first pool 15A of thefloc forming pool 15, a change in floc formation state can be promptly detected. Therefore, it is better to attach the image pickup means 18 in the first pool in order to make the control response speed high. - Further, detection signals of an
alkalinity measuring instrument 6 and apH measuring instrument 7 as shown in Fig. 31 are input to theinjection control device 100, thereby controlling the target value of the floc number and the geometric mean diameter. - According to the experiments and experiences of the inventors, the tendency of formation of flocs can be predicted by detecting the foregoing three factors of the water quality. Fig. 28 is a graph showing the results of the measurement of the suspended matter concentration (i.e., turbidity) Tu of the raw water and of the number of flocs when the injection amount of the flocculating agent was properly maintained. It will be understood from Fig. 28 that the number of flocs increases as the concentration Tu rises and there is a correlation therebetween. Fig. 29 shows a change in number of flocs to a change in alkalinity when the flocculating agent injection amount and the suspended matter concentration Tu were maintained constant. It will be understood from this graph that there is such a tendency that the number of flocs decreases with an increase in alkalinity Aℓ. Further, Fig. 30 shows the result of the measurement of the number of flocs when the other water quality condition and the injection amount were maintained to values within special ranges and pH was changed. It will be understood from this graph that the number of flocs also varies by a change in pH. It will be understood from those results that although the number of flocs formed increases as the concentration Tu of the suspended matters of the inflow raw water rises, but the increases in alkalinity and pH function as restrainers. On the other hand, in order to obtain the good treatment water in which the suspended matters hardly exists in the precipitation pool (not shown), the flocs as many as the turbidity Tu must be formed in the floc forming pool before the precipitation pool. Therefore, the floc number target value m* is corrected and calculated in the following manner. Fig. 31 shows a constitutional diagram of an example of the
injection control device 100. The concentration Tu of the suspended matters detected by theturbidity detecting means 5 is input to a calculating circuit 111. The optimum value m* of the number of flocs is calculated for the turbidity Tu and output to a targetvalue calculating circuit 118. In this case, the floc number optimum value m* is calculated when the alkalinity is set to a reference value Aℓ* and the pH is set to a reference value pH*. The alkalinity Aℓ detected by thealkalinity detecting means 6 is input to a comparator 112 and compared with the reference alkalinity value Aℓ* which is preset by asetting circuit 113. The deviation ΔAℓ is output to a calculatingcircuit 114. The calculatingcircuit 114 calculates a correction amount ΔMa of the number of flocs corresponding to the deviation ΔAℓ of the alkalinity and outputs to the targetvalue calculating circuit 118. On the other hand, the pH detected by thepH detecting means 7 is input to a comparator 115 and compared with the pH reference value pH* which is preset by asetting circuit 116. The deviation ΔpH is output to a calculatingcircuit 117. A correction amount ΔMp of the number of flocs corresponding to the deviation ΔpH of the pH is calculated in the calculatingcircuit 117 and output to the targetvalue calculating circuit 118. The calculatingcircuit 118 calculates the target value M* of the number of flocs on the basis of the floc number optimum value m* and the correction amounts ΔMa and ΔMp and inputs to aninjection control circuit 119. Theinjection control circuit 119 operates the flocculatingagent injection pump 12, thereby increasing or decreasing the injection amount of the flocculating agent. - An electric conductivity measuring instrument may be also used in place of the alkalinity measuring instrument. The volume of floc can be also used as a parameter indicative of the floc formation state.
- As described above, in this embodiment, the flocculating agent is injected in accordance with the water quality and the floc formation state, so that the flocs can be preferably formed.
Claims (16)
a flocculating pool (15) into which an inflow liquid flocculating agent (11) is injected and which forms flocs of suspended matters in said liquid;
flocculating agent injecting means (12) for injecting the flocculating agent into said flocculating pool (15);
floc image pickup means (18) for photographing a state of flocs in the flocculating pool (15) and for converting luminance data of the flocs into an electric signal;
image recognizing means (30) for binarizing the image signal obtained from said floc image pickup means (18) on the basis of a luminance level of each pixel and for recognizing the shapes of said flocs;
flocculation state deciding means (80) for calculating a characteristic amount of a diameter distribution of the flocs on the basis of the floc shapes recognized by said image recognizing means (30); and
injection amount control menas (100) for controlling an amount of flocculating agent which is injected from said flocculating agent injecting means (12) on the basis of said characteristic amount.
a flocculating pool (15) for forming the flocs of suspended matters contained in a liquid;
floc image pickup means (18) for photographing a state of flocs in said flocculating pool (15) and for converting luminance data into an electric signal;
light/dark image memory means (40) for storing light/dark image data (Figs. 16 and 20) of said flocs on the basis of the electric signal derived from said floc image pickup means (18);
luminance emphasizing means (60) for emphasizing the luminance gradient of the floc portion of said light/dark image signal; and
binarizing means (70) for binarizing the light/dark image signal derived from said luminance emphasizing means (60) on the basis of a luminance level every pixel,
wherein the flocs and the matters other than the flocs are discriminated by the binary signal obtained from said binarizing means (70).
a flocculating pool (15) into which a flocculating agent is injected and which forms flocs of suspended matters by stirring a liquid;
a water quality measuring instrument (5, 6, 7) for measuring turbidity, alkalinity, and pH of the liquid which flows into said flocculating pool (15);
floc image pickup means (18) for converting a state of the flocs into an electric signal;
image recognizing means (30) for recognizing a characteristic amount of the flocs on the basis of the image signal derived from said floc image pickup means (18);
flocculation state deciding means (80) for deciding a floc formation state on the basis of said characteristic amount; and
an injection control device (100) for controlling an injection amount of the flocculating agent on the basis of the result of the decision of said flocculation state deciding means (80) and a detection value of said water quality measuring instrument (5, 6, 7).
converting a luminance of the flocs into an electric signal;
storing an image of the flocs on the basis of the electric signal derived by said converting step; and
emphasizing the luminance of the floc portion.
floc image pickup means (18) for converting a luminance of the flocs into an electric signal;
image memory means (40) for storing an image of said flocs on the basis of the electric signal derived from said floc image pickup means (18); and
luminance emphasizing means (60) for emphasizing the luminance of the floc portion of said image memory means (40).
converting a state of said flocs into an electric signal;
recognizing a characteristic amount of the flocs on the basis of the image signal derived by said converting step;
deciding the floc formation state on the basis of said characteristic amount; and
controlling an injection amount of a flocculating agent on the basis of the result of the decision by said deciding step.
floc image pickup means (18) for converting a state of the flocs into an electric signal;
image recognizing means (30) for recognizing a characteristic amount of the flocs on the basis of the image signal derived from said floc image pickup means (18);
flocculation state deciding means (80) for deciding the floc formation state on the basis of said characteristic amount; and
an injection control device (100) for controling an injection amount of a flocculating agent on the basis of the result of the decision by said flocculation state deciding means (80).
converting a state of said flocs into an electric signal;
recognizing a characteristic amount of the flocs on the basis of the image signal derived by said converting step;
deciding a floc formation state on the basis of said characteristic amount; and
controlling an injection amount of a flocculating agent on the basis of the result of the decision in said deciding step and the value derived from said water quality measuring instrument (5, 6, 7).
floc image pickup means (18) for converting a state of said flocs into an electric signal;
image recognizing means (30) for recognizing a characteristic amount of the flocs on the basis of the image signal which is derived from said floc image pickup means (18);
flocculation state deciding means (80) for deciding a floc formation state on the basis of said characteristic amount; and
an injection control device (100) for controlling an injection amount of a flocculating agent on the basis of the result of the decision by said flocculation state deciding means (80) and the value obtained from said water quality measuring instrument (5, 6, 7).
Applications Claiming Priority (4)
| Application Number | Priority Date | Filing Date | Title |
|---|---|---|---|
| JP8295286A JPS62239278A (en) | 1986-04-10 | 1986-04-10 | Image recognizing device for agglomerate |
| JP82952/86 | 1986-04-10 | ||
| JP82953/86 | 1986-04-10 | ||
| JP8295386A JPS62241512A (en) | 1986-04-10 | 1986-04-10 | Device for controlling injection of flocculant |
Publications (3)
| Publication Number | Publication Date |
|---|---|
| EP0240974A2 true EP0240974A2 (en) | 1987-10-14 |
| EP0240974A3 EP0240974A3 (en) | 1989-02-22 |
| EP0240974B1 EP0240974B1 (en) | 1992-07-29 |
Family
ID=26423980
Family Applications (1)
| Application Number | Title | Priority Date | Filing Date |
|---|---|---|---|
| EP87105076A Expired EP0240974B1 (en) | 1986-04-10 | 1987-04-06 | Injection control system of flocculating agent |
Country Status (3)
| Country | Link |
|---|---|
| US (1) | US4783269A (en) |
| EP (1) | EP0240974B1 (en) |
| DE (1) | DE3780673T2 (en) |
Cited By (5)
| Publication number | Priority date | Publication date | Assignee | Title |
|---|---|---|---|---|
| EP0272673A3 (en) * | 1986-12-22 | 1990-02-07 | Passavant-Werke Ag | Method for conditioning and dewatering sludges |
| EP0616206A3 (en) * | 1993-03-17 | 1995-08-16 | Grundig Emv | Turbidity measuring device. |
| RU2165896C1 (en) * | 2000-05-05 | 2001-04-27 | Никольский Александр Анатольевич | Method of estimation of conditions for introducing flocculant |
| WO2002020116A3 (en) * | 2000-09-06 | 2002-12-12 | Stockhausen Chem Fab Gmbh | Device and method for particle agglomeration |
| US10988392B2 (en) | 2016-04-01 | 2021-04-27 | Kemira Oyj | Method and system for optimization of coagulation and/or flocculation in a water treatment process |
Families Citing this family (20)
| Publication number | Priority date | Publication date | Assignee | Title |
|---|---|---|---|---|
| US4990261A (en) * | 1987-11-19 | 1991-02-05 | Calgon Corporation | Method for monitoring and/or controlling liquid-solid separation processes |
| US5023803A (en) * | 1989-04-10 | 1991-06-11 | Olin Corporation | Process to control the addition of carbonate to electrolytic cell brine systems |
| US4976871A (en) * | 1989-10-17 | 1990-12-11 | Nalco Chemical Company | Method of monitoring flocculant effectiveness |
| AU1577392A (en) * | 1991-02-28 | 1992-10-06 | Biotechnology Research And Development Corporation | On-line image processing for real-time control of a process |
| US5353237A (en) * | 1992-06-25 | 1994-10-04 | Oryx Energy Company | System for increasing efficiency of chemical treatment |
| US5376280A (en) * | 1993-10-25 | 1994-12-27 | Westech Engineering, Inc. | Flocculation control system and method |
| RU2125541C1 (en) * | 1997-04-28 | 1999-01-27 | Потехин Борис Николаевич | Plant for preparation of flocculant |
| FR2795713B1 (en) * | 1999-07-01 | 2003-10-03 | Suez Lyonnaise Des Eaux | METHOD FOR CONDUCTING URBAN WASTEWATER TREATMENT PLANTS, BASED ON LOAD INDICATIONS |
| DE19937756A1 (en) * | 1999-08-10 | 2001-02-15 | Michael Hoffmann | Liquid flocculation treatment turbidity monitor linked to automatic control unit minimising treatment duration |
| DE10115179B4 (en) * | 2001-03-27 | 2005-12-15 | Clausthaler Umwelttechnikinstitut Gmbh, (Cutec-Institut) | Method and measuring arrangement for automatically determining the concentration factor of conditioned sewage sludge |
| US8293097B2 (en) * | 2008-03-17 | 2012-10-23 | Bowers Jr Gregory Scott | System for continuous optimization of wastewater treatment |
| US8506799B2 (en) * | 2009-09-09 | 2013-08-13 | ClearCorp | Suspended particle characterization system for a water processing facility |
| US20150048031A1 (en) * | 2013-08-16 | 2015-02-19 | Hossein Eshaghi | Orifice plate flocculation process |
| EP3392209A1 (en) * | 2017-04-21 | 2018-10-24 | Chemical Equipment Scandinavia AB | Fluid treatment plant |
| US10338631B1 (en) | 2017-05-02 | 2019-07-02 | ClearCorp | System for automated water sample jar testing |
| US11498858B2 (en) | 2017-05-02 | 2022-11-15 | ClearCorp | Methods for optimizing water treatment coagulant dosing |
| RU2732709C1 (en) * | 2020-03-13 | 2020-09-22 | Непубличное акционерное общество "Астерион" | Method for preparation of flocculant solution and apparatus for implementation thereof |
| CN114956287B (en) * | 2022-06-14 | 2023-08-29 | 西安清源盈科环保科技有限公司 | Sewage dephosphorization method |
| CN116812998A (en) * | 2023-04-24 | 2023-09-29 | 爱环吴世(苏州)环保股份有限公司 | Coagulant put-in flow determining method and device based on flocculation image analysis |
| CN118993488A (en) * | 2024-09-09 | 2024-11-22 | 山西品东智能控制有限公司 | Intelligent control method and system for concentration filter pressing |
Family Cites Families (9)
| Publication number | Priority date | Publication date | Assignee | Title |
|---|---|---|---|---|
| DE2704080C2 (en) * | 1977-02-01 | 1982-12-23 | GST-Regeltechnik GmbH, 4630 Bochum | Method and device for controlling the amount of flocculant in water treatment |
| JPS54143296A (en) * | 1978-04-28 | 1979-11-08 | Shinji Takasaki | Flock measuring device |
| JPS583723B2 (en) * | 1978-07-05 | 1983-01-22 | 株式会社日立製作所 | Agglomeration effect detection device |
| JPS5929281A (en) * | 1982-08-12 | 1984-02-16 | Ricoh Co Ltd | Stripping device of transfer material |
| GB2129549B (en) * | 1982-11-09 | 1986-03-12 | Univ London | Detecting particles and changes in particle size in a suspension |
| DE3344275A1 (en) * | 1983-12-07 | 1985-06-13 | Kleindienst GmbH, 8900 Augsburg | Process and apparatus for treating waste water by flocculation |
| GB2154607B (en) * | 1983-12-23 | 1987-09-23 | Nishihara Env San Res Co Ltd | Microorganism monitoring apparatus |
| DE3412620A1 (en) * | 1984-04-04 | 1985-10-17 | Basf Ag, 6700 Ludwigshafen | LASER OPTICAL ARRANGEMENT FOR MEASURING THE DEGREE OF DISPERSION IN FLOWING SYSTEMS |
| US4654139A (en) * | 1984-06-08 | 1987-03-31 | Hitachi, Ltd. | Flocculation basin in water treatment process |
-
1987
- 1987-04-06 DE DE8787105076T patent/DE3780673T2/en not_active Expired - Lifetime
- 1987-04-06 EP EP87105076A patent/EP0240974B1/en not_active Expired
- 1987-04-10 US US07/037,157 patent/US4783269A/en not_active Expired - Fee Related
Cited By (5)
| Publication number | Priority date | Publication date | Assignee | Title |
|---|---|---|---|---|
| EP0272673A3 (en) * | 1986-12-22 | 1990-02-07 | Passavant-Werke Ag | Method for conditioning and dewatering sludges |
| EP0616206A3 (en) * | 1993-03-17 | 1995-08-16 | Grundig Emv | Turbidity measuring device. |
| RU2165896C1 (en) * | 2000-05-05 | 2001-04-27 | Никольский Александр Анатольевич | Method of estimation of conditions for introducing flocculant |
| WO2002020116A3 (en) * | 2000-09-06 | 2002-12-12 | Stockhausen Chem Fab Gmbh | Device and method for particle agglomeration |
| US10988392B2 (en) | 2016-04-01 | 2021-04-27 | Kemira Oyj | Method and system for optimization of coagulation and/or flocculation in a water treatment process |
Also Published As
| Publication number | Publication date |
|---|---|
| DE3780673D1 (en) | 1992-09-03 |
| EP0240974B1 (en) | 1992-07-29 |
| US4783269A (en) | 1988-11-08 |
| DE3780673T2 (en) | 1992-12-10 |
| EP0240974A3 (en) | 1989-02-22 |
Similar Documents
| Publication | Publication Date | Title |
|---|---|---|
| EP0240974B1 (en) | Injection control system of flocculating agent | |
| US4654139A (en) | Flocculation basin in water treatment process | |
| JPH0483504A (en) | Flocculant injection controlling apparatus | |
| KR101999696B1 (en) | Method for controlling water purification using real-time image analysis | |
| US20230106343A1 (en) | Water treatment system, control device, water treatment method, and program | |
| US5324431A (en) | Process for treating suspended substances in liquor | |
| WO2021053984A1 (en) | Water treatment system, control device, water treatment method, and program | |
| JPH06226011A (en) | Flocculant injection control method in water treatment flocculation process and flocculant injection control device | |
| JP2539179B2 (en) | Device for monitoring substances suspended in water | |
| JPS63269043A (en) | Aggregate image recognition device | |
| JP3136554B2 (en) | Sludge coagulation equipment | |
| JPH0425041B2 (en) | ||
| JPH0661410B2 (en) | Coagulant injection controller for water purification plants | |
| JP7339105B2 (en) | Water treatment system, controller, water treatment method and program | |
| JPH05240767A (en) | Floc measuring/controlling device | |
| JPH0640928B2 (en) | Coagulant injection controller for water purification plants | |
| JPH0720522B2 (en) | Flocculant injection controller | |
| JPH05285308A (en) | Controller for injecting flocculant | |
| JPH076906B2 (en) | Image recognition device for aggregates or particulate objects | |
| JPS63252512A (en) | Coagulant injection control device | |
| JPH0817891B2 (en) | Flocculant injection amount control device | |
| JPH02184304A (en) | Method for controlling injection of flocculant | |
| JPH02152507A (en) | Coagulant injection control device | |
| JPS62239278A (en) | Image recognizing device for agglomerate | |
| JPS63252511A (en) | Coagulant injection control device |
Legal Events
| Date | Code | Title | Description |
|---|---|---|---|
| PUAI | Public reference made under article 153(3) epc to a published international application that has entered the european phase |
Free format text: ORIGINAL CODE: 0009012 |
|
| AK | Designated contracting states |
Kind code of ref document: A2 Designated state(s): CH DE FR GB IT LI NL SE |
|
| PUAL | Search report despatched |
Free format text: ORIGINAL CODE: 0009013 |
|
| AK | Designated contracting states |
Kind code of ref document: A3 Designated state(s): CH DE FR GB IT LI NL SE |
|
| 17P | Request for examination filed |
Effective date: 19890728 |
|
| 17Q | First examination report despatched |
Effective date: 19900528 |
|
| GRAA | (expected) grant |
Free format text: ORIGINAL CODE: 0009210 |
|
| AK | Designated contracting states |
Kind code of ref document: B1 Designated state(s): CH DE FR GB IT LI NL SE |
|
| REF | Corresponds to: |
Ref document number: 3780673 Country of ref document: DE Date of ref document: 19920903 |
|
| ET | Fr: translation filed | ||
| ITF | It: translation for a ep patent filed | ||
| PLBE | No opposition filed within time limit |
Free format text: ORIGINAL CODE: 0009261 |
|
| STAA | Information on the status of an ep patent application or granted ep patent |
Free format text: STATUS: NO OPPOSITION FILED WITHIN TIME LIMIT |
|
| 26N | No opposition filed | ||
| EAL | Se: european patent in force in sweden |
Ref document number: 87105076.1 |
|
| PGFP | Annual fee paid to national office [announced via postgrant information from national office to epo] |
Ref country code: FR Payment date: 19990318 Year of fee payment: 13 |
|
| PGFP | Annual fee paid to national office [announced via postgrant information from national office to epo] |
Ref country code: SE Payment date: 19990322 Year of fee payment: 13 |
|
| PGFP | Annual fee paid to national office [announced via postgrant information from national office to epo] |
Ref country code: CH Payment date: 19990323 Year of fee payment: 13 |
|
| PGFP | Annual fee paid to national office [announced via postgrant information from national office to epo] |
Ref country code: NL Payment date: 19990324 Year of fee payment: 13 |
|
| PGFP | Annual fee paid to national office [announced via postgrant information from national office to epo] |
Ref country code: GB Payment date: 19990325 Year of fee payment: 13 |
|
| PGFP | Annual fee paid to national office [announced via postgrant information from national office to epo] |
Ref country code: DE Payment date: 19990630 Year of fee payment: 13 |
|
| PG25 | Lapsed in a contracting state [announced via postgrant information from national office to epo] |
Ref country code: GB Free format text: LAPSE BECAUSE OF NON-PAYMENT OF DUE FEES Effective date: 20000406 |
|
| PG25 | Lapsed in a contracting state [announced via postgrant information from national office to epo] |
Ref country code: SE Free format text: LAPSE BECAUSE OF NON-PAYMENT OF DUE FEES Effective date: 20000407 |
|
| PG25 | Lapsed in a contracting state [announced via postgrant information from national office to epo] |
Ref country code: LI Free format text: LAPSE BECAUSE OF NON-PAYMENT OF DUE FEES Effective date: 20000430 Ref country code: CH Free format text: LAPSE BECAUSE OF NON-PAYMENT OF DUE FEES Effective date: 20000430 |
|
| PG25 | Lapsed in a contracting state [announced via postgrant information from national office to epo] |
Ref country code: NL Free format text: LAPSE BECAUSE OF NON-PAYMENT OF DUE FEES Effective date: 20001101 |
|
| GBPC | Gb: european patent ceased through non-payment of renewal fee |
Effective date: 20000406 |
|
| EUG | Se: european patent has lapsed |
Ref document number: 87105076.1 |
|
| REG | Reference to a national code |
Ref country code: CH Ref legal event code: PL |
|
| PG25 | Lapsed in a contracting state [announced via postgrant information from national office to epo] |
Ref country code: FR Free format text: LAPSE BECAUSE OF NON-PAYMENT OF DUE FEES Effective date: 20001229 |
|
| NLV4 | Nl: lapsed or anulled due to non-payment of the annual fee |
Effective date: 20001101 |
|
| PG25 | Lapsed in a contracting state [announced via postgrant information from national office to epo] |
Ref country code: DE Free format text: LAPSE BECAUSE OF NON-PAYMENT OF DUE FEES Effective date: 20010201 |
|
| REG | Reference to a national code |
Ref country code: FR Ref legal event code: ST |
|
| PG25 | Lapsed in a contracting state [announced via postgrant information from national office to epo] |
Ref country code: IT Free format text: LAPSE BECAUSE OF NON-PAYMENT OF DUE FEES;WARNING: LAPSES OF ITALIAN PATENTS WITH EFFECTIVE DATE BEFORE 2007 MAY HAVE OCCURRED AT ANY TIME BEFORE 2007. THE CORRECT EFFECTIVE DATE MAY BE DIFFERENT FROM THE ONE RECORDED. Effective date: 20050406 |