EP0220289B1 - Unblutige messung der blutströmung mittels synchronisierung durch den herzschlag - Google Patents
Unblutige messung der blutströmung mittels synchronisierung durch den herzschlag Download PDFInfo
- Publication number
- EP0220289B1 EP0220289B1 EP86903095A EP86903095A EP0220289B1 EP 0220289 B1 EP0220289 B1 EP 0220289B1 EP 86903095 A EP86903095 A EP 86903095A EP 86903095 A EP86903095 A EP 86903095A EP 0220289 B1 EP0220289 B1 EP 0220289B1
- Authority
- EP
- European Patent Office
- Prior art keywords
- signals
- reflection coefficients
- residual energy
- channel
- sampled
- Prior art date
- Legal status (The legal status is an assumption and is not a legal conclusion. Google has not performed a legal analysis and makes no representation as to the accuracy of the status listed.)
- Expired
Links
Images


Classifications
-
- A—HUMAN NECESSITIES
- A61—MEDICAL OR VETERINARY SCIENCE; HYGIENE
- A61B—DIAGNOSIS; SURGERY; IDENTIFICATION
- A61B8/00—Diagnosis using ultrasonic, sonic or infrasonic waves
- A61B8/06—Measuring blood flow
Definitions
- This invention pertains to a blood system and a corresponding method according to the introductory portions of claims 1 and 8 respectively.
- the Doppler method is the most commonly used non-invasive method for performing blood flow analysis and can be repeated as necessary. In general, this method involves the transmission of an ultrasound signal through the skin to a blood vessel and the detection of the Doppler shift in the reflected ultrasound signal resulting from the movement of the red blood cells. The Doppler shifted ultrasound signal is then utilized to determine the velocity of blood flow. The latter determination is complicated due to the presence of noise in the Doppler shifted signal, and because there are sets of blood cells moving at different velocities. Each of these sets of blood cells gives rise to a different frequency shift resulting in a Doppler shifted signal that is a complex wave.
- noise that is present in the Doppler shifted signal is that due to the movement of blood vessel walls. The wall of a blood vessel moves out during the systole portion and returns during the systole portion of the cardiac cycle. These movements result in both low- and high-frequency noise components in the Doppler shifted signal.
- the problem is that the technique utilizing autoregressive analysis requires the calculation of the power spectra for each channel of every cycle and the large amount of data on an individual patient basis requires a large amount of storage.
- a blood flow analysis system like that defined in the first part of claim 1 is known from US-A-4 476 874.
- the invention is based on the problem to provide for a blood flow analysis system and method which allows a non-invasive Doppler-type blood flow analysis in the presence of noise and taking into account the variations in cardiac cycles without needing large amount of storage.
- a departure in the art is achieved by performing an autoregressive analysis of reflected Doppler shifted ultrasonic signals resulting from the blood cell movement to determine the amount of flow by averaging the reflection coefficients and residual energy levels resulting from the autoregressive analysis.
- Each cardiac cycle of a patient is divided into a predefined number of time segments or channels by first determining the start and the end of each cardiac cycle from the patient's electrocardiogram signals.
- An autoregressive analysis is then performed on each individual channel to determine the reflection coefficients and the residual energy level for each channel.
- the reflection coefficients resulting from the autoregressive analysis closely model the blood flow within the patient's internal blood vessel and can be performed in an economical manner.
- the residual energy represents energy not accounted for by that modelling.
- the reflection coefficients and residual energy level for individual channels are then averaged over all of the cycles resulting in a small amount of data that represents the blood flow within the patient's blood vessel.
- These averaged reflection coefficients and residual energy levels can then be stored in economical mass storage devices for later analysis and display.
- the reflection coefficients and residual energy level data are utilized to calculate averaged power spectra for individual averaged channels.
- these averaged power spectra are then displayed on a channel basis using different colors to represent different power levels thus greatly enhancing the ease of interpretation by medical personnel.
- an autoregressive analysis system for obtaining the average power spectrum of a plurality of signal groups each comprising a plurality of information signals functions by a first set of steps determining the start and end of each of set signal groups, and a second set of steps is responsive to the information signals of each group for calculating reflection coefficients.
- a third set of steps is responsive to the information signals and the reflection coefficients for a given group to generate a residual energy level for each group.
- a fourth set of steps computes the average of the reflection coefficients and the average of the residual energy levels over all the groups.
- a fifth set of steps is responsive to the averaged reflection coefficients and averaged residual energy level for generating an average power spectrum.
- the autoregressive analysis system utilizes a Doppler shifted flow meter to transmit a beam of ultrasonic frequency acoustical waves into an internal patient vessel and for receiving the reflected acoustical echoed signal back from moving blood cells within the internal patient vessel and determining the difference between the transmitted and received signals.
- An analog-to-digital (ADC) converter is used to convert the sampled difference signals into digitized signals which are the information signals of the signal groups.
- an electrocardiogram instrument is used to obtain the patient's electrocardiogram signals, and a second ADC converter digitizes the electrocardiogram signals.
- the first set of steps is responsive to the digitized electrocardiogram signals for determining the start and end of the signal groups which correspond to the start and end of cardiac cycles.
- the second set of steps which calculates the reflection coefficients comprises three subsets of program instructions.
- the first subset of steps computes a forward error between each of the information signals of each signal group and subsequent ones of the information signals of the same group, and a second subset of steps computes backward error signals for each of the information signals of each group representing the difference between each information signal and the preceding information signals of the same group.
- the third subset of steps computes the reflection coefficients in response to the backward and forward error signals for each of the groups.
- a method for determining the amount of blood flow by utilization of a system comprising a Doppler flow meter, electrocardiogram instrument, analog-to-digital converters, and a digital computer performs the following steps: determines the start and end of a patient's cardiac cycles in response to electrocardiogram signals by an analysis of digitized signals from the electrocardiogram instrument, digitizing Doppler shifted signals from the flow meter by utilization of an analog-to-digital converter, dividing the resulting digitized Doppler shifted signals into a predefined number of time channels, calculating reflection coefficients for each of said channels for said Doppler shifted signals, computing residual energy level in response to the calculated reflection coefficients and the Doppler shifted signals for each of said channels, averaging the reflection coefficients and the residual energy levels for particular channels over all of the cardiac cycles, and calculating the power spectrum from the averaged reflection coefficients and averaged residual energy level for each channel.
- the method further comprises the steps of normalizing the average power spectrum for each of the combined channels and displaying the normalized power spectrum for each channel utilizing different colors to represent the different power levels thus enhancing the display for the ease of medical personnel performing an analysis of the amount of blood flow.
- FIG. 1 A system for analyzing and displaying the flow of blood within a blood vessel is illustrated in FIG. 1.
- Doppler flow meter 102 and ultrasonic transducer 101 generate an analog Doppler shifted signal that corresponds to the speed of the red blood cells (RBC) that are moving in a blood vessel.
- the frequency of the signal indicates the speed at which the blood cells are moving, and the power observed at a particular frequency indicates the number of blood cells moving at that frequency. Because of such factors as the angle of the probe and other complex physical factors, the energy does not literally correspond to the number of red cells. However, the energy is roughly proportional to the number of cells moving at any given speed.
- the Doppler shifted signal is converted to digital form by analog-to-digital converter 103.
- computer 106 is responsive to the digitized Doppler shifted signal to store the signals along with the digitized EKG signal from electrocardiogram unit 104. After the information for a number of cardiac cycles has been stored, computer 106 is responsive to the digitized Doppler shifted signals and the digitized EKG signals to calculate the spectral power present at the various frequencies, to average the spectral powers for a number of cycles together, and to display this average spectral power over the time required for one cycle.
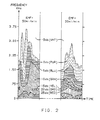
- FIG. 2 illustrates the information that is displayed by computer 106 in analyzing the blood flow. Illustrated in FIG. 2 are the results of two tests performed on a piglet weighing approximately 4.2 kilograms and whose blood was artificially controlled. The blood flow rate was also monitored using electromagnetic flow meter that required surgical procedures and the results of the electromagnetic flow meter (EMF) are shown in the upper portion of each cycle of FIG. 2. The difference between a flow rate of 50 milliliters per minute and a flow rate of 20 milliliters per minute, as determined by the EMF meter, is quite apparent in FIG. 2 and readily discernible by medical personnel. Each test is divided into a number of time segments referred to as channels; and illustratively, there may be 50 channels per cardiac cycle.
- channels illustratively, there may be 50 channels per cardiac cycle.
- the display illustrates the average of the power on a per-channel basis for a plurality of cycles by first determining the reflection coefficients and the residual energy by utilizing autoregressive analysis techniques for each cycle, averaging the reflection coefficients and residual energy for individual channels for all of the cycles, and then determining the power level for each individual channel from the averaged reflection coefficients and averaged residual energy.
- the display illustrated in FIG. 2 is produced by accurately determining the start of each cardiac cycle and the end of the cycle by analyzing the EKG signals from the patient. Once the start and end of the cardiac cycle is determined, then the digitized Doppler shifted signals in this time period are illustratively divided up into 50 channels.
- autoregressive analysis is performed on all of the Doppler shifted signals in a given channel to determine the reflection coefficients and residual energy of that channel.
- Some implementations of autoregressive analysis are the maximum entropy method of Berg or the Durbin Levinson Recursions on Autocorrelation Coefficients method. After all of the channels for one cycle have been processed, then the next cycle is processed. When all of the reflection coefficients and residual energies for all of the channels of all of the cardiac cycles have been determined, the average of the reflection coefficients and the residual energies of individual channels of all of the cycles is taken. Finally, the power spectrum for each individual averaged channel is determined from the averaged reflection coefficients and residual energies for that channel and the resulting power spectra of the average channels is then displayed with different colors representing different power levels.
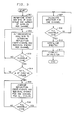
- FIG. 3 illustrates in greater detail the steps necessary to produce a display such as illustrated in FIG. 2.
- block 301 determines the start and end of the cycle and the number of samples per channel. Reflection coefficients and residual energy for each channel are then determined by blocks 302, 303, and 304.
- Block 302 performs an autoregressive analysis of the samples for one channel to determine the reflection coefficients and the residual energy.
- the reflection coefficients define a model constructed by the autoregressive analysis of red blood cell movement.
- the residual energy is the amount of energy unaccounted for by the model.
- the reflection coefficients and residual energy are later averaged by blocks 305 and 306 and those averaged coefficients and energies are used to determine the spectrum for each averaged channel by block 307.
- the average of the reflection coefficients and the residual energy for each particular channel of all of the channels is then calculated by blocks 305 and 306.
- the result of these averaging calculations is reflection coefficients and energy for each channel which represent the average for that channel over all of the cycles.
- the power spectrum of each channel is calculated for a multitude of frequencies utilizing the averaged reflection coefficients and residual energy for this particular channel as calculated in block 305.
- block 307 and 308 determine the average spectrum for each channel. Once the average spectra for all of the cycles has been calculated, the latter is displayed by block 311 on a color printer. Before display, the average spectra is normalized to take out variations due to the differences of the gain in the Doppler flow meter 102.
- the input signal e(n) can be interpreted as the prediction error between the actual data sample x(n) and the linear combination of the previous n samples given by
- the common analysis procedure is to minimize the sum of the squares of this error as a method for determining the filter coefficients.
- the Berg method solves for the filter coefficients, fc(m), by using a forward and backward prediction errors. For any given point, the error is calculated by considering the points in time preceding the sample point under calculations and points prior to the particular point under consideration.
- the forward error is defined by: while the backward error is defined by: where the values of index k range from 1 to (NPTS - ORDER) and fc(0) is defined as 1.
- NPTS is the number of sample points in the channel being analyzed.
- the problem is to determine the set of filter coefficients that minimize the sum of both the forward and backward errors summed over all sample points subject to a constraint.
- FC represents the coefficients determined when ORDER - 1 terms were used in the prediction equation.
- This relation is called the Levinson recursion, and the term, rc(ORDER), is frequently referred to as the LPC reflection coefficient.
- FIGS. 5 and 6 illustrate steps for evaluating equation 8.
- the power spectrum for any frequency, f is given by where fsample is the frequency at which the original signal was sampled, P(f) is the power at the particular frequency f, and PE is a measure of the residual energy left over in the autoregressive analysis.
- ABS represents the magnitude function of a complex number.
- equation 9 is transformed into equation 10 for the following reasons.
- the power is computed in db to avoid large numbers.
- log(P(f)) is the quantity calculated.
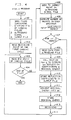
- steps ulpc.c The process of performing the autoregressive analysis, as defined in block 302 of FIG. 3, is shown in greater detail in the flowchart illustrated in FIG. 4 as steps ulpc.c.
- the steps first open the necessary files, block 401, in order to gain access to the digitized Doppler signal and the points which define the start and end of the cardiac cycles.
- Block 402 first reads the beginning of the first cycle and blocks 403 and 404 checks if the entire file has been read. If the entire file has been read, then the steps are finished. However, if the entire file has not been read, block 405 utilizes the starting point of the cardiac cycle to seek to the proper place in the Doppler signal file.
- Block 406 then computes the number of sample points for each channel by dividing the total number of samples by the number of channels. Illustratively, the number of channels is 50. Blocks 407 through 414 then compute the reflection coefficients and residual energy for a particular channel. For each channel, the data samples of that channel are utilized to calculate the reflection coefficients and the residual energy in block 409. The latter block implements the Berg method by utilizing fberg steps which are illustrated in FIGS. 5 and 6. The reflection coefficients are then stored in an output file by block 410. The reason for storing reflection coefficients rather than the filter coefficients themselves is that the reflection coefficients are bounded between 1 and -1 whereas the filter coefficients can be quite large or small. The residual energy is converted to db and stored by blocks 411 and 412. Blocks 413 and 414 determine whether or not all the points of the channel have been utilized. If they have, then the steps return to block 403 to process another cycle.
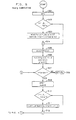
- the fberg steps is illustrated in greater detail in FIGS. 5 and 6. These steps calculate equation 8 and verifies that the conditions of equation 7 have been met.
- the fberg steps calculate equation 8 in a recursive manner by first calculating the first reflection filter coefficient for order 1 and then uses this information to calculate a new set of filter coefficients for order 2. Because of this recursive nature, fberg steps are repetitively recalculating equation 8.
- Blocks 501 through 506, illustrated on FIG. 5, perform the initialization of the various variables used by the subroutine.
- the initial residual energy, etot is set equal to the sum of the squares of all the data points of the channel and the backward and forward errors (berr and ferr, respectively) are set equal to corresponding data samples, where the data sample is the digitized Doppler signal.
- the filter coefficients are initially set equal to 1 by block 506 and the denominator of equation 8 is set equal to the initial residual energy as determined by block 503.
- FIGS. 5 and 6 illustrate the evaluation of equation 8.
- Block 507 determines whether or not the equation has been sufficiently evaluated for the order filter being calculated, and if it has, a return is executed to the program illustrated on FIG. 4 via return block 508. If the filter has not yet been calculated to a sufficient order, then block 509 is executed.
- the numerator and denominator (num and den, respectively) of equation 8 for this particular order are evaluated by blocks 510 through 513. After the numerator and denominator have been determined, then the reflection coefficient, rc[m], and residual energy for this particular order are evaluated in block 514.
- the stepup function is implemented by blocks 515 through 519 to update the previously determined filter coefficients for (ORDER - 1) as defined by the Levinson recursion formula and given in equation 7.
- the highest order filter coefficient is always equal to the reflection coefficient and is set equal to the reflection coefficient by block 520.
- the past filter coefficients are then uptdated by blocks 521 through 523 in order for block 517 to evaluate the next set of filter coefficients.
- the past filter coefficients are designated as FC(n) in equation 7, and as pfc[n] on FIGS. 5 and 6.
- the forward and backward errors are next updated by blocks 524 through 526 in order to evaluate blocks 511 and 513 in the next iteration. After the forward and backward errors have been updated, control is passed from blcok 526 to decision block 507 which determines whether or not all the orders have been evaluated.
- the average for each individual channel over all cycles is performed as illustrated in blocks 305 and 306.
- the power spectrum for each channel is calculated for a plurality of frequencies as defined in equation 10.
- equation 10 is evaluated for 150 different frequencies by blocks 307 and 308.
- the resulting power spectra is normalized by block 310 and then displayed by block 311.
- Blocks 305 through 310 are implemented by the cfdspect.c steps which are illustrated as a flowchart in FIG. 7.
- Blocks 701 through 704 perform the initialization required for the execution of the cfdspect.c program.
- the sine and cosine values of equation 10 are initially evaluated and stored so as to save processing time.
- the av array which is used to hold the averages for the spectra for the different channels is initialized to 0.
- the arrays which hold the values for the reflection coefficients and the residual energy levels for all the channels of all the cycles are initialized by block 715 reading this information from a file created by blocks 410 and 412 of FIG. 4.
- block 716 sums the reflection coefficients and residual energy level for each particular channel for all cycles with reflection coefficients for the same filter element being summed together for all cycles.
- the power spectrum for each combined channel is calculated by blocks 706 through 710 in the following manner.
- the average of the reflection coefficients and the residual energy level is calculated by block 707.
- Block 708 then converts the reflection coefficients for the channel into filter coefficients by executing the stepup subroutine that implements equation 7. These steps are illustrated in FIG. 8.
- the power spectrum is calculated by block 709 which uses the cspect steps of FIG. 10. Blocks 706 and 706 control the steps so that the previous calculations are performed for all of the combined channels.
- blocks 711, 728, and 729 are executed implementing block 310 of FIG. 3 which normalizes and stores the resulting spectra of all of the cycles.
- the normalized spectra are displayed on a color printer.
Landscapes
- Health & Medical Sciences (AREA)
- Life Sciences & Earth Sciences (AREA)
- Heart & Thoracic Surgery (AREA)
- Medical Informatics (AREA)
- Biophysics (AREA)
- Nuclear Medicine, Radiotherapy & Molecular Imaging (AREA)
- Pathology (AREA)
- Radiology & Medical Imaging (AREA)
- Engineering & Computer Science (AREA)
- Biomedical Technology (AREA)
- Hematology (AREA)
- Physics & Mathematics (AREA)
- Molecular Biology (AREA)
- Surgery (AREA)
- Animal Behavior & Ethology (AREA)
- General Health & Medical Sciences (AREA)
- Public Health (AREA)
- Veterinary Medicine (AREA)
- Ultra Sonic Daignosis Equipment (AREA)
- Measuring Volume Flow (AREA)
Claims (11)
gekennzeichnet durch
gekennzeichnet durch die Verfahrensschritte:
Applications Claiming Priority (2)
| Application Number | Priority Date | Filing Date | Title |
|---|---|---|---|
| US06/730,487 US4719923A (en) | 1985-05-06 | 1985-05-06 | Non-invasive blood flow measurements utilizing autoregressive analysis with averaged reflection coefficients |
| US730487 | 1985-05-06 |
Publications (2)
| Publication Number | Publication Date |
|---|---|
| EP0220289A1 EP0220289A1 (de) | 1987-05-06 |
| EP0220289B1 true EP0220289B1 (de) | 1990-10-24 |
Family
ID=24935565
Family Applications (1)
| Application Number | Title | Priority Date | Filing Date |
|---|---|---|---|
| EP86903095A Expired EP0220289B1 (de) | 1985-05-06 | 1986-05-02 | Unblutige messung der blutströmung mittels synchronisierung durch den herzschlag |
Country Status (6)
| Country | Link |
|---|---|
| US (1) | US4719923A (de) |
| EP (1) | EP0220289B1 (de) |
| JP (1) | JPS63500148A (de) |
| CA (1) | CA1265607A (de) |
| DE (1) | DE3675146D1 (de) |
| WO (1) | WO1986006608A1 (de) |
Families Citing this family (33)
| Publication number | Priority date | Publication date | Assignee | Title |
|---|---|---|---|---|
| US5218969A (en) * | 1988-02-04 | 1993-06-15 | Blood Line Technology, Inc. | Intelligent stethoscope |
| US5010889A (en) * | 1988-02-04 | 1991-04-30 | Bloodline Technology | Intelligent stethoscope |
| US5213108A (en) * | 1988-02-04 | 1993-05-25 | Blood Line Technology, Inc. | Visual display stethoscope |
| US4932415A (en) * | 1988-11-14 | 1990-06-12 | Vingmed Sound A/S | Method of color coding two dimensional ulltrasonic doppler velocity images of blood flow on a display |
| US5107841A (en) * | 1989-11-27 | 1992-04-28 | Acoustic Imaging Technologies Corporation | Maximum entropy velocity estimator for ultrasonic flow imaging system |
| JPH03228752A (ja) * | 1990-02-05 | 1991-10-09 | Hitachi Ltd | 高限界速パルスドプラ計測装置 |
| US5058594A (en) * | 1990-08-29 | 1991-10-22 | Quantum Medical Systems, Incorporated | Direct velocity estimator for ultrasound blood flow imaging |
| US5226420A (en) * | 1991-06-07 | 1993-07-13 | Advanced Technology Laboratories, Inc. | Ultrasonic color flow imaging using autoregressive processing |
| US5327893A (en) * | 1992-10-19 | 1994-07-12 | Rensselaer Polytechnic Institute | Detection of cholesterol deposits in arteries |
| US5562098A (en) * | 1995-03-20 | 1996-10-08 | Lifesigns Corporation | Ultrasonic measurement of blood flow velocity independent of probe angle |
| US6030345A (en) * | 1997-05-22 | 2000-02-29 | Acuson Corporation | Method and system for ultrasound enhanced-resolution spectral Doppler |
| US6471655B1 (en) | 1999-06-29 | 2002-10-29 | Vitalwave Corporation | Method and apparatus for the noninvasive determination of arterial blood pressure |
| US6899684B2 (en) * | 1999-08-02 | 2005-05-31 | Healthetech, Inc. | Method of respiratory gas analysis using a metabolic calorimeter |
| US6468222B1 (en) | 1999-08-02 | 2002-10-22 | Healthetech, Inc. | Metabolic calorimeter employing respiratory gas analysis |
| US6629934B2 (en) | 2000-02-02 | 2003-10-07 | Healthetech, Inc. | Indirect calorimeter for medical applications |
| US6554774B1 (en) * | 2000-03-23 | 2003-04-29 | Tensys Medical, Inc. | Method and apparatus for assessing hemodynamic properties within the circulatory system of a living subject |
| US6705990B1 (en) | 2000-07-25 | 2004-03-16 | Tensys Medical, Inc. | Method and apparatus for monitoring physiologic parameters of a living subject |
| US6607387B2 (en) | 2000-10-30 | 2003-08-19 | Healthetech, Inc. | Sensor system for diagnosing dental conditions |
| DE60207211T2 (de) | 2001-03-02 | 2006-08-03 | Palti, Yoram, Prof. Dr.med. | Gerät zur detektierung arterieller stenose |
| US20030023181A1 (en) * | 2001-07-26 | 2003-01-30 | Mault James R. | Gas analyzer of the fluorescent-film type particularly useful for respiratory analysis |
| US20030105407A1 (en) * | 2001-11-30 | 2003-06-05 | Pearce, Edwin M. | Disposable flow tube for respiratory gas analysis |
| US6730038B2 (en) * | 2002-02-05 | 2004-05-04 | Tensys Medical, Inc. | Method and apparatus for non-invasively measuring hemodynamic parameters using parametrics |
| AU2003223420A1 (en) * | 2002-04-01 | 2003-10-20 | Healthetech, Inc. | System and method of determining an individualized drug administration dosage |
| USD478660S1 (en) | 2002-07-01 | 2003-08-19 | Healthetech, Inc. | Disposable mask with sanitation insert for a respiratory analyzer |
| US7946994B2 (en) * | 2004-10-07 | 2011-05-24 | Tensys Medical, Inc. | Compact apparatus and methods for non-invasively measuring hemodynamic parameters |
| US7520860B2 (en) * | 2005-04-13 | 2009-04-21 | Marie G. Johnson | Detection of coronary artery disease using an electronic stethoscope |
| EP2020911A4 (de) | 2006-05-13 | 2011-07-27 | Tensys Medical Inc | Kontinuierliches positionierungsgerät und verfahren |
| WO2009023807A1 (en) * | 2007-08-15 | 2009-02-19 | Massachusetts Institute Of Technology | Speech processing apparatus and method employing feedback |
| US8777862B2 (en) | 2007-10-12 | 2014-07-15 | Tensys Medical, Inc. | Apparatus and methods for non-invasively measuring a patient's arterial blood pressure |
| US20100004542A1 (en) * | 2008-07-03 | 2010-01-07 | Texas Instruments Incorporated | System and method for ultrasound color doppler imaging |
| WO2010127429A1 (en) * | 2009-05-08 | 2010-11-11 | University Of Toronto | Ultrasonic scanning system and ultrasound image enhancement method |
| WO2011071989A2 (en) * | 2009-12-08 | 2011-06-16 | Aum Cardiovascular, Llc | Systems and methods for detecting cardiovascular disease |
| JP7216720B2 (ja) | 2017-09-25 | 2023-02-01 | コーニンクレッカ フィリップス エヌ ヴェ | 音響クラッタ及びランダムノイズをフィルタリングするための方法及びシステム |
Family Cites Families (14)
| Publication number | Priority date | Publication date | Assignee | Title |
|---|---|---|---|---|
| US4109647A (en) * | 1977-03-16 | 1978-08-29 | The United States Of America As Represented By The Secretary Of The Department Of Health, Education And Welfare | Method of and apparatus for measurement of blood flow using coherent light |
| US4205687A (en) * | 1977-07-29 | 1980-06-03 | Diagnostic Electronics Corporation | Color coded blood flow velocity display equipment |
| US4271842A (en) * | 1978-03-03 | 1981-06-09 | Smith Kline Instruments, Inc. | Apparatus and method for providing multiple ultrasonic sector image displays |
| US4217909A (en) * | 1978-08-23 | 1980-08-19 | General Electric Company | Directional detection of blood velocities in an ultrasound system |
| US4182173A (en) * | 1978-08-23 | 1980-01-08 | General Electric Company | Duplex ultrasonic imaging system with repetitive excitation of common transducer in doppler modality |
| FR2447041A1 (fr) * | 1979-01-19 | 1980-08-14 | Inst Nat Sante Rech Med | Perfectionnements aux velocimetres doppler a bruit pseudo-aleatoires |
| DE2911258C2 (de) * | 1979-03-22 | 1982-09-23 | Chmiel, Horst, Prof. Dr.-Ing., 7250 Leonberg | Vorrichtung zum noninvasiven Messen der Blutströmungsgeschwindigkeit nach der Ultraschall-Doppler-Effekt-Methode |
| US4265126A (en) * | 1979-06-15 | 1981-05-05 | General Electric Company | Measurement of true blood velocity by an ultrasound system |
| US4257278A (en) * | 1979-08-24 | 1981-03-24 | General Electric Company | Quantitative volume blood flow measurement by an ultrasound imaging system featuring a Doppler modality |
| US4324258A (en) * | 1980-06-24 | 1982-04-13 | Werner Huebscher | Ultrasonic doppler flowmeters |
| JPS5897347A (ja) * | 1981-12-03 | 1983-06-09 | 株式会社東芝 | 超音波診断装置 |
| US4476874A (en) * | 1982-06-01 | 1984-10-16 | Sri International | Ultrasonic imaging with volume flow measuring method and apparatus |
| JPS5920820A (ja) * | 1982-07-28 | 1984-02-02 | Aloka Co Ltd | 超音波血流画像形成装置 |
| US4542744A (en) * | 1983-03-23 | 1985-09-24 | North American Philips Corporation | Method and apparatus for remote tissue identification by statistical modeling and hypothesis testing of echo ultrasound signals |
-
1985
- 1985-05-06 US US06/730,487 patent/US4719923A/en not_active Expired - Lifetime
-
1986
- 1986-05-02 EP EP86903095A patent/EP0220289B1/de not_active Expired
- 1986-05-02 JP JP61502670A patent/JPS63500148A/ja active Pending
- 1986-05-02 WO PCT/US1986/000973 patent/WO1986006608A1/en not_active Ceased
- 1986-05-02 DE DE8686903095T patent/DE3675146D1/de not_active Expired - Fee Related
- 1986-05-05 CA CA000508396A patent/CA1265607A/en not_active Expired - Fee Related
Also Published As
| Publication number | Publication date |
|---|---|
| US4719923A (en) | 1988-01-19 |
| WO1986006608A1 (en) | 1986-11-20 |
| DE3675146D1 (de) | 1990-11-29 |
| JPS63500148A (ja) | 1988-01-21 |
| EP0220289A1 (de) | 1987-05-06 |
| CA1265607A (en) | 1990-02-06 |
Similar Documents
| Publication | Publication Date | Title |
|---|---|---|
| EP0220289B1 (de) | Unblutige messung der blutströmung mittels synchronisierung durch den herzschlag | |
| EP0221162B1 (de) | Unblutige messung der blutströmung unter anwendung einer herzschlagsynchronisation. | |
| US5701898A (en) | Method and system for Doppler ultrasound measurement of blood flow | |
| US4575799A (en) | Ultrasonic living body tissue characterization system | |
| US8303507B2 (en) | Ultrasonic doppler diagnostic apparatus and measuring method of diagnostic parameter | |
| EP0484619B1 (de) | Gerät für Gewebemessungen | |
| US8388544B2 (en) | System and method for measuring blood viscosity | |
| US5840028A (en) | Ultrasonic diagnostic equipment | |
| US4881549A (en) | Apparatus and method for obtaining ultrasonic backcatter measurement from tissue | |
| US5967987A (en) | Ultrasonic system and method for measurement of fluid flow | |
| EP0091768A2 (de) | Messen der Eigenschaften von lebenden Geweben mittels Ultraschallwellen | |
| US5419332A (en) | Mapping of flow parameters | |
| US9538989B2 (en) | Ultrasound imaging equipment and method | |
| US6293914B1 (en) | Ultrasonic system and method for measurement of fluid flow | |
| Hamelmann et al. | An extended Kalman filter for fetal heart location estimation during Doppler-based heart rate monitoring | |
| CA2463080A1 (en) | Method and system for obtaining dimension related information for a flow channel | |
| US5916170A (en) | Method and apparatus for curvature detection in vessels from phase shifts of a plurality of input electrical signals | |
| US5107840A (en) | Device for measuring and displaying of ultrasonic echography the flow rate of a blood flow and the dilation of the associated vessel | |
| Hirsch et al. | Computer processing of ultrasonic data from the cardiovascular system | |
| Picot et al. | Rapid volume flow rate estimation using transverse colour Doppler imaging | |
| Schlaikjer et al. | Tissue motion in blood velocity estimation and its simulation | |
| Xu | Local measurement of the pulse wave velocity using Doppler ultrasound | |
| Tortoli et al. | A simplified approach for real-time detection of arterial wall velocity and distension | |
| Güler et al. | Application of autoregressive analysis to 20 MHz pulsed Doppler data in real time | |
| Guler et al. | Detection of mitral stenosis by a pulsed Doppler flowmeter and autoregressive spectral analysis method |
Legal Events
| Date | Code | Title | Description |
|---|---|---|---|
| PUAI | Public reference made under article 153(3) epc to a published international application that has entered the european phase |
Free format text: ORIGINAL CODE: 0009012 |
|
| 17P | Request for examination filed |
Effective date: 19870206 |
|
| AK | Designated contracting states |
Kind code of ref document: A1 Designated state(s): BE DE FR GB IT NL SE |
|
| 17Q | First examination report despatched |
Effective date: 19880607 |
|
| GRAA | (expected) grant |
Free format text: ORIGINAL CODE: 0009210 |
|
| AK | Designated contracting states |
Kind code of ref document: B1 Designated state(s): BE DE FR GB IT NL SE |
|
| REF | Corresponds to: |
Ref document number: 3675146 Country of ref document: DE Date of ref document: 19901129 |
|
| ET | Fr: translation filed | ||
| ITF | It: translation for a ep patent filed | ||
| ITTA | It: last paid annual fee | ||
| PLBE | No opposition filed within time limit |
Free format text: ORIGINAL CODE: 0009261 |
|
| STAA | Information on the status of an ep patent application or granted ep patent |
Free format text: STATUS: NO OPPOSITION FILED WITHIN TIME LIMIT |
|
| 26N | No opposition filed | ||
| EAL | Se: european patent in force in sweden |
Ref document number: 86903095.7 |
|
| PGFP | Annual fee paid to national office [announced via postgrant information from national office to epo] |
Ref country code: BE Payment date: 19990329 Year of fee payment: 14 |
|
| PG25 | Lapsed in a contracting state [announced via postgrant information from national office to epo] |
Ref country code: BE Free format text: LAPSE BECAUSE OF NON-PAYMENT OF DUE FEES Effective date: 20000531 |
|
| BERE | Be: lapsed |
Owner name: AMERICAN TELEPHONE AND TELEGRAPH CY Effective date: 20000531 |
|
| REG | Reference to a national code |
Ref country code: GB Ref legal event code: IF02 |
|
| PGFP | Annual fee paid to national office [announced via postgrant information from national office to epo] |
Ref country code: SE Payment date: 20020416 Year of fee payment: 17 |
|
| PGFP | Annual fee paid to national office [announced via postgrant information from national office to epo] |
Ref country code: FR Payment date: 20020423 Year of fee payment: 17 |
|
| PGFP | Annual fee paid to national office [announced via postgrant information from national office to epo] |
Ref country code: GB Payment date: 20020426 Year of fee payment: 17 |
|
| PGFP | Annual fee paid to national office [announced via postgrant information from national office to epo] |
Ref country code: NL Payment date: 20020513 Year of fee payment: 17 |
|
| PGFP | Annual fee paid to national office [announced via postgrant information from national office to epo] |
Ref country code: DE Payment date: 20020628 Year of fee payment: 17 |
|
| PG25 | Lapsed in a contracting state [announced via postgrant information from national office to epo] |
Ref country code: GB Free format text: LAPSE BECAUSE OF NON-PAYMENT OF DUE FEES Effective date: 20030502 |
|
| PG25 | Lapsed in a contracting state [announced via postgrant information from national office to epo] |
Ref country code: SE Free format text: LAPSE BECAUSE OF NON-PAYMENT OF DUE FEES Effective date: 20030503 |
|
| PG25 | Lapsed in a contracting state [announced via postgrant information from national office to epo] |
Ref country code: NL Free format text: LAPSE BECAUSE OF NON-PAYMENT OF DUE FEES Effective date: 20031201 |
|
| PG25 | Lapsed in a contracting state [announced via postgrant information from national office to epo] |
Ref country code: DE Free format text: LAPSE BECAUSE OF NON-PAYMENT OF DUE FEES Effective date: 20031202 |
|
| GBPC | Gb: european patent ceased through non-payment of renewal fee |
Effective date: 20030502 |
|
| EUG | Se: european patent has lapsed | ||
| PG25 | Lapsed in a contracting state [announced via postgrant information from national office to epo] |
Ref country code: FR Free format text: LAPSE BECAUSE OF NON-PAYMENT OF DUE FEES Effective date: 20040130 |
|
| NLV4 | Nl: lapsed or anulled due to non-payment of the annual fee |
Effective date: 20031201 |
|
| REG | Reference to a national code |
Ref country code: FR Ref legal event code: ST |
|
| PG25 | Lapsed in a contracting state [announced via postgrant information from national office to epo] |
Ref country code: IT Free format text: LAPSE BECAUSE OF NON-PAYMENT OF DUE FEES;WARNING: LAPSES OF ITALIAN PATENTS WITH EFFECTIVE DATE BEFORE 2007 MAY HAVE OCCURRED AT ANY TIME BEFORE 2007. THE CORRECT EFFECTIVE DATE MAY BE DIFFERENT FROM THE ONE RECORDED. Effective date: 20050502 |