CN116324425A - Measurement device, measurement system, measurement method, and program - Google Patents
Measurement device, measurement system, measurement method, and program Download PDFInfo
- Publication number
- CN116324425A CN116324425A CN202180064245.9A CN202180064245A CN116324425A CN 116324425 A CN116324425 A CN 116324425A CN 202180064245 A CN202180064245 A CN 202180064245A CN 116324425 A CN116324425 A CN 116324425A
- Authority
- CN
- China
- Prior art keywords
- signal
- light
- unit
- fluid
- characteristic amount
- Prior art date
- Legal status (The legal status is an assumption and is not a legal conclusion. Google has not performed a legal analysis and makes no representation as to the accuracy of the status listed.)
- Pending
Links
- 238000005259 measurement Methods 0.000 title claims description 47
- 238000000691 measurement method Methods 0.000 title claims description 10
- 239000012530 fluid Substances 0.000 claims abstract description 94
- 230000002159 abnormal effect Effects 0.000 claims abstract description 78
- 238000000034 method Methods 0.000 claims description 61
- 230000005856 abnormality Effects 0.000 claims description 20
- 238000003556 assay Methods 0.000 claims description 2
- 238000010586 diagram Methods 0.000 description 43
- 238000012545 processing Methods 0.000 description 30
- 238000002474 experimental method Methods 0.000 description 14
- 238000005070 sampling Methods 0.000 description 9
- 239000000126 substance Substances 0.000 description 8
- 238000001228 spectrum Methods 0.000 description 6
- 239000008280 blood Substances 0.000 description 5
- 210000004369 blood Anatomy 0.000 description 5
- 239000004813 Perfluoroalkoxy alkane Substances 0.000 description 4
- 229920011301 perfluoro alkoxyl alkane Polymers 0.000 description 4
- 210000004204 blood vessel Anatomy 0.000 description 3
- 230000000694 effects Effects 0.000 description 3
- 230000006870 function Effects 0.000 description 3
- 239000004033 plastic Substances 0.000 description 3
- 230000002123 temporal effect Effects 0.000 description 3
- 229910000530 Gallium indium arsenide Inorganic materials 0.000 description 2
- KXNLCSXBJCPWGL-UHFFFAOYSA-N [Ga].[As].[In] Chemical compound [Ga].[As].[In] KXNLCSXBJCPWGL-UHFFFAOYSA-N 0.000 description 2
- 239000007864 aqueous solution Substances 0.000 description 2
- 239000003990 capacitor Substances 0.000 description 2
- 229910010293 ceramic material Inorganic materials 0.000 description 2
- 238000004891 communication Methods 0.000 description 2
- 238000001914 filtration Methods 0.000 description 2
- 239000011521 glass Substances 0.000 description 2
- 239000000463 material Substances 0.000 description 2
- 230000003287 optical effect Effects 0.000 description 2
- 239000011368 organic material Substances 0.000 description 2
- 229920000642 polymer Polymers 0.000 description 2
- 238000002834 transmittance Methods 0.000 description 2
- JBRZTFJDHDCESZ-UHFFFAOYSA-N AsGa Chemical compound [As]#[Ga] JBRZTFJDHDCESZ-UHFFFAOYSA-N 0.000 description 1
- XUIMIQQOPSSXEZ-UHFFFAOYSA-N Silicon Chemical compound [Si] XUIMIQQOPSSXEZ-UHFFFAOYSA-N 0.000 description 1
- PNEYBMLMFCGWSK-UHFFFAOYSA-N aluminium oxide Inorganic materials [O-2].[O-2].[O-2].[Al+3].[Al+3] PNEYBMLMFCGWSK-UHFFFAOYSA-N 0.000 description 1
- 235000013361 beverage Nutrition 0.000 description 1
- 238000011088 calibration curve Methods 0.000 description 1
- 239000002131 composite material Substances 0.000 description 1
- KZHJGOXRZJKJNY-UHFFFAOYSA-N dioxosilane;oxo(oxoalumanyloxy)alumane Chemical compound O=[Si]=O.O=[Si]=O.O=[Al]O[Al]=O.O=[Al]O[Al]=O.O=[Al]O[Al]=O KZHJGOXRZJKJNY-UHFFFAOYSA-N 0.000 description 1
- 230000005611 electricity Effects 0.000 description 1
- 238000005516 engineering process Methods 0.000 description 1
- 239000003822 epoxy resin Substances 0.000 description 1
- 229910052732 germanium Inorganic materials 0.000 description 1
- GNPVGFCGXDBREM-UHFFFAOYSA-N germanium atom Chemical compound [Ge] GNPVGFCGXDBREM-UHFFFAOYSA-N 0.000 description 1
- 239000004973 liquid crystal related substance Substances 0.000 description 1
- 229910052863 mullite Inorganic materials 0.000 description 1
- 229920000647 polyepoxide Polymers 0.000 description 1
- 229920001721 polyimide Polymers 0.000 description 1
- 239000009719 polyimide resin Substances 0.000 description 1
- 239000002952 polymeric resin Substances 0.000 description 1
- 239000000843 powder Substances 0.000 description 1
- 230000004044 response Effects 0.000 description 1
- 239000004065 semiconductor Substances 0.000 description 1
- 229910052710 silicon Inorganic materials 0.000 description 1
- 239000010703 silicon Substances 0.000 description 1
- 239000002356 single layer Substances 0.000 description 1
- 239000000758 substrate Substances 0.000 description 1
- 229920003002 synthetic resin Polymers 0.000 description 1
- XLYOFNOQVPJJNP-UHFFFAOYSA-N water Substances O XLYOFNOQVPJJNP-UHFFFAOYSA-N 0.000 description 1
Images


Classifications
-
- G—PHYSICS
- G01—MEASURING; TESTING
- G01P—MEASURING LINEAR OR ANGULAR SPEED, ACCELERATION, DECELERATION, OR SHOCK; INDICATING PRESENCE, ABSENCE, OR DIRECTION, OF MOVEMENT
- G01P5/00—Measuring speed of fluids, e.g. of air stream; Measuring speed of bodies relative to fluids, e.g. of ship, of aircraft
- G01P5/26—Measuring speed of fluids, e.g. of air stream; Measuring speed of bodies relative to fluids, e.g. of ship, of aircraft by measuring the direct influence of the streaming fluid on the properties of a detecting optical wave
-
- A—HUMAN NECESSITIES
- A61—MEDICAL OR VETERINARY SCIENCE; HYGIENE
- A61B—DIAGNOSIS; SURGERY; IDENTIFICATION
- A61B5/00—Measuring for diagnostic purposes; Identification of persons
- A61B5/02—Detecting, measuring or recording pulse, heart rate, blood pressure or blood flow; Combined pulse/heart-rate/blood pressure determination; Evaluating a cardiovascular condition not otherwise provided for, e.g. using combinations of techniques provided for in this group with electrocardiography or electroauscultation; Heart catheters for measuring blood pressure
- A61B5/026—Measuring blood flow
- A61B5/0285—Measuring or recording phase velocity of blood waves
-
- A—HUMAN NECESSITIES
- A61—MEDICAL OR VETERINARY SCIENCE; HYGIENE
- A61B—DIAGNOSIS; SURGERY; IDENTIFICATION
- A61B5/00—Measuring for diagnostic purposes; Identification of persons
- A61B5/0059—Measuring for diagnostic purposes; Identification of persons using light, e.g. diagnosis by transillumination, diascopy, fluorescence
- A61B5/0075—Measuring for diagnostic purposes; Identification of persons using light, e.g. diagnosis by transillumination, diascopy, fluorescence by spectroscopy, i.e. measuring spectra, e.g. Raman spectroscopy, infrared absorption spectroscopy
-
- A—HUMAN NECESSITIES
- A61—MEDICAL OR VETERINARY SCIENCE; HYGIENE
- A61B—DIAGNOSIS; SURGERY; IDENTIFICATION
- A61B5/00—Measuring for diagnostic purposes; Identification of persons
- A61B5/0059—Measuring for diagnostic purposes; Identification of persons using light, e.g. diagnosis by transillumination, diascopy, fluorescence
- A61B5/0082—Measuring for diagnostic purposes; Identification of persons using light, e.g. diagnosis by transillumination, diascopy, fluorescence adapted for particular medical purposes
-
- A—HUMAN NECESSITIES
- A61—MEDICAL OR VETERINARY SCIENCE; HYGIENE
- A61B—DIAGNOSIS; SURGERY; IDENTIFICATION
- A61B5/00—Measuring for diagnostic purposes; Identification of persons
- A61B5/02—Detecting, measuring or recording pulse, heart rate, blood pressure or blood flow; Combined pulse/heart-rate/blood pressure determination; Evaluating a cardiovascular condition not otherwise provided for, e.g. using combinations of techniques provided for in this group with electrocardiography or electroauscultation; Heart catheters for measuring blood pressure
- A61B5/026—Measuring blood flow
- A61B5/0261—Measuring blood flow using optical means, e.g. infrared light
-
- A—HUMAN NECESSITIES
- A61—MEDICAL OR VETERINARY SCIENCE; HYGIENE
- A61B—DIAGNOSIS; SURGERY; IDENTIFICATION
- A61B5/00—Measuring for diagnostic purposes; Identification of persons
- A61B5/06—Devices, other than using radiation, for detecting or locating foreign bodies ; determining position of probes within or on the body of the patient
-
- A—HUMAN NECESSITIES
- A61—MEDICAL OR VETERINARY SCIENCE; HYGIENE
- A61B—DIAGNOSIS; SURGERY; IDENTIFICATION
- A61B5/00—Measuring for diagnostic purposes; Identification of persons
- A61B5/145—Measuring characteristics of blood in vivo, e.g. gas concentration, pH value; Measuring characteristics of body fluids or tissues, e.g. interstitial fluid, cerebral tissue
- A61B5/1455—Measuring characteristics of blood in vivo, e.g. gas concentration, pH value; Measuring characteristics of body fluids or tissues, e.g. interstitial fluid, cerebral tissue using optical sensors, e.g. spectral photometrical oximeters
-
- A—HUMAN NECESSITIES
- A61—MEDICAL OR VETERINARY SCIENCE; HYGIENE
- A61B—DIAGNOSIS; SURGERY; IDENTIFICATION
- A61B5/00—Measuring for diagnostic purposes; Identification of persons
- A61B5/72—Signal processing specially adapted for physiological signals or for diagnostic purposes
- A61B5/7235—Details of waveform analysis
- A61B5/7253—Details of waveform analysis characterised by using transforms
- A61B5/7257—Details of waveform analysis characterised by using transforms using Fourier transforms
-
- G—PHYSICS
- G01—MEASURING; TESTING
- G01F—MEASURING VOLUME, VOLUME FLOW, MASS FLOW OR LIQUID LEVEL; METERING BY VOLUME
- G01F1/00—Measuring the volume flow or mass flow of fluid or fluent solid material wherein the fluid passes through a meter in a continuous flow
- G01F1/66—Measuring the volume flow or mass flow of fluid or fluent solid material wherein the fluid passes through a meter in a continuous flow by measuring frequency, phase shift or propagation time of electromagnetic or other waves, e.g. using ultrasonic flowmeters
- G01F1/661—Measuring the volume flow or mass flow of fluid or fluent solid material wherein the fluid passes through a meter in a continuous flow by measuring frequency, phase shift or propagation time of electromagnetic or other waves, e.g. using ultrasonic flowmeters using light
-
- G—PHYSICS
- G01—MEASURING; TESTING
- G01F—MEASURING VOLUME, VOLUME FLOW, MASS FLOW OR LIQUID LEVEL; METERING BY VOLUME
- G01F1/00—Measuring the volume flow or mass flow of fluid or fluent solid material wherein the fluid passes through a meter in a continuous flow
- G01F1/74—Devices for measuring flow of a fluid or flow of a fluent solid material in suspension in another fluid
-
- A—HUMAN NECESSITIES
- A61—MEDICAL OR VETERINARY SCIENCE; HYGIENE
- A61B—DIAGNOSIS; SURGERY; IDENTIFICATION
- A61B2562/00—Details of sensors; Constructional details of sensor housings or probes; Accessories for sensors
- A61B2562/02—Details of sensors specially adapted for in-vivo measurements
- A61B2562/0233—Special features of optical sensors or probes classified in A61B5/00
-
- A—HUMAN NECESSITIES
- A61—MEDICAL OR VETERINARY SCIENCE; HYGIENE
- A61B—DIAGNOSIS; SURGERY; IDENTIFICATION
- A61B5/00—Measuring for diagnostic purposes; Identification of persons
- A61B5/74—Details of notification to user or communication with user or patient ; user input means
- A61B5/746—Alarms related to a physiological condition, e.g. details of setting alarm thresholds or avoiding false alarms
Abstract
The measuring device includes a light emitting unit, a light receiving unit, a determining unit, and a calculating unit. The light-emitting unit irradiates light on an object to be irradiated, which has fluid flowing therein. The light receiving unit receives interference light of light scattered by the object to be irradiated, and outputs an output signal corresponding to the intensity of the interference light. The determination unit obtains a characteristic amount indicating a characteristic of a signal waveform of the output signal, and determines an abnormal signal contained in the output signal based on the obtained characteristic amount. The calculating unit calculates a flow state value indicating a state of the flow of the fluid based on a signal other than the abnormal signal in the output signal.
Description
Cross-reference to related applications
The present application claims priority from japanese application 2020-162391 (application 9/28/2020), the disclosure of which is incorporated herein by reference in its entirety.
Technical Field
The present disclosure relates to assay technology.
Background
JP-A-6-237998 and JP-A-2018-163163 disclose techniques for detecting bubbles in blood.
Disclosure of Invention
Disclosed are a measurement device, a measurement system, a measurement method, and a program. In one embodiment, the measurement device includes a light emitting unit, a light receiving unit, a determining unit, and a calculating unit. The light-emitting unit irradiates light on an object to be irradiated, which has fluid flowing therein. The light receiving unit receives interference light of light scattered by the object to be irradiated, and outputs an output signal corresponding to the intensity of the interference light. The determination unit obtains a characteristic amount indicating a characteristic of a signal waveform of the output signal, and determines an abnormal signal contained in the output signal based on the obtained characteristic amount. The calculating unit calculates a flow state value indicating a state of the flow of the fluid based on a signal other than the abnormal signal in the output signal.
In one embodiment, the measurement system includes: the above-mentioned measuring device; and a display device for displaying the flow state value calculated by the measuring device.
In one embodiment, the measurement system includes the measurement device and the display device. When the determination unit determines the abnormality signal, the measurement device outputs a notification signal notifying that foreign matter is contained in the fluid to the outside of the measurement device. The display device displays notification information for notifying that foreign matter is contained in the fluid when the measurement device outputs a notification signal to the outside of the measurement device.
In one embodiment, the measurement method is a measurement method performed in an apparatus. The measurement method comprises the following steps: when the light emitting unit irradiates light to an object flowing through the fluid, a characteristic amount representing a characteristic of a signal waveform of an output signal corresponding to the intensity of interference light output from a light receiving unit receiving the interference light including light scattered by the object is acquired, and an abnormal signal included in the output signal is specified based on the acquired characteristic amount. The measurement method further comprises the following steps: a flow state value indicating a state of flow of the fluid is calculated based on a signal other than the abnormal signal in the output signal.
In one embodiment, a program for causing a computer to execute a process of inputting an output signal according to an intensity of interference light outputted from a light receiving portion that receives interference light of light scattered by an object to be irradiated when the light emitting portion irradiates the object to be irradiated, the program causes the computer to execute the process of: acquiring a characteristic amount representing a characteristic of a signal waveform of the output signal, and determining an abnormal signal contained in the output signal based on the acquired characteristic amount; and calculating a flow state value indicating a state of flow of the fluid based on a signal other than the abnormal signal in the output signal.
Drawings
Fig. 1 is a schematic diagram showing an example of the structure of a measurement device.
Fig. 2 is a schematic diagram showing an example of a part of the structure of the measuring apparatus.
Fig. 3 is a schematic diagram showing an example of the configuration of the arithmetic circuit.
Fig. 4 is a flowchart showing an example of the operation of the arithmetic circuit.
Fig. 5 is a schematic diagram showing an example of a power spectrum.
Fig. 6 is a diagram showing an example of a signal waveform of an AC signal.
Fig. 7 is a diagram showing an example of a signal waveform of an AC signal.
Fig. 8 is a diagram showing an example of a signal waveform of an AC signal.
Fig. 9 is a diagram showing an example of a signal waveform of an AC signal.
Fig. 10 is a diagram showing an example of a signal waveform of an AC signal.
Fig. 11 is a diagram showing an example of a signal waveform of an AC signal.
Fig. 12 is a diagram showing an example of a signal waveform of an AC signal.
Fig. 13 is a diagram showing an example of a signal waveform of an AC signal.
Fig. 14 is a diagram showing an example of the characteristic amount of the signal waveform of the AC signal.
Fig. 15 is a diagram showing an example of the characteristic amount of the signal waveform of the AC signal.
Fig. 16 is a diagram showing an example of the characteristic amount of the signal waveform of the AC signal.
Fig. 17 is a diagram showing an example of the characteristic amount of the signal waveform of the AC signal.
Fig. 18 is a diagram showing an example of the characteristic amount of the signal waveform of the AC signal.
Fig. 19 is a diagram showing an example of the characteristic amount of the signal waveform of the AC signal.
Fig. 20 is a diagram showing an example of the characteristic amount of the signal waveform of the AC signal.
Fig. 21 is a diagram showing an example of the characteristic amount of the signal waveform of the AC signal.
Fig. 22 is a diagram showing an example of the characteristic amount of the signal waveform of the AC signal.
Fig. 23 is a diagram showing an example of the characteristic amount of the signal waveform of the AC signal.
Fig. 24 is a diagram showing an example of the characteristic amount of the signal waveform of the AC signal.
Fig. 25 is a diagram showing an example of the characteristic amount of the signal waveform of the AC signal.
Fig. 26 is a diagram showing an example of the characteristic amount of the signal waveform of the AC signal.
Fig. 27 is a diagram showing an example of the characteristic amount of the signal waveform of the AC signal.
Fig. 28 is a diagram showing an example of the characteristic amount of the signal waveform of the AC signal.
Fig. 29 is a diagram showing an example of the characteristic amount of the signal waveform of the AC signal.
Fig. 30 is a diagram showing an example of the characteristic amount of the signal waveform of the AC signal.
Fig. 31 is a diagram showing an example of the characteristic amount of the signal waveform of the AC signal.
Fig. 32 is a diagram showing an example of the characteristic amount of the signal waveform of the AC signal.
Fig. 33 is a diagram showing an example of the characteristic amount of the signal waveform of the AC signal.
Fig. 34 is a diagram showing an example of the characteristic amount of the signal waveform of the AC signal.
Fig. 35 is a diagram showing an example of the characteristic amount of the signal waveform of the AC signal.
Fig. 36 is a diagram showing an example of the characteristic amount of the signal waveform of the AC signal.
Fig. 37 is a diagram showing an example of the characteristic amount of the signal waveform of the AC signal.
Fig. 38 is a schematic diagram showing an example of the structure of the measurement system.
Detailed Description
Fig. 1 is a schematic diagram showing an example of the structure of a measurement device 1. As shown in fig. 1, the measuring device 1 irradiates, for example, an object (also referred to as an irradiation target) 800 having a fluid 802 flowing through an interior 803 with light L1. The object 800 includes an object (also referred to as a flow path structure) 801 that forms a flow path, and a fluid 802 that flows through the flow path. The inside 803 of the flow path structure 801 becomes the inside 803 of the object 800 to be irradiated. The measurement device 1 can receive interference light of light scattered by the object 800 to be irradiated, and quantitatively measure the state of the flow of the fluid 802 based on the received interference light. That is, the measurement device 1 can calculate a quantitative value (also referred to as a flow state value) indicating the state of the flow of the fluid 802. The flow channel structure 801 is a tubular object (also referred to as a tubular body) such as a blood vessel in a living body or a pipe of various devices. The flow state value includes, for example, at least one of a flow rate and a flow velocity. The flow rate is, for example, the amount of fluid passing through the flow path per unit time. The amount of fluid is expressed, for example, in terms of volume or mass. The flow rate is the speed of the flow of fluid in the flow path. The speed of flow is expressed, for example, in terms of the distance that the fluid advances per unit time.
The measurement device 1 can quantitatively measure the state of the flow of the fluid 802 using, for example, the doppler effect of light. For example, when light is scattered by the fluid 802 in response to irradiation of the fluid 802 with the light, a frequency shift (also referred to as a doppler shift) of the frequency of the light corresponding to the movement speed of the fluid 802 is generated due to the doppler effect corresponding to the flow of the fluid 802. The measuring device 1 can quantitatively measure the state of the flow of the fluid 802 by using the doppler shift.
The fluid 802 that is an object (also referred to as a measurement object) in a state of quantitatively measuring a flow may be, for example, the fluid 802 itself scattering light. Alternatively, the fluid 802 may flow a substance that scatters light (also referred to as a scattering substance) or an object that scatters light (also referred to as a scatterer). For example, water, blood, various aqueous solutions such as ink and beverage for a printer, gas containing a scattering body such as powder, or the like is used as the fluid 802 to be measured. For example, in the case where a scattering substance or a scatterer flows following a fluid, the "flow rate of the scattering substance or the scatterer" may be regarded as "flow rate of the fluid", and the "flow rate of the scattering substance or the scatterer" may be regarded as "flow rate of the fluid".
As shown in fig. 1, the measuring device 1 includes, for example, a wiring board 2, a sensor 3, a processing circuit 4, an arithmetic circuit 5, and a connector 6. The measuring device 1 may include an outer case for housing the wiring board 2, the sensor 3, the processing circuit 4, the arithmetic circuit 5, and the connector 6.
On the 1 st surface of the wiring board 2, for example, a sensor 3, a processing circuit 4, an arithmetic circuit 5, and a connector 6 are provided. The wiring board 2 may be a single-layer board or a multilayer board. At least one of the processing circuit 4, the arithmetic circuit 5, and the connector 6 may be located on the 2 nd surface of the wiring substrate 2 on the opposite side of the 1 st surface.
The connector 6 is connected to, for example, a cable extending from an external device of the measuring device 1. The power supply of the measuring apparatus 1 is supplied to the connector 6, for example. The power supplied to the connector 6 is supplied to the sensor 3, the processing circuit 4, and the arithmetic circuit 5 through the wiring board 2.
The sensor 3 includes, for example, a light emitting unit 30 and a light receiving unit 31. The light emitting unit 30 can irradiate the irradiation object 800 with the light L1. The light L1 emitted from the light emitting unit 30 to the irradiation object 800 is, for example, light having a predetermined wavelength corresponding to the fluid 802. For example, in the case where the fluid 802 is blood, the wavelength of the light L1 is set to about 600nm to 900 nm. In addition, for example, in the case where the fluid 802 is ink for a printer, the wavelength of the light L1 is set to about 700nm to 1000 nm. For example, a semiconductor laser device such as a vertical resonator surface emitting laser (VCSEL: vertical Cavity Surface Emitting LASER) is used for the light emitting portion 30.
The light receiving unit 31 can receive, for example, interference light L2 of light scattered by the irradiation target 800, among light L1 irradiated from the light emitting unit 30 to the irradiation target 800. The light receiving unit 31 converts the received light into an electrical signal corresponding to the intensity of the light, for example. The light receiving unit 31 receives the interference light L2 included in the light scattered by the irradiation target 800, and outputs a time domain output signal corresponding to the intensity of the interference light L2. The interference light L2 that the light receiving unit 31 can receive includes interference light generated by scattered light that does not generate doppler shift from an object (also referred to as a stationary object) stationary around the fluid 802 among the scattered light from the object 800 to be irradiated and scattered light that generates doppler shift by Δf from the fluid 802. For example, in the case where the fluid 802 is blood flowing through a blood vessel, the stationary object includes skin, a blood vessel, and the like. When the fluid 802 is ink flowing through a pipe, the stationary object includes the pipe and the like. In this case, the piping includes a material having light transmittance, for example. For example, glass, polymer resin, or the like is used for a material having light transmittance.
Here, the change in the intensity of the interference light L2 with respect to the passage of time (also referred to as a time change) indicates a beat of a frequency corresponding to a frequency difference Δf between the frequency of the scattered light not generating the doppler shift and the frequency of the scattered light generating the doppler shift. Therefore, the output signal corresponding to the intensity of the interference light L2 output from the light receiving section 31 includes components of signals (also referred to as beat signals, optical beat signals) corresponding to beats in the temporal variation of the intensity of the interference light L2. The light receiving unit 31 is, for example, a light receiving unit having a capability of following a beat in a temporal change in the intensity of the interference light L2 (also referred to as a temporal resolution). The wavelength of light that can be received by the light receiving unit 31 is set according to measurement conditions such as the wavelength of light L1 emitted from the light emitting unit 30 to the irradiation object 800, and the range of the speed of the fluid 802. Various light emitting diodes such as a silicon (Si) light emitting diode, a gallium arsenide (GaAs) light emitting diode, an indium gallium arsenide (InGaAs) light emitting diode, and a germanium (Ge) light emitting diode are used for the light receiving portion 31.
The sensor 3 includes, for example, a package 32 and a cover member 33 in addition to the light emitting portion 30 and the light receiving portion 31. The package 32 accommodates the light emitting unit 30 and the light receiving unit 31. The package 32 has recesses 320 and 321 for accommodating the light emitting unit 30 and the light receiving unit 31, respectively. The cover member 33 covers the concave portions 320 and 321 of the package 32.
The package 32 includes, for example, a multilayer wiring board including a ceramic material, an organic material, or the like. The light emitting section 30 and the light receiving section 31 are electrically connected to the wiring board 2 via the multilayer wiring board. For example, alumina sintered body, mullite sintered body, or the like is used as the ceramic material. For example, epoxy resin, polyimide resin, or the like is used as the organic material.
The cover member 33 includes, for example, a transparent glass plate. The light L1 emitted from the light emitting portion 30 in the concave portion 320 is transmitted through the cover member 33 and then irradiated to the object 800. The interference light L2 from the object 800 is transmitted through the cover member 33 and then received by the light receiving portion 31 in the recess 321.
The processing circuit 4 is electrically connected to the light receiving unit 31 through the multilayer wiring board and the wiring board 2 constituting the package 32 of the sensor 3. The arithmetic circuit 5 is electrically connected to the processing circuit 4 through the wiring board 2.
Fig. 2 is a schematic diagram showing an example of the configuration of the processing circuit 4 and the arithmetic circuit 5. As shown in fig. 2, the processing circuit 4 includes, for example, an amplifying circuit 40 and a filter 41. The amplifying circuit 40 amplifies and outputs the output signal 310 of the light receiving unit 31. The amplifying circuit 40 includes, for example, an operational amplifier, a resistor, a capacitor, and the like. The filter 41 performs a filter process on the output signal 310 amplified by the amplifying circuit 40 and outputs the result. The output signal 310 subjected to the filter 41 filtering processing is input to the arithmetic circuit 5. The filter 41 includes, for example, an operational amplifier, a resistor, a capacitor, and the like.
The filter 41 is, for example, a high-pass filter, removes a dc component from the amplified output signal 310, and outputs the output signal 310 from which the dc component has been removed. The filter 41 can also be said to extract an ac component from the output signal 310 and output it. Hereinafter, the output signal 310 after the filtering process output from the filter 41, that is, the alternating current component contained in the output signal 310 may be referred to as an AC signal.
The processing circuit 4 can control the light emission of the light emitting section 30 by controlling the supply of electricity to the light emitting section 30. The processing circuit 4 may further include an amplifying circuit that amplifies the AC signal output from the filter 41 and outputs the amplified signal to the arithmetic circuit 5.
The arithmetic circuit 5 includes, for example, at least one processor. According to various embodiments, at least one processor may be implemented as a single Integrated Circuit (IC) or as a plurality of communicatively connected integrated circuit ICs and/or discrete circuits (discrete circuits). The at least one processor can be implemented in accordance with various known techniques.
In one embodiment, a processor includes, for example, one or more circuits or units configured to perform one or more data calculation procedures or processes by executing instructions stored in an associated memory. In other embodiments, the processor may be firmware (e.g., discrete logic elements) configured to perform more than one data calculation procedure or process.
A processor may also include more than one processor, controller, microprocessor, microcontroller, application Specific Integrated Circuit (ASIC), digital signal processing device, programmable logic device, field programmable gate array, or any combination of these devices or structures, or other known devices and combinations of structures, in accordance with various embodiments, to perform the functions described below.
In this example, the arithmetic circuit 5 includes, for example, a microprocessor. As shown in fig. 2, the microprocessor is a computer, and includes, for example, a CPU (Central Processing Unit ) 50, a memory circuit 51, an a/D converter 52, and the like. The CPU50 can also be a computer. The storage circuit 51 includes, for example, a non-transitory recording medium readable by the CPU50 such as a ROM (Read Only Memory) and a RAM (Random Access Memory). The program 510 is stored in the storage circuit 51. The various functions of the arithmetic circuit 5 are realized by the CPU50 executing the program 510 in the memory circuit 51. The computer provided in the arithmetic circuit 5 may include at least a part of the functions of the processing circuit 4.
The program 510 is stored in a non-transitory recording medium readable by a computer provided in the storage circuit 51. The computer-readable non-transitory recording medium storing the program 510 may be a removable recording medium such as an optical disk, a magnetic disk, or a nonvolatile memory. In this case, the program 510 may be stored in a removable storage medium in a state where the removable storage medium is provided in a device capable of reading data, such as a disk drive or a memory reader.
The a/D converter 52 can convert the AC signal input from the processing circuit 4 from an analog form to a digital form. The CPU50 can quantitatively determine the state of the flow of the fluid 802 based on the digital form of the AC signal (also referred to as AC signal 520). The CPU50 calculates a flow state value based on the AC signal 520. The AC signal 520 is a time-domain signal that contains a plurality of digital values representing the signal strength of the AC signal 520 side by side in a time sequence. The resolution of the a/D converter 52 is, for example, 12 bits, and the digital value output from the a/D converter 52 shows a value in the range of 0 to 4095 in 10-ary marks. Since the a/D converter 52 outputs digital values for each sampling period, a plurality of digital values constituting the AC signal 520 are juxtaposed at intervals of the sampling period of the a/D converter 52. The resolution of the a/D converter 52 may be other than 12 bits. Hereinafter, the digital value contained in the AC signal 520 may be referred to as an AC value. The AC value represents the signal strength of the AC signal 520.
Fig. 3 is a diagram showing an example of a plurality of functional blocks implemented in the arithmetic circuit 5 by the CPU50 executing the program 510. As shown in fig. 3, the arithmetic circuit 5 includes, for example, a determination unit 500 and a calculation unit 501 as functional blocks. The determination unit 500 and the calculation unit 501 are implemented in the CPU 50.
Here, foreign matter may be contained in the fluid 802. In the case where the fluid 802 is, for example, blood, bubbles are contained in the fluid 802 as foreign substances, for example. When the light receiving unit 31 receives light scattered by foreign matter contained in the fluid 802, an abnormal signal may be contained in the AC signal 520. If the flow state value is calculated based on the AC signal 520 including the abnormal signal, the accuracy of calculating the flow state value may be lowered, and the accuracy of measuring the state of the flow of the fluid 802 may be lowered.
The determination section 500 can determine an abnormal signal contained in the AC signal 520. The determination unit 500 acquires, for example, a characteristic amount indicating the characteristic of the signal waveform of the AC signal 520. Then, the determination section 500 determines an abnormal signal contained in the AC signal 520 based on the acquired characteristic amount. The calculating unit 501 calculates and outputs the flow state value Va based on signals other than the abnormal signal determined by the determining unit 500 in the AC signal 520. The measurement method may include a step of determining the abnormality signal and a step of calculating the flow state value Va. Further, as the program 510, the computer is caused to execute the step of determining the abnormality signal and the step of calculating the flow state value Va.
In this way, by calculating the flow state value Va based on a signal other than the abnormal signal in the AC signal 520, the accuracy of calculating the flow state value Va improves. Thus, accuracy in measuring the state of the flow of the fluid 802 improves. An example of the operation of the determining unit 500 and the calculating unit 501 will be described in detail below.
The determination unit 500 obtains a characteristic amount of a signal waveform (also referred to as a 1 st signal waveform) of a partial signal (also referred to as a 1 st partial signal) in the unit period T of the AC signal 520 for each unit period T, for example. Then, the determination unit 500 determines whether or not the 1 st partial signal in the unit period T is an abnormal signal based on the characteristic amount obtained for the unit period T. For example, when it is determined that the 1 st partial signal for a certain unit period T is not an abnormal signal, the calculating unit 501 calculates the flow state value Va based on the 1 st partial signal. In other words, when it is determined that the 1 st partial signal for a certain unit period T is normal, the calculating unit 501 calculates the flow state value Va based on the 1 st partial signal. On the other hand, when it is determined that the 1 st partial signal for a certain unit period T is an abnormal signal, the calculating unit 501 does not calculate the flow state value Va based on the 1 st partial signal. Hereinafter, the unit period T to be described may be referred to as a target unit period T.
Fig. 4 is a flowchart showing an example of the operation of the arithmetic circuit 5 in the case where the arithmetic circuit 5 calculates the flow state value Va. A series of processes of steps s1 to s4 shown in fig. 4 is executed for each unit period T.
In this example, the preceding and following unit periods T are not continuous in time, and a time difference occurs between the end timing of the preceding unit period T and the start timing of the following unit period T. The unit period T is set to, for example, a period during which N (N is an integer of 2 or more) AC values are output from the a/D converter 52. The part 1 signal contains N AC values side by side in time sequence. The arithmetic circuit 5 acquires N AC values in each unit period T.
In the case where N is 1024, for example, the unit period T is set to a period during which 1024 AC values are output from the a/D converter 52. In this case, if the sampling frequency of the a/D converter 52 is set to 100kHz, the sampling period becomes 10 μs, and the length of the unit period T becomes about 10.2ms. The part 1 signal in the unit period T contains 1024 AC values side by side in time series. Hereinafter, the sampling frequency refers to the sampling frequency of the a/D converter 52.
As shown in fig. 4, in step s1, the determination unit 500 acquires N AC values constituting the 1 st partial signal in the target unit period T. At this time, the determination unit 500 sets the latest N AC values output from the a/D converter 52 as N AC values constituting the 1 st partial signal in the target unit period T, for example. The start of step s1 is the start of the target unit period T, and the end of step s1 is the end of the target unit period T.
Next, in step s2, the determination unit 500 obtains a signal waveform of the 1 st partial signal in the target unit period T, that is, a characteristic amount indicating a characteristic of the 1 st signal waveform in the target unit period T, based on the N AC values obtained in step s 1. Then, in step s3, the determination unit 500 determines whether or not the 1 st partial signal in the target unit period T is an abnormal signal based on the characteristic amount acquired in step s 2. Hereinafter, the processing in steps s2 and s3 may be collectively referred to as abnormality determination processing. The abnormality determination processing will be described in detail later.
If the determination is no in step s3, in step s4, the calculation unit 501 calculates the flow state value Va based on the 1 st partial signal in the target unit period T. Specifically, the calculating unit 501 calculates the flow state value Va based on the N AC values constituting the 1 st partial signal acquired in step s 1. Specific examples of step s4 are described below. Hereinafter, each AC value constituting the 1 st partial signal determined not to be an abnormal signal may be referred to as a normal AC value.
The frequency and signal strength of the output signal 310 of the light receiving unit 31 depend on the doppler effect of light. Thus, the power spectrum representing the frequency of the output signal 310 versus signal strength varies according to the flow state value Va (e.g., flow or velocity) of the fluid 802. Therefore, in step s4, the calculation unit 501 performs fourier transform on the 1 st partial signal obtained from the output signal 310 to obtain the power spectrum of the 1 st partial signal. Specifically, the calculation unit 501 performs discrete fourier transform on N normal AC values constituting the 1 st partial signal determined not to be an abnormal signal, and obtains the power spectrum of the 1 st partial signal.
Fig. 5 is a diagram showing an example of the power spectrum obtained by the calculating unit 501. The horizontal axis of fig. 5 represents frequency. The vertical axis of fig. 5 represents the signal strength of the 1 st partial signal at each frequency.
The calculating unit 501 calculates the flow state value Va based on the obtained power spectrum. Here, the frequency is set to fn, and the signal strength of the 1 st partial signal at the frequency fn is set to P (fn). The calculation unit 501 obtains a calculated value Vb obtained by integrating the signal intensity P (fn) weighted at the frequency fn, for example. The calculated value Vb is expressed by the following expression (1). The calculated value Vb is a value that varies according to the state of the flow of the fluid 802.
[ mathematics 1]
Vb=Σfn×Pf(fn)…(1)
Next, the calculating unit 501 calculates a quantitative value indicating the state of the flow of the fluid 802, that is, a flow state value Va, based on the calculated value Vb. For example, the calculating unit 501 calculates the flow state value Va based on the calculated value Vb and calibration data (also referred to as a calibration curve) prepared in advance. The calibration data is stored in the memory circuit 51 of the arithmetic circuit 5 in advance before the flow state value Va of the fluid 802 is measured, for example. The calibration data may be stored, for example, in a functional form or in a tabular form. When calibration data concerning the flow rate of the fluid 802 is stored in the memory circuit 51, the calculation unit 501 can calculate the flow rate of the fluid 802 based on the calculated value Vb and the calibration data stored in the memory circuit 51. When calibration data concerning the flow rate of the fluid 802 is stored in the memory circuit 51, the calculation unit 501 can calculate the flow rate of the fluid 802 based on the calculated value Vb and the calibration data stored in the memory circuit 51.
After step s4, step s1 is performed again. In step s1, the determination unit 500 acquires N AC values constituting the 1 st partial signal in the next unit period T. The determination unit 500 sets the latest N AC values output from the a/D converter 52 as N AC values constituting the 1 st partial signal in the next unit period T. Then, step s2 is performed, and the arithmetic circuit 5 operates similarly.
On the other hand, if it is determined to be "yes" in step s3, the flow state value Va is not calculated, and step s1 is executed again. In step s1, the determination unit 500 acquires N AC values constituting the 1 st partial signal in the next unit period T, as in step s1 following step s 4. Then, step s2 is performed, and the arithmetic circuit 5 operates similarly.
In starting up the measuring apparatus 1, the arithmetic circuit 5 may repeat the series of processing shown in fig. 4 at all times, or may repeat the series of processing in a predetermined period.
As described above, in this example, the start and end of step s1 for the target unit period T become the start and end of the target unit period T. Then, for example, when step s4 is executed for the target unit period T, the start and end of step s1 executed immediately after step s4 become the start and end of the next unit period T of the target unit period T. If it is determined that "yes" is performed in step s3 for the target unit period T, the start and end of step s1, which is performed immediately after step s3, become the start and end of the next unit period T of the target unit period T.
The delay time from the end of the target unit period T to the start of the next unit period T (also referred to as a delay time for the unit period T) is substantially equal to the execution time of the process including steps s2, s3, and s4 or the execution time of the process including steps s2 and s 3. For example, when step s4 is executed for the target unit period T, the delay time from the end of the target unit period T to the start of the next unit period T is substantially equal to the execution time of steps s2 to s4 for the target unit period T. When step s3 regarding the target unit period T is determined to be yes, the delay time from the end of the target unit period T to the start of the next unit period T is substantially equal to the execution time of steps s2 and s3 regarding the target unit period T. The delay time with respect to the unit period T depends on the processing speed of the CPU 50. The delay time for the unit period T is, for example, a value sufficiently smaller than the length of the unit period T. The delay time for the unit period T is, for example, several tens of μs to several hundreds of μs.
The method for calculating the flow state value Va by the calculating unit 501 is not limited to the above. Since the calculated value Vb represented by the expression (1) can be said to be a value indicating the state of the flow of the fluid 802, the calculation unit 501 can set the calculated value Vb to the flow state value Va, for example. In this case, an external device of the measuring device 1 may calculate the flow rate or the flow velocity of the fluid 802 based on the calculated value Vb calculated by the calculating unit 501. In this case, the calculated value Vb calculated as the flow state value Va by the calculating unit 501 may be notified to an external device via the connector 6.
Next, a plurality of examples of the abnormality determination processing (steps s2 and s 3) are described. Hereinafter, the 1 st partial signal in the target unit period T may be referred to as a target 1 st partial signal. In addition, the signal waveform of the object 1 st partial signal is sometimes referred to as an object 1 st signal waveform. In the abnormality determination processing concerning the target unit period T, it is determined whether or not the target 1 st partial signal is an abnormal signal. Note that the unit period T determined that the 1 st partial signal is an abnormal signal may be referred to as an abnormal unit period T. The unit period T determined that the 1 st partial signal is not an abnormal signal is sometimes referred to as a normal unit period T.
< example 1 >
In the abnormality determination processing of this example, in step s2 regarding the target unit period T, the determination unit 500 calculates the standard deviation σu of the target 1 st signal waveform. The standard deviation σu can be said to be the standard deviation for the N AC values that make up the object part 1 signal. The determination unit 500 sets the calculated standard deviation σu as the characteristic amount of the target 1 st signal waveform.
In step s3 regarding the target unit period T, the determination unit 500 performs a process of determining whether or not the target 1 st partial signal is an abnormal signal based on the standard deviation σu (also referred to as 1 st determination process). In the 1 st determination process, for example, the determination unit 500 calculates an average value σuave of the standard deviation σu obtained in M unit periods T preceding the comparison target unit period T. Here, M is an integer of 2 or more. In step s3 concerning the target unit periods T, the M unit periods T of the target for which the average value σuave is calculated are sometimes referred to as M unit periods T of the target.
As the M unit periods T to be subject, for example, the most recent M normal unit periods T of the subject unit period T are employed. For example, the unit periods T1 to T8 are sequentially displayed in this order, and m=5. Note that, the unit period T4 alone among the unit periods T1 to T8 is an abnormal unit period T. In this case, in the abnormality determination processing for the target unit period T8, the latest 5 normal unit periods T of the target unit period T8, that is, the M unit periods T of which the unit periods T7, T6, T5, T3, and T2 are targets.
In the 1 st determination process, when the determination unit 500 calculates the average value σuave, it compares the standard deviation σu with the average value σuave, and determines whether or not the target 1 st partial signal is an abnormal signal based on the comparison result. For example, the determination unit 500 calculates the magnification MG of the standard deviation σu with respect to the average value σuave. The magnification MG is expressed as σu/σuave. Then, when the magnification MG is equal to or greater than the 1 st threshold, the determination unit 500 determines that the target 1 st partial signal is an abnormal signal. On the other hand, when the magnification MG is smaller than the 1 st threshold, the determination unit 500 determines that the target 1 st partial signal is not an abnormal signal. The determination unit 500 may determine that the target 1 st partial signal is an abnormal signal when the magnification MG is larger than the 1 st threshold, and may determine that the target 1 st partial signal is not an abnormal signal when the magnification MG is equal to or smaller than the 1 st threshold.
Fig. 6 to 13 are diagrams showing an example of signal waveforms of the AC signal 520 in the case where the light receiving unit 31 receives light scattered by foreign matter contained in the fluid 802. The horizontal axis of fig. 6 to 13 represents time, and the vertical axis of fig. 6 to 13 represents AC value (in other words, signal strength). Fig. 6 to 13 show the 1 st signal waveform in the unit periods T1 to T10. The unit periods T1 to T10 are sequentially displayed in this order in the measuring device 1. Since the measurement device 1 generates a delay time with respect to the unit period T, the 1 st signal waveform in the original unit periods T1 to T10 is not continuous in time. Fig. 6 to 13 continuously show the 1 st signal waveform in the unit periods T1 to T10 for convenience of explanation.
Fig. 6 to 13 show signal waveforms in the case where a PFA (perfluoroalkoxyalkane) tube is used as the flow path structure portion 801 and virtual blood is used as the fluid 802. The virtual blood as the fluid 802 is an aqueous solution containing a large amount of spherical polymer having a diameter of 10 μm, and the polymer content is about 45vol%. Fig. 6 shows signal waveforms when the PFA tube as the flow path structure 801 has an outer diameter and an inner diameter of 4mm and 3mm, respectively. Fig. 7 to 13 show signal waveforms when the PFA tube as the flow path structure 801 has an outer diameter and an inner diameter of 4mm and 2mm, respectively.
Fig. 6 shows a signal waveform in the case where only one bubble having a substantially spherical shape with a diameter of about 2mm containing air is contained as a foreign substance in the fluid 802. Fig. 6 shows signal waveforms in the case where the light quantity of the light emitting portion 30 is 2.0mW, the sampling frequency is 50kHz, and the flow rate of the fluid 802 is 100 ml/min. Fig. 6 shows a signal waveform of n=1024, and the length of the unit period T shown in fig. 6 is about 20.5ms. In the example of fig. 6, the time for the bubble in the fluid 802 to pass through the light receiving region of the light receiving portion 31 becomes about 21.2ms.
Fig. 7 to 13 show signal waveforms in the case where only one black plastic having a diameter of 0.8mm is contained as a foreign substance in the fluid 802. Fig. 7 to 13 show signal waveforms in the case where the light quantity of the light emitting portion 30 is 1.5 mW.
Fig. 7 to 9 show signal waveforms in the case where the flow rate of the fluid 802 is 20 ml/min. Fig. 7 to 9 show signal waveforms of sampling frequencies of 50kHz, 100kHz and 200kHz, respectively. Fig. 7 to 9 show signal waveforms of n=1024, and the lengths of the unit periods T shown in fig. 7 to 9 are about 20.5ms, about 10.2ms, and about 5.1ms, respectively. In the examples of fig. 7 to 9, the time for the black plastic in the fluid 802 to pass through the light receiving region of the light receiving portion 31 is about 35.8ms.
Fig. 10 to 13 show signal waveforms in the case where the flow rate of the fluid 802 is 50 ml/min. Fig. 10 to 13 show signal waveforms of sampling frequencies of 50kHz, 100kHz, 200kH, and 400kHz, respectively. Fig. 10 to 13 show signal waveforms of n=1024, and the length of the unit period T shown in fig. 10 to 13 is about 20.5ms, about 10.2ms, about 5.1ms, and about 2.6ms, respectively. In the examples of fig. 10 to 13, the time for the black plastic in the fluid 802 to pass through the light receiving region of the light receiving portion 31 is about 14.3ms.
In the examples of fig. 6 to 13, the light receiving unit 31 receives scattered light from the foreign matter in the unit period T7, and does not receive light in the unit periods T1 to T6 and T8 to T10. Therefore, the 1 st signal waveform in the unit periods T1 to T6 and T8 to T10 is not affected by scattered light from the foreign matter, and the 1 st signal waveform in the unit period T7 is affected by scattered light from the foreign matter. The 1 st signal in the unit period T7 becomes an abnormal signal.
Here, the flow velocity of the fluid 802 in the flow path structure portion 801 is not uniform, but varies depending on the location in the flow path structure portion 801. The flow velocity of the fluid 802 tends to be smaller as the flow velocity is closer to the inner wall of the flow path structure 801. Therefore, the light receiving unit 31 receives the interference light L2 including a plurality of scattered lights having different doppler shift amounts. That is, the light receiving unit 31 receives the interference light L2 including a plurality of scattered lights having different frequencies. As a result, the AC signal 520 becomes a composite signal of a plurality of alternating current signals having mutually different frequencies.
Like the 1 st signal waveform in the unit periods T1 to T6 and T8 to T10 in fig. 6 to 13, the AC signal 520, which is not affected by scattered light from a foreign object, has a fluctuation waveform with a short period and a small amplitude. On the other hand, as in the 1 st signal waveform in the unit period T7 of fig. 6 to 13, the AC signal 520 affected by scattered light from the foreign matter is a waveform in which a waveform that changes gradually and greatly is superimposed with a fluctuation waveform having a short period. Therefore, the standard deviation of the plurality of AC values constituting the AC signal 520 affected by the scattered light from the foreign matter tends to be larger than the standard deviation of the plurality of AC values constituting the AC signal 520 unaffected by the scattered light from the foreign matter.
Therefore, in this example, as described above, the determination unit 500 determines whether or not the 1 st partial signal in the target unit period T is an abnormal signal based on the standard deviation σu of the 1 st signal waveform in the target unit period T. Specifically, the determination unit 500 compares the standard deviation σu of the 1 st signal waveform in the target unit period T with the average value σuave of the standard deviation σu of the M unit periods T preceding the target unit period T, and determines whether or not the 1 st partial signal in the target unit period T is an abnormal signal based on the comparison result. For example, the determination unit 500 calculates the magnification MG of the standard deviation σu with respect to the average value σuave, and determines that the target 1 st partial signal is an abnormal signal when the calculated magnification MG is equal to or greater than the 1 st threshold value. For example, the length of the unit period T may be determined based on the signal waveform of the AC signal 520 obtained in a prior experiment or the like based on the assumed foreign matter, so that the determination unit 500 can appropriately determine whether or not the 1 st partial signal is an abnormal signal.
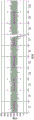
Fig. 14 to 21 are graphs showing the results of calculation of the standard deviation σu, the average value σuave, and the magnification MG for the signal waveforms shown in fig. 6 to 13, respectively. Fig. 14 to 21 show the average value σuave of the sum of cases where m=5. Fig. 14 to 21 also show average value AVEu of the 1 st signal waveform in unit period T. The average value AVEu can be said to be the average value of the N AC values constituting the part 1 signal.
In fig. 14 to 21, the average value AVEu and the standard deviation σu of the 1 st signal waveform in each unit period T are shown in columns of the unit period T. The column of each unit period T shows the average value σuave compared with the standard deviation σu of the 1 st signal waveform in the unit period T. In the column of each unit period T, the magnification MG with respect to the average value σuave of the standard deviation σu of the 1 st signal waveform in the unit period T is shown. Hereinafter, the term "magnification MG corresponding to the unit period T" refers to a magnification MG of the average value σuave of the standard deviation σu of the 1 st signal waveform in the unit period T.
As shown in fig. 14 to 21, if the conditions such as the flow rate of the fluid 802 and the light quantity of the light emitting unit 30 are constant, the standard deviation σu of the 1 st signal waveform in the unit period T (unit periods T4 to T6, T8 in fig. 14 to 21) in which the light receiving unit 31 does not receive the scattered light from the foreign matter, that is, the standard deviation σu of the 1 st signal waveform not affected by the scattered light from the foreign matter is substantially constant. Therefore, if the conditions such as the flow rate of the fluid 802 and the light quantity of the light emitting unit 30 are constant, the average value σuave, which is the average value of the standard deviation σu of the 1 st signal waveform in the M normal unit periods T, is also substantially constant, and the magnification MG corresponding to the unit period T in which the light receiving unit 31 does not receive scattered light from the foreign matter becomes a value close to 1.0.
On the other hand, the standard deviation σu of the 1 st signal waveform in the unit period T (unit period T7 in fig. 14 to 21) in which the light receiving portion 31 receives the scattered light from the foreign matter, that is, the standard deviation σu of the 1 st signal waveform affected by the scattered light from the foreign matter is larger than the standard deviation σu of the 1 st signal waveform unaffected by the scattered light from the foreign matter. Therefore, the magnification MG corresponding to the unit period T in which the light receiving unit 31 receives scattered light from the foreign matter becomes larger than 1.0. In the examples of fig. 14 to 21, the magnification MG corresponding to the unit period T in which the light receiving unit 31 receives scattered light from a foreign object is larger than 2.0.
The 1 st threshold value used in step s3 by the determination unit 500 is determined based on the value of the magnification MG obtained in a prior experiment or the like based on the assumed foreign matter, for example. For example, when the value of the magnification MG shown in fig. 14 is obtained by a prior experiment or the like, the 1 st threshold is set to 1.5, for example. In this case, in the 1 st determination process, the determination unit 500 determines that the 1 st partial signal in the target unit period T is an abnormal signal when the magnification MG obtained for the target unit period T is, for example, 1.5 or more. When the values of the magnification MG shown in fig. 15 to 21 are obtained by experiments in advance or the like, the 1 st threshold is set to 1.5, for example.
In the 1 st determination process, the determination unit 500 may determine that the 1 st partial signal to be subject is an abnormal signal when the standard deviation σu of the 1 st signal waveform in the subject unit period T is equal to or greater than the 2 nd threshold value, without obtaining the multiplying power MG. For example, when the standard deviation σu shown in fig. 14 is obtained by a prior experiment or the like, the 2 nd threshold is set to 800, for example. In addition, when the standard deviation σu shown in fig. 15 to 21 is obtained by a prior experiment or the like, the 2 nd threshold is set to, for example, 500.
As described above, the determination unit 500 determines whether or not the 1 st partial signal in the target unit period T is an abnormal signal based on the standard deviation σu of the 1 st signal waveform in the target unit period T, and thereby the specific accuracy of the abnormal signal included in the AC signal 520 is improved. Thus, the calculating unit 501 can calculate the flow state value Va appropriately based on signals other than the abnormal signal in the AC signal 520. As a result, the accuracy of calculating the flow state value Va improves.
In the measurement device 1, when the flow rate of the fluid 802 is reduced, the amplitude of the fluctuation of the signal waveform of the AC signal 520 tends to be increased. This is because, when the flow rate of the fluid 802 is reduced, the distribution range of the flow rate of the fluid 802 in the flow path structure portion 801 is reduced (in other words, the variation of the flow rate of the fluid 802 in the flow path structure portion 801 is reduced), and as a result, the AC signal 520 becomes a signal synthesized by a plurality of AC signals having frequencies close to each other. When the fluctuation amplitude of the signal waveform of the AC signal 520 increases, the standard deviation σu of the 1 st signal waveform in the unit period T increases.
For example, the amplitude of the signal waveform in the case where the flow rate of the fluid 802 is 20 ml/min shown in fig. 7 to 9 is larger than the amplitude of the signal waveform in the case where the flow rate of the fluid 802 is 50 ml/min shown in fig. 10 to 13. Therefore, the standard deviation σu of the flow rate of the fluid 802 shown in fig. 15 to 17 is larger than the standard deviation σu of the flow rate of the fluid 802 shown in fig. 18 to 21 of 50 ml/min.
In this way, since the standard deviation σu varies according to the variation in the flow rate of the fluid 802, when the determination unit 500 determines whether or not the object 1 st partial signal is an abnormal signal based on the comparison result of the standard deviation σu of the 1 st signal waveform in the object unit period T and the certain 2 nd threshold value, the determination unit 500 may erroneously determine that the normal object 1 st partial signal is an abnormal signal.
On the other hand, if the standard deviation σu changes according to the change in the flow rate of the fluid 802, the average value σuave also changes according to this. Therefore, when the determination unit 500 determines whether or not the object 1 st partial signal is an abnormal signal based on the comparison result of the standard deviation σu and the average value σuave with respect to the object unit period T, it can be more appropriately determined whether or not the object 1 st partial signal is an abnormal signal. As a result, the accuracy of calculating the flow state value Va improves.
< example 2 >
In the abnormality determination processing of this example, in step s2 regarding the target unit period T, the determination unit 500 calculates the difference R between the maximum value MAX and the minimum value MIN of the target 1 st signal waveform. The difference R can be said to be the difference between the maximum value MAX and the minimum value MIN among the N AC values constituting the object 1 st partial signal. The determination unit 500 sets the calculated difference R as the characteristic amount of the target 1 st signal waveform.
In step s3 for the target unit period T, the determination unit 500 performs a process of determining whether or not the target 1 st partial signal is an abnormal signal based on the difference R (also referred to as a 2 nd determination process). In the 2 nd determination process, the determination unit 500 determines that the target 1 st partial signal is an abnormal signal when the difference R is equal to or greater than the 3 rd threshold value, for example. On the other hand, when the difference R is smaller than the 3 rd threshold value, the determination unit 500 determines that the target 1 st partial signal is not an abnormal signal. The determination unit 500 may determine that the target 1 st partial signal is an abnormal signal when the difference R is greater than the 3 rd threshold value, and determine that the target 1 st partial signal is not an abnormal signal when the difference R is equal to or less than the 3 rd threshold value.
Fig. 22 to 29 are graphs showing the results of calculation of the maximum value MAX, the minimum value MIN, and the difference R of the signal waveforms shown in fig. 6 to 13, respectively. In fig. 22 to 29, the column of each unit period T shows the maximum value MAX, the minimum value MIN, and the difference R between them of the 1 st signal waveform in the unit period T.
As described above, the AC signal 520 affected by the scattered light from the foreign matter has a waveform in which a waveform that changes gradually and greatly is superimposed on a waveform that has a short period of fluctuation. Therefore, the difference R between the maximum value MAX and the minimum value MIN of the 1 st signal waveform in the unit period T (unit period T7 in fig. 22 to 29) in which the light receiving unit 31 receives scattered light from the foreign matter becomes large.
Therefore, as described above, the determination unit 500 determines whether or not the target 1 st partial signal is an abnormal signal based on the difference R. Thus, it can be appropriately determined whether or not the object 1 st partial signal is an abnormal signal.
The 3 rd threshold value used by the determination unit 500 is determined, for example, from the value of the difference R obtained in a prior experiment or the like based on the assumed foreign matter. For example, when the value of the difference R shown in fig. 22 is obtained by a prior experiment or the like, the 3 rd threshold value is set to 3900, for example. In addition, when the value of the difference R shown in fig. 23 to 29 is obtained by a prior experiment or the like, the 3 rd threshold value is set to 2600, for example.
< example 3 >
In the abnormality determination processing of the present example, in step s2 regarding the target unit period T, the determination unit 500 divides the target unit period T into L partial periods PT. Here, L is an integer of 2 or more. The length of the partial period PT is 1/L of the length of the unit period T.
Next, the determination unit 500 calculates the average value AVEp of the signal waveforms (2 nd signal waveforms) of the partial signals (also referred to as 2 nd partial signals) in the partial period PT included in the target 1 st partial signal for the L partial periods PT, respectively. The average value AVEp can be said to be an average of a plurality of AC values constituting the part 2 signal. Then, the determination unit 500 calculates the standard deviation σap of the L average values AVEp obtained for the L partial periods PT. The determination unit 500 sets the calculated standard deviation σap as the characteristic amount of the target 1 st signal waveform.
The number of the plurality of AC values constituting the 2 nd partial signal is set to, for example, a value obtained by dividing N, which is the number of the plurality of AC values constituting the 1 st partial signal, by L. For example, in the case where n=1024 and l=4, the number of the plurality of AC values constituting the 2 nd partial signal becomes 256.
In step s3 for the target unit period T, the determination unit 500 performs a process of determining whether or not the target 1 st partial signal is an abnormal signal based on the standard deviation σap (also referred to as a 3 rd determination process). In the 3 rd determination process, the determination unit 500 calculates, for example, the average value AVEap of the L average values AVEp obtained for the L partial periods PT in step s 2. Then, the determination unit 500 calculates the variation coefficient CV of the average value AVEp based on the standard deviation σap and the average value AVEap. The value obtained by dividing the standard deviation σap by the average value AVEap becomes the coefficient of variation CV.
In the 3 rd determination process, when the coefficient of variation CV is calculated, the determination unit 500 compares the calculated coefficient of variation CV with the 4 th threshold value, and determines whether or not the 1 st partial signal to be detected is an abnormal signal based on the comparison result. For example, when the coefficient of variation CV is equal to or greater than the 4 th threshold value, the determination unit 500 determines that the target 1 st partial signal is an abnormal signal. On the other hand, when the coefficient of variation CV is smaller than the 4 th threshold value, the determination unit 500 determines that the target 1 st partial signal is not an abnormal signal. The determination unit 500 determines that the target 1 st partial signal is an abnormal signal when the coefficient of variation CV is greater than the 4 th threshold value, and determines that the target 1 st partial signal is not an abnormal signal when the coefficient of variation CV is equal to or less than the 4 th threshold value.
Fig. 30 to 37 are graphs showing the results of calculation of the average value AVEp, average value AVEap, standard deviation σap, and coefficient of variation CV for the signal waveforms shown in fig. 6 to 13, respectively. In the examples of fig. 30 to 37, n=1024 and l=4, and the number of the plurality of AC values constituting the 2 nd partial signal becomes 256. Fig. 30 to 37 show average values AVEp of the 2 nd signal waveforms in the 4 partial periods PT1, PT2, PT3, and PT4 constituting the unit period T in columns of the unit period T. In addition, the column of each unit period T shows an average value AVEap of 4 average values AVEp of 4 partial periods PT1, PT2, PT3, PT4 constituting the unit period T, a standard deviation σap of the 4 average values AVEp, and a variation coefficient CV based on the average value AVEap and the standard deviation σap. In fig. 30 to 37, the coefficient of variation CV is shown in%. That is, the value of the coefficient of variation CV in fig. 30 to 37 is obtained by multiplying 100 by the standard deviation σap divided by the average value AVEap.
Unlike the AC signal 520 affected by the scattered light from the foreign matter, the AC signal 520 not affected by the scattered light from the foreign matter does not change slowly and greatly. Therefore, the average value AVEp of the partial periods PT of the unit period T (the unit periods T4 to T6, T8 in fig. 30 to 37) constituting the light receiving portion 31 that does not receive scattered light from the foreign matter is small in variation. Therefore, the standard deviation σap and the coefficient of variation CV obtained for the unit period T in which the light receiving unit 31 does not receive scattered light from the foreign matter are small.
On the other hand, since the AC signal 520 affected by the scattered light from the foreign matter gradually and largely changes, the average value AVEp between the plurality of partial periods PT constituting the unit period T (the unit period T7 of fig. 30 to 37) in which the light receiving unit 31 receives the scattered light from the foreign matter becomes large. Therefore, the standard deviation σap and the coefficient of variation CV obtained for the unit period T in which the light receiving unit 31 receives the scattered light from the foreign matter show large values.
Therefore, as described above, the determination unit 500 determines whether or not the target 1 st partial signal is an abnormal signal based on the coefficient of variation CV calculated for the target unit period T. Thus, it can be determined whether or not the target 1 st partial signal is an abnormal signal.
The 4 th threshold value used by the determination unit 500 is determined, for example, from the value of the coefficient of variation CV obtained in a prior experiment or the like based on the assumed foreign matter. For example, when the value of the coefficient of variation CV shown in fig. 30 is obtained by a prior experiment or the like, the 4 th threshold is set to, for example, 5%. When the values of the variation coefficients CV shown in fig. 31 to 37 are obtained by experiments in advance, for example, the 4 th threshold is set to 8%.
In the 3 rd determination process, the determination unit 500 may determine that the target 1 st partial signal is an abnormal signal when the standard deviation σap obtained for the target unit period T is equal to or greater than the 5 th threshold value without obtaining the variation coefficient CV. For example, when the standard deviation σap shown in fig. 30 is obtained by a prior experiment or the like, the 5 th threshold is set to, for example, 500. In addition, when the standard deviation σap shown in fig. 31 to 37 is obtained by a prior experiment or the like, the 5 th threshold is set to 200, for example.
In the example of fig. 4 described above, steps s1 to s4 are continuously performed, but other processes may be performed between step s3 and step s 4. Further, the processing of steps s1 to s3 and the processing of step s4 may be separately executed. In this case, in the calculation of the flow state value Va in step s4, the normal AC values different from the number N that are arranged in the time series may be subjected to the discrete fourier transform. The number of AC values used in the calculation of the characteristic amount and the number of AC values used in the calculation of the flow state value Va may be different.
The characteristic amount used in the abnormality determination process may include the standard deviation σu according to example 1 and the difference R according to example 2. In this case, in step s3, for example, a 1 st determination process using the standard deviation σu and a 2 nd determination process using the difference R are performed. In this case, if it is determined that the target 1 st partial signal is an abnormal signal in at least one of the 1 st determination process and the 2 nd determination process, step s1 is executed again without executing step s4. On the other hand, if it is determined that the target 1 st partial signal is not an abnormal signal in each of the 1 st determination process and the 2 nd determination process, step s4 is executed.
The characteristic amounts used in the abnormality determination process may include the standard deviation σu according to example 1 and the standard deviation σap according to example 3. In this case, in step s3, for example, the 1 st determination process using the standard deviation σu and the 3 rd determination process using the standard deviation σap are performed. In this case, if it is determined that the target 1 st partial signal is an abnormal signal in at least one of the 1 st determination process and the 3 rd determination process, step s1 is executed again without executing step s4. On the other hand, if it is determined in the 1 st determination process and the 3 rd determination process that the target 1 st partial signal is not an abnormal signal, step s4 is executed.
The characteristic amount used in the abnormality determination process may include the difference R and the standard deviation σap. In this case, in step s3, for example, the 2 nd determination process and the 3 rd determination process are executed. In this case, if it is determined that the target 1 st partial signal is an abnormal signal in at least one of the 2 nd determination process and the 3 rd determination process, step s1 is executed again without executing step s4. On the other hand, if it is determined in the 2 nd determination process and the 3 rd determination process that the target 1 st partial signal is not an abnormal signal, step s4 is executed.
The characteristic amounts used in the abnormality determination process may include a standard deviation σu, a difference R, and a standard deviation σap. In this case, in step s3, for example, the 1 st determination process, the 2 nd determination process, and the 3 rd determination process are executed. In this case, if it is determined that the target 1 st partial signal is an abnormal signal in at least one of the 1 st determination process, the 2 nd determination process, and the 3 rd determination process, step s1 is executed again without executing step s4. On the other hand, if it is determined that the target 1 st partial signal is not an abnormal signal in each of the 1 st determination process, the 2 nd determination process, and the 3 rd determination process, step s4 is executed.
When the determination unit 500 determines the abnormality signal included in the AC signal 520, the measurement device 1 may output a notification signal (also referred to as a foreign matter notification signal) notifying that the foreign matter is included in the fluid 802 to the outside of the measurement device 1. In this case, for example, if it is determined in step s3 that the target 1 st partial signal is an abnormal signal, the arithmetic circuit 5 generates a foreign matter notification signal. Then, the arithmetic circuit 5 outputs the generated foreign matter notification signal to the outside of the measurement device 1 through the connector 6. The foreign matter notification signal output to the outside of the measurement device 1 is input to an external device connected to the connector 6. Thus, the external device can know that the foreign matter in the fluid 802 is determined in the measuring device 1.
When the measuring apparatus 1 is provided with a real-time clock for outputting the current time, the foreign matter notification information including the time at which the foreign matter is specified (also referred to as the foreign matter specifying time) may be output to the outside of the measuring apparatus 1. Thus, the external device connected to the connector 6 can know the timing of determining the foreign matter in the measuring device 1. The measurement device 1 may set the time when the object 1 st partial signal is determined to be the abnormal signal in step s3 as the foreign matter determination time.
The external device connected to the measurement device 1 may be, for example, a display device. Fig. 38 is a diagram showing an example of a configuration of a measurement system 100 including a measurement device 1 and a display device 10 connected to the measurement device 1. The external device may be a device other than the display device.
In the example of fig. 38, the display device 10 is connected to the connector 6 via the cable 11. The display device 10 can display various information such as characters, signs, and graphics. The display device 10 may display various information related to measurement of the flow of the fluid 802 in the measurement device 1. The display device 10 may be, for example, a liquid crystal display device, or may be another type of display device.
When the arithmetic circuit 5 outputs the calculated flow state value Va to the display device 10 via the connector 6, the display device 10 can display the received flow state value Va. In this case, the display device 10 may display the calculated value Vb included in the flow state value Va, may display the flow rate included in the flow state value Va, or may display the flow rate included in the flow state value Va.
When the arithmetic circuit 5 outputs the abnormality notification signal to the display device 10 via the connector 6, the display device 10 displays notification information (also referred to as foreign matter notification information) notifying that the foreign matter is contained in the fluid 802. In this case, a user who sees the display of the display device 10 can know that foreign matter is contained in the fluid 802. The display device 10 may display the foreign matter notification information in characters, may display the foreign matter notification information in graphics, or may display the foreign matter notification information in a combination of characters and graphics. In addition, in the case where the arithmetic circuit 5 outputs a foreign matter notification signal including the foreign matter determination timing to the display device 10 via the connector 6, the display device 10 can display the foreign matter determination timing. In this case, the user who views the display of the display device 10 can know the timing of determining the foreign matter in the fluid 802 in the measuring device 1.
The external devices such as the measurement device 1 and the display device 10 may be connected not by a wire but by a wireless connection. In this case, the measurement device 1 may be provided with a communication circuit capable of wireless communication with an external device instead of the connector 6.
As described above, the measurement device 1 and the measurement system 100 have been described in detail, but the above description is merely an example in all aspects, and the present disclosure is not limited thereto. The above examples can be used in combination as long as they do not contradict each other. Further, it is understood that numerous examples not illustrated can be envisaged without exceeding the scope of the disclosure.
Symbol description
1. Measuring device
10. Display device
30. Light emitting part
31. Light receiving part
100. Measurement system
500. Determination part
501. Calculation unit
510. Program
800. An object to be irradiated.
Claims (12)
1. A measuring device is provided with:
a light-emitting unit that irradiates an object to be irradiated, through which a fluid flows;
a light receiving unit that receives interference light of light scattered by the object to be irradiated and outputs an output signal corresponding to the intensity of the interference light;
a determination unit that obtains a characteristic amount indicating a characteristic of a signal waveform of the output signal, and determines an abnormal signal contained in the output signal based on the obtained characteristic amount; and
And a calculating unit configured to calculate a flow state value indicating a state of the flow of the fluid based on a signal other than the abnormality signal in the output signal.
2. The measuring device according to claim 1, wherein,
the determination unit acquires the characteristic amount of a 1 st signal waveform of a 1 st partial signal in the 1 st period included in the output signal for each 1 st period, and determines whether the 1 st partial signal is the abnormal signal based on the acquired characteristic amount.
3. The measuring device according to claim 2, wherein,
the characteristic amount includes a difference between a maximum value and a minimum value of the 1 st signal waveform.
4. The measuring device according to claim 2 or 3, wherein,
the characteristic amount includes the 1 st standard deviation of the 1 st signal waveform.
5. The measuring apparatus according to claim 4, wherein,
the determination unit compares the 1 st standard deviation of a certain 1 st period with a 1 st average value of the 1 st standard deviations of a plurality of 1 st periods preceding the certain 1 st period, and determines whether or not the 1 st partial signal in the certain 1 st period is the abnormal signal based on a result of the comparison.
6. The measuring device according to any one of claims 2 to 5, wherein,
the period 1 is divided into a plurality of periods 2,
the determination unit obtains a 2 nd average value of a 2 nd signal waveform of a 2 nd partial signal in the 2 nd periods included in the 1 st partial signal for each of the plurality of 2 nd periods, obtains a 2 nd standard deviation of the 2 nd average value obtained for the plurality of 2 nd periods,
the characteristic amount includes the 2 nd standard deviation.
7. The measuring apparatus according to claim 6, wherein,
the determination unit determines whether or not the 1 st partial signal is the abnormal signal based on a coefficient of variation obtained by dividing the 2 nd standard deviation by an average value of the 2 nd average values obtained in the plurality of 2 nd periods.
8. The measuring device according to any one of claims 1 to 7, wherein,
when the determination unit determines the abnormality signal, a notification signal for notifying that foreign matter is contained in the fluid is output to the outside of the measurement device.
9. A measurement system is provided with:
the measurement device according to any one of claims 1 to 8; and
and a display device for displaying the flow state value calculated by the measurement device.
10. A measurement system is provided with:
the assay device of claim 8; and
and a display device configured to display notification information for notifying that foreign matter is contained in the fluid when the measurement device outputs the notification signal to the outside of the measurement device.
11. A measurement method performed in an apparatus, the measurement method comprising:
when a light emitting unit irradiates light to an object through which a fluid flows, a characteristic amount representing a characteristic of a signal waveform of an output signal corresponding to the intensity of interference light outputted from a light receiving unit that receives the interference light including light scattered by the object is acquired, and an abnormal signal included in the output signal is specified based on the acquired characteristic amount; and
a flow state value indicating a state of the flow of the fluid is calculated based on a signal other than the abnormal signal in the output signal.
12. A program for causing a computer to execute a process,
when the light emitting section irradiates light to an object flowing through the fluid, the computer receives an output signal corresponding to the intensity of the interference light outputted from the light receiving section receiving the interference light including the light scattered by the object,
The program causes a computer to execute:
acquiring a characteristic amount representing a characteristic of a signal waveform of the output signal, and determining an abnormal signal contained in the output signal based on the acquired characteristic amount; and
a flow state value indicating a state of the flow of the fluid is calculated based on a signal other than the abnormality signal in the output signal.
Applications Claiming Priority (3)
| Application Number | Priority Date | Filing Date | Title |
|---|---|---|---|
| JP2020-162391 | 2020-09-28 | ||
| JP2020162391 | 2020-09-28 | ||
| PCT/JP2021/035075 WO2022065429A1 (en) | 2020-09-28 | 2021-09-24 | Measuring device, measuring system, measuring method, and program |
Publications (1)
| Publication Number | Publication Date |
|---|---|
| CN116324425A true CN116324425A (en) | 2023-06-23 |
Family
ID=80846612
Family Applications (1)
| Application Number | Title | Priority Date | Filing Date |
|---|---|---|---|
| CN202180064245.9A Pending CN116324425A (en) | 2020-09-28 | 2021-09-24 | Measurement device, measurement system, measurement method, and program |
Country Status (5)
| Country | Link |
|---|---|
| US (1) | US20230337926A1 (en) |
| EP (1) | EP4220187A1 (en) |
| JP (1) | JPWO2022065429A1 (en) |
| CN (1) | CN116324425A (en) |
| WO (1) | WO2022065429A1 (en) |
Family Cites Families (13)
| Publication number | Priority date | Publication date | Assignee | Title |
|---|---|---|---|---|
| JPS57207882A (en) * | 1981-06-17 | 1982-12-20 | Tokyo Keiki Co Ltd | Ultrasonic receiving device |
| JPH027524U (en) * | 1988-06-30 | 1990-01-18 | ||
| JPH06237998A (en) | 1993-02-19 | 1994-08-30 | Ube Ind Ltd | Detection of air bubble |
| JP4642279B2 (en) * | 2001-06-28 | 2011-03-02 | 株式会社日立メディコ | Biological light measurement device |
| US8339584B2 (en) * | 2010-05-21 | 2012-12-25 | Teledyne Technologies Incorporated | Velocity measuring system |
| JPWO2016046905A1 (en) * | 2014-09-24 | 2017-08-10 | パイオニア株式会社 | Measuring apparatus, measuring method, computer program and recording medium |
| JP6531773B2 (en) * | 2017-04-14 | 2019-06-19 | 株式会社デンソー | Air flow measuring device |
| JP2019045488A (en) * | 2017-08-31 | 2019-03-22 | Ntn株式会社 | Noise elimination method of state monitoring device and state monitoring device |
| JP2019076641A (en) * | 2017-10-27 | 2019-05-23 | ソニー株式会社 | Measurement device and measurement method |
| WO2019146762A1 (en) * | 2018-01-26 | 2019-08-01 | 京セラ株式会社 | Fluid measurement device, fluid measurement method, and program |
| JP7330170B2 (en) * | 2018-03-28 | 2023-08-21 | 京セラ株式会社 | Flow velocity calculator and flow velocity sensor device |
| JP2018163163A (en) | 2018-06-04 | 2018-10-18 | パイオニア株式会社 | Bubble detector |
| JP7270440B2 (en) | 2019-03-28 | 2023-05-10 | 三菱電機株式会社 | WIRELESS POWER TRANSMISSION SYSTEM AND WIRELESS POWER TRANSMISSION METHOD |
-
2021
- 2021-09-24 JP JP2022552068A patent/JPWO2022065429A1/ja not_active Withdrawn
- 2021-09-24 WO PCT/JP2021/035075 patent/WO2022065429A1/en active Application Filing
- 2021-09-24 CN CN202180064245.9A patent/CN116324425A/en active Pending
- 2021-09-24 US US18/027,850 patent/US20230337926A1/en not_active Abandoned
- 2021-09-24 EP EP21872558.8A patent/EP4220187A1/en not_active Withdrawn
Also Published As
| Publication number | Publication date |
|---|---|
| US20230337926A1 (en) | 2023-10-26 |
| JPWO2022065429A1 (en) | 2022-03-31 |
| WO2022065429A1 (en) | 2022-03-31 |
| EP4220187A1 (en) | 2023-08-02 |
Similar Documents
| Publication | Publication Date | Title |
|---|---|---|
| EP3433599B1 (en) | Laser sensor for ultra-fine particle size detection | |
| WO2018012312A1 (en) | Measurement device, measurement method, and measurement program | |
| US10271747B2 (en) | Living-body information measuring device | |
| CN108685569B (en) | Pulse measurement apparatus, pulse measurement method, and non-transitory computer readable medium | |
| JP2016128795A (en) | Particle measurement device, air cleaning machine, and particle measurement method | |
| CN110326175A (en) | Method for determining the operating condition of the particle detector based on laser | |
| CN116324425A (en) | Measurement device, measurement system, measurement method, and program | |
| EP2929834A1 (en) | Measurement device, probe portion and connection cable | |
| CN209485440U (en) | The vortex flowmeter of flow velocity for measurement process fluid | |
| JP2022070650A (en) | Measurement device, measurement system, measurement method, and program | |
| WO2019146663A1 (en) | Fluid measurement device, fluid measurement method, and program | |
| JP2022085336A (en) | Measuring device, measuring system, measuring method, program, and method for calibrating measuring device | |
| KR101630301B1 (en) | Taper tube type area flow meter using magnetrostricive position detector | |
| WO2019082688A1 (en) | Measurement device and measurement method | |
| WO2022255327A1 (en) | Measurement device, processing method, and program | |
| CN114585302A (en) | Measurement device, measurement system, measurement method, and program | |
| US10006856B2 (en) | Device and method for calibrating a scattered-light meter | |
| JP2009145257A (en) | Temperature sensor and measuring method of temperature | |
| Koch | Sound field measurement in a double layer cavitation cluster by rugged miniature needle hydrophones | |
| JP6820706B2 (en) | Electronics, control methods and programs | |
| CN113874749A (en) | Laser sensor module with dirt detection | |
| WO2018062294A1 (en) | Electronic device, control method, and program | |
| JP7058376B1 (en) | Measuring device and estimation system | |
| CN116194737A (en) | Measuring device, measuring system, program, and method for calibrating measuring device | |
| WO2020121944A1 (en) | Measurement device, measurement system, and measurement method |
Legal Events
| Date | Code | Title | Description |
|---|---|---|---|
| PB01 | Publication | ||
| PB01 | Publication | ||
| SE01 | Entry into force of request for substantive examination | ||
| SE01 | Entry into force of request for substantive examination |