CN114355280B - Multi-sensor composite array antenna arraying and multi-information fusion sorting angle measuring method - Google Patents
Multi-sensor composite array antenna arraying and multi-information fusion sorting angle measuring method Download PDFInfo
- Publication number
- CN114355280B CN114355280B CN202210267165.XA CN202210267165A CN114355280B CN 114355280 B CN114355280 B CN 114355280B CN 202210267165 A CN202210267165 A CN 202210267165A CN 114355280 B CN114355280 B CN 114355280B
- Authority
- CN
- China
- Prior art keywords
- angle
- sorting
- signal
- antenna
- interferometer
- Prior art date
- Legal status (The legal status is an assumption and is not a legal conclusion. Google has not performed a legal analysis and makes no representation as to the accuracy of the status listed.)
- Active
Links
Images


Classifications
-
- G—PHYSICS
- G01—MEASURING; TESTING
- G01S—RADIO DIRECTION-FINDING; RADIO NAVIGATION; DETERMINING DISTANCE OR VELOCITY BY USE OF RADIO WAVES; LOCATING OR PRESENCE-DETECTING BY USE OF THE REFLECTION OR RERADIATION OF RADIO WAVES; ANALOGOUS ARRANGEMENTS USING OTHER WAVES
- G01S3/00—Direction-finders for determining the direction from which infrasonic, sonic, ultrasonic, or electromagnetic waves, or particle emission, not having a directional significance, are being received
- G01S3/02—Direction-finders for determining the direction from which infrasonic, sonic, ultrasonic, or electromagnetic waves, or particle emission, not having a directional significance, are being received using radio waves
- G01S3/14—Systems for determining direction or deviation from predetermined direction
Abstract
The invention discloses a multi-sensor composite array antenna arraying and multi-information fusion sorting angle measuring method, belonging to the technical field of fusion, and comprising the following steps: step 1, performing parameter measurement on signals received by an antenna array to obtain corresponding pulse description words; 2, carrying out interferometer direction finding by using the leading edge amplitude phase of the antenna to obtain the azimuth angle of each pulse description word; step 3, utilizing the direction finding result of the interferometer to carry out angle sorting; step 4, performing electromagnetic parameter sorting on the pulses meeting the angle sorting result; step 5, setting a spectrum estimation direction-finding range according to the direction-finding result of the interferometer; and 6, performing small-range spectrum estimation angle measurement on the pulses meeting the angle and electromagnetic parameter sorting results, and outputting sorting and angle measurement results. The method realizes angle sorting and then parameter sorting, improves the signal sorting accuracy, dilutes the pulse density and reduces the spectrum estimation angle measurement range, and lays a foundation for quickly and accurately detecting the target in a complex electromagnetic environment.
Description
Technical Field
The invention relates to the technical field of fusion in the field of array antenna arrangement and signal processing, in particular to a multi-sensor composite array antenna arrangement and multi-information fusion sorting angle measurement method.
Background
In the array direction finding process, common direction finding methods include interferometer direction finding and spectral estimation direction finding. The interferometer has high angle measurement operation speed, can realize pulse-by-pulse real-time direction measurement, has stronger complex electromagnetic environment sorting capability by combining an angle sorting method, but does not have super-resolution capability, and has precision inferior to the spectrum estimation direction measurement; the spectrum estimation direction finding precision is high, super-resolution bait resistance can be realized, the operation speed is low, pulse-by-pulse real-time direction finding is difficult to realize, and the sorting capability is weak in a complex electromagnetic environment. When the multi-sensor is installed in a common aperture mode, an array antenna usually adopts annular arrangement and is difficult to have interferometer direction finding and spectrum estimation direction finding at the same time, and meanwhile, an existing array direction finding scheme usually adopts a single direction finding system and is difficult to give consideration to sorting, direction finding and bait resistance in a complex environment.
Disclosure of Invention
In view of the above, aiming at the problems of sorting, direction finding and bait resistance of array direction finding in a complex environment, the invention provides a multi-sensor composite array antenna arrangement and multi-information fusion sorting angle-measuring method, which is based on the advantages of pulse-by-pulse quick direction finding of an interferometer, realizes angle sorting and then parameter sorting, and improves the accuracy of signal sorting.
The invention discloses a multi-sensor composite array antenna arraying and multi-information fusion sorting angle measuring method, which comprises the following steps:
2, carrying out interferometer direction finding by using the leading edge amplitude phase of the antenna to obtain the azimuth angle of each pulse description word;
and 6, performing small-range spectrum estimation angle measurement on the pulses meeting the angle and electromagnetic parameter sorting results, and outputting sorting and angle measurement results.
Optionally, step 2 includes:
leading edge phase Ph using 1-n antenna1~PhnAnd carrying out interferometer direction finding to obtain the azimuth angle of each pulse description word, wherein the azimuth angle is as follows:

in the formula: is an azimuth angle; d1nThe distance between the No. 1 antenna and the No. n antenna; ph1nThe phase difference between the antenna No. 1 and the antenna No. n is obtained; λ is the signal wavelength, calculated by dividing the speed of light by the signal frequency.
Optionally, the pulse description word includes a frequency, a pulse width, an arrival time, a signal covariance, an amplitude of a leading edge of each channel signal, and a phase of the leading edge of each channel signal.
Optionally, step 3 includes:
31, setting the distance between the radar and the bait to be R1, setting the distance between the direction-finding array and the radar to be R2, and calculating an angle clustering threshold Comprises the following steps:
 ;
;


wherein the content of the first and second substances, is as follows
 Each pulse describes a subset of words and n denotes the number of antennas.
Optionally, the step 4 includes:
and eliminating outliers obviously inconsistent with the prior information in the angle clustering result according to the prior information, and sequentially carrying out electromagnetic parameter sorting on the pulses in each angle stack, wherein the outliers comprise signal frequency, repetition period and pulse width.
Optionally, step 5 includes:
calculating a spectrum estimation angle measurement range by using an interferometer angle measurement result, and estimating an angle measurement unilateral range by using the spectrum The method is the same as the clustering threshold of the angle measurement of the interferometer, namely the spectrum estimation angle measurement range is reduced as follows: orientation
 In pitch
 。
。
Optionally, the step 6 includes:
step 61, performing spectrum estimation angle measurement on the pulse meeting the sorting results of the angle and the electromagnetic parameters to obtain a received data vector;
step 62, calculating the covariance of the received data vector;
step 63, carrying out characteristic decomposition on the covariance to obtain a signal subspace and a noise subspace;
step 64, obtaining a target angle value according to the signal subspace, the noise subspace and a spatial spectrum function calculation formula of the MUSIC algorithm; then, outputting a sorting result and an angle measurement result; wherein, the angle measurement result is a target angle value.
Optionally, the received data vector is:

wherein the content of the first and second substances, in order to receive the vector of data,
 in order to be the vector of the signal,
 in order to be a vector of the noise,
 in the form of an array of flow pattern matrices,
 is as follows
 The direction vector of each signal source is determined,
 in order to receive the number of antennas in the antenna array,
 ,
, is the speed of light;
the step 62 includes:
because the noise of each antenna element in the antenna array is not correlated and the noise is not correlated with the signal received by the antenna array, the data vector is received The covariance matrix of (a) is:

in the formula: as a vector of signals
 The covariance matrix of (a) is determined,
 ,
, is the variance of the gaussian noise and is,
 is an identity matrix.
Optionally, step 63 includes:
performing characteristic decomposition on the covariance matrix R to obtain A characteristic value of
 The characteristic values are sorted from big to small into
 The corresponding feature vector is
 Dividing the space U formed by the feature vector into signal subspaces
 And noise subspace
 Namely:

wherein the content of the first and second substances, ,
, ,
, 。
。
optionally, step 64 includes:
as can be seen from the subspace basic principle, the signal subspace is orthogonal to the noise subspace, and the signal subspace and the subspace spanned by the signal direction vectors are the same subspace, so there are: ;
;
the spatial spectrum function calculation formula of the MUSIC algorithm is as follows:
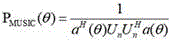
wherein the spectral function The angle corresponding to the maximum value is the target angle value
 N is the target number of the spectral estimation super-resolution, and N is not more than 7; spectral function
 The maximum value is the spectrum peak;
 is the direction vector of the signal source,
 and
and azimuth and pitch angles, respectively, for the ith signal.
Due to the adoption of the technical scheme, the invention has the following advantages: the method is used for the array direction finding technology, is compatible with the interferometer and the spectrum estimation direction finding requirements through an effective antenna array arrangement mode, realizes angle sorting and then parameter sorting based on the advantage of pulse-by-pulse quick direction finding of the interferometer, improves the signal sorting accuracy, simultaneously dilutes the pulse density and reduces the spectrum estimation angle finding range, carries out high-precision direction finding and super-resolution decoy resistance on the sorted signals through spectrum estimation on the basis, and lays a foundation for quickly and accurately detecting the target in a complex electromagnetic environment.
Drawings
In order to more clearly illustrate the technical solutions in the embodiments of the present invention, the drawings needed to be used in the description of the embodiments are briefly introduced below, and it is obvious that the drawings in the following description are only some embodiments described in the embodiments of the present invention, and it is obvious for those skilled in the art that other drawings can be obtained according to the drawings.
Fig. 1 is a schematic flow chart of a multi-sensor composite array antenna arraying and multi-information fusion sorting angle measurement method according to an embodiment of the present invention;
FIG. 2 is a schematic diagram of an array layout compatible with interferometers and spectral estimation direction finding according to an embodiment of the present invention;
FIG. 3 is a schematic diagram of a scenario of an embodiment of the present invention;
fig. 4 is a schematic view of the variation trend of azimuth angles of the radar 1 and the radar 2 according to the embodiment of the present invention;
fig. 5 is a schematic diagram illustrating the variation trend of the pitch angles of the radar 1 and the radar 2 according to the embodiment of the present invention;
FIG. 6 is a schematic diagram of a simulation result of radar azimuth measurement obtained by the method of the present invention according to an embodiment of the present invention;
FIG. 7 is a schematic diagram of a simulation result of a radar pitch angle measurement obtained by using the method of the present invention according to an embodiment of the present invention;
FIG. 8 is a schematic diagram of a simulation result of a radar azimuth interferometer angle measurement obtained by interferometer angle measurement according to an embodiment of the present invention;
fig. 9 is a schematic diagram of a simulation result of a radar pitch interferometer angle measurement obtained by using an interferometer angle measurement according to an embodiment of the present invention.
Detailed Description
The present invention will be further described with reference to the accompanying drawings and examples, it being understood that the examples described are only some of the examples and are not intended to limit the invention to the embodiments described herein. All other embodiments available to those of ordinary skill in the art are intended to be within the scope of the embodiments of the present invention.
The first embodiment is as follows:
referring to fig. 1, the invention discloses a multi-sensor composite array antenna arraying and multi-information fusion sorting angle measuring method, which comprises the following steps:
s1, carrying out parameter measurement on the signals received by the antenna array to obtain corresponding pulse description words;
s2, carrying out interferometer direction finding by using the leading edge amplitude phase of the antenna to obtain the azimuth angle of each pulse description word;
s3, angle sorting is carried out by utilizing the direction finding result of the interferometer;
s4, performing electromagnetic parameter sorting on the pulses meeting the angle sorting result;
s5, setting a spectrum estimation direction finding range according to the direction finding result of the interferometer;
and S6, performing small-range spectrum estimation angle measurement on the pulse meeting the angle and electromagnetic parameter sorting results, and outputting sorting and angle measurement results.
The method comprises the following steps that composite antennas are arranged according to installation apertures, active antennas are eccentrically arranged, N passive antennas with the same system and the same polarization are arranged in an L mode to form an azimuth linear array and a pitching linear array required by interferometer angle measurement, M antennas with different polarizations are arranged around the linear array to form a multi-polarization array required by spectrum estimation together with the previous N antennas, and therefore the multi-sensor composite array antenna arrangement can be obtained; wherein N and M are both positive integers.
In this embodiment, S2 includes:
leading edge phase Ph using 1-n antenna1~PhnAnd carrying out interferometer direction finding to obtain the azimuth angle of each pulse description word, wherein the azimuth angle is as follows:

in the formula: is an azimuth angle; d1nThe distance between the No. 1 antenna and the No. n antenna; ph1nThe phase difference between the antenna No. 1 and the antenna No. n is obtained; λ is the signal wavelength, calculated by dividing the speed of light by the signal frequency.
In this embodiment, the pulse description word contains the frequency, pulse width, arrival time, signal covariance, amplitude of the leading edge of each channel signal, and phase of the leading edge of each channel signal.
In this embodiment, S3 includes:
31, setting the distance between the radar and the bait to be R1, setting the distance between the direction-finding array and the radar to be R2, and calculating an angle clustering threshold Comprises the following steps:
 ;
;


wherein the content of the first and second substances, is as follows
 A subset of pulse description words, n denotesThe serial number of the antenna.
In this embodiment, S4 includes:
according to prior information (such as the approximate position and direction of a target, a platform motion track and the like), field values obviously inconsistent with the prior information in the angle clustering result are removed, and electromagnetic parameter sorting including signal frequency, repetition period and pulse width is sequentially carried out on the pulses in each angle stack.
In this embodiment, S5 includes:
calculating a spectrum estimation angle measurement range by using an interferometer angle measurement result, and estimating an angle measurement unilateral range by using the spectrum The method is the same as the clustering threshold of the angle measurement of the interferometer, namely the spectrum estimation angle measurement range is reduced as follows: orientation
 In pitch
 。
。
In this embodiment, S6 includes:
calculating a spectrum estimation angle measurement range by using an interferometer angle measurement result, and estimating an angle measurement unilateral range by using the spectrum The method is the same as the clustering threshold of the angle measurement of the interferometer, namely the spectrum estimation angle measurement range is reduced as follows: orientation
 In pitch
 。
。
In this embodiment, the received data vector is:

wherein the content of the first and second substances, in order to receive the vector of data,
 in order to be the vector of the signal,
 in order to be a vector of the noise,
 in the form of an array of flow pattern matrices,
 is as follows
 The direction vector of each signal source is determined,
 in order to receive the number of antennas in the antenna array,
 ,
, is the speed of light;
s62 includes:
because the noise of each antenna element in the antenna array is not correlated and the noise is not correlated with the signal received by the antenna array, the data vector is received The covariance matrix of (a) is:

in the formula: as a vector of signals
 The covariance matrix of (a) is determined,
 ,
, is the variance of the gaussian noise and is,
 is an identity matrix.
In this embodiment, S63 includes:
performing characteristic decomposition on the covariance matrix R to obtain A characteristic value of
 The characteristic values are sorted from big to small into
 The corresponding feature vector is
 Dividing the space U formed by the spread characteristic vectors into signal subspaces
 And noise subspace
 Namely:

wherein the content of the first and second substances, ,
, ,
, 。
。
in this embodiment, S64 includes:
as can be seen from the subspace basic principle, the signal subspace is orthogonal to the noise subspace, and the signal subspace and the subspace spanned by the signal direction vectors are the same subspace, so there are: ;
;
the spatial spectrum function calculation formula of the MUSIC algorithm is as follows:

wherein the spectral function The angle corresponding to the maximum value is the target angle value
 N is the target number of the spectral estimation super-resolution, and N is not more than 7; spectral function
 The maximum value is the spectrum peak;
 is the direction vector of the signal source,
 and
and azimuth and pitch angles, respectively, for the ith signal.
Example two:
the invention provides an embodiment of typical array antenna arrangement, as shown in fig. 2, wherein antennas numbered 1-5 are left-handed circularly polarized antennas, antennas numbered 6 are 45-degree oblique line polarized antennas, antennas numbered 7 are right-handed circularly polarized antennas, and antennas 8 are-45-degree oblique line polarized antennas; 3 antennas numbered 1, 2 and 3 are arranged in a straight line in the azimuth direction to form an azimuth baseline of the interferometer, and the length from the antenna 1 to the antenna 2 is 1/2 to 1/3 of the length from the antenna 2 to the antenna 3; 3 antennas numbered 1, 4 and 5 are arranged in a straight line in the pitching direction to form an interferometer pitching baseline, and the length between the antenna 1 and the antenna 4 is 1/2 to 1/3 of the length between the antenna 4 and the antenna 5; the antennas No. 1-8 form a spectrum estimation direction-finding array together.
Firstly, an 8-channel digital receiver is used for measuring parameters of signals received by an antenna array to obtain corresponding Pulse Description Words (PDW) including frequency f, pulse width PW, arrival time TOA, signal covariance R and amplitude Pa of leading edge of each channel signal1~Pa8And phase Ph of the leading edge of each channel signal1~Ph8And so on.
Secondly, utilizing the leading edge phase Pa of the No. 1 to No. 3 antennas1~Pa8Carrying out interferometer direction finding to obtain azimuth angle information of each PDW, wherein the azimuth angle is as follows:

in the formula:
Ød13the distance between the No. 1 antenna and the No. 3 antenna;
ØPh13the phase difference between the antenna No. 1 and the antenna No. 3 is obtained;
the positive axis lambda is the signal wavelength and is calculated by dividing the light speed by the signal frequency.
Due to the fact that The antenna is a periodic function taking 2 pi as a period, and when the angle is beyond 2 pi, angle ambiguity is generated, so that the ambiguity needs to be resolved by using the No. 1 antenna and the No. 2 antenna as short baselines.
Similarly, the leading edge phase Ph of the No. 1, 4 and 5 antennas is utilized1、Ph4、Ph5Carrying out interferometer direction finding to obtain the pitch angle information of each PDW ,
,
Thirdly, calculating an angle clustering threshold by taking the set distance between the radar and the bait as R1 and the distance between the direction-finding array and the radar as R2 Comprises the following steps:

according to the angle measurement result by using interferometer Performing angle clustering for the threshold to form an angle-by-angle center
 ,
, Is an indexed PDW subset
 。
。
And fourthly, eliminating outliers from the angle clustering result, and sequentially sorting the electromagnetic parameters of the pulses in each angle stack, wherein the electromagnetic parameters comprise signal frequency, repetition period, pulse width and the like.
The fifth step, using interferometer to measureThe angle result calculates the spectral estimation angle measurement range, and the spectral estimation angle measurement unilateral range The method is the same as the clustering threshold of the angle measurement of the interferometer, namely the spectrum estimation angle measurement range is reduced as follows: azimuth of square
 In pitch
 。
。
Sixthly, performing spectrum estimation angle measurement on the pulse meeting the sorting result of the angle and the electromagnetic parameters, wherein the angle measurement range is the azimuth In pitch
 The output of the m-th antenna is

In the formula: ,
, ,
, the direction of the kth signal source.
Writing the above formula into matrix form

Wherein the content of the first and second substances, in order to receive the vector of data,
 in order to be the vector of the signal,
 in order to be a vector of the noise,
 in the form of an array of flow pattern matrices,
 is as follows
 The direction vector of each signal source is determined,
 in order to receive the number of antennas in the antenna array,
 ,
, is the speed of light;
because the noise of each antenna element in the antenna array is not correlated and the noise is not correlated with the signal received by the antenna array, the data vector is received The covariance matrix of (a) is:

in the formula: as a vector of signals
 The covariance matrix of (a) is determined,
 ,
, is the variance of the gaussian noise and is,
 is an identity matrix.
Performing characteristic decomposition on the covariance matrix R to obtain A characteristic value of
 The characteristic values are sorted from big to small into
 The corresponding feature vector is
 Dividing the space U formed by the spread characteristic vectors into signal subspaces
 And noise subspace
 Namely:

wherein the content of the first and second substances, ,
, ,
, 。
。
as can be seen from the subspace rationale, the signal subspace is orthogonal to the noise subspace, and the signal subspace is the same subspace as the subspace spanned by the signal direction vectors. Therefore, there are: 。
。
the spatial spectrum function calculation formula of the MUSIC algorithm is as follows:

wherein the spectral function The angle corresponding to the maximum value is the target angle value
 N is the target number of the spectral estimation super-resolution, and N is not more than 7; spectral function
 The maximum value is the spectrum peak;
 is the direction vector of the signal source,
 and
and azimuth and pitch angles, respectively, for the ith signal.
Example three:
in the embodiment, the calculation analysis is performed by a simulation calculation method. By adopting the method provided by the invention, 4 radar sites are rapidly sorted and subjected to direction finding, wherein 1 radar site contains a radar target and 3 baits.
The simulation calculation setup scenario is shown in fig. 3.
1) Setting the positions of a real target and a false target under a north heaven coordinate system of a prediction point: radar target 1 position (-400, 0, 0), bait 1 position (400, 0, 0), bait 2 position (0, -330, 0), bait 3 position (0, 330, 0), radar target 2 position (3000, 1000, 0), radar target 3 position (-5000, -5000, 0), radar target 4 position (1000, -10000, 0), units are meters;
2) the electromagnetic parameters of each radar target are as follows:
the electromagnetic signal parameters of the radar target 1 are: the frequency is changed rapidly to 5300 MHz-5800 MHz, the repetition period is 1786us, the pulse width is 32us, the front edge and the rear edge of the bait are shielded, the bait 1 leads 4us, the bait 2 leads 2us, and the bait 3 lags 2 us;
the electromagnetic signal parameters of the radar target 2 are: the frequency is 5600MHz, the repetition period 1298us, and the pulse width jitter range is 48 us-36 us;
the electromagnetic signal parameters of the radar target 3 are: the frequency is 5350MHz, the repetition period is jittered for 650 us-460 us, and the pulse width is 24 us;
the electromagnetic signal parameters of the radar target 4 are: the frequency is quickly changed to 5500 MHz-5900 MHz, the repetition period is 60us, and the pulse width is 8 us;
3) the platform flies forwards at the speed of (-380 m/s, -40m/s, -280 m/s) from the position of (4000 m,500m,3000 m);
4) the direction-finding precision of the interferometer is 0.8 degree of root mean square error, the spectrum estimation direction-finding precision is 0.4 degree of root mean square error, and the spectrum estimation resolution is 5 degrees;
5) the radar to bait set distance was set to 1000 m.
The method provided by the invention is adopted for angle measurement and sorting, and the specific steps are as follows:
1) under different distances from the platform to the radar target, simulating an angle clustering result measured by an interferometer, and only PDW piles of the radar 1 and the radar 2 are left after angle sorting because the angle difference between the radar 3 and the radar 4 is large, as shown in fig. 4 and 5;
2) electromagnetic parameter sorting is respectively carried out on the two PDW piles, the PDW pile of the radar 2 can be removed, and the PDW pile of the radar 1 is obtained through sorting;
3) reducing the spectrum estimation angle measurement threshold according to the angle clustering threshold, and performing spectrum estimation angle measurement in a small angle range on the PDW stack of the radar 1 to obtain a spectrum estimation angle measurement result, as shown in FIGS. 6 and 7;
as shown in fig. 6 and 7, by adopting the method, the targets with close parameters but far angles can be effectively removed through angle sorting, the required targets can be further sorted through parameter sorting, and meanwhile, the angle measuring range of spectrum estimation is effectively reduced and the spectrum estimation angle measuring speed is improved through interferometer angle measurement and angle sorting. As a comparison, a scheme of circular array arrangement and single spectrum estimation angle measurement is adopted, angle separation is difficult to carry out due to low angle measurement speed, parameter separation is carried out firstly, and targets are difficult to accurately separate due to the fact that parameters of 4 radars are close; by adopting the scheme of linear array arrangement and interferometer angle measurement, angle sorting can be performed, but super-resolution angle measurement cannot be performed, and only the 2-degree angle of the bait before the super-resolution angle measurement can be measured, as shown in fig. 8 and 9.
Comparing the results of conventional interferometers, spectral estimation and the sorting and angle measurement of the present invention as shown in table 1, it can be seen that the sorting and bait resistance in complex environments can be effectively improved by using the present invention.
TABLE 1 sorting and Angle measurement statistics
| Fusion method | Interferometer | Spectral estimation | The invention |
| Sorting results | Sorting is correct | Sorting failure | Sorting is correct |
| Angle measurement result | Bait incapable of super-resolution and tracking | The spectrum estimation angular measurement speed is slow, and under the condition of sorting failure, the angular measurement is difficult to complete in real time, so that the angular measurement is wrong. | |
The verification shows that the invention simultaneously realizes the interferometer and the spectrum estimation direction finding, and considers the signal sorting, the direction finding precision and the super-resolution bait resistance.
Finally, it should be noted that: the above embodiments are only for illustrating the technical solutions of the present invention and not for limiting the same, and although the present invention is described in detail with reference to the above embodiments, those of ordinary skill in the art should understand that: modifications and equivalents may be made to the embodiments of the invention without departing from the spirit and scope of the invention, which is to be covered by the claims.
Claims (9)
1. A multi-sensor composite array antenna arraying and multi-information fusion sorting angle measuring method is characterized by comprising the following steps:
step 1, performing parameter measurement on signals received by an antenna array to obtain corresponding pulse description words;
2, carrying out interferometer direction finding by using the leading edge amplitude phase of the antenna to obtain the azimuth angle of each pulse description word;
step 3, utilizing the direction finding result of the interferometer to carry out angle sorting;
step 4, performing electromagnetic parameter sorting on the pulses meeting the angle sorting result;
step 5, setting a spectrum estimation direction-finding range according to the direction-finding result of the interferometer;
step 6, carrying out small-range spectrum estimation angle measurement on the pulses meeting the sorting results of the angles and the electromagnetic parameters, and outputting sorting and angle measurement results;
the step 3 comprises the following steps:
31, setting the distance between the radar and the bait to be R1, setting the distance between the direction-finding array and the radar to be R2, and calculating an angle clustering threshold Comprises the following steps:
 ;
;
step 32, according to the angle measurement result by using the interferometer Performing angle clustering for the threshold to form an angle-by-angle center
 And
And for the subset of indexed pulse description words,

wherein the content of the first and second substances, is as follows
 Each pulse describes a subset of words, n represents the serial number of the antenna, and k is the number of signal sources.
2. The method of claim 1, wherein the step 2 comprises:
leading edge phase Ph using 1-n antenna1~PhnAnd carrying out interferometer direction finding to obtain the azimuth angle of each pulse description word, wherein the azimuth angle is as follows:

in the formula: is an azimuth angle; d1nThe distance between the No. 1 antenna and the No. n antenna; ph1nThe phase difference between the antenna No. 1 and the antenna No. n is obtained; λ is the signal wavelength, calculated by dividing the speed of light by the signal frequency.
3. The method of claim 2, wherein the pulse description word comprises a frequency, a pulse width, an arrival time, a signal covariance, an amplitude of a leading edge of each channel signal, and a phase of a leading edge of each channel signal.
4. The method of claim 1, wherein the step 4 comprises:
and eliminating outliers obviously inconsistent with the prior information in the angle clustering result according to the prior information, and sequentially carrying out electromagnetic parameter sorting on the pulses in each angle stack, wherein the outliers comprise signal frequency, repetition period and pulse width.
5. The method of claim 1, wherein the step 5 comprises:
calculating a spectrum estimation angle measurement range by using an interferometer angle measurement result, and estimating an angle measurement unilateral range by using the spectrum And the angle measurement clustering threshold of the interferometerThe same, i.e. the spectral estimation goniometric range is reduced to: orientation
 In pitch
 。
。
6. The method of claim 1, wherein the step 6 comprises:
step 61, performing spectrum estimation angle measurement on the pulse meeting the sorting results of the angle and the electromagnetic parameters to obtain a received data vector;
step 62, calculating the covariance of the received data vector;
step 63, carrying out characteristic decomposition on the covariance to obtain a signal subspace and a noise subspace;
step 64, obtaining a target angle value according to the signal subspace, the noise subspace and a spatial spectrum function calculation formula of the MUSIC algorithm; then, outputting a sorting result and an angle measurement result; wherein, the angle measurement result is a target angle value.
7. The method of claim 6, wherein the received data vector is:

wherein the content of the first and second substances, in order to receive the vector of data,
 in order to be the vector of the signal,
 in order to be a vector of the noise,
 in the form of an array of flow pattern matrices,
 is a first
 The direction vector of each signal source is determined,
 in order to receive the number of antennas in the antenna array,
 ,
, is the speed of light;
the step 62 includes:
because the noise of each antenna element in the antenna array is not correlated and the noise is not correlated with the signal received by the antenna array, the data vector is received The covariance matrix of (a) is:

in the formula: as a vector of signals
 The covariance matrix of (a) is determined,
 ,
, is the variance of the gaussian noise and is,
 is an identity matrix.
8. The method of claim 7, wherein the step 63 comprises:
performing characteristic decomposition on the covariance matrix R to obtain A characteristic value of
 The characteristic values are sorted from big to small into
 The corresponding feature vector is
 Dividing the space U formed by the feature vector into signal subspaces
 And noise subspace
 Namely:

wherein the content of the first and second substances, ,
, ,
, 。
。
9. the method of claim 8, wherein step 64 comprises:
as can be seen from the subspace basic principle, the signal subspace is orthogonal to the noise subspace, and the signal subspace and the subspace spanned by the signal direction vectors are the same subspace, so there are: ;
;
the spatial spectrum function calculation formula of the MUSIC algorithm is as follows:

wherein the spectral function The angle corresponding to the maximum value is the target angle value
 N is the target number of the spectral estimation super-resolution, and N is not more than 7; spectral function
 The maximum value is the spectrum peak;
 is the direction vector of the signal source,
 and
and azimuth and pitch angles, respectively, for the ith signal.
Priority Applications (1)
| Application Number | Priority Date | Filing Date | Title |
|---|---|---|---|
| CN202210267165.XA CN114355280B (en) | 2022-03-18 | 2022-03-18 | Multi-sensor composite array antenna arraying and multi-information fusion sorting angle measuring method |
Applications Claiming Priority (1)
| Application Number | Priority Date | Filing Date | Title |
|---|---|---|---|
| CN202210267165.XA CN114355280B (en) | 2022-03-18 | 2022-03-18 | Multi-sensor composite array antenna arraying and multi-information fusion sorting angle measuring method |
Publications (2)
| Publication Number | Publication Date |
|---|---|
| CN114355280A CN114355280A (en) | 2022-04-15 |
| CN114355280B true CN114355280B (en) | 2022-05-17 |
Family
ID=81094479
Family Applications (1)
| Application Number | Title | Priority Date | Filing Date |
|---|---|---|---|
| CN202210267165.XA Active CN114355280B (en) | 2022-03-18 | 2022-03-18 | Multi-sensor composite array antenna arraying and multi-information fusion sorting angle measuring method |
Country Status (1)
| Country | Link |
|---|---|
| CN (1) | CN114355280B (en) |
Citations (10)
| Publication number | Priority date | Publication date | Assignee | Title |
|---|---|---|---|---|
| CN102419430A (en) * | 2011-08-17 | 2012-04-18 | 电子科技大学 | Parallel-baseline-based two-dimensional direction finding method of round array phase interferometer |
| CN104122527A (en) * | 2014-07-14 | 2014-10-29 | 中国人民解放军国防科学技术大学 | Circular array phase position interferometer broadband instantaneous direction finding method based on table lookup method |
| CN104239678A (en) * | 2014-07-01 | 2014-12-24 | 中国电子科技集团公司第三十六研究所 | Method and device for implementing direction finding and positioning of interferometer |
| WO2015177559A1 (en) * | 2014-05-23 | 2015-11-26 | Toshiba Research Europe Limited | Method for localising scattering elements in a 3d environment |
| CN106950527A (en) * | 2017-04-14 | 2017-07-14 | 中国电子科技集团公司第二十九研究所 | A kind of Pulse Signal Sorting method under multi-baseline interference instrument direction finding system |
| CN109116295A (en) * | 2018-08-31 | 2019-01-01 | 上海微小卫星工程中心 | The passive direction finding algorithm of baseline is chosen based on phased array |
| CN110007267A (en) * | 2019-01-29 | 2019-07-12 | 杭州电子科技大学 | A kind of uniform circular array interferometer direction finding ambiguity solution method based on mixed baseline |
| CN111693934A (en) * | 2020-06-19 | 2020-09-22 | 中国电子科技集团公司第二十九研究所 | Direction finding method and system based on digital interference system |
| CN111693935A (en) * | 2020-06-19 | 2020-09-22 | 中国电子科技集团公司第二十九研究所 | Radio frequency direction finding method and system |
| CN113203980A (en) * | 2021-04-20 | 2021-08-03 | 北京通广龙电子科技有限公司 | High-precision quick radio direction finding method and system |
Family Cites Families (1)
| Publication number | Priority date | Publication date | Assignee | Title |
|---|---|---|---|---|
| US9730029B2 (en) * | 2012-11-08 | 2017-08-08 | Duke University | Unsupervised indoor localization and heading directions estimation |
-
2022
- 2022-03-18 CN CN202210267165.XA patent/CN114355280B/en active Active
Patent Citations (10)
| Publication number | Priority date | Publication date | Assignee | Title |
|---|---|---|---|---|
| CN102419430A (en) * | 2011-08-17 | 2012-04-18 | 电子科技大学 | Parallel-baseline-based two-dimensional direction finding method of round array phase interferometer |
| WO2015177559A1 (en) * | 2014-05-23 | 2015-11-26 | Toshiba Research Europe Limited | Method for localising scattering elements in a 3d environment |
| CN104239678A (en) * | 2014-07-01 | 2014-12-24 | 中国电子科技集团公司第三十六研究所 | Method and device for implementing direction finding and positioning of interferometer |
| CN104122527A (en) * | 2014-07-14 | 2014-10-29 | 中国人民解放军国防科学技术大学 | Circular array phase position interferometer broadband instantaneous direction finding method based on table lookup method |
| CN106950527A (en) * | 2017-04-14 | 2017-07-14 | 中国电子科技集团公司第二十九研究所 | A kind of Pulse Signal Sorting method under multi-baseline interference instrument direction finding system |
| CN109116295A (en) * | 2018-08-31 | 2019-01-01 | 上海微小卫星工程中心 | The passive direction finding algorithm of baseline is chosen based on phased array |
| CN110007267A (en) * | 2019-01-29 | 2019-07-12 | 杭州电子科技大学 | A kind of uniform circular array interferometer direction finding ambiguity solution method based on mixed baseline |
| CN111693934A (en) * | 2020-06-19 | 2020-09-22 | 中国电子科技集团公司第二十九研究所 | Direction finding method and system based on digital interference system |
| CN111693935A (en) * | 2020-06-19 | 2020-09-22 | 中国电子科技集团公司第二十九研究所 | Radio frequency direction finding method and system |
| CN113203980A (en) * | 2021-04-20 | 2021-08-03 | 北京通广龙电子科技有限公司 | High-precision quick radio direction finding method and system |
Also Published As
| Publication number | Publication date |
|---|---|
| CN114355280A (en) | 2022-04-15 |
Similar Documents
| Publication | Publication Date | Title |
|---|---|---|
| Chandran | Advances in direction-of-arrival estimation | |
| CN108549059B (en) | Low-altitude target elevation angle estimation method under complex terrain condition | |
| EP1167995B1 (en) | Matrix monopulse ratio radar processor for two target azimuth and elevation angle determination | |
| CN106526530A (en) | Propagation operator-based 2-L type array two-dimensional DOA estimation algorithm | |
| CN111220954B (en) | Radar angle error correction method based on self-correcting amplitude normalization | |
| CN112068119B (en) | Identification method of passive radar seeker for radar and decoy interference | |
| CN112130111B (en) | Single-snapshot two-dimensional DOA estimation method in large-scale uniform cross array | |
| CN106249225B (en) | Sparse circle acoustic vector-sensor array column quaternary number ESPRIT method for parameter estimation | |
| CN109856605A (en) | A kind of while formation of the digital multiple beam quadratic fit curve is directed toward modification method | |
| CN106526531A (en) | Improved propagation operator two-dimensional DOA estimation algorithm based on three-dimensional antenna array | |
| Li et al. | Combining sum-difference and auxiliary beams for adaptive monopulse in jamming | |
| Sun et al. | Array geometry calibration for underwater compact arrays | |
| CN109633521A (en) | Face battle array estimating two-dimensional direction-of-arrival method based on subspace reconstruct | |
| CN114355280B (en) | Multi-sensor composite array antenna arraying and multi-information fusion sorting angle measuring method | |
| CN108490425A (en) | A kind of angle-measuring method of bistatic MIMO radar | |
| CN107202975A (en) | A kind of a burst of first attitude error rectification method of two-dimensional vector | |
| CN114325560A (en) | Super-resolution target direction finding method for beam scanning radar | |
| Wei et al. | An empirical exploration of a simple deghosting method for multistatic radars | |
| CN114460531A (en) | Uniform linear array MUSIC spatial spectrum estimation method | |
| Howell | d-MUSIC, a real time algorithm for estimating the DOA of coherent sources using a single array snapshot | |
| Springer et al. | Joint localization and calibration in partly and fully uncalibrated array sensor networks | |
| CN112986935B (en) | Multi-element array channel passive calibration method based on landform conformal arrangement | |
| CN112363106B (en) | Signal subspace direction of arrival detection method and system based on quantum particle swarm | |
| Sun et al. | Phase array amplitude and phase correction for HFSWR based on AIS information | |
| US11733367B1 (en) | Chromatic correlation interferometry direction finding |
Legal Events
| Date | Code | Title | Description |
|---|---|---|---|
| PB01 | Publication | ||
| PB01 | Publication | ||
| SE01 | Entry into force of request for substantive examination | ||
| SE01 | Entry into force of request for substantive examination | ||
| GR01 | Patent grant | ||
| GR01 | Patent grant |