CN110198552B - Method and device for calculating downlink throughput - Google Patents
Method and device for calculating downlink throughput Download PDFInfo
- Publication number
- CN110198552B CN110198552B CN201910357714.0A CN201910357714A CN110198552B CN 110198552 B CN110198552 B CN 110198552B CN 201910357714 A CN201910357714 A CN 201910357714A CN 110198552 B CN110198552 B CN 110198552B
- Authority
- CN
- China
- Prior art keywords
- sinr
- downlink throughput
- scene
- los
- distribution
- Prior art date
- Legal status (The legal status is an assumption and is not a legal conclusion. Google has not performed a legal analysis and makes no representation as to the accuracy of the status listed.)
- Active
Links
- 238000000034 method Methods 0.000 title claims abstract description 60
- 238000004891 communication Methods 0.000 claims abstract description 11
- 238000009826 distribution Methods 0.000 claims description 93
- 238000012545 processing Methods 0.000 claims description 32
- 238000005259 measurement Methods 0.000 claims description 26
- 230000008859 change Effects 0.000 claims description 18
- 230000001186 cumulative effect Effects 0.000 claims description 10
- 238000005315 distribution function Methods 0.000 claims description 10
- 238000004364 calculation method Methods 0.000 description 27
- 230000008569 process Effects 0.000 description 12
- 238000010586 diagram Methods 0.000 description 9
- 230000005540 biological transmission Effects 0.000 description 8
- 230000006870 function Effects 0.000 description 8
- 230000035515 penetration Effects 0.000 description 7
- 238000005516 engineering process Methods 0.000 description 6
- 238000004088 simulation Methods 0.000 description 6
- 239000006185 dispersion Substances 0.000 description 5
- 230000003068 static effect Effects 0.000 description 5
- 230000009286 beneficial effect Effects 0.000 description 4
- 238000010276 construction Methods 0.000 description 3
- 230000008878 coupling Effects 0.000 description 3
- 238000010168 coupling process Methods 0.000 description 3
- 238000005859 coupling reaction Methods 0.000 description 3
- 238000013461 design Methods 0.000 description 3
- 238000010295 mobile communication Methods 0.000 description 3
- 230000003287 optical effect Effects 0.000 description 3
- 230000003993 interaction Effects 0.000 description 2
- 230000033001 locomotion Effects 0.000 description 2
- 238000004422 calculation algorithm Methods 0.000 description 1
- 230000001413 cellular effect Effects 0.000 description 1
- 238000010835 comparative analysis Methods 0.000 description 1
- 238000004590 computer program Methods 0.000 description 1
- 125000004122 cyclic group Chemical group 0.000 description 1
- 238000013506 data mapping Methods 0.000 description 1
- 238000001514 detection method Methods 0.000 description 1
- 230000008676 import Effects 0.000 description 1
- 230000010354 integration Effects 0.000 description 1
- 238000012423 maintenance Methods 0.000 description 1
- 230000005855 radiation Effects 0.000 description 1
- 238000007493 shaping process Methods 0.000 description 1
- 239000007921 spray Substances 0.000 description 1
- 238000006467 substitution reaction Methods 0.000 description 1
- 230000009466 transformation Effects 0.000 description 1
- 239000002699 waste material Substances 0.000 description 1
Images


Classifications
-
- H—ELECTRICITY
- H04—ELECTRIC COMMUNICATION TECHNIQUE
- H04L—TRANSMISSION OF DIGITAL INFORMATION, e.g. TELEGRAPHIC COMMUNICATION
- H04L43/00—Arrangements for monitoring or testing data switching networks
- H04L43/08—Monitoring or testing based on specific metrics, e.g. QoS, energy consumption or environmental parameters
- H04L43/0876—Network utilisation, e.g. volume of load or congestion level
- H04L43/0888—Throughput
-
- H—ELECTRICITY
- H04—ELECTRIC COMMUNICATION TECHNIQUE
- H04W—WIRELESS COMMUNICATION NETWORKS
- H04W24/00—Supervisory, monitoring or testing arrangements
- H04W24/08—Testing, supervising or monitoring using real traffic
Landscapes
- Engineering & Computer Science (AREA)
- Computer Networks & Wireless Communication (AREA)
- Signal Processing (AREA)
- Environmental & Geological Engineering (AREA)
- Mobile Radio Communication Systems (AREA)
Abstract
Description
技术领域technical field
本发明涉及通信技术领域,尤其涉及一种下行吞吐量的计算方法和装置。The present invention relates to the field of communication technologies, and in particular, to a method and device for calculating downlink throughput.
背景技术Background technique
目前,第五代移动通信技术(英文全称:5th-Generation,简称:5G)作为首个中国主推的通信标准,目前标准已经基本冻结。从设备形态来看,5G新空口(英文全称:NewRadio,简称:NR)是结合大功率(200W)、大带宽(100MHz)和大规模天线技术形成的新型基站,如图1所示,NR具备多个子载波且可以进行波束赋形。5G不同于传统的蜂窝移动网络,大规模天线设备和设备的强大计算能力,可以极大的实现不同用户间的配对,如好点户和中点用户配对后,吞吐量为二者独立传输的1.2倍或更多。因此,小区的下行吞吐量已经无法简单的使用第四代移动通信技术(英文全称:the 4th Generation mobile communicationtechnology,简称:4G)里好点吞吐量、中点吞吐量、差点吞吐量来评估了。At present, the fifth-generation mobile communication technology (full name in English: 5th-Generation, abbreviation: 5G) is the first communication standard promoted by China, and the current standard has been basically frozen. From the perspective of equipment form, 5G new air interface (full name in English: NewRadio, abbreviation: NR) is a new type of base station formed by combining high power (200W), large bandwidth (100MHz) and large-scale antenna technology. As shown in Figure 1, NR has Multiple subcarriers and can be beamformed. 5G is different from traditional cellular mobile networks. Large-scale antenna equipment and the powerful computing power of the equipment can greatly realize the pairing between different users. For example, after a good point user and a midpoint user are paired, the throughput is transmitted independently by the two. 1.2 times or more. Therefore, the downlink throughput of a cell can no longer be simply evaluated by using the good throughput, midpoint throughput, and handicap throughput in the fourth generation mobile communication technology (full name in English: the 4th Generation mobile communication technology, abbreviation: 4G).
由上述可知,如何计算5G小区的下行吞吐量成为了一个亟待解决的问题。It can be seen from the above that how to calculate the downlink throughput of a 5G cell has become an urgent problem to be solved.
发明内容SUMMARY OF THE INVENTION
本发明的实施例提供一种下行吞吐量的计算方法和装置,解决了如何计算5G小区的下行吞吐量的问题。Embodiments of the present invention provide a method and apparatus for calculating downlink throughput, which solves the problem of how to calculate the downlink throughput of a 5G cell.
为达到上述目的,本发明的实施例采用如下技术方案:To achieve the above object, the embodiments of the present invention adopt the following technical solutions:
第一方面,本发明的实施例提供一种下行吞吐量的计算方法,包括:获取小区的场景地图以及小区的覆盖范围内至少一个测量点的第一下行吞吐量和SINR值;根据场景地图,确定SINR值在SINR区间出现的概率;根据第一下行吞吐量和SINR值,确定各个SINR区间的第二下行吞吐量;根据第二下行吞吐量、SINR值在SINR区间出现的概率和场景地图,确定小区的第三下行吞吐量。In a first aspect, an embodiment of the present invention provides a method for calculating downlink throughput, including: acquiring a scene map of a cell and a first downlink throughput and SINR value of at least one measurement point within the coverage of the cell; , determine the probability of the SINR value appearing in the SINR interval; according to the first downlink throughput and SINR value, determine the second downlink throughput of each SINR interval; according to the second downlink throughput, the SINR value appears in the SINR interval The probability and scenario map to determine the third downlink throughput of the cell.
由上述方案可知,本发明的实施例提供的下行吞吐量的计算方法,通过小区的覆盖范围内的至少一个测量点的第一下行吞吐量和SINR值,确定各个SINR区间的第二下行吞吐量,从而建立不同的SINR区间与第二下行吞吐量的对应关系;同时,根据该小区的场景地图,确定SINR值在SINR区间出现的概率,从而确定SINR值与SINR区间的对应关系;最后,根据第二下行吞吐量、SINR值在SINR区间出现的概率和场景地图,确定小区的第三下行吞吐量;因此,通过本发明的实施例提供的下行吞吐量的计算方法,可以计算出5G小区的下行吞吐量,解决了如何计算5G小区的下行吞吐量的问题。It can be seen from the above solution that the calculation method of downlink throughput provided by the embodiment of the present invention determines the second downlink throughput of each SINR interval by the first downlink throughput and SINR value of at least one measurement point within the coverage of the cell. Therefore, the corresponding relationship between different SINR intervals and the second downlink throughput is established; at the same time, according to the scene map of the cell, the probability that the SINR value appears in the SINR interval is determined, thereby determining the corresponding relationship between the SINR value and the SINR interval; finally, The third downlink throughput of the cell is determined according to the second downlink throughput, the probability that the SINR value appears in the SINR interval, and the scene map; therefore, through the calculation method of the downlink throughput provided by the embodiment of the present invention, the 5G cell can be calculated It solves the problem of how to calculate the downlink throughput of 5G cells.
第二方面、本发明的实施例提供一种下行吞吐量的计算装置,包括:获取单元,用于获取小区的场景地图以及小区的覆盖范围内至少一个测量点的第一下行吞吐量和SINR值;处理单元,用于根据获取单元获取的场景地图,确定SINR值在SINR区间出现的概率;处理单元,还用于根据获取单元获取的第一下行吞吐量和SINR值,确定各个SINR区间的第二下行吞吐量;处理单元,还用于根据第二下行吞吐量、SINR值在SINR区间出现的概率和获取单元获取的场景地图,确定小区的第三下行吞吐量。In a second aspect, an embodiment of the present invention provides an apparatus for calculating downlink throughput, including: an acquisition unit configured to acquire a scene map of a cell and a first downlink throughput and SINR of at least one measurement point within the coverage of the cell The processing unit is used to determine the probability that the SINR value appears in the SINR interval according to the scene map obtained by the acquisition unit; the processing unit is also used to determine each SINR interval according to the first downlink throughput and the SINR value acquired by the acquisition unit The processing unit is further configured to determine the third downlink throughput of the cell according to the second downlink throughput, the probability that the SINR value appears in the SINR interval, and the scene map acquired by the acquisition unit.
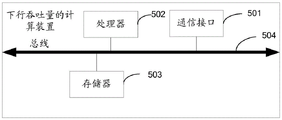
第三方面,本发明的实施例提供一种下行吞吐量的计算装置,包括:通信接口、处理器、存储器、总线;存储器用于存储计算机执行指令,处理器与存储器通过总线连接,当下行吞吐量的计算装置运行时,处理器执行存储器存储的计算机执行指令,以使下行吞吐量的计算装置执行如上述第一方面提供的方法。In a third aspect, embodiments of the present invention provide a computing device for downlink throughput, including: a communication interface, a processor, a memory, and a bus; the memory is used to store computer execution instructions, and the processor and the memory are connected through a bus. When the amount of computing devices is running, the processor executes the computer-executed instructions stored in the memory, so that the computing device of downlink throughput executes the method provided in the first aspect above.
第四方面,本发明的实施例提供一种计算机存储介质,包括指令,当其在计算机上运行时,使得计算机执行如上述第一方面提供的方法。In a fourth aspect, embodiments of the present invention provide a computer storage medium comprising instructions, which when executed on a computer, cause the computer to perform the method provided in the above-mentioned first aspect.
可以理解地,上述提供的任一种下行吞吐量的计算装置用于执行上文所提供的第一方面对应的方法,因此,其所能达到的有益效果可参考上文第一方面的方法以及下文具体实施方式中对应的方案的有益效果,此处不再赘述。It can be understood that any one of the above-provided downlink throughput computing devices is used to execute the method corresponding to the first aspect provided above. Therefore, for the beneficial effects that can be achieved, reference may be made to the above-mentioned method of the first aspect and The beneficial effects of the corresponding solutions in the following specific implementation manner will not be repeated here.
附图说明Description of drawings
为了更清楚地说明本发明实施例或现有技术中的技术方案,下面将对实施例或现有技术描述中所需要使用的附图作简单地介绍,显而易见地,下面描述中的附图仅仅是本发明的一些实施例,对于本领域普通技术人员来讲,在不付出创造性劳动的前提下,还可以根据这些附图获得其他的附图。In order to explain the embodiments of the present invention or the technical solutions in the prior art more clearly, the following briefly introduces the accompanying drawings that need to be used in the description of the embodiments or the prior art. Obviously, the accompanying drawings in the following description are only These are some embodiments of the present invention. For those of ordinary skill in the art, other drawings can also be obtained according to these drawings without creative efforts.
图1为现有技术中5G NR的内部结构示意图;1 is a schematic diagram of the internal structure of 5G NR in the prior art;
图2为本发明的实施例提供的一种下行吞吐量的计算方法的硬件系统架构图;2 is a hardware system architecture diagram of a method for calculating downlink throughput provided by an embodiment of the present invention;
图3为本发明的实施例提供的一种下行吞吐量的计算方法的硬件仿真部分设备部署图;FIG. 3 is a device deployment diagram of a hardware emulation part of a method for calculating downlink throughput provided by an embodiment of the present invention;
图4为本发明的实施例提供的一种下行吞吐量的计算方法的流程示意图之一;FIG. 4 is one of the schematic flowcharts of a method for calculating downlink throughput provided by an embodiment of the present invention;
图5为本发明的实施例提供的一种下行吞吐量的计算方法的流程示意图之二;FIG. 5 is a second schematic flowchart of a method for calculating downlink throughput provided by an embodiment of the present invention;
图6为本发明的实施例提供的一种下行吞吐量的计算方法的CDF曲线;6 is a CDF curve of a method for calculating downlink throughput provided by an embodiment of the present invention;
图7为本发明的实施例提供的一种下行吞吐量的计算方法的相关度的示意图之一;FIG. 7 is one of the schematic diagrams of the correlation of a method for calculating downlink throughput according to an embodiment of the present invention;
图8为本发明的实施例提供的一种下行吞吐量的计算方法的相关度的示意图之二;FIG. 8 is the second schematic diagram of the correlation of a method for calculating downlink throughput according to an embodiment of the present invention;
图9为本发明的实施例提供的一种下行吞吐量的计算方法的相关度0.3时SINR-吞吐量的示意图;9 is a schematic diagram of SINR-throughput when the correlation degree of a method for calculating downlink throughput according to an embodiment of the present invention is 0.3;
图10为本发明的实施例提供的一种下行吞吐量的计算方法的流程示意图之三;FIG. 10 is a third schematic flowchart of a method for calculating downlink throughput provided by an embodiment of the present invention;
图11为本发明的实施例提供的一种下行吞吐量的计算方法的流程示意图之四;FIG. 11 is a fourth schematic flowchart of a method for calculating downlink throughput according to an embodiment of the present invention;
图12为本发明的实施例提供的一种下行吞吐量的计算装置的结构示意图之一;FIG. 12 is one of the schematic structural diagrams of an apparatus for calculating downlink throughput according to an embodiment of the present invention;
图13为本发明的实施例提供的一种下行吞吐量的计算装置的结构示意图之二。FIG. 13 is a second schematic structural diagram of an apparatus for calculating downlink throughput according to an embodiment of the present invention.
附图标记:Reference number:
下行吞吐量的计算装置-10;Downlink throughput calculation device-10;
获取单元-101;处理单元-102。Acquisition Unit-101; Processing Unit-102.
具体实施方式Detailed ways
下面将结合本发明实施例中的附图,对本发明实施例中的技术方案进行清楚、完整地描述,显然,所描述的实施例仅仅是本发明一部分实施例,而不是全部的实施例。基于本发明中的实施例,本领域普通技术人员在没有做出创造性劳动前提下所获得的所有其他实施例,都属于本发明保护的范围。The technical solutions in the embodiments of the present invention will be clearly and completely described below with reference to the accompanying drawings in the embodiments of the present invention. Obviously, the described embodiments are only a part of the embodiments of the present invention, but not all of the embodiments. Based on the embodiments of the present invention, all other embodiments obtained by those of ordinary skill in the art without creative efforts shall fall within the protection scope of the present invention.
为了便于清楚描述本发明实施例的技术方案,在本发明的实施例中,采用了“第一”、“第二”等字样对功能和作用基本相同的相同项或相似项进行区分,本领域技术人员可以理解“第一”、“第二”等字样并不是在对数量和执行次序进行限定。In order to clearly describe the technical solutions of the embodiments of the present invention, in the embodiments of the present invention, words such as "first" and "second" are used to distinguish the same items or similar items with basically the same functions and functions. Those skilled in the art can understand that words such as "first" and "second" are not intended to limit the quantity and execution order.
在本发明实施例中,“示例性的”或者“例如”等词用于表示作例子、例证或说明。本发明实施例中被描述为“示例性的”或者“例如”的任何实施例或设计方案不应被解释为比其它实施例或设计方案更优选或更具优势。确切而言,使用“示例性的”或者“例如”等词旨在以具体方式呈现相关概念。In the embodiments of the present invention, words such as "exemplary" or "for example" are used to mean serving as an example, illustration or illustration. Any embodiments or designs described as "exemplary" or "such as" in the embodiments of the present invention should not be construed as preferred or advantageous over other embodiments or designs. Rather, the use of words such as "exemplary" or "such as" is intended to present the related concepts in a specific manner.
在本发明实施例的描述中,除非另有说明,“多个”的含义是指两个或两个以上。例如,多个网络是指两个或两个以上的网络。In the description of the embodiments of the present invention, unless otherwise specified, the meaning of "plurality" refers to two or more. For example, multiple networks refers to two or more networks.
本文中术语“和/或”,仅仅是一种描述关联对象的关联关系,表示可以存在三种关系,例如,A和/或B,可以表示:单独存在A,同时存在A和B,单独存在B这三种情况。本文中符号“/”表示关联对象是或者的关系,例如A/B表示A或者B。The term "and/or" in this article is only an association relationship to describe the associated objects, indicating that there can be three kinds of relationships, for example, A and/or B, it can mean that A exists alone, A and B exist at the same time, and A and B exist independently B these three cases. The symbol "/" in this document indicates the relationship in which the associated object is or, for example, A/B indicates A or B.
本发明的实施例提供的上行吞吐量的计算方法适用于具备如图1所示的基站和用户设备(英文全称:User Equipment,简称:UE);其中,基站在发送(transport,TX)信息时,通过k个传输链路传输数据;第k条传输链路在传输信息时,包括:首先,根据承载在子基带(subband)k的符号(symbol)(这里符号是指基站需要传输的信息),然后按照载波间隔(subcarrier spacing)k进对该符号进行快速傅里叶逆变换(Inverse Fast FourierTransform,IFFT)后得到信号k,进一步对信号k添加(add)循环冗余码(cyclic prefix,CP)k后,通过波束赋型滤波器(spectrum shaping filter)对添加了CPk的信号k进行信号处理,从而得到第k条传输链路进行波束成型后的信号k;最后,将每条传输链路进行波束成型后的信号k进行波束整合,并通过天线将该波束整合后的信号发送至信号接收端,从而实现信息的传输。The method for calculating the uplink throughput provided by the embodiment of the present invention is applicable to a base station and user equipment (full name in English: User Equipment, abbreviation: UE) as shown in FIG. 1 ; wherein, when the base station transmits (transport, TX) information , transmit data through k transmission links; when the kth transmission link transmits information, including: first, according to the symbol (symbol) carried in the sub-baseband (subband) k (the symbol here refers to the information that the base station needs to transmit) , and then perform an Inverse Fast Fourier Transform (IFFT) on the symbol according to the subcarrier spacing k to obtain a signal k, and further add a cyclic prefix (CP) to the signal k ) After k , the signal k added with CP k is processed by the beamforming filter, so as to obtain the signal k after beamforming of the kth transmission link; The signal k after beamforming is performed on the channel for beam integration, and the beam-integrated signal is sent to the signal receiving end through the antenna, so as to realize the transmission of information.
UE通过天线接收(receive,RX)从基站发送的承载在子基带k的符号时,首先通过赋型滤波器对该符号进行信号处理得到处理后的信号,然后去除该信号的CP,然后对去除了CP的信号按照载波间隔k进行快速傅氏变换(Fast Fourier Transformation,FFT),然后对进行了FFT信号处理的信号的子基带i进行正交频分复用(Orthogonal FrequencyDivision Multiplexing,OFDM)检测,从而将天线接收基站发送的承载在子基带k的符号转换成UE可识别的信号。When the UE receives (receive, RX) the symbol carried by the sub-baseband k sent from the base station through the antenna, it first performs signal processing on the symbol through the shaping filter to obtain a processed signal, then removes the CP of the signal, and then removes the The signal with CP is subjected to Fast Fourier Transformation (FFT) according to the carrier interval k, and then the sub-baseband i of the signal processed by FFT is subjected to Orthogonal Frequency Division Multiplexing (OFDM) detection, Thus, the symbols carried in the sub-baseband k sent by the antenna receiving base station are converted into signals identifiable by the UE.
图2示出了一种下行吞吐量的计算方法的系统架构,包括:获取单元和处理单元;其中,获取单元需要分别获取信号与干扰加噪声比(英文全称:Signal to Interferenceplus Noise Ratio,简称:SINR)分布数据以及用户设备(英文全称:User Equipment,简称:UE)的下行吞吐量数据,处理单元用于根据获取单元获取的SINR分布数据和UE的下行吞吐量数据计算小区的平均下行吞吐量;其中,获取单元获取UE的下行吞吐量数据时通过UE、NR和信道仿真仪或者移相器和衰减器进行射频直连,形成无信道环境影响的多用户差异化分布场景;如图3所示4个UE接入仿真系统时的硬件仿真图,包括:UE-1、信道仿真仪-2和基站3;其中,信道仿真仪具备移相器和可编程衰减器的功能;通过规定UE的SINR位置和UE间的相关度获取多种现网中可能的场景,使得UE-1通过信道仿真仪-2和基站-3建立数据通信链路,进行用户数据报协议(英文全称:User Datagram Protocol,简称:UDP)下载业务,获得单个UE的下行吞吐量(T′N和T′D),并最终计算出多个用户的差异化分布的下行吞吐量(TN和TD)。FIG. 2 shows a system architecture of a method for calculating downlink throughput, including: an acquisition unit and a processing unit; wherein, the acquisition unit needs to acquire the signal to interference plus noise ratio (English full name: Signal to Interference plus Noise Ratio, abbreviated as: SINR) distribution data and downlink throughput data of user equipment (English full name: User Equipment, referred to as: UE), the processing unit is used to calculate the average downlink throughput of the cell according to the SINR distribution data obtained by the acquisition unit and the downlink throughput data of the UE ; wherein, when the acquisition unit acquires the downlink throughput data of the UE, the radio frequency is directly connected through the UE, the NR and the channel emulator or the phase shifter and the attenuator, forming a multi-user differentiated distribution scenario without the influence of the channel environment; as shown in Figure 3 The hardware emulation diagram when 4 UEs access the emulation system, including: UE-1, channel emulator-2 and
获取单元获取SINR分布数据时,通过软件仿真,完成SINR采集和信道影响处理2个部分。SINR采集部分主要是完成小区级用户的SINR分布的情况统计,可以分为仿真、网络模拟多用户接入或者测量报告(英文全称:Measurement Report,简称:MR)数据映射等方法。本文后续主要考虑使用仿真进行对比分析。在实际应用中多用户接入更加趋近真实用户分布,但是存在需要终端数量太多难以控制等问题。在进行仿真时,信道影响主要考虑实际环境中包含多种情况的信道场景,在规定了路损等大尺度影响后,还要考虑小尺度影响。小尺度模型一般可以分为非视距(英文全称:Non-Line of Sight,简称:NLOS)或者视距(英文全称:Line of Sight,简称:LOS)。本实体部分主要完成LOS和NLOS与无信道影响下SINR的差异,获取信道影响下的SINR CDF分布
目前5G商业部署需要使用小区平均容量来规划网络传输模块,由于不同场景需要的下行容量不同,在4G阶段最高容量为100Mbps,实测极限容量为40Mbps,因此使用50%左右的极限容量来衡量小区的下行吞吐量;而5G阶段最高容量为5Gbps,但实测极限容量为600-700Mbps;由于4G阶段和5G阶段的极限容量与最高容量存在较大的差异,如果继续使用50%左右的极限容量来衡量小区的下行吞吐量,会造成低流量地区传输资源浪费或者高流量区域传输资源不足;为了解决上述问题,本发明的实施例提供的下行吞吐量的计算方法,根据场景地图以及小区的覆盖范围内至少一个测量点的第一下行吞吐量和SINR值,计算出小区的下行吞吐量,从而满足不同小区的下行吞吐量的计算,可以实现基站级别的传输需求估计,为网络建设提供合理依据,减少超额投资,具体的实现过程如下:At present, 5G commercial deployment needs to use the average capacity of the cell to plan the network transmission module. Since the downlink capacity required in different scenarios is different, the maximum capacity in the 4G stage is 100Mbps, and the measured limit capacity is 40Mbps. Therefore, the limit capacity of about 50% is used to measure the cell's capacity. Downlink throughput; while the maximum capacity in the 5G stage is 5Gbps, but the measured limit capacity is 600-700Mbps; due to the large difference between the limit capacity and the maximum capacity in the 4G stage and the 5G stage, if you continue to use about 50% of the limit capacity to measure The downlink throughput of the cell will cause waste of transmission resources in low-traffic areas or insufficient transmission resources in high-traffic areas; in order to solve the above problems, the calculation method of downlink throughput provided by the embodiments of the present invention is based on the scene map and the coverage of the cell. The first downlink throughput and SINR value of at least one measurement point are used to calculate the downlink throughput of the cell, so as to satisfy the calculation of the downlink throughput of different cells, realize the estimation of the transmission demand at the base station level, and provide a reasonable basis for network construction. To reduce excess investment, the specific implementation process is as follows:
需要说明的是,本发明实施例提供的下行吞吐量的计算方法适用于拟建基站的网络规划适用场景;示例性的,以新建5G基站为例进行说明,由于5G中存在多天线技术(英文全称:Multi-User Multiple-Input Multiple-Output,简称:MU-MIMO)的工作模式,因此吞吐量受到信道相关性和信道条件的影响较大,无法使用仅基于SINR值的方式计算吞吐量。因此本发明的实施例考虑了用户的可能的SINR分布情况和不同的信道相关性,给出适用于5G小区的下行吞吐量的计算方法。It should be noted that the calculation method of downlink throughput provided by the embodiment of the present invention is applicable to the network planning application scenario of the proposed base station; exemplarily, a new 5G base station is used as an example to illustrate, because there is a multi-antenna technology (English) in 5G. Full name: Multi-User Multiple-Input Multiple-Output, abbreviation: MU-MIMO) working mode, so the throughput is greatly affected by channel correlation and channel conditions, and the throughput cannot be calculated based on the SINR value only. Therefore, in the embodiments of the present invention, the possible SINR distribution of users and different channel correlations are considered, and a calculation method of downlink throughput suitable for 5G cells is given.
实施例一Example 1
本发明的实施例提供一种下行吞吐量的计算方法,如图4所示包括:An embodiment of the present invention provides a method for calculating downlink throughput, as shown in FIG. 4 , including:
S101、获取小区的场景地图以及小区的覆盖范围内至少一个测量点的第一下行吞吐量和SINR值。S101. Acquire a scene map of a cell and a first downlink throughput and SINR value of at least one measurement point within the coverage of the cell.
S102、根据场景地图,确定SINR值在SINR区间出现的概率。S102. Determine the probability that the SINR value appears in the SINR interval according to the scene map.
可选的,如图5所示,场景地图包括三维(英文全称:3Dimensions,简称:3D)地图或者规划图;根据场景地图,确定SINR值在SINR区间出现的概率,包括:Optionally, as shown in FIG. 5 , the scene map includes a three-dimensional (English full name: 3Dimensions, abbreviation: 3D) map or planning map; according to the scene map, determine the probability of the SINR value appearing in the SINR interval, including:
S1020、获取小区的天线与测量点的传播方式;其中,传播方式包括NLOS和LOS。S1020. Acquire a propagation mode of an antenna of a cell and a measurement point, wherein the propagation mode includes NLOS and LOS.
S1021、根据3D地图或者规划图,确定SINR值的累积分布函数(英文全称:Cumulative Distribution Function,简称:CDF)。S1021. Determine a cumulative distribution function (full English name: Cumulative Distribution Function, abbreviation: CDF) of the SINR value according to the 3D map or the planning map.
需要说明的是,在实际的应用中,根据3D地图或者规划图,确定SINR值的累积分布函数包括:It should be noted that, in practical applications, according to the 3D map or planning map, the cumulative distribution function for determining the SINR value includes:
1、场景重现法1. Scene reproduction method
可以获取指定精度的3D地图(如精度为2米×2米的3D地图),将3D地图导入仿真软件(如Atoll)后,配置基站参数,并进行用户撒点仿真,然后计算SINR值的CDF曲线,如图6所示:You can obtain a 3D map with a specified accuracy (such as a 3D map with an accuracy of 2 meters × 2 meters), import the 3D map into a simulation software (such as Atoll), configure the parameters of the base station, and perform a user-spray simulation, and then calculate the CDF of the SINR value curve, as shown in Figure 6:
F(SINR)=a×SINR3+b×SINR2+c×SINR+d;F(SINR)=a×SINR 3 +b×SINR 2 +c×SINR+d;
其中,a,b,c,d均为常数,F(SINR)为用户在该SINR值出现的概率。Among them, a, b, c, d are all constants, and F(SINR) is the probability that the user appears at the SINR value.
2、场景假设法2. Scenario Hypothesis Method
该方法适用于没有进行基站建设的场景,在只知道楼宇和其他的一些建筑物信息的情况下,则需要计算不同类型穿透损耗的占比情况,具体的如表1所示:This method is suitable for scenarios without base station construction. In the case of only knowing the information of buildings and other buildings, it is necessary to calculate the proportion of different types of penetration losses, as shown in Table 1:
表1Table 1
然后,基于穿透损耗占比和该小区的基站参数,使用系统仿真软件(如matlab等)进行仿真,并进行用户撒点仿真,然后计算SIRN的CDF曲线,如图6所示(横坐标为SINR值,纵坐标为F(5G_SINR)):Then, based on the penetration loss ratio and the base station parameters of the cell, use system simulation software (such as matlab, etc.) to simulate, and perform user simulation, and then calculate the CDF curve of the SIRN, as shown in Figure 6 (the abscissa is SINR value, the ordinate is F(5G_SINR)):
F(SINR)=a×SINR3+b×SINR2+c×SINR+d;F(SINR)=a×SINR 3 +b×SINR 2 +c×SINR+d;
其中,a,b,c,d分别为常数,F(SINR)为用户在该SINR值出现的概率。Among them, a, b, c, d are constants respectively, and F(SINR) is the probability that the user appears at the SINR value.
其中,穿透损耗占比由38.901标准中定义的不同穿损模型进行场景构建确定的,基站参数包括:仿真场景、站间距(英文全称:Inter-Site Distance,简称:ISD)、站点数量(周围基站的总个数)、基站天线高度、信道模型、子载波间隔、业务模型、每扇区用户数量、用户分布、室内外用户分布(不同穿透损耗占比)、用户移动性、频段、系统带宽、物理资源块(英文全称:Physical Resource Block,简称:PRB)数、帧结构、演进型基站(英文全称:Evolved Node B,简称:eNB)发射功率、天线阵子数、天线阵子辐射模型、收发单元数、基站噪声系数、天线下倾角、UE天线高度、基站与用户最小距离、UE接收天线数量、UE噪声系数、UE发射天线数量、UE发射功率、下行单用户多进多出天线系统(英文全称:DownlinkSingle-user-Multiple-Input Multiple-Output,简称:DL SU-MIMO)最大流数、下行多用户多进多出天线系统(英文全称:Downlink Multi-user-Multiple-Input Multiple-Output,简称:DL MU-MIMO)最大流数、上行单用户多进多出天线系统(英文全称:UplinkSingle-user-Multiple-Input Multiple-Output,简称:UL SU-MIMO)最大流数、上行多用户多进多出天线系统(英文全称:Uplink Multi--user-Multiple-Input Multiple-Output,简称:UL MU-MIMO)最大流数、调度、传播模型和切换余量中的一项或多项。Among them, the penetration loss ratio is determined by the scene construction of different penetration loss models defined in the 38.901 standard. Total number of base stations), base station antenna height, channel model, subcarrier spacing, service model, number of users per sector, user distribution, indoor and outdoor user distribution (different penetration loss ratios), user mobility, frequency band, system Bandwidth, number of physical resource blocks (English full name: Physical Resource Block, abbreviation: PRB), frame structure, Evolved Node B (English full name: Evolved Node B, abbreviation: eNB) transmit power, number of antenna elements, antenna element radiation model, transceiver Number of units, base station noise figure, antenna downtilt angle, UE antenna height, minimum distance between base station and user, number of UE receive antennas, UE noise figure, number of UE transmit antennas, UE transmit power, downlink single-user multiple-input multiple-output antenna system (English) Full name: DownlinkSingle-user-Multiple-Input Multiple-Output, referred to as: DL SU-MIMO) maximum number of streams, downlink multi-user multi-input and multi-output antenna system (English full name: Downlink Multi-user-Multiple-Input Multiple-Output, referred to as : DL MU-MIMO) maximum number of streams, uplink single-user multiple-input multiple-output antenna system (full English name: UplinkSingle-user-Multiple-Input Multiple-Output, abbreviation: UL SU-MIMO) maximum number of streams, uplink multi-user multiple-input One or more of the maximum number of streams, scheduling, propagation model and handover margin of the multiple antenna system (full English name: Uplink Multi--user-Multiple-Input Multiple-Output, abbreviated as: UL MU-MIMO).
S1022、根据累积分布函数和传播方式,确定不同传播方式下SINR值在SINR区间出现的概率。S1022 , according to the cumulative distribution function and the propagation mode, determine the probability that the SINR value appears in the SINR interval under different propagation modes.
需要说明的是,在实际的应用中,信道对5G MU—MIMO场景的影响尤为重要;而不同的传播方式,会影响信道对5G MU—MIMO场景的影响;而UE与基站建立信道时对应的传播方式分为NLOS和LOS,需要计算传播方式为NLOS(简称NLOS径)时SINR值在SINR区间出现的概率,以及传播方式为LOS(简称LOS径)时SINR值在SINR区间出现的概率,具体的计算方式如下:It should be noted that in practical applications, the impact of the channel on the 5G MU-MIMO scenario is particularly important; and different propagation methods will affect the impact of the channel on the 5G MU-MIMO scenario; The propagation mode is divided into NLOS and LOS. It is necessary to calculate the probability of the SINR value appearing in the SINR interval when the propagation mode is NLOS (abbreviated as NLOS path), and the probability of the SINR value appearing in the SINR interval when the propagation mode is LOS (abbreviated as LOS path). is calculated as follows:
为了更好的模拟用户的实际分布,使得得到的NLOS径下的总下行吞吐量TNLOS以及LOS径下的总下行吞吐量TLOS更加的准确;因此,需要收集同SINR位置处的吞吐量数据以及不同SINR位置处的吞吐量数据。In order to better simulate the actual distribution of users, the obtained total downlink throughput T NLOS under the NLOS path and the total downlink throughput T LOS under the LOS path are more accurate; therefore, it is necessary to collect throughput data at the same SINR location. and throughput data at different SINR locations.
其中,同SINR位置处的吞吐量数据的收集过程如下:Among them, the collection process of throughput data at the same SINR location is as follows:
选取典型SINR值,如选取SINR值为22、SINR值为18、SINR值为9、SINR值为6、SINR值为0以及SINR值为-2这6个点(涵盖极好点、好点、中点、差点);UE的分布模式为放置4个以上(含4个)UE在上述相同的SINR值位置上,保证可以实现极限容量。这里选择放置4个UE的原因是由于一个UE最多支持4路下行链路,而每个基站同时支持16路下行链路,因此放置4个UE时就可以模拟出该基站满载时的下行吞吐量;当然,在实际的应用中,当基站支持的最大下行链路次数为N时,而UE支持最大下行链路次数为n时,此时该基站满载时支持的UE数量为
示例性的,以相关度为0.3\0.5\0.8,SINR值为22、SINR值为18、SINR值为9、SINR值为6、SINR值为0以及SINR值为-2,不同UE位置处测量的下行吞吐量为例进行说明(其中,需要记录的数据如表2所示)。Exemplarily, with a correlation of 0.3\0.5\0.8, SINR value of 22, SINR value of 18, SINR value of 9, SINR value of 6, SINR value of 0, and SINR value of -2, measurement at different UE locations The downlink throughput of .
其中,图7中点o为小区对应的基站的天线,点a为UE-a、点b为UE-b、点c为UE-c和点d为UE-d;其中,点a、点b和点c分别位于同一同心圆o的边界上,位于同一同心圆上的各个UE的SINR值相同;具体的,各个UE之间的相关度可以根据实际要求的相关度进行放置;示例性的,以UE-a和UE-b之间的相关度为例进行说明,其他各个UE之间的相关度的计算方式与UE-a和UE-b之间的相关度的计算方式相同,此处不再赘述。Among them, point o in Figure 7 is the antenna of the base station corresponding to the cell, point a is UE-a, point b is UE-b, point c is UE-c, and point d is UE-d; among them, point a and point b and point c are respectively located on the boundary of the same concentric circle o, and the SINR values of each UE located on the same concentric circle are the same; specifically, the correlation between each UE can be placed according to the actual required correlation; exemplarily, Taking the correlation between UE-a and UE-b as an example, the calculation method of the correlation between other UEs is the same as the calculation method of the correlation between UE-a and UE-b. Repeat.
其中,相关度等于为任意两个UE分别与基站天线的连线形成的夹角;如:水平方向上点a与圆心o(表示基站天线所在的位置)的连线和水平方向上点b与圆心o的连线形成的夹角θ;或者,水平方向上点d与圆心o(表示基站天线所在的位置)的连线和水平方向上点b与圆心o的连线形成的夹角θ;或者,如图8所示垂直方向上点a与圆心o的连线和水平方向上点b与圆心o的连线形成的夹角θ。Among them, the degree of correlation is equal to the angle formed by the connection between any two UEs and the base station antenna respectively; for example: the connection between point a in the horizontal direction and the center o (representing the location of the base station antenna) and point b in the horizontal direction and The included angle θ formed by the connection line of the circle center o; or, the included angle θ formed by the connection line between the point d in the horizontal direction and the circle center o (representing the location of the base station antenna) and the connection line between the point b and the circle center o in the horizontal direction; Or, as shown in FIG. 8 , the included angle θ formed by the line connecting the point a and the center o in the vertical direction and the line connecting the point b and the center o in the horizontal direction.
具体的,模式1、模式2、模式3、模式4、模式5和模式6均表示将4个UE同时放置于相同SINR值对应的位置上。Specifically,
表2Table 2


通过测量每个相关度下,每个典型SINR值(包括:SINR值为22、SINR值为18、SINR值为9、SINR值为6、SINR值为0以及SINR值为-2)对应的下行吞吐量,拟合出同一相关度下的SINR-平均下行吞吐量曲线,如图9所示(横坐标为SINR值,纵坐标为平均下行吞吐量),给出了相关度为0.3时SINR值的平均下行吞吐量曲线;其中,每个点的平均下行吞吐量等于同一SINR值下每个UE的下行吞吐量的平均值。By measuring the downlink corresponding to each typical SINR value (including: SINR value of 22, SINR value of 18, SINR value of 9, SINR value of 6, SINR value of 0, and SINR value of -2) under each correlation degree Throughput, fit the SINR-average downlink throughput curve under the same correlation, as shown in Figure 9 (the abscissa is the SINR value, the ordinate is the average downlink throughput), and the SINR value when the correlation is 0.3 is given The average downlink throughput curve of ; wherein, the average downlink throughput of each point is equal to the average downlink throughput of each UE under the same SINR value.
最终获取相关度分别为0.3、0.5以及0.8的SINR-平均下行吞吐量曲线,如下面公式所示:Finally, the SINR-average downlink throughput curves with correlations of 0.3, 0.5 and 0.8 are obtained, as shown in the following formula:
T0.3SINR(SINR)=f1(SINR);T 0.3SINR (SINR)=f 1 (SINR);
T0.5SINR(SINR)=f2(SINR);T 0.5SINR (SINR)=f 2 (SINR);
T0.8SINR(SINR)=f3(SINR)。T 0.8SINR (SINR)=f 3 (SINR).
基于单个相关度的公式,计算出单一SINR下的平均下行吞吐量:Based on the formula of a single correlation, calculate the average downlink throughput under a single SINR:

示例性的,以SINR值为22、SINR值为18、SINR值为9、SINR值为6、SINR值为0以及SINR值为-2,相关度为0.3、0.5和0.8为例进行说明:Exemplarily, the SINR value is 22, the SINR value is 18, the SINR value is 9, the SINR value is 6, the SINR value is 0, the SINR value is -2, and the correlations are 0.3, 0.5, and 0.8 as examples to illustrate:
SINR值为22的平均下行吞吐量
SINR值为18、SINR值为9、SINR值为6、SINR值为0或者及SINR值为-2的平均下行吞吐量的计算方式与SINR值为22的平均下行吞吐量的计算方式相同,此处不再赘述。The average downlink throughput with an SINR value of 18, an SINR value of 9, an SINR value of 6, an SINR value of 0, or an SINR value of -2 is calculated in the same way as the average downlink throughput with an SINR value of 22. It is not repeated here.
针对不同的SINR-平均下行吞吐量取值,计算出一定SINR区间内的吞吐量:For different SINR-average downlink throughput values, calculate the throughput within a certain SINR range:

示例性的,如表3所示以SINR区间分别为[-2.5,2.5]、[2.5,7.5]、[7.5,12.5]、[12.5,17.5]和[17.5,22.5]为例进行说明,其中SINR区间为[-2.5,2.5]时分别选取SINR值为-2、-1、0、1和2的点作为典型点,此时N_gap等于5;SINR区间为[2.5,7.5]时分别选取SINR值为3、4、5、6和7的点作为典型点,此时N_gap等于5;SINR区间为[7.5,12.5]时分别选取SINR值为8、9、10、11和12的点作为典型点,此时N_gap等于5;SINR区间为[12.5,17.5]时分别选取SINR值为13、14、15、15和16的点作为典型点,此时N_gap等于5;SINR区间为[17.5,22.5]时分别选取SINR值为18、19、20、21和22的点作为典型点,此时N_gap等于5。Exemplarily, as shown in Table 3, the SINR intervals are [-2.5, 2.5], [2.5, 7.5], [7.5, 12.5], [12.5, 17.5] and [17.5, 22.5] as examples for illustration, where When the SINR interval is [-2.5, 2.5], the points with SINR values of -2, -1, 0, 1, and 2 are selected as typical points, and N_gap is equal to 5; when the SINR interval is [2.5, 7.5], the SINR values are selected respectively. Points with values of 3, 4, 5, 6 and 7 are used as typical points, at this time N_gap is equal to 5; when the SINR interval is [7.5, 12.5], points with SINR values of 8, 9, 10, 11 and 12 are selected as typical points respectively At this time, N_gap is equal to 5; when the SINR interval is [12.5, 17.5], the points with SINR values of 13, 14, 15, 15 and 16 are selected as typical points, at this time, N_gap is equal to 5; the SINR interval is [17.5, 22.5 ], select points with SINR values of 18, 19, 20, 21, and 22 as typical points, and N_gap is equal to 5.
表3table 3


根据表3中记录的数据,可以分别计算出在同SINR位置处的不同区间的平均下行吞吐量;其中,TSINR(X)为SINR值为X时每个UE的下行吞吐量的平均值。According to the data recorded in Table 3, the average downlink throughput of different intervals at the same SINR position can be calculated respectively; wherein, T SINR (X) is the average value of the downlink throughput of each UE when the SINR value is X.
其中,不同SINR位置处的吞吐量数据的收集过程如下:Among them, the collection process of throughput data at different SINR positions is as follows:
选取5种典型不同SINR值分布情况,将4个以上(含4个)UE按照表4中的分布模式放置在相同的SINR值的位置上,从而保证实现基站极限容量。Five typical distributions of different SINR values are selected, and more than 4 (including 4) UEs are placed in the same SINR value position according to the distribution pattern in Table 4, thereby ensuring the realization of the base station limit capacity.
表4Table 4


将UE按照选定的相关度、典型SINR值按照如表4所示的分布模式放置UE,并收集每个UE的下行吞吐量;示例性的,以相关度为0.3、0.5和0.8为例进行说明,记录不同情况下的全部UE的总下行吞吐量,如表5所示。Place the UE according to the selected correlation degree and typical SINR value according to the distribution pattern shown in Table 4, and collect the downlink throughput of each UE; Note, record the total downlink throughput of all UEs in different situations, as shown in Table 5.
表5table 5

根据表5中记录的数据,可以分别计算出在不同SINR位置处不同分布模式对应的平均下行吞吐量;其中,TD(TMx)为模式X下,好点处每个UE的下行吞吐量的平均值和中点处每个UE的下行吞吐量的平均值和差点处每个UE的下行吞吐量的平均值之和。According to the data recorded in Table 5, the average downlink throughput corresponding to different distribution modes at different SINR positions can be calculated respectively; wherein, TD(TM x ) is the downlink throughput of each UE at the good point under mode X The average and the sum of the average downlink throughput of each UE at the midpoint and the average downlink throughput of each UE at the handicap.
基于上面计算得到的相同SINR位置处的吞吐量数据和不同SINR位置处的吞吐量数据,分别计算NLOS径对应的SINR值在SINR区间出现的概率以及LOS径对应的SINR值在SINR区间出现的概率,具体的实现过程如下:Based on the throughput data at the same SINR position and the throughput data at different SINR positions calculated above, calculate the probability of the SINR value corresponding to the NLOS path appearing in the SINR interval and the probability of the SINR value corresponding to the LOS path appearing in the SINR interval, respectively. , the specific implementation process is as follows:
1、根据无信道影响的典型SINR值的CDF比例,计算以典型值为中心值的特定区间内概率,使用P(SINR)表示;其中,P(SINR)=F(SINR_UP)-F(SINR_DOWN),SINR_UP为SINR值的取值上限、SINR_DOWN为SINR值的取值下限,F(SINR)为:1. According to the CDF ratio of the typical SINR value without channel influence, calculate the probability in a specific interval with the typical value as the central value, and use P(SINR) to express; where, P(SINR)=F(SINR_UP)-F(SINR_DOWN) , SINR_UP is the upper limit of the SINR value, SINR_DOWN is the lower limit of the SINR value, and F(SINR) is:
F(SINR)=a×SINR3+b×SINR2+c×SINR+d。F(SINR)=a× SINR3 +b×SINR2+c×SINR + d.
示例性的,以SINR区间分别为[-2.5,2.5]、[2.5,7.5]、[7.5,12.5]、[12.5,17.5]和[17.5,22.5]为例进行说明,每个SINR区间的概率如表6所示。Exemplarily, taking the SINR intervals [-2.5, 2.5], [2.5, 7.5], [7.5, 12.5], [12.5, 17.5] and [17.5, 22.5] as an example, the probability of each SINR interval is As shown in Table 6.
表6Table 6
2、在5G MU—MIMO场景下,信道的影响尤为重要。因此计算NLOS径、LOS径与无路损的下SINR值的差别,计算过程如下:2. In the 5G MU-MIMO scenario, the influence of the channel is particularly important. Therefore, to calculate the difference between the NLOS path, the LOS path and the SINR value without path loss, the calculation process is as follows:
建立NLOS下位置R与SINRNLOS的关系:Establish the relationship between position R under NLOS and SINR NLOS :

SINRNLOS=SINRui; SINRNLOS = SINRui ;
建立NLOS下位置R与SINRLOS的关系:Establish the relationship between position R and SINR LOS under NLOS:


SINRLOS=SINRui。SINR LOS =SINR ui .
相同位置下SINRNLOS与SINRLOS值的差值,在相同基站配置下:The difference between the SINR NLOS and SINR LOS values at the same location, under the same base station configuration:

需要说明的是,由于不同位置下的SINRNLOS与SINRLOS值的差值也是对应同一SINR位置下无路损和有路损的SINR差值,然后把全部覆盖范围内获得的SINR差值进行平均获取一个平均的差异值;因此,此处无需计算不同位置下SINRNLOS与SINRLOS值的差值。It should be noted that since the difference between the SINR NLOS and SINR LOS values at different locations is also the SINR difference between no path loss and path loss at the same SINR position, and then the SINR difference obtained in the entire coverage area is averaged. Obtain an average difference value; therefore, there is no need to calculate the difference between SINR NLOS and SINR LOS values for different locations here.
如下为密集城区为例,表7记录了:The following is an example of dense urban areas. Table 7 records:
表7Table 7

因此:therefore:
SINRLOS=SINR-2.9568; SINRLOS =SINR-2.9568;
SINRNLOS=SINR-11.9258; SINRNLOS =SINR-11.9258;
根据无信道影响的SINR的值CDF曲线、无路损情况下SINRNLOS与SINRLOS值的差值,计算出NLOS径时对应的SINR的值CDF曲线(FNLOS(SINRNLOS))和LOS径时对应的SINR值的CDF曲线(FLOS(SINRLOS))。According to the CDF curve of the SINR value without channel influence and the difference between the SINR NLOS and SINR LOS values under the condition of no path loss, the corresponding SINR value CDF curve (F NLOS (SINR NLOS )) and LOS path time are calculated. CDF curve of the corresponding SINR value (F LOS (SINR LOS )).
FLOS(SINRLOS)=a2×SINRLOS 3+b2×SINRLOS 2+c2×SINRLOS+e2;F LOS (SINR LOS )=a 2 ×SINR LOS 3 +b 2 ×SINR LOS 2 +c 2 ×SINR LOS +e 2 ;
FNLOS(SINRNLOS)=a3×SINRNLOS 3+b3×SINRNLOS 2+c3×SINRNLOS+e3。F NLOS (SINR NLOS )=a 3 ×SINR NLOS 3 +b 3 ×SINR NLOS 2 +c 3 ×SINR NLOS +e 3 .
示例性的,以LOS径和NLOS径时,对应的SINR区间分别为[-2.5,2.5]、[2.5,7.5]、[7.5,12.5]、[12.5,17.5]和[17.5,22.5]为例进行说明;其中,LOS径对应的SINR值在SINR区间出现的概率如表8所示,NLOS径对应的SINR值在SINR区间出现的概率如表9所示。Exemplarily, when the LOS path and the NLOS path are used, the corresponding SINR intervals are [-2.5, 2.5], [2.5, 7.5], [7.5, 12.5], [12.5, 17.5] and [17.5, 22.5] as an example Describe; among them, the probability of the SINR value corresponding to the LOS path appearing in the SINR interval is shown in Table 8, and the probability of the SINR value corresponding to the NLOS path appearing in the SINR interval is shown in Table 9.
表8Table 8
表9Table 9

S103、根据第一下行吞吐量和SINR值,确定各个SINR区间的第二下行吞吐量。S103. Determine the second downlink throughput of each SINR interval according to the first downlink throughput and the SINR value.
可选的,根据第一下行吞吐量和SINR值,确定各个SINR区间的第二下行吞吐量,如图10所示包括:Optionally, according to the first downlink throughput and the SINR value, determine the second downlink throughput of each SINR interval, as shown in FIG. 10 , including:
S1030、根据SINR值,确定测量点的分布模式;其中,分布模式指测量点以相同或不同SINR进行分布。S1030. Determine the distribution pattern of the measurement points according to the SINR value; wherein, the distribution pattern means that the measurement points are distributed with the same or different SINRs.
需要说明的是,测量点以相同SINR进行分布是指将UE放置于相同的SINR位置处,测量点以不同SINR进行分布是指将UE放置于不同的SINR位置处;示例性的,UE放置于不同SINR位置处时可以按照表4的分布模式进行放置。It should be noted that the distribution of measurement points with the same SINR refers to placing the UE at the same SINR position, and the distribution of the measurement points with different SINRs refers to placing the UE at different SINR positions; Different SINR positions can be placed according to the distribution pattern in Table 4.
S1031、根据分布模式和第一下行吞吐量,确定不同分布模式的第二下行吞吐量。S1031. Determine second downlink throughputs of different distribution modes according to the distribution mode and the first downlink throughput.
需要说明的是,根据分布模式和第一下行吞吐量,确定不同分布模式的第二下行吞吐量,包括:It should be noted that, according to the distribution mode and the first downlink throughput, the second downlink throughput of different distribution modes is determined, including:
根据同SINR位置处的吞吐量数据、不同SINR位置处的吞吐量数据、LOS径时每个SINR区间的概率以及NLOS径时每个SINR区间的概率,确定不同分布模式的第二下行吞吐量,具体如下:According to the throughput data at the same SINR position, the throughput data at different SINR positions, the probability of each SINR interval on the LOS path, and the probability of each SINR interval on the NLOS path, determine the second downlink throughput of different distribution modes, details as follows:
根据不同SINR位置处的吞吐量数据、LOS径时每个SINR区间的概率以及NLOS径时每个SINR区间的概率,确定同SINR位置-LOS径时不同SINR区间对应的P模式相同点_LOS_SINR_gap、同SINR位置-NLOS径时不同SINR区间对应的P模式相同点_NLOS_SINR_gap、不同SINR位置-LOS径时不同SINR区间对应的P模式不同点_LOS_SINR_gap和不同SINR位置-NLOS径时不同SINR区间对应的P模式不同点_NLOS_SINR_gap。According to the throughput data at different SINR positions, the probability of each SINR interval in the LOS path, and the probability of each SINR interval in the NLOS path, determine the P -mode same point_LOS_SINR_gap corresponding to different SINR intervals in the same SINR position-LOS path, The same SINR position-NLOS path corresponds to the P -mode same point _NLOS_SINR_gap corresponding to different SINR intervals, different SINR position-LOS path corresponds to the P -mode difference point _LOS_SINR_gap corresponding to different SINR intervals, and different SINR position-NLOS path corresponds to different SINR intervals P -mode difference _NLOS_SINR_gap .
根据同SINR位置处的吞吐量数据、同SINR位置-LOS径时不同SINR区间对应的P模式相同点_LOS_SINR_gap、同SINR位置-NLOS径时不同SINR区间对应的P模式相同点_NLOS_SINR_gap、不同SINR位置-LOS径时不同SINR区间对应的P模式不同点_LOS_SINR_gap和不同SINR位置-NLOS径时不同SINR区间对应的P模式不同点_NLOS_SINR_gap,确定不同分布模式的第二下行吞吐量。According to the throughput data at the same SINR position, the same point of P mode _LOS_SINR_gap corresponding to different SINR intervals when the same SINR position - LOS path, the same point of P mode _NLOS_SINR_gap corresponding to different SINR intervals when the same SINR position - NLOS path, different SINR The P -mode difference _LOS_SINR_gap corresponding to different SINR intervals in the position-LOS path and the P-mode difference _NLOS_SINR_gap corresponding to different SINR intervals in different SINR positions-NLOS path, determine the second downlink throughput of different distribution modes.
S104、根据第二下行吞吐量、SINR值在SINR区间出现的概率和场景地图,确定小区的第三下行吞吐量。S104. Determine the third downlink throughput of the cell according to the second downlink throughput, the probability that the SINR value appears in the SINR interval, and the scene map.
可选的,根据第二下行吞吐量、SINR值在SINR区间出现的概率和场景地图,确定小区的第三下行吞吐量,如图11所示包括:Optionally, determine the third downlink throughput of the cell according to the second downlink throughput, the probability that the SINR value appears in the SINR interval, and the scenario map, as shown in FIG. 11 , including:
S1040、根据场景地图,确定小区的场景分类;其中,场景分类包括密集分布场景或者分散分布场景,密集分布场景内SINR变化量小于或等于变化量阈值,分散分布场景内SINR变化量大于变化量阈值,SINR变化量由SINR值中的最大值和最小值确定的。S1040. Determine the scene classification of the cell according to the scene map; wherein, the scene classification includes a dense distribution scene or a scattered distribution scene, the SINR change in the dense distribution scene is less than or equal to the change threshold value, and the SINR change in the scattered distribution scene is greater than the change threshold value , the SINR variation is determined by the maximum and minimum values of the SINR values.
需要说明的是,在实际的应用中,通过对该小区内建筑物、植被等情况进行分析,可以确定该小区的场景分类分为密集分布区域或者分散分布区域。It should be noted that, in practical applications, by analyzing the buildings, vegetation, etc. in the cell, it can be determined that the scene of the cell is classified into a dense distribution area or a scattered distribution area.
其中,密集分布区域主要包括写字楼、体育馆、住宅区等;位于密集分布区域内的用户分布一般符合:用户大部分处于一种密集静止状态,少量用户处于分散运动的情况;相应的位于密集分布区域内的网络性能分布符合如下情况:大部分UE处于同一SINR值范围内,如整体变化不会超过5dB,少量UE会出现SINR值大于5dB的跳变。需要说明的是,在实际的应用中针对密集场景,我们优先保证全部满足同位置分布的点进行用户配对,其他位置的点则使用剩余的点进行用户配对。Among them, densely distributed areas mainly include office buildings, gymnasiums, residential areas, etc.; the distribution of users located in densely distributed areas generally conforms to: most users are in a dense static state, and a small number of users are in scattered motion; correspondingly located in densely distributed areas The network performance distribution within the network conforms to the following conditions: most UEs are within the same SINR value range, such as the overall change will not exceed 5dB, and a small number of UEs will have SINR values greater than 5dB jump. It should be noted that in practical applications, for dense scenarios, we give priority to ensuring that all points that satisfy the same location distribution are used for user pairing, and points in other locations use the remaining points for user pairing.
分散分布区域主要包括公园、商场、道路等;位于分散分布区域内的用户分布一般符合:用户大部分处于一种密集静止状态,少量用户处于密集运动的情况;位于分散分布区域内的网络性能分布符合如下情况:大部分UE处于不同的SINR值范围内,如整体变化超过5dB,少量UE相对静止,SINR值变化小于5dB的跳变。The scattered distribution area mainly includes parks, shopping malls, roads, etc. The distribution of users located in the scattered distribution area generally conforms to: most of the users are in a dense static state, and a small number of users are in intensive movement; the network performance distribution in the scattered distribution area It conforms to the following conditions: most of the UEs are in different SINR value ranges, such as the overall change exceeds 5dB, a small number of UEs are relatively static, and the SINR value changes less than 5dB jump.
具体的,根据场景地图,确定小区的场景分类,包括:Specifically, according to the scene map, determine the scene classification of the cell, including:
根据场景地图,计算密集分布场景的第一总面积;其中,密集分布场景包括写字楼、体育馆、住宅区中的一项或者多项。According to the scene map, the first total area of the densely distributed scene is calculated; wherein, the densely distributed scene includes one or more items of an office building, a gymnasium, and a residential area.
根据第一总面积,计算P密集;其中,
根据场景地图,计算分散分布场景的第二总面积;其中,分散分布场景包括公园、商场和道路中的一项或者多项。According to the scene map, the second total area of the scattered distribution scene is calculated; wherein, the scattered distribution scene includes one or more items of parks, shopping malls and roads.
根据第二总面积,计算P分散;其中,
确定P密集>50%时,确定该小区为密集分布场景。When it is determined that P is dense > 50%, the cell is determined to be a dense distribution scenario.
确定P分散>50%时,确定该小区为分散分布场景。When it is determined that the P dispersion is greater than 50%, the cell is determined to be a scattered distribution scenario.
确定P密集≤50%,或者P分散≤50%时,确定该小区为其他分布场景。When it is determined that the P density is less than or equal to 50%, or the P dispersion is less than or equal to 50%, the cell is determined to be another distribution scenario.
S1041、根据不同分布模式的第二下行吞吐量、不同传播方式下SINR值在SINR区间出现的概率和场景分类,确定第三下行吞吐量。S1041. Determine the third downlink throughput according to the second downlink throughput in different distribution modes, the probability that the SINR value appears in the SINR interval under different propagation modes, and the scene classification.
需要说明的是,在实际的应用中,计算第三下行吞吐量时,若该小区属于密集分布场景,则需要按照密集分布场景计算第三下行吞吐量的方式计算该小区的第三下行吞吐量;若该小区属于分散分布场景,则需要按照密集分散场景计算第三下行吞吐量的方式计算该小区的第三下行吞吐量,具体的计算方式如下:It should be noted that, in an actual application, when calculating the third downlink throughput, if the cell belongs to a dense distribution scenario, the third downlink throughput of the cell needs to be calculated in the manner of calculating the third downlink throughput in the dense distribution scenario. ; If the cell belongs to a scattered distribution scenario, the third downlink throughput of the cell needs to be calculated according to the method of calculating the third downlink throughput in a densely scattered scenario. The specific calculation method is as follows:
当确定该小区的场景分类为密集分布场景时,根据不同SINR位置处的吞吐量数据、LOS径时每个SINR区间的概率以及NLOS径时每个SINR区间的概率,确定同SINR位置-LOS径时不同SINR区间对应的P模式相同点_LOS_SINR_gap、同SINR位置-NLOS径时不同SINR区间对应的P模式相同点_NLOS_SINR_gap、不同SINR位置-LOS径时不同SINR区间对应的P模式不同点_LOS_SINR_gap和不同SINR位置-NLOS径时不同SINR区间对应的P模式不同点_NLOS_SINR_gap,具体包括:When it is determined that the scene of the cell is classified as a densely distributed scene, according to the throughput data at different SINR positions, the probability of each SINR interval in the LOS path, and the probability of each SINR interval in the NLOS path, determine the same SINR position - LOS path P -mode same points corresponding to different SINR intervals _LOS_SINR_gap , P-mode same points corresponding to different SINR intervals when the same SINR position-NLOS path _NLOS_SINR_gap , Different SINR positions-LOS path corresponding P -mode differences corresponding to different SINR intervals _LOS_SINR_gap Different points of P mode _NLOS_SINR_gap corresponding to different SINR intervals at different SINR positions-NLOS paths, including:
根据LOS径时每个SINR区间的概率以及NLOS径时每个SINR区间的概率,确定密集分布场景的同SINR位置LOS径SINR值出现在SINR区间的概率P模式相同点_LOS_SINR_gap以及确定密集分布场景的同SINR位置NLOS径SINR值出现在SINR区间的概率P模式相同点_NLOS_SINR_gap。其中,According to the probability of each SINR interval in the LOS path and the probability of each SINR interval in the NLOS path, determine the probability that the SINR value of the LOS path in the same SINR position of the densely distributed scene appears in the SINR interval P mode same point_LOS_SINR_gap and determine the dense distribution scene The same SINR position NLOS path SINR value appears in the SINR interval probability P mode is the same point _NLOS_SINR_gap . in,

其中,SINR_gap为需要计算的SINR区间,M为UE的总数。Wherein, SINR_gap is the SINR interval to be calculated, and M is the total number of UEs.
需要说明的是,UE的总数等于实现基站极限容量时使用的UE的数量;示例性的,本发明的实施例在实现基站极限容量时使用了4个UE,因此M等于4。It should be noted that the total number of UEs is equal to the number of UEs used to realize the limit capacity of the base station; exemplarily, the embodiment of the present invention uses 4 UEs to realize the limit capacity of the base station, so M is equal to 4.
示例性的,以计算密集分布场景的同SINR位置LOS径SINR值出现在SINR区间[-2.5,2.5]的概率P模式相同点_LOS_SINR_gap为例进行说明,包括:Exemplarily, the calculation of the probability P -mode same point _LOS_SINR_gap that the LOS path SINR value of the same SINR position of the densely distributed scene appears in the SINR interval [-2.5, 2.5] is used as an example for description, including:
由表8可知,密集分布场景的同SINR位置下,LOS径下单个SINR值出现在SINR区间[-2.5,2.5]的概率PLOS_[-2.5,2.5]=FLOS(2.5)-FLOS(-2.5);由
又或者,计算密集分布场景的同SINR位置NLOS径SINR值出现在SINR区间[-2.5,2.5]的概率P模式相同点_NLOS_SINR_gap的过程如下:由表9可知,密集分布场景的同SINR位置下,NLOS径下单个SINR值出现在SINR区间[-2.5,2.5]的概率PNLOS_[-2.5,2.5]=FNLOS(2.5)-FNLOS(-2.5);由
根据LOS径时每个SINR区间的概率以及NLOS径时每个SINR区间的概率,确定密集分布场景的不同SINR位置LOS径SINR值出现在SINR区间的概率P模式不同点_LOS_SINR_gap以及确定密集分布场景的不同SINR位置NLOS径SINR值出现在SINR区间的概率P模式不同点_NLOS_SINR_gap。其中,According to the probability of each SINR interval in the LOS path and the probability of each SINR interval in the NLOS path, determine the probability that the SINR value of the LOS path appears in the SINR interval at different SINR positions of the densely distributed scene P mode difference_LOS_SINR_gap and determine the dense distribution scene The different SINR positions of the NLOS path SINR values appear in the SINR interval probability P mode difference point _NLOS_SINR_gap . in,


其中,N为UE总数,n为SINR_gap的总个数,Mji为模式i下处于SINR_gapj的UE总数。Wherein, N is the total number of UEs, n is the total number of SINR_gap, and M ji is the total number of UEs in SINR_gap j in mode i.
需要说明的是,UE处于不同SINR位置分布时,其分布模式如表4所示,本发明的实施例规定好点取值在[18,22dB],中点取值在[6,10dB],差点取值在[-2,2],具体的运维人员可以根据实际的情况设定好点、中点和差点的SINR区间。It should be noted that when the UE is distributed in different SINR positions, its distribution pattern is shown in Table 4. The embodiment of the present invention stipulates that the good point value is [18, 22dB], and the midpoint value is [6, 10dB], The handicap value is [-2, 2], and the specific operation and maintenance personnel can set the SINR range of the point, midpoint and handicap according to the actual situation.
由NLOS径时对应的SINR值的CDF曲线(FNLOS(SINRNLOS))和LOS径时对应的SINR值的CDF曲线(FLOS(SINRLOS))可知,NLOS径下SINR值出现在好点区间[18,22dB]的概率为FNLOS(22)-FNLOS(18),SINR值出现在中点区间[6,10dB]的概率为FNLOS(10)-FNLOS(6),SINR值出现在差点区间[-2,2dB]的概率为FNLOS(2)-FNLOS(-2);LOS径下SINR值出现在好点区间[18,22dB]的概率为FLOS(22)-FLOS(18),SINR值出现在中点区间[6,10dB]的概率为FLOS(10)-FLOS(6),SINR值出现在差点区间[-2,2dB]的概率为FLOS(2)-FLOS(-2)。From the CDF curve of the SINR value corresponding to the NLOS path (F NLOS (SINR NLOS )) and the CDF curve of the SINR value corresponding to the LOS path (F LOS (SINR LOS )), it can be known that the SINR value under the NLOS path appears in the good point interval The probability of [18, 22dB] is F NLOS (22)-F NLOS (18), the probability that the SINR value appears in the midpoint interval [6, 10dB] is F NLOS (10)-F NLOS (6), the SINR value appears The probability of being in the handicap interval [-2, 2dB] is F NLOS (2)-F NLOS (-2); the probability of the SINR value appearing in the good point interval [18, 22dB] under the LOS path is F LOS (22)-F LOS (18), the probability that the SINR value appears in the midpoint interval [6, 10dB] is F LOS (10)-F LOS (6), and the probability that the SINR value appears in the handicap interval [-2, 2dB] is F LOS ( 2)-F LOS (-2).
示例性的,以4个UE按照表4中的模式1分布,计算密集分布场景LOS径下不同SINR位置处的SINR值出现在SINR区间[-2.5,2.5]的概率
由表8可知,LOS径单个SINR值出现在SINR区间[18,22dB]的概率为FLOS(22)-FLOS(18),单个SINR值出现在SINR区间[6,10dB]的概率为FLOS(10)-FLOS(6),单个SINR值出现在SINR区间[-2,2]的概率为FLOS(2)-FLOS(-2),则It can be seen from Table 8 that the probability that a single SINR value of the LOS path appears in the SINR interval [18, 22dB] is F LOS (22)-F LOS (18), and the probability that a single SINR value appears in the SINR interval [6, 10dB] is F LOS (10)-F LOS (6), the probability of a single SINR value appearing in the SINR interval [-2, 2] is F LOS (2)-F LOS (-2), then

又或者,以4个UE按照表4中的模式1分布,计算密集分布场景NLOS径下不同SINR位置处的SINR值出现在SINR区间[-2.5,2.5]的概率
由表9可知,NLOS径单个SINR值出现在SINR区间[18,22dB]的概率为FNLOS(22)-FNLOS(18),单个SINR值出现在SINR区间[6,10dB]的概率为FNLOS(10)-FNLOS(6),单个SINR值出现在SINR区间[-2,2]的概率为FNLOS(2)-FNLOS(-2),则It can be seen from Table 9 that the probability that a single SINR value of the NLOS path appears in the SINR interval [18, 22dB] is F NLOS (22)-F NLOS (18), and the probability that a single SINR value appears in the SINR interval [6, 10dB] is F NLOS (10)-F NLOS (6), the probability of a single SINR value appearing in the SINR interval [-2, 2] is F NLOS (2)-F NLOS (-2), then

具体的,在实际的应用中,同SINR位置处采集的下行吞吐量数据和不同SINR位置处采集的下行吞吐量数据会存在重复的情况;因此,为了提高第三下行吞吐量的计算精度,需要均衡去除位置相同点后,不同SINR区间剩余点在不同SINR位置的关系如下:Specifically, in practical applications, the downlink throughput data collected at the same SINR position and the downlink throughput data collected at different SINR positions may be duplicated; therefore, in order to improve the calculation accuracy of the third downlink throughput, it is necessary to After equalization removes the same points, the relationship between the remaining points in different SINR intervals at different SINR positions is as follows:
PLOS_SINR_gap-P模式相同点_LOS_SINR_gap=aj×P模式不同点_LOS_SINR_gap;P LOS_SINR_gap - the same point of the P mode _LOS_SINR_gap = a j × the difference point of the P mode _LOS_SINR_gap ;
PNLOS_SINR_gap-P模式相同点_NLOS_SINR_gap=aj×P模式不同点_NLOS_SINR_gap。P NLOS_SINR_gap -P mode same point _NLOS_SINR_gap = a j ×P mode difference point _NLOS_SINR_gap .
其中,aj为常数。Among them, a j is a constant.
示例性的,以SINR区间分别为[-2.5,2.5]、[2.5,7.5]、[7.5,12.5]、[12.5,17.5]和[17.5,22.5],计算同SINR位置-LOS径时不同SINR区间对应的P模式相同点_LOS_SINR_gap、同SINR位置-NLOS径时不同SINR区间对应的P模式相同点_NLOS_SINR_gap、不同SINR位置-LOS径时不同SINR区间对应的P模式不同点_LOS_SINR_gap和不同SINR位置-NLOS径时不同SINR区间对应的P模式不同点_NLOS_SINR_gap为例进行说明:Exemplarily, the SINR intervals are [-2.5, 2.5], [2.5, 7.5], [7.5, 12.5], [12.5, 17.5], and [17.5, 22.5] to calculate different SINRs between the same SINR position and the LOS path. The same point of P mode _LOS_SINR_gap corresponding to the interval, the same point of P mode _NLOS_SINR_gap corresponding to different SINR intervals when the same SINR position - NLOS path, the difference point of P mode corresponding to different SINR intervals when the position of different SINR - LOS path _LOS_SINR_gap and different SINR The different points of P mode corresponding to different SINR intervals in the position-NLOS path _NLOS_SINR_gap are taken as an example to illustrate:
由密集分布场景的P模式相同点_LOS_SINR_gap、P模式相同点_NLOS_SINR_gap、P模式不同点_LOS_SINR_gap和P模式不同点_NLOS_SINR_gap的计算公式可以分别计算出每个SINR区间对应的P模式相同点_LOS_SINR_gap、P模式相同点_NLOS_SINR_gap、P模式不同点_LOS_SINR_gap和P模式不同点_NLOS_SINR_gap的取值。From the calculation formulas of the P -mode same point _LOS_SINR_gap , the P -mode same point _NLOS_SINR_gap , the P -mode difference point _LOS_SINR_gap and the P -mode difference point _NLOS_SINR_gap of the densely distributed scene, the P-mode same point corresponding to each SINR interval can be calculated separately_ The value of LOS_SINR_gap , the same point of P mode _NLOS_SINR_gap, the difference point of P mode _LOS_SINR_gap and the difference point of P mode _NLOS_SINR_gap .
进一步地,根据PLOS_SINR_gapj-P模式相同点_LOS_SINR_gap=aj×P模式不同点_LOS_SINR_gap和PNLOS_SINR_gapj-P模式相同点_NLOS_SINR_gap=aj×P模式不同点_NLOS_SINR_gap,可以得到去重后的P模式相同点_LOS_SINR_gap、P模式相同点_NLOS_SINR_gap、P模式不同点_LOS_SINR_gap和P模式不同点_NLOS_SINR_gap的取值;其中,同SINR位置-LOS径时不同SINR区间对应的P模式相同点_LOS_SINR_gap、同SINR位置-NLOS径时不同SINR区间对应的P模式相同点_NLOS_SINR_gap如表10所示,不同SINR位置-LOS径时不同SINR区间对应的P模式不同点_LOS_SINR_gap和不同SINR位置-NLOS径时不同SINR区间对应的P模式不同点_NLOS_SINR_gap如表11所示。Further, according to P LOS_SINR_gapj - the same point of the P mode _LOS_SINR_gap = a j × the difference point of the P mode _LOS_SINR_gap and P NLOS_SINR_gapj - the same point of the P mode _NLOS_SINR_gap = a j × the difference point of the P mode _NLOS_SINR_gap , the deduplication can be obtained The value of the same point of P mode _LOS_SINR_gap, the same point of P mode _NLOS_SINR_gap , the difference point of P mode _LOS_SINR_gap and the difference point of P mode _NLOS_SINR_gap ; among them, the same point of P mode corresponding to different SINR intervals when the same SINR position - LOS path_ LOS_SINR_gap , the same SINR position-NLOS path corresponding to the P -mode same point _NLOS_SINR_gap in different SINR intervals as shown in Table 10, different SINR position-LOS path corresponding to the P -mode difference between different SINR intervals _LOS_SINR_gap and different SINR positions-NLOS The different points _NLOS_SINR_gap of the P mode corresponding to different SINR intervals in the path are shown in Table 11.
表10Table 10


表11Table 11
需要说明的是,在实际的应用中,小区内的UE与该小区的天线的传播方式仅包括LOS径或者NLOS径,因此需要计算该小区内LOS径和NLOS径的概率,具体如下:It should be noted that, in practical applications, the propagation mode of the UE in the cell and the antenna of the cell only includes the LOS path or the NLOS path, so it is necessary to calculate the probability of the LOS path and the NLOS path in the cell, as follows:
在密集城区(非授权移动接入(英文全称:Unlicensed Mobile Access,简称:UMA)情况下,使用下面的公式进行计算:In the case of dense urban areas (Unlicensed Mobile Access (English full name: Unlicensed Mobile Access, abbreviation: UMA), use the following formula to calculate:


其中,d2D-out为水平覆盖距离,R为覆盖距离;hBS为基站高度;hUT为UE高度。Among them, d 2D-out is the horizontal coverage distance, R is the coverage distance; h BS is the height of the base station; h UT is the height of the UE.
根据上述LOS径下的第二下行吞吐量TLOS、NLOS径下的第二下行吞吐量TNLOS以及PrLOS,确定密集分布场景的第三吞吐量T密集。其中,T密集=TLOS×PrLOS+TNLOS×(1-PrLOS),LOS径下的第二下行吞吐量TLOS计算方式为:According to the second downlink throughput T LOS under the LOS path, the second downlink throughput T NLOS and Pr LOS under the NLOS path, the third throughput T dense in the dense distribution scenario is determined. Among them, T dense = T LOS ×Pr LOS +T NLOS ×(1-Pr LOS ), and the calculation method of the second downlink throughput T LOS under the LOS path is:

NLOS径下的第二下行吞吐量TNLOS计算方式为:The calculation method of the second downlink throughput T NLOS under the NLOS path is:

当确定该小区的场景分类为分散分布场景时,根据不同SINR位置处的吞吐量数据、LOS径时每个SINR区间的概率以及NLOS径时每个SINR区间的概率,确定同SINR位置-LOS径时不同SINR区间对应的P模式相同点_LOS_SINR_gap、同SINR位置-NLOS径时不同SINR区间对应的P模式相同点_NLOS_SINR_gap、不同SINR位置-LOS径时不同SINR区间对应的P模式不同点_LOS_SINR_gap和不同SINR位置-NLOS径时不同SINR区间对应的P模式不同点_NLOS_SINR_gap。When it is determined that the scene of the cell is classified as a scattered distribution scene, the same SINR position-LOS path is determined according to the throughput data at different SINR positions, the probability of each SINR interval in the LOS path, and the probability of each SINR interval in the NLOS path. P -mode same points corresponding to different SINR intervals _LOS_SINR_gap , P-mode same points corresponding to different SINR intervals when the same SINR position-NLOS path _NLOS_SINR_gap , Different SINR positions-LOS path corresponding P -mode differences corresponding to different SINR intervals _LOS_SINR_gap The P -mode difference corresponding to different SINR intervals at different SINR positions-NLOS path _NLOS_SINR_gap .
需要说明的是,确定该小区的场景分类为分散分布场景时,根据不同SINR位置处的吞吐量数据、LOS径时每个SINR区间的概率以及NLOS径时每个SINR区间的概率,确定同SINR位置-LOS径时不同SINR区间对应的P模式相同点_LOS_SINR_gap、同SINR位置-NLOS径时不同SINR区间对应的P模式相同点_NLOS_SINR_gap、不同SINR位置-LOS径时不同SINR区间对应的P模式不同点_LOS_SINR_gap和不同SINR位置-NLOS径时不同SINR区间对应的P模式不同点_NLOS_SINR_gap,具体包括:It should be noted that, when it is determined that the scenario of the cell is classified as a scattered distribution scenario, the same SINR is determined according to the throughput data at different SINR locations, the probability of each SINR interval on the LOS path, and the probability of each SINR interval on the NLOS path. The same point of P mode corresponding to different SINR intervals when the position-LOS path is _LOS_SINR_gap, the same point of P mode corresponding to different SINR intervals when the same SINR position-NLOS path is _NLOS_SINR_gap, and the P mode corresponding to different SINR intervals when the position of different SINR-LOS path is different Different points _LOS_SINR_gap and different SINR positions-NLOS paths corresponding to different SINR intervals in different P mode points _NLOS_SINR_gap , including:
根据LOS径时每个SINR区间的概率以及NLOS径时每个SINR区间的概率,确定分散分布场景的不同SINR位置LOS径SINR值出现在SINR区间的概率P模式不同点_LOS_SINR_gap以及确定分散分布场景的不同SINR位置NLOS径SINR值出现在SINR区间的概率P模式不同点_NLOS_SINR_gap。其中,According to the probability of each SINR interval in the LOS path and the probability of each SINR interval in the NLOS path, determine the probability that the SINR value of the LOS path appears in the SINR interval at different SINR positions of the scattered distribution scene P mode difference point_LOS_SINR_gap and determine the scattered distribution scene The different SINR positions of the NLOS path SINR values appear in the SINR interval probability P mode difference point _NLOS_SINR_gap . in,


其中,N为UE总数,n为SINR_gap的总个数,Mji为模式i下处于SINR_gapj的UE总数。Wherein, N is the total number of UEs, n is the total number of SINR_gap, and M ji is the total number of UEs in SINR_gap j in mode i.
需要说明的是,分散分布场景的P模式不同点_LOS_SINR_gap的计算方式与密集分布场景的P模式不同点_LOS_SINR_gap的计算方式相同,同时分散分布场景的P模式不同点_NLOS_SINR_gap的计算方式与密集分布场景的P模式不同点_NLOS_SINR_gap的计算方式相同,此处不再赘述。It should be noted that the calculation method of _LOS_SINR_gap is the same as that of the P mode difference in the scattered distribution scene and the calculation method of _LOS_SINR_gap in the P mode of the dense distribution scene. The calculation method of the difference point _NLOS_SINR_gap of the P mode of the distribution scenario is the same, and will not be repeated here.
具体的,在实际的应用中,同SINR位置处采集的下行吞吐量数据和不同SINR位置处采集的下行吞吐量数据会存在重复的情况;因此,为了提高第三下行吞吐量的计算精度,需要均衡去除位置相同点后,不同SINR区间剩余点和不同SINR位置的关系如下:Specifically, in practical applications, the downlink throughput data collected at the same SINR position and the downlink throughput data collected at different SINR positions may be duplicated; therefore, in order to improve the calculation accuracy of the third downlink throughput, it is necessary to After equalization removes the same points, the relationship between the remaining points in different SINR intervals and different SINR positions is as follows:
P模式相同点_LOS_SINR_gap=PLOS_SINR_gap-aj×P模式不同点_LOS_SINR_gap;P mode same point _LOS_SINR_gap =P LOS_SINR_gap -a j ×P mode difference point _LOS_SINR_gap ;
P模式相同点_NLOS_SINR_gap=PNLOS_SINR_gap-aj×P模式不同点_NLOS_SINR_gap。P -mode same point _NLOS_SINR_gap =P NLOS_SINR_gap - a j ×P -mode difference point _NLOS_SINR_gap .
其中,aj常数。Among them, a j constant.
示例性的,以SINR区间分别为[-2.5,2.5]、[2.5,7.5]、[7.5,12.5]、[12.5,17.5]和[17.5,22.5],计算同SINR位置-LOS径时不同SINR区间对应的P模式相同点_LOS_SINR_gap、同SINR位置-NLOS径时不同SINR区间对应的P模式相同点_NLOS_SINR_gap、不同SINR位置-LOS径时不同SINR区间对应的P模式不同点_LOS_SINR_gap和不同SINR位置-NLOS径时不同SINR区间对应的P模式不同点_NLOS_SINR_gap为例进行说明:Exemplarily, the SINR intervals are [-2.5, 2.5], [2.5, 7.5], [7.5, 12.5], [12.5, 17.5], and [17.5, 22.5], respectively, to calculate different SINRs at the same SINR position-LOS path The same point of P mode _LOS_SINR_gap corresponding to the interval, the same point of P mode _NLOS_SINR_gap corresponding to different SINR intervals when the same SINR position - NLOS path, and the difference point of P mode _LOS_SINR_gap and different SINR corresponding to different SINR intervals when the position of different SINR - LOS path The different points of P mode corresponding to different SINR intervals in the position-NLOS path _NLOS_SINR_gap are taken as an example to illustrate:
由分散分布场景的P模式相同点_LOS_SINR_gap、P模式相同点_NLOS_SINR_gap、P模式不同点_LOS_SINR_gap和P模式不同点_NLOS_SINR_gap的计算公式可以分别计算出每个SINR区间对应的P模式相同点_LOS_SINR_gap、P模式相同点_NLOS_SINR_gap、P模式不同点_LOS_SINR_gap和P模式不同点_NLOS_SINR_gap的取值。From the calculation formulas of the P mode same point _LOS_SINR_gap , the P mode same point _NLOS_SINR_gap , the P mode difference point _LOS_SINR_gap , and the P mode difference point _NLOS_SINR_gap of the scattered distribution scene, the corresponding P mode same point of each SINR interval can be calculated separately_ The value of LOS_SINR_gap , the same point of P mode _NLOS_SINR_gap, the difference point of P mode _LOS_SINR_gap and the difference point of P mode _NLOS_SINR_gap .
进一步地,根据P模式相同点_LOS_SINR_gap=PLOS_SINR_gap-aj×P模式不同点_LOS_SINR_gap和P模式相同点_NLOS_SINR_gap=PNLOS_SINR_gap-aj×P模式不同点_NLOS_SINR_gap,可以得到去重后的P模式相同点_LOS_SINR_gap、P模式相同点_NLOS_SINR_gap、P模式不同点_LOS_SINR_gap和P模式不同点_NLOS_SINR_gap的取值;其中,同SINR位置-LOS径时不同SINR区间对应的P模式相同点_LOS_SINR_gap、同SINR位置-NLOS径时不同SINR区间对应的P模式相同点_NLOS_SINR_gap如表12所示,不同SINR位置-LOS径时不同SINR区间对应的P模式不同点_LOS_SINR_gap和不同SINR位置-NLOS径时不同SINR区间对应的P模式不同点_NLOS_SINR_gap如表13所示。Further, according to the same point of P mode _LOS_SINR_gap = P LOS_SINR_gap - a j × difference point of P mode _LOS_SINR_gap and the same point of P mode _NLOS_SINR_gap = P NLOS_SINR_gap - a j × difference point of P mode _NLOS_SINR_gap , the deduplication can be obtained The value of the same point of P mode _LOS_SINR_gap, the same point of P mode _NLOS_SINR_gap , the difference point of P mode _LOS_SINR_gap and the difference point of P mode _NLOS_SINR_gap ; among them, the same point of P mode corresponding to different SINR intervals when the same SINR position - LOS path_ LOS_SINR_gap , the same SINR position-NLOS path corresponding to the P -mode same point _NLOS_SINR_gap in different SINR intervals as shown in Table 12, different SINR position-LOS path corresponding to the P -mode difference between different SINR intervals _LOS_SINR_gap and different SINR positions-NLOS The different points _NLOS_SINR_gap of the P mode corresponding to different SINR intervals in the path are shown in Table 13.
表12Table 12

表13Table 13
需要说明的是,在实际的应用中,小区内的UE与该小区的天线的传播方式仅包括LOS径或者NLOS径,因此需要计算该小区内LOS径和NLOS径的概率,具体如下:It should be noted that, in practical applications, the propagation mode of the UE in the cell and the antenna of the cell only includes the LOS path or the NLOS path, so it is necessary to calculate the probability of the LOS path and the NLOS path in the cell, as follows:
在密集城区(UMA情况下,使用下面的公式进行计算:)In dense urban areas (UMA case, use the formula below:)


其中,d2D-out为水平覆盖距离,R为覆盖距离;hBS为基站高度;hUT为UE高度。Among them, d 2D-out is the horizontal coverage distance, R is the coverage distance; h BS is the height of the base station; h UT is the height of the UE.
根据上述LOS径下的第二下行吞吐量TLOS、NLOS径下的第二下行吞吐量TNLOS以及PrLOS,确定分散分布场景的第三吞吐量T分散。其中,T分散=TLOS×PrLOS+TNLOS×(1-PrLOS),LOS径下的第二下行吞吐量TLOS计算方式为:According to the second downlink throughput T LOS under the LOS path, the second downlink throughput T NLOS and Pr LOS under the NLOS path, the third throughput T dispersion of the distributed distribution scenario is determined. Among them, T dispersion =T LOS ×Pr LOS +T NLOS ×(1-Pr LOS ), and the calculation method of the second downlink throughput T LOS under the LOS path is:
TLOS=∑P模式相同点_LOS_SINR_gap×T_SINR_gap+∑P模式不同点_LOS_SINR_gap×TD(TMi);T LOS = ∑P mode same point _LOS_SINR_gap ×T _SINR_gap +∑P mode difference point _LOS_SINR_gap ×TD(TM i );
NLOS径下的第二下行吞吐量TNLOS计算方式为:The calculation method of the second downlink throughput T NLOS under the NLOS path is:
TNLOS=∑P模式相同点_NLOS_SINR_gap×T_SINR_gap+∑P模式不同点_NLOS_SINR_gap×TD(TMi)。T NLOS = ΣP pattern same point _NLOS_SINR_gap ×T _SINR_gap + ΣP pattern difference point _NLOS_SINR_gap ×TD(TM i ).
具体的,当该小区的场景分类为其他分布场景时,其他分布场景的下行吞吐量TNLOS_其他的计算公式为:Specifically, when the scenario of the cell is classified into other distribution scenarios, the calculation formula of the downlink throughput T NLOS_Other of the other distribution scenarios is:

由上述方案可知,本发明的实施例提供的下行吞吐量的计算方法,通过小区的覆盖范围内的至少一个测量点的第一下行吞吐量和SINR值,确定各个SINR区间的第二下行吞吐量,从而建立不同的SINR区间与第二下行吞吐量的对应关系;同时,根据该小区的场景地图,确定SINR值在SINR区间出现的概率,从而确定SINR值与SINR区间的对应关系;最后,根据第二下行吞吐量、SINR值在SINR区间出现的概率和场景地图,确定小区的第三下行吞吐量;因此,通过本发明的实施例提供的下行吞吐量的计算方法,可以计算出5G小区的下行吞吐量,解决了如何计算5G小区的下行吞吐量的问题。It can be seen from the above solution that the calculation method of downlink throughput provided by the embodiment of the present invention determines the second downlink throughput of each SINR interval by the first downlink throughput and SINR value of at least one measurement point within the coverage of the cell. Therefore, the corresponding relationship between different SINR intervals and the second downlink throughput is established; at the same time, according to the scene map of the cell, the probability that the SINR value appears in the SINR interval is determined, thereby determining the corresponding relationship between the SINR value and the SINR interval; finally, The third downlink throughput of the cell is determined according to the second downlink throughput, the probability that the SINR value appears in the SINR interval, and the scene map; therefore, through the calculation method of the downlink throughput provided by the embodiment of the present invention, the 5G cell can be calculated It solves the problem of how to calculate the downlink throughput of 5G cells.
实施例二
本发明的实施例提供一种下行吞吐量的计算装置10,如图12所示包括:An embodiment of the present invention provides an
获取单元101,用于获取小区的场景地图以及小区的覆盖范围内至少一个测量点的第一下行吞吐量和SINR值。The obtaining
处理单元102,用于根据获取单元101获取的场景地图,确定SINR值在SINR区间出现的概率。The
处理单元102,还用于根据获取单元101获取的第一下行吞吐量和SINR值,确定各个SINR区间的第二下行吞吐量。The
处理单元102,还用于根据第二下行吞吐量、SINR值在SINR区间出现的概率和获取单元获取的场景地图,确定小区的第三下行吞吐量。The
可选的,获取单元101,具体用于获取小区的天线与测量点的传播方式;其中,传播方式包括NLOS或者LOS;处理单元102,具体用于根据获取单元101获取的3D地图或者规划图,确定SINR值的累积分布函数;处理单元102,具体用于根据累积分布函数和获取单元101获取的传播方式,确定不同传播方式下SINR值在SINR区间出现的概率。Optionally, the
可选的,处理单元102,具体用于根据获取单元101获取的SINR值,确定测量点的分布模式;其中,分布模式指测量点以相同或不同SINR进行分布;处理单元102,具体用于根据分布模式和获取单元101获取的第一下行吞吐量,确定不同分布模式的第二下行吞吐量。Optionally, the
可选的,处理单元102,还用于根据获取单元101获取的场景地图,确定小区的场景分类;其中,场景分类包括密集分布场景和分散分布场景,密集分布场景内SINR变化量小于或等于变化量阈值,分散分布场景内SINR变化量大于变化量阈值,SINR变化量由SINR值中的最大值和最小值确定的;处理单元102,具体用于根据不同分布模式的第二下行吞吐量、不同传播方式下SINR值在SINR区间出现的概率和场景分类,确定第三下行吞吐量。Optionally, the
其中,上述方法实施例涉及的各步骤的所有相关内容均可以援引到对应功能模块的功能描述,其作用在此不再赘述。Wherein, all relevant contents of the steps involved in the above method embodiments can be cited in the functional descriptions of the corresponding functional modules, and the functions thereof will not be repeated here.
在采用集成的模块的情况下下行吞吐量的计算装置10包括:存储单元、处理单元以及获取单元。处理单元用于对下行吞吐量的计算装置的动作进行控制管理,例如,处理单元用于支持下行吞吐量的计算装置执行图4中的过程S101、S102、S103和S104;获取单元用于支持下行吞吐量的计算装置与其他设备的信息交互。存储单元,用于存储下行吞吐量的计算装置的程序代码和数据。In the case of using integrated modules, the
其中,以处理单元为处理器,存储单元为存储器,获取单元为通信接口为例。其中,下行吞吐量的计算装置参照图13中所示,包括通信接口501、处理器502、存储器503和总线504,通信接口501、处理器502通过总线504与存储器503相连。The processing unit is the processor, the storage unit is the memory, and the acquisition unit is the communication interface as an example. 13 , the device for calculating downlink throughput includes a
处理器502可以是一个通用中央处理器(Central Processing Unit,CPU),微处理器,特定应用集成电路(Application-Specific Integrated Circuit,ASIC),或一个或多个用于控制本申请方案程序执行的集成电路。The
存储器503可以是只读存储器(Read-Only Memory,ROM)或可存储静态信息和指令的其他类型的静态存储设备,随机存取存储器(Random Access Memory,RAM)或者可存储信息和指令的其他类型的动态存储设备,也可以是电可擦可编程只读存储器(ElectricallyErasable Programmable Read-only Memory,EEPROM)、只读光盘(Compact Disc Read-Only Memory,CD-ROM)或其他光盘存储、光碟存储(包括压缩光碟、激光碟、光碟、数字通用光碟、蓝光光碟等)、磁盘存储介质或者其他磁存储设备、或者能够用于携带或存储具有指令或数据结构形式的期望的程序代码并能够由计算机存取的任何其他介质,但不限于此。存储器可以是独立存在,通过总线与处理器相连接。存储器也可以和处理器集成在一起。The
其中,存储器503用于存储执行本申请方案的应用程序代码,并由处理器502来控制执行。通信接口501用于与其他设备进行信息交互,例如与遥控器的信息交互。处理器502用于执行存储器503中存储的应用程序代码,从而实现本申请实施例中所述的方法。Wherein, the
此外,还提供一种计算存储媒体(或介质),包括在被执行时进行上述实施例中的下行吞吐量的计算装置执行的方法操作的指令。另外,还提供一种计算机程序产品,包括上述计算存储媒体(或介质)。In addition, a computing storage medium (or medium) is also provided, including instructions that, when executed, perform the method operations performed by the computing device for downlink throughput in the above-described embodiments. In addition, a computer program product is also provided, including the above-mentioned computing storage medium (or medium).
应理解,在本发明的各种实施例中,上述各过程的序号的大小并不意味着执行顺序的先后,各过程的执行顺序应以其功能和内在逻辑确定,而不应对本发明实施例的实施过程构成任何限定。It should be understood that, in various embodiments of the present invention, the size of the sequence numbers of the above-mentioned processes does not mean the sequence of execution, and the execution sequence of each process should be determined by its functions and internal logic, rather than the embodiments of the present invention. implementation constitutes any limitation.
本领域普通技术人员可以意识到,结合本文中所公开的实施例描述的各示例的单元及算法步骤,能够以电子硬件、或者计算机软件和电子硬件的结合来实现。这些功能究竟以硬件还是软件方式来执行,取决于技术方案的特定应用和设计约束条件。专业技术人员可以对每个特定的应用来使用不同方法来实现所描述的功能,但是这种实现不应认为超出本发明的范围。Those of ordinary skill in the art can realize that the units and algorithm steps of each example described in conjunction with the embodiments disclosed herein can be implemented in electronic hardware, or a combination of computer software and electronic hardware. Whether these functions are performed in hardware or software depends on the specific application and design constraints of the technical solution. Skilled artisans may implement the described functionality using different methods for each particular application, but such implementations should not be considered beyond the scope of the present invention.
所属领域的技术人员可以清楚地了解到,为描述的方便和简洁,上述描述的系统、装置和单元的具体工作过程,可以参考前述方法实施例中的对应过程,在此不再赘述。Those skilled in the art can clearly understand that, for the convenience and brevity of description, the specific working process of the above-described systems, devices and units may refer to the corresponding processes in the foregoing method embodiments, which will not be repeated here.
在本申请所提供的几个实施例中,应该理解到,所揭露的系统、设备和方法,可以通过其它的方式实现。例如,以上所描述的设备实施例仅仅是示意性的,例如,所述单元的划分,仅仅为一种逻辑功能划分,实际实现时可以有另外的划分方式,例如多个单元或组件可以结合或者可以集成到另一个系统,或一些特征可以忽略,或不执行。另一点,所显示或讨论的相互之间的耦合或直接耦合或通信连接可以是通过一些接口,设备或单元的间接耦合或通信连接,可以是电性,机械或其它的形式。In the several embodiments provided in this application, it should be understood that the disclosed systems, devices and methods may be implemented in other manners. For example, the device embodiments described above are only illustrative. For example, the division of the units is only a logical function division. In actual implementation, there may be other division methods. For example, multiple units or components may be combined or Can be integrated into another system, or some features can be ignored, or not implemented. On the other hand, the shown or discussed mutual coupling or direct coupling or communication connection may be through some interfaces, indirect coupling or communication connection of devices or units, and may be in electrical, mechanical or other forms.
所述作为分离部件说明的单元可以是或者也可以不是物理上分开的,作为单元显示的部件可以是或者也可以不是物理单元,即可以位于一个地方,或者也可以分布到多个网络单元上。可以根据实际的需要选择其中的部分或者全部单元来实现本实施例方案的目的。The units described as separate components may or may not be physically separated, and components displayed as units may or may not be physical units, that is, may be located in one place, or may be distributed to multiple network units. Some or all of the units may be selected according to actual needs to achieve the purpose of the solution in this embodiment.
另外,在本发明各个实施例中的各功能单元可以集成在一个处理单元中,也可以是各个单元单独物理存在,也可以两个或两个以上单元集成在一个单元中。In addition, each functional unit in each embodiment of the present invention may be integrated into one processing unit, or each unit may exist physically alone, or two or more units may be integrated into one unit.
所述功能如果以软件功能单元的形式实现并作为独立的产品销售或使用时,可以存储在一个计算机可读取存储介质中。基于这样的理解,本发明的技术方案本质上或者说对现有技术做出贡献的部分或者该技术方案的部分可以以软件产品的形式体现出来,该计算机软件产品存储在一个存储介质中,包括若干指令用以使得一台计算机设备(可以是个人计算机,服务器,或者网络设备等)执行本发明各个实施例所述方法的全部或部分步骤。而前述的存储介质包括:U盘、移动硬盘、只读存储器(英文全称:read-only memory,英文简称:ROM)、随机存取存储器(英文全称:random access memory,英文简称:RAM)、磁碟或者光盘等各种可以存储程序代码的介质。The functions, if implemented in the form of software functional units and sold or used as independent products, may be stored in a computer-readable storage medium. Based on this understanding, the technical solution of the present invention can be embodied in the form of a software product in essence, or the part that contributes to the prior art or the part of the technical solution. The computer software product is stored in a storage medium, including Several instructions are used to cause a computer device (which may be a personal computer, a server, or a network device, etc.) to execute all or part of the steps of the methods described in the various embodiments of the present invention. The aforementioned storage media include: U disk, mobile hard disk, read-only memory (full English name: read-only memory, English abbreviation: ROM), random access memory (English full name: random access memory, English abbreviation: RAM), magnetic Various media that can store program codes, such as discs or optical discs.
可以理解地,上述提供的任一种下行吞吐量的计算装置用于执行上文所提供的实施例一对应的方法,因此,其所能达到的有益效果可参考上文实施例一的方法以及下文具体实施方式中对应的方案的有益效果,此处不再赘述。It can be understood that any of the above-mentioned devices for calculating downlink throughput is used to execute the method corresponding to the first embodiment provided above. Therefore, for the beneficial effects that can be achieved, reference may be made to the method of the first embodiment and the The beneficial effects of the corresponding solutions in the following specific implementation manner will not be repeated here.
以上所述,仅为本发明的具体实施方式,但本发明的保护范围并不局限于此,任何熟悉本技术领域的技术人员在本发明揭露的技术范围内,可轻易想到变化或替换,都应涵盖在本发明的保护范围之内。因此,本发明的保护范围应以所述权利要求的保护范围为准。The above are only specific embodiments of the present invention, but the protection scope of the present invention is not limited thereto. Any person skilled in the art can easily think of changes or substitutions within the technical scope disclosed by the present invention. should be included within the protection scope of the present invention. Therefore, the protection scope of the present invention should be based on the protection scope of the claims.
Claims (10)
Priority Applications (1)
| Application Number | Priority Date | Filing Date | Title |
|---|---|---|---|
| CN201910357714.0A CN110198552B (en) | 2019-04-29 | 2019-04-29 | Method and device for calculating downlink throughput |
Applications Claiming Priority (1)
| Application Number | Priority Date | Filing Date | Title |
|---|---|---|---|
| CN201910357714.0A CN110198552B (en) | 2019-04-29 | 2019-04-29 | Method and device for calculating downlink throughput |
Publications (2)
| Publication Number | Publication Date |
|---|---|
| CN110198552A CN110198552A (en) | 2019-09-03 |
| CN110198552B true CN110198552B (en) | 2022-03-15 |
Family
ID=67752186
Family Applications (1)
| Application Number | Title | Priority Date | Filing Date |
|---|---|---|---|
| CN201910357714.0A Active CN110198552B (en) | 2019-04-29 | 2019-04-29 | Method and device for calculating downlink throughput |
Country Status (1)
| Country | Link |
|---|---|
| CN (1) | CN110198552B (en) |
Families Citing this family (3)
| Publication number | Priority date | Publication date | Assignee | Title |
|---|---|---|---|---|
| CN110753353B (en) * | 2019-09-17 | 2022-06-07 | 中国联合网络通信集团有限公司 | A kind of equipment selection method and device |
| CN111278044A (en) * | 2020-01-10 | 2020-06-12 | 四川豪威尔信息科技有限公司 | 5G cell capacity evaluation method and device |
| CN112367679B (en) * | 2020-11-27 | 2023-05-26 | 中国联合网络通信集团有限公司 | Method and device for evaluating number of accessible users |
Citations (8)
| Publication number | Priority date | Publication date | Assignee | Title |
|---|---|---|---|---|
| CN102595428A (en) * | 2011-01-10 | 2012-07-18 | 中兴通讯股份有限公司 | Calculation method of cell throughput and calculation apparatus thereof |
| CN103874181A (en) * | 2012-12-10 | 2014-06-18 | 中国移动通信集团设计院有限公司 | Method and device for distributing downlink channel for terminal |
| CN104640144A (en) * | 2015-01-13 | 2015-05-20 | 中国联合网络通信集团有限公司 | Method and device for testing indoor cell average throughput |
| CN104811947A (en) * | 2014-01-27 | 2015-07-29 | 中兴通讯股份有限公司 | Capacity estimation method and system for heterogeneous network |
| CN104838714A (en) * | 2013-12-10 | 2015-08-12 | 华为技术有限公司 | Base station and user scheduling method |
| CN106470056A (en) * | 2015-08-21 | 2017-03-01 | 上海贝尔股份有限公司 | The method and apparatus of SINR threshold value when determining that between MIMO mode, switching occurs |
| WO2018060089A1 (en) * | 2016-09-29 | 2018-04-05 | British Telecommunications Public Limited Company | Network range and connectivity improvenment |
| CN109089277A (en) * | 2018-09-10 | 2018-12-25 | 中国联合网络通信集团有限公司 | Networking appraisal procedure and device based on ergodic data |
Family Cites Families (3)
| Publication number | Priority date | Publication date | Assignee | Title |
|---|---|---|---|---|
| US8250441B2 (en) * | 2007-12-11 | 2012-08-21 | Wi-Lan Inc. | Outer coding framework for application packet error rate minimization |
| US8879613B1 (en) * | 2013-08-06 | 2014-11-04 | Cisco Technology, Inc. | Dynamic frame selection when requesting tone map parameters in mesh networks |
| US10454989B2 (en) * | 2016-02-19 | 2019-10-22 | Verizon Patent And Licensing Inc. | Application quality of experience evaluator for enhancing subjective quality of experience |
-
2019
- 2019-04-29 CN CN201910357714.0A patent/CN110198552B/en active Active
Patent Citations (8)
| Publication number | Priority date | Publication date | Assignee | Title |
|---|---|---|---|---|
| CN102595428A (en) * | 2011-01-10 | 2012-07-18 | 中兴通讯股份有限公司 | Calculation method of cell throughput and calculation apparatus thereof |
| CN103874181A (en) * | 2012-12-10 | 2014-06-18 | 中国移动通信集团设计院有限公司 | Method and device for distributing downlink channel for terminal |
| CN104838714A (en) * | 2013-12-10 | 2015-08-12 | 华为技术有限公司 | Base station and user scheduling method |
| CN104811947A (en) * | 2014-01-27 | 2015-07-29 | 中兴通讯股份有限公司 | Capacity estimation method and system for heterogeneous network |
| CN104640144A (en) * | 2015-01-13 | 2015-05-20 | 中国联合网络通信集团有限公司 | Method and device for testing indoor cell average throughput |
| CN106470056A (en) * | 2015-08-21 | 2017-03-01 | 上海贝尔股份有限公司 | The method and apparatus of SINR threshold value when determining that between MIMO mode, switching occurs |
| WO2018060089A1 (en) * | 2016-09-29 | 2018-04-05 | British Telecommunications Public Limited Company | Network range and connectivity improvenment |
| CN109089277A (en) * | 2018-09-10 | 2018-12-25 | 中国联合网络通信集团有限公司 | Networking appraisal procedure and device based on ergodic data |
Non-Patent Citations (5)
| Title |
|---|
| Effects of SINR estimation errors on the DL cell throughput of an LTE system in different environments;Gerald Ostermayer等;《2013 IEEE 11th Malaysia International Conference on Communications (MICC)》;20140428;全文 * |
| LTE-A中CoMP场景化配置策略;江海波等;《广东通信技术》;20140915(第09期);全文 * |
| R4-150932 "Analysis on EIRP accuracy on system throughput";Huawei;《3GPP tsg_ran\WG4_Radio》;20150202;全文 * |
| 基于 TD-LTE 的网络优化设计与应用;郭小光;《中国优秀硕士学位论文》;20160315;全文 * |
| 基于3D MIMO解决高价值场景网络覆盖和容量的方法;邓萌等;《电信工程技术与标准化》;20180614(第06期);全文 * |
Also Published As
| Publication number | Publication date |
|---|---|
| CN110198552A (en) | 2019-09-03 |
Similar Documents
| Publication | Publication Date | Title |
|---|---|---|
| Jao et al. | WiSE: A system-level simulator for 5G mobile networks | |
| CN101626585B (en) | Network interference evaluation method, dynamic channel distribution method and equipment in wireless network | |
| CN110383874A (en) | Distributed FD-MIMO: Cellular Evolution to 5G and Beyond 5G | |
| CN105307258B (en) | It is a kind of adjust pilot reference signal transmission power method and base station | |
| EP2689627A1 (en) | Performing coordinated multipoint transmission and reception (comp) in a wireless communication network | |
| CN105379390B (en) | A method and device for MBSFN configuration | |
| CN102026259A (en) | System level simulation method for CoMP (coordinated multi-point) technique in LTE-A (long term evolution-advanced) system | |
| KR20130094343A (en) | Multi-layer beamforming with partial channel state information | |
| CN110198552B (en) | Method and device for calculating downlink throughput | |
| CN115362637B (en) | Report on channel statistics used for beam management | |
| CN110312281B (en) | Method and device for calculating downlink throughput of communication cell | |
| Hamid et al. | Coverage and capacity analysis of LTE radio network planning considering Dhaka city | |
| WO2014114106A1 (en) | Uplink data reception method and apparatus for wireless transceiving device | |
| CN110167057B (en) | A method and device for calculating downlink throughput | |
| WO2024060045A1 (en) | Antenna switching diversity techniques in wireless communications | |
| US20240323756A1 (en) | User equipment, electronic device, wireless communication method and storage medium | |
| CN110312280B (en) | A method and device for calculating downlink throughput | |
| CN110337120B (en) | Method and device for calculating uplink throughput | |
| CN106254050A (en) | Extensive mimo system dynamic pilot allocation method based on large scale information | |
| EP4505818A1 (en) | Multi-dimensional channel measurement resource configuration | |
| CN110324852B (en) | Method and device for calculating uplink throughput | |
| WO2024211073A1 (en) | Group based beam report enhancement for mobility | |
| KR20250164702A (en) | Spectrum shaping and subband spectrum shaping for narrow spectrum suppression and transceiver architecture | |
| Yang et al. | Interference modeling and performance evaluation for BS MMSE-IRC receiver in LTE-A release 13 | |
| Zhao et al. | performance analysis of the multiple antenna asynchronous cognitive MAC protocol in cognitive radio network for IT convergence |
Legal Events
| Date | Code | Title | Description |
|---|---|---|---|
| PB01 | Publication | ||
| PB01 | Publication | ||
| SE01 | Entry into force of request for substantive examination | ||
| SE01 | Entry into force of request for substantive examination | ||
| GR01 | Patent grant | ||
| GR01 | Patent grant |