CN110114115B - Apparatus and method for predicting therapeutic outcome - Google Patents
Apparatus and method for predicting therapeutic outcome Download PDFInfo
- Publication number
- CN110114115B CN110114115B CN201780080419.4A CN201780080419A CN110114115B CN 110114115 B CN110114115 B CN 110114115B CN 201780080419 A CN201780080419 A CN 201780080419A CN 110114115 B CN110114115 B CN 110114115B
- Authority
- CN
- China
- Prior art keywords
- subject
- magnetic stimulation
- transcranial magnetic
- network activity
- computer processor
- Prior art date
- Legal status (The legal status is an assumption and is not a legal conclusion. Google has not performed a legal analysis and makes no representation as to the accuracy of the status listed.)
- Active
Links
Images


Classifications
-
- A—HUMAN NECESSITIES
- A61—MEDICAL OR VETERINARY SCIENCE; HYGIENE
- A61N—ELECTROTHERAPY; MAGNETOTHERAPY; RADIATION THERAPY; ULTRASOUND THERAPY
- A61N2/00—Magnetotherapy
- A61N2/004—Magnetotherapy specially adapted for a specific therapy
- A61N2/006—Magnetotherapy specially adapted for a specific therapy for magnetic stimulation of nerve tissue
-
- A—HUMAN NECESSITIES
- A61—MEDICAL OR VETERINARY SCIENCE; HYGIENE
- A61N—ELECTROTHERAPY; MAGNETOTHERAPY; RADIATION THERAPY; ULTRASOUND THERAPY
- A61N1/00—Electrotherapy; Circuits therefor
- A61N1/18—Applying electric currents by contact electrodes
- A61N1/32—Applying electric currents by contact electrodes alternating or intermittent currents
- A61N1/36—Applying electric currents by contact electrodes alternating or intermittent currents for stimulation
- A61N1/36014—External stimulators, e.g. with patch electrodes
- A61N1/36025—External stimulators, e.g. with patch electrodes for treating a mental or cerebral condition
-
- G—PHYSICS
- G16—INFORMATION AND COMMUNICATION TECHNOLOGY [ICT] SPECIALLY ADAPTED FOR SPECIFIC APPLICATION FIELDS
- G16H—HEALTHCARE INFORMATICS, i.e. INFORMATION AND COMMUNICATION TECHNOLOGY [ICT] SPECIALLY ADAPTED FOR THE HANDLING OR PROCESSING OF MEDICAL OR HEALTHCARE DATA
- G16H50/00—ICT specially adapted for medical diagnosis, medical simulation or medical data mining; ICT specially adapted for detecting, monitoring or modelling epidemics or pandemics
- G16H50/30—ICT specially adapted for medical diagnosis, medical simulation or medical data mining; ICT specially adapted for detecting, monitoring or modelling epidemics or pandemics for calculating health indices; for individual health risk assessment
-
- A—HUMAN NECESSITIES
- A61—MEDICAL OR VETERINARY SCIENCE; HYGIENE
- A61B—DIAGNOSIS; SURGERY; IDENTIFICATION
- A61B5/00—Measuring for diagnostic purposes; Identification of persons
- A61B5/0002—Remote monitoring of patients using telemetry, e.g. transmission of vital signals via a communication network
- A61B5/0004—Remote monitoring of patients using telemetry, e.g. transmission of vital signals via a communication network characterised by the type of physiological signal transmitted
- A61B5/0006—ECG or EEG signals
-
- A—HUMAN NECESSITIES
- A61—MEDICAL OR VETERINARY SCIENCE; HYGIENE
- A61B—DIAGNOSIS; SURGERY; IDENTIFICATION
- A61B5/00—Measuring for diagnostic purposes; Identification of persons
- A61B5/16—Devices for psychotechnics; Testing reaction times ; Devices for evaluating the psychological state
- A61B5/165—Evaluating the state of mind, e.g. depression, anxiety
-
- A—HUMAN NECESSITIES
- A61—MEDICAL OR VETERINARY SCIENCE; HYGIENE
- A61B—DIAGNOSIS; SURGERY; IDENTIFICATION
- A61B5/00—Measuring for diagnostic purposes; Identification of persons
- A61B5/16—Devices for psychotechnics; Testing reaction times ; Devices for evaluating the psychological state
- A61B5/168—Evaluating attention deficit, hyperactivity
-
- A—HUMAN NECESSITIES
- A61—MEDICAL OR VETERINARY SCIENCE; HYGIENE
- A61B—DIAGNOSIS; SURGERY; IDENTIFICATION
- A61B5/00—Measuring for diagnostic purposes; Identification of persons
- A61B5/24—Detecting, measuring or recording bioelectric or biomagnetic signals of the body or parts thereof
- A61B5/25—Bioelectric electrodes therefor
- A61B5/279—Bioelectric electrodes therefor specially adapted for particular uses
- A61B5/291—Bioelectric electrodes therefor specially adapted for particular uses for electroencephalography [EEG]
-
- A—HUMAN NECESSITIES
- A61—MEDICAL OR VETERINARY SCIENCE; HYGIENE
- A61B—DIAGNOSIS; SURGERY; IDENTIFICATION
- A61B5/00—Measuring for diagnostic purposes; Identification of persons
- A61B5/24—Detecting, measuring or recording bioelectric or biomagnetic signals of the body or parts thereof
- A61B5/30—Input circuits therefor
-
- A—HUMAN NECESSITIES
- A61—MEDICAL OR VETERINARY SCIENCE; HYGIENE
- A61B—DIAGNOSIS; SURGERY; IDENTIFICATION
- A61B5/00—Measuring for diagnostic purposes; Identification of persons
- A61B5/24—Detecting, measuring or recording bioelectric or biomagnetic signals of the body or parts thereof
- A61B5/316—Modalities, i.e. specific diagnostic methods
- A61B5/369—Electroencephalography [EEG]
- A61B5/377—Electroencephalography [EEG] using evoked responses
-
- A—HUMAN NECESSITIES
- A61—MEDICAL OR VETERINARY SCIENCE; HYGIENE
- A61B—DIAGNOSIS; SURGERY; IDENTIFICATION
- A61B5/00—Measuring for diagnostic purposes; Identification of persons
- A61B5/40—Detecting, measuring or recording for evaluating the nervous system
- A61B5/4076—Diagnosing or monitoring particular conditions of the nervous system
-
- A—HUMAN NECESSITIES
- A61—MEDICAL OR VETERINARY SCIENCE; HYGIENE
- A61B—DIAGNOSIS; SURGERY; IDENTIFICATION
- A61B5/00—Measuring for diagnostic purposes; Identification of persons
- A61B5/72—Signal processing specially adapted for physiological signals or for diagnostic purposes
- A61B5/7271—Specific aspects of physiological measurement analysis
- A61B5/7275—Determining trends in physiological measurement data; Predicting development of a medical condition based on physiological measurements, e.g. determining a risk factor
-
- A—HUMAN NECESSITIES
- A61—MEDICAL OR VETERINARY SCIENCE; HYGIENE
- A61N—ELECTROTHERAPY; MAGNETOTHERAPY; RADIATION THERAPY; ULTRASOUND THERAPY
- A61N2/00—Magnetotherapy
- A61N2/02—Magnetotherapy using magnetic fields produced by coils, including single turn loops or electromagnets
Abstract
An apparatus and method for use with a plurality of electrophysiological signal detection electrodes (14) and a transcranial magnetic stimulation device (10) are disclosed. A computer processor (16) drives the transcranial magnetic stimulation device to apply one or more pulses of transcranial magnetic stimulation to a subject. The computer processor detects an electrophysiological signal of the subject using a plurality of the electrophysiological signal detection electrodes (14) for a given time period during which one of the pulses of one or more of the transcranial magnetic stimulation is applied to the subject. The computer processor predicts a result of treating a neuropsychiatric disorder of the subject using a given therapy, at least in part, in response to the electrophysiological signal, and generates an output on an output device (18) in response to the predicted result. Other applications are also described.
Description
Cross Reference to Related Applications
The present application claims priority to U.S. provisional patent application No. 62412598 to alygon entitled "predictive treatment outcome" filed on day 10, 25 of 2016, which is incorporated herein by reference.
Fields of various embodiments of the invention
Some applications of the present invention relate to devices and methods for use with transcranial magnetic stimulation, and more particularly, to devices and methods for predicting the outcome of treatment of a condition using transcranial magnetic stimulation.
Background
Transcranial magnetic stimulation (Transcranial Magnetic Stimulation, TMS) is widely used as a research tool in studying the brain of humans and has recently been used as a tool in the treatment of neuropsychiatric disorders. Biological tissue is stimulated by a magnetic field created by passing an electrical current through an electrically conductive material located in the vicinity of the tissue. The magnetic field causes electrical conduction of brain cells and thus generates action potentials.
The magnetic stimulus is delivered or generated by a coil located on the scalp of the patient, inducing neural stimulation within the brain. Deep transcranial magnetic stimulation is described for the treatment of depression and other neuropsychiatric disorders such as autism, post-traumatic stress syndrome (Posttraumatic Stress Disorder, PTSD), addictive behaviors including smoking, eating disorders and drug addiction, schizophrenia, parkinson's disease and others. For example, a device for deep transcranial magnetic stimulation is described in International publication No. WO 0232504, which is incorporated herein by reference. The device described in international publication No. WO 0232504 includes a base having a plurality of individual windings for individual current paths and an extension designed to minimize unwanted stimulation of other areas of the brain.
Reduced excitability of the right prefrontal cortex is associated with attention deficit hyperactivity disorder (Attention Deficit Hyperactivity Disorder, ADHD). Despite its high prevalence, many patients still cannot tolerate available treatments for attention deficit hyperactivity disorder.
Summary of the embodiments
According to some applications of the invention, one or more pulses of transcranial magnetic stimulation (e.g., one or more strings of transcranial magnetic stimulation) are applied to a subject. For example, the subject may be a subject suffering from attention deficit hyperactivity disorder. An electrophysiological signal (typically, an electroencephalogram signal) of the subject is detected within a given time segment of one of the pulses of one or more of the transcranial magnetic stimulation applied to the subject. A result of treating a neuropsychiatric disorder of the subject with a given therapy is generally predicted by a computer processor at least partially in response to the electrophysiological signal.
For some applications of the invention, an electroencephalogram signal of the subject is detected. The power of a given frequency band within the detected electroencephalogram signal is calculated. For example, power for a low gamma frequency band (e.g., a frequency band from about 30 hertz to about 40 hertz) may be calculated. For some applications, the low gamma frequency band is normalized by dividing by the power of a different frequency band, such as an alpha frequency band (e.g., a frequency band from about 8 hertz to about 15 hertz). The outcome of treating a neuropsychiatric disorder of the subject using a given therapy is predicted based at least in part on the power of the given frequency band.
For some applications, a plurality of activity-related features are identified in the electroencephalogram signal, and a brain network activity (Brain Network Activity, BNA) pattern is constructed based on the plurality of features. The brain network activity pattern generally includes a plurality of nodes and a connectivity weight, each of the nodes representing a feature of a plurality of the activity-related features, and the connectivity weight being assigned to each pair of nodes.
For some applications, pulses of a plurality of transcranial magnetic stimuli are transmitted to an electroencephalographic system (or to a processor that receives and processes electroencephalographic signals) and are used to identify evoked responses in the brain. For some applications, the evoked response is used to identify a plurality of activity related features, and to construct a brain network activity pattern.
For some applications, the plurality of nodes of the brain network activity pattern represent a plurality of clusters of a plurality of vectors of a plurality of data features. According to some applications of the invention, each vector of each data characteristic of each cluster corresponds to data obtained from a different subject. Alternatively, the vectors of all data features correspond to data obtained from the same subject, but in response to stimulation by a separate transcranial magnetic stimulation.
According to some applications of the present invention, a connectivity weight includes a weight index calculated based on an attribute of at least one cluster selected from the group consisting of: (i) a plurality of vectors in a corresponding pair of clusters; (ii) A variability between a plurality of vectors in the respective clusters; (iii) A width of a plurality of time windows associated with each cluster of the respective pair of clusters; (iv) Separating a difference in a latency of the respective pair of clusters, wherein the latency is a time of pulse application relative to the transcranial magnetic stimulation; (v) Amplitude of a signal associated with the respective pair of clusters; (vi) A frequency of a signal associated with the respective pair of clusters; (vii) defining a width of a spatial window of a plurality of said clusters.
Thus, according to some applications of the present invention, there is provided an apparatus for use with a device of a plurality of electrophysiological signal detection electrodes and a transcranial magnetic stimulation device, the apparatus comprising:
an output device; and
a computer processor configured to:
driving the transcranial magnetic stimulation device to apply one or more pulses of transcranial magnetic stimulation to a subject;
Detecting an electrophysiological signal of the subject using a plurality of the electrophysiological signal detection electrodes for a given time period in which one of the one or more pulses of transcranial magnetic stimulation is applied to the subject;
predicting a result of treating a neuropsychiatric disorder of the subject with a given therapy at least partially in response to the electrophysiological signal; and
an output is generated on the output device in response to the predicted result.
In some applications, the computer processor is configured to predict the outcome of treating the neuropsychiatric disorder of the subject using the given therapy in a manner that: predicting a result of treating depression in the subject using transcranial magnetic stimulation.
In some applications, the computer processor is configured to predict the outcome of treating the neuropsychiatric disorder of the subject using the given therapy in a manner that: predicting a result of treating major depressive disorder in the subject using transcranial magnetic stimulation.
In some applications, the computer processor is configured to predict the outcome of treating the neuropsychiatric disorder of the subject using the given therapy in a manner that: a result of treating attention deficit hyperactivity disorder (Attention Deficit Hyperactivity Disorder, ADHD) in the subject using transcranial magnetic stimulation is predicted.
In some applications, the computer processor is configured to detect the electrophysiological signal of the subject in a manner that: detecting an electroencephalogram signal of the subject within the given time segment in which one of the pulses of one or more of the transcranial magnetic stimulation is applied to the subject.
In some applications, the computer processor is configured to predict the outcome of treating the neuropsychiatric disorder of the subject using the given therapy in a manner that: predicting a response time for treating the subject with the given therapy.
In some applications, the computer processor is configured to predict the outcome of treating the neuropsychiatric disorder of the subject using the given therapy in a manner that: predicting an improvement rate of the neuropsychiatric disorder of the subject in response to treatment with the given therapy.
In some applications:
the computer processor is further configured to detect an electroencephalogram signal of the subject while the subject is performing a task, and
the computer processor is configured to predict the outcome of treating the neuropsychiatric disorder of the subject using the given therapy based on the electrophysiological signal of the subject and a component of the electroencephalographic signal of the subject detected when the subject performs the task.
In some applications, the configuration of the computer processor configured to drive the transcranial magnetic stimulation device to apply one or more pulses of the transcranial magnetic stimulation to the subject is: the transcranial magnetic stimulation device is driven to apply one or more strings of transcranial magnetic stimulation to the subject.
In some applications, the computer processor is configured to detect the electrophysiological signal of the subject in a manner that: the electrophysiological signal of the subject is detected when one or more strings of the transcranial magnetic stimulation is applied to the subject.
In some applications, the computer processor is configured to detect the electrophysiological signal of the subject in a manner that: the electrophysiological signal of the subject is detected between a plurality of transcranial magnetic stimulation applied to the subject.
In some applications, the computer processor is further configured to construct a brain network activity pattern based on the electrophysiological signal, and the computer processor is configured to predict the outcome of treating the neuropsychiatric disorder of the subject using the given therapy based on the brain network activity pattern.
In some applications, the computer processor is further configured to calculate a brain network activity pattern similarity score by comparing the brain network activity pattern to a population of brain network activity patterns based on a number of electrophysiological signals acquired from a population of subjects, and the computer processor is configured to predict the outcome of treating the neuropsychiatric disorder of the subject using the given therapy based on the brain network activity pattern similarity score.
In some applications, the computer processor is configured to construct the brain network activity pattern by constructing a brain network activity pattern comprising:
a plurality of nodes, each node representing a comparison of a plurality of features and a plurality of relationships between a plurality of features in the electrophysiological signal and a plurality of features and a plurality of relationships between a plurality of features of reference neurophysiologic data; and
a plurality of connectivity weights assigned to each pair of the nodes.
In some applications, the computer processor is configured to construct the brain network activity pattern in a configuration that is: a brain network activity pattern is constructed by using a plurality of electrophysiological signals acquired from a population of subjects as the reference neurophysiologic data.
In some applications, the computer processor is configured to construct the brain network activity pattern in a configuration that is: a brain network activity pattern is constructed by using a plurality of electrophysiological signals acquired from a population of subjects, each of which is applied with an initial pulse of transcranial magnetic stimulation, as the reference neurophysiologic data.
In some applications, the computer processor is configured to construct the brain network activity pattern by constructing a brain network activity pattern in which each of the nodes represents a cluster of vectors of a plurality of data features, and the connectivity weights of each respective one of the nodes represent attributes of at least one cluster describing a pair of clusters represented by the respective pair of nodes.
In some applications, the computer processor is configured to construct a brain network activity pattern by constructing the brain network activity pattern, wherein the attribute of at least one of the clusters in the brain network activity pattern includes a latency difference separating the pair of clusters.
In some applications, the computer processor is further configured to calculate a power of a given frequency band within the detected electrophysiological signal, and the computer processor is configured to predict the outcome of treating the neuropsychiatric disorder of the subject using the given therapy, at least in part in response to the power of the given frequency band.
In some applications:
the computer processor is further configured to calculate a plurality of powers of one or more additional frequency bands within the detected electrophysiological signal, and
the computer processor is configured to predict the outcome of treating the neuropsychiatric disorder of the subject using the given therapy based on a combination of the power of the given frequency band and a plurality of the powers of one or more of the additional frequency bands.
In some applications, the computer processor is configured to predict the outcome of treating the neuropsychiatric disorder of the subject using the given therapy based on a ratio of the power of the given frequency band to the power of one of the one or more additional frequency bands.
In some applications, the computer processor is configured to detect the electrophysiological signal of the subject in a manner that: detecting an electroencephalogram signal of the subject within the given time segment in which one of the pulses of one or more of the transcranial magnetic stimulation is applied to the subject.
In some applications, the computer processor is configured to calculate the power of the given frequency band within the detected electrophysiological signal by calculating a power of a low gamma band within the detected electroencephalographic signal.
In some applications:
the computer processor is further configured to calculate a power of an alpha band within the detected electroencephalogram signal, and
the computer processor is configured to predict the outcome of treating the neuropsychiatric disorder of the subject using the given therapy based on a combination of the power of the low gamma band within the detected electroencephalogram signal and the power of the alpha band within the detected electroencephalogram signal.
In some applications, the computer processor is configured to predict the outcome of treating the neuropsychiatric disorder of the subject using the given therapy based on a ratio of the power of the low gamma band within the detected electroencephalogram signal to the power of the alpha band within the detected electroencephalogram signal.
According to some applications of the present invention, there is also provided a computer software product for use with an output device, a plurality of electrophysiological signal detection electrodes, and a craniomagnetic stimulation device, the computer software product comprising a non-transitory computer readable medium storing instructions of a plurality of programs, the computer performing steps when a plurality of the instructions are read by a computer, comprising:
Driving the transcranial magnetic stimulation device to apply one or more pulses of transcranial magnetic stimulation to a subject;
detecting an electrophysiological signal of the subject using a plurality of the electrophysiological signal detection electrodes for a given time period in which one of the one or more pulses of transcranial magnetic stimulation is applied to the subject;
predicting a result of treating a neuropsychiatric disorder of the subject with a given therapy at least partially in response to the electrophysiological signal; and
an output is generated on the output device in response to the predicted result.
According to some applications of the present invention there is also provided a method comprising:
applying one or more pulses of transcranial magnetic stimulation to a subject;
detecting an electrophysiological signal of the subject for a given time period in which one of the pulses of one or more of the transcranial magnetic stimulation is applied to the subject;
a result of treating a neuropsychiatric disorder of the subject with a given therapy is predicted, at least in part, in response to the detected electrophysiological signal.
The invention will be more fully understood from the following detailed description of various embodiments of the invention, taken together with the accompanying drawings, in which:
Drawings
FIG. 1 is a schematic diagram showing the use of a plurality of electrodes to detect an electrophysiological signal, such as an electroencephalogram signal, of a subject while a transcranial magnetic stimulation device is applying transcranial magnetic stimulation to the subject according to some applications of the present invention;
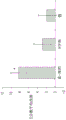
FIG. 2 is a bar graph showing the response of the right prefrontal cortex of a patient with multiple attention deficit hyperactivity disorders by various types of transcranial magnetic stimulation in accordance with certain applications of the present invention;
FIGS. 3A, 3B and 3C are graphs calculated according to some applications of the present invention showing the correlation between T scores of patients with multiple attention deficit hyperactivity disorders and T scores of multiple healthy subjects and various indicators;
FIG. 4 illustrates an electroencephalogram record of a subject in a treatment from which 2 second segments are sampled, in accordance with some applications of the present invention;
FIG. 5 is a graph showing the degree of correlation between (a) improvement in T score of a patient and (b) power of individual frequency components of 2 second interval electroencephalogram samples recorded during an initial treatment for a plurality of transcranial magnetic stimulated subjects at applied depths, in accordance with some applications of the present invention;
FIGS. 6A, 6B and 6C are graphs showing the relationship between improvement in T score of a plurality of patients with attention deficit hyperactivity disorder and power in the alpha band of an electroencephalogram recorded during a treatment of a first day of a treatment, the plurality of patients being treated with a dummy coil (FIG. 6A), an 8-coil (FIG. 6B) and a deep transcranial magnetic stimulation coil (FIG. 6C), respectively;
FIGS. 7A, 7B and 7C are graphs showing the relationship between improvement in T score of a plurality of patients with attention deficit hyperactivity disorder and power in the beta band of an electroencephalogram recorded during a treatment of a first day of a treatment, the plurality of patients being treated with a dummy coil (FIG. 7A), an 8-shaped coil (FIG. 7B) and a deep transcranial magnetic stimulation coil (FIG. 7C), respectively;
FIGS. 8A, 8B and 8C are graphs showing the relationship between improvement in T score and low gamma band power of an electroencephalogram in a treatment recorded on a first day of a treatment for a plurality of attention deficit hyperactivity disorder patients treated with a pseudocoil (FIG. 8A), a figure 8 coil (FIG. 8B) and a deep transcranial magnetic stimulation coil (FIG. 8C), respectively;
FIGS. 9A, 9B and 9C are graphs showing the relationship between improvement in T score of a plurality of patients suffering from attention deficit hyperactivity disorder and the ratio of the power in the low gamma frequency band of an electroencephalogram to the power in the alpha frequency band of an electroencephalogram record in a treatment recorded on a first day of a treatment, the plurality of patients being treated with a pseudo coil (FIG. 9A), an 8-coil (FIG. 9B) and a deep transcranial magnetic stimulation coil (FIG. 9C), respectively;
FIG. 10A is a schematic diagram showing a representative example of a brain network activity pattern that may be extracted from electroencephalographic data in accordance with some applications of the present invention;
FIG. 10B illustrates a representation of a time of occurrence of each single event within an electroencephalogram signal of each subject in accordance with some applications of the present invention; and
FIGS. 10C, 10D and 10E show respective examples of pairs of nodes and respective edges of a brain network activity pattern according to some applications of the present invention;
FIG. 11A is a graph showing the degree of correlation between (a) improvement of the Hamiltonian depression scale (Hamilton depression rating scale, HDRS) and treatment of patients with major depressive disorder following treatment with transcranial magnetic stimulation at a depth of four weeks and (b) bias values for intra-cortical suppression transcranial magnetic stimulation evoked potentials (Long Interval Cortical Inhibition TMS-evoked potentials, LICI-TEP) corresponding to the difference between a single pulse recorded prior to the initiation of a first day of treatment of a treatment and a pair of second pulses, for patients with major depressive disorder with transcranial magnetic stimulation at a depth of multiple applied depths, in accordance with some applications of the present invention;
FIG. 11B is a graph showing the degree of correlation between (a) improvement in the Hamiltonian depression scale of patients after treatment with transcranial magnetic stimulation at a depth of four weeks and (B) inhibition of the bias value of transcranial magnetic stimulation evoked potential in the long interval cortex resulting from a single pulse recorded prior to initiation of treatment on the first day of treatment, for patients with major depression with transcranial magnetic stimulation at a plurality of applied depths, in accordance with some applications of the present invention;
FIGS. 12A and 12B are graphs showing the degree of correlation between (a) improvement in the Hamiltonian depression scale of a patient after treatment with transcranial magnetic stimulation at a depth of four weeks and (B) power of individual frequency components of 13 second intervals of an electroencephalogram sample recorded on indicated electroencephalogram electrodes before beginning treatment in the first stage, FIG. 12A corresponding to a high frequency wave (20-40 hertz) of electrode position F7, and FIG. 12B corresponding to a low gamma wave (30-40 hertz) of electrode position F7, for patients with major depression with transcranial magnetic stimulation at a plurality of applied depths, according to some applications of the present invention;
FIG. 13A is a graph showing the relationship between (a) percent improvement in the Hamiltonian depression scale for patients with major depression after three weeks of treatment and (b) brain network activity similarity scores for patients compared to brain network activity for a plurality of healthy subjects and generated from single pulse transcranial magnetic stimulation evoked potentials recorded prior to initiation of treatment, in accordance with some applications of the present invention;
FIG. 13B is a graph showing the relationship between (a) a similarity score for brain network activity of a patient with major depression resulting from a single-pulse transcranial magnetic stimulation evoked potential compared to the brain network activity of a patient with major depression and (B) the patient's Hamiltonian depression scale, in accordance with some applications of the present invention;
FIGS. 14A and 14B are graphs showing the relationship between (a) the time to each percentage improvement from a pre-treatment baseline in the Hamiltonian depression scale of a patient after initiation of deep transcranial magnetic stimulation therapy for a plurality of major depressive patients and (B) the power of each frequency component of a 13 second interval electroencephalogram sample recorded on each electroencephalogram electrode prior to initiation of therapy, in accordance with some applications of the present invention; and
15A, 15B and 15C are flowcharts illustrating steps performed by a computer processor according to some applications of the present invention.
Detailed Description
Referring now to fig. 1, fig. 1 is a schematic diagram illustrating the detection of an electrophysiological signal of a subject, such as an electroencephalogram signal of the subject, using a plurality of electrodes 14 while a transcranial magnetic stimulation device 10 is applying transcranial magnetic stimulation to the subject 12, according to some applications of the present invention. Typically, the transcranial magnetic stimulation device and a plurality of the electrodes are operatively coupled to one or more computer processors 16. Typically, a user inputs data into the computer processor and/or receives data from the computer processor through one or more user interface devices. For example, as shown in FIG. 1, the computer processor may generate an output to the user via an output device (e.g., a fluorescent screen 18).
According to some applications of the present invention, one or more pulses of transcranial magnetic stimulation (e.g., a train of pulses including a plurality of pulses) are applied to a subject. For example, the subject may be a subject suffering from attention deficit hyperactivity disorder (Attention Deficit Hyperactivity Disorder, ADHD). An electrophysiological signal (typically, an electroencephalogram signal) of the subject is detected within a given time segment of one of the pulses of one or more of the transcranial magnetic stimulation applied to the subject. A result of treating a neuropsychiatric disorder of the subject with a given therapy is predicted, at least in part, in response to the electrophysiological signal.
The pulses of transcranial magnetic stimulation may be applied according to any protocol known in the art, including but not limited to one or more of known repetitive transcranial magnetic stimulation, long-interval intracortical suppression (Long Interval Cortical Inhibition, LICI), short-interval intracortical suppression (Short Interval Cortical Inhibition, SICI), contralateral cortical resting phase (Contralateral Cortical Silent Period, CSP), paired pulse transcranial magnetic stimulation, and repetitive paired pulse transcranial magnetic stimulation. Any commercially available transcranial magnetic stimulation device known in the art may be used.
For some applications of the invention, an electroencephalogram signal of the subject is detected. The power of a given frequency band within the detected electroencephalogram signal is calculated. For example, a low gamma band (e.g., a band from about 30 Hz (e.g., 30 Hz plus/minus 5 Hz) to about 40 Hz (e.g., 40 Hz plus/minus 5 Hz) may be calculated. For some applications, the low gamma frequency band is normalized by dividing by the power of a different frequency band, such as an alpha frequency band (e.g., a frequency band from about 8 hertz (e.g., 8 hertz plus/minus 2 hertz) to about 15 hertz (e.g., 15 hertz plus/minus 3 hertz)). The outcome of treating a neuropsychiatric disorder of the subject using a given therapy is predicted, at least in part, in response to the power of the given frequency band.
A plurality of pulses of the transcranial magnetic stimulation may be transmitted to the electroencephalographic system (or to a computer processor, such as computer processor 16, which receives and processes the electroencephalographic signals). For some of the applications, the electroencephalographic signal is analyzed to extract event related measurements, such as event related potentials or event related magnetic fields. A plurality of the measurements may define evoked responses in a plurality of brains and a plurality of the evoked responses may be used to identify activity related characteristics and to construct a brain network activity pattern. For some applications, time stamps in the plurality of electroencephalographic signals are synchronized with stimulation provided by pulses of the plurality of transcranial magnetic stimulation to establish a timeline of responses, and a plurality of data features are extracted in response to the timeline. Typically, but not necessarily, the collection of the electroencephalographic signals is ongoing such that the signals are continuously collected before, during and/or after stimulation with the transcranial magnetic stimulation.
For some applications, the electroencephalogram signals are analyzed immediately after acquisition ("on-line analysis"), and/or recorded and stored, and then analyzed ("off-line analysis").
Referring now to fig. 2, a bar graph showing the response of a plurality of attention deficit hyperactivity disorder patients to stimulation of the right prefrontal cortex using the following patterns: (a) a depth transcranial magnetic stimulation coil, (b) a splayed transcranial magnetic stimulation coil, and (c) a pseudo-transcranial magnetic stimulation coil. A plurality of attention deficit hyperactivity disorder patients are determined to have attention deficit hyperactivity disorder by a standard test, such as a Conner adult attention deficit hyperactivity disorder assessment scale.
The leftmost bar of the bar graph of fig. 2 shows the results of treating a group of 15 attention deficit hyperactivity disorder patients using a depth of transcranial magnetic stimulation coils. A plurality of such patients are stimulated using a coil configured to apply transcranial magnetic stimulation of depth, such as described in US 7407478 of Zangen, US 8608634 of Zangen, and/or US 20140235928 of Zangen, all of which are incorporated herein by reference. Each patient was treated 15 times daily and 5 times daily per week over a period of 3 weeks. In the daily treatment applied to each patient, 40 stimulation strings were applied to the right prefrontal cortex. Each string has a duration of 2 seconds with an inter-string spacing of 20 seconds between each string. The stimulus is applied at a frequency of 18 hz.
As shown, on average, stimulation by transcranial magnetic stimulation at this depth resulted in a T score increase 8,T score for multiple patients as measured according to the adult attention deficit hyperactivity disorder rating scale of Conner. A p-value of the above results was less than 0.05.
The middle bar of the bar graph of fig. 2 shows the results of treating a group of 11 attention deficit hyperactivity disorder patients with a 8-shaped stimulation coil. A plurality of the patients are treated using a treatment regimen substantially similar to the regimen described above. As shown, stimulation using the figure 8 coil resulted in an average improvement in T-score for a plurality of the patients that was lower than for a plurality of patients stimulated using a depth transcranial magnetic stimulation coil.
The rightmost bar of the bar graph of fig. 2 shows the results of treating a group of 12 attention deficit hyperactivity disorder patients with a coil of transcranial magnetic stimulation. A plurality of the patients are treated using a treatment regimen substantially similar to the regimen described above. As shown, stimulation using the dummy coil resulted in an average improvement in T-score for a plurality of the patients that was lower than the average improvement in T-score measured for a plurality of the patients stimulated with a deep transcranial magnetic stimulation coil.
The results shown in fig. 2 indicate that applying deep transcranial magnetic stimulation to the prefrontal cortex may be a suitable treatment for at least some attention deficit hyperactivity disorder patients.
In connection with the treatment described above, electroencephalogram records are obtained from a plurality of patients before, during, and after the first and last days of treatment. In addition, electroencephalographic recordings are acquired during (a) a stop signal task and after (b) a single pulse of transcranial magnetic stimulation is applied to the right prefrontal cortex using a figure 8 coil.
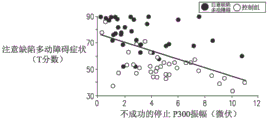
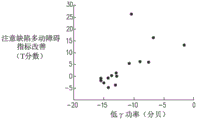
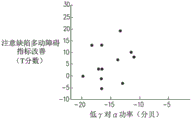
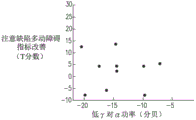
Referring now to fig. 3A-C, which are graphs showing the correlation between T scores for a plurality of attention deficit hyperactivity disorder patients and T scores for a plurality of healthy subjects and various indicators, according to some applications of the present invention;
at baseline (i.e., prior to the application of repeated transcranial magnetic stimulation), event-related potentials for a plurality of attention deficit hyperactivity disorder patients were recorded during the signal cessation task. As a control group, event-related potentials for a plurality of healthy subjects were also recorded during similar stop signal tasks. As a result, it was found that there was a difference between the amplitudes of the components of the event-related potential for the plurality of attention deficit hyperactivity disorder patients and the amplitudes of the components of the event-related potential for the plurality of healthy subjects for successful and unsuccessful cessation. For example, the lower amplitudes of the N200 and P300 components recorded during the stop signal task are significantly lower in attention deficit hyperactivity disorder patients compared to healthy subjects.
Referring now to fig. 3A, there is a graph indicating the relationship between T scores of a plurality of attention deficit hyperactivity disorder patients and a plurality of healthy subjects and P300 amplitudes recorded during unsuccessful stop signal tasks performed by the plurality of patients/plurality of subjects. The P300 amplitude was recorded by the frontal center electrode and the top lobe electrode. As shown, there is a correlation between the T-score and the P300 amplitude, with a correlation coefficient of-0.51.
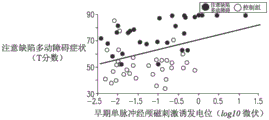
In addition to the above, a single pulse of transcranial magnetic stimulation was applied to the right prefrontal cortex of a plurality of attention deficit hyperactivity disorder patients and a plurality of healthy subjects using a figure 8 coil, after which electroencephalogram signals of a plurality of the patients/subjects were recorded. The patient with attention deficit hyperactivity disorder was found to have a lower transcranial magnetic stimulation evoked potential than the healthy subject.
Referring now to fig. 3B, a graph is shown indicating the relationship between T scores and transcranial magnetic stimulation evoked potentials for a plurality of attention deficit hyperactivity disorder patients and a plurality of healthy subjects. As shown, there is a correlation between the T-score and the transcranial magnetic stimulation evoked potential, with a correlation coefficient of-0.39. (Note that in FIG. 3B, the correlation between T scores and transcranial magnetic stimulation evoked potentials for multiple attention deficit hyperactivity disorder patients and multiple healthy subjects appears to be positive, but because the transcranial magnetic stimulation evoked potentials are negative and are measured using a logarithmic scale.)
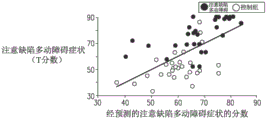
Referring now to fig. 3C, which is a graph indicating the correlation between T scores of a plurality of attention deficit hyperactivity disorder patients and a plurality of healthy subjects and a predicted attention deficit hyperactivity disorder symptom score based on both: (a) P300 amplitude recorded during unsuccessful stop signal tasks performed by a plurality of said patients/subjects (indicated in fig. 3A), and (B) transcranial magnetic stimulation evoked potentials in a plurality of said patients/subjects in a multiple regression model (indicated in fig. 3B). As shown, there is a correlation between the T score and the attention deficit hyperactivity disorder index, and the correlation coefficient is 0.61.
In view of the results shown in fig. 3A-C, for some applications of the present invention, transcranial magnetic stimulation is applied to a subject suspected of having attention deficit hyperactivity disorder. Typically, the transcranial magnetic stimulation is applied to at least the right prefrontal cortex of the subject. An electroencephalogram of the subject is detected at a given time interval following stimulation of the transcranial magnetic stimulation. Determining whether the subject has attention deficit hyperactivity disorder at least partially in response to a characteristic of the transcranial magnetic stimulation-induced electroencephalogram signal, and/or calculating an attention deficit hyperactivity disorder score for the subject. For some applications, in addition to transcranial magnetic stimulation evoked potentials, event-related potentials are measured during a stop signal task performed by the subject. At least partially in response to: (a) A feature of transcranial magnetic stimulation-induced electroencephalogram signals, and (b) a component of the event-related potential measured during a stop signal task, determining whether the subject has attention deficit hyperactivity disorder, and/or calculating an attention deficit hyperactivity disorder score for the subject.
Referring now to fig. 4, there is shown an electroencephalogram record in a treatment of a subject in accordance with some applications of the present invention. The record is from a subject suffering from attention deficit hyperactivity disorder and is recorded when the subject receives deep transcranial magnetic stimulation according to the stimulation protocol described above, with reference to fig. 2. As described above, 40 stimulation strings were applied to the right prefrontal cortex of the subject in each daily treatment. Each string has a duration of 2 seconds with an inter-string spacing of 20 seconds between each string. During the treatment described above, a plurality of electroencephalogram measurements are recorded from the subject.
The electroencephalographic recordings from multiple inter-string intervals are sampled in a 2 second segment. The 2 second segment is sampled at least 1 second after passing from the end of a previous transcranial magnetic stimulation string to reduce the effect of direct artifacts of stimulation of the depth transcranial magnetic stimulation on the electroencephalographic signal. An example of such a sampling is shown in fig. 4, which shows a 2 second segment sampled about 1 second after the end of the previous transcranial magnetic stimulation string. (although the 2 second interval shown in FIG. 4 is shown as beginning 1 second after the end of the transcranial magnetic stimulation string at the previous depth, the characteristics of the electroencephalogram samples described below are also shown by the samples sampled at the inter-string interval, however after a longer period of time has elapsed after the end of the transcranial magnetic stimulation string at the previous depth.)
As described above with reference to fig. 2, transcranial magnetic stimulation (using a depth transcranial magnetic stimulation coil, a figure 8 coil, or a pseudocoil) was applied to a plurality of attention deficit hyperactivity disorder patients for 15 days. Electroencephalogram signals in treatment of a plurality of the patients are recorded on days 1, 8 and 15 of the application of the transcranial magnetic stimulation. The electroencephalogram signal in the plurality of treatments is sampled at 2 second intervals as shown in fig. 4, and the plurality of samples are subjected to spectral analysis to calculate the power of each frequency component within the plurality of samples. At the end of the treatment, T-scores of a plurality of the patients are measured to measure responsiveness of the plurality of the patients to the transcranial magnetic stimulation treatment. The responsiveness of a plurality of the patients to the treatment is then compared to the power of the individual frequency components of a plurality of 2 second interval electroencephalogram samples recorded during the first treatment session (i.e., recorded during the transcranial magnetic stimulation applied on the first day of treatment).
Referring now to fig. 5, there is a graph showing the degree of correlation between (a) improvement in T scores for a plurality of patients and (b) power of individual frequency components of 2 second interval electroencephalogram samples recorded at the FC4 electroencephalogram electrode during the first treatment period, for a plurality of transcranial magnetic stimulated attention deficit hyperactivity disorder patients of applied depth. As shown, there is a correlation between the many frequency components of the 2 second interval electroencephalogram samples recorded during the first treatment session and the improvement in T scores for multiple patients. Notably, although a plurality of electroencephalographic signals sampled and spectrally analyzed were recorded during the first treatment session of a three-week treatment session, the graph shown in fig. 5 shows that certain frequency components of the sample have a correlation with responsiveness of a plurality of patients to treatment, which is measured after the three-week treatment session.
The graph shown in fig. 5 illustrates that an electrophysiological signal recorded for a subject over a given time period after transcranial magnetic stimulation is applied to the subject can be used as an indicator of responsiveness to treat a neuropsychiatric disorder in the subject using a given therapy. Thus, for some applications of the present invention, computer processor 16 (FIG. 1) drives transcranial magnetic stimulation device 10 to apply one or more pulses of transcranial magnetic stimulation (e.g., one or more strings) to a subject. The computer processor detects an electrophysiological signal of the subject using the electrophysiological signal detection electrode 14 during a given time period in which one of a plurality of pulses of the transcranial magnetic stimulation is applied to the subject. In response, at least in part, to the electrophysiological signal, the computer processor predicts a result of treating a neuropsychiatric disorder of the subject using a given therapy. For some applications, the computer processor generates an output on an output device (e.g., fluorescent screen 18) in response to the predicted result. For example, an electroencephalogram signal of a patient suffering from attention deficit hyperactivity disorder may be recorded within a given time period after or during the application of a transcranial magnetic stimulation string of transcranial magnetic stimulation or depth to the subject. In response thereto, responsiveness of the patient to treat attention deficit hyperactivity disorder of the patient using transcranial magnetic stimulation or deep transcranial magnetic stimulation is predicted.
In electroencephalogram spectrum analysis, a frequency range of about 8 hertz (e.g., 8 hertz plus/minus 2 hertz) to about 15 hertz (e.g., 15 hertz plus/minus 3 hertz) is described as an α -band, a frequency range of about 15 hertz (e.g., 15 hertz plus/minus 3 hertz) to about 30 hertz (e.g., 30 hertz plus/minus 5 hertz) is described as a β -band, and a frequency range of about 30 hertz (e.g., 30 hertz plus/minus 5 hertz) to about 100 hertz (e.g., 100 hertz plus/minus 10 hertz) is described as a γ -band. These classifications are represented on the graph shown in fig. 5. In the context of the present application, a frequency range of about 30 hertz (e.g., 30 hertz plus/minus 5 hertz) to about 40 hertz (e.g., 40 hertz plus/minus 5 hertz) is further categorized as a low gamma band.
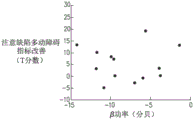
Referring now to fig. 6A-C, which are graphs showing the relationship between improvement in T scores of a plurality of attention deficit hyperactivity disorder patients and power of the alpha band of an electroencephalogram in a treatment recorded on FC4 electroencephalogram electrodes on the first day of a treatment, a plurality of patients treated with a pseudocoil (fig. 6A), an 8-shaped coil (fig. 6B) and a deep transcranial magnetic stimulation coil (fig. 6C), respectively, were sampled as described above.
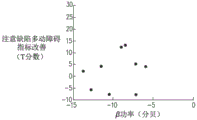
Referring also to fig. 7A-C, which are graphs showing the relationship between improvement in T scores of a plurality of attention deficit hyperactivity disorder patients and power of beta bands of an electroencephalogram in a treatment recorded on FC4 electroencephalogram electrodes on a first day of the treatment, a plurality of patients treated with a pseudocoil (fig. 7A), an 8-shaped coil (fig. 7B), and a deep transcranial magnetic stimulation coil (fig. 7C), respectively, were sampled as described above.
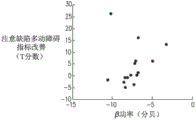
Referring additionally to fig. 8A-C, which are graphs showing the relationship between improvement in T scores of a plurality of attention deficit hyperactivity disorder patients and power in the low gamma frequency band of an electroencephalogram in a treatment recorded on FC4 electroencephalogram electrodes on the first day of a treatment, a plurality of patients treated with a pseudocoil (fig. 8A), a figure 8-shaped coil (fig. 8B) and a deep transcranial magnetic stimulation coil (fig. 8C), respectively, were sampled as described above.
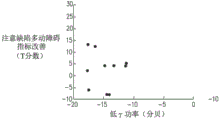
Referring further to fig. 9A-C, which are graphs showing the relationship between (a) improvement in T scores of a plurality of attention deficit hyperactivity disorder patient patients and (b) low gamma band power of an in-treatment electroencephalogram recorded on FC4 electroencephalogram electrodes on a first day of treatment, a plurality of patients treated with a pseudocoil (fig. 9A), an 8-coil, and a deep transcranial magnetic stimulation coil (fig. 9C), respectively, were sampled as described above and normalized by alpha band power using a decibel measurement.
It can be observed that when a patient is treated with a depth of transcranial magnetic stimulation coils (corresponding to the graphs shown in fig. 6C, 7C and 8C), then at each frequency band there is a degree of correlation between the power of the frequency band of the first day of treatment and the improvement in T-score of a plurality of said patients after treatment. In contrast, when a patient is treated with a dummy transcranial magnetic stimulation coil or a figure 8 transcranial magnetic stimulation coil (corresponding to the graphs shown in figures 7A-B, 7A-B and 8A-B), then at each frequency band there is no correlation between the frequency band power of the first day of treatment and the improvement in T-score for a plurality of the patients after treatment.
Further, by comparing fig. 9C with fig. 6C, 7C and 8C, it can be observed that when stimulation is performed using a depth of transcranial magnetic stimulation coils, the improved correlation of the T-score exhibited by the power of the (a) low gamma band normalized by the power of the low alpha band is relatively stronger compared to the improved correlation of the T-scores exhibited by the (b) alpha band (fig. 6C), beta band (fig. 7C) and low gamma band (fig. 8C).
It was observed during the above-described experiments that, typically, when normalized by subtracting the effect of a dummy coil, stimulation using a depth of transcranial magnetic stimulation coils resulted in a high ratio of low gamma power to alpha power (e.g., up to 4 db) in the prefrontal cortex region for a plurality of electroencephalogram recordings following the stimulation. Stimulation using a figure 8 coil also results in a high ratio of low gamma to alpha power in certain areas of the brain, but with less effect than that exhibited by patients stimulated with a deep transcranial magnetic stimulation coil.
Based on the experimental results described above, for some applications of the present invention, the computer processor 16 detects an electroencephalographic signal of the subject using the electroencephalographic electrodes. The computer processor calculates power for a given frequency band within the detected electroencephalogram signal. In response, at least in part, to the power of the given frequency band, the computer processor predicts a result of treating a neuropsychiatric disorder of the subject using a given therapy. For some applications, the computer processor generates an output on an output device (e.g., fluorescent screen 18) in response to the predicted result. For example, an electroencephalogram signal of a patient suffering from attention deficit hyperactivity disorder may be recorded (e.g., after application of deep transcranial magnetic stimulation to a subject). The power of a given frequency band (e.g., alpha band or low gamma band) is calculated and in response thereto, the patient's responsiveness to treatment of the patient's attention deficit hyperactivity disorder by deep transcranial magnetic stimulation is predicted. For some applications, a mathematical operation is used to combine and/or manipulate the power of two or more frequency bands. For some applications, the power of the given frequency band is normalized by dividing the power of the given frequency band by the power of a different frequency band. For example, the low gamma frequency band may be normalized by dividing by the power of a different frequency band (e.g., an alpha frequency band). Alternatively or additionally, a different mathematical operation may be used to combine and/or manipulate the power of two or more frequency bands.
It should be noted that the results described with reference to fig. 6A-C, 7A-C, 8A-C and 9A-C indicate that a patient with attention deficit hyperactivity disorder's response to treatment with deep transcranial magnetic stimulation can be predicted based on recordings of FC4 electrodes from an electroencephalogram recorded on the first day of treatment. However, it was observed during the above experiments that there appears to be a correlation between the responsiveness of the patient to the treatment and the power of the frequency band of the electroencephalogram signal at the first day of the treatment at a plurality of positions of the electroencephalogram electrode in addition to the FC4 electrode position. Furthermore, the effect was observed during treatment with a figure 8 coil, not just with a transcranial magnetic stimulation coil of a depth. Accordingly, the scope of the present invention includes the devices and techniques described herein using any type of transcranial magnetic stimulation parameters, as well as any type of electrophysiological sensing, including electroencephalographic sensing, at any location, and mutatis mutandis.
For some applications of the present invention, the computer processor 16 detects an electrical physiological signal (typically an electroencephalogram signal) of the subject using the electrodes 14. For some applications, activity-related features are identified in the electroencephalogram signal, and a brain network activity pattern is constructed based on the plurality of features. In response, at least in part, to the brain network activity, the computer processor predicts a result of treating a neuropsychiatric disorder in the subject with a given therapy. For some applications, the computer processor generates an output on an output device (e.g., a display) responsive to the predicted result.
The concept of brain network activity patterns may be better understood with reference to fig. 10A, which is a representative example of a brain network activity pattern 20 according to some applications of the present invention, the brain network activity pattern 20 being extractable from transcranial magnetic stimulation-induced electroencephalogram signals. The brain network activity pattern 20 has a plurality of nodes 22, each representing an activity-related feature. For example, a node may represent a particular frequency band (optionally two or more particular frequency bands), optionally with a particular range of amplitudes, at a particular location and within a particular time window or latency.
Some nodes 22 are connected by a plurality of edges 24, each edge representing a causal relationship between the plurality of nodes at the ends of the respective edge. Thus, the brain network activity pattern is represented as a graph having a plurality of nodes and a plurality of edges. In some applications of the invention, the brain network activity pattern comprises a plurality of discrete nodes, wherein information about characteristics of the data is represented only by a plurality of the nodes and information about relationships between the plurality of characteristics is represented only by a plurality of the edges.
Fig. 10A shows brain network activity pattern 20 within a template 26 of a scalp, demonstrating the relationship between the location of a plurality of said nodes and a plurality of brain lobes (forehead 28, center 30, top 32, pillow 34 and temporal 36). A plurality of nodes in the brain network activity pattern may be labeled by various features thereof. A color-coded or shape-coded visualization technique may also be employed if desired. For example, nodes corresponding to a particular frequency band may be displayed using one color or shape, and nodes corresponding to another frequency band may be displayed using another color or shape. For example, a red node may be used for corresponding Yubo and a green node for the θ wave. As shown in fig. 10A, the "red" node is represented by a solid black circle, and the "green" node is represented by a solid black circle surrounded by an outer ring (three in fig. 10A).
Brain network activity pattern 20 may describe brain activity in a single subject or in a group or subgroup of subjects. A brain network activity pattern describing brain activity of a single subject is referred to herein as a subject-specific brain network activity pattern, and a brain network activity pattern describing brain activity of a group or subgroup of subjects is referred to herein as a group brain network activity pattern.
When brain network activity pattern 20 is a subject-specific brain network activity pattern, the brain network activity pattern of a given subject is constructed using only a plurality of vectors extracted from the data of the subject. Thus, each node corresponds to a point in the multidimensional space, and thus represents an activity event in the brain. When brain network activity pattern 20 is a group brain network activity pattern, some nodes may correspond to a group of points in the multidimensional space, so the pattern represents an activity event that is prevalent among a group or subgroup of subjects. Because of the statistical nature of a population of brain network activity patterns, the number of nodes (referred to herein as "orders") and/or edges (referred to herein as "sizes") in a population of brain network activity patterns is typically, but not necessarily, greater than the order and/or size of a subject-specific brain network activity pattern.
The simplified scheme shown in fig. 10B is considered as an example for constructing a population of brain network activity patterns, where a "segment" corresponds to a different subject in a population or subgroup of subjects. In the example, the electroencephalographic signals of the group include two single events associated with locations a and B. Each of the plurality of events forms a cluster in the multidimensional space. In some applications of the present invention, each cluster, referred to herein as clusters a and B, is represented by a node in the group brain network activity pattern. Two of the clusters a and B are identified as activity-related features because there are some individual points in these clusters that pass the criteria of such a relationship (in this example, the pair of subjects 4 and 5, as will be described in further detail below). Thus, for some applications of the invention, nodes corresponding to clusters a and B are connected by one edge. A simplified illustration of the resulting pattern of population brain network activity is shown in fig. 10C.
A subject-specific brain network activity pattern is typically constructed by comparing features and relationships between features of electroencephalogram signals collected from a subject with features and relationships between features of reference data, which for some applications correspond to groups of electroencephalogram signals. For the application, a plurality of points and relationships between a plurality of points of a signal associated with a subject are compared to a plurality of relationships between a plurality of clusters of data associated with a cluster. For example, consider the simplified scheme shown in fig. 10B, where a "fragment" corresponds to a different subject in a group or subgroup of subjects. Cluster a does not include a contribution from subject number 3, cluster B does not include a contribution from subject number 6, because for the plurality of subjects, each point fails the criteria of the time window. Thus, for some applications, when a subject-specific brain network activity pattern is constructed for subject No. 3, it does not include a node corresponding to location a, and when a subject-specific brain network activity pattern is constructed for subject No. 6, it does not include a node corresponding to location B. On the other hand, positions a and B are both represented as nodes in a subject-specific brain network activity pattern constructed for any of the subjects numbered 1, 2, 4, and 5. For a plurality of subjects (e.g., subjects corresponding to numbers 4 and 5 in this example, since a plurality of events occur within a given time interval from each other) whose points are accepted as a pair of activity-related features, the respective nodes are connected by one edge. A simplified illustration of a subject-specific brain network activity pattern for this situation is shown in fig. 10D.
Note that for the simplified example of only two nodes, the subject-specific brain network activity pattern of fig. 10D is similar to the group brain network activity pattern of fig. 10C. As noted, for a greater number of nodes, the order and/or size of the group of brain network activity patterns is generally greater than the order and/or size of the subject-specific brain network activity patterns. As described in further detail below, an additional difference between the subject-specific and population brain network activity patterns may be manifested by a degree of relationship between a plurality of the activity-related features represented by a plurality of edges.
For a plurality of subjects (in this example, subjects numbered 1 and 2) whose points are rejected as a pair of activity-related features, the respective nodes are not connected by one side. A simplified diagram of a subject-specific brain network activity pattern for this situation is shown in fig. 10E.
However, it should be appreciated that while the above technique for constructing a subject-specific brain network activity pattern is described in terms of a relationship between a signal of a particular subject and data of a population of subjects, this is not necessarily the case, as for some applications a subject-specific brain network activity pattern may be constructed from only a plurality of electroencephalogram signals obtained from a single subject. For the application, vectors of waveform features are extracted separately for time-separated transcranial magnetic stimulation to define a plurality of clusters of points, wherein each point within the cluster corresponds to a response to a stimulus applied at a different time, as described in further detail above. The process of constructing a subject-specific brain network activity pattern in such an application is generally similar to the process of constructing a population of brain network activity patterns described above. However, since all signals are collected from a single subject, the brain network activity pattern is subject-specific.
Thus, according to some applications, a subject-specific brain network activity pattern is generated to have one of two types: a first type describing the association of a particular subject with a population or subgroup of subjects, which is a representation of a population of brain network activity patterns of the particular subject, and a second type describing the data of the particular subject without correlating the subject to a population or subgroup of subjects. The former type of brain network activity pattern is referred to herein as an associated subject-specific brain network activity pattern, and the latter type of brain network activity pattern is referred to herein as a non-associated subject-specific brain network activity pattern.
For non-associated subject-specific brain network activity patterns, a set of evoked responses is typically analyzed. Typically, the data is then averaged and a vector of individual data is generated. On the other hand, for a population brain network activity pattern, the data for each subject in the population is typically averaged and then becomes a vector of the data.
It should be noted that while a non-associated subject-specific brain network activity pattern is typically unique to a particular subject (when the subject-specific brain network activity pattern is constructed), the same subject may be characterized by more than one associated subject-specific brain network activity pattern, as a subject may have different associations with different groups. Consider, for example, a population of healthy subjects with a population of unhealthy subjects with the same brain disorder. Consider further a subject Y, which may or may not belong to one of these groups. According to various applications of the present invention, one or more of a plurality of subject-specific brain network activity patterns of subject Y may be generated.
A first brain network activity pattern is a non-correlated subject-specific brain network activity pattern, which, as described above, is generally unique to the subject because it is constructed from data collected only from subject Y. A second brain network activity pattern is an associated subject-specific brain network activity pattern that is constructed from the relationship between the data of subject Y and the data of the healthy population. A third brain network activity pattern is an associated subject-specific brain network activity pattern that is constructed from the relationship between subject Y's data and the data of the non-healthy population. Each of these brain network activity patterns can be used to assess the condition of subject Y. The first brain network activity pattern may be useful, for example, for monitoring changes in brain function of the subject over time (e.g., monitoring brain plasticity, etc.), as it allows the brain network activity pattern to be compared to a previously constructed, non-associated subject-specific brain network activity pattern. The second and third brain network activity patterns can be used to determine the level of association between subject Y and the respective populations, thereby determining the likelihood of encephalopathy for the subject.
For some further applications, the reference data used to construct the subject-specific brain network activity pattern corresponds to historical data previously obtained from the same subject. The plurality of applications are performed in a substantially similar manner as the application described above with respect to generating an associated subject-specific brain network activity pattern, except that the brain network activity pattern is associated with a history of the same subject rather than a group of subjects.
For some applications, reference data corresponding to data later acquired in the same subject is used. The application allows investigation of whether data obtained at an early stage evolves into data obtained later. A specific and non-limiting example is the case of several treatment sessions (e.g., N sessions) for the same subject. The data obtained during the first few treatment sessions (e.g., session 1 through session k1< N) may be used as reference data to construct a first associated subject-specific brain network activity pattern corresponding to the interim session (e.g., session k2> kl through session k3> k 2), and the data obtained during the last few treatment sessions (e.g., session k4 through session N) may be used as reference data to construct a second associated subject-specific brain network activity pattern corresponding to the interim session described above, where 1< k2< k3< k4. Two such associated subject-specific brain network activity patterns for the same subject may be used to determine the evolution of data from the early stage of treatment to the late stage of treatment.
For some applications, pulses of multiple transcranial magnetic stimulation are applied to each of a population of subjects during a treatment course of multiple treatment sessions. For some of these applications, a reference population brain network activity pattern is constructed from electroencephalogram signals obtained from a population of subjects during a first course of treatment (e.g., the first day, when each course of treatment occurs on a different day), and is typically based on a single-pulse transcranial magnetic stimulation evoked potential. The inventors of the present application have found that a single pulse of transcranial magnetic stimulation evoked potential during the first treatment session has a marginal effect on the brain, such that an electroencephalogram signal obtained after the pulse can be considered to correspond to an untreated subject. The reference population brain network activity pattern may be used as a basis for constructing an associated subject-specific brain network activity pattern for one or more of a population of subjects that describes the association or lack of association of a particular subject with a population of subjects. The associated subject-specific brain network activity pattern may be constructed for a particular subject in one or more subsequent therapy sessions to show a therapeutic effect relative to the effect of the single-pulse transcranial magnetic stimulation evoked potential during the first therapy session.
Typically, a connectivity weight is assigned to each pair of nodes in the brain network activity pattern (or equally to each edge in the brain network activity pattern) to provide a weighted brain network activity pattern. The connectivity weights are represented in fig. 10A, 10C, and 10D by the thickness of the edges connecting the two nodes. For example, thicker edges may correspond to higher weights, while thinner edges may correspond to lower weights.
For some applications, the connection weight includes a weight index calculated based on at least one of the following cluster attributes: (i) The number of subjects participating in the respective cluster pair, wherein a greater weight is assigned to a greater number of subjects; (ii) The difference between the number of subjects in each cluster in the pair (referred to as the "degree of differentiation" of the pair), with a greater weight assigned to a lower degree of differentiation; (iii) The width of the plurality of time windows associated with each respective cluster (see, e.g., Δt in FIG. 10B A And Deltat B ) Wherein a larger weight is assigned to a narrower window; (iv) Latency differences between two clusters (see e.g. Δt in fig. 10A AB ) Wherein larger weights are assigned to narrower windows; (v) the amplitude of the signal associated with the corresponding cluster; (vi) the frequency of signals associated with the respective clusters; and (vii) defining the width of a spatial window of the cluster (for continuous application of the coordinate system). For any cluster attribute other than attributes (i) and (ii), a statistically observable amount of one or more attributes is typically used, such as, but not limited to, average, median, minimum upper bound, maximum lower bound, and variance over the cluster.
For a population of brain network activity patterns or a non-associated subject-specific brain network activity pattern, the connectivity weight is typically equal to the weight index calculated based on attributes of a plurality of the clusters.
For an associated subject-specific brain network activity pattern, a pair of nodes' connectivity weights are preferably assigned based on the weight index (denoted as WI) and one or more subject-specific and pair-specific numbers (denoted as SI). Representative examples of the numbers are provided below.
In some embodiments of the invention, the associated subject-specific brain network activity pattern is configured to communicate with a pair of nodesIs assigned by a connectivity weight calculated by combining WI with SI. For example, a pair of connectivity weights in the associated subject-specific brain network activity pattern may be given by wi·si. For some applications, when multiple numbers (e.g., N numbers) are calculated for a given pair of nodes, more than one connectivity weight, e.g., WI SI, may be assigned to the pair 1 、WI·SI 2 ......WI·SI N In which SI is 1 、SI 2 ......SI N Is the number of N computations. Alternatively or additionally, the connectivity weights of all a given pair are combined, e.g. by averaging, multiplication, etc.
The number SI may be, for example, a statistical score characterizing a relationship between the subject-specific pair and the corresponding cluster. The statistical score may be of any type including, but not limited to, average difference, absolute deviation, and standard score, among others. The relationship of the statistical scores calculated may relate to one or more attributes used to calculate the weight index, including but not limited to latency, latency differences, amplitude and frequency, and the like.
A statistical score related to latency or latency differences is referred to herein as a synchronization score and is denoted as SIs. Thus, a synchronization score according to some applications of the present invention is obtained by calculating a statistical score for: (i) Latency of points obtained for the subject relative to the group average latency of the corresponding cluster (e.g., t in the example above (i) A T (i) B ) And/or (ii) relative to a group average latency difference between two respective clusters for a latency difference between two points obtained by a subject (e.g.: Δt (delta t) (i) AB )。
A statistical score related to amplitude is referred to herein as an amplitude score and is denoted SIa. Thus, an amplitude score according to some applications of the invention is obtained by calculating a statistical score of the amplitudes obtained for the subject relative to the group average amplitudes of the corresponding clusters.
A statistical score related to frequency is referred to herein as a frequency score and is denoted as SIf. Thus, a frequency score according to some applications of the invention is obtained by calculating a statistical score of frequencies obtained for the subject relative to the group average frequency of the corresponding cluster.
A statistical score related to location is referred to herein as a location score and is denoted as SIl. The use of the score is generally useful for applications employing a continuous coordinate system, as described in further detail above. Thus, a location score according to some applications of the invention is obtained by calculating a statistical score of the locations obtained for the subject relative to the group average location of the corresponding cluster.
The calculation of statistical scores for other characteristics is not excluded from the scope of the present invention.
The following is a description of a technique for calculating the quantity SI according to some applications of the present invention.
When SI is a Synchronization Score (SIs), the computation is typically based on matching to the Time of the electrode pair (Time) subj ) A plurality of discrete points in time of the plurality of space-time constraints, if any, are set. In these applications, the Time and participation of the plurality of points in a group mode (Time pat ) Comparing the mean value and standard deviation of the time of the plurality of discrete points of (a) to provide a region synchronization score SI for each region sr . The synchronization score SIs may then be calculated by, for example, averaging the region synchronization scores of the two regions in the pair. Formally, this process can be written as:

an amplitude fraction SIa is typically calculated in a similar manner. Initially, an individual subject (Amp subj ) Amplitude and participation in a group pattern (Amp) pat ) Average and standard deviation of multiple amplitudes of multiple discrete points of (a) are compared to provide a region amplitude fraction SIa for each region r . The amplitude score may then be calculated, for example, by averaging the two regions in the pairRegional amplitude score:

one or more brain network activity pattern similarities S may then be calculated as a weighted average over a plurality of nodes of the brain network activity pattern as follows:


formally, an additional similarity Sc can be calculated as follows:

where sigi is a binary quantity, equal to 1 if i is present in the subject's data, and 0 otherwise.
In some applications of the invention, the quantity SI comprises a correlation value between a plurality of recorded activities. For some applications, the correlation value describes a correlation between a plurality of the activities recorded for a particular subject at two locations associated with the pair, and for some applications, the correlation value describes a correlation between a plurality of activities recorded for a particular subject at any location associated with the pair and group activities recorded at the same location. For some applications, the correlation value describes a causal relationship between a plurality of activities.
For some applications, a program for calculating the correlation value is used, such as causal relationships known in the art. For some applications, the Grignard theory is employed (e.g., as described in Granger C W J,1969, "Investigating Causal Relations By Econometric Models And Cross-spectra Methods," Econometrics, 37 (3): 242), which is incorporated herein by reference). Other techniques suitable for such applications are described in Durka et al, 2001, "Time-frequency microstructure of event-related electroencephalogram desynchronisation and synchronisation," Medical & Biological Engineering & Computing,39:315, smith Bassett et al, 2006, "Small-World Brain Networks" Neuroscintist, 12:512, he et al, 2007, "Small-World Anatomical Networks in the Human Brain Revealed by Cortical Thickness from MRI," ceramic Cortex 17:2407 and De Vico Fallani et al, "Extracting Information from Cortical Connectivity Patterns Estimated from High Resolution EEG Recordings: A Theoretical Graph Approach," Brain Topogr 19:125, all of which are incorporated herein by reference.
The connectivity weights assigned over the brain network activity patterns are calculated as a continuous variable (e.g., using a function with a continuous range) or as a discrete variable (e.g., using a function with a discrete range, or using a lookup table), depending on the respective application. In general, the connectivity weight may have more than two possible values. Thus, according to some applications of the present invention, the weighted brain network activity pattern has at least three, or at least four, or at least five, or at least six sides, each side being assigned a different connectivity weight.
Typically, once the brain network activity pattern is constructed, the brain network activity pattern is transmitted to a display device such as a screen 18 or a printer (not shown). Alternatively or additionally, the brain network activity pattern is transmitted to a computer readable medium.
For some applications, a subject-specific brain network activity pattern of a particular subject is compared to a previously constructed brain network activity pattern, e.g., a reference population brain network activity pattern constructed based on electroencephalogram signals obtained from a plurality of subjects in a first course of therapy from a single-pulse transcranial magnetic stimulation evoked potential. Optionally, a score is assigned to the subject-specific brain network activity pattern. The score may be, for example, a brain network activity pattern similarity score S. When the subject-specific brain network activity pattern is constructed based on the reference population brain network activity pattern (i.e., when the subject-specific brain network activity pattern is a representation of the reference population brain network activity pattern for the specific subject), a brain network activity pattern similarity S between two brain network activity patterns is typically calculated based on the value of the connectivity weight of the subject-specific brain network activity pattern. For example, the brain network activity pattern similarity may be obtained by averaging connectivity weights over the subject-specific brain network activity pattern.
When more than one type of connectivity weight is assigned to each pair of nodes in the subject-specific brain network activity pattern, the brain network activity patterns are typically averaged separately for each type of connectivity weight. Typically, one or more averages are combined (e.g., summed, multiplied, averaged, etc.) to provide a combined brain network activity pattern similarity. Alternatively, a representation of an average (e.g., maximum) is defined as the brain network activity pattern similarity.
For some applications, the brain network activity pattern similarity is used as a score that quantitatively describes the subject's membership to a group. The score is referred to as a brain network activity score. In the above example of a population brain network activity pattern constructed from a plurality of electroencephalogram signals obtained over a first course of treatment based on a single-pulse transcranial magnetic stimulation evoked potential, it describes the subject's membership (or lack of membership) to a population, typically considered as a population of untreated subjects. The plurality of applications may generally be used to determine the evolving effects of transcranial magnetic stimulation on a subject over a plurality of courses of treatment.
For some applications, the brain network activity score is represented as a continuous or discrete variable. Typically, the similarity is a non-binary number. In other words, rather than determining whether the two brain network activity patterns are similar or dissimilar, the degree to which the two brain network activity patterns are similar or dissimilar is typically calculated. For example, the similarity may be expressed as a percentage, as a non-integer between 0 and 1 (e.g., 0 corresponds to complete dissimilarity, and 1 corresponds to a comparison between a brain network activity pattern and itself), and so forth.
Thus, for some applications of the present invention, at least one brain network activity pattern similarity is calculated, the similarity describing a similarity between the brain network activity pattern and a previously annotated brain network activity pattern.
Examples
Reference is now made to the following examples, which together with the above description illustrate some applications of the invention in a non-limiting manner.
In experiments conducted according to some applications of the present invention, a depth of transcranial magnetic stimulation therapy was administered over a period of 4 weeks in 20 stimulation sessions. Stimulation was performed at 10 hz on the left prefrontal cortex and at 1 hz on the right prefrontal cortex. A 10 hz stimulation is delivered using a 2 second train of 20 pulses at 15 second intervals, a 1 hz stimulation is applied during the inter-train intervals, and then an electroencephalogram is recorded every 5 sessions (i.e., 1, 6, and 11 sessions) before starting the treatment, and on the day of the week after the last session. Transcranial magnetic stimulation treatment at each depth included 25.5 minutes of treatment with dual channel depth transcranial magnetic stimulation.
The results described in this example were from 30 healthy subjects and 24 major depressive patients.
Referring now to fig. 11A, a graph showing the degree of correlation between (a) improvement of the hamiltonian depression scale (Hamilton depression rating scale, HDRS) and (b) bias values of inhibiting transcranial magnetic stimulation evoked potentials (Long Interval Cortical Inhibition TMS-evoked potentials, LICI-TEP) in the long interval cortex corresponding to the difference between a single pulse recorded before the beginning of a first day of treatment and a second pulse of a pair, for a patient with major depression with transcranial magnetic stimulation at applied depth, according to some applications of the present invention, following four weeks of transcranial magnetic stimulation treatment. The plurality of bias values plotted on the x-axis of fig. 11A are negative bias values of the differential waveform between the single pulse transcranial magnetic stimulation evoked potential recorded 60-140 milliseconds after the pulse of transcranial magnetic stimulation at electrode F3 before the beginning of the treatment of the first treatment phase and the transcranial magnetic stimulation evoked potential of the second pulse of a pair. For the data shown in FIG. 11A, a Hamiltonian depression scale-21 (HDRS-21) score table was used. The correlation coefficient is 0.473 and the corresponding probability is 0.03.
According to the correlation in fig. 11A, major depressive patients with a smaller differential waveform recorded before the onset of deep transcranial magnetic stimulation treatment have a better chance of responding to deep transcranial magnetic stimulation treatment. A similar relationship can be obtained for positive bias values.
Referring now to fig. 11B, a graph is presented that shows the degree of correlation between (a) improvement in the hamiltonian depression scale in patients after four weeks of transcranial magnetic stimulation treatment and (B) inhibition of the bias value of transcranial magnetic stimulation evoked potential in the long interval cortex produced by a single pulse recorded prior to the beginning of a first day of treatment, for major depressive patients with transcranial magnetic stimulation at the depth of application, according to some applications of the present invention. The multiple bias values plotted on the x-axis of fig. 11B are bias values (areas) of single pulse transcranial magnetic stimulation evoked potentials recorded 140-300 milliseconds after the pulse of transcranial magnetic stimulation at electrode FC6 prior to the beginning of treatment at the first treatment stage. For the data shown in FIG. 11B, a Hamiltonian depression scale-21 (HDRS-21) score table was used. The correlation coefficient is 0.402 and the corresponding probability is 0.07.
According to the correlation in fig. 11B, major depressive patients with a larger transcranial magnetic stimulation evoked potential, recorded prior to the onset of deep transcranial magnetic stimulation treatment, have a better chance of responding to deep transcranial magnetic stimulation treatment.
The 13 second interval part of the electroencephalogram signal in the treatment is sampled, and the sample is subjected to spectrum analysis, so that the power of each frequency component in the sample is calculated. At the end of treatment, the patient's hamiltonian depression scale is measured to measure the patient's responsiveness to deep transcranial magnetic stimulation treatment. The patient's responsiveness to treatment is then compared to the power of the corresponding frequency component of the 13 second interval electroencephalogram sample recorded before the beginning of the treatment at the first treatment stage.
Referring now to fig. 12A and 12B, which show the degree of correlation between (a) improvement in the hamiltonian depression scale measurements of a patient after four weeks of transcranial magnetic stimulation treatment and (B) power of the corresponding frequency components of 13 second interval electroencephalogram samples recorded at electrode F7 prior to the beginning of treatment at the first treatment stage, fig. 12A corresponds to a high frequency wave (20-40 hz) at electrode position F7, and fig. 12B corresponds to a low gamma wave (30-40 hz) at electrode position F7, for a major depressive patient applying deep transcranial magnetic stimulation, according to some applications of the present invention. As shown, there is a correlation between the two frequency components of the 13 second interval electroencephalogram samples recorded during the first treatment phase and the improvement in the patient's hamiltonian depression scale. The correlation is negative in the high frequency range (20-40 hz) at electrode F7 (a correlation coefficient of-0.65), which means that patients with lower left forehead high frequency power exhibit higher responsiveness to transcranial magnetic stimulation treatment at the beginning of the treatment. The correlation in the low gamma range (30-40 hz) at electrode F7 is also negative (a correlation value of-0.64), which means that patients with lower left forehead gamma power show higher responsiveness to transcranial magnetic stimulation treatment at the beginning of the treatment. Both correlations were statistically significant (a probability of less than 0.001 for the data shown in each of fig. 12A and 12B).
It should be noted that although sampled and spectrally analyzed electroencephalogram signals were recorded during the first treatment phase of a four-week treatment session, the graphs shown in fig. 12A-B represent a correlation between the power of certain frequency components of the sample measured after a four-week treatment session and the responsiveness of the patient to treatment.
Each population brain network activity pattern is constructed from electroencephalogram signals obtained after application of pulses (single, paired) of transcranial magnetic stimulation to healthy subjects and patients with major depression. In addition, a subject-specific brain network activity pattern is constructed and a brain network activity similarity score for the subject-specific brain network activity pattern is calculated.
Fig. 13A is a graph showing the relationship between (a) percent improvement in the hamiltonian depression scale for patients with major depression after three weeks of treatment and (b) brain network activity similarity scores for patients compared to brain network activity for a plurality of healthy subjects and generated from single pulse transcranial magnetic stimulation evoked potentials recorded prior to initiation of treatment, according to some applications of the present invention. The correlation coefficient was 0.775268, the corresponding probability was 0.0051, and the number of subjects was 11. As shown in FIG. 13A, a Hamiltonian depression scale-21 (HDRS-21) score table was used. The graph demonstrates that patients who obtained a high brain network activity similarity score show the greatest benefit from deep transcranial magnetic stimulation therapy relative to healthy subjects, and that the brain network activity score successfully predicts responsiveness of major depressive patients to deep transcranial magnetic stimulation therapy. Similar correlations were obtained using a reference population brain network activity pattern constructed from electroencephalogram signals obtained after a second pulse in a pair of pulses of transcranial magnetic stimulation, demonstrating that predicting responsiveness to transcranial magnetic stimulation therapy based on brain network activity is not limited to only one type of pulse of transcranial magnetic stimulation.
Referring also to fig. 13B, which is a graph showing the relationship between (a) a similarity score for brain network activity of a patient with major depression resulting from a single-pulse transcranial magnetic stimulation evoked potential and (B) the patient's hamiltonian depression scale, as compared to brain network activity of a patient with major depression, according to some applications of the present invention. The correlation coefficient of the data shown in fig. 13B is 0.853554, and the corresponding probability is 0.0017. For the data shown in FIG. 13B, a Hamiltonian depression scale-17 (HDRS-17) score table was used.
A similarity score was generated based on the pattern of brain network activity of the patient generated 3 weeks after treatment, and the patient's hamiltonian depression scale was also measured at the same time point. As shown in the relationship shown in fig. 13B, at a given moment, there is a correlation between the similarity score of the patient's brain network activity and the patient's hamiltonian depression scale, as compared to the brain network activity of a major depressive patient. The data shown in fig. 13B shows that brain network activity of a patient with a particular neuropsychiatric disorder can be used to measure the severity of the disorder, instead of or in addition to ranking the condition using a standard model. For example, based on the data shown in fig. 13B, major depressive patients may alternatively or additionally be ranked (typically a time-consuming process) using a scoring table of the hamiltonian depression scale, the brain network activity of which may be measured, and patients may be ranked based on their brain network activity (e.g., by comparing their brain network activity to that of a group of healthy subjects or to that of a group of unhealthy subjects).
Referring now to fig. 14A and 14B, graphs showing the relationship between (a) the time to each percentage improvement from the pre-treatment baseline in the patient's hamiltonian depression scale after the onset of deep transcranial magnetic stimulation therapy for a plurality of major depressive patients and (B) the power of each frequency component of a 13 second interval electroencephalogram sample recorded on each electroencephalogram electrode prior to the onset of therapy, are shown in accordance with some applications of the present invention. Specifically, fig. 14A depicts the number of electroencephalogram visits recorded at an electrode FT8 relative to pulses of transcranial magnetic stimulation applied in response to a first day of treatment, until the patient's hamiltonian depression scale reaches 40% improvement relative to its pre-treatment hamiltonian depression scale (30-40 hz). The correlation between the time required for 40% hamiltonian depression scale improvement versus low gamma power was negative, a correlation value of-0.63, indicating that patients with lower right low gamma power responded slower to the treatment prior to transcranial magnetic stimulation treatment.
Fig. 14B depicts the delta (1-4 hz) to beta (12-30 hz) power ratio recorded at an electrode T8 relative to pulses in response to a cranial magnetic stimulus applied prior to the start of treatment on the first day of treatment until the patient's hamiltonian depression scale reaches 50% of the number of improved electroencephalograms relative to its pre-treatment hamiltonian depression scale. The correlation between the time required for 50% hamiltonian depression scale improvement versus delta to beta power ratio was positive, a correlation value of 0.83, indicating that patients with lower delta to beta power ratios responded to the treatment faster before transcranial magnetic stimulation treatment. The correlation shown in FIGS. 14A and 14B was statistically significant (p < 0.001).
From the results shown in fig. 14A and 14B, the electroencephalogram power spectral density function obtained before starting treatment is highly correlated with the response time to treatment measured using the hamiltonian depression scale. Thus, according to some applications of the invention, one or more pulses of transcranial magnetic stimulation are applied to a subject even before treatment of the subject is initiated. An electrophysiological signal of a subject (e.g., an electroencephalogram of the subject) is detected within a given time segment of one of the pulses of one or more transcranial magnetic stimulation applied to the subject. In response, at least in part, to the detected electrophysiological signal, a time required to treat (or at least partially treat) a neuropsychiatric disorder in the subject using a given therapy is predicted. Alternatively or additionally, a rate of improvement in the condition of the subject in response to the treatment is predicted. For some applications, the power density of a particular frequency band is measured and predictions are made in response thereto. Alternatively or additionally, a relationship (e.g., a ratio) between the power densities of two or more frequency bands is detected and a prediction is made in response thereto.
15A, 15B and 15C, a flowchart illustrating steps performed by a computer processor according to some applications of the present invention is shown.
As shown in fig. 15A, and in accordance with the description above, for some applications in step 40, the computer processor drives the transcranial magnetic stimulation device 10 (fig. 1) to apply one or more pulses of transcranial magnetic stimulation to a subject having a particular neuropsychiatric disorder. In step 42, the computer processor detects an electrophysiological signal of the subject signal after applying one or more pulses. For example, an electroencephalogram of a subject can be detected using the electrodes 14 (shown in fig. 1). For some applications, the detection records an electroencephalogram at one or more given electrodes. In step 44, the computer processor predicts a result of treating the subject with a given therapy in response to the detected electrophysiological signal. 14A and 14B, for some applications, as part of step 44, the computer processor predicts a time taken for the subject's condition until improvement by a given amount and/or predicts a rate of improvement of the subject's condition in response to the given treatment given to the subject.
The flow chart shown in fig. 15B is substantially similar to the flow chart of fig. 15A. However, according to some applications of the present invention, the flow chart shown in FIG. 15B includes a plurality of additional steps 46 and 48. For some applications, the power density of one or more given frequency bands within the detected electrophysiological signal is measured, as shown in step 46. At step 48 (which is optional, as indicated by the dashed box), the power densities of two or more frequency bands are combined. Typically, a relationship (e.g., a ratio) between the power densities of two or more frequency bands is calculated. For some applications, step 44 is performed in response to step 46 and/or step 48, wherein the subject's response to treatment with a given therapy is predicted.
The flow chart shown in fig. 15C is substantially similar to the flow chart of fig. 15A. However, according to some applications of the present invention, the flow chart shown in FIG. 15B includes additional steps 50 and 52. For some applications, in step 50, a brain network activity pattern of the subject is constructed based on the detected electrophysiological signals, e.g., using the techniques described above. For some applications, in step 52 (which is optional, as indicated by the dashed box), a similarity score is calculated for the brain network activity pattern of the subject, e.g., by comparing the brain network activity pattern of the subject to a population pattern, e.g., a healthy population pattern of subjects, or a pattern of a population having a particular neuropsychiatric disorder. For some applications, step 44 is performed in response to step 50 and/or step 52, wherein the subject's response to treatment with a given therapy is predicted.
Although applications have been described herein according to which a train of pulses of transcranial magnetic stimulation is applied to a subject, the scope of the present invention includes using an electrophysiological response to a single pulse of transcranial magnetic stimulation to predict a subject's response to a treatment, mutatis mutandis, according to the general techniques described herein. Although applications have been described herein according to which an electroencephalogram signal of a subject is measured at a given time after a series of pulses of transcranial magnetic stimulation are applied, the scope of the present invention includes using an electrophysiological response measured at various points in time after a given transcranial magnetic stimulation pulse to predict a subject's response to a treatment, mutatis mutandis, according to the general techniques described herein. For example, when a regimen of transcranial magnetic stimulation is applied using a given set of strings and inter-string intervals, electroencephalographic recordings (or other electrophysiological recordings) can be measured at any of the following times:
1. a given time period after one pulse of transcranial magnetic stimulation is applied, e.g., a time period greater than 1 millisecond and/or less than 10 milliseconds (e.g., between 1 millisecond and 10 milliseconds) after the pulse is applied, or a time period greater than 10 milliseconds and/or less than 100 milliseconds (e.g., between 10 milliseconds and 100 milliseconds) after the pulse is applied, or a time period greater than 100 milliseconds and/or less than 1 second (e.g., between 100 milliseconds and 1 second) after the pulse is applied.
2. Within a given train, between pulses of successive transcranial magnetic stimulation.
3. During the inter-string interval, e.g., after a string is applied, more than 1 second and/or less than 20 seconds (e.g., between 1 second and 20 seconds).
For some applications, a plurality of electrophysiological measurements recorded at a plurality of respective times corresponding to the application of transcranial magnetic stimulation are averaged (or otherwise combined) over a period of minutes or transcranial magnetic stimulation, and in response thereto, the subject's response to treatment is predicted, mutatis mutandis, in accordance with the general techniques described herein.
Generally, the scope of the present invention includes using any form of transcranial magnetic stimulation configuration (e.g., using deep transcranial magnetic stimulation coils, or using 8-shaped coils) and any form of stimulation protocol (e.g., including single pulse, paired pulse, single burst, and multiple burst) and predicting responsiveness of the patient to various treatments, including transcranial magnetic stimulation therapy, deep transcranial magnetic stimulation therapy, drug therapy, behavioral or psychological therapy, deep brain stimulation therapy, electro-spasmodic therapy, and other treatments based on a component of an electrophysiological signal of the patient (e.g., an electroencephalogram of the patient) recorded during or after transcranial magnetic stimulation is applied to the patient.
Furthermore, for some applications, analysis of a component of the patient's electrophysiological signal recorded after the application of a pulse (or a train or trains of pulses) of a craniomagnetic stimulus is combined with the patient's electrophysiological signal during a particular task, and the combined neural marker (e.g., a ratio or any other mathematical combination) is used as a predictor of response to treatment. In addition to using electrophysiological recordings to predict response to treatment, the electrophysiological recordings described herein can be used to diagnose, characterize, evaluate, and/or distinguish healthy subjects from subjects with a neuropsychiatric disease.
The inventors of the present application speculate that similar effects to those observed in attention deficit hyperactivity disorder patients and major depressive disorder patients are apparent for patients suffering from other disorders such as depression and other neuropsychiatric disorders such as bipolar disorder, autism, post-traumatic stress syndrome, addictive behaviors (including smoking, binge eating and drug addiction), schizophrenia, parkinson's disease, alzheimer's disease, obsessive-compulsive disorder, epilepsy, and the like. Accordingly, the scope of the present invention includes mutatis mutandis, applying the devices and methods described herein to a patient suffering from any of the above-described conditions.
It should be noted that the terms "patient" and "subject" are used interchangeably throughout this application.
Applications of the invention described herein may take the form of a computer program product accessible from a computer-usable or computer-readable medium (e.g., a non-transitory computer-readable medium) providing program code for use by or in connection with a computer or any instruction execution system. For the purposes of this description, a computer-usable or computer readable medium can be any apparatus that can contain, store, communicate, propagate, or transport the program for use by or in connection with the instruction execution system, apparatus, or device. The medium can be an electronic, magnetic, optical, electromagnetic, infrared, or semiconductor system (or apparatus or device) or a propagation medium. Typically, the computer-usable or computer-readable medium is a non-transitory computer-usable or computer-readable medium.
Examples of a computer-readable medium include a semiconductor or solid state memory, magnetic tape, a removable computer diskette, a random access memory, a read-only memory, a rigid magnetic disk and an optical disk. Current examples of optical discs include compact discs read only discs (CD-ROMs), compact discs rewritable (CD-R/W), and digital versatile discs. For some applications, cloud storage is used.
A data processing system suitable for storing and/or executing program code will include at least one processor coupled directly or indirectly to memory elements through a system bus. The memory elements can include local memory employed during actual execution of the program code, bulk storage, and cache memories which provide temporary storage of at least some program code in order to reduce the number of times code must be retrieved from bulk storage during execution. The system may read the inventive instructions on a program storage device and follow those instructions to perform a method of an embodiment of the invention.
A plurality of network adapters may be coupled to the processor to enable the processor to become coupled to other processors or remote printers or storage devices through private or public networks. Modems, cable modem and Ethernet cards are just a few of the currently available types of network adapters.
Computer program code for carrying out operations of the present invention may be written in any combination of one or more programming languages, including an object oriented language such as Java, smalltalk, C ++ or the like and conventional procedural programming languages, such as the C-language or similar programming languages.
It should be understood that the techniques described herein may be implemented by computer program instructions. The computer program instructions may also be loaded onto a computer, other programmable data processing apparatus, or other devices to cause a series of operational steps to be performed on the computer, other programmable apparatus or other devices to produce a computer implemented process such that the instructions which execute on the computer or other programmable apparatus create means for implementing the functions/acts specified in the flowchart and/or algorithm(s) described in this application. The plurality of computer program instructions may also be stored in a computer-readable medium (e.g., a non-transitory computer-readable medium) that can direct a computer or other programmable data processing apparatus to function in a particular manner, such that the instructions stored in the computer-readable medium produce an article of manufacture including instruction means which implement the algorithm described herein. The plurality of computer program instructions may also be loaded onto a computer or other programmable data processing apparatus to cause a series of operational steps to be performed on the computer or other programmable apparatus to produce a computer implemented process such that the instructions which execute on the computer or other programmable apparatus provide processes for implementing the functions/acts specified in the algorithm(s) described herein.
The computer processor described herein is typically a hardware device programmed with computer program instructions to produce a special purpose computer. For example, when programmed to perform the algorithms described herein, the computer processor typically acts as a dedicated treatment-outcome prediction computer processor. In general, the operations described herein performed by a computer processor transform the physical state of a memory, which is a real physical object, to have a different magnetic polarity, charge, etc., according to the technology of the memory used.
Some embodiments of the invention include combining the methods and apparatus described in any one of the following patent applications with the methods and apparatus described in the present application:
WO 14128631 to Zangen;
WO 14128632 to Zangen;
WO 14128630 to Zangen;
WO 13121359 to Pell;
WO 06134598 to Zangen;
US 20140249352 of Zangen;
US 20140235928 of Zangen;
US 20140235927 of Zangen;
US 20140235926 of Zangen;
US 20130178692 of Zangen; and
WO 2011086563 to Shahaf.
Each of the above-referenced applications is incorporated herein by reference.
It will be appreciated by persons skilled in the art that the present invention is not limited to what has been particularly shown and described hereinabove. Rather, the scope of the present invention includes both combinations and sub-combinations of the various features described hereinabove, as well as variations and modifications thereof which would occur to persons skilled in the art upon reading the foregoing description.
Claims (19)
1. An apparatus for use with a plurality of electrophysiological signal detection electrodes and a transcranial magnetic stimulation device, the apparatus comprising:
an output device; and
a computer processor configured to:
driving the transcranial magnetic stimulation device by driving the transcranial magnetic stimulation device to apply a plurality of serial transcranial magnetic stimulation to a subject to apply one or more pulses of transcranial magnetic stimulation to the subject;
detecting an electrophysiological signal of the subject using a plurality of the electrophysiological signal detection electrodes for a given time period during which one of the one or more pulses of transcranial magnetic stimulation is applied to the subject, wherein the given time period occurs between successive pulses of a given train of transcranial magnetic stimulation;
predicting a result of treating a neuropsychiatric disorder of the subject with a given therapy at least partially in response to the electrophysiological signal detected within the given time period; and
an output is generated on the output device in response to the predicted result.
2. The apparatus as claimed in claim 1, wherein: the computer processor is configured to predict the outcome of treating the neuropsychiatric disorder of the subject using the given therapy in a configuration of: predicting a result of treating depression in the subject using transcranial magnetic stimulation.
3. The apparatus as claimed in claim 1, wherein: the computer processor is configured to predict the outcome of treating the neuropsychiatric disorder of the subject using the given therapy in a configuration of: a result of treating attention deficit hyperactivity disorder (Attention Deficit Hyperactivity Disorder, ADHD) in the subject using transcranial magnetic stimulation is predicted.
4. The apparatus as claimed in claim 1, wherein: the computer processor is configured to detect the electrophysiological signal of the subject in a manner that: detecting an electroencephalogram signal of the subject within the given time segment in which one of the pulses of one or more of the transcranial magnetic stimulation is applied to the subject.
5. The apparatus as claimed in claim 1, wherein: the computer processor is configured to predict the outcome of treating the neuropsychiatric disorder of the subject using the given therapy in a configuration of: predicting a response time for treating the subject with the given therapy.
6. The apparatus as claimed in claim 1, wherein: the computer processor is configured to predict the outcome of treating the neuropsychiatric disorder of the subject using the given therapy in a configuration of: predicting an improvement rate of the neuropsychiatric disorder of the subject in response to treatment with the given therapy.
7. The apparatus as claimed in claim 1, wherein: the computer processor is further configured to detect an electroencephalogram signal of the subject when the subject is performing a task, and the computer processor is configured to predict the outcome of treating the neuropsychiatric disorder of the subject with the given therapy based on the electrophysiological signal of the subject and a component of the electroencephalogram signal of the subject detected when the subject is performing the task.
8. The apparatus of any one of claims 1 to 7, wherein: the computer processor is further configured to construct a brain network activity pattern based on the electrophysiological signals, and the computer processor is configured to predict the outcome of treating the neuropsychiatric disorder of the subject using the given therapy based on the brain network activity pattern.
9. The apparatus as recited in claim 8, wherein: the computer processor is further configured to calculate a brain network activity pattern similarity score by comparing the brain network activity pattern to a population of brain network activity patterns based on a plurality of electrophysiological signals acquired from a population of subjects, and the computer processor is configured to predict the outcome of treating the neuropsychiatric disorder of the subject using the given therapy based on the brain network activity pattern similarity score.
10. The apparatus as recited in claim 8, wherein: the configuration mode of the computer processor configured to construct the brain network activity mode is as follows: a brain network activity pattern is constructed using reference neurophysiologic data, which are a plurality of electrophysiological signals acquired from a population of subjects, each of which is subjected to an initial pulse of transcranial magnetic stimulation.
11. The apparatus as recited in claim 8, wherein: (A) The computer processor is configured to construct a brain network activity pattern by constructing the brain network activity pattern, comprising: a plurality of nodes, each of the nodes representing a comparison of a plurality of features and a plurality of relationships between features in the electrophysiological signal and a plurality of features and a plurality of relationships between features of reference neurophysiologic data, and a plurality of connectivity weights assigned to respective pairs of the plurality of nodes; and (B) the computer processor is configured to construct a brain network activity pattern by constructing the brain network activity pattern, wherein in the brain network activity pattern, each of the nodes represents a cluster of a plurality of vectors of a plurality of data features, and the plurality of connectivity weights of each of a plurality of respective ones of the nodes represent attributes of at least one cluster describing a pair of clusters represented by respective pairs of the plurality of nodes.
12. The apparatus of any one of claims 1 to 7, wherein: the computer processor is further configured to calculate a power of a given frequency band within the detected electrophysiological signal, and the computer processor is configured to predict the outcome of treating the neuropsychiatric disorder of the subject using the given therapy, at least in part in response to the power of the given frequency band.
13. The apparatus as recited in claim 12, wherein: the computer processor is further configured to calculate a plurality of powers of one or more additional frequency bands within the detected electrophysiological signal, and the computer processor is configured to predict the outcome of treating the neuropsychiatric disorder of the subject using the given therapy based on a combination of the power of the given frequency band and the plurality of powers of one or more of the additional frequency bands.
14. The apparatus as claimed in claim 13, wherein: the computer processor is configured to predict the outcome of treating the neuropsychiatric disorder of the subject using the given therapy based on a ratio of the power of the given frequency band to the power of one of the one or more additional frequency bands.
15. The apparatus as recited in claim 12, wherein: the computer processor is configured to detect the electrophysiological signal of the subject in a manner that: detecting an electroencephalogram signal of the subject within the given time segment in which one of the pulses of one or more of the transcranial magnetic stimulation is applied to the subject.
16. The apparatus as recited in claim 15, wherein: the computer processor is configured to calculate the power of the given frequency band within the detected electrophysiological signal by calculating a power of a low gamma band within the detected electroencephalographic signal.
17. The apparatus as recited in claim 16, wherein: the computer processor is further configured to calculate a power of an alpha band within the detected electroencephalogram signal, and the computer processor is configured to predict the outcome of treating the neuropsychiatric disorder of the subject using the given therapy based on a combination of the power of the low gamma band within the detected electroencephalogram signal and the power of the alpha band within the detected electroencephalogram signal.
18. The apparatus as claimed in claim 1, wherein: the given time period is within 1 to 1000 milliseconds of the application of one of the pulses of one or more of the transcranial magnetic stimulation to the subject.
19. A computer software product for use with an output device, a plurality of electrophysiological signal detection electrodes, and a craniomagnetic stimulation device, the computer software product comprising a non-transitory computer readable medium storing instructions of a plurality of programs, wherein when a plurality of the instructions are read by a computer, the computer performs steps comprising:
driving the transcranial magnetic stimulation device by driving the transcranial magnetic stimulation device to apply a plurality of serial transcranial magnetic stimulation to a subject to apply one or more pulses of transcranial magnetic stimulation to the subject;
detecting an electrophysiological signal of the subject using a plurality of the electrophysiological signal detection electrodes for a given time period during which one of the one or more pulses of transcranial magnetic stimulation is applied to the subject, wherein the given time period occurs between successive pulses of a given train of transcranial magnetic stimulation;
Predicting a result of treating a neuropsychiatric disorder of the subject with a given therapy at least partially in response to the electrophysiological signal detected within the given time period; and
an output is generated on the output device in response to the predicted result.
Applications Claiming Priority (3)
| Application Number | Priority Date | Filing Date | Title |
|---|---|---|---|
| US201662412598P | 2016-10-25 | 2016-10-25 | |
| US62/412,598 | 2016-10-25 | ||
| PCT/IL2017/051163 WO2018078619A1 (en) | 2016-10-25 | 2017-10-25 | Apparatus and methods for predicting therapy outcome |
Publications (2)
| Publication Number | Publication Date |
|---|---|
| CN110114115A CN110114115A (en) | 2019-08-09 |
| CN110114115B true CN110114115B (en) | 2023-06-06 |
Family
ID=60262966
Family Applications (1)
| Application Number | Title | Priority Date | Filing Date |
|---|---|---|---|
| CN201780080419.4A Active CN110114115B (en) | 2016-10-25 | 2017-10-25 | Apparatus and method for predicting therapeutic outcome |
Country Status (8)
| Country | Link |
|---|---|
| US (1) | US11400289B2 (en) |
| EP (1) | EP3532162A1 (en) |
| JP (1) | JP7048598B2 (en) |
| CN (1) | CN110114115B (en) |
| AU (1) | AU2017349924A1 (en) |
| CA (1) | CA3041605A1 (en) |
| IL (1) | IL266176B (en) |
| WO (1) | WO2018078619A1 (en) |
Families Citing this family (18)
| Publication number | Priority date | Publication date | Assignee | Title |
|---|---|---|---|---|
| US11247039B2 (en) | 2016-05-03 | 2022-02-15 | Btl Healthcare Technologies A.S. | Device including RF source of energy and vacuum system |
| US10583287B2 (en) | 2016-05-23 | 2020-03-10 | Btl Medical Technologies S.R.O. | Systems and methods for tissue treatment |
| US10556122B1 (en) | 2016-07-01 | 2020-02-11 | Btl Medical Technologies S.R.O. | Aesthetic method of biological structure treatment by magnetic field |
| WO2018182534A1 (en) * | 2017-03-31 | 2018-10-04 | Agency For Science, Technology And Research | A computer system for acquiring a control command |
| CN108742607A (en) * | 2018-06-29 | 2018-11-06 | 南阳市中心医院 | A kind of Neurology interventional therapy device |
| CN110537929B (en) * | 2019-08-23 | 2022-11-04 | 杭州曼安智能科技有限公司 | SSVEP-based attention assessment method, training method and brain-computer interface |
| CN110840411B (en) * | 2019-12-06 | 2022-03-11 | 深圳市德力凯医疗设备股份有限公司 | Measuring device, storage medium and electronic equipment of anesthesia degree of depth |
| CA3173876A1 (en) | 2020-05-04 | 2021-11-11 | Tomas SCHWARZ | Device and method for unattended treatment of a patient |
| US11878167B2 (en) | 2020-05-04 | 2024-01-23 | Btl Healthcare Technologies A.S. | Device and method for unattended treatment of a patient |
| CN111839511B (en) * | 2020-07-21 | 2021-08-10 | 浙江大学 | Magnetic compatible nerve probe and preparation method thereof |
| CN114259239A (en) * | 2020-09-15 | 2022-04-01 | 洪硕宏 | Auxiliary judgment device for evaluating whether transcranial magnetic stimulation is effective for melancholia patient |
| US20230346294A1 (en) * | 2020-09-15 | 2023-11-02 | Cheng-Ta LI | Auxiliary determination device for evaluating efficacy of transcranial magnetic stimulation for patient with depression |
| US11571541B2 (en) | 2020-10-27 | 2023-02-07 | David Richardson Hubbard, JR. | Apparatus and methods of transcranial stimulation to adjust sensory cortical dendritic spine neck membrane potentials for altering consciousness |
| CN116847789A (en) * | 2021-02-12 | 2023-10-03 | 庆应义塾 | Symptom determination device and symptom determination program |
| US11896816B2 (en) | 2021-11-03 | 2024-02-13 | Btl Healthcare Technologies A.S. | Device and method for unattended treatment of a patient |
| CN114081493B (en) * | 2021-12-07 | 2024-02-27 | 杭州睿笛生物科技有限公司 | Auxiliary detection and evaluation method for depression |
| CN115644890A (en) * | 2022-11-15 | 2023-01-31 | 南京左右脑医疗科技集团有限公司 | Brain state recognition method, device and storage medium |
| CN116510183B (en) * | 2023-06-28 | 2023-09-19 | 南昌大学第一附属医院 | Transcranial magnetic stimulation device, electronic device, and storage medium |
Citations (1)
| Publication number | Priority date | Publication date | Assignee | Title |
|---|---|---|---|---|
| CN102906752A (en) * | 2010-01-18 | 2013-01-30 | 艾欧敏达有限公司 | Method and system for weighted analysis of neurophysiological data |
Family Cites Families (25)
| Publication number | Priority date | Publication date | Assignee | Title |
|---|---|---|---|---|
| DE60125963T2 (en) | 2000-10-20 | 2007-10-18 | The Government Of The United States Of America As Represented By The Secretary, Department Of Health And Human Services | COIL FOR MAGNETIC STIMULATION |
| US7706871B2 (en) * | 2003-05-06 | 2010-04-27 | Nellcor Puritan Bennett Llc | System and method of prediction of response to neurological treatment using the electroencephalogram |
| BRPI0410296A (en) * | 2003-05-06 | 2006-05-16 | Aspect Medical Systems Inc | system and method for determining the efficacy of treatment of neurological disorders using electroencephalogram |
| US7976451B2 (en) | 2005-06-16 | 2011-07-12 | The United States Of America As Represented By The Department Of Health And Human Services | Transcranial magnetic stimulation system and methods |
| WO2007138579A2 (en) | 2006-05-25 | 2007-12-06 | Elminda Ltd. | Neuropsychological spatiotemporal pattern recognition |
| WO2008070001A2 (en) | 2006-12-01 | 2008-06-12 | Beth Israel Deaconess Medical Center, Inc. | Transcranial magnetic stimulation (tms) methods and apparatus |
| EP2227138A4 (en) | 2007-11-29 | 2015-10-14 | Elminda Ltd | Functional analysis of neurophysiological data |
| US20110004412A1 (en) | 2007-11-29 | 2011-01-06 | Elminda Ltd. | Clinical applications of neuropsychological pattern analysis and modeling |
| US20120203130A1 (en) * | 2009-07-22 | 2012-08-09 | Armin Bernhard | Tinnitus Therapy Device |
| US20110224571A1 (en) | 2009-11-16 | 2011-09-15 | Alvaro Pascual-Leone | Non-invasive methods for evaluating cortical plasticity impairments |
| EP2651496A4 (en) * | 2010-12-14 | 2014-07-09 | Univ California | Devices, systems and methods for the treatment of medical disorders |
| AU2012285379B2 (en) * | 2011-07-20 | 2017-04-13 | Elminda Ltd. | Method and system for estimating brain concussion |
| US10335606B2 (en) | 2012-02-13 | 2019-07-02 | Brainsway, Ltd. | Use of transcranial magnetic stimulation to modulate permeability of the blood-brain barrier |
| AU2013220050B2 (en) | 2012-02-13 | 2017-07-20 | Brainsway, Ltd. | Transcranial magnetic stimulation to modulate the blood brain barrier |
| KR101881193B1 (en) | 2012-04-06 | 2018-07-23 | 코시바나 홀딩스 리미티드 | rTMS AT HARMONICS OF BIOLOGICAL SIGNALS |
| EP2919647B1 (en) | 2012-11-13 | 2021-01-06 | Elminda Ltd. | Neurophysiological data analysis using spatiotemporal parcellation |
| US9254394B2 (en) | 2013-02-21 | 2016-02-09 | Brainsway, Ltd. | Central base coils for deep transcranial magnetic stimulation |
| US9808642B2 (en) | 2013-02-21 | 2017-11-07 | Brainsway, Ltd. | Circular coils for deep transcranial magnetic stimulation |
| US9533168B2 (en) | 2013-02-21 | 2017-01-03 | Brainsway, Ltd. | Unilateral coils for deep transcranial magnetic stimulation |
| US9248308B2 (en) | 2013-02-21 | 2016-02-02 | Brainsway, Ltd. | Circular coils for deep transcranial magnetic stimulation |
| US9802058B2 (en) | 2013-02-21 | 2017-10-31 | Brainsway, Ltd. | Central base coils for deep transcranial magnetic stimulation |
| CN104394931A (en) | 2013-03-15 | 2015-03-04 | 奈科斯迪姆公司 | Method and system for tms dose assessment and seizure detection |
| EP3068295A4 (en) | 2013-11-13 | 2017-07-19 | Elminda Ltd. | Method and system for managing pain |
| CA2961451A1 (en) | 2014-09-28 | 2016-03-31 | Elminda Ltd. | Brain stimulation tool configuration |
| EP3367895A4 (en) | 2015-11-01 | 2019-07-03 | Elminda Ltd. | Method and system for estimating potential distribution on cortical surface |
-
2017
- 2017-10-25 IL IL266176A patent/IL266176B/en unknown
- 2017-10-25 CN CN201780080419.4A patent/CN110114115B/en active Active
- 2017-10-25 WO PCT/IL2017/051163 patent/WO2018078619A1/en unknown
- 2017-10-25 AU AU2017349924A patent/AU2017349924A1/en active Pending
- 2017-10-25 JP JP2019523608A patent/JP7048598B2/en active Active
- 2017-10-25 EP EP17794429.5A patent/EP3532162A1/en active Pending
- 2017-10-25 CA CA3041605A patent/CA3041605A1/en active Pending
- 2017-10-25 US US16/344,499 patent/US11400289B2/en active Active
Patent Citations (1)
| Publication number | Priority date | Publication date | Assignee | Title |
|---|---|---|---|---|
| CN102906752A (en) * | 2010-01-18 | 2013-01-30 | 艾欧敏达有限公司 | Method and system for weighted analysis of neurophysiological data |
Also Published As
| Publication number | Publication date |
|---|---|
| JP7048598B2 (en) | 2022-04-05 |
| CN110114115A (en) | 2019-08-09 |
| WO2018078619A1 (en) | 2018-05-03 |
| IL266176B (en) | 2022-08-01 |
| AU2017349924A1 (en) | 2019-05-23 |
| CA3041605A1 (en) | 2018-05-03 |
| US11400289B2 (en) | 2022-08-02 |
| US20190247654A1 (en) | 2019-08-15 |
| EP3532162A1 (en) | 2019-09-04 |
| JP2020503084A (en) | 2020-01-30 |
| IL266176A (en) | 2019-06-30 |
Similar Documents
| Publication | Publication Date | Title |
|---|---|---|
| CN110114115B (en) | Apparatus and method for predicting therapeutic outcome | |
| Griffiths et al. | Alpha/beta power decreases track the fidelity of stimulus-specific information | |
| EP2734107B1 (en) | Method and system for estimating brain concussion | |
| CA2875912C (en) | Assessing susceptibility to epilepsy and epileptic seizures | |
| JP2021502165A (en) | Efficacy and / or treatment parameter recommendation using individual patient data and therapeutic brain network maps | |
| US20160106331A1 (en) | Fractal index analysis of human electroencephalogram signals | |
| CA2779010A1 (en) | Brain activity as a marker of disease | |
| EP3068295A2 (en) | Method and system for managing pain | |
| US20190321638A1 (en) | Method and apparatus for preventing or terminating epileptic seizures | |
| US20240090817A1 (en) | Cortical recording and signal processing methods and devices | |
| Höller et al. | Quantitative EEG biomarkers for epilepsy and their relation to chemical biomarkers | |
| Khodayari-Rostamabad et al. | Using pre-treatment electroencephalography data to predict response to transcranial magnetic stimulation therapy for major depression | |
| Ranjan et al. | A machine learning framework for automatic diagnosis of schizophrenia using eeg signals | |
| TH et al. | Improved feature exctraction process to detect seizure using CHBMIT-dataset | |
| Zubler et al. | Quantitative EEG in the intensive care unit | |
| McBride | Dynamic Complexity and Causality Analysis of Scalp EEG for Detection of Cognitive Deficits | |
| Bates et al. | Seizure detection by recurrent backpropagation neural network analysis | |
| Smits | Seizure onset detection for responsive stimulation in the sensorimotor cortex | |
| Balestrieri et al. | Beyond oscillations-A novel feature space for characterizing brain states | |
| Zubrzycki et al. | Application of IT Methods for the Identification and Analysis of EEG Signals | |
| Gurisko | A Quantitative Tool for Identifying the Epileptogenic Zone using Network Connectivity Analysis | |
| Rajashree | Validation of Spindle Detection Algorithms to Find Association Between Sleep Spindles and Chronic Pain in Mice | |
| Janwattanapong | Connectivity Analysis of Electroencephalograms in Epilepsy | |
| Varghese | Probing the sub-thalamic nucleus: development of bio-markers from very Local Field Potentials | |
| Cimbálník | BRNO UNIVERSITY DF TECHNOLOGY |
Legal Events
| Date | Code | Title | Description |
|---|---|---|---|
| PB01 | Publication | ||
| PB01 | Publication | ||
| SE01 | Entry into force of request for substantive examination | ||
| SE01 | Entry into force of request for substantive examination | ||
| CB02 | Change of applicant information |
Address after: Jerusalem, Israel Applicant after: Brain Road Co.,Ltd. Applicant after: Elminda Ltd. Applicant after: B. G. Negev Technology Application Co.,Ltd. Address before: Jerusalem, Israel Applicant before: Brain Road Co.,Ltd. Applicant before: Elminda Ltd. Applicant before: Bagean Technology Co.,Ltd. |
|
| CB02 | Change of applicant information | ||
| GR01 | Patent grant | ||
| GR01 | Patent grant |