CN109196120B - Detection of blood disorders using cell-free DNA in blood - Google Patents
Detection of blood disorders using cell-free DNA in blood Download PDFInfo
- Publication number
- CN109196120B CN109196120B CN201780033380.0A CN201780033380A CN109196120B CN 109196120 B CN109196120 B CN 109196120B CN 201780033380 A CN201780033380 A CN 201780033380A CN 109196120 B CN109196120 B CN 109196120B
- Authority
- CN
- China
- Prior art keywords
- cell
- blood
- methylation
- dna
- determining
- Prior art date
- Legal status (The legal status is an assumption and is not a legal conclusion. Google has not performed a legal analysis and makes no representation as to the accuracy of the status listed.)
- Active
Links
- 210000004369 blood Anatomy 0.000 title claims abstract description 81
- 239000008280 blood Substances 0.000 title claims abstract description 81
- 208000019838 Blood disease Diseases 0.000 title claims abstract description 69
- 208000014951 hematologic disease Diseases 0.000 title claims abstract description 69
- 208000018706 hematopoietic system disease Diseases 0.000 title claims abstract description 69
- 238000001514 detection method Methods 0.000 title description 22
- 230000011987 methylation Effects 0.000 claims abstract description 225
- 238000007069 methylation reaction Methods 0.000 claims abstract description 225
- 210000002381 plasma Anatomy 0.000 claims abstract description 215
- 238000004458 analytical method Methods 0.000 claims abstract description 117
- 238000000034 method Methods 0.000 claims abstract description 69
- 210000000601 blood cell Anatomy 0.000 claims abstract description 57
- 239000000203 mixture Substances 0.000 claims abstract description 51
- 239000012634 fragment Substances 0.000 claims abstract description 48
- 210000002966 serum Anatomy 0.000 claims abstract description 20
- 108020004414 DNA Proteins 0.000 claims description 339
- 210000004027 cell Anatomy 0.000 claims description 152
- 210000003743 erythrocyte Anatomy 0.000 claims description 122
- 238000011282 treatment Methods 0.000 claims description 88
- 208000007502 anemia Diseases 0.000 claims description 82
- 108010054147 Hemoglobins Proteins 0.000 claims description 79
- 102000001554 Hemoglobins Human genes 0.000 claims description 79
- 239000000523 sample Substances 0.000 claims description 77
- 108091029430 CpG site Proteins 0.000 claims description 64
- 208000032467 Aplastic anaemia Diseases 0.000 claims description 61
- 210000001185 bone marrow Anatomy 0.000 claims description 59
- 230000000913 erythropoietic effect Effects 0.000 claims description 44
- 230000004044 response Effects 0.000 claims description 33
- 238000012163 sequencing technique Methods 0.000 claims description 32
- 208000037265 diseases, disorders, signs and symptoms Diseases 0.000 claims description 30
- 208000015710 Iron-Deficiency Anemia Diseases 0.000 claims description 28
- 101150063237 FECH gene Proteins 0.000 claims description 25
- 239000012472 biological sample Substances 0.000 claims description 25
- 208000020832 chronic kidney disease Diseases 0.000 claims description 24
- 210000000349 chromosome Anatomy 0.000 claims description 17
- 241000124008 Mammalia Species 0.000 claims description 15
- 208000022831 chronic renal failure syndrome Diseases 0.000 claims description 15
- 238000001574 biopsy Methods 0.000 claims description 14
- 208000005980 beta thalassemia Diseases 0.000 claims description 11
- 230000035945 sensitivity Effects 0.000 claims description 10
- 201000010099 disease Diseases 0.000 claims description 7
- 230000006607 hypermethylation Effects 0.000 claims description 7
- 238000010222 PCR analysis Methods 0.000 claims description 6
- 238000011088 calibration curve Methods 0.000 claims description 4
- 230000003247 decreasing effect Effects 0.000 claims description 4
- 230000009467 reduction Effects 0.000 claims description 3
- 210000003924 normoblast Anatomy 0.000 abstract description 157
- XEEYBQQBJWHFJM-UHFFFAOYSA-N Iron Chemical compound [Fe] XEEYBQQBJWHFJM-UHFFFAOYSA-N 0.000 description 83
- 210000001519 tissue Anatomy 0.000 description 65
- 102000003875 Ferrochelatase Human genes 0.000 description 48
- 108010057394 Ferrochelatase Proteins 0.000 description 48
- 229910052742 iron Inorganic materials 0.000 description 40
- 208000022806 beta-thalassemia major Diseases 0.000 description 36
- 238000007847 digital PCR Methods 0.000 description 33
- 210000001995 reticulocyte Anatomy 0.000 description 28
- 101000782147 Homo sapiens WD repeat-containing protein 20 Proteins 0.000 description 26
- 102100036561 WD repeat-containing protein 20 Human genes 0.000 description 26
- 238000002560 therapeutic procedure Methods 0.000 description 26
- 238000003556 assay Methods 0.000 description 25
- 230000010437 erythropoiesis Effects 0.000 description 25
- 201000003793 Myelodysplastic syndrome Diseases 0.000 description 24
- 206010028980 Neoplasm Diseases 0.000 description 23
- 208000035475 disorder Diseases 0.000 description 23
- 230000006870 function Effects 0.000 description 22
- LSNNMFCWUKXFEE-UHFFFAOYSA-M Bisulfite Chemical compound OS([O-])=O LSNNMFCWUKXFEE-UHFFFAOYSA-M 0.000 description 21
- 238000012360 testing method Methods 0.000 description 19
- 210000005259 peripheral blood Anatomy 0.000 description 17
- 239000011886 peripheral blood Substances 0.000 description 17
- 201000011510 cancer Diseases 0.000 description 16
- 239000003550 marker Substances 0.000 description 15
- 230000002829 reductive effect Effects 0.000 description 15
- 230000008859 change Effects 0.000 description 14
- 230000000875 corresponding effect Effects 0.000 description 14
- 230000008685 targeting Effects 0.000 description 14
- 210000004700 fetal blood Anatomy 0.000 description 13
- 230000008774 maternal effect Effects 0.000 description 13
- 238000012544 monitoring process Methods 0.000 description 13
- 238000003752 polymerase chain reaction Methods 0.000 description 12
- 230000007067 DNA methylation Effects 0.000 description 11
- 102100035716 Glycophorin-A Human genes 0.000 description 11
- 238000006243 chemical reaction Methods 0.000 description 11
- 210000000265 leukocyte Anatomy 0.000 description 11
- 238000004519 manufacturing process Methods 0.000 description 11
- 238000005259 measurement Methods 0.000 description 11
- 102000003951 Erythropoietin Human genes 0.000 description 10
- 108090000394 Erythropoietin Proteins 0.000 description 10
- 229940105423 erythropoietin Drugs 0.000 description 10
- 208000032839 leukemia Diseases 0.000 description 10
- OXCMYAYHXIHQOA-UHFFFAOYSA-N potassium;[2-butyl-5-chloro-3-[[4-[2-(1,2,4-triaza-3-azanidacyclopenta-1,4-dien-5-yl)phenyl]phenyl]methyl]imidazol-4-yl]methanol Chemical compound [K+].CCCCC1=NC(Cl)=C(CO)N1CC1=CC=C(C=2C(=CC=CC=2)C2=N[N-]N=N2)C=C1 OXCMYAYHXIHQOA-UHFFFAOYSA-N 0.000 description 10
- 230000008569 process Effects 0.000 description 10
- 238000004445 quantitative analysis Methods 0.000 description 10
- 238000001712 DNA sequencing Methods 0.000 description 9
- 101001074244 Homo sapiens Glycophorin-A Proteins 0.000 description 9
- 101000835093 Homo sapiens Transferrin receptor protein 1 Proteins 0.000 description 9
- 206010022971 Iron Deficiencies Diseases 0.000 description 9
- 108091028043 Nucleic acid sequence Proteins 0.000 description 9
- 208000002903 Thalassemia Diseases 0.000 description 9
- 102100026144 Transferrin receptor protein 1 Human genes 0.000 description 9
- 230000000694 effects Effects 0.000 description 9
- 230000001605 fetal effect Effects 0.000 description 9
- 238000001369 bisulfite sequencing Methods 0.000 description 8
- 238000002650 immunosuppressive therapy Methods 0.000 description 8
- 239000002773 nucleotide Substances 0.000 description 8
- 230000035935 pregnancy Effects 0.000 description 8
- 230000002441 reversible effect Effects 0.000 description 8
- 230000002950 deficient Effects 0.000 description 7
- 239000003814 drug Substances 0.000 description 7
- 210000002216 heart Anatomy 0.000 description 7
- 210000003958 hematopoietic stem cell Anatomy 0.000 description 7
- 208000007106 menorrhagia Diseases 0.000 description 7
- 150000007523 nucleic acids Chemical class 0.000 description 7
- 125000003729 nucleotide group Chemical group 0.000 description 7
- 230000009469 supplementation Effects 0.000 description 7
- 210000004556 brain Anatomy 0.000 description 6
- 238000005119 centrifugation Methods 0.000 description 6
- OPTASPLRGRRNAP-UHFFFAOYSA-N cytosine Chemical compound NC=1C=CNC(=O)N=1 OPTASPLRGRRNAP-UHFFFAOYSA-N 0.000 description 6
- 239000012530 fluid Substances 0.000 description 6
- 230000003394 haemopoietic effect Effects 0.000 description 6
- 210000004072 lung Anatomy 0.000 description 6
- 230000004048 modification Effects 0.000 description 6
- 238000012986 modification Methods 0.000 description 6
- 108090000623 proteins and genes Proteins 0.000 description 6
- 238000003860 storage Methods 0.000 description 6
- 208000000733 Paroxysmal Hemoglobinuria Diseases 0.000 description 5
- 102100036050 Phosphatidylinositol N-acetylglucosaminyltransferase subunit A Human genes 0.000 description 5
- 108010004729 Phycoerythrin Proteins 0.000 description 5
- 230000001154 acute effect Effects 0.000 description 5
- 210000004100 adrenal gland Anatomy 0.000 description 5
- 230000002759 chromosomal effect Effects 0.000 description 5
- 108091092240 circulating cell-free DNA Proteins 0.000 description 5
- 210000001072 colon Anatomy 0.000 description 5
- 238000003745 diagnosis Methods 0.000 description 5
- 230000007159 enucleation Effects 0.000 description 5
- 230000000925 erythroid effect Effects 0.000 description 5
- 210000003238 esophagus Anatomy 0.000 description 5
- MHMNJMPURVTYEJ-UHFFFAOYSA-N fluorescein-5-isothiocyanate Chemical compound O1C(=O)C2=CC(N=C=S)=CC=C2C21C1=CC=C(O)C=C1OC1=CC(O)=CC=C21 MHMNJMPURVTYEJ-UHFFFAOYSA-N 0.000 description 5
- 230000003287 optical effect Effects 0.000 description 5
- 210000000496 pancreas Anatomy 0.000 description 5
- 201000003045 paroxysmal nocturnal hemoglobinuria Diseases 0.000 description 5
- 108091008146 restriction endonucleases Proteins 0.000 description 5
- 238000000926 separation method Methods 0.000 description 5
- 210000000813 small intestine Anatomy 0.000 description 5
- RYVNIFSIEDRLSJ-UHFFFAOYSA-N 5-(hydroxymethyl)cytosine Chemical compound NC=1NC(=O)N=CC=1CO RYVNIFSIEDRLSJ-UHFFFAOYSA-N 0.000 description 4
- 102000053602 DNA Human genes 0.000 description 4
- 108010033040 Histones Proteins 0.000 description 4
- ISAKRJDGNUQOIC-UHFFFAOYSA-N Uracil Chemical compound O=C1C=CNC(=O)N1 ISAKRJDGNUQOIC-UHFFFAOYSA-N 0.000 description 4
- 208000036878 aneuploidy Diseases 0.000 description 4
- 231100001075 aneuploidy Toxicity 0.000 description 4
- 239000003173 antianemic agent Substances 0.000 description 4
- 239000011324 bead Substances 0.000 description 4
- 230000001684 chronic effect Effects 0.000 description 4
- 238000010586 diagram Methods 0.000 description 4
- 230000004069 differentiation Effects 0.000 description 4
- 238000009826 distribution Methods 0.000 description 4
- 230000001973 epigenetic effect Effects 0.000 description 4
- 229940125367 erythropoiesis stimulating agent Drugs 0.000 description 4
- 210000003754 fetus Anatomy 0.000 description 4
- OVBPIULPVIDEAO-LBPRGKRZSA-N folic acid Chemical compound C=1N=C2NC(N)=NC(=O)C2=NC=1CNC1=CC=C(C(=O)N[C@@H](CCC(O)=O)C(O)=O)C=C1 OVBPIULPVIDEAO-LBPRGKRZSA-N 0.000 description 4
- 238000001990 intravenous administration Methods 0.000 description 4
- 210000004698 lymphocyte Anatomy 0.000 description 4
- 230000007246 mechanism Effects 0.000 description 4
- 210000003593 megakaryocyte Anatomy 0.000 description 4
- 238000007855 methylation-specific PCR Methods 0.000 description 4
- 210000000440 neutrophil Anatomy 0.000 description 4
- 108020004707 nucleic acids Proteins 0.000 description 4
- 102000039446 nucleic acids Human genes 0.000 description 4
- 210000004940 nucleus Anatomy 0.000 description 4
- 210000000056 organ Anatomy 0.000 description 4
- 230000003169 placental effect Effects 0.000 description 4
- 239000011541 reaction mixture Substances 0.000 description 4
- 238000011160 research Methods 0.000 description 4
- 210000002784 stomach Anatomy 0.000 description 4
- 210000003932 urinary bladder Anatomy 0.000 description 4
- -1 B12 Chemical compound 0.000 description 3
- 102000014914 Carrier Proteins Human genes 0.000 description 3
- 206010058314 Dysplasia Diseases 0.000 description 3
- WSFSSNUMVMOOMR-UHFFFAOYSA-N Formaldehyde Chemical compound O=C WSFSSNUMVMOOMR-UHFFFAOYSA-N 0.000 description 3
- 208000022559 Inflammatory bowel disease Diseases 0.000 description 3
- 208000008601 Polycythemia Diseases 0.000 description 3
- 230000003321 amplification Effects 0.000 description 3
- 238000013459 approach Methods 0.000 description 3
- 238000003491 array Methods 0.000 description 3
- 230000005540 biological transmission Effects 0.000 description 3
- 230000030833 cell death Effects 0.000 description 3
- 230000015271 coagulation Effects 0.000 description 3
- 238000005345 coagulation Methods 0.000 description 3
- 230000001447 compensatory effect Effects 0.000 description 3
- 230000001276 controlling effect Effects 0.000 description 3
- 230000002596 correlated effect Effects 0.000 description 3
- 229940104302 cytosine Drugs 0.000 description 3
- 229940079593 drug Drugs 0.000 description 3
- 238000011156 evaluation Methods 0.000 description 3
- 230000002496 gastric effect Effects 0.000 description 3
- 210000001035 gastrointestinal tract Anatomy 0.000 description 3
- 230000036541 health Effects 0.000 description 3
- 230000002489 hematologic effect Effects 0.000 description 3
- 238000010562 histological examination Methods 0.000 description 3
- 238000009396 hybridization Methods 0.000 description 3
- 208000015181 infectious disease Diseases 0.000 description 3
- 238000007726 management method Methods 0.000 description 3
- 239000000463 material Substances 0.000 description 3
- 238000010208 microarray analysis Methods 0.000 description 3
- 210000001616 monocyte Anatomy 0.000 description 3
- 230000035772 mutation Effects 0.000 description 3
- 238000003199 nucleic acid amplification method Methods 0.000 description 3
- 230000007170 pathology Effects 0.000 description 3
- 230000000737 periodic effect Effects 0.000 description 3
- 230000002093 peripheral effect Effects 0.000 description 3
- 210000002826 placenta Anatomy 0.000 description 3
- 239000002243 precursor Substances 0.000 description 3
- 238000003793 prenatal diagnosis Methods 0.000 description 3
- 238000004393 prognosis Methods 0.000 description 3
- 238000012216 screening Methods 0.000 description 3
- 210000000130 stem cell Anatomy 0.000 description 3
- 239000013589 supplement Substances 0.000 description 3
- 238000001356 surgical procedure Methods 0.000 description 3
- 208000024891 symptom Diseases 0.000 description 3
- 230000004797 therapeutic response Effects 0.000 description 3
- 230000009466 transformation Effects 0.000 description 3
- LRSASMSXMSNRBT-UHFFFAOYSA-N 5-methylcytosine Chemical compound CC1=CNC(=O)N=C1N LRSASMSXMSNRBT-UHFFFAOYSA-N 0.000 description 2
- CKOMXBHMKXXTNW-UHFFFAOYSA-N 6-methyladenine Chemical compound CNC1=NC=NC2=C1N=CN2 CKOMXBHMKXXTNW-UHFFFAOYSA-N 0.000 description 2
- 108091093088 Amplicon Proteins 0.000 description 2
- 208000018240 Bone Marrow Failure disease Diseases 0.000 description 2
- 241001598984 Bromius obscurus Species 0.000 description 2
- 208000017667 Chronic Disease Diseases 0.000 description 2
- PMATZTZNYRCHOR-CGLBZJNRSA-N Cyclosporin A Chemical compound CC[C@@H]1NC(=O)[C@H]([C@H](O)[C@H](C)C\C=C\C)N(C)C(=O)[C@H](C(C)C)N(C)C(=O)[C@H](CC(C)C)N(C)C(=O)[C@H](CC(C)C)N(C)C(=O)[C@@H](C)NC(=O)[C@H](C)NC(=O)[C@H](CC(C)C)N(C)C(=O)[C@H](C(C)C)NC(=O)[C@H](CC(C)C)N(C)C(=O)CN(C)C1=O PMATZTZNYRCHOR-CGLBZJNRSA-N 0.000 description 2
- 229930105110 Cyclosporin A Natural products 0.000 description 2
- 108010036949 Cyclosporine Proteins 0.000 description 2
- 238000007400 DNA extraction Methods 0.000 description 2
- KCXVZYZYPLLWCC-UHFFFAOYSA-N EDTA Chemical compound OC(=O)CN(CC(O)=O)CCN(CC(O)=O)CC(O)=O KCXVZYZYPLLWCC-UHFFFAOYSA-N 0.000 description 2
- 102000004190 Enzymes Human genes 0.000 description 2
- 108090000790 Enzymes Proteins 0.000 description 2
- 108010029961 Filgrastim Proteins 0.000 description 2
- 208000012671 Gastrointestinal haemorrhages Diseases 0.000 description 2
- 102000006395 Globulins Human genes 0.000 description 2
- 108010044091 Globulins Proteins 0.000 description 2
- 108091005250 Glycophorins Proteins 0.000 description 2
- 102100039619 Granulocyte colony-stimulating factor Human genes 0.000 description 2
- 241000282412 Homo Species 0.000 description 2
- 241000701044 Human gammaherpesvirus 4 Species 0.000 description 2
- 208000028622 Immune thrombocytopenia Diseases 0.000 description 2
- 208000033776 Myeloid Acute Leukemia Diseases 0.000 description 2
- OVBPIULPVIDEAO-UHFFFAOYSA-N N-Pteroyl-L-glutaminsaeure Natural products C=1N=C2NC(N)=NC(=O)C2=NC=1CNC1=CC=C(C(=O)NC(CCC(O)=O)C(O)=O)C=C1 OVBPIULPVIDEAO-UHFFFAOYSA-N 0.000 description 2
- 208000002454 Nasopharyngeal Carcinoma Diseases 0.000 description 2
- 206010061306 Nasopharyngeal cancer Diseases 0.000 description 2
- 208000031981 Thrombocytopenic Idiopathic Purpura Diseases 0.000 description 2
- 108020005202 Viral DNA Proteins 0.000 description 2
- 238000001793 Wilcoxon signed-rank test Methods 0.000 description 2
- 230000002159 abnormal effect Effects 0.000 description 2
- 238000010521 absorption reaction Methods 0.000 description 2
- 239000002253 acid Substances 0.000 description 2
- 208000022400 anemia due to chronic disease Diseases 0.000 description 2
- 230000001494 anti-thymocyte effect Effects 0.000 description 2
- QVGXLLKOCUKJST-UHFFFAOYSA-N atomic oxygen Chemical compound [O] QVGXLLKOCUKJST-UHFFFAOYSA-N 0.000 description 2
- 201000003710 autoimmune thrombocytopenic purpura Diseases 0.000 description 2
- 108091008324 binding proteins Proteins 0.000 description 2
- 238000004820 blood count Methods 0.000 description 2
- 210000002798 bone marrow cell Anatomy 0.000 description 2
- 238000010322 bone marrow transplantation Methods 0.000 description 2
- 239000007975 buffered saline Substances 0.000 description 2
- 108091092356 cellular DNA Proteins 0.000 description 2
- 230000033077 cellular process Effects 0.000 description 2
- 229960001265 ciclosporin Drugs 0.000 description 2
- 238000004140 cleaning Methods 0.000 description 2
- 238000012937 correction Methods 0.000 description 2
- 229930182912 cyclosporin Natural products 0.000 description 2
- 230000002435 cytoreductive effect Effects 0.000 description 2
- 230000007812 deficiency Effects 0.000 description 2
- 238000000432 density-gradient centrifugation Methods 0.000 description 2
- 238000013461 design Methods 0.000 description 2
- 239000003623 enhancer Substances 0.000 description 2
- 230000002255 enzymatic effect Effects 0.000 description 2
- 238000002474 experimental method Methods 0.000 description 2
- 239000012997 ficoll-paque Substances 0.000 description 2
- 229960004177 filgrastim Drugs 0.000 description 2
- 238000000684 flow cytometry Methods 0.000 description 2
- 239000007850 fluorescent dye Substances 0.000 description 2
- 235000019152 folic acid Nutrition 0.000 description 2
- 239000011724 folic acid Substances 0.000 description 2
- 229960000304 folic acid Drugs 0.000 description 2
- 238000007672 fourth generation sequencing Methods 0.000 description 2
- 230000004927 fusion Effects 0.000 description 2
- 208000030304 gastrointestinal bleeding Diseases 0.000 description 2
- 230000002068 genetic effect Effects 0.000 description 2
- 238000005534 hematocrit Methods 0.000 description 2
- 208000007475 hemolytic anemia Diseases 0.000 description 2
- 238000001114 immunoprecipitation Methods 0.000 description 2
- 230000002757 inflammatory effect Effects 0.000 description 2
- 230000000977 initiatory effect Effects 0.000 description 2
- 230000003993 interaction Effects 0.000 description 2
- 238000003771 laboratory diagnosis Methods 0.000 description 2
- 210000004185 liver Anatomy 0.000 description 2
- 238000013507 mapping Methods 0.000 description 2
- 239000011159 matrix material Substances 0.000 description 2
- 125000002496 methyl group Chemical group [H]C([H])([H])* 0.000 description 2
- 201000000050 myeloid neoplasm Diseases 0.000 description 2
- 201000011216 nasopharynx carcinoma Diseases 0.000 description 2
- 239000011824 nuclear material Substances 0.000 description 2
- 235000015097 nutrients Nutrition 0.000 description 2
- 230000008520 organization Effects 0.000 description 2
- 229910052760 oxygen Inorganic materials 0.000 description 2
- 239000001301 oxygen Substances 0.000 description 2
- 230000001717 pathogenic effect Effects 0.000 description 2
- 230000008289 pathophysiological mechanism Effects 0.000 description 2
- 230000007310 pathophysiology Effects 0.000 description 2
- 230000035479 physiological effects, processes and functions Effects 0.000 description 2
- 238000009598 prenatal testing Methods 0.000 description 2
- 238000002203 pretreatment Methods 0.000 description 2
- 238000012545 processing Methods 0.000 description 2
- 239000000047 product Substances 0.000 description 2
- 230000035755 proliferation Effects 0.000 description 2
- 238000011002 quantification Methods 0.000 description 2
- 238000003753 real-time PCR Methods 0.000 description 2
- 238000011084 recovery Methods 0.000 description 2
- 150000003839 salts Chemical class 0.000 description 2
- 239000000243 solution Substances 0.000 description 2
- 238000011895 specific detection Methods 0.000 description 2
- 238000011287 therapeutic dose Methods 0.000 description 2
- 201000003067 thrombocytopenia due to platelet alloimmunization Diseases 0.000 description 2
- RWQNBRDOKXIBIV-UHFFFAOYSA-N thymine Chemical compound CC1=CNC(=O)NC1=O RWQNBRDOKXIBIV-UHFFFAOYSA-N 0.000 description 2
- 238000002054 transplantation Methods 0.000 description 2
- 238000012384 transportation and delivery Methods 0.000 description 2
- 210000004881 tumor cell Anatomy 0.000 description 2
- 229940035893 uracil Drugs 0.000 description 2
- 210000002700 urine Anatomy 0.000 description 2
- XLYOFNOQVPJJNP-UHFFFAOYSA-N water Substances O XLYOFNOQVPJJNP-UHFFFAOYSA-N 0.000 description 2
- 238000012070 whole genome sequencing analysis Methods 0.000 description 2
- HWPZZUQOWRWFDB-UHFFFAOYSA-N 1-methylcytosine Chemical compound CN1C=CC(N)=NC1=O HWPZZUQOWRWFDB-UHFFFAOYSA-N 0.000 description 1
- 229930024421 Adenine Natural products 0.000 description 1
- GFFGJBXGBJISGV-UHFFFAOYSA-N Adenine Chemical compound NC1=NC=NC2=C1N=CN2 GFFGJBXGBJISGV-UHFFFAOYSA-N 0.000 description 1
- 208000030760 Anaemia of chronic disease Diseases 0.000 description 1
- 208000019901 Anxiety disease Diseases 0.000 description 1
- 206010002961 Aplasia Diseases 0.000 description 1
- 206010003445 Ascites Diseases 0.000 description 1
- 208000023275 Autoimmune disease Diseases 0.000 description 1
- 102000015081 Blood Coagulation Factors Human genes 0.000 description 1
- 108010039209 Blood Coagulation Factors Proteins 0.000 description 1
- 206010065553 Bone marrow failure Diseases 0.000 description 1
- OKTJSMMVPCPJKN-UHFFFAOYSA-N Carbon Chemical compound [C] OKTJSMMVPCPJKN-UHFFFAOYSA-N 0.000 description 1
- 108010078791 Carrier Proteins Proteins 0.000 description 1
- 208000032170 Congenital Abnormalities Diseases 0.000 description 1
- 206010010356 Congenital anomaly Diseases 0.000 description 1
- 108091029523 CpG island Proteins 0.000 description 1
- 230000030933 DNA methylation on cytosine Effects 0.000 description 1
- 102000052510 DNA-Binding Proteins Human genes 0.000 description 1
- 108700020911 DNA-Binding Proteins Proteins 0.000 description 1
- 201000010374 Down Syndrome Diseases 0.000 description 1
- 108010067770 Endopeptidase K Proteins 0.000 description 1
- 241000588724 Escherichia coli Species 0.000 description 1
- 102000008857 Ferritin Human genes 0.000 description 1
- 108050000784 Ferritin Proteins 0.000 description 1
- 238000008416 Ferritin Methods 0.000 description 1
- 206010016880 Folate deficiency Diseases 0.000 description 1
- 102100039620 Granulocyte-macrophage colony-stimulating factor Human genes 0.000 description 1
- 206010018910 Haemolysis Diseases 0.000 description 1
- 208000002250 Hematologic Neoplasms Diseases 0.000 description 1
- 102100027685 Hemoglobin subunit alpha Human genes 0.000 description 1
- 108091005902 Hemoglobin subunit alpha Proteins 0.000 description 1
- 102100021519 Hemoglobin subunit beta Human genes 0.000 description 1
- 108091005904 Hemoglobin subunit beta Proteins 0.000 description 1
- 208000032843 Hemorrhage Diseases 0.000 description 1
- 101001032113 Homo sapiens Histone deacetylase 7 Proteins 0.000 description 1
- 241000702617 Human parvovirus B19 Species 0.000 description 1
- 206010021143 Hypoxia Diseases 0.000 description 1
- 206010061598 Immunodeficiency Diseases 0.000 description 1
- 208000029462 Immunodeficiency disease Diseases 0.000 description 1
- 238000012351 Integrated analysis Methods 0.000 description 1
- 206010058467 Lung neoplasm malignant Diseases 0.000 description 1
- 206010025323 Lymphomas Diseases 0.000 description 1
- 241000282560 Macaca mulatta Species 0.000 description 1
- 208000002720 Malnutrition Diseases 0.000 description 1
- 241001465754 Metazoa Species 0.000 description 1
- 102000016397 Methyltransferase Human genes 0.000 description 1
- 108060004795 Methyltransferase Proteins 0.000 description 1
- 208000014767 Myeloproliferative disease Diseases 0.000 description 1
- 102000048850 Neoplasm Genes Human genes 0.000 description 1
- 108700019961 Neoplasm Genes Proteins 0.000 description 1
- CTQNGGLPUBDAKN-UHFFFAOYSA-N O-Xylene Chemical compound CC1=CC=CC=C1C CTQNGGLPUBDAKN-UHFFFAOYSA-N 0.000 description 1
- 108091034117 Oligonucleotide Proteins 0.000 description 1
- 206010033661 Pancytopenia Diseases 0.000 description 1
- 208000008469 Peptic Ulcer Diseases 0.000 description 1
- OAICVXFJPJFONN-UHFFFAOYSA-N Phosphorus Chemical compound [P] OAICVXFJPJFONN-UHFFFAOYSA-N 0.000 description 1
- 206010036790 Productive cough Diseases 0.000 description 1
- 210000001744 T-lymphocyte Anatomy 0.000 description 1
- 206010043391 Thalassaemia beta Diseases 0.000 description 1
- 102000004338 Transferrin Human genes 0.000 description 1
- 108090000901 Transferrin Proteins 0.000 description 1
- 208000037280 Trisomy Diseases 0.000 description 1
- 208000007642 Vitamin B Deficiency Diseases 0.000 description 1
- 230000005856 abnormality Effects 0.000 description 1
- 208000017733 acquired polycythemia vera Diseases 0.000 description 1
- 230000009471 action Effects 0.000 description 1
- 229960000643 adenine Drugs 0.000 description 1
- 210000004404 adrenal cortex Anatomy 0.000 description 1
- 230000002411 adverse Effects 0.000 description 1
- 238000011256 aggressive treatment Methods 0.000 description 1
- 230000004075 alteration Effects 0.000 description 1
- 239000012491 analyte Substances 0.000 description 1
- 239000003146 anticoagulant agent Substances 0.000 description 1
- 229940127219 anticoagulant drug Drugs 0.000 description 1
- 230000036506 anxiety Effects 0.000 description 1
- 230000009118 appropriate response Effects 0.000 description 1
- 206010003246 arthritis Diseases 0.000 description 1
- 230000001174 ascending effect Effects 0.000 description 1
- LMEKQMALGUDUQG-UHFFFAOYSA-N azathioprine Chemical compound CN1C=NC([N+]([O-])=O)=C1SC1=NC=NC2=C1NC=N2 LMEKQMALGUDUQG-UHFFFAOYSA-N 0.000 description 1
- 229960002170 azathioprine Drugs 0.000 description 1
- 210000003719 b-lymphocyte Anatomy 0.000 description 1
- 230000008901 benefit Effects 0.000 description 1
- 239000000090 biomarker Substances 0.000 description 1
- 230000015572 biosynthetic process Effects 0.000 description 1
- 208000034158 bleeding Diseases 0.000 description 1
- 230000000740 bleeding effect Effects 0.000 description 1
- 239000003114 blood coagulation factor Substances 0.000 description 1
- 238000009534 blood test Methods 0.000 description 1
- 210000001124 body fluid Anatomy 0.000 description 1
- 208000015322 bone marrow disease Diseases 0.000 description 1
- 230000005983 bone marrow dysfunction Effects 0.000 description 1
- 239000000872 buffer Substances 0.000 description 1
- 229910052799 carbon Inorganic materials 0.000 description 1
- 230000000747 cardiac effect Effects 0.000 description 1
- 230000005754 cellular signaling Effects 0.000 description 1
- 210000001175 cerebrospinal fluid Anatomy 0.000 description 1
- 239000003153 chemical reaction reagent Substances 0.000 description 1
- 239000003795 chemical substances by application Substances 0.000 description 1
- 238000003776 cleavage reaction Methods 0.000 description 1
- 230000001112 coagulating effect Effects 0.000 description 1
- 239000003086 colorant Substances 0.000 description 1
- 238000012790 confirmation Methods 0.000 description 1
- 210000002726 cyst fluid Anatomy 0.000 description 1
- 208000024389 cytopenia Diseases 0.000 description 1
- 230000003436 cytoskeletal effect Effects 0.000 description 1
- 230000006378 damage Effects 0.000 description 1
- 238000013480 data collection Methods 0.000 description 1
- 238000012217 deletion Methods 0.000 description 1
- 230000037430 deletion Effects 0.000 description 1
- 238000011161 development Methods 0.000 description 1
- 230000018109 developmental process Effects 0.000 description 1
- 238000000502 dialysis Methods 0.000 description 1
- 238000003748 differential diagnosis Methods 0.000 description 1
- FWZTTZUKDVJDCM-CEJAUHOTSA-M disodium;(2r,3r,4s,5s,6r)-2-[(2s,3s,4s,5r)-3,4-dihydroxy-2,5-bis(hydroxymethyl)oxolan-2-yl]oxy-6-(hydroxymethyl)oxane-3,4,5-triol;iron(3+);oxygen(2-);hydroxide;trihydrate Chemical compound O.O.O.[OH-].[O-2].[O-2].[O-2].[O-2].[O-2].[O-2].[O-2].[O-2].[Na+].[Na+].[Fe+3].[Fe+3].[Fe+3].[Fe+3].[Fe+3].O[C@H]1[C@H](O)[C@@H](CO)O[C@@]1(CO)O[C@@H]1[C@H](O)[C@@H](O)[C@H](O)[C@@H](CO)O1 FWZTTZUKDVJDCM-CEJAUHOTSA-M 0.000 description 1
- 230000005183 environmental health Effects 0.000 description 1
- 238000009585 enzyme analysis Methods 0.000 description 1
- 230000002449 erythroblastic effect Effects 0.000 description 1
- 230000001747 exhibiting effect Effects 0.000 description 1
- 230000002550 fecal effect Effects 0.000 description 1
- 238000012268 genome sequencing Methods 0.000 description 1
- 238000003205 genotyping method Methods 0.000 description 1
- 210000004907 gland Anatomy 0.000 description 1
- 102000018146 globin Human genes 0.000 description 1
- 108060003196 globin Proteins 0.000 description 1
- 150000003278 haem Chemical class 0.000 description 1
- 210000003566 hemangioblast Anatomy 0.000 description 1
- 210000000777 hematopoietic system Anatomy 0.000 description 1
- 230000008588 hemolysis Effects 0.000 description 1
- 230000011132 hemopoiesis Effects 0.000 description 1
- 210000003494 hepatocyte Anatomy 0.000 description 1
- 229940088597 hormone Drugs 0.000 description 1
- 239000005556 hormone Substances 0.000 description 1
- 208000022168 hypermenorrhea Diseases 0.000 description 1
- 230000001146 hypoxic effect Effects 0.000 description 1
- 230000028993 immune response Effects 0.000 description 1
- 210000000987 immune system Anatomy 0.000 description 1
- 230000007813 immunodeficiency Effects 0.000 description 1
- 238000011534 incubation Methods 0.000 description 1
- 229940032961 iron sucrose Drugs 0.000 description 1
- VRIVJOXICYMTAG-IYEMJOQQSA-L iron(ii) gluconate Chemical compound [Fe+2].OC[C@@H](O)[C@@H](O)[C@H](O)[C@@H](O)C([O-])=O.OC[C@@H](O)[C@@H](O)[C@H](O)[C@@H](O)C([O-])=O VRIVJOXICYMTAG-IYEMJOQQSA-L 0.000 description 1
- MVZXTUSAYBWAAM-UHFFFAOYSA-N iron;sulfuric acid Chemical compound [Fe].OS(O)(=O)=O MVZXTUSAYBWAAM-UHFFFAOYSA-N 0.000 description 1
- 230000002262 irrigation Effects 0.000 description 1
- 238000003973 irrigation Methods 0.000 description 1
- 238000011901 isothermal amplification Methods 0.000 description 1
- 150000002576 ketones Chemical class 0.000 description 1
- 210000003734 kidney Anatomy 0.000 description 1
- 238000012417 linear regression Methods 0.000 description 1
- 238000011528 liquid biopsy Methods 0.000 description 1
- 208000019423 liver disease Diseases 0.000 description 1
- 201000005202 lung cancer Diseases 0.000 description 1
- 208000020816 lung neoplasm Diseases 0.000 description 1
- 208000037841 lung tumor Diseases 0.000 description 1
- 230000000527 lymphocytic effect Effects 0.000 description 1
- 210000003738 lymphoid progenitor cell Anatomy 0.000 description 1
- 210000002540 macrophage Anatomy 0.000 description 1
- 230000036210 malignancy Effects 0.000 description 1
- 210000001161 mammalian embryo Anatomy 0.000 description 1
- 230000035800 maturation Effects 0.000 description 1
- 230000002503 metabolic effect Effects 0.000 description 1
- 238000012164 methylation sequencing Methods 0.000 description 1
- 238000002493 microarray Methods 0.000 description 1
- 208000010555 moderate anemia Diseases 0.000 description 1
- 210000005087 mononuclear cell Anatomy 0.000 description 1
- 210000001167 myeloblast Anatomy 0.000 description 1
- 206010028537 myelofibrosis Diseases 0.000 description 1
- 210000003643 myeloid progenitor cell Anatomy 0.000 description 1
- 230000003525 myelopoietic effect Effects 0.000 description 1
- 208000010125 myocardial infarction Diseases 0.000 description 1
- 239000013642 negative control Substances 0.000 description 1
- 229910052757 nitrogen Inorganic materials 0.000 description 1
- 235000018343 nutrient deficiency Nutrition 0.000 description 1
- 238000005457 optimization Methods 0.000 description 1
- 210000001672 ovary Anatomy 0.000 description 1
- 239000012188 paraffin wax Substances 0.000 description 1
- 230000037361 pathway Effects 0.000 description 1
- 208000011906 peptic ulcer disease Diseases 0.000 description 1
- 229910052698 phosphorus Inorganic materials 0.000 description 1
- 239000011574 phosphorus Substances 0.000 description 1
- 230000036470 plasma concentration Effects 0.000 description 1
- 210000004180 plasmocyte Anatomy 0.000 description 1
- 210000004910 pleural fluid Anatomy 0.000 description 1
- 208000037244 polycythemia vera Diseases 0.000 description 1
- 239000013641 positive control Substances 0.000 description 1
- 238000002360 preparation method Methods 0.000 description 1
- 102000004196 processed proteins & peptides Human genes 0.000 description 1
- 108090000765 processed proteins & peptides Proteins 0.000 description 1
- 230000002250 progressing effect Effects 0.000 description 1
- 238000010223 real-time analysis Methods 0.000 description 1
- 230000001105 regulatory effect Effects 0.000 description 1
- 230000009711 regulatory function Effects 0.000 description 1
- 210000003296 saliva Anatomy 0.000 description 1
- 229960002530 sargramostim Drugs 0.000 description 1
- 108010038379 sargramostim Proteins 0.000 description 1
- 230000007017 scission Effects 0.000 description 1
- 208000007056 sickle cell anemia Diseases 0.000 description 1
- 230000000391 smoking effect Effects 0.000 description 1
- 210000003802 sputum Anatomy 0.000 description 1
- 208000024794 sputum Diseases 0.000 description 1
- 230000003068 static effect Effects 0.000 description 1
- 238000007619 statistical method Methods 0.000 description 1
- 238000011476 stem cell transplantation Methods 0.000 description 1
- 239000000021 stimulant Substances 0.000 description 1
- 239000000126 substance Substances 0.000 description 1
- 210000004243 sweat Anatomy 0.000 description 1
- 210000001138 tear Anatomy 0.000 description 1
- 230000002381 testicular Effects 0.000 description 1
- 230000001225 therapeutic effect Effects 0.000 description 1
- 229940113082 thymine Drugs 0.000 description 1
- 210000001541 thymus gland Anatomy 0.000 description 1
- 238000012546 transfer Methods 0.000 description 1
- 239000012581 transferrin Substances 0.000 description 1
- 239000003643 water by type Substances 0.000 description 1
- 239000008096 xylene Substances 0.000 description 1
Images


Classifications
-
- C—CHEMISTRY; METALLURGY
- C12—BIOCHEMISTRY; BEER; SPIRITS; WINE; VINEGAR; MICROBIOLOGY; ENZYMOLOGY; MUTATION OR GENETIC ENGINEERING
- C12Q—MEASURING OR TESTING PROCESSES INVOLVING ENZYMES, NUCLEIC ACIDS OR MICROORGANISMS; COMPOSITIONS OR TEST PAPERS THEREFOR; PROCESSES OF PREPARING SUCH COMPOSITIONS; CONDITION-RESPONSIVE CONTROL IN MICROBIOLOGICAL OR ENZYMOLOGICAL PROCESSES
- C12Q1/00—Measuring or testing processes involving enzymes, nucleic acids or microorganisms; Compositions therefor; Processes of preparing such compositions
- C12Q1/68—Measuring or testing processes involving enzymes, nucleic acids or microorganisms; Compositions therefor; Processes of preparing such compositions involving nucleic acids
- C12Q1/6809—Methods for determination or identification of nucleic acids involving differential detection
-
- C—CHEMISTRY; METALLURGY
- C12—BIOCHEMISTRY; BEER; SPIRITS; WINE; VINEGAR; MICROBIOLOGY; ENZYMOLOGY; MUTATION OR GENETIC ENGINEERING
- C12Q—MEASURING OR TESTING PROCESSES INVOLVING ENZYMES, NUCLEIC ACIDS OR MICROORGANISMS; COMPOSITIONS OR TEST PAPERS THEREFOR; PROCESSES OF PREPARING SUCH COMPOSITIONS; CONDITION-RESPONSIVE CONTROL IN MICROBIOLOGICAL OR ENZYMOLOGICAL PROCESSES
- C12Q1/00—Measuring or testing processes involving enzymes, nucleic acids or microorganisms; Compositions therefor; Processes of preparing such compositions
- C12Q1/68—Measuring or testing processes involving enzymes, nucleic acids or microorganisms; Compositions therefor; Processes of preparing such compositions involving nucleic acids
- C12Q1/6876—Nucleic acid products used in the analysis of nucleic acids, e.g. primers or probes
- C12Q1/6883—Nucleic acid products used in the analysis of nucleic acids, e.g. primers or probes for diseases caused by alterations of genetic material
-
- C—CHEMISTRY; METALLURGY
- C12—BIOCHEMISTRY; BEER; SPIRITS; WINE; VINEGAR; MICROBIOLOGY; ENZYMOLOGY; MUTATION OR GENETIC ENGINEERING
- C12Q—MEASURING OR TESTING PROCESSES INVOLVING ENZYMES, NUCLEIC ACIDS OR MICROORGANISMS; COMPOSITIONS OR TEST PAPERS THEREFOR; PROCESSES OF PREPARING SUCH COMPOSITIONS; CONDITION-RESPONSIVE CONTROL IN MICROBIOLOGICAL OR ENZYMOLOGICAL PROCESSES
- C12Q1/00—Measuring or testing processes involving enzymes, nucleic acids or microorganisms; Compositions therefor; Processes of preparing such compositions
- C12Q1/68—Measuring or testing processes involving enzymes, nucleic acids or microorganisms; Compositions therefor; Processes of preparing such compositions involving nucleic acids
- C12Q1/6876—Nucleic acid products used in the analysis of nucleic acids, e.g. primers or probes
- C12Q1/6888—Nucleic acid products used in the analysis of nucleic acids, e.g. primers or probes for detection or identification of organisms
-
- C—CHEMISTRY; METALLURGY
- C12—BIOCHEMISTRY; BEER; SPIRITS; WINE; VINEGAR; MICROBIOLOGY; ENZYMOLOGY; MUTATION OR GENETIC ENGINEERING
- C12Q—MEASURING OR TESTING PROCESSES INVOLVING ENZYMES, NUCLEIC ACIDS OR MICROORGANISMS; COMPOSITIONS OR TEST PAPERS THEREFOR; PROCESSES OF PREPARING SUCH COMPOSITIONS; CONDITION-RESPONSIVE CONTROL IN MICROBIOLOGICAL OR ENZYMOLOGICAL PROCESSES
- C12Q2600/00—Oligonucleotides characterized by their use
- C12Q2600/106—Pharmacogenomics, i.e. genetic variability in individual responses to drugs and drug metabolism
-
- C—CHEMISTRY; METALLURGY
- C12—BIOCHEMISTRY; BEER; SPIRITS; WINE; VINEGAR; MICROBIOLOGY; ENZYMOLOGY; MUTATION OR GENETIC ENGINEERING
- C12Q—MEASURING OR TESTING PROCESSES INVOLVING ENZYMES, NUCLEIC ACIDS OR MICROORGANISMS; COMPOSITIONS OR TEST PAPERS THEREFOR; PROCESSES OF PREPARING SUCH COMPOSITIONS; CONDITION-RESPONSIVE CONTROL IN MICROBIOLOGICAL OR ENZYMOLOGICAL PROCESSES
- C12Q2600/00—Oligonucleotides characterized by their use
- C12Q2600/112—Disease subtyping, staging or classification
-
- C—CHEMISTRY; METALLURGY
- C12—BIOCHEMISTRY; BEER; SPIRITS; WINE; VINEGAR; MICROBIOLOGY; ENZYMOLOGY; MUTATION OR GENETIC ENGINEERING
- C12Q—MEASURING OR TESTING PROCESSES INVOLVING ENZYMES, NUCLEIC ACIDS OR MICROORGANISMS; COMPOSITIONS OR TEST PAPERS THEREFOR; PROCESSES OF PREPARING SUCH COMPOSITIONS; CONDITION-RESPONSIVE CONTROL IN MICROBIOLOGICAL OR ENZYMOLOGICAL PROCESSES
- C12Q2600/00—Oligonucleotides characterized by their use
- C12Q2600/154—Methylation markers
-
- G—PHYSICS
- G16—INFORMATION AND COMMUNICATION TECHNOLOGY [ICT] SPECIALLY ADAPTED FOR SPECIFIC APPLICATION FIELDS
- G16B—BIOINFORMATICS, i.e. INFORMATION AND COMMUNICATION TECHNOLOGY [ICT] SPECIALLY ADAPTED FOR GENETIC OR PROTEIN-RELATED DATA PROCESSING IN COMPUTATIONAL MOLECULAR BIOLOGY
- G16B30/00—ICT specially adapted for sequence analysis involving nucleotides or amino acids
Landscapes
- Chemical & Material Sciences (AREA)
- Life Sciences & Earth Sciences (AREA)
- Organic Chemistry (AREA)
- Proteomics, Peptides & Aminoacids (AREA)
- Health & Medical Sciences (AREA)
- Analytical Chemistry (AREA)
- Wood Science & Technology (AREA)
- Zoology (AREA)
- Engineering & Computer Science (AREA)
- Genetics & Genomics (AREA)
- Immunology (AREA)
- Physics & Mathematics (AREA)
- Microbiology (AREA)
- Molecular Biology (AREA)
- Biotechnology (AREA)
- Biophysics (AREA)
- Biochemistry (AREA)
- Bioinformatics & Cheminformatics (AREA)
- General Engineering & Computer Science (AREA)
- General Health & Medical Sciences (AREA)
- Pathology (AREA)
- Measuring Or Testing Involving Enzymes Or Micro-Organisms (AREA)
- Investigating Or Analysing Biological Materials (AREA)
Abstract
The present invention provides techniques for detecting blood disorders using cell-free DNA in a blood sample, for example using plasma or serum. For example, the analysis may target one or more differentially methylated regions specific for a particular blood cell lineage (e.g., erythroblasts). Methylation levels can be quantified from the analysis to determine the amount of methylated or unmethylated DNA fragments in the cell-free mixture of the blood sample. The methylation level can be compared to, for example, one or more cut-off values corresponding to a normal range of the particular blood cell lineage as part of determining the level of a blood disorder.
Description
Cross Reference to Related Applications
The U.S. provisional application No. 62/343,050 entitled "use of cell-free DNA in blood for detection of blood disorders" filed 5/30/2016 of this application and is a non-provisional application for said U.S. provisional application, the entire contents of which are incorporated herein by reference for all purposes.
Background
To determine whether a blood disorder (e.g., anemia) is present in a human, routine techniques perform histological examination of a bone marrow biopsy. However, bone marrow biopsy is an invasive procedure that causes pain and anxiety in patients undergoing such procedures. Accordingly, it is desirable to identify new techniques for detecting and characterizing blood disorders in humans.
Anemia can be caused by a number of clinical conditions, each with its own treatment. It will therefore be clinically useful for determining the cause of cases of anemia, and subsequently for further research or treatment accordingly. One cause of anemia is a deficiency in nutrients necessary for erythropoiesis (the process of producing red blood cells), such as (but not limited to) iron, B12, folic acid, and the like. Another cause of anemia is blood loss, which can be acute or chronic. Blood loss may be caused by, for example, menorrhagia or gastrointestinal bleeding. Anemia is also common in many chronic conditions, also known as anemia of chronic disease, and can be found in cancer and inflammatory bowel disease.
Accordingly, it is desirable to provide new techniques for screening subjects for blood disorders, for determining the cause of a blood disorder, for monitoring subjects with blood disorders, and/or determining the appropriate treatment for subjects with blood disorders.
Disclosure of Invention
Some embodiments provide systems, methods, and devices for detecting blood disorders using cell-free DNA in a blood sample, for example using plasma or serum. For example, the analysis may target one or more differentially methylated regions specific for a particular blood cell lineage (e.g., erythroblasts). Methylation levels can be quantified from the analysis to determine the amount of methylated or unmethylated DNA fragments in the cell-free mixture of the blood sample. The methylation level can be compared to, for example, one or more cut-off values corresponding to a normal range of the particular blood cell lineage as part of determining the level of a blood disorder. Some embodiments can use one or more levels of methylation to measure the amount of DNA (e.g., erythroblast DNA) of a particular blood cell lineage in a blood sample in a similar manner.
Such analysis may provide detection of a blood disorder without the need for invasive surgery for a bone marrow biopsy. For example, our results indicate that bone marrow cells contribute a significant proportion of circulating cell-free DNA. Analysis of methylation signatures of hematopoietic cells in circulating cell-free DNA may reflect the status of bone marrow cells. These embodiments may be particularly useful for monitoring bone marrow response to treatment, such as the response of a patient suffering from iron deficiency anemia to oral iron therapy. Embodiments may also be used to assign patients to different procedures, such as bone marrow biopsies or less invasive studies.
Other embodiments relate to systems and computer-readable media related to the methods described herein.
The nature and advantages of embodiments of the present invention may be better understood with reference to the following detailed description and accompanying drawings.
Drawings
FIG. 1 shows methylation density of CpG sites within a promoter of a Ferrochelatase (FECH) gene according to an embodiment of the present invention.
FIGS. 2A and 2B show analysis of universally methylated and unmethylated DNA using a digital PCR assay designed to detect methylated and unmethylated DNA according to an embodiment of the present invention.
Fig. 3A is a graph showing the correlation between E% and the number of nucleated RBCs (erythroblasts) in blood cells according to an embodiment of the present invention. FIG. 3B is a flow diagram illustrating a method 300 for determining the amount of cells of a particular cell lineage in a biological sample by analyzing cell-free DNA, according to an embodiment of the invention.
Figure 4 shows the% Unmeth in the buffy coat and plasma of healthy non-pregnant subjects and pregnant women of different gestation periods according to an embodiment of the invention.
Fig. 5 is a graph showing the lack of correlation between the% Unmeth in the buffy coat and plasma.
Fig. 6A and 6B show the percentage of red blood cell DNA (E% (FECH)) in healthy subjects according to embodiments of the invention. E% can be defined as the same as the Unmeth%.
Figure 7 shows the lack of correlation between the E% (FECH) results for plasma DNA and the age of healthy subjects.
Figure 8 is a graph of Unmeth% for hemoglobin concentration in patients with aplastic anemia, beta-thalassemia major, and healthy control subjects, according to an embodiment of the present invention.
Fig. 9 is a graph of plasma% Unmeth in patients with iron deficiency (Fe) anemia and acute blood loss, according to an embodiment of the present invention.
FIG. 10 shows the relationship between the percentage of red blood cell DNA (E% (FECH)) in plasma and the hemoglobin level in patients and healthy subjects with aplastic anemia, Chronic Renal Failure (CRF), beta-thalassemia major, iron deficiency anemia, according to an embodiment of the present invention.
Figures 11A and 11B show the relationship between reticulocyte count/index and hemoglobin levels in anemic patients with aplastic anemia, Chronic Renal Failure (CRF), beta-thalassemia major, and iron deficiency anemia according to embodiments of the present invention.
FIG. 12 is a graph of plasma Unmeth% in patients with myelodysplastic syndrome and polycythemia vera, according to an embodiment of the present invention.
FIG. 13A shows the percentage of red blood cell DNA in plasma (E% (FECH)) in patients with Aplastic Anemia (AA) and myelodysplastic syndrome (MDS), according to an embodiment of the present invention. FIG. 13B shows the percentage of red blood cell DNA (E% (FECH)) in plasma between the treatment-responsive group and the treatment-non-responsive group in aplastic anemia according to an embodiment of the present invention.
Fig. 14 is a graph of% Unmeth in plasma for hemoglobin concentration in two patients with leukemia and a normal subject according to an embodiment of the present invention.
FIGS. 15A and 15B show the methylation density of CpG sites within erythroblasts-specific DMR on chromosome 12 according to an embodiment of the invention.
FIG. 16 shows histone modifications (H3K4me1 and H3K27Ac) to two other erythroblasts-specific DMRs from the ENCODE database (Ery-1 and Ery-2).
Fig. 17A and 17B show the correlation between the percentage of erythrocyte DNA sequence in buffy coat DNA (E%) in patients with beta-thalassemia major as measured by digital PCR analysis targeting the Ery-1 marker (fig. 17A) and the Ery-2 marker (fig. 17B) and the percentage of erythroblasts in all peripheral blood leukocytes as measured using an automated hematology analyzer.
FIGS. 18A and 18B show the correlation of the E% (FECH) results for buffy coat DNA with E% (Ery-1) and E% (Ery-2) for patients with beta-thalassemia major.
Figure 19 shows the percentage of red blood cell DNA in healthy subjects and patients with aplastic anemia and β -thalassemia major using a digital PCR analysis targeting three erythroblasts-specific DMRs, according to an embodiment of the invention.
Fig. 20A and 20B show series of measurements of percent red cell DNA (E% (FECH)) and percent reticulocyte count in plasma DNA of iron deficiency anemia receiving intravenous iron therapy in a pre-treatment state and two days post-treatment, according to embodiments of the invention.
Figure 21A shows a series of changes in plasma E% at erythroblasts DMR in patients receiving oral iron treatment with hypermenorrhea resulting in iron deficiency anemia according to an embodiment of the present invention. Figure 21B shows the change in hemoglobin after treatment.
Figure 22 shows a series of changes in plasma unneth% at erythroblasts DMR in patients with Chronic Kidney Disease (CKD) treated with recombinant Erythropoietin (EPO) or Erythropoiesis Stimulating Agent (ESA).
Figure 23A shows a series of changes in plasma umeth% at erythroblast DMR in a patient with aplastic anemia receiving anti-thymocyte globulin (ATG) therapy or cyclosporin as an immunosuppressive therapy, according to an embodiment of the present invention. Figure 23B shows the series of changes in hemoglobin in patients with aplastic anemia receiving treatment.
Figures 24A and 24B show graphs of% Unmeth in plasma for hemoglobin concentration in four patients with aplastic anemia.
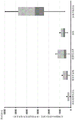
Fig. 25 illustrates a box and whisker plot showing the absolute concentration of red blood cell DNA at FECH gene-associated DMR (copies/ml plasma) in healthy subjects and anemia patients according to an embodiment of the invention.
Fig. 26 is a flow chart illustrating a method of analyzing a blood sample of a mammal according to an embodiment of the present invention.
Fig. 27 illustrates a system 2700 according to an embodiment of the invention.
FIG. 28 illustrates a block diagram of an example computer system that can be used with systems and methods according to embodiments of the invention.
Detailed Description
Term(s) for
The "methylation group" provides a measure of the amount of DNA methylation at multiple sites or loci in the genome. A methylation group can correspond to all genomes, a large portion of a genome, or a relatively small portion of a genome.
"cell lineage" refers to the developmental history of a tissue or organ from a fertilized embryo. Different types of tissues (e.g., different types of blood cells) will have different cell lineages. Red Blood Cells (RBCs) are derived from erythroblasts through a series of intermediate cells. The primary erythroblasts, primary megakaryocytes, and myeloblasts are derived from a common bone marrow progenitor cell. Lymphocytes are derived from a common lymphoid progenitor. Nucleated RBCs are erythroblasts, immature enucleated RBCs are reticulocytes, and mature enucleated RBCs are red blood cells, which are hemoglobin-carrying red blood cells in the blood stream.
A "cell-free mixture" corresponds to a sample comprising cell-free DNA fragments from various cells. For example, the cell-free mixture can include cell-free DNA fragments from various cell lineages. Plasma and serum are examples of cell-free mixtures obtained from blood samples (e.g., by centrifugation). Other cell-free mixtures may be derived from other biological samples. A "biological sample" refers to any sample taken from a subject (e.g., a human, such as a pregnant woman, a person with cancer, or an individual suspected of having cancer, an organ transplant recipient, or a subject suspected of having a disease process involving an organ (e.g., a heart in myocardial infarction, a brain of stroke, or a hematopoietic system of anemia) and containing one or more nucleic acid molecules of interest. The biological sample may be a bodily fluid, such as blood, plasma, serum, urine, vaginal fluid, cyst (e.g., testicular) fluid, or vaginal irrigation fluid, pleural fluid, ascites fluid, cerebrospinal fluid, saliva, sweat, tears, sputum, bronchoalveolar lavage, and the like. Fecal samples may also be used. In various embodiments, a majority of the DNA in a biological sample (e.g., a plasma sample obtained by a centrifugation protocol) that has been enriched for cell-free DNA can be cell-free (as opposed to cells), e.g., greater than 50%, 60%, 70%, 80%, 90%, 95%, or 99%. The centrifugation protocol may include 3,000g × 10 minutes, obtaining a fluid fraction, and re-centrifuging at 30,000g for an additional 10 minutes to remove residual cells.
A "plasma methylation group" is a methylation group determined from the plasma or serum of an animal (e.g., a human). The plasma methylation group is an example of a cell-free methylation group, as plasma and serum include cell-free DNA. The plasma methylation group is also an example of a mixed methylation group, as it is a mixture of DNA from different organs or tissues or cells within the body. In one embodiment, the cells are hematopoietic cells, including, but not limited to, cells of the erythroid (i.e., erythrocyte) lineage, myeloid lineage (e.g., neutrophils and their precursors), and megakaryocytic lineage. During pregnancy, the plasma methylation set can contain fetal and maternal methylation set information. In patients with cancer, the plasma methylation set can contain methylation set information from tumor cells and other cells in the patient. A "cell methylation set" corresponds to a methylation set determined from cells (e.g., blood cells) of a patient. The methylation group of blood cells is called the blood cell methylation group (or blood methylation group). Techniques for determining methylation sets are further described in PCT patent application No. WO2014/043763, entitled "non-invasive determination of methylation sets of fetuses or tumors from plasma," the disclosure of which is incorporated by reference in its entirety for all purposes.
A "site" corresponds to a single site, which can be a single base position or a group of related base positions, such as CpG sites. A "locus" can correspond to a region that includes multiple loci. A locus may comprise only one site, which would make the locus equivalent to one site in this context.
The "methylation index" of each genomic site (e.g., CpG site) can refer to the proportion of DNA fragments within the total number of reads covering the site that show methylation at that site (e.g., as determined from sequence reads or probes). A "read" can correspond to information obtained from a DNA fragment (e.g., methylation state at a site). Reads can be obtained using reagents (e.g., primers or probes) that preferentially hybridize to DNA fragments of a particular methylation state. Typically, these agents are applied after treatment with methods that modify the DNA molecule according to its methylation state differences, such as bisulfite conversion or methylation sensitive restriction enzymes. The reads may be sequence reads. "sequence reads" refers to a string of nucleotides sequenced from any portion or all of a nucleic acid molecule. For example, the sequence reads can be short nucleotide strings (e.g., 20-150) sequenced from the nucleic acid fragments, short nucleotide strings at one or both ends of the nucleic acid fragments, or sequencing of the entire nucleic acid fragments present in the biological sample. Sequence reads can be obtained in a variety of ways, for example, using sequencing techniques or using probes (e.g., hybridization arrays or capture probes, or amplification techniques such as Polymerase Chain Reaction (PCR) or linear amplification or isothermal amplification using single primers).
The "methylation density" of a region can refer to the number of reads at a site within the region that exhibit methylation divided by the total number of reads in the region that cover the site. The sites may have specific characteristics, for example CpG sites. Thus, a "CpG methylation density" of a region may refer to the number of reads exhibiting CpG methylation divided by the total number of reads covering CpG sites (e.g., a particular CpG site, CpG site within a CpG island, or a larger region) in the region. For example, the methylation density of each 100-kb group (bin) in the human genome can be determined by the ratio of the total number of unconverted cytosines (which correspond to methylated cytosines) at CpG sites after bisulfite treatment to all CpG sites covered by sequence reads mapped to the 100kb region. Other panel sizes, such as 500bp, 5kb, 10kb, 50-kb or 1-Mb, etc., can also be analyzed for this. A region may be a whole genome or a chromosome or part of a chromosome (e.g., a chromosomal arm). When a region includes only one CpG site, the methylation index of that CpG site is the same as the methylation density of the region. The "proportion of methylated cytosines" can refer to the number of cytosine sites "C's" that exhibit methylation (e.g., unconverted after bisulfite conversion) within the total number of cytosine residues analyzed (i.e., cytosines outside of the CpG background are included in the region). Methylation index, methylation density, and ratio of methylated cytosines are examples of "methylation level". In addition to bisulfite conversion, other Methods known to those skilled in the art can be used to query the methylation state of a DNA molecule, including, but not limited to, enzymes sensitive to methylation state (e.g., methylation-sensitive restriction enzymes), methylated binding proteins, single-molecule sequencing using a platform sensitive to methylation state (e.g., nanopore sequencing (Schreiber et al, Proc Natl Acad. Sc. USA 2013; 110:18910-18915), and single-molecule real-time analysis of Pacific Biosciences (Flusberg et al, Methods Nature (Nature Methods) 2010; 7: 461-465)).
"methylation profiles" (also referred to as methylation states) include information about DNA methylation of a region. Information related to DNA methylation may include, but is not limited to, methylation index of CpG sites, methylation density of CpG sites in a region, distribution of CpG sites on adjacent regions, methylation pattern or level of each individual CpG site within a region containing more than one CpG site, and non-CpG methylation. The majority of methylation profiles in the genome can be considered to correspond to the methylation group. "DNA methylation" in the mammalian genome generally refers to the addition of a methyl group to the 5' carbon of a cytosine residue in a CpG dinucleotide (i.e., 5-methylcytosine). DNA methylation can occur in cytosines in other contexts, such as CHG and CHH, where H is adenine, cytosine, or thymine. Cytosine methylation can also be in the form of 5-hydroxymethylcytosine. Non-cytosine methylation is also reported, e.g. N 6 -methyladenine.
"tissue" corresponds to a group of cells that are grouped together as a functional unit. More than one type of cell may be found in a single tissue. Different types of tissue may consist of different types of cells (e.g., hepatocytes, alveolar cells, or blood cells) and may correspond to tissue from different organisms (mother versus fetus) or to healthy cells versus tumor cells. The "reference tissue" corresponds to the tissue used to determine the tissue-specific methylation level. Multiple samples of the same tissue type from different individuals can be used to determine the tissue-specific methylation level of such tissue type. The same tissue from the same individual may exhibit differences at different times due to physiology (e.g., pregnancy) or pathology (e.g., cancer or anemia or infection or mutation). The same tissue from different individuals may exhibit differences due to physiology (e.g., age, gender) or pathology (e.g., cancer or anemia or infection or mutation).
The term "level of a disorder," also referred to as a classification of a disorder, may refer to a classification of the type of disorder, the stage of the disorder, and/or other measures of the severity of the disorder, whether or not the disorder is present. The levels may be numbers or other characters. The level may be zero. The level of the disorder can be used in a variety of ways. For example, a screen may examine whether a person who has not previously been known to have a disorder has a disorder. Assessment may investigate someone who has been diagnosed with a condition to monitor the development of the condition over time, investigate the utility of a therapy, or determine prognosis. In one embodiment, prognosis may be expressed as the likelihood of a patient dying from a disorder or the likelihood of the disorder progressing after a particular duration. Detection may mean 'screening' or may mean checking whether someone with underlying characteristics of the disorder (e.g., symptoms or other positive tests) has the disorder.
Anemia refers to a condition in which the number of red blood cells or their oxygen carrying capacity is insufficient to meet physiological needs, which can vary by age, sex, altitude, smoking and pregnancy status. According to the World Health Organization (WHO) recommendations, anemia can be diagnosed when the hemoglobin concentration of men is below 130g/L and that of women is below 110 g/L. The term "degree of anemia" can be reflected by the hemoglobin concentration of the subject. Lower hemoglobin levels indicate a more severe degree of anemia. According to the WHO recommendation, severe anemia refers to a hemoglobin concentration of <80g/L in men and <70g/L in women, moderate anemia refers to a hemoglobin concentration of 80-109g/L in men and 70-99g/L in women, mild anemia refers to a hemoglobin concentration of 110-129g/L in men and 109g/L in women.
An "isolated value" corresponds to a difference or ratio that relates two values (e.g., two contributions or two methylation levels). The separation value may be a simple difference or a ratio. The separation value may include other factors, such as a multiplication factor. As other examples, a difference or ratio of a function of the values may be used, such as a difference or ratio of the natural logarithms (ln) of the two values. The separation value may include a difference value and a ratio.
As used herein, the term "classification" refers to any number or other character that is associated with a particular characteristic of a sample. For example, a "+" symbol (or the word "positive") may indicate that a sample is classified as having a deletion or an amplification. The classification may be binary (e.g., positive or negative) or have more classification levels (e.g., a scale from 1 to 10 or 0 to 1). The terms "cutoff value" and "threshold value" refer to predetermined numbers used in operations. The threshold may be a value above or below which a particular classification applies. Any of these terms may be used in any of these contexts.
In some embodiments, the contribution of cell-free DNA (also referred to as circulating DNA) from erythroblasts is quantified using one or more methylation markers (e.g., one marker per marker) that are specific for erythroblasts relative to cell-free DNA from other tissues. A label (e.g., a differentially methylated region, DMR) can include a site or a set of sites that contribute to the same label.
The contribution of cell-free DNA from erythroblasts can be used to determine the level of a blood disorder (e.g., anemia). For example, embodiments may be used to analyze anemia in a fetus, neonate, or child. In the context of anemia, the embodiments can be used to study someone suspected of having anemia or having been diagnosed with anemia: (i) to clarify the cause of anemia; (ii) to monitor the progression of the clinical state over time; (iii) to study the effect of the therapy; or (iv) to determine prognosis. Thus, the examples have identified red blood cell DNA as a major component of heretofore unrecognized circulating DNA libraries and as a non-invasive biomarker for the differential diagnosis and monitoring of anemia and other blood disorders.
I. Introduction to the design reside in
Plasma DNA is an increasingly practiced analyte for molecular diagnostics. Research work is underway with respect to its clinical application, particularly in non-invasive prenatal testing (1-7) and oncology (8-12). Despite the wide variety of clinical applications, the tissue source of circulating DNA is not fully understood.
It has been shown that circulating DNA is released primarily from hematopoietic cells using sex-mismatched bone marrow transplantation as a model system (13, 14). Kun et al recently demonstrated that a significant proportion of plasma DNA has methylation signatures for neutrophils and lymphocytes (15). However, there is currently no information as to whether DNA of erythrocyte origin (erythroblasts) can also be detected in plasma.
Red Blood Cells (RBCs) are the largest hematopoietic cell population in the blood. The concentration of Red Blood Cells (RBC) is about 5X 10 per liter of blood 12 And (4) respectively. Given the lifetime of each RBC of about 120 days, the body needs to produce 2 x 10 11 RBC/day or 9.7X 10 9 Individual RBC/hour. Mature RBCs in humans have no nuclei.
During the enucleation step, the erythroblasts lose their nuclei and mature into reticulocytes in the bone marrow (16). The enucleation process is a complex, multi-step process involving tightly regulated cell signaling actions and cytoskeletal actions. Erythroblasts' nuclear material is phagocytosed and degraded by bone marrow macrophages in the erythroblasts islands (e.g., in the bone marrow) (17). We hypothesize that some degraded DNA material from the erythroid lineage of the bone marrow will be released into the circulation.
The examples can identify methylation markers of DNA from red blood cell derived cells and use these markers to determine whether red blood cell DNA is detectable in human plasma. High-resolution reference methylation groups of different tissue and hematopoietic cell types have become publicly available through cooperative projects including the BLUEPRINT Project (18, 19) and the Roadmap Epigenomics Project (20). We and others have previously demonstrated that it is possible to follow the source of plasma DNA by analysis of tissue-associated methylation markers (15, 21, 22). Additional details of such an assay to determine the contribution of certain tissues to a cell-free mixture (e.g., plasma) can be found in PCT patent application No. WO 2016/008451 entitled "methylation pattern analysis of tissues in DNA mixtures," the disclosure of which is incorporated by reference in its entirety for all purposes.
To validate our hypothesis and confirm the presence of red blood cell DNA in plasma, we identified erythroblasts-specific Differentially Methylated Regions (DMR) by analyzing methylation profiles of erythroblasts and other tissue types. Based on these findings, we developed digital Polymerase Chain Reaction (PCR) analysis targeting erythroblasts-specific DMR to enable quantitative analysis of red blood cell DNA in biological samples. Specifically, using high resolution methylation profiles of erythroblasts and other tissue types, three genomic loci were found to be hypomethylated in erythroblasts but highly methylated in other cell types. Digital PCR analysis was developed for measuring red blood cell DNA using differentially methylated regions of each locus.
We applied these digital PCR analyses to study plasma samples of healthy subjects and patients with different types of anemia. We also explored the potential clinical utility of the assay in the assessment of anemia. Although the examples use PCR analysis, other analyses, such as sequencing, may also be used.
In subjects with anemia of different etiology, we show that quantitative analysis of circulating red blood cell DNA (e.g., using methylation markers) reflects erythropoietic activity in the bone marrow. For patients with reduced erythropoietic activity, as exemplified by aplastic anemia, the percentage of circulating red blood cell DNA is reduced. For patients with increased but failed erythropoiesis, as exemplified by β -thalassemia major, the percentage increases. In addition, plasma levels of red blood cell DNA were found to correlate with therapeutic responses to aplastic anemia and iron deficiency anemia. Plasma DNA analysis using digital PCR analysis targeting the other two differentially methylated regions showed similar findings.
Differentially methylated regions of erythroblasts (DMR)
We hypothesize that the process of enucleation of red blood cells or other processes involved in the maturation of RBCs will contribute significantly to the pool of circulating cell-free DNA. To determine the contribution of circulating DNA from erythroblasts, we identified Differentially Methylated Regions (DMR) in erythroblasts DNA by comparing the DNA methylation profiles of erythroblasts with other tissues and blood cells. We studied the methylation profiles of erythroblasts and other blood cells (neutrophils, B-lymphocytes and T-lymphocytes) and tissues (liver, lung, colon, small intestine, pancreas, adrenal gland, esophagus, heart, brain and placenta) and the methylation groups generated by our group from the BLUEPRINT project and roadmap epigenomics project (18-20, 23).
In a simple example, one or more DMR can be used directly to determine the contribution of circulating DNA from red blood cells, for example by determining the percentage of DNA fragments that are methylated (for highly methylated DMR) or unmethylated (for hypomethylated DMR). The percentages may be used directly or modified (e.g., multiplied by a scaling factor). Other embodiments may perform more complex procedures, such as solving a linear system of equations. The contribution of M tissues can be calculated using the methylation levels at N genomic sites, where M is less than or equal to N, as described in PCT patent application No. WO 2016/008451. The methylation level at each site can be calculated for each tissue. A system of linear equations Ax ═ b can be solved, where b is a vector of measured methylation densities for N sites, x is a vector of contributions of M tissues, and a is a matrix of M rows and N columns, where each row provides the methylation densities of N tissues at a particular site in that row. If M is less than N, then a least squares optimization can be performed. Matrix a of size N × M may be formed from tissue-specific methylation levels of a reference tissue, as obtained from the sources described above.
Identification of dmr
To identify Differentially Methylated Regions (DMR), a particular type of tissue/cell lineage (e.g., erythroblasts) can be isolated and subsequently analyzed, e.g., using methylation-aware sequencing, as described herein. Methylation density of sites across tissue types (e.g., only two types of erythroblasts and others) can be analyzed to determine if there is a sufficient difference to identify sites for use in DMR.
In some embodiments, one or more of the following criteria may be used to identify methylation markers for erythroblasts. (1) If the methylation density of CpG sites is less than 20% in erythroblasts and more than 80% in other blood cells and tissues, the CpG sites are hypomethylated in erythroblasts and vice versa. (2) To be DMR, a region may be required to include multiple CpG sites (e.g., 3, 4, 5 or more) that are hypomethylated. Thus, a fragment of multiple CpG sites within a DMR can be selected for analysis by analysis in order to improve the signal-to-noise ratio and specificity of the DMR. (3) The DMR can be selected to have a size representative of the DNA molecules in the cell-free mixture. In plasma, mainly short DNA fragments, most of which are shorter than 200bp (1, 24, 25). For the example of determining the presence of red blood cell DNA molecules in plasma, DMR can be defined within a representative size of plasma DNA molecules (i.e. 166bp) (1). Variations of these criteria may be used in combination with the three criteria, e.g. different thresholds other than 20% and 80% may be used to identify CpG sites as hypomethylation. As discussed later, some results used selected CpG sites within three erythroblast-specific DMRs that are hypomethylated in erythroblasts.
Using the criteria defined above, we identified three erythroblasts-specific DMR in the whole genome. One DMR is in the intron region of the Ferrochelatase (FECH) gene on chromosome 18. In this region, the difference in methylation density between erythroblasts and other cell types was greatest among the three DMRs identified. The FECH gene encodes ferrochelatase, an enzyme responsible for the final step in heme biosynthesis (26). As shown in fig. 1, four selected CpG sites within erythroblast-specific DMRs are hypomethylated in erythroblasts, but highly methylated in other blood cells and tissues.
FIG. 1 shows methylation density of CpG sites within a promoter of a Ferrochelatase (FECH) gene according to an embodiment of the present invention. The FECH gene is located on chromosome 18, and the genomic coordinates of CpG sites are shown on the X-axis. As shown, the methylation density of CpG sites is within the intron region of the FECH gene. The four CpG sites located within the region 110 bounded by the two vertical dashed lines are hypomethylated in erythroblasts but highly methylated in other tissues or cell types. For purposes of illustration, individual results for lung, heart, small intestine, colon, thymus, stomach, adrenal gland, esophagus, bladder, brain, ovary, and pancreas are not shown. Their average values are indicated by "other organizations".
Due to hypomethylation of CpG sites located within this region, the unmethylated sequences of all four CpG sites within the two dashed lines in FIG. 1 will be enriched for DNA derived from erythroblasts. Thus, the amount of hypomethylated sequences in a DNA sample will reflect the amount of DNA from erythroblasts.
An assay was developed to detect methylated or unmethylated DNA at the identified CpG sites. The higher the number of CpG within the plasma DNA molecule, the more specific the assay will be. Most plasma DNA molecules are smaller than 200bp, and the average is 166 bp. Thus, CpG sites may all be within 166bp of each other, but may also be within 150, 140, 130, 120, 110 or 100bp of each other. In other embodiments, only paired CpG sites may be within such a distance from each other.
In other embodiments, a CpG site may be defined as hypomethylated in erythroblasts if the methylation density of the CpG site is less than 10% (or other threshold) in erythroblasts and exceeds 90% (or other threshold) in all other tissues and blood cells. If the methylation density of CpG sites is above 90% (or other threshold) in erythroblasts and below 10% (or other threshold) in all other tissues and blood cells, then a CpG site can be defined as being highly methylated in erythroblasts. In some embodiments, a DMR may have at least two CpG sites within 100bp, all showing differential methylation of erythroblasts.
In one embodiment of a differentially useful DMR, it may be required that all CpG sites within 100bp (or some other length) exhibit hypomethylation or hypermethylation in erythroblasts as compared to all other tissues and blood cells. For example, multiple CpG sites may span 100bp or less on a reference genome corresponding to a mammal. As another example, each CpG site may be within 100bp of another CpG site. Thus, CpG sites can span over 100 bp.
In some embodiments, one or more differentially methylated regions can be identified in the following manner. Methylation indices (e.g., densities) at multiple sites can be obtained for each of multiple cell lineages, including particular blood cell lineages and other cell lineages, e.g., as shown in fig. 1. At each of the multiple sites, methylation indices of multiple cell lineages can be compared to one another. Based on the comparison, one or more sites of a plurality of sites can be identified, each site having a methylation index in a particular blood cell lineage that is below/above a first methylation threshold and a methylation index in each other cell lineage that is above/below a second methylation threshold. In this way hypomethylated sites and/or highly methylated sites can be identified. Examples of the first methylation threshold are 10%, 15% or 20% for hypomethylated sites, where examples of the second methylation threshold may be 80%, 85% or 90%. Differentially methylated regions containing one or more sites can then be identified, for example, using the criteria described above.
B. Detection of methylated and unmethylated DNA sequences
To detect methylated and unmethylated DNA sequences at erythroblasts-specific DMRs, two digital PCR analyses can be developed: one targeting unmethylated sequences and the other targeting methylated sequences. In other embodiments, other methods can also be used to detect and/or quantify methylated and unmethylated sequences of DMR, such as methylation-aware sequencing (e.g., bisulfite sequencing or sequencing after biochemical or enzymatic processes that will differentially modify DNA based on their methylation state), real-time methylation-specific PCR, methylation-sensitive restriction enzyme analysis, and microarray analysis. Thus, other types of analysis may be used in addition to PCR analysis.
In one example, erythroblasts DMR can be detected after bisulfite treatment. The methylation status of a CpG site can be determined based on the detection result (e.g., PCR signal). For the FECH gene, following bisulfite treatment for sequencing, the following primers can be used to amplify red blood cell DMR: 5'-TTTAGTTTATAGTTGAAGAGAATTTGATGG-3', and 5'-AAACCCAACCATACAACCTCTTAAT-3'.
In another example, to increase the specificity of the assay, two forward primers can be used that encompass both the methylated and unmethylated state of a particular CpG. Such primer sets for two digital PCR analyses specifically targeting methylated and unmethylated sequences are listed below.
| Primer/probe | Sequence of |
| Forward primer-1 | 5′-TTGAAGAGAATTTGATGGTATGGGTA-3′ |
| Forward primer-2 | 5′-TGAAGAGAATTTGATGGTACGGGTA-3′ |
| |
5′- |
| Fluorescent probe | |
| 5′-FAM-TTGTGTGGTGTAGAGAG-MGB-3′ |
Table 1: analysis for specific detection of unmethylated sequences.
| Primer and method for producing the same | Sequence of |
| |
5′-TTGAAGAGAATTTGATGGTATGGGTA-3′ |
| 5′-TGAAGAGAATTTGATGGTACGGGTA-3′ | |
| |
5′-CAAATCTCTCTAATTTCCGAACACG-3 |
| Fluorescent probe | |
| 5′-VIC-TGCGTGGCGTAGAG-MGB-3′ |
Table 2: analysis for the specific detection of methylated sequences
The underlined nucleotides in the reverse primer and probe are differentially methylated cytosines at the CpG site. The reverse primers and probes for the unmethylated and methylated analyses bind specifically to the unmethylated and methylated sequences due to the differences at the underlined nucleotides.
C. Confirmation using universally methylated and universally unmethylated DNA
Analyses of the universally methylated and universally unmethylated DNA were performed to confirm the accuracy of both analyses.
The universally methylated sequences from CpGenome human methylated DNA (EMD Millipore) and the universally unmethylated sequences from epitec unmethylated human control DNA (Qiagen) were used to confirm the specificity of two digital PCR assays designed to detect and quantify methylated and unmethylated sequences at erythroblast-specific DMRs. CpGenome human methylated DNA was purified from HCT116DKO cells, followed by enzymatic methylation of all CpG nucleotides using m.sssi methyltransferase. The universally methylated and universally unmethylated DNA sequences were run on the same plates as the positive and negative controls. The cut-off value for positive fluorescence signal was determined with reference to the control. The number of methylated and unmethylated DNA sequences in each sample was calculated from the multiple wells using combined counts followed by Poisson correction (Poisson correction) (4).
FIGS. 2A and 2B show analysis of universally methylated and unmethylated DNA using a digital PCR assay designed to detect methylated and unmethylated DNA according to an embodiment of the present invention. The vertical axis corresponds to the intensity of the relative fluorescence signal of the unmethylated sequences. The horizontal axis corresponds to the intensity of the relative fluorescence signal of the methylated sequence. Data was generated using DNA known to be methylated or unmethylated. These assays are intended to demonstrate the specificity of the assay for methylated or unmethylated DNA.
For analysis of prevalent unmethylated DNA, amplified signals (blue dots 210 in subgraph 205 of fig. 2A corresponding to positive FAM signals) were detected using analysis for unmethylated DNA, where blue dots 210 were not detected when using analysis for methylated DNA (subgraph 255 of fig. 2B). To analyze ubiquitously methylated DNA, an amplified signal (green spot 220 in panel 250 of fig. 2B corresponding to a positive VIC signal) was detected using an analysis for methylated DNA, where no green spot 220 was detected using an analysis for unmethylated DNA (panel 200 of fig. 2A). The black dots in each plot represent droplets without any amplified signal. The thick vertical and horizontal lines within each of the four plots represent the threshold fluorescence signal for a positive result. These results confirm the specificity of both assays for methylated and unmethylated DNA of erythroblasts-specific DMR.
To further assess the analytical sensitivity of the assay based on the FECH gene-associated DMR, samples with unmethylated sequences were serially diluted at a specific fractional concentration (i.e., percentage of unmethylated sequences in all (unmethylated and methylated) sequences at the FECH gene-associated DMR). There were a total of 1,000 molecules per reaction. Unmethylated sequences can be detected as low as 0.1% of the total amount of methylated and unmethylated sequences (see Table 3).

Table 3: sensitivity assessment for analysis of targeted FECH gene-associated DMR, concentration measured at different input concentrations of unmethylated sequences (percentage of unmethylated sequences).
Furthermore, to assess potential changes (e.g., from pipetting), we repeatedly measured the percentage of unmethylated sequences in an artificially mixed sample of methylated and unmethylated sequences in 20 separate reactions at a specific fractional concentration (unmethylated sequences% ═ 30%). We used a total of 500 methylated and unmethylated molecules for each reaction. This number is comparable to the number we observed in the total number of methylated and unmethylated molecules in digital PCR analysis of plasma DNA samples. We observed an average of 30.4% and a standard deviation of 1.7% for the percentage of unmethylated sequences measured in 20 replicates. The coefficient of variation in the analysis was calculated to be 5.7%.
Specificity and sensitivity of analysis for different samples
To confirm the tissue specificity of digital PCR analysis of FECH gene-associated DMR targeting red blood cell DNA, we tested digital PCR analysis in various samples with different erythroblasts amounts as measured using techniques other than these digital PCR analyses. The amount of unmethylated DNA sequence detected by digital PCR analysis should reflect the amount of red blood cell DNA. Similarly, the amount of methylated sequences should reflect DNA from other tissues or cell types. Therefore, we defined the percentage of erythrocyte DNA in the biological sample (E%) as the percentage of unmethylated sequences among all detected (unmethylated and methylated) sequences at the erythroblasts-specific DMR. Therefore, blood samples were analyzed using an analysis specific for the methylated and unmethylated sequences of the DMR regions to determine the correlation between the percentage of unmethylated sequences, Unmeth% (also referred to as E%), and the presence of DNA from erythroblasts. Unmeth% (E%) is an example of methylation level.
The percentage of red blood cell DNA (E%) was calculated as:

since the difference in methylation density between red blood cells and other cell types is greatest for DMR within the FECH gene, we first performed an E% analysis based on this marker site to demonstrate our hypothesis. Subsequently, we analyzed E% based on the other two erythroblasts-specific DMRs in the sample subset to verify the E% results from the FECH gene-related DMRs. The E% results based on DMR within the FECH gene will be expressed by E% (FECH). Other percentages or ratios can also be used, such as a percentage of methylated sequences, or a ratio of only methylated sequences to unmethylated sequences, where any value can be in the numerator and denominator of the ratio.
Specifically, digital PCR was used to determine the number of methylated and unmethylated DNA sequences in each sample at the four CpG sites on the FECH gene of fig. 1. Subsequently, the percentage of unmethylated DNA in the sample was calculated (Unmeth%/E%). In one example, for a DNA fragment that is considered unmethylated, all four CpG sites are unmethylated.
Two cases were used to test the ability of the analytical signal to quantify erythroblasts. One situation is cord blood compared to adult blood, because the two types of samples differ in the number of erythroblasts. Also, for other cases, subjects with beta-severe thalassemia have appreciable numbers of erythroblasts in their blood.
A. Erythrocyte enriched samples compared to buffy coat of healthy subjects
The number of erythroblasts in adult human blood is extremely low. Cord blood has a higher number of erythroblasts. Therefore, the E% of four CpG sites in cord blood should be much higher than that of healthy patients. Thus, to confirm the tissue specificity of digital PCR analysis of FECH gene-associated DMR targeting red blood cell DNA, we tested digital PCR analysis in samples including DNA extracted from 12 different normal tissue types and erythroblasts-rich samples. We included 4 samples from different individuals for each tissue type. Erythroblasts-rich samples were prepared from cord blood for analysis.
Specifically, to confirm the relationship between methylation density at DMR and E%, venous blood samples were collected from 21 healthy subjects and 30 pregnant women (10 in early pregnancy, 10 in mid-pregnancy and 10 in late pregnancy). The blood sample was centrifuged at 3,000g for 10 minutes to separate plasma and blood cells. The buffy coat was collected after centrifugation. Plasma samples were collected and centrifuged again at 30,000g to remove residual blood cells.
As for the 12 different normal tissue types, we included 4 samples from different individuals for each tissue type. As shown in Table 4, the median E% (FECH) of DNA from all tissues was low (median range: 0.00% to 2.63%).
| Tissue of | Median E% |
| Liver disease | 0.12% |
| Lung (lung) | 1.33% |
| Esophagus | 2.63% |
| Stomach (stomach) | 2.58% |
| Small intestine | 2.33% |
| Colon | 1.51% |
| Pancreas gland | 0.12% |
| Adrenal gland | 0.00% |
| Bladder of urinary bladder | 1.20% |
| Heart and heart | 0.82% |
| Brain | 1.94% |
| Placenta hominis | 0.10% |
Table 4. table shows the median percent of red blood cell DNA (E% (FECH)) in 4 groups of 12 tissue types, where each tissue sample was obtained from a different individual.
The experimental procedure for enrichment from cord blood by flow cytometry and cell sorting and subsequent DNA extraction is described below. After delivery, 1-3mL of cord blood was collected from each of eight pregnant women. Monocytes were isolated from cord blood samples after density gradient centrifugation using the Ficoll-Paque PLUS kit (GE Healthcare). After collection of monocytes, 1X 10 cells were added 8 A1 mL mixture of anti-CD 235a (glycophorin A) and Phycoerythrin (PE) conjugated anti-CD 71 antibodies (Miltenyi Biotec), each cell conjugated with Fluorescein Isothiocyanate (FITC), was diluted 1:10 in phosphorus at a rate of 1:10The acid salt buffered saline was incubated together in the dark at 4 ℃ for 30 minutes. Sorting and analysis of CD235a + CD71+ cells was then performed using a BD FACSAria fusion cell sorter (BD Biosciences). Since CD235a and CD71 are specifically present in erythroblasts, CD235a + CD71+ cells will be enriched for erythroblasts (Bianchi et al, "Prenatal Diagnosis (Prenatal Diagnosis); 13: 293-). 300).
Cells from eight cases were pooled for downstream analysis due to the lower number of cells obtained from each case. These two antibodies are specific for erythroblasts and attach to the surface of the erythroblasts. These two antibodies were conjugated with FITC and phycoerythrin, respectively. These two substances are bound to magnetic beads and the beads can be sorted using a cell sorter. Thus, Ab-labeled erythroblasts can be captured. Erythroblasts were enriched from 8 cord blood samples using flow cytometry and cell sorting with anti-CD 71 (transport protein receptor) and anti-CD 235a (glycophorin a) antibodies (see supplementary materials and methods), and subsequently pooled. DNA was extracted from the pooled samples.
The E% (FECH) of DNA from pooled cord blood samples was 67% at the four CpG sites tested in the analysis of CD235a + CD71+ cells (mostly erythroblasts). With respect to the E% (FECH) of buffy coat DNA of 20 healthy subjects, which had undetectable amounts of erythroblasts in their peripheral blood, the median E% of buffy coat DNA was 2.2% (four-quadrant spacing: 1.2-3.1%). The low proportion of erythroblasts-specific unmethylated sequences observed in the buffy coat of healthy subjects is consistent with the fact that mature RBCs do not have nuclei. Since CD235a and CD71 are cell surface markers specific for erythroblasts (Bianchi et al, prenatal diagnostics 1993; 13:293-300), the high E% (FECH) in cells enriched in CD235a and CD71 shows that analysis of unmethylated DNA at erythroblasts-specific DMR enables the detection of erythroblasts-derived DNA. Thus, this high E% for erythroblasts-rich samples, as well as the low E% results for DNA from other tissue types and buffy coat DNA from healthy subjects, show that digital PCR analysis of unmethylated FECH sequences is specific for erythroblasts-derived DNA.
B. For patients with beta-thalassemia major
In patients suffering from beta-thalassemia major, the bone marrow attempts to produce large numbers of Red Blood Cells (RBCs). However, the production of hemoglobin is defective. As a result, many RBCs do not contain sufficient hemoglobin and contain a large excess of alpha globin chains. These defective RBCs will be removed from the bone marrow and will never become mature RBCs. There are two types of globin chains: α and β. Two alpha chains and two beta chains are required for one hemoglobin molecule. If the beta chain is not produced, the excess alpha chains will aggregate together and fail to form functional hemoglobin.
In patients with beta-thalassemia major, increased but ineffective erythropoiesis will result in decreased production of mature RBCs (Schrier et al, Current Opinion in Hematology 2002; 9: 123-6). This is accompanied by compensatory extramedullary hematopoiesis and the presence of nucleated red blood cells in the circulation. As described below, patients with beta-thalassemia major will have more nucleated red blood cells than healthy patients. The number of nucleated RBCs in peripheral blood can be counted on a blood smear and expressed as the number of nucleated RBCs per 100 White Blood Cells (WBCs).
Since patients with thalassemia major often have higher numbers of erythroblasts in the peripheral blood than healthy individuals due to ineffective erythropoiesis (27), such patients also provide a good mechanism for the specificity and sensitivity of the test assay. Therefore, we tested our digital PCR analysis for sensitivity in buffy coat DNA in fifteen patients with β -thalassemia major. All of these patients had detectable numbers of erythroblasts in peripheral blood as measured by an automated hematology analyzer (UniCel DxH 800 Coulter cell analysis system, Beckman Coulter) and confirmed by manual counting.
Fig. 3A is a graph showing the correlation between E% (FECH) and the number of nucleated RBCs (erythroblasts) in blood cells according to an embodiment of the present invention. E% was measured by digital PCR analysis targeting FECH gene-associated DMR. As shown on the axis, the graph shows the correlation between the percentage of erythrocyte DNA sequence in buffy coat DNA (E% (FECH)) and the percentage of erythroblasts in all peripheral leukocytes, as measured using an automated hematology analyzer.
As shown in fig. 3A, E% (FECH) of buffy coat DNA correlates well with the percentage of erythroblasts in peripheral blood leukocytes measured by hematology analyzers (r ═ 0.94, P <0.0001, Pearson correlation). A good linear relationship between E% in the buffy coat and erythroblast counts for thalassemia patients shows that digital PCR analysis provides a good quantitative measure of the DNA content of erythrocytes in a sample, since erythroblasts are not methylated for DMR and other blood cells are methylated. Thus, the higher the proportion of erythroblasts in the blood sample, the higher the E% will be. The purpose of this experiment was to demonstrate that the assay can be used to reflect the amount of erythroblasts-derived DNA in the sample. These results further support that the E% of the FECH gene reflects the proportion of DNA derived from erythroblasts.
This correlation will also exist for other patients. However, since the number of erythroblasts may be higher for patients with beta-thalassemia major, their samples provide a good test for identifying this correlation. As can be seen in fig. 3A, patients have a wide range of E% and high erythroblasts, providing a good mechanism for test correlation.
C. Method for determining the amount of cellular DNA of a particular cell lineage
In some embodiments, the amount of unmethylated or methylated DNA fragments in a cell-free mixture (e.g., a plasma or serum sample) can be used to determine the number of cells (or other amounts of DNA) of a particular cell lineage when the amount is counted at one or more DMR specific for that cell lineage. As shown in fig. 3A, the percentage of unmethylated DNA fragments at the FECH DMR correlates with the number of erythroblasts in the blood sample. Absolute concentrations may also be used. For highly methylated DMR, the amount (e.g., percentage or absolute concentration) of methylated DNA fragments can be used. As described herein, various cell lineages can be used.
To determine the number of cells, a calibration function may be used. In the example of fig. 3A, a line fit to the data points may provide a calibration function. For example, the calibration function may be stored by its function parameters (e.g., slope and y-intercept of a line, or more parameters for other functions) or by a set of data points from which a curve fit may be obtained. When determining the number of erythroblasts, the data points (e.g., referred to as calibration data points) can have known values for the amount of DNA of the cell lineage (e.g., cell number), as can be determined by another technique.
Thus, one method can determine the amount of DNA from a particular cell lineage in a blood sample. As described herein, several methylated or unmethylated sequences of one or more DMR can be determined from the analysis. The methylation level can be determined and compared to a calibrated value for the calibration function. For example, the methylation level can be compared to a line (or other calibration function) to determine the intersection of the function with the methylation level, and thus the corresponding amount of DNA (e.g., a value on the horizontal axis of fig. 3A). In other embodiments, the methylation level can be compared to various calibration data points, e.g., having a methylation level that is close to the measured methylation level of the sample.
FIG. 3B is a flow diagram illustrating a method 300 for determining the amount of cells of a particular cell lineage in a biological sample by analyzing cell-free DNA, according to an embodiment of the invention. The method 300 may use measurements such as those shown in fig. 3A. Portions of method 300 may be performed manually, while other portions may be performed by a computer system. In one embodiment, the system may perform all of the steps. For example, the system may include a robotic element (e.g., to obtain a sample and perform an analysis), a detection system for detecting signals from the analysis, and a computer system for analyzing the signals. Instructions for controlling this system may be stored in one or more computer readable media, such as Field Programmable Gate Arrays (FPGAs), flash memory, and/or configuration logic of a hard drive. Such a system is shown in fig. 27.
At block 310, a cell-free mixture of a biological sample is obtained. The biological sample may be a blood sample, but may also be other samples comprising cell-free DNA, as described herein. Examples of cell-free mixtures include plasma or serum. The cell-free mixture can include cell-free DNA from multiple cell lineages.
At block 320, the DNA fragments in the cell-free mixture are contacted with an assay corresponding to one or more differentially methylated regions. Each of the one or more differentially methylated regions is specific for a particular cell lineage (e.g., a particular blood cell lineage, such as erythroblasts) by hypomethylation or hypermethylation relative to other cell lineages.
In various embodiments, the analysis may involve PCR or sequencing. Contacting with the DNA fragments may involve flowing cells, droplets, beads, or other mechanisms to provide for analysis of interactions with the DNA fragments. Examples of such analyses include whole genome bisulfite sequencing, targeted bisulfite sequencing (by hybridization capture or amplicon sequencing), other methylation-aware sequencing (e.g., single molecule real-time (SMRT) DNA sequencing by pacific biosciences), real-time methylation-specific PCR, and digital PCR. Other examples of assays that can be used in method 300 are described herein (e.g., in section XII). Although the example fig. 3A is directed to erythroblasts, other cell lineages, including other blood cell lineages, can be used.
At block 330, based on the signal obtained from the analysis, a first amount of methylated or unmethylated DNA fragments is detected in the cell-free mixture at the one or more differentially methylated regions. The analysis may provide various signals, such as optical or electrical signals. The signal may provide a specific signal for each DNA fragment, or an aggregate signal indicative of the total number of DNA fragments with methylation markers (e.g., as in real-time PCR).
In one embodiment, sequencing can be used to obtain sequence reads of the DNA fragments, and the DNA fragments can be aligned with the reference genome. If the DNA fragment aligns with one of the DMRs, a counter may be incremented. Given that the signal is from an unmethylated analysis of a particular methylation, it can be assumed that the DNA fragment has the methylation signature. In another embodiment, reads from a PCR (e.g., light signals from a positive well) may be used to increment such a counter.
At block 340, a first methylation level is determined using the first amount. The first methylation level can be normalized or an absolute concentration, e.g., per volume of the biological sample. An example of absolute concentrations is provided in fig. 25.
For normalized values, the first number and total number of DNA fragments in the cell-free mixture at one or more differentially methylated regions can be used to determine the methylation level. As described above, the methylation level can be a percentage of unmethylated DNA fragments. In other embodiments, the percentage may be a percentage of methylated DNA fragments that will have an inverse relationship to the above example of erythroblasts. In various embodiments, the methylation level can be determined using the percentage of all sites in the DMR, by the average of the individual percentages per site or a weighted average of each site.
At block 350, one or more calibration data points are obtained. Each calibration data point may specify (1) the amount of cells of a particular blood cell lineage and (2) a calibration methylation level. One or more calibration data points are determined from the plurality of calibration samples.
The amount of cells can be specified as a particular amount (e.g., number or concentration) or a range of amounts. Calibration data points can be determined from a calibration sample having a known cell mass, which can be measured by various techniques described herein. At least some of the calibration samples will have different amounts of cells, but some calibration samples may have the same amount of cells.
In various embodiments, one or more calibration points may be defined as one discrete point, a set of discrete points, as a function, as one discrete point and function, or any other combination of discrete or continuous sets of values. As an example, calibration data points can be determined from a calibration methylation level of a sample having a particular cell mass of a particular lineage.
In one embodiment, measurements of the same methylation level from multiple samples of the same cell mass can be combined to determine a calibration data point for a particular cell mass. For example, an average of methylation levels can be obtained from methylation data of samples of the same cell mass to determine a particular calibration data point (or to provide a range corresponding to a calibration data point). In another embodiment, multiple data points with the same calibration methylation level can be used to determine the average amount of cells.
In one embodiment, the methylation level is measured for a number of calibration samples. A calibration value for the methylation level of each calibration sample is determined, where the methylation level can be plotted against a known cell mass of the sample (e.g., as shown in fig. 3A). A function may then be fitted to the data points of the map, where the function fit defines calibration data points for determining the cell mass of the new sample.
At block 360, the first methylation level is compared to a calibration methylation level at the at least one calibration data point. The comparison may be made in various ways. For example, the comparison can be whether the first methylation level is above or below the calibration methylation level. The comparison can involve comparison to a calibration curve (consisting of calibration data points), and thus the comparison can identify a point on the curve having the first level of methylation. For example, a calculated value X of the first methylation level can be used as an input to a function F (X), where F is a calibration function (curve). The output of F (X) is the cell mass. An error range may be provided which may be different for each X value, providing a range of values as an output of f (X).
At block 370, the amount of cells of a particular cell lineage in the biological sample is estimated based on the comparison. In one embodiment, it may be determined whether the first methylation level is above or below a threshold calibration methylation level, thereby determining whether the amount of cells of the sample of the invention is above or below the amount of cells corresponding to the threshold calibration methylation level. For example, if the biological first methylation level X is calculated 1 Higher than calibration methylation level X C Then the amount of cells N of the biological sample can be determined 1 Higher than corresponding to X C Cell number N of C . This relationship of above and below mayIn a defined manner depending on the parameters. In this embodiment, only one calibration data point may be required.
In another embodiment, the comparison is accomplished by inputting the first methylation level into a calibration function. By identifying a point on the curve corresponding to the first methylation level, the calibration function can effectively compare the first methylation level to the calibration methylation level. The estimated cell mass is then provided as an output value of the calibration function.
Source of cell-free DNA of erythroblasts in plasma
Using the relationship established between Unmeth% and red blood cell-derived DNA, Unmeth% of plasma can be used to quantify red blood cell-derived DNA in plasma. The above analysis was used to determine the% Unmeth in plasma. Differences in% Unmeth in buffy coat and plasma were observed. Analysis showed that cell-free erythroblasts DNA in plasma was derived from erythropoiesis in the bone marrow, not from erythroblasts in the bloodstream.
After confirming that the Unmeth% determined by the two digital PCR analyses accurately reflects the amount of erythroblast-derived DNA in the sample, we further compared the proportion of erythroblast-derived DNA in the buffy coat and plasma of healthy control subjects and pregnant women.
Fig. 4 shows the% umeth in buffy coat and plasma of healthy non-pregnant subjects and pregnant women of different gestation periods according to an embodiment of the invention. For each group of subjects, the plasma samples had significantly higher Unmeth than buffy coat (P <0.01 for Wilcoxon sign-rank test (Wilcoxon sign-rank test) for each pair of comparisons between plasma and buffy coat).
The results in fig. 4 show that the amount of erythroblast-derived DNA is lower in the blood cells, as would be expected due to the lower number of nucleated RBCs. The unexpected result was that the amount of erythroblasts-derived DNA in plasma was higher. If the erythroblasts-derived DNA in plasma is derived from blood cells, it is expected that the two amounts are similar. Thus, this data shows that the source of erythroblast-derived DNA in plasma is from erythropoiesis in bone marrow.
Fig. 5 is a graph showing the lack of correlation between the% Unmeth in buffy coat and plasma. No significant correlation was observed between the buffy coat and Unmeth% of plasma DNA (R) 2 0.002, P0.99, pearson correlation). The lack of correlation can be seen for all subjects including non-pregnant subjects, early pregnant women, mid-pregnant women and late pregnant women. As with the results in fig. 4, this is unexpected, and one would expect that erythroblasts are derived from blood cells in the bloodstream to be related to each other if the source of the DNA.
The observation that plasma DNA has a much higher% Unmeth than buffy coat and the lack of correlation between% Unmeth of plasma and buffy coat indicates that circulating cell-free DNA carrying erythroblasts methylation markers may be derived from bone marrow during the erythropoiesis process, not from circulating blood cells. Thus, cell-free plasma DNA with erythroblastic methylation markers is produced in the bone marrow, as opposed to by nucleated RBCs in the blood stream, because the number of nucleated RBCs in the blood stream is extremely low in healthy subjects and in pregnant women. Also, since the contribution of White Blood Cells (WBCs) to erythroblasts methylation markers is very low, this contribution does not provide a measurable dependence on cell-free plasma DNA with erythroblasts methylation markers.
Methylation levels as a measure of erythropoietic activity
Based on the above observations, we determined that the% Unmeth at erythroblasts DMR will reflect erythropoietic activity in bone marrow. High Unmeth% will indicate high erythropoietic activity. In other words, analysis of erythroblasts DNA in plasma/serum will be used as a liquid biopsy of bone marrow. This analysis would be particularly useful for studying anemia, for example, to determine whether the anemia is due to reduced erythropoiesis (e.g., aplastic anemia), defective erythropoiesis (e.g., failure of mature RBC production in thalassemia), or increased RBC depletion (e.g., blood loss and hemolytic anemia). To this end, we recruited 35 healthy subjects and 75 anemia patients with different etiologies. Peripheral blood sample collection and processing, plasma and buffy coat DNA extraction, and bisulfite conversion of DNA were performed. More details about the method are described in section XII.
A. Measurement of cell-free erythrocyte DNA in plasma of healthy subjects
After confirming the specificity of our analysis, we used these analyses to analyze the plasma of healthy subjects. We analyzed E% (FECH) in the plasma of 35 healthy subjects, including 20 subjects of the same group who also provided buffy coat samples. The median E% (FECH) of the plasma DNA was 30.1% (quartet: 23.8-34.8%). This indicates that red cell DNA constitutes a significant proportion of the circulating DNA pool in the plasma of healthy individuals. To determine the source of plasma red blood cell DNA, we compared the corresponding E% (FECH) results in the plasma and buffy coat of 20 healthy subjects.
Fig. 6A and 6B show the percentage of red blood cell DNA (E% (FECH)) in healthy subjects. Fig. 6A shows the E% of buffy coat DNA and plasma DNA of healthy subjects, where the value of E% is higher in plasma (cell-free fraction) than in the buffy coat (cell fraction). The median E% (median: 26.7%, interquartile: 23.7-30.4%) of the plasma DNA was significantly higher than in paired buffy coat DNA (median: 2.2%, interquartile: 1.2-3.1%) (P <0.0001, wilcoxon signed rank test).
Figure 6B shows the lack of correlation between E% in buffy coat DNA and plasma DNA of corresponding healthy subjects. There is a lack of correlation between paired E% (FECH) results in plasma DNA and buffy coat DNA (r 0.002, P0.99, pearson correlation). Two findings in fig. 6A and 6B show that circulating red blood cell DNA is unlikely to originate primarily from circulating erythroblasts in peripheral blood.
Figure 7 shows the lack of correlation between the E% (FECH) results for plasma DNA and the age of healthy subjects. The graph shows that the E% (FECH) results are independent of the age of the subject (r 0.21, p 0.23, pearson correlation).
B. Differentiation between patients with beta-thalassemia major and aplastic anemia
After determining that red blood cell DNA in plasma is not predominantly released from intact erythroblasts in the circulation, we propose that these DNA molecules are more likely to be released from the bone marrow during erythropoiesis. We conclude that quantitative analysis of erythrocyte DNA in plasma can provide information about erythropoietic activity in bone marrow.
To confirm the ability to measure erythropoietic activity in bone marrow using plasma, patients with β -thalassemia major and aplastic anemia were recruited from the Department of Medicine (Department of Medicine) of the Prince of waters Hospital, hong kong. Venous blood samples were collected prior to transfusion. Unmeth% of plasma DNA from each patient was determined by digital PCR. These results correlate with hemoglobin levels. Hemoglobin levels can be measured by techniques known to those skilled in the art, such as by photometric techniques performed on an automated hemocytometer. Hemoglobin levels can be measured from the RBC fraction, for example, after centrifugation.
The patients of both groups (beta thalassemia major and aplastic anemia) represent two distinct erythropoietic activity profiles. Erythropoiesis is highly active in patients with beta-thalassemia major. However, due to defective production of functional β -globin chains, the production of mature RBCs is reduced. In patients with aplastic anemia, erythropoiesis is reduced, resulting in reduced RBC production.
Figure 8 is a graph of Unmeth% of hemoglobin concentrations in patients with aplastic anemia, β -thalassemia major, and healthy control subjects, according to embodiments of the invention. In patients with beta-thalassemia, hemoglobin concentrations decreased, but% Unmeth increased significantly compared to healthy control subjects (P <0.01, Mann-Whitney rank-sum test). In fact, the% Unmeth values for 10 of 11 patients with beta-thalassemia (89%) were higher than for all healthy control subjects. This observation is consistent with increased but defective erythropoiesis in these patients.
In contrast, the% Unmeth was lower for six patients with aplastic anemia who underwent regular blood transfusions than for all healthy control subjects. This observation is consistent with reduced erythropoiesis in these patients.
For three patients with aplastic anemia who were in clinical remission, hemoglobin levels were normal and no regular blood transfusions were required. Its% Unmeth value was not significantly different from that of healthy control subjects (P ═ 0.53, mann whitney rank sum test). Therefore, quantitative analysis of erythroblasts specific DNA in plasma would be useful for monitoring patients with bone marrow dysfunction, for example, to determine whether aplastic anemia is in remission. In addition, quantitative analysis of erythroblast-specific DNA can be used to guide therapy. For example, patients with aplastic anemia who are not in remission may be treated with periodic blood transfusions.
Therefore, the unneth% is higher in thalassemia patients and lower in aplastic anemia patients. For thalassemia, the bone marrow is active because the patient is anemic and the bone marrow wants to produce more RBCs for circulation. Thus, the erythropoiesis is higher in healthy subjects without anemia. For patients with aplastic anemia, the anemia is due to reduced RBC production. Taken together, these results indicate that analysis of erythroblast-specific methylation profiles would be useful in reflecting erythropoietic activity in bone marrow.
Patients can be diagnosed by a combination of hemoglobin measurements and% Unmeth. For example, patients with hemoglobin below 11.8 and E% above 50 may be classified as having beta-thalassemia. However, patients with hemoglobin below 11.8 and E% below 25 may be classified as having aplastic anemia.
C. Iron deficiency anemia and treatment
Anemia may be due to a deficiency of nutrients (e.g., iron, B12, folic acid, etc.), blood loss (e.g., due to menorrhagia or bleeding from the gastrointestinal tract), or chronic disease (e.g., cancer, inflammatory bowel disease).
Fig. 9 is a graph of plasma Unmeth% in patients with iron deficiency (Fe) anemia and acute blood loss. Three patients with iron deficiency anemia and one patient with acute gastrointestinal blood were studied. Among two iron deficiency patients, anemia is caused by menorrhagia. For one patient, blood samples were collected before iron supplementation was initiated. For another patient, blood samples were collected 1 week after the start of iron supplementation therapy. A third patient with iron deficiency anemia had inflammatory bowel disease and blood samples were collected before iron supplementation began.
Plasma% of Unmeth was determined for each patient and compared to values for healthy control subjects. An increase in% plasma unneth was observed in patients with acute gastrointestinal bleeding. For two iron deficiency patients who collected samples before the start of iron supplementation therapy, despite their low hemoglobin levels, their plasma% umeth values were not increased compared to healthy subjects. For Fe-deficient patients collecting samples 1 week after the start of iron supplementation, an increase in% plasma unneth was observed.
These results show that plasma unnmeth% reflects erythropoietic activity in response to treatment. For example, iron-supplemented treatments show increased erythropoietic activity. Furthermore, these results show that the response in% Unmeth will be faster than the rise in hemoglobin levels. Use of% Unmeth can be an early indication of whether such treatment is effective and therefore whether treatment should be continued or stopped. Therefore, the% Unmeth may provide guidance to predict response to anemia treatment (e.g., iron therapy) before changes in hemoglobin levels are observed.
In some embodiments, plasma% unneth may be used to reflect a response to treatment for anemia. For example, in patients with iron deficiency anemia, the response to oral iron supplementation may vary from subject to subject due to variations in the absorption of iron through the intestinal tract. In this case, an insufficient increase in% plasma Unmeth after the start of oral iron supplementation may be indicative of the need for intravenous iron therapy.
D. Differentiation of various anemia conditions
We recruited anemic patients with Aplastic Anemia (AA), Chronic Renal Failure (CRF), iron deficiency anemia due to chronic blood loss, and β -thalassemia major. Different disease entities were recruited to represent the two ends of the erythropoietic activity profile in bone marrow.
Fig. 10 shows the relationship between the percentage of red blood cell DNA (E% (FECH)) in plasma and the hemoglobin level in patients and healthy subjects with aplastic anemia, Chronic Renal Failure (CRF), β -thalassemia major, iron deficiency anemia, according to an embodiment of the present invention. The E% (FECH) of plasma DNA of anemic patients and 35 healthy controls were plotted against hemoglobin level. The dashed horizontal line represents the median E% in healthy subjects. The vertical line corresponds to the cutoff for hemoglobin levels measured between subjects with anemia and subjects without anemia (11.5, as shown).
We analyzed the E% of plasma DNA in 13 AA patients who met the diagnostic criteria (28) but failed to respond to immunosuppressive therapy. The median E% of plasma DNA of group AA was 12.4% (quartet: 7.5-13.7%), which was significantly lower than that of healthy controls (P <0.0001, mann whitney rank sum test; fig. 10). Similarly, the median E% result for 18 CRF patients requiring dialysis was 16.8% (quartet: 12.2-21.0%), which was also significantly lower than the median E% for healthy controls (P <0.0001, mann whitney rank sum test; fig. 10). These findings are consistent with the pathophysiology of reduced erythropoietic activity in AA (28, 29) and CRF patients (30).
For patients with beta-thalassemia major, the bone marrow is attempting to compensate for hypoxic stress with increased but ineffective erythropoiesis (31). The median E% of plasma DNA was 65.3% (quartet: 60.1-78.9%) among 17 enrolled patients with β -thalassemia major, which was significantly higher than that of healthy controls (P <0.0001, mann whitney rank sum test; fig. 10).
For subjects with iron deficiency anemia, we recruited 11 patients with iron deficiency anemia due to menorrhagia or peptic ulcer disease (transferrin saturation < 16% or serum ferritin level < 30 ng/ml). The median E% of its plasma DNA was 37.8% (quartet: 31.8-43.0%), which was significantly higher than that of healthy controls (P ═ 0.002, mann whitney rank sum test; fig. 10). This finding can be explained by a compensatory increase in myeloerythropoietic activity as a response to chronic blood loss (32).
Thus, a patient can be diagnosed by a combination of hemoglobin measurement and E%. For example, patients with hemoglobin below 11.5 (or other values) and E% above 50 may be classified as anemia with increased erythropoietic activity, such as β -thalassemia. However, patients with hemoglobin levels below 11.5 and E% below 50 and above 28 may be classified as anemias with moderate erythropoietic activity, such as iron deficiency anemia. However, patients with hemoglobin levels below 11.5 and E% below 28 can be classified as anemias with reduced erythropoietic activity, such as aplastic anemia or chronic renal failure.
In some embodiments, to determine the classification of a blood disorder, the hemoglobin level of a blood sample can be measured. The hemoglobin level may be compared to a hemoglobin threshold (e.g., 11.5). Thus, classification of a blood disorder may be further based on comparison of hemoglobin levels to hemoglobin thresholds in addition to methylation levels.
A summary of the subject's E% (FECH), red blood cell, and reticulocyte parameters are shown in tables 5 and 6 and fig. 11A and 11B, respectively.

Table 5 table summarizes the median percentage of red blood cell DNA (E% (FECH)) in plasma DNA of healthy subjects and anemia patients.
In table 6 below, the median and the interquartile range (in parentheses) are shown. The following abbreviations are used: hematocrit is Hct, mean corpuscular volume is MCV, mean corpuscular hemoglobin is MCH, mean corpuscular hemoglobin concentration is MCHC, and red blood cell distribution width is RDW.

Table 6 Red Blood Cell (RBC) parameters of enrolled healthy controls and anemic patients.
FIGS. 11A and 11B show the relationship between reticulocyte count/index and hemoglobin levels in anemic patients with aplastic anemia, Chronic Renal Failure (CRF), beta-thalassemia major, and iron deficiency anemia. Reticulocyte indices were calculated as follows: reticulocyte count x hematocrit/normal hematocrit. It can be seen that the amount of reticulocytes (immature RBCs) in the blood does not provide a reliable distinction between different conditions. These results show that reticulocyte count and reticulocyte index are not able to distinguish anemias of different etiologies, such as thalassemia and aplastic anemia.
E. Myelodysplastic syndrome and polycythemia
Figure 12 is a graph of plasma unnmeth% in patients with myelodysplastic syndrome and polycythemia. In patients with myelodysplastic syndrome, increased plasma unneth% is observed at reduced hemoglobin levels. Increased plasma Unmeth% was also observed in patients with polycythemia. These results show that the detection and quantification of the erythroblasts DNA methylation marker in plasma is useful for detecting and monitoring abnormal proliferation or dysplasia of bone marrow involving myeloid progenitor cells.
Thus, as can be seen, these two blood disorders also show higher cell-free DNA of erythroblasts, allowing the detection of blood disorders. In some embodiments, accurate diagnosis may be based on histological examination of a bone marrow biopsy. Accordingly, bone marrow biopsies may be performed in response to detecting high% Unmeth. Similarly, bone marrow biopsies can be performed in response to detection of low% unneth in the presence of anemia but in the absence of nutritional deficiency (e.g., iron deficiency, vitamin B deficiency 12, or folate deficiency). These matrices for bone marrow biopsies may reduce the number of these biopsies while still allowing monitoring of the health of the bone marrow. Therefore, the% Unmeth would be more suitable for monitoring therapeutic response.
F. Other differences in anemia
Differentiation between other conditions is also possible.
1. Aplastic Anemia (AA) and myelodysplastic syndrome (MDS)
Both aplastic anemia and MDS are bone marrow failure conditions. Despite their similar clinical characteristics of cytopenia of various classes, these two disease entities have different pathophysiological mechanisms. In AA, there is cytoreductive bone marrow without the dysplastic features. In MDS, hypercellular bone marrow and dysplasia involving one or more lineages are typically present (33), but cytoreductive MDS are also identified.
FIG. 13A shows the percentage of red blood cell DNA (E% (FECH)) in plasma of patients with Aplastic Anemia (AA) and myelodysplastic syndrome (MDS), according to an embodiment of the present invention. The median E% of plasma DNA from 8 MDS patients was 50.3% (range: 37.4-60.8%). Two cases had unilineage dysplastic MDS, 4 cases had multilineage dysplasia, and 2 cases had excess blast MDS (34). All of their previous bone marrow biopsies showed hypercytoemia. The median E% for MDS patients was significantly higher than the median E% for 13 enrolled AA patients (P <0.0001, mann whitney rank sum test; fig. 13A). The median E% results in MDS patients are consistent with the pathophysiology of bone marrow biopsy findings and ineffective erythropoiesis of MDS.
Thus, using E% or other methylation levels can distinguish MDS from aplastic anemia. For example, a cutoff value of 30 may be used to classify the sample as corresponding to aplastic anemia or MDS.
Treatment response group and treatment non-response group of AA
FIG. 13B shows the percentage of red blood cell DNA (E% (FECH)) in plasma between the treatment-responsive group and the treatment-non-responsive group in aplastic anemia according to an embodiment of the present invention. We analyzed 8 additional patients with aplastic anemia who responded to immunosuppressive therapy, thereby increasing hemoglobin levels. The median E% of plasma DNA in the treatment response group was 22.5% (quartet: 17.2-27.1%), which was higher than that in the non-response group (median: 12.3%; quartet: 7.5-13.7%) (P ═ 0.0003, mann whitney rank sum test; fig. 13B). There was a slight but significant difference between the E% results in the treatment response group and healthy controls (P ═ 0.01, mann whitney rank sum test).
These results reflect the restoration of erythropoietic activity in the bone marrow. Since recovery of E% can occur earlier than hemoglobin levels, E% can be used to determine early whether a patient is responding to immunosuppressive therapy. When the patient is unresponsive, other treatments (e.g., more aggressive treatments) may be performed, such as stem cell transplantation or prescription of bone marrow stimulants (e.g., sargramostim, filgrastim, and pegylated filgrastim).
G. Leukemia (leukemia)
Erythroblasts-specific DMRs can also be used to detect other blood disorders besides leukemia, for example, in FECH.
Fig. 14 is a graph of plasma unneth% for hemoglobin concentration in both normal subjects and in patients with leukemia, according to an embodiment of the invention. Unmeth% was determined using FECH DMR. The% Unmeth value in plasma of patients with leukemia or myeloproliferative disorders is higher than the median Unmeth% in plasma of normal subjects. This observation is consistent with the observation of increased but defective erythropoiesis in patients with leukemia. Thus, a cutoff value of about 45 can be used for the Unmeth% to distinguish between healthy subjects and subjects with leukemia, thereby determining the level of a blood disorder. Hemoglobin levels may also be used, for example patients with hemoglobin below 8 may be identified as having leukemia rather than beta-thalassemia, which typically has a hemoglobin level between 8 and about 11.8, as shown in fig. 10.
Results for other methylated markers
We analyzed E% based on the other two DMRs in the sample subset plasma to validate the above E% results from the FECH gene-associated DMRs. Similar differences in the percentage of red blood cell DNA in plasma between healthy subjects and patients with aplastic anemia and β -thalassemia major were observed using the other two erythroblast-specific DMRs as DMRs in the FECH gene.
A. Two other erythroblasts specific DMRs
The other two DMR located on chromosome 12 are also hypomethylated. The genomic regions associated with these two DMR were not previously identified as being within any of the annotated genes.
FIGS. 15A and 15B show the methylation density of CpG sites within erythroblasts-specific DMR on chromosome 12 according to an embodiment of the invention. Fig. 15A shows region 1510 at genomic coordinates on chromosome 12:48227688 and 48227701, which contains 3 sites. Fig. 15B shows region 1560 at genomic coordinates on chromosome 12:48228144 and 48228154, which also includes 3 sites. The genomic coordinates correspond to the human reference genome hg 19. Selected CpG sites located within the shaded region are hypomethylated in erythroblasts but highly methylated in other tissues or cell types. Other tissues represent lung, colon, small intestine, pancreas, adrenal gland, esophagus, heart and brain.
These two other erythroblasts-specific DMR markers are Ery-1 and Ery-2. The E% based on the other two DMRs (chromosome 12:48227688-48227701 and chromosome 12:48228144-48228154) will be represented by E% (Ery-1) and E% (Ery-2), respectively.
FIG. 16 shows histone modifications (H3K4me1 and H3K27Ac) to two other erythroblasts-specific DMRs from the ENCODE database (Ery-1 and Ery-2). We reviewed the common data for histone modifications and the CHIP-seq dataset for these two DMRs in erythroblasts of the erythroblasts type from the ENCODE database. Ery-1 and Ery-2 DMR are marked by two enhancer-related histone modifications (H3K4me1 and H3K27Ac), which indicate a regulatory function, especially of an enhancer. The most recent downstream gene is the HDAC7 gene, approximately 15kb apart.
B. Erythroblasts-enriched samples
We analyzed the percentage of red blood cell DNA based on the other two DMRs in erythroblasts-rich samples from the 8 cord blood samples described previously. The E% (Ery-1) and E% (Ery-2) of the DNA extracted from the pooled samples were 66.5% and 68.5%. These E% values are similar to E%, 67%, based on the FECH gene-related DMR. In view of similar findings from all three DMRs, lower than expected E% values (i.e., lower than expected when performing enrichment) may be attributed to incomplete selectivity of the enrichment protocol.
C. Correlation of E% of buffy coat with erythroblasts in patients with beta-thalassemia major
The percentage of red blood cell DNA based on two DMR was analyzed in buffy coat DNA of the same group of beta-thalassemia major patients. The E% of the two DMR in buffy coat DNA correlated well with the percentage of erythroblasts in a similar manner to figure 3A.
FIGS. 17A and 17B show the correlation between the percentage of red cell DNA sequence in buffy coat DNA (E%) of patients with beta-thalassemia major as measured by digital PCR analysis targeting the Ery-1 marker (FIG. 17A) and the Ery-2 marker (FIG. 17B) and the percentage of erythroblasts in all peripheral blood leukocytes as measured using an automated hematology analyzer. The E% (Ery-1) and E% (Ery-2) of buffy coat DNA correlated well with the percentage of erythroblasts in peripheral blood leukocytes measured by hematology analyzers (r ═ 0.938 and r ═ 0.928, two P <0.0001, pearson correlation).
FIGS. 18A and 18B show the correlation of the E% (FECH) results for buffy coat DNA with E% (Ery-1) and E% (Ery-2) for patients with beta-thalassemia major. The E% results from these two DMR also correlated well with the paired E% results for the FECH gene marker site in buffy coat DNA from 15 patients with beta-thalassemia major.
C. E% in plasma of healthy subjects and anemia patients
We analyzed E% (Ery-1) and E% (Ery-2) of plasma DNA in healthy subjects and patients with aplastic anemia and beta-thalassemia major. The E% results based on three erythroblast-specific DMR in the same group of healthy subjects, 7 patients with aplastic anemia and 9 patients with beta-thalassemia major were analyzed.
Figure 19 shows the percentage of red blood cell DNA in healthy subjects and patients with aplastic anemia and β -thalassemia major using a digital PCR analysis targeting three erythroblasts-specific DMRs, according to an embodiment of the invention. The median E% (Ery-1) of the plasma DNA of 13 healthy subjects was 16.7% (interquartile distance: 10.9-23.5%) and the median E% (Ery-2) of the same group of healthy subjects was 25.0% (interquartile distance: 22.2-27.3%). Based on the Ery-1 marker, the E% (Ery-1) of patients with aplastic anemia and β -thalassemia major was 13.78% and 61.69%, respectively. Based on the Ery-2 marker, the E% (Ery-2) of patients with aplastic anemia and β -thalassemia major was 14.13% and 64.95%, respectively. Similar differences in the percentage of red blood cell DNA in plasma were observed between healthy subjects and patients with aplastic anemia and β -thalassemia major using two erythroblast-specific DMRs as DMRs in the FECH gene.
Therapeutic results
As described above, E% can be used to monitor the efficacy of treatment for anemia.
A. Measurement of E% (FECH) of plasma DNA in patients with iron deficiency anemia before and after iron therapy
We monitored the serial changes in hemoglobin levels, reticulocyte counts and E% of plasma DNA in 4 patients with iron deficiency anemia who received intravenous iron therapy due to intolerance to the gastrointestinal side effects of oral iron. Instead of patients on oral iron therapy, we chose to observe changes in this group of patients to avoid possible confounding factors of different therapeutic responses due to changes in gastrointestinal absorption. We measured these parameters before and two days after treatment.
Fig. 20A and 20B show series of measurements of percent red cell DNA (E% (FECH)) and percent reticulocyte count in plasma DNA of iron deficiency anemia receiving intravenous iron therapy in a pre-treatment state and two days post-treatment, according to embodiments of the invention. Figure 20A shows the series of changes in E% of plasma DNA. Fig. 20B shows the serial change in percent reticulocyte count.
In addition to subject 1, the E% of plasma DNA and reticulocyte count increased while hemoglobin levels remained static only initially after treatment initiation. As for the final change in hemoglobin levels, subjects 3 and 4 had sharp changes in final levels of 84.7% and 75.3%, respectively. Subject 2 defaults to follow-up and no additional samples for hemoglobin measurement were provided after treatment. Subject 1, which had minimal E% change in plasma DNA, had the least (12.2%) increase in hemoglobin levels. Thus, changes in E% of plasma DNA may confirm the dynamic response of bone marrow erythropoietic activity to iron therapy and may be used as an early predictor of patient response to treatment.
The lack of an increase in reticulocyte count for subject 1 indicates that RBC production does not adequately respond to iron therapy. Lack of response to iron therapy can also be reflected by lack of increase in E%, which corresponds to bone marrow activity. However, for subject 1, the hemoglobin level before iron therapy was started was higher than the reference range for the other 3 subjects and closer to healthy subjects. Lack of elevation of subject 1's E% (FECH) may reflect absence of compensatory increase in erythropoietic activity in bone marrow because the lack of hemoglobin levels is less than normal. Reticulocytes of subject 1 were initially approximately the same as the other subjects and therefore do not indicate that bone marrow activity is of sufficient level. Thus, for anemia with moderate erythropoietic activity, the E% of the upper normal limit for a healthy patient may indicate a positive response to treatment, or at least an indeterminate response, and thus treatment may not be discontinued in such cases.
To restore hemoglobin levels to normal, increased RBC production is required. Thus, in iron deficiency anemia, a normal range of E% may be considered inappropriate. An increase in E% for subjects 2-4 indicates an appropriate response after iron therapy, as normal (see figure 10) or E% in the higher range just above normal would be expected for subjects with iron deficiency anemia. Thus, the threshold value for E% to determine whether a treatment is effective may depend on the starting value of E%. The threshold for E% may specify a particular change in value from the initial value, where the amount of change may depend on the initial value.
The effect of oral treatment with iron was also investigated. For example, patients with chronic blood loss due to menorrhagia will suffer from iron deficiency anemia. Iron supplements will be used to correct iron deficiency conditions.
Figure 21A shows a series of changes in plasma E% of erythroblasts DMR in patients with iron deficiency anemia due to menorrhagia receiving oral iron treatment according to embodiments of the present invention. The E% of plasma of patients with iron deficiency anemia who received iron treatment was analyzed before and seven days after iron treatment. In fig. 21A, E% increased after receiving iron treatment. These results indicate that plasma E% may reflect erythropoietic activity in response to treatment.
Figure 21B shows the change in hemoglobin following oral iron treatment. Hemoglobin levels have not been significantly increased, but E% at the same time point post treatment (FECH — increase, similar to fig. 20A, showing that E% can be used as an early detection of whether treatment is effective.
B. Treatment of Chronic Kidney Disease (CKD)
In CKD patients, one of the major causes of anemia is the reduction in erythropoietin production caused by renal damage. Erythropoietin is a hormone produced by the kidneys in response to low tissue oxygen levels. Which stimulates the bone marrow to produce red blood cells. Exogenous erythropoietin can be used to treat CKD anemia.
Figure 22 shows a series of changes in plasma unneth% at erythroblasts DMR in patients with Chronic Kidney Disease (CKD) treated with recombinant Erythropoietin (EPO) or Erythropoiesis Stimulating Agent (ESA). Seven CKD patients receiving EPO treatment were analyzed for% plasma umeth before and 7 to 14 days after EPO treatment. Lines of different shapes (colors) correspond to different patients. All patients showed an increase in% Unmeth after receiving EPO treatment. The Unmeth% values show different levels of efficacy for different patients. These results show that plasma unnmeth% reflects erythropoietic activity in response to treatment.
C. ATG treatment of aplastic anemia
Immunosuppressive therapy of patients with aplastic anemia may result in 60-70% recovery of the patient's Blood (Young et al, Blood 2006; 108(8): 2509-2519). The plasma% value of the Unmeth of 4 patients with aplastic anemia who received immunosuppressive therapy was analyzed before the start of immunosuppressive therapy and 2 months and 4 months thereafter. All patients did not respond to treatment and hemoglobin levels did not return to normal levels during this period; all four patients required periodic transfusions.
Figure 23A shows a continuous change in plasma unneth% at erythroblasts DMR in a patient with aplastic anemia receiving anti-thymocyte globulin (ATG) therapy or cyclosporin as an immunosuppressive therapy, according to an embodiment of the present invention. In three patients, the% Unmeth in plasma was unchanged. One patient showed a significant increase in unneth%. This occurs simultaneously with the appearance of symptoms of Paroxysmal Nocturnal Hemoglobinuria (PNH) clones (i.e. the transfer of dark urine containing hemoglobin). Even with an increase in Unmeth%, this symptom can be used to determine that the patient does not respond to treatment. PNH is well known for its appearance in patients with aplastic anemia and has the pathophysiological mechanisms of hemolytic anemia. The increase in Unmeth% reflects an increase in erythropoietic activity due to PNH hemolysis.
Figure 23B shows the series of changes in hemoglobin in patients with aplastic anemia receiving treatment. Hemoglobin levels do not increase significantly. These results show that plasma umeth% reflects a change in erythropoietic activity during the course of treatment, with no change in erythropoietic activity, as all patients did not respond to treatment, as exemplified by the lack of hemoglobin change shown in figure 23B.
Figures 24A and 24B show graphs of% Unmeth of plasma for hemoglobin concentration for four patients with aplastic anemia. Each line corresponds to one patient and changes in the% Unmeth and hemoglobin levels were tracked before and 4 months after treatment. Figure 23A shows that except for patients with PNH, the% Unmeth has not significantly changed. Fig. 23B shows that hemoglobin levels did change, but were not significant.
Use of the Absolute concentration of erythrocyte DNA
To measure the amount of red blood cell DNA in plasma/serum, some embodiments use the parameter E% (also known as Unmeth%) at hypomethylation markers, but highly methylated markers specific for cell lineage (if present) can also be used. E% corresponds to the amount of erythroblasts DNA normalized to the total amount of DNA in the sample (most of which is highly methylated).
The surrogate parameter is the measurement of the absolute concentration of red blood cell DNA per unit volume of plasma. To calculate E%, the examples can measure the absolute concentration of unmethylated DNA and the absolute concentration of methylated DNA. In digital PCR analysis, each spot can represent one DNA molecule (e.g., as shown in fig. 2A and 2B). The counts of methylated and unmethylated DNA can be counted directly. In the previous section, normalized values (e.g., E%) were calculated, but embodiments may also use the absolute concentration of unmethylated molecules for hypomethylated markers or the absolute concentration of methylated molecules for highly methylated markers.
Fig. 25 illustrates a box and whisker plot showing the absolute concentration of red blood cell DNA at FECH gene-associated DMR (copies/ml plasma) in healthy subjects and anemia patients according to an embodiment of the invention. The box plot and the internal lines represent the interquartile range and median, respectively. The top and bottom must represent the maximum and minimum values.
As shown in fig. 25, although individual clusters between different patient groups can be observed using absolute concentrations of red blood cell DNA, normalized values allow for better separation between groups. Theoretically, the E% parameter of plasma can also be influenced by the concentration of circulating DNA of non-erythrocytic origin (e.g. DNA of myeloid or lymphoid origin). For example, in anemic conditions (e.g., aplastic anemia or myelodysplastic syndrome) in which other hematopoietic lineages are also affected, altered red blood cell DNA release may be masked in some cases.
IX. other blood lineages
This plasma DNA-based approach for hematological assessment can be generalized to markers of other blood cell lineages, such as bone marrow, lymphoid and megakaryocyte cell lines. Previous studies on the use of blood-based lineage specific DNA methylation markers have focused primarily on whole blood or blood cells (Housmen EA et al, Current Environmental Health Reports 2015; 2: 145- & 154). The data presented above clearly show that plasma DNA does contain information that is not present in blood cells. Thus, analysis of plasma DNA using epigenetic markers from multiple blood cell lineages can provide valuable diagnostic information about an individual's blood system. It is therefore a non-invasive alternative to bone marrow biopsy. Assays that specifically detect methylation markers of specific cell lineages in plasma or serum can be designed so that the activity of different cell lineages in bone marrow can be monitored.
This method is applicable to the assessment of many clinical situations, including (but not limited to) the following disorders. Example-related lineages are provided for disorders.
1. Hematological malignancies, such as leukemia and lymphoma (lymphocytic lineage)
2. Bone marrow disorders, e.g. aplastic anemia, myelofibrosis (myeloid and lymphoid lineages)
3. Monitoring the immune system and its function: such as immunodeficiency and establishment of immune response (lymphocyte lineage) during disease and therapy
4. Effects of drugs on bone marrow, e.g. azathioprine (myeloid lineage)
5. Autoimmune disorders with hematological manifestations, such as Immune Thrombocytopenia (ITP), which is a disorder characterized by low platelet counts but normal bone marrow. Plasma DNA analysis using blood lineage markers (e.g., megakaryocyte markers) will provide valuable diagnostic information about this condition.
(megakaryocyte marker)
6. The infection is accompanied by hematological complications, such as parvovirus B19, which may be accompanied by a reduced erythropoiesis or even more severe aplasia crisis. (erythroid lineage)
X. Process
Fig. 26 is a flow diagram illustrating a method 2600 of analyzing a blood sample of a mammal in accordance with an embodiment of the invention. Portions of method 2600 may be performed manually, while other portions may be performed by a computer system. In one embodiment, the system may perform all of the steps. For example, the system may include a robotic element (e.g., to obtain a sample and perform an analysis), a detection system for detecting signals from the analysis, and a computer system for analyzing the signals. Instructions for controlling this system may be stored in one or more computer readable media, such as Field Programmable Gate Arrays (FPGAs), flash memory, and/or configuration logic of a hard drive. Fig. 27 shows such a system.
At block 2610, a cell-free mixture of the blood sample is obtained. Examples of cell-free mixtures include plasma or serum. The cell-free mixture can include cell-free DNA from multiple cell lineages.
In some embodiments, the blood sample is separated to obtain a cell-free mixture. Plasma and serum are different. Both of which correspond to the fluid portion of the blood. To obtain plasma, an anticoagulant is added to the blood sample to prevent it from coagulating. To obtain serum, a blood sample is allowed to clot. Thus, the coagulation factors will be consumed during coagulation. With respect to circulating DNA, some DNA will be released from blood cells to the fluid portion during coagulation. Thus, serum has a higher DNA concentration than plasma. The DNA of the cells during coagulation may dilute the DNA specific for plasma. Thus, plasma may be advantageous.
At block 2620, the DNA fragments in the cell-free mixture are contacted with an assay corresponding to the one or more differentially methylated regions. Each of the one or more Differentially Methylated Regions (DMR) is specific for a particular blood cell lineage by hypomethylation or hypermethylation relative to other cell lineages. Examples of DMRs of erythroblasts lineage are provided herein.
In various embodiments, the analysis may involve PCR or sequencing, and thus is a PCR analysis or sequencing analysis. Contacting with the DNA fragments may involve flowing cells, droplets, beads, or other mechanisms to provide for analysis of interactions with the DNA fragments. Examples of such analyses include whole genome bisulfite sequencing, targeted bisulfite sequencing (by hybridization capture or amplicon sequencing), other methylation senses (e.g., Single Molecule Real Time (SMRT) DNA sequencing by pacific biosciences), real-time methylation specific PCR, and digital PCR. Other examples of assays that can be used in method 300 are described herein (e.g., in section XII). Although the examples use erythroblasts, other cell lineages, including other blood cell lineages, may also be used.
At block 2630, based on the signal obtained from the analysis, a first amount of methylated or unmethylated DNA fragments is detected in the cell-free mixture at the one or more differentially methylated regions. The analysis may provide various signals, such as optical or electrical signals. The signal may provide a specific signal for each DNA fragment, or an aggregate signal indicative of the total number of DNA fragments with methylation markers (e.g., as in real-time PCR).
In one embodiment, sequencing can be used to obtain sequence reads of DNA fragments, and the DNA fragments can be aligned with a reference genome. If the DNA fragment aligns with one of the DMRs, a counter may be incremented. Given that the signal is from an unmethylated analysis of a particular methylation, it can be assumed that the DNA fragment has the methylation signature. In another embodiment, reads from a PCR (e.g., light signals from a positive well) may be used to increment such a counter.
At block 2640, the first amount is used to determine a methylation level. The first methylation level can be normalized or an absolute concentration, e.g., per volume of the biological sample. An example of absolute concentrations is provided in fig. 25. Examples of normalized methylation levels include E% (also known as Unmeth%).
For normalized values, the methylation level can be determined using the first number and the total number of DNA fragments in the cell-free mixture at the one or more differentially methylated regions. As described above, the methylation level can be a percentage of unmethylated DNA fragments. In other embodiments, the percentage may be a percentage of methylated DNA fragments that will have an inverse relationship to the above example of erythroblasts. In various embodiments, the methylation level can be determined using the percentage of all sites in the DMR, by the average of the individual percentages per site or a weighted average of each site.
At block 2650, the methylation level is compared to one or more cutoff values as part of determining a classification of the blood disorder in the mammal. One or more cutoff values may be selected from empirical data, for example, as shown in fig. 8-10 and 12-14. The cutoff value may be selected to provide optimal sensitivity and specificity to provide accurate classification of blood disorders, e.g., based on supervised learning from a dataset of samples known to be normal and having disorders.
As an example for determining the cutoff value, a plurality of samples may be obtained. Each sample is known to have a particular classification of a blood disorder, for example, by other techniques known to those skilled in the art. The plurality of samples has at least two classifications of blood disorders, e.g., having the disorder and not having the disorder. Different types of disorders may also be included, for example, as shown in fig. 10. The methylation level of one or more differentially methylated regions can be determined for each of the plurality of samples as the data points in fig. 8-10 and 12-14.
The first set of samples may identify a first classification of having a blood disorder, such as a first classification of being healthy. The first group may be grouped together, for example, as shown in fig. 8-10 and 12-14. The second set of samples may identify a second classification with a blood disorder. The second group may be patients suffering from said disorder or a different type of disorder than the first category. The two classifications may correspond to different degrees of having the same condition. When the first set of samples collectively have a statistically higher methylation level than the second set of samples, a cutoff value can be determined that distinguishes the first set of samples from the second set of samples within a particular specificity and sensitivity. Thus, a balance between specificity and sensitivity can be used to select an appropriate cut-off value.
XI summary
RBC are the most abundant cell type in peripheral blood, but do not have a nucleus. In this disclosure, we determined that cells of the erythroid lineage contributed a significant proportion of the plasma DNA pool. Prior to this study, hematopoietic cells were known to contribute significantly to the circulating DNA pool (13, 14), but many researchers assumed that this hematopoietic DNA was only from the leukocyte lineage (15). Recent results using DNA methylation markers have shown that plasma DNA carries DNA methylation markers for neutrophils and lymphocytes (15).
Using a high resolution reference methylation set of several tissues including erythroblasts (18, 20), we distinguished red blood cell-derived DNA molecules from DNA of other tissue types in the plasma DNA pool. Our digital PCR analysis based on erythroblasts specific methylation markers enables us to perform quantitative analysis of these DNA molecules in plasma. This method enabled us to demonstrate the presence of large amounts of red blood cell DNA in the plasma DNA pool of healthy subjects.
Our results are consistent with the contribution of DNA from cells of the erythroid lineage in bone marrow to plasma. The corollary of this hypothesis is that quantitative analysis of red blood cell DNA in plasma reflects bone marrow erythropoietic activity and thus can help identify a diagnosis of anemia. We have established a reference value for red blood cell DNA in the plasma of healthy subjects. We have further demonstrated that anemic patients may increase or decrease the proportion of circulating red blood cell DNA, depending on their pathology and the exact nature of the treatment. In particular, we can distinguish between two bone marrow failure syndromes, namely Aplastic Anemia (AA) and myelodysplastic syndrome (MDS), in the patients we recruited by analyzing the percentage of erythrocyte DNA in plasma.
Reticulocyte counts can be used to provide information about bone marrow responses in anemic patients. Of the 11 β -thalassemia patients we studied, four patients had a reticulocyte count in the peripheral blood of less than 1%, the limit of detection. For the other seven patients, reticulocyte counts ranged from 1% to 10%. The reticulocyte count was less than 1% for all nine patients with aplastic anemia whether they received regular transfusions or not. Therefore, reticulocyte counts may not clearly define normal and reduced erythropoietic activity in bone marrow at low concentrations of reticulocytes due to the high degree of inaccuracy of automated methods (35, 36).
We have demonstrated that analysis of reticulocyte counts or reticulocyte indices cannot distinguish between the causes of anemia with reduced erythropoietic activity in our patient population (fig. 11A and 11B). Our results show that plasma umeth% (e.g., as shown in figure 10) is more accurate than reticulocyte counts in reflecting erythropoietic activity in bone marrow. In all patients with both parameters measured, there was no correlation between plasma umeth% and reticulocyte count or reticulocyte index (P ═ 0.3, linear regression) as shown in fig. 11A and 11B.
Similarly, the presence of abnormally high numbers of erythroblasts in the peripheral blood means abnormal erythropoiesis stress (37). However, the absence of erythroblasts in peripheral blood does not imply normal or reduced erythropoietic activity. In contrast, quantitative analysis of plasma erythroblast-derived DNA yields information about bone marrow erythropoietic activity that is not provided by conventional blood parameters of peripheral blood.
For beta-thalassemia and aplastic anemia, these two conditions are usually diagnosed by analyzing the iron in the blood and hemoglobin patterns. However, both beta-thalassemia and aplastic anemia exhibit low hemoglobin levels, and thus this technique cannot distinguish between beta-thalassemia and aplastic anemia. Using Unmeth%, more specificity can be provided by achieving differentiation between these two disorders, as shown in fig. 8 and 10.
Unmeth% may also be used to monitor treatment. For example, analysis of the% Unmeth in patients with iron deficiency anemia can be used to monitor the response of bone marrow to oral iron therapy, as shown in figure 9. In some patients, oral iron supplements may be effectively absorbed through the gastrointestinal tract. As a result, erythropoiesis is not increased after initiation of treatment. The absence of an increase in Unmeth% can be used as an indicator of adverse effects on oral iron therapy, so that other therapies can be initiated, such as parenteral iron therapy (e.g., iron dextran, iron gluconate, and iron sucrose). Alternatively, the absence of an increase in Unmeth% can be used to discontinue (stop) treatment, thereby saving the cost of ineffective treatment. In another embodiment, the absence of an increase in% Unmeth can be used to identify when to increase a therapeutic dose, such as an increase in iron dose. When the unneth% increases, treatment can continue. If the increase in% Unmeth is high enough (e.g., based on a threshold), then treatment may be discontinued because it may be assumed that erythropoietic activity reaches a level sufficient to eventually restore hemoglobin levels to healthy levels, thereby avoiding costly and possibly harmful over-treatment.
Thus, a blood disorder in a mammal can be treated in response to determining that the classification of the blood disorder indicates that the mammal has the blood disorder. After treatment, the analysis can be repeated to determine an updated methylation level, and a determination can be made whether to continue with treatment based on the updated methylation level. In one embodiment, determining whether to continue treatment may include: when the updated methylation level does not change within a specified threshold relative to the methylation level, the treatment is discontinued, the therapeutic dose is increased, or a different treatment is administered. In another embodiment, determining whether to continue treatment may include: treatment is continued when the updated methylation level changes to within a specified threshold relative to the methylation level.
As another example of monitoring treatment, the Unmeth% analysis can be used to determine whether ineffective erythropoiesis in thalassemia patients has been sufficiently inhibited by treatment, e.g., by blood transfusion. Extramedullary erythropoiesis is responsible for skeletal deformities in patients with thalassemia. Extramedullary erythropoiesis can be inhibited by blood transfusion and restoration of hemoglobin levels. Unmeth% can indicate patient response to these treatments, and failure to inhibit Unmeth% can be used to indicate that treatment should be boosted.
Unmeth% can also be used to distinguish patients with iron deficiency alone from patients with iron deficiency and other causes of anemia (e.g., anemia due to chronic disease). Iron-deficiency only patients are expected to increase Unmeth% after iron treatment, but those with various causes of anemia do not show an elevated response in Unmeth%.
Thus, we have demonstrated that the percentage of circulating red blood cell DNA increases in response to iron therapy in patients with iron deficiency anemia, thus reflecting an increase in myelopoietic activity. The dynamic change in the proportion of red blood cell DNA shows that quantification of plasma red blood cell DNA allows non-invasive monitoring of the relevant cellular processes. The rapid kinetics of plasma DNA (e.g., with half-life sequences of tens of minutes (38, 39)) suggest that this monitoring can provide near real-time results. Similarly, the percentage of circulating cell-free DNA of other cell lineages also allows for non-invasive monitoring of relevant cellular processes in bone marrow of other cell lineages.
Current studies serve as evidence for the presence of nuclear material of hematopoietic progenitor cells and precursor cells in circulation. In addition, the presence of circulating DNA released from precursor cells of other hematopoietic lineages may also be used.
In summary, we have demonstrated that red blood cell DNA contributes a significant proportion of the plasma DNA pool. This finding fills an important gap in our understanding of the basic biology of circulating nucleic acids. Clinically, the measurement of red blood cell DNA in plasma opens up a new avenue for studying and monitoring different types of anemia, and promises the start of a new family of cell-free DNA blood tests.
Xii. materials and methods
This section describes techniques that have been used and are useful for implementing embodiments.
A. Sample collection and preparation
In some embodiments, formalin-fixed, paraffin-embedded (FFPE) 12 types of normal tissue (liver, lung, esophagus, stomach, small intestine, colon, pancreas, adrenal gland, bladder, heart, brain, and placenta), each with four cases, were extracted from anonymous surgical specimens. The collected tissue was confirmed to be normal in histological examination. DNA was extracted from the FFPE tissue protocol using a QIAamp DNA mini kit (qiagen) with the manufacturer's fixed tissue protocol modified. A dewaxing solution (qiagen) was used instead of xylene to remove the paraffin. After cleavage with buffer ATL and proteinase K to reverse the formaldehyde modification of the nucleic acids, an additional step of incubation at 90 ℃ for 1 hour was performed.
To prepare the erythrocyte enriched samples for analysis, 1-3ml of umbilical cord blood was collected from each of eight pregnant women into tubes containing EDTA immediately after delivery. Mononuclear cells were isolated from cord blood samples by density gradient centrifugation using Ficoll-Paque PLUS solution (general electric medical group). Will be 1 × 10 8 Each isolated monocyte was conjugated to two antibodies: a1 mL mixture of Fluorescein Isothiocyanate (FITC) conjugated anti-CD 235a (Amersham whirlpool Biotech) and Phycoerythrin (PE) conjugated anti-CD 71 antibody (Amersham whirlpool Biotech) was diluted 1:10 in phosphorusThe acid salt buffered saline was incubated together in the dark at 4 ℃ for 30 minutes. CD235a + and CD71+ cells were subsequently sorted by BD FACSAria fusion flow cytometer (BD bioscience) for enrichment of erythroblasts (1). CD235a + CD71+ cells from eight cases were pooled for downstream analysis. DNA was extracted from pooled CD235a + CD71+ cells using the QIAamp DNA Blood mini kit (qiagen) with the manufacturer's instructions.
Peripheral blood samples were collected into tubes containing EDTA and immediately stored at 4 ℃. 10mL of peripheral venous blood was collected from each patient. Plasma separation was performed within 6 hours after blood withdrawal. Plasma DNA was extracted from 4mL of plasma. Plasma and buffy coat DNA were obtained as previously described (2). Briefly, blood samples were first centrifuged at 1,600g for 10 minutes at 4 ℃ and the plasma fraction was centrifuged again at 16,000g for 10 minutes at 4 ℃. The blood cell fraction was collected after centrifugation at 2,500g for 10 minutes to remove any residual plasma. DNA from plasma and buffy coat was extracted using the QIAamp DSP DNA minikit (qiagen) and the QIAamp DNA blood minikit (qiagen), respectively.
Bisulphite conversion of DNA
Plasma DNA and genomic DNA extracted from blood cells and FFPE tissue were subjected to two rounds of bisulfite treatment using the Epitect Plus bisulfite kit (qiagen) according to the manufacturer's instructions (3).
In one embodiment, DNA extracted from a biological sample is first treated with bisulfite. Bisulfite treatment converts unmethylated cytosines to uracil while leaving methylated cytosines unchanged. Thus, after bisulfite conversion, methylated and unmethylated sequences can be distinguished based on sequence differences at CpG dinucleotides. To analyze the plasma samples presented in selected examples of the present application, DNA was extracted from 2-4mL of plasma. For the analysis of DNA extracted from blood cells, 1. mu.g of DNA was used for downstream analysis in the examples. In other embodiments, other volumes of plasma and amounts of DNA may be used.
In the examples in this application, two rounds of bisulfite treatment were performed on each sample using the epitec bisulfite kit according to the manufacturer's instructions. Bisulfite converted plasma DNA was eluted in 50. mu.L of water. Bisulfite-converted cellular DNA was eluted in 20. mu.L of water and then diluted 100-fold for downstream analysis.
C. Methylation state
Various methylation assays can be used to quantify the amount of DNA from a particular cell lineage.
PCR analysis
Two digital PCR analyses were performed, one targeting the bisulfite converted unmethylated sequence and the other targeting the methylated sequence for each of the three erythroblasts specific DMR. Primer and probe designs for the analysis are listed in supplementary table 7.
FECH gene marker locus (chromosome 18:55250563-55250585)

Ery-1 marker site (chr 12:48227688 and 48227701)

Ery-2 marker loci (chromosome 12:48228144-

TABLE 7 oligonucleotide sequences for digital PCR analysis of methylated and unmethylated sequences of erythroblast-specific DMR. The underlined nucleotides in the reverse primer and probe represent differentially methylated cytosines at CpG sites. VIC and FAM represent 2 fluorescent reporters.
As an example, a PCR reaction may include 50. mu.L of template DNA converted with 3. mu.L bisulfite, a final concentration of 0.3. mu.M of each primer, 0.5. mu.M MgCl 2 And 25. mu.L of 2 XKAPA HiFi HotStart Uracil ReadyMix. The following PCR thermal profile can be used: 95 deg.C98 ℃ for 20 seconds, 57 ℃ for 15 seconds and 72 ℃ for 15 seconds for 5 minutes and 35 cycles followed by a final extension step of 72 ℃ for 30 seconds. In other embodiments, non-preferential whole genome sequencing may be performed in combination with alignment, but such procedures may not be cost effective.
In some embodiments, for digital PCR analysis of a sample, 20 μ Ι _ of reaction mixture is prepared after bisulfite treatment. In one example, the reaction mixture contains 8. mu.L of template DNA, a final concentration of 450nM for each of the two forward primers, 900nM for the reverse primer, and 250nM for the probe. In other examples, a total volume of 20. mu.L of each reaction mixture containing 8uL of template DNA, a final concentration of 900nM forward primer, 900nM reverse primer and 250nM probe was prepared. The reaction mixture was then used to generate droplets using a BioRad QX200 ddPCR droplet generator. Typically, 20,000 droplets will be produced per sample. In some embodiments, the droplets are transferred to a clean 96-well plate, followed by thermocycling using the same conditions for methylated and unmethylated specific assays: 95 ℃ x 10 minutes (1 cycle), 40 cycles of 94 ℃ x 15 seconds, and 60 ℃ x 1 minute, 98 ℃ x 10 minutes (1 cycle), followed by a 12 ℃ holding step. After PCR, the droplets of each sample were analyzed by a BioRad QX200 droplet reader and the results were interpreted using QuantaSoft (version 1.7) software.
2. Examples of other methylation assays
Other examples of methyl-aware sequencing include the use of a single-molecule sequencing platform that would allow direct elucidation of DNA molecules (including N) 6 -methyladenine, 5-methylcytosine and 5-hydroxymethylcytosine) without bisulfite conversion (AB Flusberg et al 2010 natural methods; 7: 461-465; j Shim et al 2013, "scientific reports (Sci Rep)"; 3: 1389); or by immunoprecipitation of methylated cytosines (e.g., by use of antibodies to methylcytosine or by use of methylated DNA binding proteins or peptides (LG Acevedo et al 2011 Experimental embryology (Epigenomics); 3: 93-101) followed by sequencing), or by use of methylation-sensitive restriction enzymes followed by sequencing。
In some embodiments, the methylation level of a genomic site in a DNA mixture can be determined using whole genome bisulfite sequencing. In other embodiments, the methylation level of a genomic site can be determined using a methylation microarray analysis, such as the Illumina human methylation450 system, or by using methylation immunoprecipitation (e.g., using anti-methylcytosine antibodies) or treatment with a methylation binding protein, followed by microarray analysis or DNA sequencing, or by using methylation sensitive restriction enzyme treatment, followed by microarray or DNA sequencing, or by using methylation-aware sequencing, such as using a single molecule sequencing method (e.g., by nanopore sequencing (Schreiber et al, journal of the american national academy of sciences 2013; 110: 18910-. Tissue specific methylation levels can be measured in the same manner. As another example, targeted bisulfite sequencing, methylation-specific PCR, non-bisulfite-based methylation-aware sequencing (e.g., by single molecule sequencing platforms (Efficient and accurate genome-wide assembly by Powers et al and methylation analysis of E.coli, BMC Genomics (BMC Genomics) 2013; 14:675) can be used to analyze the methylation levels of plasma DNA for plasma DNA methylation deconvolution analysis.
D. Statistical analysis
The pilsner correlation was used to study the correlation between the percentage of erythrocyte DNA (E% (FECH)) and the percentage of erythroblasts in peripheral blood leukocytes measured by hematology analyzers in beta-thalassemia major patients. Pearson's correlation was also used to study the correlation between plasma DNA of healthy controls and paired E% (FECH) results in buffy coat DNA. The wilcoxon signed rank test is used to compare the difference between E% in plasma DNA and paired buffy coat DNA in healthy subjects. The mann whitney rank sum test was used to compare the difference between E% in plasma DNA of healthy subjects and anemia patients of different disease groups.
We also developed a bioinformatic pathway (pipeline) to mine erythroblasts-specific DMR based on the criteria described in our text. The bioinformatic approach may be implemented in various platforms, such as Perl platform.
Xiii example system
Fig. 27 illustrates a system 2700 according to an embodiment of the invention. The illustrated system includes a sample 2705, e.g., cell-free DNA molecules within a sample holder 2710, wherein the sample 2705 can be contacted with an assay 2708 to provide a signal of a physical characteristic 2715. An example of a sample holder may be a flow cell comprising probes for analysis and/or a tube through which a primer or droplet is moved (a droplet comprising an analysis). Physical characteristics 2715 (e.g., fluorescence intensity values) from the sample are detected by detector 2720. The detector may measure at intervals (e.g., periodic intervals) to obtain data points that constitute the data signal. In one embodiment, the analog-to-digital converter converts the analog signal from the detector to digital form multiple times. A data signal 2725 is sent from detector 2720 to logic system 2730. The data signal 2725 may be stored in local memory 2735, external memory 2740, or storage device 2745.
Any of the computer systems mentioned herein may utilize any suitable number of subsystems. An example of these subsystems in computer system 10 is shown in FIG. 28. In some embodiments, the computer system comprises a single computer device, wherein the subsystems may be components of the computer device. In other embodiments, a computer system may include multiple computer devices with internal components, each computer device being a subsystem. Computer systems may include desktop and laptop computers, tablets, mobile phones, and other mobile devices.
The subsystems shown in fig. 28 are interconnected by a system bus 75. Additional subsystems such as a printer 74, a keyboard 78, one or more storage devices 79, a monitor 76 coupled to a graphics card 82, etc. are shown. Peripheral devices and input/output (I/O) devices coupled to I/O controller 71 may be connected to the various devices by various means known in the art (e.g., input/output (I/O) ports 77 (e.g., USB, ) To a computer system. For example, the
 computer system 10 may be connected to a wide area network (e.g., the Internet), a mouse input device, or a scanner using the I/O port 77 or an external interface 81 (e.g., Ethernet, Wi-Fi, etc.). The interconnection via system bus 75 allows central processor 73 to communicate with each subsystem and to control the execution of instructions from system memory 72 or storage device 79 (e.g., a fixed magnetic disk such as a hard drive or optical disk), as well as the exchange of information between subsystems. The system memory 72 and/or the one or more storage devices 79 may be embodied as computer-readable media. Another subsystem is a data collection device 85 such as a camera, microphone, accelerometer, etc. Any data mentioned herein may be output from one component to another component and may be output to a user.
The computer system may include multiple identical components or subsystems connected together, for example, through external interface 81 or through an internal interface. In some embodiments, computer systems, subsystems, or devices may communicate via a network. In these cases, one computer may be considered a client and another computer a server, each of which may be part of the same computer system. The client and server may each include multiple systems, subsystems, or components.
Aspects of the embodiments may be implemented in the form of control logic in hardware (e.g., an application specific integrated circuit or field programmable gate array) and/or in a modular or integrated form using computer software with a general purpose programmable processor. As used herein, a processor includes a single-core processor, a multi-core processor on the same integrated chip, or multiple processing units on a single circuit board or networked. Based on the present disclosure and the teachings provided herein, one of ordinary skill in the art will know and appreciate other ways and/or methods to implement embodiments of the present invention using hardware and a combination of hardware and software.
Any of the software components or functions described in this application may be implemented as software code executed by a processor using any suitable computer language (e.g., Java, C + +, C #, Objective-C, Swift) or scripting language (e.g., Perl or Python), using, for example, conventional or object-oriented techniques. The software code may be stored as a series of instructions or commands on a computer readable medium for storage and/or transmission. Suitable non-transitory computer readable media may include Random Access Memory (RAM), Read Only Memory (ROM), magnetic media such as a hard drive or floppy disk or optical media such as Compact Disk (CD) or DVD (digital versatile disk), flash memory, and the like. The computer readable medium may be any combination of such storage devices or transmission devices.
The programs may also be encoded and transmitted using carrier wave signals suitable for transmission over wired, optical, and/or wireless networks conforming to a variety of protocols, including the internet. Thus, a computer readable medium may be generated using data signals encoded with these programs. The computer-readable medium encoded with the program code can be packaged with a compatible device or provided separately from other devices (e.g., downloaded over the internet). Any such computer-readable media may reside on or within a single computer product (e.g., a hard drive, a CD, or an entire computer system), and may exist on or within different computer products within a system or network. The computer system may include a monitor, printer, or other suitable display for providing any of the results mentioned herein to a user.
One of the methods described herein may be performed in whole or in part with a computer system comprising one or more processors, which may be configured to perform these steps. Accordingly, embodiments may relate to a computer system configured to perform the steps of any of the methods described herein, potentially with different components performing the respective steps or respective sets of steps. Although presented in numbered steps, the steps of the methods herein may be performed at the same time or in a different order. Additionally, portions of these steps may be used with portions of other steps of other methods. Also, all or part of the steps may be optional. Additionally, any of the steps of any method may be performed by a module, circuit or other means for performing the steps.
The specific details of particular embodiments may be combined in any suitable manner without departing from the spirit and scope of the embodiments of the invention. However, other embodiments of the invention may relate to specific embodiments relating to each individual aspect or specific combinations of these individual aspects.
The foregoing description of the exemplary embodiments of the invention has been presented for the purposes of illustration and description. It is not intended to be exhaustive or to limit the invention to the precise form described, and many modifications and variations are possible in light of the above teaching.
The recitation of "a" or "an" is intended to mean "one or more" unless specifically indicated to the contrary. The use of "or" is intended to mean "including or" rather than "excluding or" unless specifically indicated to the contrary. References to a "first" component do not necessarily require that a second component be provided. Moreover, unless explicitly stated otherwise, reference to a "first" or "second" component does not limit the referenced component to a particular location.
All patents, patent applications, publications, and descriptions mentioned herein are incorporated by reference in their entirety for all purposes. None is admitted to be prior art.
XIV reference
The following references are made to the above-mentioned and are incorporated by reference in their entirety for all purposes.
Lo YM, Chan KC, Sun H, Chen EZ, Jiang P, Lun FM et al, "Maternal plasma DNA sequencing revealed fetal genome-wide inheritance and mutation profiles (Maternal plasma DNA sequencing of the genome-wide genetics and biological profile of the fetuses)," scientific transformation medicine (Sci Transl Med) "2010; 2:61ra 91.
ChiuRW, Chan KC, Gao Y, Lau VY, Zheng W, Leung TY et al, [ non-invasive prenatal diagnosis of fetal chromosomal aneuploidies (non-invasive diagnostic of cardiac chromosomal and ascending by quantitative parallel genomic sequencing of DNA in maternal plasma ], [ journal of the national academy of sciences ] 2008; 105:20458-63.
New MI, Tong YK, Yuen T, Jiang P, Pina C, Chan KC et al, < Noninvasive preliminary diagnosis of congenital adrenal cortex proliferation (cell-free genomic DNA in patient genomic plasma) < J clinicoendocrine and Metabolic journal 2014; 99: E1022-30.
Bianchhichi DW, Parker RL, Wentworth J, Madankumar R, Saffer C, Das AF et al, [ DNA sequencing and Standard prenatal aneuploidy screening ], [ New England journal of medicine (N Engl J Med) ] 2014; 370:799-808.
Chiu RW, Akolekar R, Zheng YW, Leung TY, Sun H, Chan KC et al, < non-invasive prenatal assessment of trisomy 21 syndrome by multiplex maternal plasma DNA sequencing: BMJ 2011 (Non-innovative preliminary assessment of trisomy 21by multiplexed proteinaceous plasma DNA sequencing: Large scale identity study); 342: c 7401.
Baylindrir B, Dehaspe L, Brison N, Brady P, Ardui S, Kammon M et al, [ non-invasive testing using a novel analytical approach to screen all autosomal fetal aneuploidies for improved pregnancy management (non-invasive testing of a novel analysis pipeline to a screen for all autosomal fetal aneuploidies ], [ European journal of human genetics (Eur J Hum Genet) ] 2015; 23:1286-93.
Schefferpg, van der school CE, Page-Christians GC, de Haas M. "non-invasive fetal blood group genotyping of rhesus monkeys D, c, E and K in alloimmunized pregnant women: evaluation of clinical experience of 7 years (Noninrivative total group generating of rhesus D, c, end of K in allo-metric present of a 7-year clinical experience) BJOG 2011; 118:1340-8.
Lo YM, Chan LY, Lo KW, Leung SF, Zhang J, Chan AT et al, [ Quantitative analysis of cell-free Epstein-Barr Virus DNA in plasma of nasopharyngeal carcinoma patients ] (Quantitative analysis of cell-free Epstein-Barr Virus DNA in plasma of Patients with NAsophageal Cancer ] ], [ Cancer research (Cancer Res) ]1999; 59:1188-91.
LearyRJ, Sausen M, Kinde I, Papadopoulos N, Carpten JD, Craig D et al, ` Detection of chromosomal changes in the circulation of cancer patients by whole genome sequencing ` (Detection of chromosomal alterations in the circulation of cancer patients with a white-genome sequencing `, ` scientific transformation medicine ` 2012; 4:162ra 54.
ChanKC, Jiang P, Zheng YW, Liao GJ, Sun H, Wong J et al, < genome scan for cancer in plasma: detection of tumor-associated copy number abnormalities, single nucleotide variants, and tumor heterogeneity (Cancer gene profiling in plasma: Detection of tumor-associated copy number associations, single-nucleotide variants, and tumor specificity by mass analysis) by massively parallel sequencing, clinical chemistry (Clin Chem) 2013; 59:211-24.
Bettegowdac, Sausen M, Leary RJ, Kinde I, Wang Y, Agrawal N et al, [ Detection of circulating tumor DNA in early-and late-stage human malignancies ] ", [ scientific transformation medicine ] 2014; 224ra 24.
IzumchenkoE, Chang X, Brait M, Fertig E, Kagohara LT, Bedi A et al, "Targeted sequencing revealed clonal genetic changes in early lung tumors and paired circulating DNA progression" (Targeted sequencing of clinical genetic changes in the progression of early lung cancer and paired circulating DNA), "Nature Commun (Nat Commun) 2015; 6:8258.
LuiYY, Chik KW, Chiu RW, Ho CY, Lam CW, Lo YM., primary hematopoietic origin of cell-free DNA in plasma and serum after gender-mismatched bone marrow transplantation (clinical laboratory of cell-free DNA in plasma and serum), clinical chemistry 2002; 48:421-7.
ZHENG YW, Chan KC, Sun H, Jiang P, Su X, Chen EZ et al, that the DNA of non-blood cell origin is shorter than the DNA of hematopoietic origin in plasma: transplant models (innomatous inflammatory DNA is short human hematopoietic inflammatory DNA in plasma: atransflanation model), 2012; 58:549-58.
SunK, Jiang P, Chan KC, Wong J, Cheng YK, Liang RH et al, [ Plasma DNA mapping by gene-with-tissue sequencing for non-invasive prenatal, cancer and transplantation assessment ] magnetic positioning of Plasma DNA by genome-wide methylation sequencing for non-invasive prenatal, cancer and transplantation assessment (national institute of sciences & Processes) 2015; 112: E5503-12.
Keerthivasang, Wickrema A, Crispino JD, "erythroblasts enucleation (Erythroblast enucleation"), International Stem Cells (Stem Cells Int) 2011; 2011:139851.
ChasisJA, Mohandas N., [ erythroblasts island: in "hemangioblast generated ecological niche" (erythropoiesis isles; Niches for erythropoesis), "blood" 2008; 112:470-8.
AdamsD, Altucci L, Antonarakis SE, Ballesteros J, Beck S, Bird A et al, "BLUEPRINT to decode the epigenetic signature written in the blood" ("Nature Biotechnol)" 2012, "; 30:224-6.
MartensJH, Stunnenberg HG., "BLUEPRINT: human blood cell epigenomes (BLUEPRINT: Mapping human blood cell epitopes), 2013 (hematology) (haematologic); 98:1487-9.
KundajeA, Meuleman W, Ernst J, Bilenky M, Yen A, Heravi-Moussavi A et al, [ 111 ] Integrated analysis of 111reference human epigenomes ] 2015; 518:317-30.
ChimSS, Tong YK, Chiu RW, Lau TK, Leung TN, Chan LY et al, [ Detection of the placental epigenetic signature of the placental pathogenic in the maternal plasma ] (Detection of the placental epigenetic signature of the placental pathogenic in the maternal plasma) ], [ Proc. Natl.Acad.Sci.USA ] 2005; 102:14753-8.
Lehmann-Werman R, Neiman D, Zemmour H, Moss J, Magenheim J, Vaknin-Dembinsky A et al, [ Identification of tissue-specific cell death using methylation patterns of circulating DNA ] Identification of tissue-specific cell death (Identification of tissue-specific cell death genes of circulating DNA ], Proc. Natl. Acad. Sci. USA ] 2016; 113E 1826-34.
LunfM, Chiu RW, Sun K, Leung TY, Jiang P, Chan KC et al, ` Noninvasive prenatal methylomics analysis by genomic bisulfite sequencing maternal plasma DNA ` (Noninvagal preliminary methyl analysis by genomic biological plasma sequencing of biological plasma DNA `, ` clinical chemistry ` 2013; 59:1583-94.
ChanKC, Zhang J, Hui AB, Wong N, Lau TK, Leung TN et al, "Size distributions of maternal and fetal DNA in maternal plasma (Size distributions of maternal and fetal DNA in maternal plasma)," clinical chemistry "2004; 50:88-92.
YuSC, Chan KC, Zheng YW, Jiang P, Liao GJ, Sun H et al, "Size-based molecular diagnostics using plasma DNA for non-invasive prenatal testing" (assistant-based molecular diagnostics), 2014; 111:8583-8.
FerreiraGC, Franco R, Lloyd SG, Moura I, Moura JJ, Huynh BH., Structure and function of ferrochelatase (Structure and function of biochelatase), J Bioenergi Biomembr 1995; 27:221-9.
Evaluation of the nucleated red Blood cell count of patients with thalassemia or sickle cell anemia and neonates by Sysmex XE-2100 (Evaluation of circulating Blood cell count by Sysmex XE-2100in patients with arthritis with clinical assays or single cell assays and in ketones), Blood transfusion (Blood Transfus) 2015; 13:588-94.
KillickSB, Bown N, Cavenagh J, Dokal I, Foukaneli T, Hill A et al, Guidelines for the diagnosis and management of adult aplastic anemia (Guidelines for the diagnosis and management of advanced aplastic anemia), J.British hematology (Br J Haematol) 2016; 172:187-207.
Young NS., Acquired aplastic anemia (Acquired aplastic anemia) book, Ann Intern Med 2002; 136:534-46.
Eschbach JW., Erythropoietin-outline in 1991 (Erythropoietin 1991-an overview), journal of nephropathy in the United states (Am J Kidney Dis 1991); 18:3-9.
Schrier SL., Pathobiology of thalassemia red blood cells (Pathobiology of hematological erythrocyties), Current research in hematology (Curr Opin Hematol) 1997; 4:75-8.
Kasper CK, Whissell DY, Wallerstein RO., "Clinical aspects of iron deficiency (Clinical aspects of iron deficiency"), JAMA 1965; 191:359-63.
Bejar R, Steensma DP., "Recent developments in myelodysplastic syndromes," blood "2014; 124:2793-803.
Arber DA, Orazi a, Hasserjian R, Thiele J, Borowitz MJ, Le Beau MM et al, 2016 (The 2016 vision to The world health organization classification of myeloid neoplasms and acute leukemia) revision of The classification of myeloid neoplasms and acute leukemia, 2016 (blood 2016); 127:2391-405.
Butterello m., "laboratory diagnosis of anemia: is the old and new red blood cell parameters useful in classification and treatment? (Laboratory diagnosis of diseases, Are the old and new cell parameters used in classification and treatment, how; 38 supplement 1: 123-32.
Buttarello M, Bulian P, Farina G, Temporin V, Toffolo L, Travio E, Rizzotti P., (Flow cytometry reticulocyte counting) in Flow cytometry, < five full-automatic analyzers for parallel assessment: NCCLS-ICSH methods (Parallel evaluation of five healthy analyzers: An NCCLS-ICSH approach), J.Clin Pathol 2001; 115:100-11.
Danise P, maconite M, Barrella F, Di Palma, Avino D, Rovetti a et al, "Evaluation of nucleated red blood cells in peripheral blood of hematological disorders" (Evaluation of cleared red blood cells in the peripheral blood of clinical disorders "), 2012" clinical chemistry and laboratory medicine (clean Chem Lab Med "); 50:357-60.
Lo YM, Zhang J, Leung TN, Lau TK, Chang AM, Hjelm NM., "Rapid cleaning of fetal DNA from maternal plasma" (Rapid cleaning of fetal DNA from biological plasma), "journal of human genetics in the United states (AM J Hum Genet)"1999; 64:218-24.
To EW, Chan KC, Leung SF, Chan LY, To KF, Chan AT et al Rapid removal of plasma Epstein-Barr viral DNA after surgical treatment of nasopharyngeal carcinoma (Rapid clean of plasma Epstein-Barr viral DNA after surgical treatment of Nasophageal Cancer), clinical Cancer research (Clin Cancer Res) 2003; 9:3254-9.
Claims (62)
1. A method of measuring the amount of cells of a particular cell lineage in a biological sample for non-disease diagnostic purposes, the method comprising:
obtaining a cell-free mixture of the biological sample, the cell-free mixture comprising cell-free DNA from a plurality of cell lineages;
performing an analysis of the cell-free mixture for DNA fragments corresponding to one or more differentially methylated regions, each of the one or more differentially methylated regions being specific for the particular cell lineage by hypomethylation or hypermethylation relative to other cell lineages;
detecting a first number of methylated or unmethylated DNA fragments in the cell-free mixture at the one or more differentially methylated regions based on the signal obtained from the analyzing;
determining a first methylation level using the first amount;
obtaining one or more calibration data points, wherein each calibration data point specifies (1) a calibration cell amount for the particular cell lineage and (2) a calibration methylation level, and wherein the one or more calibration data points are determined from a plurality of calibration samples;
comparing the first methylation level to a calibration methylation level for at least one calibration data point; and
estimating the amount of cells of the particular cell lineage in the biological sample based on the comparison.
2. The method of claim 1, wherein the specific cell lineage is a specific blood cell lineage.
3. The method of claim 1, wherein the one or more calibration data points is a plurality of calibration data points, and wherein the calibration data points form a calibration curve.
4.A computer product comprising a computer readable medium storing a plurality of instructions for controlling a system to perform the method of any of claims 1-3.
5. A system, comprising:
the computer product of claim 4; and
one or more processors configured to execute instructions stored on the computer-readable medium.
6. A system configured to perform the method of any one of claims 1 to 3.
7. A computer product comprising a computer-readable medium storing a plurality of instructions for controlling a system to analyze a blood sample of a mammal by performing:
detecting a first amount of methylated or unmethylated DNA fragments in a cell-free mixture of the blood sample at one or more differentially methylated regions based on signals obtained from the analysis, the cell-free mixture including cell-free DNA from a plurality of cell lineages, and each of the one or more differentially methylated regions being specific for a particular blood cell lineage by hypomethylation or hypermethylation relative to other cell lineages;
determining a methylation level using the first amount; and
comparing the methylation level to one or more cut-off values as part of determining a classification of a blood disorder in the mammal, wherein the one or more cut-off values correspond to a range over which the classification of the blood disorder is made for the particular blood cell lineage.
8. The computer product of claim 7, wherein the plurality of instructions further control the system to perform:
determining the total number of DNA fragments in the cell-free mixture of the one or more differentially methylated regions; and
determining the methylation level using the first amount and the total.
9. The computer product of claim 7, wherein the plurality of instructions further control the system to perform:
determining a volume of the cell-free mixture, wherein the methylation level determines the first amount and the volume of the cell-free mixture.
10. The computer product of claim 7, wherein obtaining the cell-free mixture comprises:
separating the cell-free mixture from the blood sample, the cell-free mixture comprising plasma or serum.
11. The computer product of claim 7, wherein the plurality of instructions further control the system to identify the one or more differentially methylated regions by:
obtaining methylation indices for a plurality of sites of each of the plurality of cell lineages, the plurality of cell lineages including the particular blood cell lineage and the other cell lineages;
comparing the methylation indices of the plurality of cell lineages at each of the plurality of sites;
identifying one or more of the plurality of sites having a methylation index below/above a first methylation threshold in the particular blood cell lineage and a methylation index above/below a second methylation threshold in each of the other cell lineages; and
identifying differentially methylated regions containing the one or more sites.
12. The computer product of claim 7, wherein the plurality of instructions further control the system to perform determining the one or more cutoff values comprises:
obtaining a plurality of samples, each sample known to have a particular classification of the blood disorder, the plurality of samples having at least two classifications of the blood disorder;
determining a methylation level of the one or more differentially methylated regions of each of the plurality of samples;
identifying a first set of samples having a first classification of the blood disorder;
identifying a second set of samples having a second classification of the blood disorder, the first set of samples collectively having a statistically higher level of methylation than the second set of samples; and
determining a cutoff value that distinguishes the first set of samples from the second set of samples within a particular specificity and sensitivity.
13. The computer product of claim 7, wherein determining the classification of the blood disorder comprises identifying a particular type of the blood disorder.
14. The computer product of claim 7, wherein the plurality of instructions further control the system to perform:
determining an updated methylation level in the mammal that has received treatment of the blood disorder in response to determining that the classification of the blood disorder indicates that the mammal has the blood disorder; and
determining whether to continue the treatment based on the updated methylation level.
15. The computer product of claim 7, wherein the plurality of instructions further control the system to perform:
determining the presence of the blood disorder based on comparing the methylation level to the one or more cutoff values; and
performing a bone marrow biopsy in response to determining the presence of the blood disorder.
16. The computer product of claim 7, wherein the analysis is a PCR analysis or a sequencing analysis.
17. The computer product of claim 7, wherein the one or more differentially methylated regions comprise CpG sites.
18. The computer product of claim 17, wherein a first region of the one or more differentially methylated regions comprises a plurality of CpG sites, each of the plurality of CpG sites being within 100bp of another CpG site, and wherein the plurality of CpG sites are all hypomethylated or hypermethylated.
19. The computer product of claim 18, wherein the plurality of CpG sites spans 100bp or less on a reference genome corresponding to the mammal.
20. The computer product of claim 7, wherein the specific blood cell lineage is red blood cells.
21. The computer product of claim 7, wherein the plurality of instructions further control the system to perform:
measuring a hemoglobin level of the blood sample;
comparing the hemoglobin level to a threshold; and
determining the classification of the blood disorder further based on the comparison of the hemoglobin level to the threshold.
22. The computer product of claim 7, wherein one of the one or more differentially methylated regions is in a FECH gene.
23. The computer product of claim 7, wherein one of the one or more differentially methylated regions is in chromosome 12 at the genomic coordinates 48227688 and 48227701 of the human reference genome hg 19.
24. The computer product of claim 7, wherein one of the one or more differentially methylated regions is in chromosome 12 at the genomic coordinates 48228144 and 48228154 in the human reference genome hg 19.
25. The computer product of claim 20, wherein the blood disorder is anemia.
26. The computer product of claim 7, wherein the classification of the blood disorder corresponds to increased erythropoietic activity, moderate erythropoietic activity, or decreased erythropoietic activity.
27. The computer product of claim 26, wherein the classification of the blood disorder is increased erythropoietic activity from beta thalassemia.
28. The computer product of claim 26, wherein the classification of the blood disorder is moderate erythropoietic activity from iron deficiency anemia.
29. The computer product of claim 26, wherein the classification of the blood disorder is a reduction in erythropoietic activity from aplastic anemia or chronic renal failure.
30. The computer product of claim 7, wherein the one or more differentially methylated regions are hypomethylated.
31. The computer product of claim 7, wherein the cell-free mixture is plasma.
32. A computer product comprising a computer readable medium storing a plurality of instructions for controlling a system to measure the amount of cells of a particular cell lineage in a biological sample by performing the following:
detecting a first amount of methylated or unmethylated DNA fragments in the cell-free mixture of the biological sample at one or more differentially methylated regions based on a signal obtained from the analysis, each of the one or more differentially methylated regions being specific for the particular cell lineage by hypomethylation or hypermethylation relative to other cell lineages;
determining a first methylation level using the first amount;
obtaining one or more calibration data points, wherein each calibration data point specifies (1) a calibration cell amount for the particular cell lineage and (2) a calibration methylation level, and wherein the one or more calibration data points are determined from a plurality of calibration samples;
comparing the first methylation level to a calibration methylation level for at least one calibration data point; and
estimating the amount of cells of the particular cell lineage in the biological sample based on the comparison.
33. The computer product of claim 32, wherein the particular cell lineage is a particular blood cell lineage.
34. The computer product of claim 32, wherein the one or more calibration data points is a plurality of calibration data points, and wherein the calibration data points form a calibration curve.
35. A computer system configured to perform:
detecting a first amount of methylated or unmethylated DNA fragments in a cell-free mixture of a mammalian blood sample at one or more differentially methylated regions based on signals obtained from the analysis, the cell-free mixture comprising cell-free DNA from a plurality of cell lineages, and each of the one or more differentially methylated regions being specific for a particular blood cell lineage by being hypomethylated or highly methylated relative to other cell lineages;
determining a methylation level using the first amount; and
comparing the methylation level to one or more cut-off values as part of determining a classification of a blood disorder in the mammal, wherein the one or more cut-off values correspond to a range over which the classification of the blood disorder is made for the particular blood cell lineage.
36. The computer system of claim 35, further configured to perform:
determining the total number of DNA fragments in the cell-free mixture of the one or more differentially methylated regions; and
determining the methylation level using the first amount and the total.
37. The computer system of claim 35, further configured to perform:
determining a volume of the cell-free mixture, wherein the methylation level determines the first amount and the volume of the cell-free mixture.
38. The computer system of claim 35, wherein obtaining the cell-free mixture comprises:
separating the cell-free mixture from the blood sample, the cell-free mixture comprising plasma or serum.
39. The computer system of claim 35, further configured to identify the one or more differentially methylated regions by:
obtaining methylation indices for a plurality of sites of each of the plurality of cell lineages, the plurality of cell lineages including the particular blood cell lineage and the other cell lineages;
comparing the methylation indices of the plurality of cell lineages at each of the plurality of sites;
identifying one or more of the plurality of sites having a methylation index below/above a first methylation threshold in the particular blood cell lineage and a methylation index above/below a second methylation threshold in each of the other cell lineages; and
identifying differentially methylated regions containing the one or more sites.
40. The computer system of claim 35, further configured to perform determining the one or more cutoff values, comprising:
obtaining a plurality of samples, each sample known to have a particular classification of the blood disorder, the plurality of samples having at least two classifications of the blood disorder;
determining a methylation level of the one or more differentially methylated regions of each of the plurality of samples;
identifying a first set of samples having a first classification of the blood disorder;
identifying a second set of samples having a second classification of the blood disorder, the first set of samples collectively having a statistically higher level of methylation than the second set of samples; and
determining a cutoff value that distinguishes the first set of samples from the second set of samples within a particular specificity and sensitivity.
41. The computer system of claim 35, wherein determining the classification of the blood disorder comprises identifying a particular type of the blood disorder.
42. The computer system of claim 35, further configured to perform:
determining an updated methylation level in the mammal that has received treatment of the blood disorder in response to determining that the classification of the blood disorder indicates that the mammal has the blood disorder; and
determining whether to continue the treatment based on the updated methylation level.
43. The computer system of claim 35, further configured to perform:
determining the presence of the blood disorder based on comparing the methylation level to the one or more cutoff values; and
performing a bone marrow biopsy in response to determining the presence of the blood disorder.
44. The computer system of claim 35, wherein the analysis is a PCR analysis or a sequencing analysis.
45. The computer system of claim 35, wherein the one or more differentially methylated regions comprise CpG sites.
46. The computer system of claim 45, wherein a first region of said one or more differentially methylated regions comprises a plurality of CpG sites each within 100bp of another CpG site, and wherein each of said plurality of CpG sites is hypomethylated or hypermethylated.
47. The computer system of claim 46, wherein said plurality of CpG sites span 100bp or less on a reference genome corresponding to said mammal.
48. The computer system of claim 35, wherein the particular blood cell lineage is a red blood cell.
49. The computer system of claim 35, further configured to perform:
measuring a hemoglobin level of the blood sample;
comparing the hemoglobin level to a threshold; and
determining the classification of the blood disorder further based on the comparison of the hemoglobin level to the threshold.
50. The computer system of claim 35, wherein one of the one or more differentially methylated regions is in a FECH gene.
51. The computer system of claim 35, wherein one of the one or more differentially methylated regions is in chromosome 12 at the genomic coordinates 48227688 and 48227701 of the human reference genome hg 19.
52. The computer system of claim 35, wherein one of the one or more differentially methylated regions is in chromosome 12 at the genomic coordinates 48228144 and 48228154 in the human reference genome hg 19.
53. The computer system of claim 48, wherein the blood disorder is anemia.
54. The computer system of claim 35, wherein the classification of the blood disorder corresponds to increased erythropoietic activity, moderate erythropoietic activity, or decreased erythropoietic activity.
55. The computer system of claim 54, wherein the classification of the blood disorder is increased erythropoietic activity from beta thalassemia.
56. The computer system of claim 54, wherein the classification of the blood disorder is moderate erythropoietic activity from iron deficiency anemia.
57. The computer system of claim 54, wherein the classification of the blood disorder is a reduction in erythropoietic activity from aplastic anemia or chronic renal failure.
58. The computer system of claim 35, wherein the one or more differentially methylated regions are hypomethylated.
59. The computer system of claim 35, wherein the cell-free mixture is plasma.
60. A computer system comprising a computer readable medium storing a plurality of instructions for controlling a system to measure the amount of cells of a particular cell lineage in a biological sample by performing the following:
detecting a first amount of methylated or unmethylated DNA fragments in the cell-free mixture of the biological sample at one or more differentially methylated regions based on a signal obtained from the analysis, each of the one or more differentially methylated regions being specific for the particular cell lineage by hypomethylation or hypermethylation relative to other cell lineages;
determining a first methylation level using the first amount;
obtaining one or more calibration data points, wherein each calibration data point specifies (1) a calibration cell amount for the particular cell lineage and (2) a calibration methylation level, and wherein the one or more calibration data points are determined from a plurality of calibration samples;
comparing the first methylation level to a calibration methylation level for at least one calibration data point; and
estimating the amount of cells of the particular cell lineage in the biological sample based on the comparison.
61. The computer system of claim 60, wherein the particular cell lineage is a particular blood cell lineage.
62. The computer system of claim 60, wherein the one or more calibration data points is a plurality of calibration data points, and wherein the calibration data points form a calibration curve.
Priority Applications (1)
| Application Number | Priority Date | Filing Date | Title |
|---|---|---|---|
| CN202210823171.9A CN115161390A (en) | 2016-05-30 | 2017-05-30 | Detection of blood disorders using cell-free DNA in blood |
Applications Claiming Priority (3)
| Application Number | Priority Date | Filing Date | Title |
|---|---|---|---|
| US201662343050P | 2016-05-30 | 2016-05-30 | |
| US62/343,050 | 2016-05-30 | ||
| PCT/CN2017/086509 WO2017206888A1 (en) | 2016-05-30 | 2017-05-30 | Detecting hematological disorders using cell-free dna in blood |
Related Child Applications (1)
| Application Number | Title | Priority Date | Filing Date |
|---|---|---|---|
| CN202210823171.9A Division CN115161390A (en) | 2016-05-30 | 2017-05-30 | Detection of blood disorders using cell-free DNA in blood |
Publications (2)
| Publication Number | Publication Date |
|---|---|
| CN109196120A CN109196120A (en) | 2019-01-11 |
| CN109196120B true CN109196120B (en) | 2022-08-02 |
Family
ID=60479040
Family Applications (2)
| Application Number | Title | Priority Date | Filing Date |
|---|---|---|---|
| CN201780033380.0A Active CN109196120B (en) | 2016-05-30 | 2017-05-30 | Detection of blood disorders using cell-free DNA in blood |
| CN202210823171.9A Pending CN115161390A (en) | 2016-05-30 | 2017-05-30 | Detection of blood disorders using cell-free DNA in blood |
Family Applications After (1)
| Application Number | Title | Priority Date | Filing Date |
|---|---|---|---|
| CN202210823171.9A Pending CN115161390A (en) | 2016-05-30 | 2017-05-30 | Detection of blood disorders using cell-free DNA in blood |
Country Status (11)
| Country | Link |
|---|---|
| US (2) | US10781490B2 (en) |
| EP (3) | EP4324937A2 (en) |
| JP (3) | JP6987393B2 (en) |
| KR (3) | KR102605504B1 (en) |
| CN (2) | CN109196120B (en) |
| AU (2) | AU2017274038B2 (en) |
| CA (1) | CA3025708A1 (en) |
| DK (2) | DK3885447T3 (en) |
| IL (2) | IL303115A (en) |
| SG (1) | SG11201810544WA (en) |
| WO (1) | WO2017206888A1 (en) |
Families Citing this family (9)
| Publication number | Priority date | Publication date | Assignee | Title |
|---|---|---|---|---|
| TWI813141B (en) | 2014-07-18 | 2023-08-21 | 香港中文大學 | Methylation pattern analysis of tissues in a dna mixture |
| IL303115A (en) | 2016-05-30 | 2023-07-01 | Univ Hong Kong Chinese | Detecting hematological disorders using cell-free dna in blood |
| JP2020503003A (en) | 2016-11-30 | 2020-01-30 | ザ チャイニーズ ユニバーシティ オブ ホンコン | Analysis of cell-free DNA in urine and other samples |
| EP3574108A4 (en) | 2017-01-25 | 2020-12-23 | The Chinese University Of Hong Kong | Diagnostic applications using nucleic acid fragments |
| AU2018305609B2 (en) | 2017-07-26 | 2023-01-19 | The Chinese University Of Hong Kong | Enhancement of cancer screening using cell-free viral nucleic acids |
| AU2020246747A1 (en) | 2019-03-25 | 2021-08-26 | Grail, Inc. | Determining linear and circular forms of circulating nucleic acids |
| CN110361531B (en) * | 2019-08-02 | 2023-04-11 | 天津医科大学总医院 | Experimental method for detecting particle coagulation promoting activity |
| CN111518876B (en) * | 2020-05-11 | 2023-01-13 | 润方(北京)生物医药研究院有限公司 | Quantitative detection method for bovine-derived genomic DNA in bovine hemoglobin product and application of quantitative detection method |
| KR102517894B1 (en) * | 2021-02-23 | 2023-04-04 | 연세대학교 산학협력단 | Method for predicting a response to the lower extremity amputation for diabetic foot |
Family Cites Families (18)
| Publication number | Priority date | Publication date | Assignee | Title |
|---|---|---|---|---|
| ES2253461T3 (en) | 2002-03-05 | 2006-06-01 | Epigenomics Ag | PROCEDURE AND DEVICE FOR THE DETERMINATION OF THE SPECIFICITY OF THE TISSUE AND OF THE DNA THAT FLEETS FREE IN BODY FABRICS. |
| US20090176655A1 (en) * | 2007-11-16 | 2009-07-09 | Oncomethylome Sciences Sa | Methylation detection |
| US20110028333A1 (en) | 2009-05-01 | 2011-02-03 | Brown University | Diagnosing, prognosing, and early detection of cancers by dna methylation profiling |
| KR20120107512A (en) | 2010-01-26 | 2012-10-02 | 엔아이피디 제네틱스 리미티드 | Methods and compositions for noninvasive prenatal diagnosis of fetal aneuploidies |
| WO2011130751A1 (en) | 2010-04-16 | 2011-10-20 | Chronix Biomedical | Breast cancer associated circulating nucleic acid biomarkers |
| KR102040307B1 (en) | 2010-11-30 | 2019-11-27 | 더 차이니즈 유니버시티 오브 홍콩 | Detection of genetic or molecular aberrations associated with cancer |
| WO2012103031A2 (en) | 2011-01-25 | 2012-08-02 | Ariosa Diagnostics, Inc. | Detection of genetic abnormalities |
| US20140178348A1 (en) | 2011-05-25 | 2014-06-26 | The Regents Of The University Of California | Methods using DNA methylation for identifying a cell or a mixture of cells for prognosis and diagnosis of diseases, and for cell remediation therapies |
| CN113388605A (en) | 2011-09-26 | 2021-09-14 | 凯杰有限公司 | Rapid method for isolating extracellular nucleic acids |
| PL2768985T3 (en) | 2011-10-21 | 2019-10-31 | Chronix Biomedical | Colorectal cancer associated circulating nucleic acid biomarkers |
| US9732390B2 (en) * | 2012-09-20 | 2017-08-15 | The Chinese University Of Hong Kong | Non-invasive determination of methylome of fetus or tumor from plasma |
| NZ706269A (en) | 2012-09-20 | 2016-08-26 | Univ Hong Kong Chinese | Non-invasive determination of methylome of fetus or tumor from plasma |
| US20160340740A1 (en) | 2014-01-30 | 2016-11-24 | The Regents Of The University Of California | Methylation haplotyping for non-invasive diagnosis (monod) |
| EP3643795B1 (en) | 2014-04-14 | 2022-03-30 | Yissum Research and Development Company of the Hebrew University of Jerusalem Ltd. | A method for determining the death of cells or tissue by dna methylation analysis |
| AU2015257654A1 (en) | 2014-05-09 | 2016-11-10 | Lifecodexx Ag | Detection of DNA that originates from a specific cell-type and related methods |
| TWI813141B (en) | 2014-07-18 | 2023-08-21 | 香港中文大學 | Methylation pattern analysis of tissues in a dna mixture |
| US10364467B2 (en) | 2015-01-13 | 2019-07-30 | The Chinese University Of Hong Kong | Using size and number aberrations in plasma DNA for detecting cancer |
| IL303115A (en) | 2016-05-30 | 2023-07-01 | Univ Hong Kong Chinese | Detecting hematological disorders using cell-free dna in blood |
-
2017
- 2017-05-30 IL IL303115A patent/IL303115A/en unknown
- 2017-05-30 KR KR1020227044979A patent/KR102605504B1/en active IP Right Grant
- 2017-05-30 CN CN201780033380.0A patent/CN109196120B/en active Active
- 2017-05-30 JP JP2018562945A patent/JP6987393B2/en active Active
- 2017-05-30 DK DK21163406.8T patent/DK3885447T3/en active
- 2017-05-30 EP EP23214529.2A patent/EP4324937A2/en active Pending
- 2017-05-30 CA CA3025708A patent/CA3025708A1/en active Pending
- 2017-05-30 EP EP17805833.5A patent/EP3464637B1/en active Active
- 2017-05-30 SG SG11201810544WA patent/SG11201810544WA/en unknown
- 2017-05-30 AU AU2017274038A patent/AU2017274038B2/en active Active
- 2017-05-30 US US15/608,863 patent/US10781490B2/en active Active
- 2017-05-30 CN CN202210823171.9A patent/CN115161390A/en active Pending
- 2017-05-30 KR KR1020187037241A patent/KR102482616B1/en active IP Right Grant
- 2017-05-30 KR KR1020237039843A patent/KR20230164209A/en active Application Filing
- 2017-05-30 WO PCT/CN2017/086509 patent/WO2017206888A1/en unknown
- 2017-05-30 EP EP21163406.8A patent/EP3885447B1/en active Active
- 2017-05-30 IL IL262953A patent/IL262953B2/en unknown
- 2017-05-30 DK DK17805833.5T patent/DK3464637T3/en active
-
2020
- 2020-08-19 US US16/997,435 patent/US11873527B2/en active Active
-
2021
- 2021-11-24 JP JP2021189986A patent/JP2022024127A/en active Pending
-
2023
- 2023-05-26 AU AU2023203305A patent/AU2023203305A1/en active Pending
-
2024
- 2024-02-13 JP JP2024019464A patent/JP2024054311A/en active Pending
Also Published As
Similar Documents
| Publication | Publication Date | Title |
|---|---|---|
| CN109196120B (en) | Detection of blood disorders using cell-free DNA in blood | |
| Breuss et al. | Autism risk in offspring can be assessed through quantification of male sperm mosaicism | |
| CN106661609B (en) | Method for predicting congenital heart defects | |
| Jia et al. | PIWI-interacting RNA sequencing profiles in maternal plasma-derived exosomes reveal novel non-invasive prenatal biomarkers for the early diagnosis of nonsyndromic cleft lip and palate | |
| Hua et al. | Detection of aneuploidy from single fetal nucleated red blood cells using whole genome sequencing | |
| Myers et al. | Integrated single-cell genotyping and chromatin accessibility charts JAK2V617F human hematopoietic differentiation | |
| WO2021237105A1 (en) | Methods for determining a genetic variation | |
| Agarwal et al. | Clinical utility of targeted next‐generation sequencing panel in routine diagnosis of hereditary hemolytic anemia: a national reference laboratory experience | |
| Zhao et al. | Breakpoint mapping of at (9; 22; 12) chronic myeloid leukaemia patient with e14a3 BCR‐ABL1 transcript using Nanopore sequencing | |
| Wang et al. | Serological, fragmentomic, and epigenetic characteristics of cell-free DNA in patients with lupus nephritis | |
| CN113481289B (en) | Primer composition for detecting sideroblastic red blood cell anemia and application thereof | |
| Du et al. | Unique dual indexing PCR reduces chimeric contamination and improves mutation detection in cell-free DNA of pregnant women | |
| Caggiano et al. | Tissue informative cell-free DNA methylation sites in amyotrophic lateral sclerosis | |
| Hamidah | Whole exome sequencing analysis of Malaysian monozygotic twin suspected with primary immunodeficiency diseases/Hamidah Abdul Ghani | |
| Madalese et al. | CBU Posttransplant Chimerism Analysis Using ChimerMarker™ | |
| Ghani | Whole Exome Sequencing Analysis of Malaysian Monozygotic Twin Suspected with Primary Immunodeficiency Diseases | |
| Gai | Single-molecule Analysis of Circulating Cell-free DNA: Biological and Clinical Perspectives | |
| Akbari | Biological and Aetiological Inference from the Statistical Genetic Analyses of Blood Cell Traits | |
| CN113186274A (en) | GRPEL1 mutant gene, primer, kit and method for detecting GRPEL1 mutant gene and application of GRPEL1 mutant gene | |
| Vadgama | Investigating postzygotic de novo mutations and somatic mosaicism in monozygotic twins discordant for complex disorders |
Legal Events
| Date | Code | Title | Description |
|---|---|---|---|
| PB01 | Publication | ||
| PB01 | Publication | ||
| SE01 | Entry into force of request for substantive examination | ||
| SE01 | Entry into force of request for substantive examination | ||
| REG | Reference to a national code |
Ref country code: HK Ref legal event code: DE Ref document number: 1261820 Country of ref document: HK |
|
| GR01 | Patent grant | ||
| GR01 | Patent grant |