WO2021237105A1 - Methods for determining a genetic variation - Google Patents
Methods for determining a genetic variation Download PDFInfo
- Publication number
- WO2021237105A1 WO2021237105A1 PCT/US2021/033681 US2021033681W WO2021237105A1 WO 2021237105 A1 WO2021237105 A1 WO 2021237105A1 US 2021033681 W US2021033681 W US 2021033681W WO 2021237105 A1 WO2021237105 A1 WO 2021237105A1
- Authority
- WO
- WIPO (PCT)
- Prior art keywords
- probe
- genetic
- metric
- sample
- genome
- Prior art date
Links
Classifications
-
- G—PHYSICS
- G16—INFORMATION AND COMMUNICATION TECHNOLOGY [ICT] SPECIALLY ADAPTED FOR SPECIFIC APPLICATION FIELDS
- G16B—BIOINFORMATICS, i.e. INFORMATION AND COMMUNICATION TECHNOLOGY [ICT] SPECIALLY ADAPTED FOR GENETIC OR PROTEIN-RELATED DATA PROCESSING IN COMPUTATIONAL MOLECULAR BIOLOGY
- G16B20/00—ICT specially adapted for functional genomics or proteomics, e.g. genotype-phenotype associations
- G16B20/10—Ploidy or copy number detection
-
- C—CHEMISTRY; METALLURGY
- C12—BIOCHEMISTRY; BEER; SPIRITS; WINE; VINEGAR; MICROBIOLOGY; ENZYMOLOGY; MUTATION OR GENETIC ENGINEERING
- C12Q—MEASURING OR TESTING PROCESSES INVOLVING ENZYMES, NUCLEIC ACIDS OR MICROORGANISMS; COMPOSITIONS OR TEST PAPERS THEREFOR; PROCESSES OF PREPARING SUCH COMPOSITIONS; CONDITION-RESPONSIVE CONTROL IN MICROBIOLOGICAL OR ENZYMOLOGICAL PROCESSES
- C12Q1/00—Measuring or testing processes involving enzymes, nucleic acids or microorganisms; Compositions therefor; Processes of preparing such compositions
- C12Q1/68—Measuring or testing processes involving enzymes, nucleic acids or microorganisms; Compositions therefor; Processes of preparing such compositions involving nucleic acids
- C12Q1/6813—Hybridisation assays
- C12Q1/6827—Hybridisation assays for detection of mutation or polymorphism
Definitions
- the technology relates to, in part, methods and processes of detecting a genetic variation in a genetic sample comprising genetic material derived from different sources or different genomes.
- the technology also relates to, in part, computer implemented methods for analyzing genetic data to detect genetic variations such as chromosomal aneuploidies and copy number variations with higher accuracy, precision and/or confidence.
- the methods provided herein provide a significant improvement in the technical field of genetic analysis.
- a method of determining a copy number of a nucleic acid region of interest in a genome of interest comprising (A) providing a genetic sample comprising genetic material derived from a first genome and genetic material derived from a second genome, (B) determining a first metric representative of a joint probability of a first copy number hypothesis for a nucleic acid region of interest in the first genome by a process comprising determining a first probability and a second probability of the first copy number hypothesis where each of the first probability and the second probability of the first copy number hypothesis is a function of (i) an amount of a plurality of non-polymorphic reference loci in the genetic sample, and (ii) an amount of a plurality of non-polymorphic loci in the nucleic acid region of interest in the genetic sample, the first probability of the first copy number hypothesis is further a function of a first likelihood distribution (f1 ) of a genetic fraction of genetic material derived from the first
- the method comprises determining (i) the amount of the plurality of non- polymorphic reference loci in the genetic sample, and (ii) the amount of the plurality of non- polymorphic loci in the nucleic acid region of interest in the genetic sample.
- the amounts of (i) or (ii) are determined by a process comprising: I.) contacting at least a first and a second probe set to the genetic sample, where (1) the first probe set comprises a first labeling probe and a first tagging probe comprising an affinity tag, where the first labeling probe hybridizes adjacent to the first tagging probe on a first locus, and (2) the second probe set comprises a second labeling probe, and a second tagging probe comprising the affinity tag, where the second labeling probe hybridizes adjacent to the second tagging probe on a second locus; II.) ligating the first labeling probe to the first tagging probe thereby providing a first ligated probe set, and ligating the second labeling probe to the second tagging probe, thereby providing a second ligated probe set; III.) amplifying the first and second ligated probe sets to form first and second amplified ligated probe sets, respectively, where, (1) the first ligated probe set is amplified using
- f2 is determined by a process comprising: I.) contacting at least a first and a second probe set to the genetic sample, where (1) the first probe set comprises a first labeling probe and a first tagging probe comprising an affinity tag, where the first labeling probe hybridizes adjacent to the first tagging probe at a first allele of an informative polymorphic locus of the plurality of non-polymorphic reference loci, and (2) the second probe set comprises a second labeling probe, and the first tagging probe, where the second labeling probe hybridizes adjacent to the first tagging probe on a second allele of the informative polymorphic locus of the plurality of non-polymorphic reference loci; II.) ligating the first labeling probe to the first tagging probe thereby providing a first ligated probe set, and ligating the second labeling probe to the first tagging probe, thereby providing a second ligated probe set; III.) amplifying the first and second ligated probe sets to form
- a method of analyzing a genetic sample from a subject said genetic sample containing a first genetic material and optionally having a second genetic material, the method comprising: determining a fraction of the second genetic material in the genetic sample based on a first number and a second number, the first number and the second number obtained by: contacting first and second probe sets to the genetic sample, where the first probe set comprises a first labeling probe and a first tagging probe, and where the second probe set comprises a second labeling probe and a second tagging probe; hybridizing the first and second probe sets to first and second nucleic acid regions of interest in nucleotide molecules present in the genetic sample, respectively; labeling the first and second labeling probes with first and second labels, respectively; immobilizing the first and second probe sets to a substrate at a density in which the first and second labels of the first and second probe sets are optically resolvable after immobilization; and detecting: (i) a first number of the first label
- the genetic material from the first genetic material comprises maternal genetic material from the subject, and the second genetic material comprises fetal genetic material from a fetus, and where a ratio of the first number and the second number corresponds to a measure of the fetal fraction.
- the first and the second probe sets are allele-specific.
- a method of determining genetic variation in a genetic sample said genetic sample containing a first genetic material and optionally having a second genetic material, the method comprising: determining, using a computer system, a first metric corresponding to a measure of certainty of a null hypothesis that the genetic variation is absent in the genetic sample, where the first metric is a continuous function of a fraction of the second genetic material, and conditioned on the absence of the genetic variation in a first data set; determining, using a computer system, a second metric corresponding to a measure of certainty of an alternative hypothesis that the genetic variation is present in the genetic sample, where the second metric is a continuous function of the fraction of the second genetic material, and conditioned on the presence of the genetic variation in the first data set; determining, using a computer system, a relative number based on the first metric and the second metric; and determining, using a computer system, if the genetic variation is present in the genetic sample by comparing the relative number to a
- Fig. 1 shows two exemplary probe sets each comprising a tagging probe and a labeling probe.
- the top probe set targets a first locus (e.g., locus 1 , e.g., in a region of interest) and the bottom probe set targets a second different locus (e.g., locus 2, e.g., a reference locus).
- the tagging probe of locus 1 comprises a forward primer binding site (1), an affinity tag (2), and a target specific portion (3).
- the labeling probe of locus 1 comprises a target specific portion (4) and a reverse primer binding site (5).
- the tagging probe of locus 2 comprises a forward primer binding site (6), an affinity tag (7), and a target specific portion (8).
- the labeling probe of locus 2 comprises a target specific portion (9) and a reverse primer binding site (10).
- the affinity tags (2) and (3) are the same, and in some embodiments, the primer binding sites (1) and (6) are the same.
- the reverse primer binding sites (5) and (10) may be different in certain embodiments, to allows differential labeling of a first amplification product of a ligated probe set of locus 1 and a second amplification product of a ligated probe set of locus 2.
- Fig. 2 shows and exemplary workflow using the probe set for locus 1 as described in Fig. 1.
- the tagging probe comprises primer binding site (1), affinity tag (2) and target specific portion (3), and the labeling probe comprises target specific portion (4) and primer binding site (5).
- the probe set is contacted with a sample comprising cell-free DNA in Step 1.
- target specific portion (3) of the tagging probe hybridizes to locus 1 immediately adjacent to target specific portion (4) of the labeling probe as shown in Step 2.
- the tagging probe is ligated to the labeling probe by addition of a ligase in Step 3.
- the ligated probe set is amplified by PCR in Step 4 where the reverse primer comprises a fluorescent label (circle) and hybridizes to primer binding site (5), thereby providing a plurality of labeled amplicons as shown in Step 5.
- Step 6 is optional and shows degradation of the non-labeled amplicon using a lambda exonuclease.
- the labeled amplicon is protected from exonuclease digest because of the label attached to the 5'-end of the labeled amplicon.
- the final labeled target comprises a complement of the affinity tag (2) which hybridizes to a capture probe immobilized on a microarray, thereby immobilizing the labeled amplicon at a predefined location on the array, as shown in Step 7.
- Fig. 3A shows two different types of amplified ligated probe products generated by the workflow of Fig. 2, where a first probe set hybridized to a first locus (e.g., a region of interest, e.g., chromosome 21), and a second probe set hybridized to a second locus (e.g., a reference locus, e.g., chromosome 15).
- a first probe set hybridized to a first locus e.g., a region of interest, e.g., chromosome 21
- a second probe set hybridized to a second locus e.g., a reference locus, e.g., chromosome 15
- both types of amplified ligated probe sets comprise the same affinity tag, and therefore are immobilized at the same spot or element of the microarray shown in Fig. 3B.
- the reverse primer used to amplify the first ligated probe set comprises a red fluorescent label (Locus 1 Product) and the reverse primer used to amplify the second ligated probe set comprises a green fluorescent label (Locus 2 product).
- Each labeled amplicon is optically resolvable on the array, and therefore individual amplicons for each locus can be counted.
- red labels can be filtered out so that the green labels can be counted, and vice versa.
- Fig. 4A shows a digital image of an element on a microarray filtered to show green fluorescent labels of a plurality of amplified ligated probe sets configured to detect locus 2.
- Fig. 4B shows a magnified portion of the image of Fig 4A demonstrating that each of the green fluorescent labels are optically resolvable, each representing a single amplicon.
- Fig. 5A shows a digital image of the same element on the microarray as shown in Fig. 4A except the image of Fig. 5A is filtered to show red fluorescent labels of a plurality of amplified ligated probe sets configured to detect locus 1.
- Fig. 5B shows a magnified portion of the image of Fig 5A demonstrating that each of the red fluorescent labels are optically resolvable, each representing a single amplicon.
- FIG. 6 shows a diagram of components of an exemplary microarray on substrate 1 having multiple addressable elements (e.g., 3 and 4) spaced by distance "n".
- a digital image of element (8) is shown as image (12).
- FIG. 7 shows two exemplary probe sets, one probe set for Locus 1 (top) and one probe set for Locus 2 (bottom).
- a first probe set (top) comprises member probes 101 , 102, 103.
- Item 101 contains label (100) type “A.”
- Item 103 contains an affinity tag (104).
- a second probe set (bottom) with member probes 108, 109, 110 carries respective features as in the first probe set. However, 108 contains a label (107) of type “B,” distinguishable from type “A.”
- Items 110 contains an affinity tag (111).
- the three probes e.g., 101, 102, 103 are hybridized to the target molecule (105) such there are no gaps in between the probes on the target molecule.
- Fig. 8 shows a modification of the probe sets in Fig. 7.
- Fig. 8 depicts two probe sets, one probe set for Locus 1 (top) and one probe set for Locus 2 (bottom) were 207 and 214 are target molecules corresponding to Locus 1 and Locus 2, respectively.
- a first probe set (top) comprises member probes 202, 204, 206.
- 202 contains a label (201) of type “A.”
- 206 contains an affinity tag (205).
- a second probe set (bottom) with member probes 209, 211 , 231 carries respective features as in the first probe set.
- 209 contains a label (208) of type “B,” distinguishable from type “A.”
- 213 contains an affinity tag (212).
- the probes 204 and 211 may contain one or more labels (203, 210) of type “C.”
- Fig. 9 shows a modification of the probe sets in Fig. 7.
- Fig. 9 depicts two probe sets, one probe set for Locus 1 (top) and one probe set for Locus 2 (bottom).
- 307 and 314 are target molecules corresponding to Locus 1 and Locus 2, respectively.
- a first probe set (top) contains member probes 302, 303, 305.
- 302 contains a label (301 ) of type “A.”
- 305 contains an affinity tag (306).
- a second probe set (bottom) comprises member probes 309, 310, 312.
- 309 contains a label (308) of type “B,” distinguishable from type “A.”
- 312 contains an affinity tag (313).
- the probes 305 and 312 contain one or more labels (304, 311) of type “C.”
- Fig. 10 shows a modification of the probe sets in Fig. 7.
- 407 and 414 are target molecules corresponding to Locus 1 and Locus 2, respectively.
- a first probe set (top) contains member probes 402, 405.
- 402 contains a label (401) of type “A.”
- 405 contains an affinity tag (406).
- a second probe set (bottom) with member probes 409, 412 carries respective features as in the first probe set.
- 409 contains a label (408) of type “B,” distinguishable from type “A.”
- 412 contains an affinity tag (413).
- probes 402 and 405 hybridize to sequences corresponding to Locus 1 , but there is a “gap” on the target molecule having one or more nucleotides between hybridized probes 402 and 405.
- a DNA polymerase or other enzyme may be used to synthesize a new polynucleotide species (404) that covalently joins 402 and 405.
- 404 may contain one or more labels of type “C”.
- Fig. 11 shows a modification of the probe sets in Fig. 7.
- 505 and 510 are target molecules corresponding to Locus 1 and Locus 2, respectively.
- a first probe sets contains member probes 502, 503.
- 502 contains a label (501 ) of type “A.”
- 503 contains an affinity tag (504).
- a second probe set comprises member probes 507 and 508.
- 507 contains a label (506) of type “B,” distinguishable from type “A.”
- 508 contains an affinity tag (509).
- Fig. 12 shows a modification of the probe sets in Fig. 7.
- 606 and 612 are target molecules.
- a first probe sets contains member probes 602, 603.
- 602 contains a label (601) of type “A.”
- 603 contains an affinity tag (605).
- a second probe set comprises member probes 608 and 609.
- 608 contains a label (607) of type “B,” distinguishable from type “A.”
- 609 contains an affinity tag (611).
- the probes 603 and 609 contain one or more labels (604, 610) of type “C.”
- Fig. 13 shows a modification of the probe sets in Fig. 7.
- Fig. 13 depicts two probe sets for identifying various alleles of the same genomic locus.
- 706 and 707 are target molecules.
- a first probe set contains member probes 702, 703 and 704.
- 702 contains a label (701) of type “A.”
- 704 contains an affinity tag (705).
- a second probe set comprises member probes 709, 703 and 704.
- 703 and 704 are identical for both probe sets.
- 709 contains a label (708) of type “B,” distinguishable from type “A.”
- 702 and 709 contain sequences that are nearly identical, and differ by only one nucleotide in the sequence.
- Fig. 14 shows a modification of the probe sets in Fig. 7.
- Figure 14 depicts two probe sets for identifying various alleles of the same genomic locus.
- 807 and 810 are target molecules corresponding to Allele 1 and Allele 2, respectively.
- a first probe set comprises member probes 802, 804, 805.
- 802 contains a label (801 ) of type “A.”
- 805 contains an affinity tag (806).
- a second probe set comprises member probes 809, 804 and 805. 804 and 805 are identical for both probe sets.
- 809 contains a label (808) of type “B,” distinguishable from type “A.”
- Fig. 15 shows an exemplary probe set that can be used to determine a relative count of two different alleles of a single nucleotide polymorphism (SNP).
- a first probe set comprises Labeling Probe A and the Tagging probe which hybridizes to allele 1 having an "A" nucleotide at the position of the SNP.
- a second probe set comprises Labeling Probe B and the Tagging probe which hybridizes to allele 2 having a "G" nucleotide at the position of the SNP.
- the tagging probe of both sets comprises the same affinity tag and the same reverse primer can be used to amplify both ligated probe sets.
- the primer binding site of Labeling Probe A and Labeling Probe G are different. Therefore, the ligated probe product comprising Labeling Probe A and the Tagging Probe can be amplified with a different labeled primer than is different than and distinguishable from the labeled primer used to amplify the ligated probe set comprising Labeling Probe G and the Tagging Probe.
- Fig. 16 shows the likelihood of the observed data being indicative of a normal genotype or a trisomic genotype, as a function of the fetal fraction.
- Fig. 17 shows llikelihood profiles for the SNP loci tag T4239 in T21 pregnancy sample i with a male fetus.
- Bold black curve maternal genotype RA, fetal genotype aa.
- Gray curve maternal genotype RA, fetal genotype rr. Measured allele counts are from Table 10.
- Fig. 18 shows likelihood profiles for the SNP loci tag T4424 in T21 pregnancy sample / ' with a male fetus.
- Black curve maternal genotype RA, fetal genotype aa.
- Gray curve maternal genotype RA, fetal genotype rr. Measured allele counts are from Table 10.
- Fig. 19A-19B shows a sum of contributions from all possible or trial genotype combinations to likelihood profile for the SNP loci tag T4239 (Fig. 19A), and for the SNP loci tag T4424 (Fig. 19B), in a T21 pregnancy sample i with a male fetus. Measured allele counts are from Table 10.
- Fig. 20 shows an overall SNP likelihood profile for T21 pregnancy sample i with a male fetus, including contributions from both SNP loci tags T4239 and T4424.
- Vertical dashed gray line indicates the location of the maximum of the overall SNP log-Likelihood curve.
- Fig. 21 shows CNV log-Likelihood profiles vs. fetal fraction for the euploid fetus (null hypothesis, gray curve) and the T21 fetus (alternative hypothesis, black curve).
- Input values comprised the four experimentally measured and normalized loci tag ratios obtained for the T21 sample i from Table 11.
- Fig. 22 shows joint log-Likelihood profiles vs. fetal fraction for sample i, corresponding to T21 in black and euploid hypotheses in gray.
- Black and gray data points maximum joint log-likelihood values corresponding to the two hypotheses.
- the maximum joint log-likelihood value for the T21 (alternative hypothesis, black data point) exceeded the maximum joint log-likelihood value corresponding to the euploid (null hypothesis, gray data point) resulting in sample i being correctly classified as a T21 pregnancy.
- Figs. 23A-23B show llikelihood profiles for the SNP loci tags in a euploid pregnancy sample c with a female fetus.
- Fig. 23A shows likelihood profiles for the SNP loci tag T4239.
- Black curve maternal genotype RR, fetal genotype ra.
- Gray curve maternal genotype RA, fetal genotype rr.
- Fig. 23B shows likelihood profiles for the SNP loci tag T4424.
- Gray curve maternal genotype AA, fetal genotype ra. Measured allele counts are from Table 10.
- Figs. 24A-24B shows an overall SNP likelihood for the euploid sample c, obtained by combining likelihood profiles derived from data measured on both SNP loci T4239 (Fig. 24A) and T4424 (Fig. 24B).
- Fig. 25 shows an overall SNP likelihood for the euploid sample c with a female fetus.
- the SNP likelihood was obtained by combining likelihood profiles derived from data measured on both SNP loci T4239 and T4424.
- Vertical dashed gray line indicates the location of the maximum of the overall SNP log-Likelihood curve.
- Fig. 26 shows CNV log-Likelihood profiles vs. fetal fraction for the euploid fetus (null hypothesis, gray curve) and the T21 fetus (alternative hypothesis, black curve).
- Fig. 27 shows joint log-Likelihood profiles vs. fetal fraction for sample c, corresponding to the T21 and Euploid hypotheses, respectively.
- the continuous curves, black and gray, were evaluated by combining SNP likelihoods with CNV likelihoods, as described elsewhere.
- Black and gray dashed vertical lines show maximum joint log-likelihood values corresponding to the two hypotheses.
- kits for detecting, identifying or determining a genetic variation or a copy number of a nucleic acid region of interest in a genome of interest with improved accuracy, confidence and/or precision.
- the methods presented herein can be applied to a genetic sample comprising a mixture of genetic material derived from a first genome and a second genome (e.g., a genome of a fetus and a mother of the fetus, or e.g., a genome of a cancer and a genome of non-cancerous tissue), for example where the genetic sample is obtained from a single subject.
- methods presented herein can detect, identify or determine a genetic variation or a copy number of a nucleic acid region of interest with improved accuracy and/or precision by utilizing different estimates of a genetic fraction in a mixed genetic sample, where the genetic fraction is an amount of a first genetic material derived from a first genome relative to an amount of a second genetic material derived from a second genome in the genetic sample.
- Methods, systems and computer readable media presented herein often comprise improved data manipulation methods.
- identifying a genetic variation by a method described herein can lead to a diagnosis of, or determining a predisposition to, a particular medical condition.
- identifying a genetic variance or copy number of a nucleic acid region of interest can facilitate making a medical decision and/or employing a helpful medical procedure with a higher degree of confidence.
- Various methods have been developed to determine the presence or absence of a genetic variation in a subject. These methods can involve estimating the fraction or proportion of genetic material derived from a specific source, such as the fraction of tumor-derived nucleic acids or fetus- derived nucleic acids in a genetic sample.
- U.S. Patent No. 9,228,234 describes methods for determining the copy number of a chromosome in a fetus in the context of non-invasive prenatal diagnosis and other diagnostic and screening applications.
- the measured genetic data from a sample of genetic material that contains both fetal and maternal DNA is analysed, along with the genetic data from the biological parents of the fetus, and the copy number of the chromosome of interest is determined or estimated.
- these methods typically require estimating the genetic fraction (e.g., a fraction of genetic material derived from a given source in a genetic sample comprising genetic material from multiple sources) solely by point estimation, which can vary from the actual genetic fraction, thereby introducing error into the method.
- the fraction of genetic material from a given source is estimated to be a single value or a constant, and this estimated value or constant can differ from the true value or true estimate of the genetic fraction.
- methods presented herein include estimating genetic fraction by optimizing one or more metrics, including but not limited to a probability and/or a likelihood of a null and alternative hypothesis associated with an absence and presence, respectively, of a genetic variation in a genetic sample.
- metric refers to a measure of certainty or expectation (e.g., probability or likelihood) of, for example, a null or alternative hypothesis.
- a metric comprises a function.
- function can refer to a continuous function, a discontinuous function (e.g., a discrete function), or any combination thereof.
- Estimating genetic fraction by optimizing a metric including but not limited to probability and likelihood, often results in a more accurate estimation of a genetic fraction, and thereby increases the Statistical Power of the method (e.g., reduce Type II error, or reduce the probability of incorrectly accepting the null hypothesis).
- Estimating genetic fraction by optimizing a metric may result in a more accurate estimation of a genetic fraction, and thereby increases the Statistical Significance of the method (e.g., reduces Type I error, or reduces the probability of incorrectly rejecting a null hypothesis).
- the present disclosure provides methods for determining a genetic fraction of a genetic material derived from a given source (e.g., a fetus or a tumor present in a mixed sample), and using the determined genetic fraction as a trigger, (e.g., determining factor, decision tool, deciding factor, or tiebreaker) to perform additional testing or to not perform additional testing.
- a given source e.g., a fetus or a tumor present in a mixed sample
- a trigger e.g., determining factor, decision tool, deciding factor, or tiebreaker
- the present disclosure provides methods of using optically resolvable single molecule arrays to measure a fraction of genetic material in a genetic sample, and comparing the measured fraction of genetic material to a threshold to determine which additional test, if any, should be performed.
- the present disclosure relates to, in certain embodiments, methods of analyzing a genetic sample from a subject, said genetic sample containing a first genetic material and optionally having a second genetic material, the method comprising: determining a fraction of a second genetic material in the genetic sample based on a first number and a second number, the first number and the second number obtained by: (a) contacting first and second probe sets to the genetic sample, wherein the first probe set comprises a first labeling probe and a first tagging probe, and wherein the second probe set comprises a second labeling probe and a second tagging probe; (b) hybridizing the first and second probe sets to first and second nucleic acid regions of interest in nucleotide molecules present in the genetic sample, respectively, (c) labeling the first and second labeling probes with first and second labels, respectively; (d) immobilizing at least parts of the first and second probe sets (e.g., first and second ligated probe sets) to a substrate at a density in which the first and second
- biomarker can refer to a distinctive biological indicator of a genetic material being derived from a particular source (e.g., a fetus, a mother, a tumor, a transplanted tissue, etc.).
- Biomarkers as used herein encompass, without limitation, gene products with or without polymorphisms, mutations, variants, modifications, or other biomarkers.
- the one or more biomarkers are selected from the group consisting of a SNP, an insertion-deletion variant (indel), a microsatellite, a bi-allelic marker, a multi-allelic marker, a polymorphic marker, a polynucleotide repeat, a fragment size, a copy number variant, an RNA marker or transcript, a protein marker, a methylation marker, the like and combinations thereof.
- the one or more biomarkers comprise one or more SNPs.
- the one or more biomarkers comprise one or more indels.
- the one or more biomarkers comprise one or more microsatellites.
- the one or more biomarkers comprise one or more bi- allelic markers. In one aspect, the one or more biomarkers comprise one or more multi-allelic markers. In one aspect, the one or more biomarkers comprise one or more polymorphic markers. In one aspect, the one or more biomarkers comprise one or more polynucleotide repeats. In one aspect, the one or more biomarkers comprise a fragment size. In one aspect, the one or more biomarkers comprise one or more copy number variants. In one aspect, the one or more biomarkers comprise one or more RNA markers. In one aspect, the one or more biomarkers comprise one or more protein markers. In one aspect, the one or more biomarkers are one or more methylation markers.
- a method comprises hybridizing a first and a second probe set to first and second nucleic acid regions of interest in nucleotide molecules present in the genetic sample, respectively, wherein the first nucleic acid region of interest exists on a first nucleic acid from a first source, and wherein the second nucleic acid region of interest exists on a second nucleic acid from a second source.
- probe sets are specifically targeted to genetic material from two different sources (e.g., genetic material derived from a mother and genetic derived from a fetus).
- first and second probe sets represent different forms of a biomarker (e.g., different alleles of a SNP).
- Figures 7-15 depicts exemplary probe sets that can be used for a method disclosed herein.
- a first genetic material comprises maternal genetic material from a mother, and a second genetic material comprises fetal genetic material from a fetus. In one aspect, a ratio of a first number and a second number corresponds to a measure of the fetal fraction. In one aspect, a first genetic material comprises non-tumor derived genetic material, and a second genetic material comprises tumor-derived genetic material. In one aspect, a ratio of the first number and the second number corresponds to a measure of the tumor fraction. In one aspect, the genetic material from the first genetic material comprises organ recipient genetic material from the subject, and the second genetic material comprises organ-donor genetic material from the donor of a transplanted organ.
- a ratio of the first number and the second number corresponds to a measure of the fraction of material from a donated organ.
- a first and a second nucleic acid regions of interest are the same region.
- a first and a second probe sets are allele-specific, and each hybridize to the same or about the same region of the genome.
- a first and a second probe sets are allele-specific, and each hybridize to different regions of the genome.
- the method further comprises determining a genetic variation in the genetic sample when the fraction exceeds a predetermined threshold, value, ratio or number.
- a genetic variation is selected from the group consisting of an aneuploidy, a copy number change, a deletion, an indel, an insertion, an inversion, a monosomy, a mutation, a SNP, a translocation, a splice variant and a trisomy.
- the genetic variation comprises an aneuploidy.
- a genetic variation comprises a copy number change.
- a genetic variation comprises a deletion.
- a genetic variation comprises an indel.
- a genetic variation comprises an inversion.
- a genetic variation comprises a monosomy.
- a genetic variation comprises a mutation.
- a genetic variation comprises a SNP. In one aspect, a genetic variation comprises a translocation. In one aspect, a genetic variation comprises a splice variant. In one aspect, a genetic variation comprises a trisomy. In one aspect, a fetal fraction is weighted based on a genetic variation. In one aspect, a fetal fraction is weighted according to the first number and/or the second number.
- determining a genetic variation comprises performing an additional test selected from the group consisting of microarrays, sequencing-bysynthesis, digital polymerase chain reaction (dPCR), real-time quantitative polymerase chain reaction (rtPCR), array capture, a nucleic acid sequence-based detection, massively parallel genomic sequencing, digital arrays, single molecule arrays, single molecule counting, oligo-ligation assays and single molecule sequencing.
- determining a genetic variation comprises performing an additional test comprising a digital array.
- determining a genetic variation comprises performing an additional test comprising a single molecule array.
- determining a genetic variation comprises performing an additional test comprising single molecule counting.
- determining a genetic variation comprises performing an additional test comprising DNA or RNA sequencing.
- an additional test is performed using the genetic sample or an additional genetic sample from the subject.
- the additional test is performed only if the fraction exceeds a predetermined threshold.
- the additional genetic sample is collected only if the fraction exceeds a predetermined threshold.
- the additional test is performed only if the fraction subceeds a predetermined threshold.
- the additional genetic sample is collected only if the fraction exceeds a predetermined threshold.
- a ‘threshold’ can include a number, a ratio, a value, a constant, a range, a probability, or a likelihood.
- a ‘threshold’ can be multifaceted or can include multiple thresholds (e.g., a threshold can comprise two or more numbers, two or more ratios, two or more values, two or more constants, two or more ranges, two or more probabilities, or two or more likelihoods).
- a threshold may be upper or lower confidence interval on an estimate (for example, of the fetal fraction).
- a threshold may be a number derived from an estimate, for example, a value above with there is a defined probability that the fetal fraction of the sample exceeds.
- the genetic sample or the additional genetic sample is selected from the group consisting of whole blood, blood plasma, blood serum, buffy coat, urine, vaginal fluid, fluid from a hydrocele (e.g., of the testis), vaginal flushing fluids, pleural fluid, ascitic fluid, cerebrospinal fluid, saliva, sweat, tears, sputum, bronchoalveolar lavage fluid, discharge fluid from the nipple, isolated cells, tissue, circulating fetal cells, circulating tumor cells and circulating cells from a transplanted organ.
- a fraction of the second genetic material in the genetic sample is not determined by point estimation.
- a subject refers to animals, typically mammalian animals.
- a subject is a mammal.
- mammals include humans, non-human primates (e.g., apes, gibbons, chimpanzees, orangutans, monkeys, macaques, and the like), domestic animals (e.g., dogs and cats), farm animals (e.g., horses, cows, goats, sheep, pigs), zoo animals, wild animals and experimental animals (e.g., mouse, rat, rabbit, guinea pig).
- a subject is a primate.
- a subject is a human.
- a subject is of any age from birth until death.
- a subject is an adult, (e.g., at an age capable of bearing children, or older).
- a subject is not an embryo.
- a subject is not a fetus.
- a subject can be male or female.
- a subject is a pregnant subject (e.g., a pregnant female).
- a subject has or is suspected of having a cancer.
- a subject is at risk of developing a cancer.
- Subjects at risk of developing a cancer can be subjects in high-risk groups who can be identified by a medical professional.
- Non-limiting examples of subjects at risk of cancer include chronic smokers, overweight individuals, human subjects over the age of 60, subjects with a family history of cancer, subjects having certain gene mutations that are associated with certain cancers, subjects infected with, or previously infected with certain viruses associated with the development of certain cancers, subjects exposed to known carcinogens, subjects exposed to excessive radiation (e.g., UV radiation, alpha, beta, or gamma radiation), subjects having chronic inflammation, the like, or combinations thereof.
- a subject has received a treatment for a cancer.
- a subject is at risk of developing a cancer is subject has a cancer resected removed, and for example, the subject is at risk of a cancer still being present or returning.
- a subject is at risk of developing a cancer is subject who had a cancer and is considered in remission.
- a subject is in remission from a cancer and a method disclosed herein is used to monitor a subject for a reoccurrence of cancer. Accordingly, in certain embodiments, a method disclosed herein is used to determine a presence, absence, or change in amount of a cancer in a subject.
- an amount of cancer refers to a volume or size of a cancer (e.g., a solid tumor), or an amount of cancer cells in a subject, or within a location in or on a subject.
- a method disclosed herein is used to determine a metastatic potential or metastatic status of a cancer. For example, a method disclosed herein may be used to determine if cancer is a metastatic cancer.
- a subject has received, or is a candidate for receiving a transplant. Accordingly, in some embodiments, a method disclosed herein is used to determine a presence, absence or amount of a transplanted organ or tissue in or on a subject.
- a cancer refers to a neoplastic cell or tissue.
- a cancer include a carcinoma, sarcoma, neuro neoplasia, a blood cancer (e.g., a lymphoma, myeloma, leukemia), melanoma, mesothelioma, solid or soft tissue tumors, and secondary cancers (e.g., derived from a primary site)).
- Non-limiting examples of a carcinoma include respiratory system carcinomas, gastrointestinal system carcinomas, genitourinary system carcinomas, testicular carcinomas, prostatic carcinomas, endocrine system carcinomas, basal cell carcinoma of the skin, carcinoma of unknown primary, cholangiocarcinoma, ductal carcinoma in situ (DCIS), merkel cell carcinoma, lung carcinoma, thymoma and thymic carcinoma, midline tract carcinoma, lung small cell carcinoma, thyroid carcinoma, liver hepatocellular carcinoma, squamous cell carcinoma, head and neck squamous carcinoma, breast carcinoma, epithelial carcinoma, adrenocortical carcinoma, ovarian surface epithelial carcinoma, and the like, further including carcinomas of the uterus, cervix, colon, pancreas, kidney, esophagus, stomach and ovary.
- DCIS ductal carcinoma in situ
- Non-limiting examples of a sarcoma include Ewing sarcoma, lymphosarcoma, liposarcoma, osteosarcoma, soft tissue sarcoma, Kaposi sarcoma, rhabdomyosarcoma, uterine sarcoma, chondrosarcoma, leiomyosarcoma, fibrosarcoma and the like.
- Non-limiting examples of a neuro neoplasia include glioma, glioblastoma, meningioma, neuroblastoma, retinoblastoma, astrocytoma, oligodendrocytoma and the like.
- Non-limiting examples of lymphomas, myelomas, and leukemias include acute and chronic lymphoblastic leukemia, myeloblastic leukemia, multiple myeloma, poorly differentiated acute leukemias (e.g., erythroblastic leukemia and acute megakaryoblastic leukemia), acute promyeloid leukemia (APML), acute myelogenous leukemia (AML), chronic myelogenous leukemia (CML), acute lymphoblastic leukemia (ALL), which includes B-lineage ALL and T-lineage ALL, chronic lymphocytic leukemia (CLL), prolymphocytic leukemia (PLL), hairy cell leukemia (HLL), Waldenstrom’s macroglobulinemia (WM), non-Hodgkin lymphoma and variants, peripheral T cell lymphomas, adult T cell leukemia/lymphoma (ATL), cutaneous T-cell lymphoma (CTCL), large granular lymphocytic le
- Non-limiting examples of soft or solid tissue tumors include visceral tumors, seminomas, hepatomas, and other tumors of the breast, liver, lung, pancreas, uterus, ovary, testicle, head, neck, eye, brain, mouth, pharynx, vocal cord, ear, nose, esophagus, stomach, intestine, colon, adrenal, kidney, bone, bladder, urethra, carcinomas, lung, muscle, skin, feet, hands, and soft tissue.
- a non-cancerous tissue refers to a tissue that is not a cancer.
- a non-cancerous tissue comprises or consists of normal and/or healthy cells, for example as determined by a medical practitioner.
- a non-cancerous tissue is a cell or tissue deemed not to be a cancer, not to be a neoplasm and not to be malignant by a medical practitioner.
- a non-cancerous tissue displays normal growth characteristics, normal function, normal vascularization and/or normal adhesion for a given tissue type or cell type.
- a non-cancerous tissue comprises or consists of cells having an expected (e.g., normal) number of autosomes and sex chromosomes for a given species. It is well within the skill set of a medical professional or practitioner (e.g., an oncologist) to determine (e.g., by biopsy and/or microscopic examination) if a cell or tissue is not cancerous.
- a subject is a transplant recipient.
- a transplant recipient refers to a subject who has received a transplant.
- a transplant refers to a suitable organ or tissue derived from a first subject (e.g., an organ donor) that is introduced into or on a second subject (e.g., a transplant recipient), where the first and second subjects are genetically different members of the same species.
- a transplant is an allotransplant.
- a transplant comprises a genome that is different than the genome of the transplant recipient.
- a transplant comprises an organ, or portion thereof, non-limiting examples of which include liver, kidney, heart, pancreas, intestine, lung, skin, eye, stomach, the like, portions thereof or combinations thereof. Other non-limiting examples of a transplant include limbs such as hands, arms, feet and the like.
- a transplant comprises a tissue, or portion thereof, non-limiting examples of which include skin, bone marrow, bone marrow derived cells, stem cells, blood cells, bone, platelets, heart valve, cornea, nerves, veins, connective tissue, the like and combinations thereof.
- a transplant e.g., a transplanted organ or tissue
- a method presented herein is used to detect and monitor graft versus host disease (GVHD) by detecting a relative amount of genetic material derived from a transplant (e.g., transplanted cells (e.g., lymphocytes (B-cells, T- cells), macrophages, and combinations thereof)) present in a transplant recipient.
- a transplant e.g., transplanted cells (e.g., lymphocytes (B-cells, T- cells), macrophages, and combinations thereof) present in a transplant recipient.
- Methods disclosed herein can be used, in certain embodiments, to determine a presence or absence of a genetic variation or copy number of a nucleic acid region of interest in a genome of a fetus (e.g., a fetus carried in a womb of a pregnant female). Methods disclosed herein can be used, in certain embodiments, to determine a copy number of a nucleic acid region of interest in one fetus, or two fetuses (e.g., in the case of twins). In some embodiments, methods presented herein can be used to determine a copy number of interest in three, four, five, six, seven or eight fetuses housed in a womb of a pregnant female.
- methods disclosed herein can be used to determine a presence or absence of a genetic variation present in a genome of a pair of twins (e.g., identical or non-identical twins), or a trio of triplets (e.g., identical or non-identical triplets).
- twins e.g., identical or non-identical twins
- trio of triplets e.g., identical or non-identical triplets
- a fetus refers to an unborn offspring of a mammal (e.g., a female mammal).
- a fetus can be of any gestational age, non-limiting examples of which include 1 week to 50 weeks post-conception, 3 weeks to 42 weeks post conception, 6 weeks to 42 weeks post conception,
- a fetus is a multicellular embryo.
- a fetus is an offspring more than 1 , 2, 3, 4, 5, 6, 7, 8, 9, 10, 11 , 12, 13, 14, 15, 16, 17, 18, 19, or 20 weeks after conception, and prior to birth.
- conception initiates at fertilization or upon transplantation of an embryo.
- a sample e.g., a sample comprising nucleic acids; e.g., a genetic sample
- a sample is often derived from or obtained from a suitable subject or any suitable portion of a subject.
- a sample can be isolated or obtained directly from a subject.
- a sample obtained from a subject is obtained indirectly from the subject, for example wherein a third party (e.g., a courier or medical professional) delivers a sample for later analysis, e.g., by a method described herein.
- a sample is provided.
- a sample that is provided is simply a sample that exists as a starting material for conducting a method described herein and does not imply that the sample was physically or actively delivered or obtained.
- a sample comprises, consists of, or is derived from a suitable specimen that is isolated or obtained from a subject.
- a sample comprises a mixture of specimens isolated, obtained or derived from the same subject.
- multiple samples derived from different subjects may be mixed or combined.
- Non-limiting examples of a sample or specimen include fluid or tissue, including, without limitation, blood or a blood product (e.g ., serum, plasma, platelets, buffy coats, blood cells or the like), lymph, umbilical cord blood, chorionic villi, amniotic fluid, cerebrospinal fluid, spinal fluid, lavage fluid (e.g., lung, gastric, peritoneal, ductal, ear, arthroscopic), a biopsy sample, a celiocentesis sample, cells (blood cells, lymphocytes, placental cells, platelets, monocytes, stem cells, bone marrow derived cells, embryo or fetal cells) or parts thereof (e.g., mitochondrial, nucleus, extracts, or the like), urine, feces, sputum, saliva, nasal mucous, prostate fluid, lavage, semen, lymphatic fluid, bile, tears, sweat, breast milk, breast fluid, the like or combinations thereof.
- a blood product e.g
- Non-limiting examples of s tissue include organ tissues (e.g., liver, kidney, lung, thymus, adrenals, skin, bladder, reproductive organs, intestine, colon, spleen, brain, the like or parts thereof), epithelial tissue, hair, hair follicles, ducts, canals, bone, eye, nose, mouth, throat, ear, nails, the like, parts thereof or combinations thereof.
- a sample is cell-free or substantially cell- free (e.g., excludes whole cells).
- a sample comprises cells.
- a sample comprises dead cells, portions thereof or nucleic acids thereof.
- a sample may comprise cells or tissues that are normal, healthy, non-cancerous, diseased (e.g., infected), and/or cancerous (e.g., cancer cells).
- a sample is a genetic sample.
- a genetic sample comprises genetic material (e.g., nucleic acids, e.g., DNA) obtained from or derived from a subject.
- a genetic sample comprises genetic material obtained from or derived from a single subject.
- a genetic sample comprises genetic material obtained from or derived from multiple subjects.
- a genetic sample comprises nucleic acids, or fragments thereof, non-limiting examples of which include DNA (e.g., genomic DNA, extracellular DNA and cell-free DNA), RNA (e.g., mRNA, exosomal RNA, cell-free RNA), the like and combinations thereof.
- a genetic sample comprises DNA.
- a genetic sample comprises cell free DNA. Nucleic acids of a genetic sample may be single stranded and/or double stranded. In certain embodiments, a genetic sample comprises heritable and/or non-heritable biological information encoded in the nucleic acids of a sample.
- a genetic sample comprises genetic material.
- genetic material comprises nucleic acids derived from and/or originating from a nucleus of a cell.
- genetic material comprises nucleic acids derived from one or more genomes.
- a genome refers to genetic material or nucleic acids derived from one or more cells of a particular subject, tissue, cancer, fetus, transplant, or the like having a genotype that is substantially the same.
- a genome refers to genetic material or nucleic acids derived from the nucleus of one or more cells.
- genetic material derived from a genome comprises or consists of DNA.
- genetic material derived from a genome comprises or consists of RNA.
- genetic material comprises nucleic acids that encode one or more proteins.
- genetic material comprises nucleic acids that regulate or direct expression of RNA or a protein (e.g., untranslated regions, intron, promoters, regulator regions).
- genetic material comprises nucleic acids that do not encode a protein (e.g., repeat regions, pseudogenes, and the like).
- a genetic sample comprises genetic material derived from a first genome and genetic material derived from a second genome.
- a genetic sample comprises genetic material derived from two to ten genomes (e.g., 2, 3, 4, 5, 6, 7, 8, 9 or 10 genomes) which are, in certain embodiments, different genomes.
- a genetic sample comprises genetic material derived from a first genome and genetic material derived from a second genome, where the genetic sample was obtained from a single subject.
- a genetic sample may comprise a mixture of nucleic acids derived from (e.g., originating from) a first genome and a second genome.
- Non-limiting examples of a genome include a genome of a fetus, a genome of a mother of a fetus, a genome of a cancer, a genome of non-cancerous tissue, a genome of a transplant, a genome of a transplant recipient, a genome of a subject, a genome of a contamination (e.g., a genome from another sample or source than was inadvertently introduced into a genetic sample being processed), and the like.
- a genome of a fetus a genome of a mother of a fetus, a genome of a cancer, a genome of non-cancerous tissue, a genome of a transplant, a genome of a transplant recipient, a genome of a subject, a genome of a contamination (e.g., a genome from another sample or source than was inadvertently introduced into a genetic sample being processed), and the like.
- a genetic sample comprises genetic material derived from a fetus and genetic material derived from a mother of the fetus. In some embodiments, a genetic sample comprises genetic material derived from a genome of a fetus and genetic material derived from a genome of a mother of the fetus. In some embodiments, a genetic sample comprises genetic material derived from two or more fetuses and genetic material derived from a mother of the fetus.
- a genetic sample comprises genetic material derived from a cancer and genetic material derived from non-cancerous tissue. In some embodiments, a genetic sample comprises genetic material derived from a genome of a cancer and genetic material derived from a genome of non-cancerous tissue. In some embodiments, a genetic sample comprises genetic material derived from two or more different cancers and genetic material derived from non-cancerous tissue. In some embodiments, a genetic sample comprises a mixture of cancer cell DNA and noncancer cell DNA. In some embodiments, a genetic sample comprises a mixture of cancer cell RNA and non-cancer cell RNA. A genetic sample may comprise aberrant or mutated nucleic acid sequences arising from tumor formation or metastasis.
- a genetic sample comprises genetic material derived from a transplant and genetic material derived from a transplant recipient. In some embodiments, a genetic sample comprises genetic material derived from a genome of a transplant and genetic material derived from a genome of a transplant recipient. In some embodiments, a genetic sample comprises genetic material derived from two or more different transplants and genetic material derived from a transplant recipient.
- a genetic sample may comprise nucleic acids derived from one, or two or more sources (e.g., one or more cells, one or more cell types, e.g., one or more genomes).
- a sample or genetic sample comprises cells or portions thereof (e.g., nucleic acids) derived from one or more sources, non-limiting examples of which include a subject, a host, a transplant, a transplant recipient, a cancer, a mother, a fetus, cells thereof, genomes thereof and/or combinations thereof.
- a genetic sample comprises nucleic acids derived from 1 to 100 sources (e.g., genomes), e.g., 1 source, 2 sources, 3 sources, 4 sources, 5 sources, 6 sources, 7 sources, 8 sources, 9 sources, 10 sources, 15 sources, 20 sources, 25 sources, or greater than 25 sources.
- a genetic sample comprises nucleic acids derived from 2 to 8, 2 to 6, 2 to 4 or 2 to 3 sources.
- a sample or genetic sample comprises genetic material from 2 or more sources, there will be 2 or more genetic fractions in the sample.
- a genetic fraction is an amount of genetic material derived from a first source or genome relative to an amount of genetic material derived from a second source or genome.
- an amount of genetic material derived from a first source or genome relative to an amount of genetic material derived from a second source or genome in a sample is expressed as an amount of genetic material derived from a first source or genome in a sample relative to a total amount of genetic material in a sample.
- a genetic fraction is an amount of genetic material derived from a first source or genome relative to a total amount of genetic material in a sample (e.g., total genetic material derived from two or more genomes in a sample).
- a genetic fraction can be expressed in a suitable form or by suitable mathematical expression.
- a genetic fraction is a ratio of an amount of genetic material derived from a first source or genome to an amount of genetic material derived from a second source or genome. In some embodiments, a genetic fraction is a percent of genetic material derived from a first source or genome relative to a total amount of genetic material in a sample. In some embodiments, a genetic fraction is a percent of genetic material derived from a first source or genome relative to a total amount of genetic material derived from the first source and a second source in the sample. In certain embodiments, a genetic fraction is a likelihood or probability of a genetic fraction. In certain embodiments, a genetic fraction is a suitable distribution (e.g., a beta distribution). In certain embodiments, a genetic fraction is associated with a degree of confidence or a degree of error (e.g., a statistical measure or confidence or error).
- a genetic fraction represents a relative amount of genetic material derived from a minor contributing source (e.g., a cancer, fetus, transplant, a contamination (e.g., from another subject or sample)) compared to major contributing source (e.g., non-cancerous tissue, a mother of a fetus, a subject, or a transplant recipient).
- major contributing source e.g., non-cancerous tissue, a mother of a fetus, a subject, or a transplant recipient.
- a genetic fraction represents a relative amount of genetic material derived from a minor contributing source (e.g., a cancer, fetus, transplant, a contamination (e.g., from another subject or sample)) compared to a total amount of the minor contributing source and a major contributing source.
- a fetal fraction often refers to a genetic fraction of genetic material derived from a genome of a fetus relative to genetic material derived from a genome of a mother of a fetus, or relative to the total genetic material in a sample.
- a sample or genetic sample is a processed sample.
- nucleic acids of a genetic sample are subjected to one or more suitable processing steps.
- a genetic sample may comprise nucleic acids that are extracted, isolated, purified, and/or enriched.
- some or all of the nucleic acids of a genetic sample are amplified prior to conducting a method described herein.
- some or all of the nucleic acids of a genetic sample are not amplified prior to conducting a method described herein.
- a genetic sample and/or nucleic acids of a sample are lyophilized, precipitated, resuspended, fixed and/or embedded (e.g., formalin-fixed and/or paraffin-embedded).
- Non-limiting examples of nucleic acids include DNA and RNA, the like, various naturally occurring forms thereof, and combinations thereof.
- Non-limiting examples of DNA include genomic DNA, extracellular DNA, cell-free DNA, the like and combinations thereof.
- Non-limiting examples of RNA include messenger RNA (mRNA), exosomal RNA, extracellular RNA, cell-free RNA, the like and combinations thereof.
- a nucleic acid can be double stranded or single stranded.
- a nucleic acid length can be of any suitable length, non-limiting examples of which include 2 to 250 x 10 6 , 5 to 250 x 10 6 , 8 to 250 x 10 6 , 10 to 250 x 10 6 , 5 to 1 x 10 6 , 5 to 100,000, 5 to 10,000, 5 to 5000 or 5 to 1000 contiguous nucleotides, or intermediate ranges thereof.
- a nucleic acid comprises a length of 3 to 500, 3 to 400, 5 to 350, 5 to 200, 10 to 200, 15 to 200, or 20 to 200 contiguous nucleotides, or intermediate ranges thereof.
- a nucleic acid comprises a length of 2 or more, 3 or more, 4 or more, 5 or more, 8 or more or 10 or more contiguous nucleotides.
- a nucleic acid comprises deoxyribonucleotides, ribonucleotides, analogs thereof or mixtures thereof. In some embodiments, a nucleic acid comprises or consist of naturally occurring deoxyribonucleotides. In some embodiments, a nucleic acid comprises or consist of naturally occurring ribonucleotides. A nucleic acid often comprises a specific 5’ to 3’ order of nucleotides known in the art as a sequence (e.g., a nucleic acid sequence, e.g., a sequence).
- a nucleic acid may be naturally occurring and/or may be synthesized, copied or altered ( e.g ., by a technician, scientist or one of skill in the art).
- synthesized, copied or altered nucleic acids include cDNA, amplicons, extension products, oligonucleotides (primers, probes, and the like), ligated probes and amplified ligated probe sets.
- a nucleic acid is an amplicon (e.g., a product of an amplification reaction).
- oligonucleotide often refers to a relatively short nucleic acid. Oligonucleotides are often about 5 to 200, 5 to about 150, 5 to 100, 5 to 50, or 5 to about 35 nucleic acids in length. In some embodiment’s oligonucleotides are single stranded.
- nucleic acids are processed using a suitable method non-limiting examples of which include isolation, fragmentation (e.g., by shearing), purification, enrichment, ligation, amplification, digestion, denaturation, the like and combinations thereof.
- methods, systems and processes described herein can detect, identify, or determine the presence or absence of, one or more genetic variations.
- a method, process or system herein detects from 1 to 100, from 1 to 50, from 1 to 40, or from 1 to 10 genetic variations, or intervening ranges thereof, including 2, 3, 4, 5, 6, 7, 8, 9, 10 or more genetic variations, or 100, 50, 30, 20, 10 or less genetic variations.
- a method, process or system herein detects, identifies or determines a presence or absence of, one genetic variation.
- a nucleic acid derived from a genome comprises one or more genetic variations.
- a genetic variation often refers to a difference (i.e., a variation) in a first genetic sequence (e.g., a region of interest) compared to one or more reference sequences (e.g., a reference locus/loci).
- a genetic variation include a copy number variation, an insertion or deletion (e.g., an indel), an inversion, translocation, splice variant, one or more substitutions or mutations (e.g., a point mutation or a particular allele of a single nucleotide polymorphism), the like and combinations thereof.
- a genetic variation is a copy number variation.
- Non-limiting examples of a copy number variation includes an aneuploidy, a partial aneuploidy, macro duplications (500 bases or more more), macro deletions (500 bases or more more) or insertions (500 bases or more more), and the like.
- An aneuploidy often refers to an increase or decrease in a number of chromosomes, or a relatively large portion thereof, compared to a normal diploid subject (e.g., a normal diploid human).
- Non-limiting examples of an aneuploidy include a trisomy (e.g., trisomy 13 (T13), trisomy 18 (T18) , trisomy 21 (T21)), monosomy, a tetraploidy, aneuploidy of X (e.g., XXX and XXY), aneuploidy of Y (e.g., XYY), and the like.
- a genetic variation or copy number variation comprises in deletion, duplication or disruption of a portion of a chromosome, non-limiting examples of which include 22q11.2 (deletion), 1 q21 .1 (duplication), 9q34 (deletion), 1 p36 (deletion), 4p (deletion), 5p (deletion), 7q11.23 (duplication), 11 q24.1 (triplication), 17p (deletion), 11 p15 (duplication), 18q (deletion), 22q13 (deletion) and the like.
- a genetic variation is associated with a particular phenotype, disease, or condition.
- a nucleic acid (e.g., a nucleic acid of a genome) comprises a region of interest (e.g., a nucleic acid region of interest).
- a nucleic acid region of interest comprises or is suspected of comprising a genetic variation (e.g., a copy number variation) in at least in one genome of a genetic sample.
- a nucleic acid region of interest is a chromosome, or a portion thereof.
- a nucleic acid region of interest comprises a locus of a chromosome (e.g., a locus of interest).
- a nucleic acid region of interest is an autosome, a sex chromosome or a portion thereof.
- a nucleic acid region of interest comprises a gene, or a portion thereof.
- a nucleic acid region of interest may include one or more of a gene, an exon, an intron, untranslated regions, 5' untranslated regions, 3' untranslated regions, regulator regions, the like, combinations thereof and portions thereof.
- a nucleic acid region of interest comprises a SNP.
- a genome of a subject, a transplant, a fetus, a mother of a fetus, a cancer and/or a genome of multiple subjects comprises a same nucleic acid region of interest.
- a nucleic acid region of interest does not comprise a genetic variation (e.g., a region of interest of a reference genome, reference chromosome or reference gene).
- an amplicon, probe, primer, ligation product or extension product comprises a region of interest, a complement thereof, a portion thereof or a copy thereof.
- a region of interest may be a suitable length of contiguous nucleotide bases.
- a region of interest is in a range of 10 to 300,000,000 base pairs (bp), 10 to 100,000 bp, 10 to 1000 bp, 50 to 1000 bp, 10 to 500 bp, 100 to 500 bp, 10 to 200 bp, 10 to 100 bp, or 10 to 50 bp in length, or intervening ranges thereof.
- a reference locus is analyzed, assayed, or counted by a method, process or system herein.
- a locus is any suitable region or sequence of a chromosome.
- a reference locus is often a region of a genome having a same amount of copies in a first genome and a second genome.
- a reference locus is located on a chromosome that is diploid in both a first genome and a second genome.
- a reference locus is a region of a genome derived from a fetus having the same number of copies as the same region in a genome of a mother of the fetus.
- a reference locus is a region of a genome derived from a cancer having the same number of copies as the same region in a genome of non- cancerous tissue. In some embodiments, a reference locus is a region of a genome derived from a transplant having the same number of copies as the same region in a genome of a transplant recipient. In some embodiments, one or more reference loci are located on a reference chromosome, or portion thereof. In some embodiments, one or more reference loci are located on a reference sequence, or portion thereof. In some embodiments, a reference sequence refers to a nucleic acid sequence that does not include a genetic variation (e.g., in a first genome relative to a second genome).
- a nucleic acid sequence of a reference sequence comprises a known sequence (e.g., a sequence that is known to be present in a first genome and a second genome). In certain embodiments, a reference sequence is considered a “wild type” sequence for a particular locus.
- a locus or reference locus is a region of contiguous nucleic acids having a length in a range of 5 to 500 nucleotides, 5 to 300 nucleotides, 5 to 150 nucleotides, 10 to 500 nucleotides, 10 to 150 nucleotides, 20 to 500 nucleotides, 20 to 150 nucleotides, 50 to 500 nucleotides or 50 to 150 nucleotides.
- a locus is non-polymorphic locus.
- a non- polymorphic locus refers to a locus having a same nucleic acid sequence in all genomes present in a sample.
- a non-polymorphic loci is a locus in a nucleic acid region of interest (e.g., a chromosome of interest; a gene of interest).
- a non- polymorphic locus has a different number of copies in a first genome compared to a second genome in a sample.
- a non-polymorphic locus has the same number of copies in a first genome compared to a second genome in a sample.
- a non-polymorphic locus is a reference locus.
- a locus or reference locus is a polymorphic locus.
- a polymorphic locus often has two or more possible alleles found in a population.
- a polymorphic locus comprises a single nucleotide polymorphism (SNP).
- SNP single nucleotide polymorphism
- a polymorphic locus is an informative polymorphic locus.
- An informative polymorphic locus is a polymorphic locus having a first genotype in a first genome that is different from a second genotype in a second genome of a genetic sample.
- a fetus In a genetic sample comprising genetic material derived from a fetus (2nd Genome) and the mother of the fetus (1st Genome) as shown in Table 1, exemplary informative polymorphic loci are indicated by an asterisk.
- a fetus must have at least one allele of the fetal genotype contributed from the mother of the fetus.
- R represents a first allele and A represents a second allele for a give polymorphic sequence.
- the first genome can be a genome of a mother and the second genome can be a genome of a fetus, or the first genome can be a genome of a transplant recipient and the second genome can be a genome of a transplant, or the first genome can be a genome of non-cancerous tissue in a subject and the second genome can be a cancer in the subject.
- Methods herein may include selectively labeling, tagging, ligating, hybridizing, amplifying and/or isolating one or more nucleic acid sequences (e.g., probes), using a suitable method sufficient to yield reaction products, non-limiting examples of which include probe products, ligated probes, conjugated probes, ligated probe sets, conjugated probe sets, amplicons, extension products, hybridized duplexes (i.e., double stranded nucleic acids), and labeled nucleic acids (e.g., labeled probes, labeled ligated probe sets, labeled amplicons) .
- nucleic acid sequences e.g., probes
- an assay may comprise contacting, binding, and/or hybridizing probe sets to a sample, ligating and/or conjugating the probe sets, optionally amplifying the ligated/conjugated probes, and immobilizing the probes to a substrate.
- the assays and methods described herein may be performed on a single input sample in parallel as a multiplex assay as described herein
- a probe product, ligated probe set, conjugated probe set, ligated probes, conjugated probes, and labeled molecules may be single, contiguous molecule resulting from the performance of enzymatic action on a probe set, such as an assay.
- a probe product or a labeled molecule one or more individual probes from a probe set may be covalently modified such that they form a singular distinct molecular species as compared to either probes or probe sets.
- probe products or a labeled molecule may be chemically distinct and may therefore be identified, counted, isolated, or further manipulated apart from probes or probe sets.
- at least 10, at least 1,000, at least 10,000 probe sets are used to interrogate the same locus.
- probe products may contain one or more identification labels, and one or more affinity tags for isolation and/or immobilization.
- no additional modifications of probe products e.g., DNA sequence determination
- no additional interrogations of the DNA sequence are required.
- the probe products containing the labels may be directly counted, typically after an immobilization step onto a solid substrate.
- organic fluorophore labels are used to label probe products, and the probe products are directly counted by immobilizing the probe products to a glass substrate and subsequent imaging via a fluorescent microscope and a digital camera.
- the label may be selectively quenched or removed depending on whether the labeled molecule has interacted with its complementary genomic locus.
- two labels on opposite portions of the probe product may work in concert to deliver a fluorescence resonance energy transfer (FRET) signal depending on whether the labeled molecule has interacted with its complementary genomic locus.
- FRET fluorescence resonance energy transfer
- labeling probes containing the labels be designed for any sequence region within that locus.
- a set of multiple labeling probes with same or different labels may also be designed for a single genomic locus.
- a probe may selectively isolate and label a different region within a particular locus, or overlapping regions or the same region within a locus.
- the probe products containing affinity tags are immobilized onto a substrate via the affinity tags.
- affinity tags are used to immobilize probe products onto a substrate, and the probe products containing the affinity tags are directly counted.
- tagging probes containing affinity tags may be designed for a sequence region within that locus.
- a set of multiple tagging probes with same or different affinity tags may also be designed for a single genomic locus.
- a single nucleic acid sequence within that locus, or multiple nucleic acid sequences within that locus may be interrogated and/or quantified via the creation of probe products.
- the interrogated sequences within a genomic locus may be distinct and/or overlapping, and may or may not contain genetic polymorphisms.
- a probe product is formed by the design of one or more oligonucleotides called a “probe set”.
- an oligonucleotide is a probe.
- a probe is often configured or designed to hybridize to a selected target sequence. Accordingly, a probe often comprises a portion (e.g., 3 or more, 5 or more, or 8 or more contiguous nucleotides) that is complementary to a target locus, or portion thereof.
- At least a portion (e.g., 50, 60, 70, 80, 85, 90, 91, 92, 93, 94, 95, 96, 97, 98, 99, or 100%) of a probe sequence is complementary to a sequence motif and/or hybridization domain present in one or more target molecules, such that the probe is configured to hybridize in part or in total to one or more target molecules or nucleic acid region of interest.
- the portion of a probe or primer that hybridizes to a target sequence is often referred to as a hybridization domain.
- a probe may, or may not be extended by a polymerase.
- a probe may comprise an isolated, purified, naturally occurring, non-naturally occurring, and/or artificial material or nucleic acid sequence.
- a method herein comprises contacting one or more probe sets with a genetic sample.
- one or more probe sets are contacted with one or more loci in a genetic sample.
- one or more probe sets are contacted with one or more reference loci in a genetic sample.
- one or more probe sets are contacted with one or more nucleic acid regions of interest in a genetic sample.
- One or more probes sets may be contacted with a 1st genome and a 2nd genome, different from the first, in a genetic sample.
- a probe set comprises two or more suitable probes. Exemplary probe sets are described in Figs. 7-15 and in Example 4 herein. Additional exemplary probe sets are described in US Pat. 9,212,394 or International Pat. Application Pub. No. WO/2017/134191, which are incorporated herein by reference, each of which probe sets can be used for a method described herein.
- a probe set comprises two probes. In some embodiments a probe set comprises three or four probes. In certain embodiments, each member of a probe set comprises a portion (e.g., a nucleic acid sequence) complementary to a target sequence present in one or more genomes of a genetic sample.
- the probes of any one probe set are configured to hybridize to a target region (e.g., a target locus, region of interest, reference locus) in a genetic sample such that at least two of the probes of a set hybridize near each other. In some embodiments, at least two probes of any one probe set hybridize adjacent to each other.
- the probes of any one probe set are often configured to be joined or ligated together after hybridizing to their intended target region using a suitable method.
- the probes of a probe set joined or ligated together as described in US Pat. 9,212,394 or International Pat. Application Pub. No. WO/2017/134191.
- a probe set comprises at least one labeling probe and at least one tagging probe. In some embodiments, a probe set comprises one labeling probe and one tagging probe. In some embodiments, a probe set comprises one labeling probe, a bridging probe and a tagging probe. In some embodiments, two probe sets comprise a common tagging probe and different labeling probes (e.g., where a probe set is configured to hybridize to a locus comprising a SNP).
- a labeling probe comprises a target specific portion (e.g., a hybridization domain) and a label portion.
- a labeling probe or a label portion of a labeling probe comprises a label or is configured to have a label attached.
- a labeling probe or a label portion of a labeling probe may be modified to comprise or bind to a label.
- a labeling probe or a label portion of a labeling probe is configured to bind to a label.
- a labeling probe or a label portion of a labeling probe is configured to hybridize to a primer comprising a label.
- a labeling probe or a label portion of a labeling probe comprises a primer binding site, or complement thereof. Accordingly, in some embodiments a labeling probe or a label portion of a labeling probe comprises a primer binding site (i.e., a sequence complementary to a portion of a primer (e.g., a 3' portion of a primer)) configured to hybridize to a primer that comprises a label or to a primer configured to incorporate a label into an amplicon or extension product.
- a primer binding site i.e., a sequence complementary to a portion of a primer (e.g., a 3' portion of a primer)
- a labeling probe or a label portion of a labeling probe comprises a sequence that is substantially the same as a portion of a primer (e.g., a 3' portion of a primer) configured to hybridize to a complement of a labeling probe or a label portion of a labeling probe where the primer comprises a label or is configured to incorporate a label.
- a labelling probe may be a labelling probe described in US Pat. 9,212,394 or International Pat. Application Pub. No. WO/2017/134191.
- a tagging probe comprises a target specific portion (e.g., a hybridization domain) and an affinity tag. In some embodiments a tagging probe comprises a target specific portion (e.g., a hybridization domain) and a primer binding site, or complement thereof. In some embodiments a tagging probe comprises a target specific portion (e.g., a hybridization domain), an affinity tag and a primer binding site, or complement thereof.
- a tagging probe comprises a primer binding site (i.e., a sequence complementary to a portion of a primer (e.g., a 3' portion of a primer)) configured to hybridize to a primer that comprises an affinity tag or to a primer configured to incorporate an affinity tag into an amplicon or extension product.
- a tagging probe comprises a sequence that is substantially the same as a portion of a primer (e.g., a 3' portion of a primer) configured to hybridize to a complement of a tagging probe where the primer comprises an affinity tag or is configured to incorporate an affinity tag into an amplicon or extension product.
- a tagging probe may be a tagging probe described in US Pat. 9,212,394 or International Pat. Application Pub. No. WO/2017/134191.
- a probe set comprises a labeling probe and a tagging probe that hybridize to, or are configured to hybridize to, a nucleic acid region of interest or a reference locus.
- the hybridization domains of a labeling probe and tagging probe of a probe set hybridize to, or are configured to hybridize to, a nucleic acid region of interest or a reference locus.
- a labeling probe and a tagging probe are configured to be joined or ligated together after hybridization to a target sequence or target locus.
- the hybridization domain of a labeling probe and the hybridization domain a tagging probe are configured to be joined or ligated together after hybridization to a target sequence or target locus.
- the labeling probe and tagging probe of a probe set may be joined or ligated together using a suitable method.
- a labeling probe and a tagging probe hybridize to a target sequence where the hybridization domains of the labeling probe and tagging probe are in close proximity.
- a labeling probe and a tagging probe hybridize to a target sequence or locus where the hybridization domains of the labeling probe and tagging probe are adjacent (e.g., immediately adjacent) or substantially adjacent.
- the hybridization domain of the labeling probe can be ligated directly to the hybridization domain of the tagging probe.
- the 3'-end of the hybridization domain of the labeling probe is ligated directly to the 5'-end of the hybridization domain of the tagging probe.
- the 3'-end of the hybridization domain of the tagging probe is ligated directly to the 5'-end of the hybridization domain of the labeling probe.
- there is a gap (e.g., of 1 to 30 nucleotides, or more) between a hybridization domain of a labeling probe and a hybridization domain of a tagging probe after hybridization to a region of interest or locus.
- a gap e.g., of 1 to 30 nucleotides, or more
- substantially adjacent indicates that there may be a gap of or two nucleotides between the hybridized tagging probe and hybridized labeling probe.
- a probe set may be designed to hybridize to a non-contiguous, but proximal, portion of the nucleic acid region of interest, such that there is a “gap” of one or more nucleotides on the nucleic acid region of interest, in between hybridized probes from a probe set, that is not occupied by a probe.
- a DNA polymerase or another suitable enzyme may be used to synthesize a new polynucleotide sequence, in some cases covalently joining two probes from a single probe set.
- a gap may be filled by extending a 3'-end of one of the probes with a polymerase to the 5'-end of the other probe, followed by ligation, thereby providing a ligated probe set.
- a gap may be filled by hybridization of a gap probe that hybridizes immediately adjacent to one end of a hybridized labeling probe and immediately adjacent to one end of a hybridized tagging probe, thereby facilitating ligation of the probe set.
- a gap between a hybridized gap probe and a labeling probe and/or a tagging probe may be filled by extending a 3'-end of one of the probes with a polymerase to the 5'-end of the other probe, followed by ligation, thereby providing a ligated probe set.
- Exemplary probe set designs that include different strategies and methods of hybridization, extension and/or ligation are shown in Figs. 2-26, in US Pat. 9,212,394 and International Pat. Application Pub. No. WO/2017/134191, any one of which can be used for a method described herein to interrogate a region of interest or locus, and/or to generate a ligated probe set.
- Multiple probe sets may be used for a method described herein.
- multiple probe sets are used to hybridize to, and interrogate, multiple loci within a region of interest (e.g., a chromosome or gene of interest).
- multiple probe sets are used to hybridize to, and interrogate, multiple loci (e.g., reference loci) within one or more reference nucleic acids (e.g., one or more reference chromosomes).
- two or more probes of a probe set are joined or ligated together, using a suitable method, upon hybridizing to a target locus (e.g., a locus on a nucleic acid region of interest or a reference locus).
- a target locus e.g., a locus on a nucleic acid region of interest or a reference locus.
- two or more hybridized probes of a probe set are joined either non-covalently or covalently.
- two or more probes of a hybridized probe set are covalently ligated using a suitable ligase.
- a plurality of different hybridized probes sets are ligated at about the same time, in a same reaction and/or in a same reaction vessel or well.
- two or more hybridized probes of a probe set are ligated by an enzyme that forms a 3’,5’-phosphodiester bond. In certain embodiments, two or more hybridized probes of a probe set are joined or ligated by a process described in US Pat. 9,212,394 or International Pat. Application Pub. No. WO/2017/134191. Two or more hybridized probes that are ligated by a method disclosed herein are often referred to herein as a ligated probe set.
- a ligated probe set comprises a labeling probe and a tagging probe, where the labeling probe is ligated to the tagging probe. In certain embodiments a ligated probe set comprises a labeling probe, a gap probe and a tagging probe.
- one or more ligated probe sets are amplified using a suitable method. Two or more different ligated probe sets can be amplified independently or substantially simultaneously (i.e., at about the same time, e.g., with an error of a few seconds, or 0 to 5 minutes). In some embodiments, two or more different ligated probe sets are amplified in a same amplification reaction and/or in a same reaction vessel or well. In some embodiments, a ligated probe set is amplified using a polymerase chain reaction (PCR) thereby producing a plurality of copies of the ligated probe set often referred to as amplicons.
- PCR polymerase chain reaction
- a ligated probe set is amplified in a first amplification reaction thereby producing a first set a amplicons (e.g., an amplified ligated probe set).
- a ligated probe set is amplified in a first amplification reaction that utilizes a labeled primer that incorporates a label, thereby producing a first set a labeled amplicons.
- a ligated probe set is amplified in a first amplification reaction thereby producing a first set a amplicons, which are further subjected to a second amplification or extension reaction using a labeled primer that introduces a label, thereby producing a set of labeled amplicons.
- a PCR reaction often utilizes at least two primers per template (e.g., a ligated probe set).
- a primer is a single stranded oligonucleotide.
- a primer is often configured to hybridize to a selected complementary nucleic acid and is configured to be extended by a polymerase after hybridizing. Accordingly, a primer or portion thereof (e.g., 3 or more, 5 or more, or 8 or more contiguous nucleotides) is often complementary to a target sequence, locus, template, or portion thereof.
- a suitable template is often amplified by PCR using a primer pair.
- a ligated probe set is amplified using a suitable primer pair.
- a “primer pair” refers to a set of two primers (e.g., a forward and reverse primer) that flank a nucleic acid sequence intended to be amplified.
- a forward primer and a reverse primer or a first and second primer is arbitrary, and such phrases do not imply an orientation of where a primer binds on a template, or which strand of a template that a primer binds to.
- one primer of a primer pair initiates nucleic acid synthesis from a 3’-end of a first strand of a template, while the other primer of the primer pair initiates nucleic acid synthesis from a 3’-end of a second strand of the template.
- a primer, a probe, or a portion thereof is substantially complementary to a target nucleic acid.
- substantially complementary means that one, or a few nucleotides on each strand of a duplex formed after hybridization may not be complementary, yet still allow efficient hybridization and/or formation of a duplex under suitable conditions.
- a primer comprises a label. In certain embodiments a primer comprises two or more labels. In some embodiments, a ligated probe set is amplified using one or more primers comprising a label thereby producing labeled amplicons. In some embodiments, a ligated probe set is amplified by PCR using a primer pair wherein one of the primers is labeled such that only one strand of the amplicons is labeled.
- a primer extension or amplification can be performed as described in US Pat. 9,212,394 or International Pat. Application Pub. No. WO/2017/134191.
- a primer or primer pair used for a method herein can be any suitable prime or primer pair described in US Pat. 9,212,394 or International Pat. Application Pub. No. WO/2017/134191.
- a method herein comprises selectively digesting one strand of a double stranded molecule (e.g., a double stranded amplicon)to produce single stranded molecules.
- the method comprises contacting an exonuclease to an amplified ligated probe set, and selectively digesting one strand of the amplified ligated probe set from the 5’-end while the other strand is protected from digestion (e.g., by having a blocked 5'-end, e.g., by having a label attached to the 5'-end).
- contacting an exonuclease to a double stranded amplicon may digest an unlabeled strand from the 5’-end while the 5’-end a labeled strand is protected from exonuclease digestion.
- An exonuclease used for a method described herein can be any suitable exonuclease described in US Pat. 9,212,394 or International Pat. Application Pub. No. WO/2017/134191.
- a nucleic acid comprises one or more distinguishable identifiers. Any suitable distinguishable identifier and/or detectable identifier can be used for a method described herein.
- a distinguishable identifier can be directly or indirectly associated with (e.g., bound to) a nucleic acid.
- a distinguishable identifier can be covalently or non- covalently bound to a nucleic acid (e.g., a ligated probe set, an amplicon).
- a distinguishable identifier is bound to or associated with a binding agent or a member of binding pair that is covalently or non-covalently bound to a nucleic acid.
- a distinguishable identifier is reversibly associated with a nucleic acid.
- a distinguishable identifier that is reversibly associated with a nucleic acid can be removed from a nucleic acid using a suitable method (e.g., by increasing salt concentration, denaturing, washing, adding a suitable solvent and/or by heating).
- a distinguishable identifier is a label.
- a nucleic acid comprises a detectable label, non-limiting examples of which include a radiolabel (e.g., an isotope), a metallic label, a fluorescent label, a chromophore, a chemiluminescent label, an electro chemiluminescent label (e.g., OrigenTM), a phosphorescent label, a quencher (e.g., a fluorophore quencher), a fluorescence resonance energy transfer (FRET) pair (e.g., donor and acceptor), a dye, infra-red dyes, a protein (e.g., an enzyme (e.g., alkaline phosphatase and horseradish peroxidase), an antibody, an antigen or part thereof, a linker, a member of a binding pair), an enzyme substrate, a small molecule (e.g., biotin, avid
- Any suitable fluorophore can be used as a label.
- a light emitting label can be detected and/or quantitated by a variety of suitable techniques non-limiting examples of which include flow cytometry, digital imaging, analogue imaging, microarray imaging, CCD camera imaging, a photo sensor, mass spectrometry, fluorescence microscopy, confocal laser scanning microscopy, laser scanning cytometry, electric field suspension, the like and combinations thereof.
- a suitable label can be used for a method herein.
- a suitable label can be attached to a probe or primer disclosed herein using a suitable method.
- a probe e.g., a labeling probe
- primer e.g., primer
- ligation product e.g., extension product
- amplicon comprises one or more labels.
- a label may be directly detectable or indirectly detectable.
- two or more labels are distinguishable from each other, e.g., according to color (e.g., wavelength emission).
- a label comprising a fluorescent substance non-limiting examples of which include fluorescent dyes (e.g., fluorescein, phosphor, rhodamine, polymethine dye derivatives, and the like), BODYPY FL (trademark, produced by Molecular Probes, Inc.), FluorePrime (Amersham Pharmacia Biotech, Inc.), Fluoredite (Millipore Corporation), FAM (ABI Inc.), Cy3 and Cy5 (available at Amersham Pharmacia), TAMRA (Molecular Probes, Inc.), Pacific Blue, Alexa 488, Alexa 594, Alexa 647, Atto 488, Atto 590, Atto 647N and the like.
- fluorescent dyes e.g., fluorescein, phosphor, rhodamine, polymethine dye derivatives, and the like
- BODYPY FL trademark, produced by Molecular Probes, Inc.
- FluorePrime Amersham Pharmacia Biotech, Inc.
- Fluoredite Fluoredite
- a label may be attached anywhere within a sequence of a nucleic acid, including at the 5’ or 3’-end.
- a label can be any suitable label described in US Pat. 9,212,394 or International Pat. Application Pub. No. WO/2017/134191.
- a nucleic acid comprises one or more affinity tags.
- a tagging probe comprises an affinity tag.
- a primer, a probe, a ligated probe set, and/or amplicons comprise an affinity tag.
- a tagging probe does not comprise an affinity tag, but is configured to incorporate an affinity tag into, for example, an amplicon or extension product.
- a tagging probe may comprise a primer binding site configured to hybridize to a primer comprising an affinity tag such that an affinity tag in incorporated into an extension or amplification product comprising a sequence, or complement thereof, of the tagging probe.
- a tagging probe comprises a binder (e.g., biotin) that is configured to associate with a binding partner (e.g., streptavidin) that is attached to an affinity tag.
- a binding partner e.g., streptavidin
- an affinity tag can be attached to or incorporated into a nucleic acid comprising a sequence of a tagging probe, or complement thereof, using any suitable method.
- an affinity tag is configured to and/or designed to immobilize a nucleic acid to a substrate (e.g., an element of a microarray).
- a tagging probe, ligated probe set, or amplicons thereof are designed to have an affinity tag configured to bind to a predetermined location on a substrate or array.
- an affinity tag is a relatively short nucleic acid having a sequence complementary to another nucleic acid (e.g., capture sequence), or portion thereof, that is often immobilized on a substrate.
- an affinity tag comprises a non-naturally occurring sequence, an artificial sequence or synthetic sequence that is not present, or not expected to be present, in a genome of a genetic sample.
- An affinity tag is often unique to all other sequences present in a sample.
- An affinity tag is often completely or partially complementary to a capture sequence, or portion thereof.
- An affinity tag is often configured to specifically hybridize to a capture sequence.
- a capture sequence is a nucleic acid comprising a sequence completely or partially complementary to an affinity tag.
- a capture sequence is often immobilized or attached to a substrate (e.g., an element of an array).
- An affinity tag or capture sequence may comprise naturally occurring nucleotides or nucleotide analogues.
- an affinity tag comprises locked nucleic acids.
- An affinity tag can be any suitable tag described in US Pat. 9,212,394 or International Pat. Application Pub. No. WO/2017/134191.
- a probe comprises a binder.
- a tagging probe comprises a binder.
- a ligation product, ligated probe product or amplicons thereof comprise a binder.
- a binder is a suitable binding motif that allows for specific isolation, enrichment or immobilization of a nucleic acid (e.g., a ligated probe set or an amplicon thereof).
- Non-limiting examples of a binder include a binding partner described herein (e.g., an antigen, an antibody, biotin, streptavidin, and the like), a member of a binding pair (e.g., biotin/streptavidin; His-tag/anti-His-tag antibody; His-tag/His-tag binding metal; FLAG tag/anti-Flag antibody), click chemistry motifs (e.g., a functional group that rapidly and selectively reacts with another chemical motif to form a covalent bond), antigen/anti-antigen antibodies, and the like.
- a binding partner described herein e.g., an antigen, an antibody, biotin, streptavidin, and the like
- a member of a binding pair e.g., biotin/streptavidin; His-tag/anti-His-tag antibody; His-tag/His-tag binding metal; FLAG tag/anti-Flag antibody
- click chemistry motifs e.g.,
- a ligated probe set, or an amplicon thereof is immobilized to a substrate.
- an affinity tag of a ligated probe set, or amplicon is immobilized to a substrate.
- a binder of a ligated probe set, or amplicon is immobilized to a substrate.
- Ligated probe sets and/or an amplicon thereof are often immobilized to one or more predetermined locations on a substrate. Immobilization may refer to covalent attachment or non- covalent attachment (e.g., to a substrate).
- immobilization comprises hybridizing an affinity tag to a complementary nucleic acid molecule (e.g., a capture sequence) immobilized on a substrate.
- An affinity tag, ligated probe set, extension products thereof or amplicons thereof can be immobilized to a substrate by a method described in US Pat. 9,212,394 or International Pat. Application Pub. No. WO/2017/134191.
- a microarray comprising immobilized capture sequences, immobilized affinity tags, immobilized labels, immobilized ligated probe set, immobilized extension products thereof and/or immobilized amplicons thereof can be made by a process described in International Pat. Application Pub. No. WO/2017/134191.
- immobilized labels are optically resolvable.
- optically resolvable label or “optically individually resolvable label” or “optically separated labels” herein means a group of labels that may be distinguished from each other by their photonic emission, or other optical properties, for example, after immobilization as described herein.
- the immobilized labels may be distinguished from each other spatially.
- labels of the same type which are labels having the same optical properties
- the “same labels” are defined to be labels having identical chemical and physical compositions.
- the “different labels” herein mean labels having different chemical and/or physical compositions, including “labels of different types” having different optical properties.
- the “different labels of the same type” herein means labels having different chemical and/or physical compositions, but the same optical properties.
- Item 12 of Figure 6 depicts an image of an exemplary member of an array comprising immobilized labels or labeled probe products.
- the labels are spatially addressable as the location of a molecule specifies its identity (and in spatial combinatorial synthesis, the identity is a consequence of location).
- one member of the array on the substrate may have one or multiple labeled probe products (e.g., ligated probe sets or amplicons thereof) immobilized to the member.
- labels of the same type i.e., having the same optical properties, e.g., same color, or similar emission wavelengths
- immobilized labels on an element of an array that are of the same type are separated by a distance about from 0.1 to 1000 nm, 1 to 1000 nm, 5 to 500 nm, 5 to 100 nm, or from 10 to 100 nm; about 100, 150, 200, 250, 300, 350, or 400 nm or more; and/or about 50, 100, 150, 200, 250, 300, 350, or 400 nm or less in all dimensions (e.g., at least in the x and y dimensions of a substantially flat substrate).
- the density of probe products and/or their attached labels on a substrate may be up to many millions (and up to one billion or more) probe products per substrate, or per element on a substrate.
- an element of a substrate comprises about 5 to 20,000, about 500 to 10,000, or about 500 to 5000 immobilized labeled probe products.
- the numbers of labels immobilized on the substrate, or element of a substate are counted.
- Counts of different labels e.g., those having different optical properties, e.g., different colors
- Optically resolvable single molecule arrays may be prepared according to any of the methods described in the present disclosure or by a suitable method descried in International Pat. Application Pub. No. WO/2017/134191.
- Labels, affinity tags, probe products, ligated probe sets, extension products thereof and amplicons thereof can be immobilized to a suitable substrate by a method described herein.
- a substrate or solid support used for a method herein is a substrate descried in International Pat. Application Pub. No. WO/2017/134191.
- An array may have multiple members (e.g., see Fig. 6, 3-10) that may or may not have an overlap (6) between the members. Each member may have at least an area with no overlap with another member (3-5 and 7-10). In additional embodiments, each member may have different shapes (e.g., circular spots (3-8), triangles (9), and squares (10)) and dimensions.
- a member of an array may have an area about from 1 to 10 7 micron 2 , from 100 to 10 7 micron 2 , from 10 3 to 10 8 micron 2 , from 10 4 to 10 7 micron 2 ; from 10 5 to 10 7 micron 2 ; about 0.0001 , 0.001 , 0.01 , 0.1 , 1 , 10, 100, 10 3 , 10 4 , 10 5 , 10 6 , 10 7 , 10 8 or more micron 2 ; and/or about 0.001 , 0.01 , 0.1 , 1 , 10, 100, 10 3 , 10 4 ,
- 10 5 , 10 6 , 10 7 , 10 8 or less micron 2 Members of an array may be separated by a distance about from 0 to 10 4 microns, from 0 to 10 3 microns, from 10 2 to 10 4 microns, or from 10 2 to 10 3 microns; about 0, 0.001 , 0.1 , 1 , 2, 3, 4, 5, 10, 50, 100, 10 3 , 10 4 , 10 5 , 10 6 , 10 7 , or 10 8 microns or more; and/or about 0, 0.001 , 0.1 , 1 , 2, 3, 4, 5, 10, 50, 100, 10 3 , 10 4 , 10 5 , 10 6 , 10 7 , or 10 8 microns or less.
- the distance by which two members of the array are separated may be determined by the shortest distance between the edges of the members.
- a member of an array a member described in International Pat. Application Pub. No. WO/2017/134191.
- Members of an array may have different shapes and sizes.
- each member of an array has the same shape and/or size.
- one or more members of an array comprise the same immobilized capture sequence.
- a size of an array member and/or a density of capture sequences, binding partners or immobilized labeled probe products housed in an element of an array may be controlled and/or defined using a suitable method, e.g., a method described in International Pat. Application Pub. No. WO/2017/134191.
- a method herein comprises counting, or determining a count, sum, quantity or amount of individual labeled probe products on an array (e.g., an element of an array). In certain embodiments a method herein comprises counting, or determining a count, sum, quantity or amount of individual labeled probe products on an array (e.g., an element of an array) of a first type (e.g., a first color) and counting, or determining a count, sum, quantity or amount of individual labeled probe products on the same array (e.g., same element of the array) of a second type (e.g., a different color).
- a first type e.g., a first color
- individual labeled probe products on an array are counted.
- individual optically resolvable labeled probe products on an array are counted and/or compared.
- a count, quantity or sum of individual labeled probe products on an array can be determined using a suitable method.
- probe products are prepared such that they are grouped together by locus (in this case chromosome 21 or chromosome 18) and counted separately on a substrate.
- locus in this case chromosome 21 or chromosome 18
- probe products corresponding to loci on chromosome 21 may be isolated and/or counted separately
- probe products corresponding to loci on chromosome 18 may be isolated and/or counted separately.
- probe products are grouped together in the same location of a substrate (e.g., the same member of an array) as described herein.
- probe products bearing a red fluorophore e.g., corresponding to chromosome 21
- probe products with a green fluorophore e.g., corresponding to chromosome 18
- are optically resolvable are distinguishable from each other, are individually counted and the counts are compared.
- an increased frequency of chromosome 21 probe products relative to chromosome 18 probe products can signify a presence of trisomy 21 in a fetus when analyzed by a method described herein.
- the probe products for chromosome 18 may serve as a control.
- the methods of the present disclosure may comprise counting the labels of the probe sets immobilized to the substrate.
- the methods may comprise enumerating, quantitating, detecting, discovering, determining, measuring, evaluating, calculating, counting, and assessing the labels, probes, probe sets described herein, for example, including quantitative and/or qualitative determinations, including, for example, identifying the labels, probes, probe sets, determining presence and/or absence, proportion, relative signals, or relative counts of the labels, probes, probe sets, and quantifying the labels, probes, probe sets.
- the methods may comprise enumerating, quantitating, detecting, discovering, determining, measuring, evaluating, calculating, counting, and/or assessing (i) a first number of the first label immobilized to the substrate, and (ii) a second number of the second label immobilized to the substrate.
- the detecting, discovering, determining, measuring, evaluating, calculating, counting, and/or assessing step may be performed after immobilizing the ligated probe set to a substrate, and the substrate with immobilized ligated probe sets may be stored in a condition to prevent degradation of the ligated probe sets (e.g., at room temperature or a temperature below the room temperature) before this step is performed.
- the counting step comprises determining the numbers of labels, probes or probe sets based on an intensity, energy, relative signal, signal-to-noise, focus, sharpness, size, or shape of one or more putative labels.
- the putative labels include, for example, labels, particulate, punctate, discrete or granular background, and/or other background signals or false signals that mimic or are similar to labels.
- the methods described herein may include the step of enumerating, quantitating, detecting, discovering, determining, measuring, evaluating, calculating, counting, and/or assessing the labels, probes, and probe sets. This step is not limited to integer counting of the labels, probes, and probe sets.
- counts may be weighted by the intensity of the signal from the label.
- higher intensity signals are given greater weight and result in a higher counted number compared to lower intensity signals.
- the two labels will not be easily resolved from one another. In this case they may appear to be a single label, but with greater intensity than a typical single label (i.e., the cumulative signal of both the labels).
- counting can be more accurate when the intensity, or other characteristics or properties of a label (e.g., such as size and shape as described below) are considered or weighted.
- the shapes of the labels are considered, and the counting may include or exclude one or more of the labels depending on the shapes of the labels.
- the size of one or more labels or items, objects, or spots on an image may be considered, and the counting may include, exclude, or adjusted depending on the size.
- counting may be done on any scale, including but not limited to integers, rational or irrational numbers. Any properties of the label or multiple labels may be used to define the count given to the observation.
- the counting step may include determining the numbers of labels, probes or probe sets by summation over a vector or matrix containing the information (e.g., intensity, energy, relative signal, signal-to-noise, focus, sharpness, size or shape) about the putative label. For example, for each discrete observation of a label, information on its size, shape, energy, relative signal, signal-to-noise, focus, sharpness, intensity and other factors may be used to weight the count. Certain examples of the value of this approach would be when two fluors are coincident and appear as a single point.
- the information e.g., intensity, energy, relative signal, signal-to-noise, focus, sharpness, size or shape
- the count can be corrected or adjusted by performing the calibrating described below.
- the vector or matrix may contain integer, rational, irrational or other numeric types.
- weighting may also include determining, evaluating, calculating, or assessing likelihoods or probabilities, for example, the probability that an observation is a label, not a background particle. These probabilities may be based on prior observations, theoretical predictions or other factors.
- the initial count is the number of putative labels observed. This number may then be improved, corrected or calibrated by weighting each of the putative labels in the appropriate manner.
- an immobilized label may be detected by scanning probe microscopy (SPM), scanning tunneling microscopy (STM) and atomic force microscopy (AFM), electron microscopy, optical interrogation/detection techniques including, but not limited to, near-field scanning optical microscopy (NSOM), confocal microscopy and evanescent wave excitation. More specific versions of these techniques include far-field confocal microscopy, two-photon microscopy, wide-field epi-illumination, and total internal reflection (TIR) microscopy. Many of the above techniques may also be used in a spectroscopic mode. The actual detection is by charge coupled device (CCD) cameras and intensified CCDs, photodiodes and/or photomultiplier tubes.
- the counting step comprises an optical analysis, detecting an optical property of a label.
- the counting step comprises reading the substrate in first and second imaging channels that correspond to the first and second labels, respectively, and producing one or more images of the substrate, wherein the first and second labeling probes are resolvable in the one or more images.
- the counting step comprises spatial filtering for image segmentation.
- the counting step comprises watershedding analysis, or a hybrid method for image segmentation. Individual methods may be applied more than once, with the same or different parameters or conditions. For, example, watershedding may divide the image into a set of regions, and then a re-application of watershedding within each region may be used to detect one or more labels within the regions defined by the initial watershedding analysis.
- a count, quantity or sum of individual labeled probe products immobilized on an array can be determined using a process described in US Pat. 9,212,394 or International Pat. Application Pub. No. WO/2017/134191.
- one or more method or process described herein are computer implemented methods.
- counting, determining counts, measuring, statistical analysis (e.g., calculations of probability or likelihood), comparison, estimation, quantitation, evaluation, optimization, calculations of a function/metric (e.g., at a given parameter value), decision- making, and/or goodness-of-fit steps are performed using a computer.
- image analysis is performed using a computer.
- counting comprises analyzing an artificial, processed digital images (e.g ., a matrix of intensity values). In some embodiments, counting does not comprise direct inspection of unprocessed visual light emitted from an array by visual inspection by a naked eye.
- detection of a label may be by direct observation or measurement or by detecting a resultant property or secondary effect, such as the result of an interaction between and probe and target.
- a deoxyribonucleotide triphosphate dNTP
- an ion sensor for example, an array of ion-sensitive field-effect transistors.
- the signal from single molecule arrays cannot be seen by the human eye. In this way, whether the dye emits in the visible wavelength is less important than for many biological applications. Infra-red (IR) or near infra-red dyes are therefore particularly well suited to this application as they have low contamination.
- the counts described herein may be normalized, for example, by the density of the labels on the surface, the observed density of background particles (that mimic labels) or other factors.
- counts may be transformed using standard mathematical functions and transformations (e.g., logarithm).
- counts can be used to produce ratios. For example, if the count of Label 1 and Label 2 are X and Y, the ratio X/Y may be used to combine the two numbers. These ratios can be compared within and between samples.
- Label 1 represents Chromosome 21 and Label 2 Chromosome 1
- the ratio X/Y would be expected to be higher in cfDNA from a pregnant woman whose fetus has Down's Syndrome than it would be in cfDNA from a pregnant woman whose fetus did not have Down's Syndrome.
- the methods described herein may also look at the frequency of different alleles at the same genetic locus (e.g., two alleles of a given single nucleotide polymorphisms). The accuracy of these methods may detect very small changes in frequency (e.g., as low as about 10, 5, 4, 3, 2, 1 ,
- a blood sample will contain a very dilute genetic signature from the donated organ. This signature may be the presence of an allele that is not in the recipient of the donated organ's genome.
- the methods described herein may detect very small deviations in allele frequency (e.g. , as low as about 10, 5, 4, 3, 2, 1 , 0.5, 0.1 or 0.01 % or less) and may identify the presence of donor DNA in a host sample (e.g., blood sample).
- An unhealthy transplanted organ may result in elevated levels of donor DNA in the host blood - a rise of only a few percent (e.g., as low as about 10, 5, 4, 3, 2, 1 , 0.5, 0.1 or 0.01 % or less).
- the methods described herein may be sensitive enough to identify changes in allele frequency with the necessary sensitivity, and therefore may accurately determine the presence and changing amounts of donor DNA in host blood.
- the methods of the present disclosure may comprise comparing the first and second numbers to determine the genetic variation in the genetic sample.
- a genetic fraction of a first genome in a genetic sample is determined according to an amount of a plurality of informative polymorphic loci located at a plurality of reference loci in the genetic sample.
- a genetic fraction of a first genome in a genetic sample is determined according to an amount (e.g., counts) of a first allele of a plurality of informative polymorphic loci located at a plurality of reference loci in a first genome and an amount (e.g., counts) of a second allele of each of the plurality of informative polymorphic loci located at the plurality of reference loci in a second genome (different than the first) in the genetic sample.
- An amount of one or more alleles of an informative polymorphic loci may be determined using a suitable method.
- an amount of one or more alleles of an informative polymorphic loci may be determined using an NGS sequencing method (e.g., a targeted sequencing method or a whole genome sequencing method.
- an amount of one or more alleles of an informative polymorphic loci are determined using a microarray as described herein, which in certain embodiments comprises hybridizing, ligating and amplifying a suitable probe set described herein (e.g., a probe set shown in Figs. 1-33), immobilizing the amplified ligated probe sets and counting the labeled probe products immobilized to an element of an array.
- an amount of one or more alleles of one or more informative polymorphic loci are determined using a method described in US Pat. 9,212,394 or International Pat. Application Pub. No. WO/2017/134191.
- a genetic fraction determined by a method described herein is a likelihood or probability distribution generated according to a suitable method. In certain embodiments, multiple likelihood distributions are generated.
- a method comprises determining a copy number of a nucleic acid region of interest in a genome (e.g., a genome of interest). In some embodiments, a method comprises analyzing a genetic sample.
- a genetic sample may be obtained or provided.
- a genetic sample often comprises genetic material derived from a first genome and genetic material derived from a second genome.
- a method comprises determining a suitable metric (e.g., a first metric) of a copy number hypothesis for a nucleic acid region of interest in a genome (e.g., a first genome).
- a metric is a suitable statistical metric or statistical measure, nonlimiting examples of which include a probability and a likelihood.
- a metric is a suitable statistical metric or statistical measure of a copy number of a nucleic acid region of interest in a genome based on a particular copy number hypothesis.
- a copy number hypothesis is represented by a mathematical expression that defines a particular copy number of a nucleic acid region of interest in a genome.
- a metric comprises a distribution (e.g., probability distribution or likelihood distribution). In some embodiments, a metric comprises a function. In certain embodiments, a metric is a combination of two or more metrics (e.g., a joint metric, a joint probability). In some embodiments, a metric is a joint probability and is determined by combining two or more probabilities using a suitable process. In certain embodiments, a metric is a joint probability determined by combining or joining a first probability and a second probability of a copy number hypothesis. Two or more probabilities can be joined using a suitable mathematical process (e.g., by adding or multiplying).
- a suitable mathematical process e.g., by adding or multiplying.
- a metric, probability or likelihood of a copy number hypothesis is a function of an amount of one or more loci in a genetic sample.
- An amount of loci present in a sample can be determined by a suitable process (e.g., a method described herein).
- an amount of one or more loci is a sum, mean, average, or absolute amount of one or more loci in a sample.
- an amount of one or more loci is determined according to a representative subset or sampling of one or more loci present in a sample.
- an amount of one or more loci is sum, mean, average or absolute count of some (e.g., a representative subset) or all of one or more loci present in a sample. In some embodiments, an amount of a plurality of loci is a suitable distribution of one or more loci. In some embodiments, an amount of one or more loci is a z-score.
- a metric, likelihood or probability of a copy number hypothesis is a function of an amount of a plurality of non-polymorphic loci in a genetic sample. In certain embodiments, a metric, likelihood or probability of a copy number hypothesis is a function of (i) an amount of a plurality of non-polymorphic reference loci in a genetic sample, and (ii) an amount of a plurality of non-polymorphic loci in a nucleic acid region of interest in the genetic sample.
- a metric, likelihood or probability of a copy number hypothesis is determined, in part, according to a suitable mathematical comparison of i) an amount of a plurality of non-polymorphic reference loci in a genetic sample, and (ii) an amount of a plurality of non-polymorphic loci in a nucleic acid region of interest in the genetic sample.
- a metric, likelihood or probability of a copy number hypothesis is determined, in part, according to a ratio of i) an amount of a plurality of non-polymorphic reference loci in a genetic sample, and (ii) an amount of a plurality of non-polymorphic loci in a nucleic acid region of interest in the genetic sample, or an inverse ration thereof.
- a metric, likelihood or probability of a copy number hypothesis is a function of a genetic fraction of genetic material in a genetic sample.
- a metric, likelihood or probability of a copy number hypothesis is a function of a genetic fraction of an amount of genetic material derived from a first genome or source in a genetic sample relative to an amount of genetic material derived from another genome or source in the genetic sample.
- a metric, likelihood or probability of a copy number hypothesis is a function of a likelihood distribution of a genetic fraction of genetic material derived from a first genome or source in the genetic sample relative to an amount of genetic material derived from a second genome or source in a genetic sample.
- a likelihood distribution can be determined using a suitable statistical method.
- a likelihood distribution comprises a probability distribution.
- a metric, likelihood or probability of a copy number hypothesis is a function of i) an amount of a plurality of non-polymorphic reference loci in a genetic sample, (ii) an amount of a plurality of non-polymorphic loci in a nucleic acid region of interest in the genetic sample, and (iii) a genetic fraction of genetic material in a genetic sample.
- the genetic fraction of (iii) is determined according to i) an amount of a plurality of non-polymorphic reference loci in a genetic sample, and (ii) an amount of a plurality of non-polymorphic loci in a nucleic acid region of interest in the genetic sample.
- a genetic fraction is a function of i) an amount of a plurality of non-polymorphic reference loci in a genetic sample, and (ii) an amount of a plurality of non-polymorphic loci in a nucleic acid region of interest in the genetic sample.
- a genetic fraction of genetic material in a sample is determined according to a one or more polymorphic alleles located at one or more reference loci in a genetic sample. In some embodiments, a genetic fraction of genetic material is determined according to a plurality of informative polymorphic alleles located at a plurality of reference loci in a genetic sample.
- a genetic fraction of genetic material is determined by comparing a first genotype (e.g., a first expected genotype, e.g., a first genotype hypothesis) of a first genome in a sample to a second genotype (e.g., a second expected genotype, e.g., a second genotype hypothesis) of a second genome in the sample, where the first and second genotypes are defined by two different alleles of a polymorphic allele present in a sample.
- a first genotype e.g., a first expected genotype, e.g., a first genotype hypothesis
- a second genotype e.g., a second expected genotype, e.g., a second genotype hypothesis
- a metric, likelihood or probability of a copy number hypothesis is determining by a joint probability by combining a first and second probability of a copy number hypothesis, each of which first and second probabilities are a function of different genetic fraction metrics.
- a copy number hypothesis is a presumption of a trisomy 18 in a fetus
- the hypothesis is represented by two probability distributions A and B, where B is a function of i) an amount of a plurality of non-polymorphic reference loci in a genetic sample, (ii) an amount of a plurality of non-polymorphic loci in a nucleic acid region of interest (i.e., Chr.
- the second probability distribution B of the trisomy 18 hypothesis is a function of i) an amount of a plurality of non-polymorphic reference loci in a genetic sample, (ii) an amount of a plurality of non-polymorphic loci in a nucleic acid region of interest (i.e., Chr.
- the joint probability is determined by combining the probability distribution of A with the probability distribution of B, thereby providing a first metric, likelihood or probability of the copy number hypothesis that the fetus is a trisomy 18.
- two or more metrics, likelihoods or probabilities of a copy number hypothesis are determining by a joint probability by combining a first and second probability of a copy number hypothesis as described above.
- a first metric, likelihood or probability of a copy number hypothesis is a hypothesis that the fetus is a trisomy 18
- a second metric, likelihood or probability of a copy number hypothesis is a hypothesis that the fetus is euploid for Chr. 18.
- both the first and second metrics are determined by a joint probability as described above.
- the first metric and the second metric are distributions (e.g., probability or likelihood distributions).
- a first and a second metric are compared to determined which metric has a higher value (e.g., peak value, e.g., highest area under the curve), which often defines a true copy number hypothesis.
- a first and second metric of a copy number hypothesis can be compared by a suitable method.
- each of the distributions can be compared graphically.
- a peak value of each of the metrics are compared.
- the measured genetic data from a sample of genetic material that contains both fetal and maternal DNA is analysed, along with the genetic data from the biological parents of the fetus, and the copy number of the chromosome of interest is determined or estimated.
- these methods typically rely on estimating the genetic fraction (e.g., a fraction of genetic material derived from a given source in a genetic sample comprising genetic material from multiple sources) solely by point estimation, which can vary from the actual genetic fraction, thereby introducing error into the method.
- the fraction of genetic material from a given source is estimated to be a single value or a constant, and this estimated value or constant can differ from the true value or true estimate of the genetic fraction.
- the distribution of fragment sizes may be used to assess the fetal fraction and the presence of trisomy. This information may be used in combination with an array of the current disclosure to provide more information on the presence of fetal material in the sample and the disease status of the fetus (for example, where it carries a trisomy).
- data for determining a genetic fraction may be obtained at the same time as the data for determining the genetic variation is collected.
- the data for determining a genetic fraction is the same data, or a subset of the data, for determining the genetic variation.
- data from nucleic acid molecules corresponding to chromosomes not expected to have a genetic variation can be used to determine the genetic fraction.
- the data for determining a genetic fraction can be obtained prior to collecting the data for determining the genetic variation.
- the data for determining a genetic fraction can be obtained after collecting the data for determining the genetic variation.
- detecting, discovering, determining, measuring, evaluating, counting, and assessing the genetic variation are used interchangeably and include quantitative and/or qualitative determinations, including, for example, identifying the genetic variation, determining presence and/or absence of the genetic variation, and quantifying the genetic variation.
- the methods of the present disclosure may detect multiple genetic variations.
- the present disclosure also relates to methods of determining genetic variation in a genetic sample, said genetic sample containing a first genetic material and optionally having a second genetic material, the method comprising: (a) determining, using a computer system, a first metric corresponding to a measure of certainty of a null hypothesis that the genetic variation is absent in the genetic sample, wherein the first metric is a continuous or discontinuous function of a fraction of the second genetic material, and conditioned on the absence of the genetic variation in a first data set; (b) determining, using a computer system, a second metric corresponding to a measure of certainty of an alternative hypothesis that the genetic variation is present in the genetic sample, wherein the second metric is a continuous or discontinuous function of the fraction of the second genetic material, and conditioned on the presence of the genetic variation in the first data set; (c) determining, using a computer system, a relative number based on the first metric and the second metric; and (d) determining, using a computer system, if the
- the present disclosure provides a method comprising determining with certainty, using a computer system, if the genetic variation is present in the genetic sample by comparing the relative number to a reference number. In certain embodiments, the present disclosure provides a method comprising determining, using a computer system, the probability that the genetic variation is present in the genetic sample by comparing the relative number to a reference number.
- the term “function” can refer to a continuous function, a discontinuous function (e.g., a discrete function), or any combination thereof.
- the relative number corresponds to a difference or a ratio (e.g., an odds ratio) between the first metric (disomic) and the second metric (trisomic) occurring at a predetermined fraction of the second genetic material.
- the predetermined fraction is the same for the first metric and the second metric.
- the predetermined fraction is different for the first metric and the second metric.
- the relative number corresponds to a difference or a ratio between the first metric and the second metric occurring at the fraction of the second genetic material that maximizes the first metric.
- the relative number corresponds to a difference or a ratio between the first metric and the second metric occurring at the fraction of the second genetic material that maximizes the second metric. In one aspect, the relative number corresponds to a difference or a ratio between the first metric and the second metric occurring at the fraction of the second genetic material that maximizes the ratio between the first metric and the second metric. In one aspect, the relative number corresponds to a difference or a ratio between (i) the first metric occurring at a fraction of the second genetic material that maximizes the first metric, and (ii) the second metric occurring at fraction of the second genetic material that maximizes the second metric.
- the method further comprises determining the fraction of the second genetic material at which the difference or the ratio between the first and second metric is maximized.
- the first metric and the second metric are selected from the group consisting of probability and likelihood.
- the first data set is obtained by: (a) contacting a first probe set to the genetic sample, wherein the first probe set comprises a first labeling probe and a first tagging probe; (b) hybridizing the first probe set to one or more first nucleic acid regions of interest in nucleotide molecules present in the genetic sample; (c) labeling the first labeling probe with a first label; (d) immobilizing the first probe set to a substrate at a density in which the first label is optically resolvable after immobilization; and (e) detecting a number of the first labels corresponding to the first probe set immobilized to the substrate to detect the nucleic acid copy numbers of the one or more first nucleic acid regions of interest, thereby obtaining the first data set.
- the Statistical Power in detecting the genetic variation is increased by at least 0.05, at least 0.1, at least 0.15, at least 0.2, at least 0.3, at least 0.4, at least 0.5, at least 0.6, at least 0.7, at least 0.8, at least 0.9, or at least 0.99 as compared to a method in which the fraction of the second genetic material is determined by point estimation that does not maximize the probability of the metric.
- the Statistical Power in detecting the genetic variation is increased by at least 5%, at least 10%, at least 15%, at least 20%, at least 25%, at least 50%, at least 75%, at least 100%, at least 150%, at least 200%, at least 250%, at least 300%, at least 350%, at least 400%, at least 450%, at least 500%, at least 600%, at least 700%, at least 800%, at least 900%, or at least 1000% as compared to a method in which the fraction of the second genetic material is determined by point estimation that does not maximize the probability of the metric.
- the Statistical Power is a result of maximizing the metric of the fraction of the second genetic material, as compared to using a point estimate of the fraction of the second genetic material from the first data set.
- the fraction of the second genetic material is not determined directly by point estimation from the first data set.
- the first genetic material comprises maternal genetic material from the subject, and the second genetic material comprises fetal genetic material from a fetus.
- the first genetic material comprises non-tumor derived genetic material, and the second genetic material comprises tumor-derived genetic material.
- determining the genetic variation comprises performing an additional test selected from the group consisting of microarrays, sequencing-by-synthesis, digital polymerase chain reaction (dPCR), realtime quantitative polymerase chain reaction (rtPCR), array capture, a nucleic acid sequence-based detection, massively parallel genomic sequencing, digital arrays, single molecule arrays, single molecule counting, oligo-ligation assays and single molecule sequencing.
- determining the genetic variation comprises performing an additional test comprising an array.
- determining the genetic variation comprises performing an additional test comprising a digital array.
- determining the genetic variation comprises performing an additional test comprising a single molecule array.
- determining the genetic variation comprises performing an additional test comprising single molecule counting.
- the additional test is performed using a digital array. In one aspect, the additional test is not performed using a digital array. It is contemplated that the additional test can comprise performing any test known in the art that may be used to determine a genetic variation. In one aspect, the additional test is performed using the genetic sample or an additional genetic sample from the subject. In one aspect, the additional test is performed only if the relative number exceeds the reference number. In one aspect, the additional genetic sample is collected only if the relative number exceeds the reference number.
- the present disclosure also relates to methods of determining genetic variation in a genetic sample, said genetic sample containing a first genetic material and optionally having a second genetic material, the method comprising: (a) determining, using a computer system, a first metric corresponding to a measure of certainty of a null hypothesis that the genetic variation is absent in the genetic sample, wherein the first metric is a function of a fraction of the second genetic material and conditioned on the absence of the genetic variation in both a first data set and a second data set; (b) determining, using a computer system, a second metric corresponding to a measure of certainty of an alternative hypothesis that the genetic variation is present in the genetic sample, wherein the second metric is a function of the fraction of the second genetic material and conditioned on the presence of the genetic variation in at least one of the first data set and the second data set; (c) determining, using a computer system, a relative number corresponding to a maximum difference or a ratio between the first metric and the second metric; and
- the method further comprises determining the fraction of the second genetic material at which the difference or the ratio between the first and second metric is maximized.
- the first metric and the second metric are selected from the group consisting of probability and likelihood.
- the first metric and the second metric are determined using a first data set and a second data set obtained by: (a) contacting a first probe set and a second probe set to the genetic sample, wherein the first probe set and the second probe set comprise a first labeling probe and a second labeling probe, respectively, and a first tagging probe and a second tagging probe, respectively; (b) hybridizing the first probe set to one or more first nucleic acid regions of interest, and the second probe set to one or more second nucleic acid regions of interest, in nucleotide molecules present in the genetic sample; (c) labeling the first labeling probe with a first label and the second labeling probe with a second label; (d) immobilizing the first probe set and the second probe set to one or more substrates at a density in which the first label and the second label are optically resolvable after immobilization; (e) detecting a number of the first labels corresponding to the first probe set, and the second labels corresponding to the second probe set
- the method further comprises: (a) contacting a third probe set and a fourth probe set to the genetic sample, wherein the third probe set and the fourth probe set comprise a third labeling probe and a fourth labeling probe, respectively, and a third tagging probe and a fourth tagging probe, respectively; (b) hybridizing the third probe set to one or more third nucleic acid regions of interest, and the fourth probe set to one or more fourth nucleic acid regions of interest, in nucleotide molecules present in the genetic sample; (c) labeling the third labeling probe with a third label and the fourth labeling probe with a fourth label; (d) immobilizing the third probe set and the fourth probe set to one or more substrates at a density in which the third label and the fourth label are optically resolvable after immobilization; and (e) detecting a number of the third labels corresponding to the third probe set, and the fourth labels corresponding to the fourth probe set, immobilized to the substrate to detect (i) one or more third nucleic acid
- the first probe set and the second probe set comprise probes that interrogate non-polymorphic or polymorphic regions of interest
- the third probe set and the fourth probe set comprise SNP probes.
- the Statistical Power in detecting the genetic variation is increased by at least 0.05, at least 0.1 , at least 0.15, at least 0.2, at least 0.3, at least 0.4, at least 0.5, at least 0.6, at least 0.7, at least 0.8, at least 0.9, or at least 0.99 as compared to a method in which the fraction of the second genetic material is determined by point estimation that does not maximize the probability of the metric.
- the Statistical Power in detecting the genetic variation is increased by at least 5%, at least 10%, at least 15%, at least 20%, at least 25%, at least 50%, at least 75%, at least 100%, at least 150%, at least 200%, at least 250%, at least 300%, at least 350%, at least 400%, at least 450%, at least 500%, at least 600%, at least 700%, at least 800%, at least 900%, or at least 1000% as compared to a method in which the fraction of the second genetic material is determined by point estimation that does not maximize the probability of the metric.
- the increase in the Statistical Power is a result of maximizing the function of the fraction of the second genetic material, as compared to using a predetermined estimate of the fraction of the second genetic material from the first data set.
- the fraction of the second genetic material is not determined by point estimation.
- the first genetic material comprises maternal genetic material from the subject, and the second genetic material comprises fetal genetic material from a fetus.
- the first genetic material comprises non-tumor derived genetic material, and the second genetic material comprises tumor-derived genetic material.
- determining the genetic variation comprises performing an additional test selected from the group consisting of sequencing-by-synthesis, digital polymerase chain reaction, real-time quantitative polymerase chain reaction, array capture, a nucleic acid sequence-based detection, massively parallel genomic sequencing, digital arrays, single molecule arrays, single molecule counting, oligo-ligation assays and single molecule sequencing.
- determining the genetic variation comprises performing an additional test comprising a digital array.
- determining the genetic variation comprises performing an additional test comprising a single molecule array.
- determining the genetic variation comprises performing an additional test comprising single molecule counting.
- determining the genetic variation comprises performing an additional test comprising sequencing.
- the additional test is performed using the genetic sample or an additional genetic sample from the subject. In one aspect, the additional test is performed only if the relative number exceeds the reference number. In one aspect, the additional test is performed only if the relative number subceeds the reference number. In one aspect, the additional genetic sample is collected only if the relative number subceeds the reference number.
- the methods of the present disclosure increase the Statistical Power of the method (e.g., a method for determining the presence or absence of a genetic variation).
- the “Statistical Power” of a method can refer to one minus the probability of type II error (beta), where Type II error refers to the false acceptance of the null hypothesis.
- the null hypothesis generally refers to a hypothesis of “no difference” (e.g., a sample is ‘healthy’, or does not contain a genetic variation).
- Exemplary null hypotheses can include, for example, the absence of fetal trisomy, the absence of cancer, or the absence of transplant rejection.
- Statistical Power should be maximized when selecting a method to increase the probability of correctly rejecting the null hypothesis (e.g., the null hypothesis is truly false).
- the Statistical Power of the method is increased by at least 0.05, at least 0.1 , at least 0.15, at least 0.2, at least 0.3, at least 0.4, at least 0.5, at least 0.6, at least 0.7, at least 0.8, at least 0.9, or at least 0.99 as compared to a method in which a genetic fraction is determined solely by point estimation.
- the Statistical Power of the method is increased by at least 5%, at least 10%, at least 15%, at least 20%, at least 25%, at least 50%, at least 75%, at least 100%, at least 150%, at least 200%, at least 250%, at least 300%, at least 350%, at least 400%, at least 450%, at least 500%, at least 600%, at least 700%, at least 800%, at least 900%, or at least 1000% as compared to a method in which the fraction of the second genetic material is determined by point estimation that does not maximize the probability of a metric.
- Estimation of the genetic fraction can be used to inform the collection and/or analysis of the test data (e.g., the data used to determine if a genetic variation is present in a genetic sample).
- the genetic fraction exceeds or equals a predetermined threshold, then a subsequent test is performed.
- a subsequent test is not performed.
- additional testing is delayed by a given period of time (e.g., days, weeks, months, or years).
- the genetic fraction can be used to determine the type of additional test used.
- a more sensitive additional test may be used to determine the presence or absence of a genetic variation than if the genetic fraction had exceeded the predetermined threshold.
- An additional test can comprise, for example, analysing the genetic sample with sequencing-by-synthesis, digital polymerase chain reaction, real-time quantitative polymerase chain reaction, array capture, a nucleic acid sequence-based detection, massively parallel genomic sequencing, digital arrays, single molecule arrays, single molecule counting, oligo-ligation assays or single molecule sequencing.
- the sample is re-analyzed, (ii) a new sample is obtained from the subject, and/or (iii) the sample is enriched for nucleic acids in the sample, and the analysis is repeated.
- the sample can be enriched for a particular analyte (e.g., genetic material from a fetus or tumor). Sequencing after such an enrichment results in a higher proportion of the resulting sequence data being relevant to determining the sequence of the region of interest, since a higher percentage of the sequence reads are generated from the region of interest, e.g., by single-molecule sequencing.
- At least a 10-fold, 25-fold, 100-fold, 200-fold, 300-fold, 500-fold, 700-fold, 1000-fold, 10,000-fold, or greater molar enrichment of the analyte can be achieved relative to the concentration in the original sample.
- the genetic fraction may be weighted based on the quality of the estimate.
- the genetic fraction can be weighted by the intensity of the signal from various labels.
- the genetic fraction can be weighted based on the amount of data used to make the estimate.
- the genetic fraction can be weighted based on the distribution of estimates for the genetic fraction in a set of samples (e.g., by comparing the estimate of the genetic fractions for one or more samples against a reference set of samples).
- the estimated genetic fraction is compared against a predetermined threshold to determine if an additional test should be performed.
- the predetermined threshold is determined based on the test being performed. For example, in Trisomy 18 testing, the predetermined threshold that the estimated fetal fraction should exceed in order to perform the additional test can be 1 %. In another example, in T risomy 21 testing, the predetermined threshold that the estimated fetal fraction should exceed in order to perform the additional test can 2%.
- the predetermined threshold can be determined empirically, or by theory or logic.
- the estimated genetic fraction may be used to dynamically alter the method (e.g., the type of additional test performed, or a quality of the additional test performed). For example, if the genetic fraction is estimated to be 1%, 5%, or 10%, then 5 million, 3 million, or 1 million counts, respectively, can be collected when performing an additional test to determine the presence of a genetic variation. When a sample is estimated to have a low genetic fraction, more data can be collected when performing the additional test.
- a threshold is used to determine how much a digital array is scanned. If the measured value for a specific sample equals or exceeds the threshold a certain portion of the array is scanned (e.g., a certain number of elements of the array). If the measured value for a specific sample is less than the threshold, a different portion of the array is scanned ( e.g a larger number of elements than if the value had exceeded the threshold).
- methods of the present disclosure comprise maximizing or optimizing a metric using data from a single molecule array.
- the null hypothesis e.g., that the sample is diploid, has a given genotype, has a given haplotype, or any combination thereof
- the alternative hypothesis e.g., that the sample is not diploid, does not has a given genotype, does not have a given haplotype, or any combination thereof
- GF genetic fraction
- the presence of the genetic variation is determined from a second data set or a test data set (d2).
- the first and second data sets can be obtained by analysing the same sample or different samples.
- a metric e.g., likelihood, probability, or other measure of certainty of the null or alternative hypothesis
- the two hypotheses can be H0: f(d2
- the two hypotheses are compared (e.g., using a likelihood ratio) to determine a relative number indicative of which hypothesis is more likely to represent the underlying truth about the genetic sample.
- the term “relative number” as used herein can refer to a value representing a comparison between two or more metrics. It will be understood that a relative number can be determined from two or more metrics in a variety of ways, including taking a difference between the two or more metrics, taking a sum of the two or more metrics, taking a ratio of the two or more metrics, by determining a maximum or minimum of a difference, sum, or ratio of the two or more metrics, or by performing any other mathematical operation involving the two or more metrics.
- the genetic fraction (e.g., the fetal fraction or fraction of tumor- derived DNA) in a genetic sample is determined by maximizing a metric with respect to the genetic fraction, where the genetic fraction is a parameter and not an estimate (e.g., a fixed point estimate) from independent data from the genetic sample.
- a metric such as probability of observing the given data
- the genetic fraction can be maximized with respect to the genetic fraction (which can be treated as a variable that ranges from 0 to 1 representing 0% fetal material to 100% fetal material respectively).
- the metric is a probability of a copy number change, it can be observed on a digital array by an increase in counts in one locus compared to another (e.g., for trisomy 21 in a fetus, an increase in the counts from probes that target chromosome 21 compared to the counts for probes that target a control chromosome ⁇ e.g., a reference loci).
- the magnitude of the deviation in the counts would be expected to be proportional to the genetic fraction. That is, the higher the genetic fraction, the greater the proportion of fetal material in the sample and hence the greater the expected deviation due to a copy number change in the fetus.
- a genetic fraction parameter is used to inform the detection of a change in copy number (e.g., when using non-polymorphic markers), and the observed deviation in counts used to detect the copy number change is expected to be proportional to the genetic fraction of the sample under a given ploidy hypothesis.
- the metrics can be compared by comparing a set of probes from a genomic region that is being tested for likely copy number change to a set of probes from a genomic region believed to be diploid (or another known ploidy or having any known genomic characteristic).
- the genetic fraction is measured in a first data set, having value f1.
- a metric for detecting a genetic variation is maximized in a second data set (for example, where the metric is a likelihood of a copy number change as a function of the genetic fraction) with respect to a parameter representing the genetic fraction.
- a genetic fraction at which a metric is maximized is f2. If f1 and f2 are the same or similar, that provides consistent evidence for the presence of a genetic variation.
- a suitable statistical method can be used to determine the consistency of f1 and f2.
- a measurement of the genetic fraction in the first data set (f1 ) can be used to determine if the measurement of a metric for detecting a genetic variation is optimized (e.g., maximized) at the value of the genetic fraction (f2) that is consistent with f1 .
- Consistency between fland f2 often lends support to the hypothesis that is maximized at f2 (e.g., the presence of a genetic variation).
- an estimate of the genetic fraction, f1 is an estimate from a given set of data (d1) and will not be the exact value of the genetic fraction in the genetic sample. It would require a data set of infinite size to perfectly estimate the genetic fraction in the original genetic sample. Therefore, using an estimate will not necessarily maximize the metric, particularly if genetic fraction is treated as a continuous variable, and therefore has an infinite number of possible values. By maximizing the metric with respect to the genetic fraction, the resulting estimate for the genetic fraction is likely to be a different value than a point estimate of the genetic fraction from the first data set.
- the value of the genetic fraction at which the metric is maximized in the second data set is the best estimate of the genetic fraction in the test data, d2, (as opposed to the first data set, d1).
- the genetic fraction estimate from the first data, d1 , set is explicitly not used in the determination of the presence or absence of a genetic variation.
- the first data set, d1 is only used to determine whether to collect or analyze the second dataset, d2, and not in the assessment of whether there is a genetic variation (for example, if the genetic fraction estimate in d1 is greater than a threshold, then data set d2 is collected and/or data set d2 is analyzed).
- the two hypotheses can be H0: f(d2
- the two hypotheses are compared (e.g., max(H1/H0), where the maximization is with respect to x (the FF)) to determine a relative number indicative of which hypothesis is more likely to represent the underlying truth about the genetic sample.
- a genetic fraction (e.g., the fetal fraction or fraction of tumor- derived DNA) in a genetic sample is determined by maximizing a metric over a first data set used to determine the genetic fraction and a second data set used to determine the presence of a genetic variation with respect to the genetic fraction (e.g., the value of genetic fraction that best explains both data sets), where the genetic fraction is a parameter and not the estimate (e.g., a fixed point estimate) from independent data from the genetic sample.
- the advantage of this approach is that all of the data (e.g., from both the first and the second data set) is used to estimate the genetic fraction (under an assumption on the ploidy or other genomic characteristic of the sample).
- the first data set is used in conjunction with the second data set to find the maximum likelihood of trisomy.
- the first data set adds information about the genetic fraction that constrains the genetic fraction in the second data set.
- the first data may be collected on non-test loci (e.g., non-trisomic chromosomes) and the second data set on test loci (for example, on chromosome 21 when looking for trisomy 21 in a fetus).
- the two hypotheses can be H0: f(d1 , d2
- f a metric (e.g., probability or likelihood) conditioned on the genetic fraction taking value x (where x can take any value between 0 and 1 ) and the presence or absence of a trisomy.
- the two hypotheses are compared (e.g ., max(H1/H0), where the maximization is with respect to x (the FF)) to determine a relative number indicative of which hypothesis is more likely to represent the underlying truth about the genetic sample.
- the present disclosure provides methods for determining genetic variation in a genetic sample, said genetic sample containing a first genetic material and optionally having a second genetic material, the method comprising: determining, using a computer system, a first metric corresponding to a measure of certainty of a null hypothesis that the genetic variation is absent in the genetic sample, wherein the first metric is a function of a fraction of the second genetic material and conditioned on the absence of the genetic variation in both a first data set and a second data set; determining, using a computer system, a second metric corresponding to a measure of certainty of an alternative hypothesis that the genetic variation is present in the genetic sample, wherein the second metric is a function of the fraction of the second genetic material and conditioned on the presence of the genetic variation in at least one of the first data set and the second data set; determining, using a computer system, a relative number corresponding to a maximum difference or a ratio between the first metric and the second metric; and determining, using a computer
- the method of the present disclosure may comprise selecting and/or isolating genetic locus or loci of interest, and quantifying the amount of each locus present (for example for determining copy number) and/or the relative amounts of different locus variants (for example two alleles of a given DNA sequence).
- the methods described herein may produce highly accurate measurements of genetic variation.
- One type of variation described herein includes the relative abundance of two or more distinct genomic loci.
- the loci may be small (e.g., as small as about 300, 250, 200, 150, 100, or 50 nucleotides or less), moderate in size (e.g., from 1 ,000, 10,000, 100,000 or one million nucleotides), and as large as a portion of a chromosome arm or the entire chromosome or sets of chromosomes.
- the results of this method may determine the abundance of one locus to another.
- the precision and accuracy of the methods of the present disclosure may enable the detection of very small changes in copy number (as low as about 25, 10, 5, 4, 3, 2, 1 , 0.5, 0.1 ,0.05, 0.02 or 0.01 % or less), which enables identification of a very dilute signature of genetic variation.
- a signature of fetal aneuploidy may be found in a maternal blood sample where the fetal genetic aberration is diluted by the maternal blood, and an observable copy number change of about 2% is indicative of fetal trisomy.
- the present disclosures according to some embodiments encompass at least two major components: an assay for the selective identification of genomic loci, and a technology for quantifying these loci with high accuracy.
- a method may comprise interrogating one or a plurality of Single Nucleotide Polymorphism (SNP) sites to determine whether the proportion (e.g., concentration, and number percentage based on the number of nucleotide molecules in the sample) of fetal material (e.g., the fetal fraction) is sufficient so that a genetic variation or copy number of a region of interest in a fetus may be detected from a genetic sample with a reasonable statistical significance.
- SNP Single Nucleotide Polymorphism
- the method may further comprise contacting maternal and paternal probe sets to the genetic sample, wherein the maternal probe set comprises a maternal labeling probe and a maternal tagging probe, and the paternal probe set comprises a paternal labeling probe and a paternal tagging probe.
- the method may further comprise hybridizing at least a part of each of the maternal and paternal probe sets to a nucleic acid region of interest in nucleotide molecules of the genetic sample, the nucleic acid region of interest comprising a predetermined SNP site, wherein the at least a part of the maternal probe set hybridizes to a first allele at the SNP site, the at least a part of the paternal probe set hybridizes to a second allele at the SNP site, and the first and second alleles are different from each other.
- the method may further comprise ligating the material and paternal probe sets at least by ligating (i) the maternal labeling and tagging probes, and (ii) the paternal labeling and tagging probes.
- the method may further comprise amplifying the ligated probes.
- the method may further comprise immobilizing the tagging probes to a pre-determined location on a substrate, wherein the maternal and paternal labeling probes and/or the amplified labeling probes thereof ligated to the immobilized tagging probes comprise maternal and paternal labels, respectively; the maternal and paternal labels are different, and the immobilized labels are optically resolvable.
- the method may further comprise counting the numbers of the maternal and paternal labels, and determining whether a proportion of a fetal material in the genetic sample is sufficient to detect the genetic variation in the fetus based on the numbers of the maternal and paternal labels.
- the method may further comprise determining the proportion of the fetal material in the genetic sample.
- tumor fraction is analogous to the fetal material or fetal fraction described herein.
- the tumor fraction may be a measure of the proportion of the material that comes from the tumor in a way that is analogous to the fetal fraction measuring the proportion of the material that comes from the fetus and/or placenta.
- the tumor fraction is ⁇ 1% when the cancer is at an early stage (e.g., Stage II or earlier).
- the method may further comprise contacting allele A and allele B probe sets that are allele-specific to the genetic sample, wherein the allele A probe set comprises an allele A labeling probe and an allele A tagging probe, and the allele B probe set comprises an allele B labeling probe and an allele B tagging probe.
- the method may further comprise hybridizing at least a part of each of the allele A and allele B probe sets to a nucleic acid region of interest in nucleotide molecules of the genetic sample, the nucleic acid region of interest comprising a predetermined single nucleotide polymorphism (SNP) site for which a maternal allelic profile (i.e., genotype) differs from a fetal allelic profile at the SNP site
- SNP single nucleotide polymorphism
- maternal allelic composition may be AA and fetal allelic composition may be AB, or BB.
- maternal allelic composition may be AB and fetal allelic composition may be AA, or BB.
- the method may further comprise ligating the allele A and allele B probe sets at least by ligating (i) the allele A labeling and tagging probes, and (ii) the allele B labeling and tagging probes.
- the method may further comprise amplifying the ligated probe sets.
- the method may further comprise immobilizing the tagging probes to a pre-determined location on a substrate, wherein the allele A and allele B labeling probes and/or the amplified labeling probes thereof ligated to the immobilized tagging probes comprise allele A and allele B labels, respectively, the allele A and allele B labels are different, and the immobilized labels are optically resolvable.
- the method may further comprise counting the numbers of the allele A and allele B labels, and determining whether a proportion of a fetal material in the genetic sample is sufficient to detect the genetic variation in the fetus based on the numbers of the allele A and allele B labels.
- the method may further comprise determining the proportion of the fetal material in the genetic sample.
- the method may further comprise contacting maternal and paternal probe sets to the genetic sample, wherein the maternal probe set comprises a maternal labeling probe and a maternal tagging probe, and the paternal probe set comprises a paternal labeling probe and a paternal tagging probe.
- the method may further comprise hybridizing at least parts of the maternal and paternal probe sets to maternal and paternal nucleic acid regions of interest in nucleotide molecules of the genetic sample, respectively, wherein the paternal nucleic acid region of interest is located in the Y chromosome, and the maternal nucleic acid region of interest is not located in the Y chromosome.
- the method may further comprise ligating the maternal and paternal probe sets at least by ligating (i) the maternal labeling and tagging probes, and (ii) the paternal labeling and tagging probes.
- the method may further comprise amplifying the ligated probes.
- the method may further comprise nucleic acid region of interest comprising a predetermined single nucleotide polymorphism (SNP) site containing more than one SNP, for example two or three SNPs. Further, the SNP site may contain SNPs with high linkage disequilibrium such that labeling and tagging probes are configured to take advantage of the improved energetics of multiple SNP matches or mismatches versus only one.
- SNP single nucleotide polymorphism
- the method may further comprise immobilizing the tagging probes to a pre-determined location on a substrate, wherein the maternal and paternal labeling probes and/or the amplified labeling probes thereof ligated to the immobilized tagging probes comprise maternal and paternal labels, respectively, the maternal and paternal labels are different, and the immobilized labels are optically resolvable.
- the method may further comprise counting the numbers of the maternal and paternal labels, and determining whether a proportion of a fetal material in the genetic sample is sufficient to detect the genetic variation in the fetus based on the numbers of the maternal and paternal labels.
- the method may further comprise determining the proportion of the fetal material in the genetic sample.
- the method described herein excludes identifying a sequence in the nucleotide molecules of the genetic sample, and/or sequencing of the nucleic acid region(s) of interest and/or the probes.
- the method excluding sequencing of the probes includes excluding sequencing a barcode and/or affinity tag in a tagging probe.
- the immobilized probe sets to detect different genetic variations, nucleotide regions of interest, and/or peptides of interest need not be detected or scanned separately because sequencing is not required in the methods described herein.
- the counts of different labels immobilized to a substrate are counted simultaneously (e.g., by a single scanning and/or imaging), and thus the counts of different labels are not separately counted.
- the method described herein excludes bulk array readout or analog quantification.
- the bulk array readout herein means a single measurement that measures the cumulative, combined signal from multiple labels of a single type, optionally combined with a second measurement of the cumulative, combined signal from numerous labels of a second type, without resolving a signal from each label. A result is drawn from the combination of the one or more such measurements in which the individual labels are not resolved.
- the method described herein may include a single measurement that measures the same labels, different labels of the same type, and/or labels of the same type in which the individual labels are resolved.
- the method described herein may exclude analog quantification and may employ digital quantification, in which only the number of labels is determined (ascertained through measurements of individual label intensity and shape), and not the cumulative or combined optical intensity of the labels.
- the probe set described herein may comprise a binder.
- a method further comprises immobilizing a binder to a solid phase after the ligating steps.
- a method may further comprise isolating a ligated probe set from non-ligated probes.
- a binder comprises biotin, and a solid phase or substrate comprises a magnetic bead.
- the counting step described herein may further comprise calibrating, verifying, and/or confirming the counted numbers.
- Calibrating means checking and/or adjusting the accuracy of the counted number. Verifying and confirming herein mean determining whether the counted number is accurate or not, and/or how much the error is, if exists.
- intensity and/or single-to-noise is used as a method of identifying single labels. When dye molecules or other optical labels are in close proximity, they are often impossible to discriminate with fluorescence-based imaging due to the intrinsic limit of the diffraction of light. That is, two labels that are close together will be indistinguishable with no visible gap between them.
- One exemplary method for determining the number of labels at a given location is to examine the relative signal and/or signal-to-noise compared to locations known to have a single fluor.
- two or more labels will usually emit a brighter signal (and one that can more clearly be differentiated from the background) than will a single fluor.
- energy, relative signal, signal-to-noise, focus, sharpness, size, shape and/or other properties is used as a method of distinguishing single labels from particulate, punctate, discrete or granular background or other background signals or false signals that mimic or are similar to labels.
- false signals may be caused by particulate matter, for example, unlabeled molecules, differently labeled molecules, bleed through from other dyes, inorganic or organic particulate material, and/or stochastic effects such as noise, shot noise or other factors.
- Some exemplary methods for differentiating the label from particulate, punctate, discrete or granular background at a given location is to examine the energy, relative signal, signal-to-noise, focus, sharpness, size, or shape of putative labels on a substrate. Labels will usually emit a brighter (or dimmer) signal than will particulate, punctate, discrete or granular background.
- the counting step may comprise measuring optical signals from the immobilized labels, and calibrating the counted numbers by distinguishing an optical signal from a single label from the rest of the optical signals from background and/or multiple labels.
- the distinguishing comprises calculating a relative signal and/or single-to-noise intensity of the optical signal compared to an intensity of an optical signal from a single label.
- the distinguishing may further comprise determining whether the optical signal is from a single label.
- the optical signal is from a single label if the relative signal and/or single-to- noise intensity of an optical signal differs from an intensity of an optical signal from a single label by a predetermined amount or less.
- the predetermined amount is from 0% to 100%, from 0% to 150%, 10% to 200%, 0, 1, 2, 3, 4, 5, 10, 20, 30, or 40% or more, and/or 300, 200,
- different labels may have different blinking and bleaching properties. They may also have different excitation properties.
- the counting step and/or calibrating step may comprise optimizing (i) powers of light sources to excite the labels, (ii) types of the light sources, (ii) exposure times for the labels, and/or (iv) filter sets for the labels to match the optical signals from the labels, and measuring optical signals from the labels.
- the metric being optimized may vary. For example, it may be overall intensity, signal-to-noise, least background, lowest variance in intensity or any other characteristic.
- Bleaching profiles are often label specific and in certain embodiments may be used to add information for distinguishing label types.
- blinking behavior may be used as a method of identifying single labels.
- Many dye molecules are known to temporarily go into a dark state (e.g., Burnette et al., Proc. Natl. Acad. Sci. USA (2011) 108: 21081-21086). This produces a blinking effect, where a label will go through one or more steps of bright-dark-bright. The length and number of these dark periods may vary.
- the methods of the present disclosure use this blinking behavior to discriminate one label from two or more labels that may appear similar in diffraction limited imaging. If there are multiple labels present, it is unlikely the signal will completely disappear during the blinking. More likely is that the intensity will fall as one of the labels goes dark, but the others do not.
- the probability of all the labels blinking simultaneously may be calculated based on the specific blinking characteristics of a dye.
- the optical signals from the labels are measured for at least two time points, and an optical signal is from a single label if the intensity of the optical signal is reduced by a single step function.
- the two time points may be separated by from 0.1 to 30 minutes, from 1 second to 20 minutes, from 10 seconds to 10 minutes; 0.01, 0.1, 1, 2, 3, 4, 5, 10, 20, 30, 40, 50, 60 seconds or more; and/or 1 , 2, 3, 4, 5, 10, 20, 30, 40, 50, 60 seconds or less.
- an intensity of the optical signal from a single label has a single step decrease over time
- an intensity of the optical signal from two or more labels has multiple step decreases over time.
- the optical signals from the labels are measured for at least two time points and are normalized to bleaching profiles of the labels.
- the method described herein and/or the counting step may further comprises measuring an optical signal from a control label for at least two time points, and comparing the optical signal from the control label with the optical signals from the labels to determine an increase or decrease of the optical signal from the labels.
- the counting step further comprises confirming the counting by using a control molecule.
- a control molecule may be used to determine the change in frequency of a molecule type.
- the experimental goal is to determine the abundance of two or more types of molecules either in the absolute or in relation to one another.
- the null hypothesis is that they are at equal frequency, they may be enumerated on a single-molecule array and the ratio of the counts compared to the null hypothesis.
- the “single-molecule array” herein is defined as an array configured to detect a single molecule, including, for example, the arrays described in U.S. Patent Application Publication No. 2013/0172216.
- the ratio varies from 1:1, this implies they two molecules are at different frequencies. However, it may not be clear a priori whether one has increased abundance or the other has decreased abundance. If a third dye is used as a control molecule that should also be at equal frequency, this should have a 1:1 ratio with both the other dyes.
- a third dye is used as a control molecule that should also be at equal frequency, this should have a 1:1 ratio with both the other dyes.
- the ratio of the molecules labeled A and C is 1:1 and the ratio of molecules labeled B and C is 1:2, then it is likely that the molecule labeled with dye B has increased with frequency with respect to the molecule labeled with dye A.
- An example of this would be in determining DNA copy number changes in a diploid genome. It is important to know if one sequence is amplified or the other deleted and using a control molecule allows for this determination. Note the control may be another region of the genome or an artificial control sequence.
- results of a method described herein are confirmed using different labels but the same affinity tags used in the initial method. Such confirming may be performed simultaneously with the initial method or after performing the initial method.
- the confirming described herein comprises contacting first and second control probe sets to the genetic sample, wherein the first control probe set comprises a first control labeling probe and the first tagging probe, which is the same affinity tag of the first probe set described herein, and the second control probe set comprises a second control labeling probe and the second tagging probe, which is the same affinity tag of the second probe set described herein.
- the confirmation may further comprise hybridizing at least a part of the first and second control probe sets to the first and second nucleic acid regions of interest in nucleotide molecules of the genetic sample, respectively.
- the confirmation may further comprise ligating the first control probe set at least by ligating the first control labeling probe and the first tagging probe.
- the confirmation may further comprise ligating the second control probe set at least by ligating the second control labeling probe and the second tagging probe.
- the confirmation may further comprise amplifying the ligated probe sets.
- the confirmation may further comprise immobilizing each of the tagging probes to a pre- determined location on a substrate, wherein the first and second control labeling probes and/or the amplified labeling probes thereof ligated to the immobilized tagging probes comprise first and second control labels, respectively, the first and second control labels are different, and the immobilized labels are optically resolvable.
- the confirmation may further comprise measuring the optical signals from the control labels immobilized to the substrate.
- the confirmation may further comprise comparing the optical signals from the immobilized first and second control labels to the optical signals from the immobilized first and second labels to determine whether an error based on the labels exists.
- the first label and the second control label are the same, and the second label and the first control label are the same.
- the method herein may comprise calibrating and/or confirming the counted numbers by label swapping or dye swapping.
- the first nucleic acid region of interest is located in a first chromosome
- the second nucleic acid region of interest is located in a second chromosome, different from the first chromosome.
- the counting step may further comprise confirming the counting, wherein the confirming step comprises contacting first and second control probe sets to the genetic sample, wherein the first control probe set comprises a first control labeling probe and a first control tagging probe, and the second control probe set comprises a second control labeling probe and the second control tagging probe.
- the confirming step may further comprise hybridizing at least a part of the first and second control probe sets to first and second control regions located in the first and second chromosomes, respectively, wherein the first and second control regions are different from the first and second nucleic acid regions of interest.
- the confirming step may further comprise ligating the first and second control probe sets at least by ligating (i) the first control labeling and tagging probes, and (ii) the second control labeling and tagging probes.
- the confirming step may further comprise amplifying the ligated probe sets.
- the confirming step may further comprise immobilizing (i) the first probe set and the second control probe set to a first p re-determined location, and (ii) the second probe set and the first control probe set to a second pre-determined location.
- the first and second control labeling probes and/or the amplified labeling probes thereof ligated to the immobilized tagging probes comprise a first and second control labels, respectively, the first label and the second control label are different, the second label and the first control labels are different, the immobilized labels are optically resolvable, the immobilized first and second control tagging probes and/or the amplified tagging probes thereof comprise first and second control affinity tags, respectively, and the immobilizing step is performed by immobilizing the affinity tags to the predetermined locations.
- the confirming step may further comprise measuring the optical signals from the control labels immobilized to the substrate.
- the confirming step may further comprise comparing the optical signals from the immobilized control labels to the optical signals from the immobilized first and second labels to determine whether an error based on the nucleic acid region of interest exists.
- the first affinity tag and the second control affinity tag are the same, and the second affinity tag and the first control affinity tag are the same.
- the counting step of the method described herein may further comprise calibrating and/or confirming the counted numbers by (i) repeating some or all the steps of the methods (e.g., steps including the contacting, binding, hybridizing, ligating, amplifying, and/or immobilizing) described herein with a different probe set(s) configured to bind and/or hybridize to the same nucleotide and/or peptide region(s) of interest or a different region(s) in the same chromosome of interest, and (ii) averaging the counted numbers of labels in the probe sets bound and/or hybridized to the same a nucleotide and/or peptide region of interest or to the same chromosome of interest.
- steps of the methods e.g., steps including the contacting, binding, hybridizing, ligating, amplifying, and/or immobilizing
- a different probe set(s) configured to bind and/or hybridize to the same nucleotide and/or peptide
- the averaging step may be performed before the comparing step so that the averaged counted numbers of labels in a group of different probe sets that bind and/or hybridize to the same nucleotide and/or peptide region of interest are compared, instead of the counted numbers of the labels in the individual probe sets.
- the method described herein may further comprise calibrating and/or confirming the detection of the genetic variation by (i) repeating some or all the steps of the methods (e.g., steps including the contacting, binding, hybridizing, ligating, amplifying, immobilizing, and/or counting) described herein with different probe sets configured to bind and/or hybridize to control regions that does not have any known genetic variation, and (ii) averaging the counted numbers of labels in the probe sets bound and/or hybridized to the control regions.
- steps of the methods e.g., steps including the contacting, binding, hybridizing, ligating, amplifying, immobilizing, and/or counting
- the averaged numbers of the labels in the probe sets that bind and/or hybridize to control regions are compared to the numbers of the labels in the probe sets that bind and/or hybridized to the regions of interest described herein to confirm the genetic variation in the genetic sample.
- the steps of the calibrating and/or confirming may be repeated simultaneously with the initial steps, or after performing the initial steps.
- labels e.g., fluorescent dyes
- labels may be measured and/or identified based on their underlying spectral characteristics.
- Most fluorescent imaging systems include an option of collecting images in multiple spectral channels, controlled by the combination of light source and spectral excitation/emission/dichroic filters. This enables the same fluorescent species on a given sample to be interrogated with multiple different input light color bands as well as capturing desired output light color bands.
- excitation of a fluorophore is achieved by illuminating with a narrow spectral band aligned with the absorption maxima of that species (e.g., with a broadband LED or arc lamp and excitation filter to spectrally shape the output, or a spectrally homogenous laser), and the majority of the emission from the fluorophore is collected with a matched emission filter and a long-pass dichroic to differentiate excitation and emission.
- the unique identity of a fluorescent moiety may be confirmed through interrogation with various excitation colors and collected emission bands different from (or in addition to) the case for standard operation.
- the light from these various imaging configurations is collected and compared to calibration values for the fluorophores of interest.
- the experimental measurement matches the expected calibration/reference data for that fluorophore (triangles) but does not agree well with an alternate hypothesis (squares).
- a goodness- of-fit or chi-squared may be calculated for each hypothesis calibration spectrum, and the best fit selected, in an automated and robust fashion.
- probe products may be labeled with more than one type of fluorophore such that the spectral signature is more complex.
- probe products may always carry a universal fluor, e.g., Alexa647, and a locus-specific fluorophore, e.g., Alexa 555 for locus 1 and Alexa 594 for locus 2. Since contaminants will rarely carry yield the signature of two fluors, this may further increase the confidence of contamination rejection.
- Implementation would involve imaging in three or more channels in this example such that the presence or absence of each fluor may be ascertained, by the aforementioned goodness-of-fit method comparing test to reference, yielding calls of locus 1, locus 2 or not a locus product.
- spectral modifiers may also be used to increase spectral information and uniqueness, including FRET pairs that shift the color when in close proximity or other moieties.
- the array described herein may be used in conjunction with other methods of testing to improve its accuracy.
- phenotypic data about the patient e.g age, weight, BMI, disease states
- the array of this disclosure may be used directly with an assay (for example, an oligo- ligation assay, with the product being captured on the array) or with an independent assay that can be used to replicate, confirm or improve the results from the array.
- DNA sequencing, mass spectroscopy, genotyping, standard microarrays, karyotyping, PCR-based methods or other methods could be used as an orthogonal method and the data from these methods can be integrated with data from the array of this disclosure to provide a more accurate or less ambiguous result.
- the array as described herein may be used for screening, diagnosing, replicating, confirming, validating, excluding or monitoring a disease of condition, for example, for Down's Syndrome in a fetus.
- the assays and methods described herein may be performed on a single input sample simultaneously.
- the method may comprise verifying the presence of fetal genomic molecules at or above a minimum threshold as described herein, followed by a step of estimating the target copy number state if and only if that minimum threshold is met. Therefore, one may separately run an allele-specific assay on the input sample for performing fetal fraction calculation, and a genomic target assay for computing the copy number state.
- both assays and methods described herein may be carried out in parallel on the same sample at the same time in the same fluidic volume. Further quality control assays may also be carried out in parallel with the same universal assay processing steps.
- affinity tags, and/or tagging probes in the probe products, ligated probe set, or labeled molecule to be immobilized to a substrate may be uniquely designed for every assay and every assay product, all of the parallel assay products may be localized, imaged and quantitated at different physical locations on an imaging substrate.
- the same assay or method (or some of their steps) described herein using the same probes and/or detecting the same genetic variation or control may be performed on multiple samples simultaneously either in the same or different modules (e.g., testing tube) described herein.
- assays and methods (or some of their steps) described herein using different probes and/or detecting different genetic variations or controls may be performed on single or multiple sample(s) simultaneously either in the same or different modules (e.g., testing tube).
- image analysis may include image preprocessing, image segmentation to identify the labels, characterization of the label quality, filtering the population of detected labels based on quality, and performing statistical calculations depending on the nature of the image data.
- image preprocessing image segmentation to identify the labels
- characterization of the label quality filtering the population of detected labels based on quality
- performing statistical calculations depending on the nature of the image data.
- the fetal fraction may be computed.
- the genomic target assay and imaging the relative copy number state between two target genomic regions is computed.
- Analysis of the image data may occur in real-time on the same computer that is controlling the image acquisition, or on a networked computer, such that results from the analysis may be incorporated into the test workflow decision tree in near real-time.
- members of the array will be designed such that they are large enough that they encompass the field of view or size of the image being collected. That is, the entire image captured by the camera captures the area inside of a member. In some cases, >90%, >80%, >50%, 25% or >10% of the image will be of the area contained within a member.
- the size of the image is a function of the size of the camera sensor, the magnification and members of the optical path (e.g the field diaphragm).
- the entire sensor is filled with molecules (as opposed to the blank area outside of the members), so maximizing data collection and so sample throughput.
- Having members larger than the camera sensor will also reduce problems such as ringing or donating seen with spotted arrays.
- This method of selecting the magnification, member size, optical path and sensor size are in contrast to traditional microarrays where a single frame includes many members. This is possible for traditional arrays because each member is giving a single measurement. Conversely in a single molecule array, each member is giving thousands, tens of thousands or hundreds of thousands of measurements (with each measurement being the presence of a labeled molecule).
- the total number of fluors per member is known, then the total number of members needed to collect a given number of counts can be calculated. In one embodiment 2, 5, 10, 50, 100, 500 or 1000 members are produced on a single array. The number of flours counted per member depends on the density of the labeled molecules. Each member may contain on average, 100, 500, 1,000, 5,000, 10,000. 20,000, 50,000, 100,000 or more labeled molecules. The combination of members and labeled molecules per member leads to the total number of labeled molecules that can be counted. The total number of molecules can be used to calculate the sensitivity, specificity, positive predictive value, negative predictive value and other parameters or factors.
- the total number of molecules can be used to calculate the statistical power, the expected false positive and expected false negative rates. Ideally, 10,000, 100,000, 500,000, 1 ,000,000, 5,000,000, 10,000,000, 100,000,000 or more labeled molecules will be counted for each sample. These will be contained in 1 or more member. The molecules may be labeled with one of more labels. In prenatal testing, the molecules will be counted for each genomic region being tested. Statistical power for the test can be calculated using standard methods and tailored for the specific application (see for example Statistical Methods in Cancer Research - Volumes I & II, edited by Breslow & Day, IARC Scientific Publications).
- a single molecule array does not require sequencing or the mapping of sequences to the genome.
- the number of probes that need to be counted for the methods described herein may be so high that multiple substrates are needed to analyze a single sample. For example, if a coverslip (e.g 22mm x 22mm) is used, the number of molecules available for counting may not be enough to reach the desired sensitivity. In this case, either multiple coverslips or a larger format substrate will be needed. For prenatal testing, substrates of on average 10mm ⁇ 2, 100mm ⁇ 2, 1000mm ⁇ 2 or >1000mm ⁇ 2 may be used either individually or in combination.
- not every SNP probed in the allele-specific assay may result in useful information.
- the maternal genomic material may have heterozygous alleles for a given SNP (e.g., allele pair AB), and the fetal material may also be heterozygous at that site (e.g., AB), hence the fetal material is indistinguishable and calculation of the fetal fraction fails.
- Another SNP site for the same input sample may again show the maternal material to be heterozygous (e.g., AB) while the fetal material is homozygous (e.g., AA).
- the allele-specific assay may yield slightly more A counts than B counts due to the presence of the fetal DNA, from which the fetal fraction may be calculated.
- the SNP profile i.e., genotype
- multiple or numerous SNP sites should be designed such that nearly every possible sample will yield an informative SNP site.
- Each SNP site may be localized to a different physical location on the imaging substrate, for example by using a different affinity tag for each SNP.
- the fetal fraction may only be calculated successfully once.
- a single or multiple locations on the substrate used to interrogate SNPs may be imaged and analyzed (e.g., in groups of one, two, three, four, five, ten, twenty, fifty or less and/or one, two, three, four, five, ten, twenty, fifty or more) until an informative SNP is detected.
- determining the fetal fraction of a sample may aide other aspects of the system beyond terminating tests for which the portion of fetal fraction in a sample is inadequate.
- the fetal fraction is high (e.g., 20%) then for a given statistical power, the number of counts required per genetic target (e.g., chr21 ) will be lower; if the fetal fraction is low (e.g., 1%) then for the same statistical power, a very high number of counts is required per genomic target to reach the same statistical significance. Therefore, following (4-1 ) imaging of the fetal fraction region 1, (5-1) analysis of those data resulting in a required counting throughput per genomic target, (4-2) imaging of genomic target region 2 commences at the required throughput, followed by (5-2) analysis of those image data and the test result for genomic variation of the input targets.
- (4-1 ) imaging of the fetal fraction region 1 (5-1) analysis of those data resulting in a required counting throughput per genomic target
- (4-2) imaging of genomic target region 2 commences at the required throughput, followed by (5-2) analysis of those image data and the test result for genomic variation of the input targets.
- steps (4) and (5) of the test above may be repeated further for quality control purposes, including assessment of background levels of fluors on the imaging substrate, contaminating moieties, positive controls, or other causes of copy number variation beyond the immediate test (e.g., cancer in the mother or fetus, fetal chimerism, twinning).
- image analysis may be real-time, and does not require completion of the entire imaging run before generating results (unlike DNA sequencing methods), intermediate results may dictate next steps from a decision tree, and tailor the test for ideal performance on an individual sample.
- Quality control may also encompass verification that the sample is of acceptable quality and present, the imaging substrate is properly configured, that the assay product is present and/or at the correct concentration or density, that there is acceptable levels of contamination, that the imaging instrument is functional and that analysis is yielding proper results, all feeding into a final test report for review by the clinical team.
- the test above comprises one or more of the following steps: (1) receiving a requisition (from, for example, an ordering clinician or physician), (2) receiving a patient sample, (3) performing an assay (including a allele-specific portion, genomic target portion and quality controls) on that sample resulting in a assay-product-containing imaging substrate, (4-1) imaging the allele-specific region of the substrate in one or more spectral channels, (5-1) analyzing allele-specific image data to compute the fetal fraction, (pending sufficient fetal fraction) (4-2) imaging the genomic target region of the substrate in one or more spectral channels, (5-2) analyzing genomic target region image data to compute the copy number state of the genomic targets, (4-3) imaging the quality control region of the substrate in one or more spectral channels, (5-3) analyzing quality control image data to compute validate and verify the test, (6) performing statistical calculations, (7) creating and approving the clinical report, and (8) sending the report back to the ordering clinician or physician.
- an assay including a allele-specific portion, genomic target portion
- the methods of this disclosure require basic image processing operations and counting, measuring and assignment operations to be performed on the raw images that are obtained.
- the disclosure includes the adaptation and application of general methods including software and algorithms, known in the art for digital signal processing, counting, measuring and making assignments from the raw data. This includes Bayesian, heuristic, machine learning and knowledge- based methods.
- the power of primer extension and ligation can be combined in a technique called gap ligation (the processivity and discriminatory power of two enzymes are combined).
- a first and a second oligonucleotide are designed that hybridize in close proximity to the target but with a gap of preferably a single base.
- the last base of one of the oligonucleotides ends one base upstream or downstream of the polymorphic site. In cases where it ends downstream, the first level of discrimination is through hybridization.
- Another level of discrimination occurs through primer extension which extends the first oligonucleotide by one base.
- the extended first oligonucleotide now abuts the second oligonucleotide.
- the final level of discrimination occurs where the extended first oligonucleotide is ligated to the second oligonucleotide.
- the ligation and primer extension reactions described in c. and d. above can be performed simultaneously, with some molecules of the array giving results due to ligation and others giving results due to primer extension, within the same array member. This can increase confidence in the base call, being made independently by two assay/enzyme systems.
- the products of ligation may be differently labelled than the products of primer extension.
- the primer or ligation oligonucleotides may be designed on purpose to have mismatch base at a site other than the base that serves to interrogate the polymorphic site. This serves to reduce error as duplex with two mismatch bases is considerably less stable than a duplex with only one mismatch.
- probes that are fully or partially composed of LNA (which have improved binding characteristics and are compatible with enzymes) in the above-described enzymatic assays.
- the present disclosure provides a method for SNP typing which enables the potential of genomic SNP analysis to be realised in an acceptable timeframe and at affordable cost.
- the ability to type SNPs through single-molecule recognition intrinsically reduces errors due to inaccuracy and PCR-induced bias which are inherent in mass-analysis techniques.
- the sample is likely to be homozygous. If it is from both, in substantially a 1:1 ratio then the sample is likely to be heterozygous.
- the assays are based on single molecule counting, highly accurate allele frequencies can be determined when DNA pooling strategies are used. In these cases, the ratio of molecules might be 1:100. Similarly, a rare mutant allele in a background of the wild-type allele might be found to have ratio of molecules as 1:1000.
- Capture of singly resolvable DNA molecules is the basis for haplotype determination in the target by various means. This can be done either by analysing signals from the single foci containing the single DNA molecule or by linearizing the DNA and analysing the spatial arrangement of signal along the length of the DNA.
- Two or more polymorphic sites on the same DNA strand can be analysed. This may involve hybridization of oligonucleotides to the different sites, but each labelled with different fluorophores. As described, the enzymatic approaches can equally be applied to these additional sites on the captured single molecule.
- each probe in a biallelic probe set may be differentially labelled and these labels are distinct from the labels associated with probes for the second site.
- the assay readout may be by simultaneous readout, by splitting of the emission by wavelength obtained from the same foci or from a focal region defined by the 2-D radius of projection of a DNA target molecule immobilized at one end. This radius is defined by the distance between the site of immobilized probe and the second probe. If the probes from the first biallelic set are removed or their fluors photobleached then a second acquisition can be made with the second biallelic set which in this case do not need labels that are distinct from labels for the first biallelic set.
- haplotyping can be performed on single molecules captured on allele-specific microarrays.
- Haplotype information can be obtained for nearest neighbor SNPs by for example, determining the first SNP by spatially addressable allele specific probes (see Item A, Fig 75). The labelling is due to the allelic probes (which are provided in solution) for the second SNP.
- allelic probes which are provided in solution
- the allelic probes which are provided in solution
- foci color is detected within a SNP 1 allele specific spot determines the allele for the second SNP.
- spatial position of microarray spot determines the allele for the first SNP and then color of foci within the microarray spot determines the allele for the second SNP. If the captured molecule is long enough and the array probes are far enough apart then further SNP allele specific probe, each labelled with a different color can be resolved by co-localization of signal to the same foci.
- More extensive haplotypes, for three or more SNPs can be reconstructing from analysis of overlapping nearest neighbor SNP haplotypes or by further probing with differently labeled probes on the same molecule.
- probe products are in sequence-specific hybridization and ligation.
- the specificity of forming probe products occurs in the reaction vessel, prior to isolating or enriching for probe products, for example immobilization onto a surface or other solid substrate.
- This side-steps the challenge of standard surface-based hybridization (e.g., genomic microarray) in which specificity must be entirely achieved through hybridization only with long (>40bp) oligonucleotide sequences (e.g., Agilent and Affymetrix arrays).
- affinity tags allows probe products to be immobilized on a substrate and for excess unbound probes to be washed away or removed using suitable methods. Therefore, all or most of the labels on the surface are a part of a specifically formed probe product that is immobilized to the surface.
- One feature according to some embodiments is that the surface capture does not affect the accuracy. That is, it does not introduce any bias.
- the same affinity tag is used for probe sets from different genomic loci, with probe sets targeting each locus having a different label. Probe products from both genomic loci may be immobilized to the same location on the substrate using the same affinity tag. That is, in certain embodiments, probe products from Locus 1 and Locus 2 are captured with the same efficiency, so not introducing any locus specific bias.
- some or all of the unbound probes and/or target molecules are removed prior to surface capture using standard methods. This decreases interference between unbound probes and/or target molecules and the probe products during surface capture.
- the probe sets of the present disclosure may be configured to target known genetic variations associated with tumors. These may include mutations, SNPs, copy number variants (e.g., amplifications, deletions), copy neutral variants (e.g., inversions, translocations), and/or complex combinations of these variants.
- the known genetic variations associated with tumors include those listed in cancer.sanger.ac.uk/cancergenome/projects/cosmic; nature.com/ng/journal/v45/n10/full/ng.2760.
- B GENE p-value from corrected to FDR within peak; K Known frequently amplified oncogene or deleted TSG; p Putative cancer gene; E Epigenetic regulator; M Mitochondria-associated gene; ** lmmediately adjacent to peak region; T Adjacent to telomere or centromere of acrocentric chromosome. Additional known variations associated with cancers are provided in US Pat. no. 9,212,394 and International Pat. Application Pub. No. WO/2017/134191 , which can be detected by a method described herein.
- n R Count of probes labeled with Cy5 (red).
- n G Count of probes labeled with Cy3 (green).
- r Loci tag ratio: r n R /n G .
- f Fetal fraction.
- F The number of copies of the tested chromosome per diploid fetal cell.
- F 2: Euploid state of the tested fetal chromosome.
- F 3: Trisomy state of the tested fetal chromosome.
- L Bias due to probe lengths and sample-specific template fragment length distribution, as well as GC content.
- W(r, ⁇ , ⁇ 2 ) Approximate distribution of a ratio r of two Poisson random variables.
- the parameters ⁇ and ⁇ 2 represent the mean and the variance of r, respectively.
- H(x,x 0 ) Heaviside stepwise function that rises from zero to one when x reaches x 0 .
- G(x; ⁇ , ⁇ 2 ) Gaussian centered at ⁇ , with standard deviation s.
- E(x 0 ; ⁇ , ⁇ 2 ) Error function (the cumulative distribution of the Gaussian G(x; ⁇ , ⁇ 2 ) from - ⁇ up to X0).
- P E (r) Probability of observing loci tag ratio r, given that the fetus is euploid.
- Up-loci tags are the loci tags where Cy5 (red) labels come from the chromosome in question, while Cy3 (green) labels target another, reference chromosome.
- the tested chromosome contributes the numerator n R to the observed up-loci tag ratio r.
- Down-loci tags are the loci tags where Cy3 (green) labels come from the chromosome in question, while Cy5 (red) labels target another, reference chromosome.
- the tested chromosome contributes the denominator n G to the observed down-loci tag ratio r.
- U U D Set of all loci tags involving the tested chromosome labeled either with red Cy5 (numerator) or green Cy3 (denominator).
- statistical models may be used to formulate likelihood ratios.
- such models can make one or more assumptions. Examples of assumptions that can be incorporated into models are listed below:
- Each array element contains a single affinity tag.
- Each affinity tag is associated with two sets of probes, one of which targets loci on one chromosome, while the other targets a different chromosome.
- the two sets of probes are identified and quantified based on the two fluorophores, Cy3 (green) and Cy5 (red).
- One set of probes (associated with one chromosome) carries Cy3.
- the other set of probes carries Cy5.
- Probes' abundances on the array linearly reflect the amount of tested DNA (fetal and maternal) in the sample.
- Fetal fraction can be estimated with uncertainty within ⁇ 2.5%.
- the count of red Cy5 probes n R may be a random variable that approximately follows a Poisson distribution.
- the count of green Cy3 probes n G may also be distributed according to Poisson.
- the two Poisson distributions may have mean values (parameters ⁇ R and ⁇ G , respectively) that may be determined by the relative abundances of the two chromosomes in cfDNA, as well as the total coverage depth per sample, fraction of reads expected at the given element (e.g., for a given affinity tag), fetal fraction f , and the various biases B and L.
- the variances of the Poisson random variables n R and n G equal their mean values, which can be estimated as the observed count values, yielding the following expressions for the uncertainties in the probe counts:
- the following derivations can use the already existing distribution for the ratio of two Poisson variables.
- the likelihood ratio derivations may use an approximation W that may be adequate at sufficiently high per-locus depths (e.g., exceeding 100x).
- the approximation W is chosen as an example and does not in any way limit the generality of the model.
- the model can replace the approximate distribution W with more accurate expressions as needed.
- the approximate distribution W of the ratio r is a left-truncated and renormalized Gaussian centered at ⁇ , with parameter ⁇ 2 representing the variance of the untruncated Gaussian:
- H(r,0) represents the Heaviside function:
- Heaviside H(r,0) may not be needed since the support is non-negative. It may be included to emphasize the truncation at zero.
- G(r; ⁇ , ⁇ 2 ) is the Gaussian centered at ⁇ with variance ⁇ 2 :
- the purpose of dividing the truncated Gaussian G(r; ⁇ , ⁇ 2 ) with 1 - E(0, ⁇ , ⁇ 2 ) is to secure that W(r; ⁇ , ⁇ 2 ) satisfies the normalization condition:
- Variance of Loci Tag Ratios The variance ⁇ 2 of the ratio r can be approximately estimated using the perturbation method (expansion of the random variable into a Taylor series around ⁇ and truncation after the linear term):
- n R and n G may be correlated (since both are proportional to the overall depth per sample, as well as to the fraction of reads apportioned to their shared loci tag), we may neglect the cross-term and focus on individual contributions.
- extension to P2P1 -biased situation can be computed.
- both the variance and the mean of the loci tag ratio in a euploid sample may be independent of the fetal fraction.
- the probability distribution of loci tag ratios can be: [00230]
- r) that the fetus is euploid can be given by using the observed loci tag ratio rand using the same expression, with r and euploid status switching roles as condition and conditioned variable:
- bias B may be included as necessary.
- the likelihood L(7]r) that the fetus may be affected by trisomy given the observed loci tag ratio r may be given as:
- the trisomy scenario may make both mean and variance of loci tag ratios dependent on the fetal fraction, for example, up- and down-loci tags.
- loci tag ratios dependent on the fetal fraction
- up-loci tag mean and variance both increases, while down-loci tag mean and variance both decreases.
- variance may be inversely proportional to n G , which reflects (but does not equal) the per-loci tag coverage depth.
- Likelihood Ratio In an array with multiple loci tags, a chromosome to be tested may be selected. All up-loci tags (the loci tags where the tested chromosome contributes counts n R to the numerator) and down-loci tags (where the chromosome in question provides denominator counts n G ) may be identified. Rest of the loci tags may not be included in the analysis if they didn't contribute any information on the tested chromosome. The up-loci tags form the set U while the set D collects all down-loci tags for the given chromosome.
- the likelihood that the fetus may be euploid given the observed loci tag ratios is also the product of contributions from individual loci tags. In this case, up- and down-loci tags may not be distinguished from each other.
- the test statistic for detection of fetal trisomy may be given as the ratio between the alternative hypothesis likelihood L(7] ⁇ r ⁇ ) and the null-hypothesis likelihood L(E
- the following expression can be derived: [00244]
- the above expression may sum up a set of parabolas, two contributions (H 1 and H 0 ) per loci tag. A single parabola may further be derived.
- the parabola may be a sum of squared Mahalanobis distances, justifying the X 2 distribution for the null hypothesis.
- Classification The critical value for classification can be obtained from scaled X 2 distribution, using scaling factor of 2 and a desired Type I (false positive) error rate a. Note that the definition of the log likelihood ratio (Eq. 25) requires reversal of the sign of the test statistic, as the support for the X 2 distribution excludes negative values.
- Model Extensions The model can be extended in multiple ways. For example, in addition to diploid maternal state, the model can include maternal deletions and duplications. Some practical applications may require extension to non-negligible P2P1 bias ( B ⁇ 1 ). Correlations between n R and n G may need to be considered when estimating variances for euploid, up-loci tag trisomy, and down-loci tag trisomy variances ⁇ 2 .
- the variance expressions in trisomy cases may include contributions from fetal fraction f .
- the estimated value of f comes with an error bar 5f.
- the error can be about 1 %, 2%, 3%, 4%, 5% or more. In some cases, the error can be between 2% and 3%.
- marginalization over all admissible values of f may remove explicit dependence on the continuum of f -values, while leaving the central tendency and the spread of f in the expression for the distribution of r. Both approaches may yield similar results.
- the impact of 5f may need to be further characterized.
- the approximation W is used primarily for illustrative purposes and more accurate expressions for the distribution of the ratio may be used as mentioned elsewhere in the disclosure.
- the approach described here for whole chromosome aneuploidies can be applied with minimal modifications to enhance the detection of microdeletions/microduplications.
- the procedure disclosed herein may be applied to determine fetal sex and/or detection of fetal sex aneuploidies, for example. Similar expressions can also be used to estimate fetal fraction from chromosomes X and/or Y when the fetal karyotype is X, XXX, XY, XYY, OR XXY.
- fetal fraction fis determined using SNP allele counts its estimate can be used to enhance sex determination based on loci tags that involve sex chromosomes (X and Y).
- loci tags There are three main groups of such loci tags: XA (where the probes target ChrX and one of the autosomes A), YA (targeting ChrY and an autosome A), and XY (where one polarity targets ChrX and the other binds to ChrY).
- XA where the probes target ChrX and one of the autosomes A
- YA targeting ChrY and an autosome A
- XY where one polarity targets ChrX and the other binds to ChrY.
- there are two types of loci tags depending on whether X and/or Y is assigned polarity P1 (Cy3, green) or polarity P2 (Cy5, red).
- symbols a, x, and y refer to counts on the autosome, ChrX, or ChrY, respectively.
- Six types of ratios can be formed: x/a, a/x, y/a, a/y, x/y, and y/x, where the numerator is the P2 polarity (red, Cy5) and the denominator is P1 (green, Cy3). Because the expected ChrY count in female fetuses is zero, the reciprocal of x/y and a/y can be taken to avoid division by zero.
- Sex determination can incorporate sex chromosomal aneuploidies, such as Turner (female with single X chromosome), Triple X (female with three X chromosomes), Jacobs (male with one X and two Y chromosomes), and Klinefelter (male with one Y and two X chromosomes).
- sex chromosomal aneuploidies such as Turner (female with single X chromosome), Triple X (female with three X chromosomes), Jacobs (male with one X and two Y chromosomes), and Klinefelter (male with one Y and two X chromosomes).
- the different karyotypes (XX, X, XXX, XY, XYY, and XXY) and the different loci tag types (XA, YA, and XY, with both polarity assignments) may yield the following expectation values and variances for loci tag ratios:
- fetal fraction can be estimated using X and/or Y representation.
- X and/or Y representation We can take the expressions for likelihood listed above for karyotypes X, XXX, XY, XYY, and XXY and plug them into maximum likelihood estimation. Uncertainty can be estimated using Cramer-Rao bound.
- Loci tag fractions such as x/(x + a), y/(y + a), or y/(y + x) may be used.
- P1 may be dissociated from P2 and individual probe counts can directly be used.
- Poisson distributions can be used as building blocks for likelihoods, with the parameter ⁇ (the mean) absorbing per-sample depth, loci tag/polarity-specific fraction of sample reads, and the terms reflecting fetal fraction.
- ⁇ the mean
- ⁇ the mean
- the distribution of a trisomy count n for given loci tag and polarity would be P(n, N ⁇ ( 1 + f/ 2)), where P is the Poisson distribution, N is the total coverage depth for the given sample, f is the fraction of reads expected at the given loci tag/polarity, and f is the fetal fraction.
- the probe sets of the present disclosure may be configured to target known genetic variations associated with tumors. These may include mutations, SNPs, copy number variants (e.g., amplifications, deletions), copy neutral variants (e.g., inversions, translocations), and/or complex combinations of these variants.
- inversions that occur at known locations may easily be targeted by designing probes that at least partially overlap the breakpoint in one probe arm.
- a first probe that binds the “normal” sequence targets non-inverted genomic material and carries a first label type.
- a second probe that binds the “inverted” target carries a second label type.
- a common right probe arm binds native sequence that is not susceptible to inversion, immediately adjacent the first two probes. This right probe arm further carries a common pull-down affinity tag or binding that localizes the probe products to the same region of an imaging substrate. In this way, the probe pairs may hybridize to the genomic targets, ligate, and be imaged to yield relative counts of the two underlying species.
- translocations that have known breakpoints may also be assayed.
- Figure 68A shows two genetic elements that are either in their native order or translocated. Probe arms that at least partially overlap these translocation breakpoints allow differentiation between normal and transposed orders of genetic material. By choosing unique labels on the two left arms, the resulting ligated probe products may be distinguished and counted during imaging.
- copy neutral changes e.g., inversions, translocation
- methods for detecting copy neutral changes may also be used to detect germline variants in cancer or in other disease or conditions.
- left probe arms are designed to take advantage of an energetic imbalance caused by one or more mismatched SNPs. This causes one probe arm (carrying one label) to bind more favorably than a second probe arm (carrying a second type of label). Both designs ligate to the same right probe arm that carries the universal affinity tag.
- a given patient's blood may be probed by one method, or a hybrid of more than one method. Further, in some cases, customizing specific probes for a patient may be valuable. This would involve characterizing tumor features (SNPs, translocations, inversions, etc.) in a sample from the primary tumor (e.g., a biopsy) and creating one or more custom probe sets that is optimized to detect those patient-specific genetic variations in the patient's blood, providing a low-cost, non- invasive method for monitoring. This could have significant value in the case of relapse, where detecting low-level recurrence of a tumor type (identical or related to the original tumor) as early as possible is ideal.
- SNPs tumor features
- translocations e.g., translocations, inversions, etc.
- probes may be designed to monitor current status and progression “checkpoints,” and guide therapy options.
- the ALK translocation has been associated with lung cancer.
- a probe designed to interrogate the ALK translocation may be used to detect tumors of this type via a blood sample. This would be highly advantageous, as the standard method for detecting lung tumors is via a chest x-ray an expensive procedure that may be deleterious to the patient’s health and so is not standardly performed.
- Detection of recurrence of the primary tumor type For example, a HER2+ breast tumor is removed by surgery and the patient is in remission. A probe targeting the HER2 gene may be used to monitor for amplifications of the HER2 gene at one or more time points. If these are detected, the patient may have a second HER2+ tumor either at the primary site or elsewhere.
- Detection of non-primary tumor types For example, a HER2+ breast tumor is removed by surgery and the patient is in remission. A probe targeting the EGFR gene may be used to monitor for EGFR+ tumors. If these are detected, the patient may have a second EGFR+ tumor either at the primary site or elsewhere.
- Detection of metastasis For example, the patient has a HER2+ breast tumor.
- a probe designed to interrogate the ALK translocation may be used to detect tumors of this type via a blood sample. This tumor may not be in the breast and is more likely to be in the lung. If these are detected, the patient may have a metastatic tumor distal to the primary organ.
- a breast tumor may have one population of cells that are HER2+ and another population of cells that are EGFR+. Using probes designed to target both these variants would allow the identification of this underlying genetic heterogeneity.
- the quantity of tumor cfDNA may be measured and may be used to determine the size, growth rate, aggressiveness, stage, prognosis, diagnosis and other attributes of the tumor and the patient. Ideally, measurements are made at more than one time point to show changes in the quantity of tumor cfDNA.
- HER2+ breast tumor is treated with Herceptin.
- a probe targeting the HER2 gene may be used to monitor for quantity of tumor cfDNA, which may be a proxy for the size of the tumor. This may be used to determine if the tumor is changing in size and treatment may be modified to optimize the patient’s outcome. This may include changing the dose, stopping treatment, changing to another therapy, combing multiple therapies.
- Screening for tumor DNA There is currently no universal screen for cancer.
- the present disclosure offers a way to detect tumors at some or all locations in the body.
- a panel of probes is developed at a spacing of 100 kb across the genome. This panel may be used as a way to detect genetic variation across the genome.
- the panel detects copy number changes of a certain size across the genome. Such copy number changes are associated with tumor cells and so the test detects the presence of tumor cells.
- Different tumor types may produce different quantities of tumor cfDNA or may have variation in different parts of the genome. As such, the test may be able to identify which organ is affected. Further the quantity of tumor cfDNA measured may indicate the stage or size of the tumor or the location of the tumor. In this way, the test is a whole- genome screen for many or all tumor types.
- a threshold may be used to determine the presence or certainty of a tumor. Further, the test may be repeat on multiple sample or at multiple time points to increase the certainty of the results. The results may also be combined with other information or symptoms to provide more information or more certain information on the tumor.
- a method of determining a genetic variation of a nucleic acid region of interest in a genome of interest comprising:
- each of the first probability and the second probability of the first copy number hypothesis is a function of (i) an amount of a plurality of non-polymorphic reference loci in the genetic sample, and (ii) an amount of a plurality of non-polymorphic loci in the nucleic acid region of interest in the genetic sample
- the first probability of the first copy number hypothesis is further a function of a first likelihood distribution (f1) of a genetic fraction of genetic material derived from the first genome in the genetic sample relative to an amount of genetic material derived from the second genome in the genetic sample, wherein f1 is determined according to (i) and (ii), and the second probability of the first copy number hypothesis is further a function of a second likelihood distribution (f2) of the genetic fraction, wherein f2 is
- (C) determining a second metric representative of a joint probability of a second copy number hypothesis for the nucleic acid region of interest in the first genome by a process comprising: determining a first probability and a second probability of the second copy number hypothesis wherein, each of the first probability and a second probability of the second copy number hypothesis is a function of (i) and (ii), the first probability of the second copy number hypothesis is further a function of f1 , the second probability of the second copy number hypothesis is further a function of f2; and combining the first and the second probability of the second copy number hypothesis, thereby providing the second metric; and
- a method of determining a copy number of a nucleic acid region of interest in a genome of interest comprising:
- each of the first probability and the second probability of the first copy number hypothesis is a function of (i) an amount of a plurality of non-polymorphic reference loci in the genetic sample, and (ii) an amount of a plurality of non-polymorphic loci in the nucleic acid region of interest in the genetic sample
- the first probability of the first copy number hypothesis is further a function of a first likelihood distribution (f1) of a genetic fraction of genetic material derived from the first genome in the genetic sample relative to an amount of genetic material derived from the second genome in the genetic sample, wherein f1 is determined according to (i) and (ii), and the second probability of the first copy number hypothesis is further a function of a second likelihood distribution (f2) of the genetic fraction, wherein f2 is
- (C) determining a second metric representative of a joint probability of a second copy number hypothesis for the nucleic acid region of interest in the first genome by a process comprising: determining a first probability and a second probability of the second copy number hypothesis wherein, each of the first probability and a second probability of the second copy number hypothesis is a function of (i) and (ii), the first probability of the second copy number hypothesis is further a function of f1 , the second probability of the second copy number hypothesis is further a function of f2; and combining the first and the second probability of the second copy number hypothesis, thereby providing the second metric; and
- A1.3 The method of embodiment A1 or A1.1 , wherein the genetic sample is derived from a subject.
- A1.4 The method of any one of embodiments A1 to A1.3, wherein the genetic sample is obtained directly or indirectly from a subject.
- A2 The method of any one of embodiments A1 to A1.6, wherein the first genome is a genome of a fetus and the second genome is a genome of a mother of the fetus.
- A3 The method of any one of embodiments A1 to A1.6, wherein the first genome is a genome of a mother of a fetus and the second genome is a genome of the fetus.
- A5. The method of any one of embodiments A1 to A1.6, wherein the first genome is a genome of a cancer and the second genome is a genome of non-cancerous tissue.
- A5.1 The method of embodiment A5, wherein the subject has or is suspected of having a cancer.
- A5.2 The method of embodiment A5 or A5.1 , wherein the cancer comprises a tumor.
- A6 The method of any one of embodiments A1 to A1.6, wherein the first genome is a genome of a transplant and the second genome is a genome of transplant recipient.
- A6.1 The method of embodiment A6, wherein the subject is a transplant recipient.
- transplant comprises a transplanted organ or tissue.
- transplanted organ is selected from the group consisting of liver, kidney, heart, pancreas, intestine, lung and portions thereof.
- transplanted tissue is selected from the group consisting of skin, bone marrow, bone, heart valve, cornea, veins, and connective tissue.
- A7 The method of any one of embodiments A1 to A6.4, wherein the first genome is different than the second genome.
- A8 The method of any one of embodiments A1 to A7, wherein the genetic sample comprises a mixture of genetic material derived from the first genome and the second genome.
- A8.1 The method of any one of embodiments A1 to A8, wherein the genetic sample comprises nucleic acids.
- nucleic acids comprise DNA
- A8.3. The method of embodiment A8.2, wherein the DNA comprises genomic DNA.
- A8.4 The method of any one of embodiments A1 to A8.3, wherein the genetic sample or nucleic acids comprise cell-free DNA (cfDNA).
- cfDNA cell-free DNA
- A8.5 The method of any one of embodiments A1 to A8.4, wherein the genetic sample comprises nucleic acids derived from a fetus and nucleic acids derived from the mother of the fetus.
- A8.6 The method of any one of embodiments A1 to A8.4, wherein the genetic sample comprises nucleic acids derived from a cancer and nucleic acids derived from non-cancerous tissue.
- A8.7 The method of any one of embodiments A1 to A8.6, wherein the genetic sample is acellular or is derived from a sample that is substantially devoid of cells.
- A8.8. The method of any one of embodiments A1 to A8.6, wherein the genetic sample comprises cells or is derived from a sample comprising cells.
- A8.9. The method of any one of embodiments A1 to A8.8, wherein the genetic sample comprises, is derived from, or is isolated from, a bodily fluid or secretion.
- A8.10 The method of any one of embodiments A1 to A8.9, wherein the genetic sample comprises or is derived from a blood product.
- A8.11 The method of embodiment A8.10, wherein the blood product is selected from whole blood, plasma, serum, and buffy coat.
- A8.12 The method of any one of embodiments A1 to A8.11 , wherein the genetic sample is or is derived from a sample selected from the group consisting of whole blood, blood plasma, blood serum, buffy coat, lymph, urine, vaginal fluid, semen, cerebrospinal fluid, saliva, sweat, tears, amniotic fluid, bronchoalveolar lavage, breast milk, colostrum, the like and combinations thereof.
- A9 The method of any one of embodiments A1 to A8.12, wherein the reference loci each comprise a locus or region of a chromosome having a same number of copies in the first genome and the second genome.
- polymorphic alleles comprise single nucleotide polymorphisms (SNPs).
- non-polymorphic reference loci comprise a region or locus of an autosome being diploid in the first genome and diploid in the second genome.
- A12 The method of any one of embodiments A1 to A11 , wherein the first genome and the second genome is derived from a female subject and the non-polymorphic reference loci comprise a region or locus of an X chromosome being diploid in the first genome and diploid in the second genome.
- A14 The method of any one of embodiments A1 to A13, wherein the first copy number hypothesis is a hypothesis that the nucleic acid region of interest is an autosome being diploid in the first genome.
- A15 The method of any one of embodiments A1 to A13, wherein the first copy number hypothesis is a hypothesis that the nucleic acid region of interest is an X chromosome being monoploid or diploid in the first genome.
- A16 The method of any one of embodiments A1 to A13, wherein the first copy number hypothesis is a hypothesis that the nucleic acid region of interest is a Y chromosome being monoploid in the first genome.
- A16.1. The method of any one of embodiments A1 to A13, wherein the first copy number hypothesis is a hypothesis that the nucleic acid region of interest is a portion of an autosome having two copies present in the first genome.
- A16.2. The method of any one of embodiments A1 to A13, wherein the first copy number hypothesis is a hypothesis that the nucleic acid region of interest is a portion of a X chromosome having one or two copies present in the first genome.
- A16.3. The method of any one of embodiments A1 to A13, wherein the first copy number hypothesis is a hypothesis that the nucleic acid region of interest is a portion of a Y chromosome having one copy present in the first genome.
- A17. The method of any one of embodiments A1 to A16.3, wherein the second copy number hypothesis is a hypothesis that the nucleic acid region of interest is aneuploid in the first genome.
- A20 The method of any one of embodiments A1 to A17, wherein the second copy number hypothesis is a hypothesis that the nucleic acid region of interest is an X chromosome being absent, monoploid, diploid or triploid in the first genome.
- A21 The method of any one of embodiments A1 to A17, wherein the second copy number hypothesis is a hypothesis that the nucleic acid region of interest is a Y chromosome being absent, monoploid, diploid or triploid in the first genome.
- A22 The method of any one of embodiments A1 to A16.3, wherein the second copy number hypothesis is a hypothesis that the nucleic acid region of interest is a portion of an autosome having less than or more than two copies present in the first genome.
- nucleic acid region of interest is selected from a chromosome or a portion thereof, or a gene or portion thereof, [spec, add repetitive regions]
- A24 The method of any one of embodiments A1 to A23, wherein the first metric and/or the second metric comprises a likelihood or likelihood distribution.
- A24.1 The method of any one of embodiments A1 to A24, wherein the first metric and/or the second metric comprises a measure of certainty.
- A24.2 The method of any one of embodiments A1 to A24.1 , wherein the first metric and/or the second metric comprises a measure of error.
- A25 The method of any one of embodiments A1 to A 24.2, wherein the first or second probability of the first copy number hypothesis and/or the first or second probability of the second copy number hypothesis comprise a likelihood distribution.
- A26 The method of any one of embodiments A1 to A25, wherein the comparison comprises determining a ratio of the first metric to the second metric.
- A27 The method of any one of embodiments A1 to A26, wherein the combining of the first and the second probability of the first copy number hypothesis comprises multiplying the first and the second probabilities of the first copy number hypothesis.
- A28 The method of any one of embodiments A1 to A27, wherein the combining of the first and the second probability of the second copy number hypothesis comprises multiplying the first and the second probabilities of the second copy number hypothesis.
- A29 The method of any one of embodiments A1 to A28, wherein the combining of the first and the second probability of the first copy number hypothesis comprises determining a ratio of the first and the second probabilities of the first copy number hypothesis.
- A30 The method of any one of embodiments A1 to A29, wherein the combining of the first and the second probability of the second copy number hypothesis comprises determining a ratio of the first and the second probabilities of the second copy number hypothesis.
- A31 The method of any one of embodiments A1 to A30, wherein the comparison of the first metric and the second metric comprises determining which of the first or the second metric has the highest value.
- A34 The method of any one of embodiments A1 to A33, further comprising determining (i) the amount of the plurality of non-polymorphic reference loci in the genetic sample, and (ii) the amount of the plurality of non-polymorphic loci in the nucleic acid region of interest in the genetic sample.
- the first probe set comprises a first labeling probe and a first tagging probe comprising an affinity tag, wherein the first labeling probe hybridizes adjacent to the first tagging probe on a first non-polymorphic reference locus of the plurality of non-polymorphic reference loci, and
- the second probe set comprises a second labeling probe, and a second tagging probe comprising the affinity tag, wherein the second labeling probe hybridizes adjacent to the second tagging probe on a first non-polymorphic locus in the nucleic acid region of interest of the plurality of non-polymorphic loci in the nucleic acid region of interest; II.) ligating the first labeling probe to the first tagging probe thereby providing a first ligated probe set, and ligating the second labeling probe to the second tagging probe, thereby providing a second ligated probe set;
- the first ligated probe set is amplified using a first primer that hybridizes to a portion of the first labeling probe, or complement thereof, and comprises a first label, and a second primer that hybridizes to a portion of the first tagging probe, or complement thereof, wherein the first amplified probe set comprises the first label and the affinity tag, or a complement thereof, and
- the second ligated probe set is amplified using a third primer that hybridizes to a portion of the second labeling probe, or complement thereof, and comprises a second label, and the second primer, wherein the second primer hybridizes to a portion of the second tagging probe, wherein the second amplified probe set comprises the second label and the affinity tag, or a complement thereof, and the first and second labels are different; and
- the first probe set comprises a first labeling probe and a first tagging probe comprising an affinity tag, wherein the first labeling probe hybridizes adjacent to the first tagging probe at a first allele of an informative polymorphic locus of the plurality of non-polymorphic reference loci
- the second probe set comprises a second labeling probe, and the first tagging probe, wherein the second labeling probe hybridizes adjacent to the first tagging probe on a second allele of the informative polymorphic locus of the plurality of non-polymorphic reference loci;
- the first ligated probe set is amplified using a first primer that hybridizes to a portion of the first labeling probe, or complement thereof, and comprises a first label, and a second primer that hybridizes to a portion of the first tagging probe, or complement thereof, wherein the first amplified probe set comprises the first label and the affinity tag, or a complement thereof, and
- the second ligated probe set is amplified using a third primer that hybridizes to a portion of the second labeling probe, or complement thereof, and comprises a second label, and the second primer, wherein the second amplified probe set comprises the second label and the affinity tag, or a complement thereof, and the first and second labels are different;
- A44 The method of any one of embodiments A1 to A43, wherein (A), (B), (C) and/or (D) are implemented by a computer or require use of a computer.
- a non-transitory computer readable medium configured to carry out the method of any one of claims A1 to A44.
- a method of analyzing a genetic sample from a subject, said genetic sample containing a first genetic material and optionally having a second genetic material comprising: determining a fraction of the second genetic material in the genetic sample based on a first number and a second number, the first number and the second number obtained by: contacting first and second probe sets to the genetic sample, wherein the first probe set comprises a first labeling probe and a first tagging probe, and wherein the second probe set comprises a second labeling probe and a second tagging probe; hybridizing the first and second probe sets to first and second nucleic acid regions of interest in nucleotide molecules present in the genetic sample, respectively; labeling the first and second labeling probes with first and second labels, respectively; immobilizing the first and second probe sets to a substrate at a density in which the first and second labels of the first and second probe sets are optically resolvable after immobilization; and detecting:
- B8 The method of any one of embodiments B1-B7, further comprising determining a genetic variation in the genetic sample when the fraction exceeds a predetermined threshold.
- B9 The method of any one of embodiments B1-B8, wherein the one or more biomarkers are selected from the group consisting of a SNP, an indel, a microsatellite, a bi-allelic marker, a multi- allelic marker, a polymorphic marker, a polynucleotide repeat, a fragment size, a copy number variant, a methylation marker and combinations thereof.
- determining the genetic variation comprises performing an additional test selected from the group consisting of sequencing-bysynthesis, digital polymerase chain reaction, real-time quantitative polymerase chain reaction, array capture, a nucleic acid sequence-based detection, massively parallel genomic sequencing, digital arrays, single molecule arrays, single molecule counting, oligo-ligation assays and single molecule sequencing.
- determining the genetic variation comprises performing an additional test comprising a digital array.
- determining the genetic variation comprises performing an additional test comprising a single molecule array.
- determining the genetic variation comprises performing an additional test comprising single molecule counting.
- B38 The method of any one of embodiments B33-B37, wherein the additional test is performed only if the fraction subceeds a predetermined threshold.
- B39 The method of any one of embodiments B33-B38, wherein the additional genetic sample is collected only if the fraction subceeds a predetermined threshold.
- B40 The method of any one of embodiments B1-B39, wherein the genetic sample is selected from the group consisting of whole blood, blood plasma, blood serum, buffy coat, urine, vaginal fluid, fluid from a hydrocele (e.g., of the testis), vaginal flushing fluids, pleural fluid, ascitic fluid, cerebrospinal fluid, saliva, sweat, tears, sputum, bronchoalveolar lavage fluid, and discharge fluid from the nipple.
- B41 The method of any one of embodiments B1-B40, wherein the fraction of the second genetic material in the genetic sample is not determined by point estimation.
- a method of determining genetic variation in a genetic sample comprising: determining, using a computer system, a first metric corresponding to a measure of certainty of a null hypothesis that the genetic variation is absent in the genetic sample, wherein the first metric is a continuous function of a fraction of the second genetic material, and conditioned on the absence of the genetic variation in a first data set; determining, using a computer system, a second metric corresponding to a measure of certainty of an alternative hypothesis that the genetic variation is present in the genetic sample, wherein the second metric is a continuous function of the fraction of the second genetic material, and conditioned on the presence of the genetic variation in the first data set; determining, using a computer system, a relative number based on the first metric and the second metric; and determining, using a computer system, if the genetic variation is present in the genetic sample by comparing the relative number to a reference number.
- the first data set is obtained by: contacting a first probe set to the genetic sample, wherein the first probe set comprises a first labeling probe and a first tagging probe; hybridizing the first probe set to one or more first nucleic acid regions of interest in nucleotide molecules present in the genetic sample; labeling the first labeling probe with a first label; immobilizing the first probe set to a substrate at a density in which the first label is optically resolvable after immobilization; and detecting a number of the first labels corresponding to the first probe set immobilized to the substrate to detect the nucleic acid copy numbers of the one or more first nucleic acid regions of interest, thereby obtaining the first data set.
- C12 The method of any one of embodiments C1-C11 , wherein the genetic variation is selected from the group consisting of an aneuploidy, a copy number change, a deletion, an indel, an inversion, a monosomy, a mutation, a SNP, a translocation, and a trisomy.
- C13 The method of any one of embodiments C1-C12, wherein the Statistical Power in detecting the genetic variation is increased by at least 0.05, at least 0.1, at least 0.15, at least 0.2, at least 0.3, at least 0.4, at least 0.5, at least 0.6, at least 0.7, at least 0.8, at least 0.9, or at least 0.99 as compared to a method in which the fraction of the second genetic material is determined by point estimation.
- C14 The method of embodiment C13, wherein the increase in the Statistical Power is a result of maximizing the continuous function of the fraction of the second genetic material, as compared to using a point estimate of the fraction of the second genetic material from the first data set.
- C15 The method of any one of embodiments C1-C14, wherein the genetic sample is selected from the group consisting of whole blood, blood plasma, blood serum, buffy coat, urine, vaginal fluid, fluid from a hydrocele (e.g., of the testis), vaginal flushing fluids, pleural fluid, ascitic fluid, cerebrospinal fluid, saliva, sweat, tears, sputum, bronchoalveolar lavage fluid, and discharge fluid from the nipple.
- a hydrocele e.g., of the testis
- vaginal flushing fluids pleural fluid
- ascitic fluid cerebrospinal fluid
- saliva saliva
- sweat tears
- sputum bronchoalveolar lavage fluid
- discharge fluid from the nipple discharge fluid from the nipple.
- determining the genetic variation comprises performing an additional test selected from the group consisting of sequencing-bysynthesis, digital polymerase chain reaction, real-time quantitative polymerase chain reaction, array capture, a nucleic acid sequence-based detection, massively parallel genomic sequencing, digital arrays, single molecule arrays, single molecule counting, oligo-ligation assays and single molecule sequencing.
- determining the genetic variation comprises performing an additional test comprising a digital array.
- determining the genetic variation comprises performing an additional test comprising a single molecule array.
- determining the genetic variation comprises performing an additional test comprising single molecule counting.
- a method of determining genetic variation in a genetic sample said genetic sample containing a first genetic material and optionally having a second genetic material, the method comprising: determining, using a computer system, a first metric corresponding to a measure of certainty of a null hypothesis that the genetic variation is absent in the genetic sample, wherein the first metric is a continuous function of a fraction of the second genetic material and conditioned on the absence of the genetic variation in both a first data set and a second data set; determining, using a computer system, a second metric corresponding to a measure of certainty of an alternative hypothesis that the genetic variation is present in the genetic sample, wherein the second metric is a continuous function of the fraction of the second genetic material and conditioned on the presence of the genetic variation in at least one of the first data set and the second data set; determining, using a computer system, a relative number corresponding to
- D2 The method of embodiment D1 , further comprising determining the fraction of the second genetic material at which the difference or the ratio between the first and second metric is maximized.
- D3 The method of embodiment D1 or D2, wherein the first metric and the second metric are selected from the group consisting of probability and likelihood.
- D7 The method of any one of embodiments D1-D6, wherein the genetic variation is selected from the group consisting of an aneuploidy, a copy number change, a deletion, an indel, an inversion, a monosomy, a mutation, a SNP, a translocation, and a trisomy.
- D8 The method of any one of embodiments D1-D7, wherein the Statistical Power in detecting the genetic variation is increased by at least 0.05, at least 0.1, at least 0.15, at least 0.2, at least 0.3, at least 0.4, at least 0.5, at least 0.6, at least 0.7, at least 0.8, at least 0.9, or at least 0.99 as compared to a method in which the fraction of the second genetic material is determined by point estimation.
- any one of embodiments D1 -D9 wherein the genetic sample is selected from the group consisting of whole blood, blood plasma, blood serum, buffy coat, urine, vaginal fluid, fluid from a hydrocele (e.g., of the testis), vaginal flushing fluids, pleural fluid, ascitic fluid, cerebrospinal fluid, saliva, sweat, tears, sputum, bronchoalveolar lavage fluid, and discharge fluid from the nipple.
- a hydrocele e.g., of the testis
- determining the genetic variation comprises performing an additional test selected from the group consisting of sequencing-bysynthesis, digital polymerase chain reaction, real-time quantitative polymerase chain reaction, array capture, a nucleic acid sequence-based detection, massively parallel genomic sequencing, digital arrays, single molecule arrays, single molecule counting, oligo-ligation assays and single molecule sequencing.
- determining the genetic variation comprises performing an additional test comprising a digital array.
- determining the genetic variation comprises performing an additional test comprising a single molecule array.
- determining the genetic variation comprises performing an additional test comprising single molecule counting.
- a method for typing single nucleotide polymorphisms (SNPs) and mutations in nucleic acids comprising the steps of: a) providing a repertoire of probes complementary to one or more nucleic acids present in a sample, which nucleic acids may possess one or more polymorphisms; b) arraying said repertoire such that each probe in the repertoire is resolvable individually; c) exposing the sample to the repertoire and allowing nucleic acids present in the sample to hybridize to the probes at a desired stringency and optionally be processed by enzymes such that hybridized/processed nucleic acid/probe pairs are detectable; d) eluting the unhybridized nucleic acids from the repertoire and detecting individual hybridized/processed nucleic acid/probe pairs; e) analysing the signal derived from step (d) and computing the confidence in each detection event to generate a PASS table of high-confidence results; and f) displaying results from the PASS table to assign base calls and type poly
- step (e) involves analysing the signal from step (d) and computing in each detection event a FAIL table of low confidence results and using this table to inform primer and assay design.
- a non-transitory computer readable medium configured to carry out the method of any one of embodiments A1 to E6.
- (A) obtain counts or an amount of a pluraltiy of non-polymorphic reference loci in a genetic sample, obtain counts or an amount of a pluraltiy of non-polymorphic loci in a nucleic acid region of interest in the genetic sample, and obtain counts or an amount of a plurality of informative polymorphic alleles located at a plurality of reference loci in the genetic sample, wherein the genetic sample comprising genetic material derived from a first genome and genetic material derived from a second genome; (B) determine a first metric representative of a joint probability of a first copy number hypothesis for the nucleic acid region of interest in the first genome by a process comprising: determining a first probability and a second probability of the first copy number hypothesis wherein, each of the first probability and the second probability of the first copy number hypothesis is a function of (i) the counts or amount of the plurality of non-polymorphic reference loci in the genetic sample, and (ii) the counts or amount of the plurality of non-poly
- (C) determine a second metric representative of a joint probability of a second copy number hypothesis for the nucleic acid region of interest in the first genome by a process comprising: determining a first probability and a second probability of the second copy number hypothesis wherein, each of the first probability and a second probability of the second copy number hypothesis is a function of (i) and (ii), the first probability of the second copy number hypothesis is further a function of f1 , the second probability of the second copy number hypothesis is further a function of f2; and combining the first and the second probability of the second copy number hypothesis, thereby providing the second metric; and
- (D) determine the copy number of the nucleic acid region of interest in the first genome according to a comparison of the first metric and the second metric.
- H2 The non-transitory computer-readable storage medium of embodiment H1 , further configured to carry out any one of the embodiments of A1 to E6.
- nucleotide region refers to one, more than one, or mixtures of such regions
- an assay may include reference to equivalent steps and methods known to those skilled in the art, and so forth.
- substantially means, depending on the context used, that a small degree of error or difference in the referenced noun, item, characteristic, time, metric, method or description may exist (e.g., within a range of plus or minus 0 to 5%, 0 to 3%, or 0 to 1%).
- Arrays for single molecule detection of cell-free nucleic acid molecules are prepared according to the methods provided in the present disclosure, including Examples 2 and 3 below. Whole blood obtained from a pregnant subject is analyzed using a single molecule array as described herein to determine fetal fraction. Data is collected using a single molecule array, and the fetal fraction is determined.
- the fetal fraction is determined by contacting first and second probe sets to the whole blood sample, wherein the first probe set comprises a first labeling probe and a first tagging probe, and wherein the second probe set comprises a second labeling probe and a second tagging probe; hybridizing the first and second probe sets to first and second nucleic acid regions informative of the fetal fraction in nucleotide molecules present in the whole blood sample, respectively; labeling the first and second labeling probes with first and second labels, respectively; immobilizing the first and second probe sets to a substrate at a density in which the first and second labels of the first and second probe sets are optically resolvable after immobilization; and detecting: (i) a first number of the first label corresponding to a first subset of the first probe set immobilized to the substrate, and (ii) a second number of the second label corresponding to a second subset of the second probe set immobilized to the substrate to detect the nucleic acid copy numbers, wherein the probes of the first probe sets
- the fetal fraction is determined to be 5%, and to exceed a predetermined threshold of 2%; the fetal fraction is determined to be sufficient, and the cell-free nucleic acid molecules in the sample are sequenced to determine the presence of a genetic variation associated with Down Syndrome (e.g., Trisomy 21) in the fetus.
- a genetic variation associated with Down Syndrome e.g., Trisomy 21
- Arrays for single molecule detection of cell-free nucleic acid molecules are prepared according to the methods provided in the present disclosure, including Examples 3 through 5 below.
- Whole blood obtained from a pregnant subject is analyzed using a single molecule array as described herein to determine fetal fraction.
- Data is collected using a single molecule array, and the fetal fraction is determined.
- the fetal fraction is determined by contacting first and second probe sets to the whole blood sample, wherein the first probe set comprises a first labeling probe and a first tagging probe, and wherein the second probe set comprises a second labeling probe and a second tagging probe; hybridizing the first and second probe sets to first and second nucleic acid regions informative of the fetal fraction in nucleotide molecules present in the whole blood sample, respectively; labeling the first and second labeling probes with first and second labels, respectively; immobilizing the first and second probe sets to a substrate at a density in which the first and second labels of the first and second probe sets are optically resolvable after immobilization; and detecting: (i) a first number of the first label corresponding to a first subset of the first probe set immobilized to the substrate, and (ii) a second number of the second label corresponding to a second subset of the second probe set immobilized to the substrate to detect the nucleic acid copy numbers, wherein the probes of the first probe sets
- Cell-free DNA was extracted from a plasma sample using the cfPure Cell-Free DNA Extraction Kit (BioChain; Newark, CA; Cat. No. K5011610, K5011625) according to the User's Manual and Instructions (Doc. No. F-753-3UMRevC), which is incorporated by reference herein in its entirety. Briefly, plasma separated from whole blood samples collected from pregnant women at Planned Parenthood clinics by Advanced Bioscience Resources was treated with Proteinase K and lysed using cfPure Lysis/Binding Buffer and cfPure Magnetic Bead Solution.
- cell-free DNA was eluted from the sample by adding cfPure Elution Buffer to the sample, vortexing the sample, centrifuging the sample, and transferring the centrifuged sample to a magnetic rack.
- the magnetic beads were re-suspended, and a high molecular weight cut was performed accordingly to the following protocol.
- the 96-well plate was placed on a magnet and magnetized until clear, and the supernatant was discarded. The samples were washed twice with 200 ⁇ L fresh 75% EtOH. All traces of EtOH were removed using P20, and the beads were allowed to dry for 4 minutes.
- cfDNA was eluted by adding 13 ⁇ L of LTE buffer into one duplicate well per sample, and resuspending the beads. The resuspended beads were added to the duplicate well and resuspended. The sample were spun to pellet the beads, and the 96-well plate was placed on a magnet and magnetized until clear. The eluate was transferred into a new plate, and analysed by DNA quantitation and Bioanalyzer analysis.
- Table 4 shows data from Bioanalyzer analysis for four replicates of the HMW cut procedure on a sample (HMW Cut, Rep 1, Rep 2, Rep 3, and Rep 4) and data from Bioanalyzer analysis for the same sample without the HMW cut (Uncut, Control CTL).
- the results include the peak cell-free DNA concentration (cfDNA Peak, Cone. [pg/ ⁇ I]), the peak high molecular weight DNA concentration (HMW DNA Peak, Cone. [pg/ ⁇ I]), and the ratio of the peak cell-free DNA concentration to the peak high molecular weight DNA concentration (Ratio, cfDNA/HMW DNA).
- the following protocol describes the processing of up to 24 cell-free DNA samples through hybridization-ligation of one or more loci-specific probe sets (e.g., a probe set comprising a labeling probe and a tagging probe), purification, amplification, microarray preparation, microarray hybridization, microarray washing and counting. Additional embodiments and examples of hybridization-ligation of one or more loci-specific probe sets (e.g., a probe set comprising a labeling probe and a tagging probe), amplification of ligated probe sets, microarray preparation, microarray hybridization, microarray washing and counting are disclosed in US Pat. no. 9,212,394 and International Pat. Application Pub. No. WO/2017/134191.
- probe sets that can be used to identify non-polymorphic reference loci, non-polymorphic loci in a nucleic acid region of interest and polymorphic loci (e.g., alleles of SNPs) as described herein are also disclosed in US Pat. no. 9,212,394 and International Pat. Application Pub. No. WO/2017/134191.
- Cell-free DNA in a volume of 20 ⁇ L water
- Probe Mix mixture of all Tagging and Labeling probe oligonucleotides at a concentration of 2 nM each
- Tag Ligase 40 U/ ⁇ L
- Magnetic Beads MyOne Streptavidin C1 Dynabeads
- Bead Binding and Washing Buffer 1X and 2X concentrations
- Forward amplification primer 5’ phosphate modified
- Reverse amplification primer labeled
- AmpliTaq Gold Enzyme (5 U/ ⁇ L)
- dNTP Mix Lambda Exonuclease (5 U/ ⁇ L)
- Hybridization Buffer 1.25X
- Hybridization control oligonucleotides Microarray Wash Buffer A; Microarray Wash Buffer B; Microarray Wash Buffer C.
- Hybridization-ligation Reaction The cfDNA samples (20 ⁇ L) were added to wells A3-H3 of a 96-well reaction plate. The following reagents were added to each cfDNA sample for a total reaction volume of 50 ⁇ L, and mixed by pipetting up and down 5-8 times.
- Wash Dynabeads a vial of Dynabeads was vortexed at highest setting for 30 seconds. 260 ⁇ L beads were transferred to a 1.5 mL tube. 900 ⁇ L of 2X Bead Binding and Washing Buffer and mix beads were mixed by pipetting up and down 5-8 times. The tube was placed on a magnetic stand for 1 min, and the supernatant was discarded. The tube from the magnetic stand was removed and resuspended the washed magnetic beads in 900 ⁇ L of 2X Bead Binding and Washing Buffer by pipetting up and down 5-8 times. The tube was placed on the magnetic stand for 1 min and discard the supernatant.
- the plate was removed from the plate magnet, 200 ⁇ L 1X Bead Binding and Washing Buffer were added, and the beads were resuspended by pipetting up and down 5-8 times. The plate was placed on the plate magnet for 1 min, and the supernatant was discarded. The plate was removed from the plate magnet, 180 ⁇ L 1X SSC was added, and the beads were resuspended by pipetting up and down 5-8 times. The plate was placed on the plate magnet for 1 min, and the supernatant was discarded.
- Amplification The following reagents were added to each hybridization-ligation reaction product in the 96-well reaction plate for a total reaction volume of 50 ⁇ L.
- the plate was placed in a thermal cycler, and the probes were ligated using the following cycling profile: (i) 95 °C for 5 minutes; (ii) 95 °C for 30 seconds; (iii) 45 °C for 25 minutes; (iv) Repeat steps b to c 4 times; and (v) 4 °C hold.
- Hybridization-ligation Product Purification the reagents were mixed by pipetting up and down 5-8 times. The plate was placed in a thermal cycler, and the probes were amplified using the following cycling profile: (i) 95 °C for 5 minutes; (ii) 95 °C for 30 seconds; (iii) 54 °C for 30 seconds; (iv) 72 °C for 60 seconds, (v) Repeat steps b to d 29 times; (vi) 72 °C for 5 minutes; (vii) Repeat steps b to c 4 times; and (v) 4 °C hold.
- Microarray Target Preparation single strand digestion: the following reagents were added to each amplified reaction product in the 96-well reaction plate for a total reaction volume of 60 ⁇ L
- the reagents were mixed by pipetting up and down 5-8 times.
- the plate was placed in a thermal cycler, and the probes were digested using the following cycling profile: (i) 37 °C for 60 minutes; (ii) 80 °C for 30 minutes; (iii) 4 °C hold.
- the plate was placed in Speed-vac and dry down samples using medium heat setting for about 60 minutes or until all liquid has evaporated. Samples were stored at 4 °C in the dark until used in subsequent steps.
- Microarray hybridization the following reagents were added to each dried Microarray Target in the 96-well reaction plate for a total reaction volume of 20 ⁇ L.
- the reagents were mixed by pipetting up and down 10-20 times to be resuspended and were spun briefly to bring contents to the bottoms of the plate wells.
- the plate was placed in a thermal cycler, and the probes were denatured using the following cycling profile: (i) 70 °C for 3 minutes; (ii) 42 °C hold.
- the barcode of the microarray to be used was recorded for each sample in the Tracking Sheet.
- a hybridization chamber containing a Lifter Slip for each microarray to be processed is prepared.
- Microarray Target For each sample, 15 ⁇ L of Microarray Target was added to the center of a Lifter Slip in a hybridization chamber, and the appropriate microarray was immediately placed onto the target fluid by placing the top edge down onto the lifter slip and slowly letting it fall down flat.
- the hybridization chambers were closed and incubated them at 42 °C for 60 minutes.
- the hybridization chambers were opened, and each microarray was removed from the Lifter Slips and placed into a rack immersed in Microarray Wash Buffer A. Once all the microarrays were in the rack, the rack was stirred at 650 rpm for 5 minutes.
- the rack of microarrays was removed from Microarray Wash Buffer A, excess liquid on a clean room wipe was tapped off, and the rack were quickly placed into Microarray Wash Buffer B. The rack was stirred at 650 rpm for 5 minutes. The rack of microarrays was removed from Microarray Wash Buffer B, excess liquid was tapped off on a clean room wipe, and the rack was quickly placed into Microarray Wash Buffer C. The rack was stirred at 650 rpm for 5 minutes. Immediately upon completion of the 5 minute wash in Microarray Wash Buffer C, the rack of microarrays was slowly removed from the buffer. This took 5-10 seconds to maximize the sheeting of the wash buffer from the cover slip surface. Excess liquid was tapped off on a clean room wipe. A vacuum aspirator was used to remove any remaining buffer droplets present on either surface of each microarray. The microarrays were stored in a slide rack under nitrogen and in the dark until the microarrays were analyzed.
- cfDNA Cell-free DNA
- fetal fraction by size selection, for example, fragments of about 80-180 base pairs.
- the sample were categorized according to the fetuses carried by the pregnant females as shown below:
- Table 5 Three euploid female fetuses (a-c), three euploid male fetuses (d-f), one T21 female fetus (g), and two T21 male fetuses (h-i).
- Table 6 shows SNP IDs, SNP Loci Tag IDs, genomic locations, and population minor allele frequencies (MAF) for the selected SNP loci.
- Genomic coordinates correspond to GRCh38.
- MAF values were based on the 1,000 Genomes Project data.
- Tab e 7A shows SNP probe characteristics for the two representative SNP loci of Table 6, including loci tag ID, targeted allele (alternative or reference), loci tag type (SNP, as opposed to CNV, SEX-X, SEX-XY, or SEX-Y), left and right homology region sequences. *Primer binding sites and/or affinity tag portion of probes not shown.
- Table 8 shows the characteristics of a small representative number of CNV probe sets used to target the non-polymorphic autosomal loci on the reference chromosomes and chromosome of interest. These probes were used to quantify the abundance of the loci shown. Table 8 includes genomic locations where the CNV probes hybridize. Multiple loci were targeted on each chromosome. The following four affinity tags were used in the current example: T7321 (48 probe sets targeting Chr13 and 25 probe sets targeting Chr21), T5509 (48 probe sets targeting Chr21 and 25 probe sets targeting Chr13), T6793 (47 probe sets targeting Chr18 and 23 probe sets targeting Chr21), and T3223 (50 probe sets targeting Chr21 and 25 probe sets targeting Chr18). In this example, Chr13 and Chr18 were reference chromosomes and Chr21 was the nucleic acid region of interest.
- Table 8 CNV probe characteristics. Five representative probes shown per affinity tag.
- Table 9 Sequences of the homology regions of the CNV probes listed in Table 8.
- Table 10 shows SNP Allele counts and most likely maternal and fetal genotypes at selected SNP loci for the selected samples.
- N R (k) reference allele count
- N A (k) alternate allele count
- M(k) maternal genotype
- F(k) fetal genotype at locus k.
- Normalization ratio per loci tag (e.g., Chr21 :Reference Chromosome) was calculated for the reads mapping to the CNV probes for each sample. Loci tag ratios were normalized by multiplying each raw loci tag ratio per sample with normalization coefficients to reduce bias from the observed raw loci tag ratios. Table 11 shows results of such normalization.
- Fig. 17 shows a likelihood distribution profile for the genotype combinations RA.aa and RA.rr in the T21 male pregnancy sample i, at the locus tagged with tag T4239.
- Fig. 18 shows likelihood distribution profiles for the same genotype in the same sample at a different locus (tagged with tag T4424).
- Fig. 19 shows an example of the combination of all possible genotypes for a given locus as identified by the Tag associated with it in T21 pregnancy sample / ' .
- the overall SNP likelihood for T21 pregnancy sample / was obtained by combining likelihood distribution profiles derived from data measured on both SNP loci T4239 and T4424 as shown in Fig. 20.
- CNV tag ratio likelihood profiles corresponding to a euploid fetus (the null hypothesis) and to a T21 fetus (the alternate hypothesis), derived from the data were determined for the T21 male pregnancy / (Fig. 21).
- the CNV tag ratio likelihood profiles shown in Fig. 21 were combined with the overall SNP likelihood profiles shown in Figure 20.
- the sample was correctly classified as T21 as shown in Fig. 22.
- Figs. 23A-23B show the likelihood profile for the specific genotype combinations in the euploid pregnancy sample c at the locus tagged with tag T4239 (Fig. 23A) and T4424 (Fig. 23B).
- Figs. 24A and 24B show the combined SNP likelihood distributions for the euploid sample c, obtained by combining likelihood profiles derived from data measured on both SNP loci T4239 (Fig. 24A) and T4424 (Fig. 24B) for all genotypes.
- Fig. 25 shows the combined SNP likelihood distributions for the euploid sample c, obtained by combining likelihood profiles derived from all SNP loci.
- Inputs SNP probe counts, population MAF, SNP correction coefficients. Procedure starts by initializing SNP likelihood to 0. Next: SNP loop over all input loci:
- SNP Step 6 Evaluate alternate allele frequency from the trial fetal fraction values by applying function that is appropriate for the current genotype scenario.
- SNP Step 9 List likelihood values ( b distribution with shape parameters N A + 1 and N R + 1).
- SNP Step 10 Print the contribution, which is composed of the population prior from SNP step 8 and the likelihood from SNP step 9.
- CNV Step 1 Loop over hypotheses. For this example, only two hypotheses are tested: Euploid and T21. In a real workflow, multiple hypotheses can be tested, including Male/Female fetal sex and Euploid/T13/T18/T21.
- Step 4 evaluate total likelihood by combining SNP likelihood and CN likelihood for the current hypothesis.
- Step 5 - identify the trial fetal fraction index at which total likelihood for the currently tested hypothesis reaches its maximum.
- Step 6 list the maximal value of joint logLikelihood for the currently tested hypothesis.
- Step 7 list fetal fraction value at which total likelihood for the currently tested hypothesis reaches its maximum.
- TagRatio Step 2 Looping over all copy number tags.
- TagRatio Step 3 Get denominator count.
- call function getLogLikelihoodSingleTag() which takes the observed tag ratio, the denominator count, and the residual error and evaluates contribution from the current tag. This step is detailed in the next section (Single Copy Number Tag Ratio Log Likelihood Evaluation Steps).
- TagRatio Step 5 list the contribution from the current copy number tag.
- TagRatio Step 6 add the contribution from the current tag to the overall copy number log likelihood.
- Expressions for width are also listed in the output. The expressions relevant for this example include euploid width trisomy width is and reciprocal trisomy width is where N D is the denominator count (p1 depth in the case of CNV and SEX-X tags). Additional expressions are used in actual data that include Y tags and possible monosomy (as in ChrX).
- the truncated Gaussian is the Gaussian centered at mu, having width width, rescaled by dividing with 1 - cumulative function from negative infinity to zero (to account for the requirement that tag ratios are non-negative).
Abstract
Methods are described herein with improved statistical power, precision and accuracy for detecting a genetic variation in a genetic sample from a subject comprising genetic material derived from different sources or genomes.
Description
METHODS FOR DETERMINING A GENETIC VARIATION
Related Patent Applications
[0001] This patent application claims the benefit of U.S. Provisional Patent Application No. 63/029,163 filed on May 22, 2020, entitled METHODS FOR DETERMINING A GENETIC VARIATION, naming Hywel Bowden Jones, Andrea Lynn McEvoy, Adrian Nielsen Fehr and Patrick James Collins as inventors, and designated by Attorney Docket No. 031753-5011-PR. The entire content of the foregoing patent application is incorporated herein by reference, including all text, tables and drawings.
Field
[0002] The technology relates to, in part, methods and processes of detecting a genetic variation in a genetic sample comprising genetic material derived from different sources or different genomes. The technology also relates to, in part, computer implemented methods for analyzing genetic data to detect genetic variations such as chromosomal aneuploidies and copy number variations with higher accuracy, precision and/or confidence. The methods provided herein provide a significant improvement in the technical field of genetic analysis.
Background
[0003] Traditional sequence-based methods of detecting copy number variations can be used to detect certain chromosomal differences in a fetus of a pregnant female, in a cancer or in a transplanted organ, which sometimes utilize samples obtained by non-invasive methods. However, such traditional sequence-based methods can be costly and therefore not readily available to low- income individuals, the uninsured and populations in third-world countries. Presented herein are improved methods of detecting and/or identifying genetic differences or genetic abnormalities in a patient with high accuracy, confidence and/or precision, which methods are less expensive than traditional approaches.
Summary
[0004] Presented herein in certain aspects is a method of determining a copy number of a nucleic acid region of interest in a genome of interest. In some aspects the method comprising (A) providing a genetic sample comprising genetic material derived from a first genome and genetic material derived from a second genome, (B) determining a first metric representative of a joint probability of a first copy number hypothesis for a nucleic acid region of interest in the first genome by a process
comprising determining a first probability and a second probability of the first copy number hypothesis where each of the first probability and the second probability of the first copy number hypothesis is a function of (i) an amount of a plurality of non-polymorphic reference loci in the genetic sample, and (ii) an amount of a plurality of non-polymorphic loci in the nucleic acid region of interest in the genetic sample, the first probability of the first copy number hypothesis is further a function of a first likelihood distribution (f1 ) of a genetic fraction of genetic material derived from the first genome in the genetic sample relative to an amount of genetic material derived from the second genome in the genetic sample, where f1 is determined according to (i) and (ii), and the second probability of the first copy number hypothesis is further a function of a second likelihood distribution (f2) of the genetic fraction, where f2 is determined according to a plurality of informative polymorphic alleles located at a plurality of reference loci in the genetic sample; and combining the first and the second probability of the first copy number hypothesis, thereby providing the first metric; (C) determining a second metric representative of a joint probability of a second copy number hypothesis for the nucleic acid region of interest in the first genome by a process comprising determining a first probability and a second probability of the second copy number hypothesis where, each of the first probability and a second probability of the second copy number hypothesis is a function of (i) and (ii), the first probability of the second copy number hypothesis is further a function of f1 , the second probability of the second copy number hypothesis is further a function of f2; and combining the first and the second probability of the second copy number hypothesis, thereby providing the second metric; and (D) determining the copy number of the nucleic acid region of interest in the first genome according to a comparison of the first metric and the second metric.
[0005] In some embodiments the method comprises determining (i) the amount of the plurality of non- polymorphic reference loci in the genetic sample, and (ii) the amount of the plurality of non- polymorphic loci in the nucleic acid region of interest in the genetic sample. In some embodiments, the amounts of (i) or (ii) are determined by a process comprising: I.) contacting at least a first and a second probe set to the genetic sample, where (1) the first probe set comprises a first labeling probe and a first tagging probe comprising an affinity tag, where the first labeling probe hybridizes adjacent to the first tagging probe on a first locus, and (2) the second probe set comprises a second labeling probe, and a second tagging probe comprising the affinity tag, where the second labeling probe hybridizes adjacent to the second tagging probe on a second locus; II.) ligating the first labeling probe to the first tagging probe thereby providing a first ligated probe set, and ligating the second labeling probe to the second tagging probe, thereby providing a second ligated probe set; III.) amplifying the first and second ligated probe sets to form first and second amplified ligated probe sets, respectively, where, (1) the first ligated probe set is amplified using a first primer that hybridizes to a portion of the
first labeling probe, or complement thereof, and comprises a first label, and a second primer that hybridizes to a portion of the first tagging probe, or complement thereof, where the first amplified probe set comprises the first label and the affinity tag, or a complement thereof, and (2) the second ligated probe set is amplified using a third primer that hybridizes to a portion of the second labeling probe, or complement thereof, and comprises a second label, and the second primer, where the second primer hybridizes to a portion of the second tagging probe, where the second amplified probe set comprises the second label and the affinity tag, or a complement thereof, and the first and second labels are different; and IV.) immobilizing the affinity tag or a complement thereof, of the first and second amplified ligated probe sets to a member of an array having a pre-defined location on the array; and V.) determining a first count of the first label immobilized on the member of the array, and determining a second count of the second label immobilized on the member of the array, where each of the first and the second labels are individually optically resolvable on the member of the array, thereby providing the amount of (i) or (ii). In some embodiments, f2 is determined by a process comprising: I.) contacting at least a first and a second probe set to the genetic sample, where (1) the first probe set comprises a first labeling probe and a first tagging probe comprising an affinity tag, where the first labeling probe hybridizes adjacent to the first tagging probe at a first allele of an informative polymorphic locus of the plurality of non-polymorphic reference loci, and (2) the second probe set comprises a second labeling probe, and the first tagging probe, where the second labeling probe hybridizes adjacent to the first tagging probe on a second allele of the informative polymorphic locus of the plurality of non-polymorphic reference loci; II.) ligating the first labeling probe to the first tagging probe thereby providing a first ligated probe set, and ligating the second labeling probe to the first tagging probe, thereby providing a second ligated probe set; III.) amplifying the first and second ligated probe sets to form first and second amplified ligated probe sets, respectively, where, (1 ) the first ligated probe set is amplified using a first primer that hybridizes to a portion of the first labeling probe, or complement thereof, and comprises a first label, and a second primer that hybridizes to a portion of the first tagging probe, or complement thereof, where the first amplified probe set comprises the first label and the affinity tag, or a complement thereof, and (2) the second ligated probe set is amplified using a third primer that hybridizes to a portion of the second labeling probe, or complement thereof, and comprises a second label, and the second primer, where the second amplified probe set comprises the second label and the affinity tag, or a complement thereof, and the first and second labels are different; and IV.) immobilizing the affinity tag or a complement thereof, of the first and second amplified ligated probe sets to a member of an array having a pre-defined location on the array; V.) determining a first count of the first label immobilized on the member of the array, and
determining a second count of the second label immobilized on the member of the array, where each of the first and the second labels are individually optically resolvable on the member of the array. [0006] In some aspects, presented herein is a non-transitory computer readable medium configured to carry out the methods described herein.
[0007] In some aspects, presented herein is a method of analyzing a genetic sample from a subject, said genetic sample containing a first genetic material and optionally having a second genetic material, the method comprising: determining a fraction of the second genetic material in the genetic sample based on a first number and a second number, the first number and the second number obtained by: contacting first and second probe sets to the genetic sample, where the first probe set comprises a first labeling probe and a first tagging probe, and where the second probe set comprises a second labeling probe and a second tagging probe; hybridizing the first and second probe sets to first and second nucleic acid regions of interest in nucleotide molecules present in the genetic sample, respectively; labeling the first and second labeling probes with first and second labels, respectively; immobilizing the first and second probe sets to a substrate at a density in which the first and second labels of the first and second probe sets are optically resolvable after immobilization; and detecting: (i) a first number of the first label corresponding to a first subset of the first probe set immobilized to the substrate, and (ii) a second number of the second label corresponding to a second subset of the second probe set immobilized to the substrate to detect the nucleic acid copy numbers, where the probes of the first subset and the second subset hybridize to the first and the second nucleic acid regions of interest, respectively, that contain one or more biomarkers informative of the fraction of the second genetic material in the genetic sample. In some embodiments, the genetic material from the first genetic material comprises maternal genetic material from the subject, and the second genetic material comprises fetal genetic material from a fetus, and where a ratio of the first number and the second number corresponds to a measure of the fetal fraction. In some embodiments, the first and the second probe sets are allele-specific. In some embodiments, a genetic variation in detected in the genetic sample when the fraction exceeds a predetermined threshold.
[0008] In some aspects, presented herein is a method of determining genetic variation in a genetic sample, said genetic sample containing a first genetic material and optionally having a second genetic material, the method comprising: determining, using a computer system, a first metric corresponding to a measure of certainty of a null hypothesis that the genetic variation is absent in the genetic sample, where the first metric is a continuous function of a fraction of the second genetic material, and conditioned on the absence of the genetic variation in a first data set; determining, using a computer system, a second metric corresponding to a measure of certainty of an alternative hypothesis that the genetic variation is present in the genetic sample, where the second metric is a continuous function of
the fraction of the second genetic material, and conditioned on the presence of the genetic variation in the first data set; determining, using a computer system, a relative number based on the first metric and the second metric; and determining, using a computer system, if the genetic variation is present in the genetic sample by comparing the relative number to a reference number.
Brief Description of the Drawings
[0009] Fig. 1 shows two exemplary probe sets each comprising a tagging probe and a labeling probe. The top probe set targets a first locus (e.g., locus 1 , e.g., in a region of interest) and the bottom probe set targets a second different locus (e.g., locus 2, e.g., a reference locus). The tagging probe of locus 1 comprises a forward primer binding site (1), an affinity tag (2), and a target specific portion (3). The labeling probe of locus 1 comprises a target specific portion (4) and a reverse primer binding site (5). The tagging probe of locus 2 comprises a forward primer binding site (6), an affinity tag (7), and a target specific portion (8). The labeling probe of locus 2 comprises a target specific portion (9) and a reverse primer binding site (10). In some embodiments, the affinity tags (2) and (3) are the same, and in some embodiments, the primer binding sites (1) and (6) are the same. The reverse primer binding sites (5) and (10) may be different in certain embodiments, to allows differential labeling of a first amplification product of a ligated probe set of locus 1 and a second amplification product of a ligated probe set of locus 2.
[0010] Fig. 2 shows and exemplary workflow using the probe set for locus 1 as described in Fig. 1. The tagging probe comprises primer binding site (1), affinity tag (2) and target specific portion (3), and the labeling probe comprises target specific portion (4) and primer binding site (5). The probe set is contacted with a sample comprising cell-free DNA in Step 1. In this example, target specific portion (3) of the tagging probe hybridizes to locus 1 immediately adjacent to target specific portion (4) of the labeling probe as shown in Step 2. The tagging probe is ligated to the labeling probe by addition of a ligase in Step 3. The ligated probe set is amplified by PCR in Step 4 where the reverse primer comprises a fluorescent label (circle) and hybridizes to primer binding site (5), thereby providing a plurality of labeled amplicons as shown in Step 5. Step 6 is optional and shows degradation of the non-labeled amplicon using a lambda exonuclease. The labeled amplicon is protected from exonuclease digest because of the label attached to the 5'-end of the labeled amplicon. The final labeled target comprises a complement of the affinity tag (2) which hybridizes to a capture probe immobilized on a microarray, thereby immobilizing the labeled amplicon at a predefined location on the array, as shown in Step 7. The fluorescent labels, each representing a single amplicon can now be counted on the microarray by digital imaging, for example.
[0011] Fig. 3A shows two different types of amplified ligated probe products generated by the workflow of Fig. 2, where a first probe set hybridized to a first locus (e.g., a region of interest, e.g., chromosome 21), and a second probe set hybridized to a second locus (e.g., a reference locus, e.g., chromosome 15). In this example, both types of amplified ligated probe sets comprise the same affinity tag, and therefore are immobilized at the same spot or element of the microarray shown in Fig. 3B. In this example, the reverse primer used to amplify the first ligated probe set comprises a red fluorescent label (Locus 1 Product) and the reverse primer used to amplify the second ligated probe set comprises a green fluorescent label (Locus 2 product). Each labeled amplicon is optically resolvable on the array, and therefore individual amplicons for each locus can be counted. In some embodiments, red labels can be filtered out so that the green labels can be counted, and vice versa. [0012] Fig. 4A shows a digital image of an element on a microarray filtered to show green fluorescent labels of a plurality of amplified ligated probe sets configured to detect locus 2. Fig. 4B shows a magnified portion of the image of Fig 4A demonstrating that each of the green fluorescent labels are optically resolvable, each representing a single amplicon.
[0013] Fig. 5A shows a digital image of the same element on the microarray as shown in Fig. 4A except the image of Fig. 5A is filtered to show red fluorescent labels of a plurality of amplified ligated probe sets configured to detect locus 1. Fig. 5B shows a magnified portion of the image of Fig 5A demonstrating that each of the red fluorescent labels are optically resolvable, each representing a single amplicon.
[0014] Fig. 6 shows a diagram of components of an exemplary microarray on substrate 1 having multiple addressable elements (e.g., 3 and 4) spaced by distance "n". A digital image of element (8) is shown as image (12).
[0015] Fig. 7 shows two exemplary probe sets, one probe set for Locus 1 (top) and one probe set for Locus 2 (bottom). A first probe set (top) comprises member probes 101 , 102, 103. Item 101 contains label (100) type “A.” Item 103 contains an affinity tag (104). A second probe set (bottom) with member probes 108, 109, 110 carries respective features as in the first probe set. However, 108 contains a label (107) of type “B,” distinguishable from type “A.” Items 110 contains an affinity tag (111). For each probe set, the three probes (e.g., 101, 102, 103) are hybridized to the target molecule (105) such there are no gaps in between the probes on the target molecule.
[0016] Fig. 8 shows a modification of the probe sets in Fig. 7. Fig. 8 depicts two probe sets, one probe set for Locus 1 (top) and one probe set for Locus 2 (bottom) were 207 and 214 are target molecules corresponding to Locus 1 and Locus 2, respectively. A first probe set (top) comprises member probes 202, 204, 206. 202 contains a label (201) of type “A.” 206 contains an affinity tag (205). A second probe set (bottom) with member probes 209, 211 , 231 carries respective features as
in the first probe set. However, 209 contains a label (208) of type “B,” distinguishable from type “A.” 213 contains an affinity tag (212). In this embodiment, the probes 204 and 211 may contain one or more labels (203, 210) of type “C.”
[0017] Fig. 9 shows a modification of the probe sets in Fig. 7. Fig. 9 depicts two probe sets, one probe set for Locus 1 (top) and one probe set for Locus 2 (bottom). 307 and 314 are target molecules corresponding to Locus 1 and Locus 2, respectively. A first probe set (top) contains member probes 302, 303, 305. 302 contains a label (301 ) of type “A.” 305 contains an affinity tag (306). A second probe set (bottom) comprises member probes 309, 310, 312. 309 contains a label (308) of type “B,” distinguishable from type “A.” 312 contains an affinity tag (313). In this embodiment, the probes 305 and 312 contain one or more labels (304, 311) of type “C.”
[0018] Fig. 10 shows a modification of the probe sets in Fig. 7. 407 and 414 are target molecules corresponding to Locus 1 and Locus 2, respectively. A first probe set (top) contains member probes 402, 405. 402 contains a label (401) of type “A.” 405 contains an affinity tag (406). A second probe set (bottom) with member probes 409, 412 carries respective features as in the first probe set. 409 contains a label (408) of type “B,” distinguishable from type “A.” 412 contains an affinity tag (413). In this embodiment, probes 402 and 405 hybridize to sequences corresponding to Locus 1 , but there is a “gap” on the target molecule having one or more nucleotides between hybridized probes 402 and 405. In this embodiment, a DNA polymerase or other enzyme may be used to synthesize a new polynucleotide species (404) that covalently joins 402 and 405. 404 may contain one or more labels of type “C”.
[0019] Fig. 11 shows a modification of the probe sets in Fig. 7. 505 and 510 are target molecules corresponding to Locus 1 and Locus 2, respectively. A first probe sets contains member probes 502, 503. 502 contains a label (501 ) of type “A.” 503 contains an affinity tag (504). A second probe set comprises member probes 507 and 508. 507 contains a label (506) of type “B,” distinguishable from type “A.” 508 contains an affinity tag (509).
[0020] Fig. 12 shows a modification of the probe sets in Fig. 7. 606 and 612 are target molecules. A first probe sets contains member probes 602, 603. 602 contains a label (601) of type “A.” 603 contains an affinity tag (605). A second probe set comprises member probes 608 and 609. 608 contains a label (607) of type “B,” distinguishable from type “A.” 609 contains an affinity tag (611). In this embodiment, the probes 603 and 609 contain one or more labels (604, 610) of type “C.”
[0021] Fig. 13 shows a modification of the probe sets in Fig. 7. Fig. 13 depicts two probe sets for identifying various alleles of the same genomic locus. 706 and 707 are target molecules. A first probe set contains member probes 702, 703 and 704. 702 contains a label (701) of type “A.” 704
contains an affinity tag (705). A second probe set comprises member probes 709, 703 and 704. 703 and 704 are identical for both probe sets. 709 contains a label (708) of type “B,” distinguishable from type “A.” 702 and 709 contain sequences that are nearly identical, and differ by only one nucleotide in the sequence.
[0022] Fig. 14 shows a modification of the probe sets in Fig. 7. Figure 14 depicts two probe sets for identifying various alleles of the same genomic locus. 807 and 810 are target molecules corresponding to Allele 1 and Allele 2, respectively. A first probe set comprises member probes 802, 804, 805. 802 contains a label (801 ) of type “A.” 805 contains an affinity tag (806). A second probe set comprises member probes 809, 804 and 805. 804 and 805 are identical for both probe sets. 809 contains a label (808) of type “B,” distinguishable from type “A.”
[0023] Fig. 15 shows an exemplary probe set that can be used to determine a relative count of two different alleles of a single nucleotide polymorphism (SNP). A first probe set comprises Labeling Probe A and the Tagging probe which hybridizes to allele 1 having an "A" nucleotide at the position of the SNP. A second probe set comprises Labeling Probe B and the Tagging probe which hybridizes to allele 2 having a "G" nucleotide at the position of the SNP. The tagging probe of both sets comprises the same affinity tag and the same reverse primer can be used to amplify both ligated probe sets.
The primer binding site of Labeling Probe A and Labeling Probe G are different. Therefore, the ligated probe product comprising Labeling Probe A and the Tagging Probe can be amplified with a different labeled primer than is different than and distinguishable from the labeled primer used to amplify the ligated probe set comprising Labeling Probe G and the Tagging Probe.
[0024] Fig. 16 shows the likelihood of the observed data being indicative of a normal genotype or a trisomic genotype, as a function of the fetal fraction.
[0025] Fig. 17 shows llikelihood profiles for the SNP loci tag T4239 in T21 pregnancy sample i with a male fetus. Bold black curve: maternal genotype RA, fetal genotype aa. Gray curve: maternal genotype RA, fetal genotype rr. Measured allele counts are from Table 10.
[0026] Fig. 18 shows likelihood profiles for the SNP loci tag T4424 in T21 pregnancy sample /'with a male fetus. Black curve: maternal genotype RA, fetal genotype aa. Gray curve: maternal genotype RA, fetal genotype rr. Measured allele counts are from Table 10.
[0027] Fig. 19A-19B shows a sum of contributions from all possible or trial genotype combinations to likelihood profile for the SNP loci tag T4239 (Fig. 19A), and for the SNP loci tag T4424 (Fig. 19B), in a T21 pregnancy sample i with a male fetus. Measured allele counts are from Table 10.
[0028] Fig. 20 shows an overall SNP likelihood profile for T21 pregnancy sample i with a male fetus, including contributions from both SNP loci tags T4239 and T4424. Vertical dashed gray line indicates the location of the maximum of the overall SNP log-Likelihood curve.
[0029] Fig. 21 shows CNV log-Likelihood profiles vs. fetal fraction for the euploid fetus (null hypothesis, gray curve) and the T21 fetus (alternative hypothesis, black curve). Input values comprised the four experimentally measured and normalized loci tag ratios obtained for the T21 sample i from Table 11.
[0030] Fig. 22 shows joint log-Likelihood profiles vs. fetal fraction for sample i, corresponding to T21 in black and euploid hypotheses in gray. Black and gray data points: maximum joint log-likelihood values corresponding to the two hypotheses. The maximum joint log-likelihood value for the T21 (alternative hypothesis, black data point) exceeded the maximum joint log-likelihood value corresponding to the euploid (null hypothesis, gray data point) resulting in sample i being correctly classified as a T21 pregnancy.
[0031] Figs. 23A-23B show llikelihood profiles for the SNP loci tags in a euploid pregnancy sample c with a female fetus. Fig. 23A shows likelihood profiles for the SNP loci tag T4239. Black curve: maternal genotype RR, fetal genotype ra. Gray curve: maternal genotype RA, fetal genotype rr. Fig. 23B shows likelihood profiles for the SNP loci tag T4424. Black curve: maternal genotype RA, fetal genotype rr. Gray curve: maternal genotype AA, fetal genotype ra. Measured allele counts are from Table 10.
[0032] Figs. 24A-24B shows an overall SNP likelihood for the euploid sample c, obtained by combining likelihood profiles derived from data measured on both SNP loci T4239 (Fig. 24A) and T4424 (Fig. 24B).
[0033] Fig. 25 shows an overall SNP likelihood for the euploid sample c with a female fetus. The SNP likelihood was obtained by combining likelihood profiles derived from data measured on both SNP loci T4239 and T4424. Vertical dashed gray line indicates the location of the maximum of the overall SNP log-Likelihood curve.
[0034] Fig. 26 shows CNV log-Likelihood profiles vs. fetal fraction for the euploid fetus (null hypothesis, gray curve) and the T21 fetus (alternative hypothesis, black curve).
[0035] Fig. 27 shows joint log-Likelihood profiles vs. fetal fraction for sample c, corresponding to the T21 and Euploid hypotheses, respectively. The continuous curves, black and gray, were evaluated by combining SNP likelihoods with CNV likelihoods, as described elsewhere. Black and gray dashed vertical lines show maximum joint log-likelihood values corresponding to the two hypotheses.
Detailed Description
[0036] In some embodiments, provided herein are methods of detecting, identifying or determining a genetic variation or a copy number of a nucleic acid region of interest in a genome of interest with improved accuracy, confidence and/or precision. The methods presented herein can be applied to a
genetic sample comprising a mixture of genetic material derived from a first genome and a second genome (e.g., a genome of a fetus and a mother of the fetus, or e.g., a genome of a cancer and a genome of non-cancerous tissue), for example where the genetic sample is obtained from a single subject. In some embodiments, methods presented herein can detect, identify or determine a genetic variation or a copy number of a nucleic acid region of interest with improved accuracy and/or precision by utilizing different estimates of a genetic fraction in a mixed genetic sample, where the genetic fraction is an amount of a first genetic material derived from a first genome relative to an amount of a second genetic material derived from a second genome in the genetic sample. Methods, systems and computer readable media presented herein often comprise improved data manipulation methods. In some embodiments, identifying a genetic variation by a method described herein can lead to a diagnosis of, or determining a predisposition to, a particular medical condition. In some embodiments, identifying a genetic variance or copy number of a nucleic acid region of interest can facilitate making a medical decision and/or employing a helpful medical procedure with a higher degree of confidence. [0037] Various methods have been developed to determine the presence or absence of a genetic variation in a subject. These methods can involve estimating the fraction or proportion of genetic material derived from a specific source, such as the fraction of tumor-derived nucleic acids or fetus- derived nucleic acids in a genetic sample. For example, U.S. Patent No. 9,228,234, describes methods for determining the copy number of a chromosome in a fetus in the context of non-invasive prenatal diagnosis and other diagnostic and screening applications. The measured genetic data from a sample of genetic material that contains both fetal and maternal DNA is analysed, along with the genetic data from the biological parents of the fetus, and the copy number of the chromosome of interest is determined or estimated. However, these methods typically require estimating the genetic fraction (e.g., a fraction of genetic material derived from a given source in a genetic sample comprising genetic material from multiple sources) solely by point estimation, which can vary from the actual genetic fraction, thereby introducing error into the method. In other words, the fraction of genetic material from a given source is estimated to be a single value or a constant, and this estimated value or constant can differ from the true value or true estimate of the genetic fraction. In contrast, methods presented herein, in some embodiments, include estimating genetic fraction by optimizing one or more metrics, including but not limited to a probability and/or a likelihood of a null and alternative hypothesis associated with an absence and presence, respectively, of a genetic variation in a genetic sample. As used herein, the term “metric”, in certain embodiments, refers to a measure of certainty or expectation (e.g., probability or likelihood) of, for example, a null or alternative hypothesis. In certain embodiments, a metric comprises a function. As used herein, the term “function” can refer to a continuous function, a discontinuous function (e.g., a discrete function), or any combination thereof. Estimating genetic fraction by
optimizing a metric, including but not limited to probability and likelihood, often results in a more accurate estimation of a genetic fraction, and thereby increases the Statistical Power of the method (e.g., reduce Type II error, or reduce the probability of incorrectly accepting the null hypothesis). Estimating genetic fraction by optimizing a metric may result in a more accurate estimation of a genetic fraction, and thereby increases the Statistical Significance of the method (e.g., reduces Type I error, or reduces the probability of incorrectly rejecting a null hypothesis). In some embodiments, the present disclosure provides methods for determining a genetic fraction of a genetic material derived from a given source (e.g., a fetus or a tumor present in a mixed sample), and using the determined genetic fraction as a trigger, (e.g., determining factor, decision tool, deciding factor, or tiebreaker) to perform additional testing or to not perform additional testing.
[0038] In one aspect, the present disclosure provides methods of using optically resolvable single molecule arrays to measure a fraction of genetic material in a genetic sample, and comparing the measured fraction of genetic material to a threshold to determine which additional test, if any, should be performed.
[0039] The present disclosure relates to, in certain embodiments, methods of analyzing a genetic sample from a subject, said genetic sample containing a first genetic material and optionally having a second genetic material, the method comprising: determining a fraction of a second genetic material in the genetic sample based on a first number and a second number, the first number and the second number obtained by: (a) contacting first and second probe sets to the genetic sample, wherein the first probe set comprises a first labeling probe and a first tagging probe, and wherein the second probe set comprises a second labeling probe and a second tagging probe; (b) hybridizing the first and second probe sets to first and second nucleic acid regions of interest in nucleotide molecules present in the genetic sample, respectively, (c) labeling the first and second labeling probes with first and second labels, respectively; (d) immobilizing at least parts of the first and second probe sets (e.g., first and second ligated probe sets) to a substrate at a density in which the first and second labels of the first and second probe sets are optically resolvable after immobilization; and (e) detecting: (i) a first number of the first label corresponding to a first subset of the first probe set immobilized to the substrate, and (ii) a second number of the second label corresponding to a second subset of the second probe set immobilized to the substrate to detect the nucleic acid copy numbers, wherein the probes of the first subset and the second subset hybridize to the first and the second nucleic acid regions of interest, respectively, that contain one or more biomarkers informative of the fraction of the second genetic material in the genetic sample. As used herein, the term "biomarker" can refer to a distinctive biological indicator of a genetic material being derived from a particular source (e.g., a fetus, a mother, a tumor, a transplanted tissue, etc.). Biomarkers as used herein encompass, without
limitation, gene products with or without polymorphisms, mutations, variants, modifications, or other biomarkers. In one aspect, the one or more biomarkers are selected from the group consisting of a SNP, an insertion-deletion variant (indel), a microsatellite, a bi-allelic marker, a multi-allelic marker, a polymorphic marker, a polynucleotide repeat, a fragment size, a copy number variant, an RNA marker or transcript, a protein marker, a methylation marker, the like and combinations thereof. In some embodiments, the one or more biomarkers comprise one or more SNPs. In one aspect, the one or more biomarkers comprise one or more indels. In one aspect, the one or more biomarkers comprise one or more microsatellites. In one aspect, the one or more biomarkers comprise one or more bi- allelic markers. In one aspect, the one or more biomarkers comprise one or more multi-allelic markers. In one aspect, the one or more biomarkers comprise one or more polymorphic markers. In one aspect, the one or more biomarkers comprise one or more polynucleotide repeats. In one aspect, the one or more biomarkers comprise a fragment size. In one aspect, the one or more biomarkers comprise one or more copy number variants. In one aspect, the one or more biomarkers comprise one or more RNA markers. In one aspect, the one or more biomarkers comprise one or more protein markers. In one aspect, the one or more biomarkers are one or more methylation markers. In certain embodiments, a method comprises hybridizing a first and a second probe set to first and second nucleic acid regions of interest in nucleotide molecules present in the genetic sample, respectively, wherein the first nucleic acid region of interest exists on a first nucleic acid from a first source, and wherein the second nucleic acid region of interest exists on a second nucleic acid from a second source. In certain embodiments, probe sets are specifically targeted to genetic material from two different sources (e.g., genetic material derived from a mother and genetic derived from a fetus). In another embodiment, first and second probe sets represent different forms of a biomarker (e.g., different alleles of a SNP). Figures 7-15 depicts exemplary probe sets that can be used for a method disclosed herein.
[0040] In one aspect, a first genetic material comprises maternal genetic material from a mother, and a second genetic material comprises fetal genetic material from a fetus. In one aspect, a ratio of a first number and a second number corresponds to a measure of the fetal fraction. In one aspect, a first genetic material comprises non-tumor derived genetic material, and a second genetic material comprises tumor-derived genetic material. In one aspect, a ratio of the first number and the second number corresponds to a measure of the tumor fraction. In one aspect, the genetic material from the first genetic material comprises organ recipient genetic material from the subject, and the second genetic material comprises organ-donor genetic material from the donor of a transplanted organ. In one aspect, a ratio of the first number and the second number corresponds to a measure of the fraction of material from a donated organ. In one aspect, a first and a second nucleic acid regions of
interest are the same region. In one aspect, a first and a second probe sets are allele-specific, and each hybridize to the same or about the same region of the genome. In one aspect, a first and a second probe sets are allele-specific, and each hybridize to different regions of the genome. In one aspect, the method further comprises determining a genetic variation in the genetic sample when the fraction exceeds a predetermined threshold, value, ratio or number. In some embodiments, a genetic variation is selected from the group consisting of an aneuploidy, a copy number change, a deletion, an indel, an insertion, an inversion, a monosomy, a mutation, a SNP, a translocation, a splice variant and a trisomy. In one aspect, the genetic variation comprises an aneuploidy. In one aspect, a genetic variation comprises a copy number change. In one aspect, a genetic variation comprises a deletion. In one aspect, a genetic variation comprises an indel. In one aspect, a genetic variation comprises an inversion. In one aspect, a genetic variation comprises a monosomy. In one aspect, a genetic variation comprises a mutation. In one aspect, a genetic variation comprises a SNP. In one aspect, a genetic variation comprises a translocation. In one aspect, a genetic variation comprises a splice variant. In one aspect, a genetic variation comprises a trisomy. In one aspect, a fetal fraction is weighted based on a genetic variation. In one aspect, a fetal fraction is weighted according to the first number and/or the second number. In one aspect, determining a genetic variation comprises performing an additional test selected from the group consisting of microarrays, sequencing-bysynthesis, digital polymerase chain reaction (dPCR), real-time quantitative polymerase chain reaction (rtPCR), array capture, a nucleic acid sequence-based detection, massively parallel genomic sequencing, digital arrays, single molecule arrays, single molecule counting, oligo-ligation assays and single molecule sequencing. In one aspect, determining a genetic variation comprises performing an additional test comprising a digital array. In one aspect, determining a genetic variation comprises performing an additional test comprising a single molecule array. In one aspect, determining a genetic variation comprises performing an additional test comprising single molecule counting. In one aspect, determining a genetic variation comprises performing an additional test comprising DNA or RNA sequencing. In one aspect, an additional test is performed using the genetic sample or an additional genetic sample from the subject. In one aspect, the additional test is performed only if the fraction exceeds a predetermined threshold. In certain embodiments, the additional genetic sample is collected only if the fraction exceeds a predetermined threshold. In certain embodiments, the additional test is performed only if the fraction subceeds a predetermined threshold. In yet another aspect, the additional genetic sample is collected only if the fraction exceeds a predetermined threshold. Without limitation, a ‘threshold’ can include a number, a ratio, a value, a constant, a range, a probability, or a likelihood. In certain embodiments, a ‘threshold’ can be multifaceted or can include multiple thresholds (e.g., a threshold can comprise two or more numbers, two or more ratios, two or
more values, two or more constants, two or more ranges, two or more probabilities, or two or more likelihoods). A threshold may be upper or lower confidence interval on an estimate (for example, of the fetal fraction). A threshold may be a number derived from an estimate, for example, a value above with there is a defined probability that the fetal fraction of the sample exceeds. In one aspect, the genetic sample or the additional genetic sample is selected from the group consisting of whole blood, blood plasma, blood serum, buffy coat, urine, vaginal fluid, fluid from a hydrocele (e.g., of the testis), vaginal flushing fluids, pleural fluid, ascitic fluid, cerebrospinal fluid, saliva, sweat, tears, sputum, bronchoalveolar lavage fluid, discharge fluid from the nipple, isolated cells, tissue, circulating fetal cells, circulating tumor cells and circulating cells from a transplanted organ. In one aspect, a fraction of the second genetic material in the genetic sample is not determined by point estimation.
Subjects
[0041] The term “subject” refers to animals, typically mammalian animals. In some embodiments a subject is a mammal. Non-limiting examples of mammals include humans, non-human primates (e.g., apes, gibbons, chimpanzees, orangutans, monkeys, macaques, and the like), domestic animals (e.g., dogs and cats), farm animals (e.g., horses, cows, goats, sheep, pigs), zoo animals, wild animals and experimental animals (e.g., mouse, rat, rabbit, guinea pig). In some embodiments a subject is a primate. In some embodiments a subject is a human. In some embodiments, a subject is of any age from birth until death. In certain embodiments, a subject is an adult, (e.g., at an age capable of bearing children, or older). In some embodiments, a subject is not an embryo. In some embodiments, a subject is not a fetus. A subject can be male or female. In certain embodiments, a subject is a pregnant subject (e.g., a pregnant female).
[0042] In certain embodiments a subject has or is suspected of having a cancer. In certain embodiments a subject is at risk of developing a cancer. Subjects at risk of developing a cancer can be subjects in high-risk groups who can be identified by a medical professional. Non-limiting examples of subjects at risk of cancer include chronic smokers, overweight individuals, human subjects over the age of 60, subjects with a family history of cancer, subjects having certain gene mutations that are associated with certain cancers, subjects infected with, or previously infected with certain viruses associated with the development of certain cancers, subjects exposed to known carcinogens, subjects exposed to excessive radiation (e.g., UV radiation, alpha, beta, or gamma radiation), subjects having chronic inflammation, the like, or combinations thereof. In some embodiments a subject has received a treatment for a cancer. In certain embodiments a subject is at risk of developing a cancer is subject has a cancer resected removed, and for example, the subject is at risk of a cancer still being present or returning. In certain embodiments a subject is at risk of developing a cancer is subject who had a cancer and is considered in remission. In certain
embodiments, a subject is in remission from a cancer and a method disclosed herein is used to monitor a subject for a reoccurrence of cancer. Accordingly, in certain embodiments, a method disclosed herein is used to determine a presence, absence, or change in amount of a cancer in a subject. In certain embodiments, an amount of cancer refers to a volume or size of a cancer (e.g., a solid tumor), or an amount of cancer cells in a subject, or within a location in or on a subject. In certain embodiments, a method disclosed herein is used to determine a metastatic potential or metastatic status of a cancer. For example, a method disclosed herein may be used to determine if cancer is a metastatic cancer.
[0043] In certain embodiments, a subject has received, or is a candidate for receiving a transplant. Accordingly, in some embodiments, a method disclosed herein is used to determine a presence, absence or amount of a transplanted organ or tissue in or on a subject.
Cancers
[0044] In some embodiments, methods, systems and media presented herein are used to detect, identify, monitor, or diagnose a cancer in a subject. In some embodiments, a cancer refers to a neoplastic cell or tissue. Non-limiting examples of a cancer include a carcinoma, sarcoma, neuro neoplasia, a blood cancer (e.g., a lymphoma, myeloma, leukemia), melanoma, mesothelioma, solid or soft tissue tumors, and secondary cancers (e.g., derived from a primary site)). Non-limiting examples of a carcinoma include respiratory system carcinomas, gastrointestinal system carcinomas, genitourinary system carcinomas, testicular carcinomas, prostatic carcinomas, endocrine system carcinomas, basal cell carcinoma of the skin, carcinoma of unknown primary, cholangiocarcinoma, ductal carcinoma in situ (DCIS), merkel cell carcinoma, lung carcinoma, thymoma and thymic carcinoma, midline tract carcinoma, lung small cell carcinoma, thyroid carcinoma, liver hepatocellular carcinoma, squamous cell carcinoma, head and neck squamous carcinoma, breast carcinoma, epithelial carcinoma, adrenocortical carcinoma, ovarian surface epithelial carcinoma, and the like, further including carcinomas of the uterus, cervix, colon, pancreas, kidney, esophagus, stomach and ovary. Non-limiting examples of a sarcoma include Ewing sarcoma, lymphosarcoma, liposarcoma, osteosarcoma, soft tissue sarcoma, Kaposi sarcoma, rhabdomyosarcoma, uterine sarcoma, chondrosarcoma, leiomyosarcoma, fibrosarcoma and the like. Non-limiting examples of a neuro neoplasia include glioma, glioblastoma, meningioma, neuroblastoma, retinoblastoma, astrocytoma, oligodendrocytoma and the like. Non-limiting examples of lymphomas, myelomas, and leukemias include acute and chronic lymphoblastic leukemia, myeloblastic leukemia, multiple myeloma, poorly differentiated acute leukemias (e.g., erythroblastic leukemia and acute megakaryoblastic leukemia), acute promyeloid leukemia (APML), acute myelogenous leukemia (AML), chronic myelogenous leukemia (CML), acute lymphoblastic leukemia (ALL), which includes B-lineage ALL and T-lineage
ALL, chronic lymphocytic leukemia (CLL), prolymphocytic leukemia (PLL), hairy cell leukemia (HLL), Waldenstrom’s macroglobulinemia (WM), non-Hodgkin lymphoma and variants, peripheral T cell lymphomas, adult T cell leukemia/lymphoma (ATL), cutaneous T-cell lymphoma (CTCL), large granular lymphocytic leukemia (LGF), Hodgkin's disease and Reed-Sternberg disease. Non-limiting examples of soft or solid tissue tumors include visceral tumors, seminomas, hepatomas, and other tumors of the breast, liver, lung, pancreas, uterus, ovary, testicle, head, neck, eye, brain, mouth, pharynx, vocal cord, ear, nose, esophagus, stomach, intestine, colon, adrenal, kidney, bone, bladder, urethra, carcinomas, lung, muscle, skin, feet, hands, and soft tissue.
Non-cancerous tissues
[0045] In certain embodiments, a non-cancerous tissue refers to a tissue that is not a cancer. In certain embodiments, a non-cancerous tissue comprises or consists of normal and/or healthy cells, for example as determined by a medical practitioner. In certain embodiments, a non-cancerous tissue is a cell or tissue deemed not to be a cancer, not to be a neoplasm and not to be malignant by a medical practitioner. In certain embodiments, a non-cancerous tissue displays normal growth characteristics, normal function, normal vascularization and/or normal adhesion for a given tissue type or cell type. In certain embodiments, a non-cancerous tissue comprises or consists of cells having an expected (e.g., normal) number of autosomes and sex chromosomes for a given species. It is well within the skill set of a medical professional or practitioner (e.g., an oncologist) to determine (e.g., by biopsy and/or microscopic examination) if a cell or tissue is not cancerous.
Transplants
[0046] In certain embodiments a subject is a transplant recipient. A transplant recipient refers to a subject who has received a transplant. In some embodiments a transplant refers to a suitable organ or tissue derived from a first subject (e.g., an organ donor) that is introduced into or on a second subject (e.g., a transplant recipient), where the first and second subjects are genetically different members of the same species. In some embodiments, a transplant is an allotransplant. In some embodiments, a transplant comprises a genome that is different than the genome of the transplant recipient. In some embodiments, a transplant comprises an organ, or portion thereof, non-limiting examples of which include liver, kidney, heart, pancreas, intestine, lung, skin, eye, stomach, the like, portions thereof or combinations thereof. Other non-limiting examples of a transplant include limbs such as hands, arms, feet and the like. In some embodiments, a transplant comprises a tissue, or portion thereof, non-limiting examples of which include skin, bone marrow, bone marrow derived cells, stem cells, blood cells, bone, platelets, heart valve, cornea, nerves, veins, connective tissue, the like and combinations thereof. In some embodiments, a transplant (e.g., a transplanted organ or tissue) comprises immune cells derived from a transplant donor. In some embodiments, a method presented
herein is used to detect and monitor graft versus host disease (GVHD) by detecting a relative amount of genetic material derived from a transplant (e.g., transplanted cells (e.g., lymphocytes (B-cells, T- cells), macrophages, and combinations thereof)) present in a transplant recipient.
Fetus
[0047] Methods disclosed herein can be used, in certain embodiments, to determine a presence or absence of a genetic variation or copy number of a nucleic acid region of interest in a genome of a fetus (e.g., a fetus carried in a womb of a pregnant female). Methods disclosed herein can be used, in certain embodiments, to determine a copy number of a nucleic acid region of interest in one fetus, or two fetuses (e.g., in the case of twins). In some embodiments, methods presented herein can be used to determine a copy number of interest in three, four, five, six, seven or eight fetuses housed in a womb of a pregnant female. In some embodiments, methods disclosed herein can be used to determine a presence or absence of a genetic variation present in a genome of a pair of twins (e.g., identical or non-identical twins), or a trio of triplets (e.g., identical or non-identical triplets).
[0048] In some embodiments, a fetus refers to an unborn offspring of a mammal (e.g., a female mammal). A fetus can be of any gestational age, non-limiting examples of which include 1 week to 50 weeks post-conception, 3 weeks to 42 weeks post conception, 6 weeks to 42 weeks post conception,
8 weeks to 42 weeks post-conception and intermediate ranges thereof. In some embodiments, a fetus is a multicellular embryo. In some embodiments, a fetus is an offspring more than 1 , 2, 3, 4, 5, 6, 7, 8, 9, 10, 11 , 12, 13, 14, 15, 16, 17, 18, 19, or 20 weeks after conception, and prior to birth. In certain embodiments, conception initiates at fertilization or upon transplantation of an embryo.
Samples & Genetic Samples
[0049] Provided herein, in certain embodiments, are methods and processes for analyzing a sample (e.g., a genetic sample). A sample (e.g., a sample comprising nucleic acids; e.g., a genetic sample) is often derived from or obtained from a suitable subject or any suitable portion of a subject. A sample can be isolated or obtained directly from a subject. In some embodiments, a sample obtained from a subject is obtained indirectly from the subject, for example wherein a third party (e.g., a courier or medical professional) delivers a sample for later analysis, e.g., by a method described herein. In some embodiments, a sample is provided. In certain embodiments, a sample that is provided is simply a sample that exists as a starting material for conducting a method described herein and does not imply that the sample was physically or actively delivered or obtained.
[0050] In some embodiments, a sample comprises, consists of, or is derived from a suitable specimen that is isolated or obtained from a subject. In some embodiments, a sample comprises a mixture of specimens isolated, obtained or derived from the same subject. In the case of multiplexing, multiple samples derived from different subjects may be mixed or combined. Non-limiting examples of a sample
or specimen include fluid or tissue, including, without limitation, blood or a blood product ( e.g ., serum, plasma, platelets, buffy coats, blood cells or the like), lymph, umbilical cord blood, chorionic villi, amniotic fluid, cerebrospinal fluid, spinal fluid, lavage fluid (e.g., lung, gastric, peritoneal, ductal, ear, arthroscopic), a biopsy sample, a celiocentesis sample, cells (blood cells, lymphocytes, placental cells, platelets, monocytes, stem cells, bone marrow derived cells, embryo or fetal cells) or parts thereof (e.g., mitochondrial, nucleus, extracts, or the like), urine, feces, sputum, saliva, nasal mucous, prostate fluid, lavage, semen, lymphatic fluid, bile, tears, sweat, breast milk, breast fluid, the like or combinations thereof. Non-limiting examples of s tissue include organ tissues (e.g., liver, kidney, lung, thymus, adrenals, skin, bladder, reproductive organs, intestine, colon, spleen, brain, the like or parts thereof), epithelial tissue, hair, hair follicles, ducts, canals, bone, eye, nose, mouth, throat, ear, nails, the like, parts thereof or combinations thereof. In some embodiments, a sample is cell-free or substantially cell- free (e.g., excludes whole cells). In some embodiments, a sample comprises cells. In some embodiments a sample comprises dead cells, portions thereof or nucleic acids thereof.
[0051] A sample may comprise cells or tissues that are normal, healthy, non-cancerous, diseased (e.g., infected), and/or cancerous (e.g., cancer cells).
[0052] In certain embodiments, a sample is a genetic sample. In certain embodiment, a genetic sample comprises genetic material (e.g., nucleic acids, e.g., DNA) obtained from or derived from a subject. In certain embodiment, a genetic sample comprises genetic material obtained from or derived from a single subject. In certain embodiment, a genetic sample comprises genetic material obtained from or derived from multiple subjects. In some embodiments, a genetic sample comprises nucleic acids, or fragments thereof, non-limiting examples of which include DNA (e.g., genomic DNA, extracellular DNA and cell-free DNA), RNA (e.g., mRNA, exosomal RNA, cell-free RNA), the like and combinations thereof. In some embodiments, a genetic sample comprises DNA. In some embodiments, a genetic sample comprises cell free DNA. Nucleic acids of a genetic sample may be single stranded and/or double stranded. In certain embodiments, a genetic sample comprises heritable and/or non-heritable biological information encoded in the nucleic acids of a sample.
[0053] In some embodiments, a genetic sample comprises genetic material. In certain embodiments, genetic material comprises nucleic acids derived from and/or originating from a nucleus of a cell. In certain embodiments, genetic material comprises nucleic acids derived from one or more genomes. In some embodiments, a genome refers to genetic material or nucleic acids derived from one or more cells of a particular subject, tissue, cancer, fetus, transplant, or the like having a genotype that is substantially the same. In some embodiments, a genome refers to genetic material or nucleic acids derived from the nucleus of one or more cells. In some embodiments, genetic material derived from a genome comprises or consists of DNA. In some embodiments, genetic material derived from a genome
comprises or consists of RNA. In certain embodiments, genetic material comprises nucleic acids that encode one or more proteins. In certain embodiments, genetic material comprises nucleic acids that regulate or direct expression of RNA or a protein (e.g., untranslated regions, intron, promoters, regulator regions). In certain embodiments, genetic material comprises nucleic acids that do not encode a protein (e.g., repeat regions, pseudogenes, and the like).
[0054] In some embodiments, a genetic sample comprises genetic material derived from a first genome and genetic material derived from a second genome. In some embodiments, a genetic sample comprises genetic material derived from two to ten genomes (e.g., 2, 3, 4, 5, 6, 7, 8, 9 or 10 genomes) which are, in certain embodiments, different genomes. In some embodiments, a genetic sample comprises genetic material derived from a first genome and genetic material derived from a second genome, where the genetic sample was obtained from a single subject. Accordingly, a genetic sample may comprise a mixture of nucleic acids derived from (e.g., originating from) a first genome and a second genome. Non-limiting examples of a genome include a genome of a fetus, a genome of a mother of a fetus, a genome of a cancer, a genome of non-cancerous tissue, a genome of a transplant, a genome of a transplant recipient, a genome of a subject, a genome of a contamination (e.g., a genome from another sample or source than was inadvertently introduced into a genetic sample being processed), and the like.
[0055] In some embodiments, a genetic sample comprises genetic material derived from a fetus and genetic material derived from a mother of the fetus. In some embodiments, a genetic sample comprises genetic material derived from a genome of a fetus and genetic material derived from a genome of a mother of the fetus. In some embodiments, a genetic sample comprises genetic material derived from two or more fetuses and genetic material derived from a mother of the fetus.
[0056] In some embodiments, a genetic sample comprises genetic material derived from a cancer and genetic material derived from non-cancerous tissue. In some embodiments, a genetic sample comprises genetic material derived from a genome of a cancer and genetic material derived from a genome of non-cancerous tissue. In some embodiments, a genetic sample comprises genetic material derived from two or more different cancers and genetic material derived from non-cancerous tissue. In some embodiments, a genetic sample comprises a mixture of cancer cell DNA and noncancer cell DNA. In some embodiments, a genetic sample comprises a mixture of cancer cell RNA and non-cancer cell RNA. A genetic sample may comprise aberrant or mutated nucleic acid sequences arising from tumor formation or metastasis.
[0057] In some embodiments, a genetic sample comprises genetic material derived from a transplant and genetic material derived from a transplant recipient. In some embodiments, a genetic sample comprises genetic material derived from a genome of a transplant and genetic material derived from a
genome of a transplant recipient. In some embodiments, a genetic sample comprises genetic material derived from two or more different transplants and genetic material derived from a transplant recipient.
[0058] A genetic sample may comprise nucleic acids derived from one, or two or more sources (e.g., one or more cells, one or more cell types, e.g., one or more genomes). In some embodiments, a sample or genetic sample comprises cells or portions thereof (e.g., nucleic acids) derived from one or more sources, non-limiting examples of which include a subject, a host, a transplant, a transplant recipient, a cancer, a mother, a fetus, cells thereof, genomes thereof and/or combinations thereof.
[0059] In certain embodiments, a genetic sample comprises nucleic acids derived from 1 to 100 sources (e.g., genomes), e.g., 1 source, 2 sources, 3 sources, 4 sources, 5 sources, 6 sources, 7 sources, 8 sources, 9 sources, 10 sources, 15 sources, 20 sources, 25 sources, or greater than 25 sources. In certain embodiments, a genetic sample comprises nucleic acids derived from 2 to 8, 2 to 6, 2 to 4 or 2 to 3 sources. In certain embodiments where a sample or genetic sample comprises genetic material from 2 or more sources, there will be 2 or more genetic fractions in the sample.
[0060] In certain embodiments, a genetic fraction is an amount of genetic material derived from a first source or genome relative to an amount of genetic material derived from a second source or genome.
In some embodiments, an amount of genetic material derived from a first source or genome relative to an amount of genetic material derived from a second source or genome in a sample is expressed as an amount of genetic material derived from a first source or genome in a sample relative to a total amount of genetic material in a sample. In certain embodiments, a genetic fraction is an amount of genetic material derived from a first source or genome relative to a total amount of genetic material in a sample (e.g., total genetic material derived from two or more genomes in a sample). A genetic fraction can be expressed in a suitable form or by suitable mathematical expression. In some embodiments, a genetic fraction is a ratio of an amount of genetic material derived from a first source or genome to an amount of genetic material derived from a second source or genome. In some embodiments, a genetic fraction is a percent of genetic material derived from a first source or genome relative to a total amount of genetic material in a sample. In some embodiments, a genetic fraction is a percent of genetic material derived from a first source or genome relative to a total amount of genetic material derived from the first source and a second source in the sample. In certain embodiments, a genetic fraction is a likelihood or probability of a genetic fraction. In certain embodiments, a genetic fraction is a suitable distribution (e.g., a beta distribution). In certain embodiments, a genetic fraction is associated with a degree of confidence or a degree of error (e.g., a statistical measure or confidence or error).
[0061] In some embodiments a genetic fraction represents a relative amount of genetic material derived from a minor contributing source (e.g., a cancer, fetus, transplant, a contamination (e.g., from another
subject or sample)) compared to major contributing source (e.g., non-cancerous tissue, a mother of a fetus, a subject, or a transplant recipient). In some embodiments a genetic fraction represents a relative amount of genetic material derived from a minor contributing source (e.g., a cancer, fetus, transplant, a contamination (e.g., from another subject or sample)) compared to a total amount of the minor contributing source and a major contributing source. A fetal fraction often refers to a genetic fraction of genetic material derived from a genome of a fetus relative to genetic material derived from a genome of a mother of a fetus, or relative to the total genetic material in a sample.
[0062] In certain embodiments, a sample or genetic sample is a processed sample. In some embodiments, nucleic acids of a genetic sample are subjected to one or more suitable processing steps. For example, a genetic sample may comprise nucleic acids that are extracted, isolated, purified, and/or enriched. In certain embodiments, some or all of the nucleic acids of a genetic sample are amplified prior to conducting a method described herein. In certain embodiments, some or all of the nucleic acids of a genetic sample are not amplified prior to conducting a method described herein. In some embodiments, a genetic sample and/or nucleic acids of a sample are lyophilized, precipitated, resuspended, fixed and/or embedded (e.g., formalin-fixed and/or paraffin-embedded).
Nucleic Acids
[0063] Non-limiting examples of nucleic acids include DNA and RNA, the like, various naturally occurring forms thereof, and combinations thereof. Non-limiting examples of DNA include genomic DNA, extracellular DNA, cell-free DNA, the like and combinations thereof. Non-limiting examples of RNA include messenger RNA (mRNA), exosomal RNA, extracellular RNA, cell-free RNA, the like and combinations thereof. A nucleic acid can be double stranded or single stranded.
[0064] A nucleic acid length can be of any suitable length, non-limiting examples of which include 2 to 250 x 106, 5 to 250 x 106, 8 to 250 x 106, 10 to 250 x 106, 5 to 1 x 10⁶, 5 to 100,000, 5 to 10,000, 5 to 5000 or 5 to 1000 contiguous nucleotides, or intermediate ranges thereof. In some embodiments, a nucleic acid comprises a length of 3 to 500, 3 to 400, 5 to 350, 5 to 200, 10 to 200, 15 to 200, or 20 to 200 contiguous nucleotides, or intermediate ranges thereof. In some embodiments, a nucleic acid comprises a length of 2 or more, 3 or more, 4 or more, 5 or more, 8 or more or 10 or more contiguous nucleotides.
[0065] In some embodiments, a nucleic acid comprises deoxyribonucleotides, ribonucleotides, analogs thereof or mixtures thereof. In some embodiments, a nucleic acid comprises or consist of naturally occurring deoxyribonucleotides. In some embodiments, a nucleic acid comprises or consist of naturally occurring ribonucleotides. A nucleic acid often comprises a specific 5’ to 3’ order of nucleotides known in the art as a sequence (e.g., a nucleic acid sequence, e.g., a sequence).
[0066] A nucleic acid may be naturally occurring and/or may be synthesized, copied or altered ( e.g ., by a technician, scientist or one of skill in the art). Non-limiting examples of synthesized, copied or altered nucleic acids include cDNA, amplicons, extension products, oligonucleotides (primers, probes, and the like), ligated probes and amplified ligated probe sets. In some embodiments, a nucleic acid is an amplicon (e.g., a product of an amplification reaction).
[0067] An oligonucleotide often refers to a relatively short nucleic acid. Oligonucleotides are often about 5 to 200, 5 to about 150, 5 to 100, 5 to 50, or 5 to about 35 nucleic acids in length. In some embodiment’s oligonucleotides are single stranded.
[0068] In some embodiments, nucleic acids are processed using a suitable method non-limiting examples of which include isolation, fragmentation (e.g., by shearing), purification, enrichment, ligation, amplification, digestion, denaturation, the like and combinations thereof.
Genetic Variations
[0069] In certain embodiments, methods, systems and processes described herein can detect, identify, or determine the presence or absence of, one or more genetic variations. In some embodiments, a method, process or system herein detects from 1 to 100, from 1 to 50, from 1 to 40, or from 1 to 10 genetic variations, or intervening ranges thereof, including 2, 3, 4, 5, 6, 7, 8, 9, 10 or more genetic variations, or 100, 50, 30, 20, 10 or less genetic variations. In some embodiments, a method, process or system herein detects, identifies or determines a presence or absence of, one genetic variation. In some embodiments, a nucleic acid derived from a genome comprises one or more genetic variations. A genetic variation often refers to a difference (i.e., a variation) in a first genetic sequence (e.g., a region of interest) compared to one or more reference sequences (e.g., a reference locus/loci). Non-limiting examples of a genetic variation include a copy number variation, an insertion or deletion (e.g., an indel), an inversion, translocation, splice variant, one or more substitutions or mutations (e.g., a point mutation or a particular allele of a single nucleotide polymorphism), the like and combinations thereof. In some embodiments, a genetic variation is a copy number variation. Non-limiting examples of a copy number variation includes an aneuploidy, a partial aneuploidy, macro duplications (500 bases or more more), macro deletions (500 bases or more more) or insertions (500 bases or more more), and the like. An aneuploidy often refers to an increase or decrease in a number of chromosomes, or a relatively large portion thereof, compared to a normal diploid subject (e.g., a normal diploid human). Non-limiting examples of an aneuploidy include a trisomy (e.g., trisomy 13 (T13), trisomy 18 (T18) , trisomy 21 (T21)), monosomy, a tetraploidy, aneuploidy of X (e.g., XXX and XXY), aneuploidy of Y (e.g., XYY), and the like. In some embodiments, a genetic variation or copy number variation comprises in deletion, duplication or disruption of a portion of a chromosome, non-limiting examples of which include 22q11.2 (deletion),
1 q21 .1 (duplication), 9q34 (deletion), 1 p36 (deletion), 4p (deletion), 5p (deletion), 7q11.23 (duplication), 11 q24.1 (triplication), 17p (deletion), 11 p15 (duplication), 18q (deletion), 22q13 (deletion) and the like. In some embodiments, a genetic variation is associated with a particular phenotype, disease, or condition.
Regions of Interest
[0070] In some embodiments a nucleic acid (e.g., a nucleic acid of a genome) comprises a region of interest (e.g., a nucleic acid region of interest). In some embodiments, a nucleic acid region of interest comprises or is suspected of comprising a genetic variation (e.g., a copy number variation) in at least in one genome of a genetic sample. In some embodiments, a nucleic acid region of interest is a chromosome, or a portion thereof. In some embodiments, a nucleic acid region of interest comprises a locus of a chromosome (e.g., a locus of interest). In some embodiments, a nucleic acid region of interest is an autosome, a sex chromosome or a portion thereof. In some embodiments, a nucleic acid region of interest comprises a gene, or a portion thereof. A nucleic acid region of interest may include one or more of a gene, an exon, an intron, untranslated regions, 5' untranslated regions, 3' untranslated regions, regulator regions, the like, combinations thereof and portions thereof. In certain embodiments a nucleic acid region of interest comprises a SNP. In some embodiments, a genome of a subject, a transplant, a fetus, a mother of a fetus, a cancer and/or a genome of multiple subjects comprises a same nucleic acid region of interest. Accordingly, in certain embodiments a nucleic acid region of interest does not comprise a genetic variation (e.g., a region of interest of a reference genome, reference chromosome or reference gene). In some embodiments, an amplicon, probe, primer, ligation product or extension product comprises a region of interest, a complement thereof, a portion thereof or a copy thereof. A region of interest may be a suitable length of contiguous nucleotide bases. In some embodiments, a region of interest is in a range of 10 to 300,000,000 base pairs (bp), 10 to 100,000 bp, 10 to 1000 bp, 50 to 1000 bp, 10 to 500 bp, 100 to 500 bp, 10 to 200 bp, 10 to 100 bp, or 10 to 50 bp in length, or intervening ranges thereof.
Reference Loci
[0071] In some embodiments, a reference locus is analyzed, assayed, or counted by a method, process or system herein. A locus is any suitable region or sequence of a chromosome. A reference locus is often a region of a genome having a same amount of copies in a first genome and a second genome. In some embodiments, a reference locus is located on a chromosome that is diploid in both a first genome and a second genome. For example, in some embodiments, a reference locus is a region of a genome derived from a fetus having the same number of copies as the same region in a genome of a mother of the fetus. In some embodiments, a reference locus is a region of a genome derived from a cancer having the same number of copies as the same region in a genome of non-
cancerous tissue. In some embodiments, a reference locus is a region of a genome derived from a transplant having the same number of copies as the same region in a genome of a transplant recipient. In some embodiments, one or more reference loci are located on a reference chromosome, or portion thereof. In some embodiments, one or more reference loci are located on a reference sequence, or portion thereof. In some embodiments, a reference sequence refers to a nucleic acid sequence that does not include a genetic variation (e.g., in a first genome relative to a second genome). In certain embodiments, a nucleic acid sequence of a reference sequence comprises a known sequence (e.g., a sequence that is known to be present in a first genome and a second genome). In certain embodiments, a reference sequence is considered a “wild type” sequence for a particular locus.
[0072] In some embodiments, a locus or reference locus is a region of contiguous nucleic acids having a length in a range of 5 to 500 nucleotides, 5 to 300 nucleotides, 5 to 150 nucleotides, 10 to 500 nucleotides, 10 to 150 nucleotides, 20 to 500 nucleotides, 20 to 150 nucleotides, 50 to 500 nucleotides or 50 to 150 nucleotides.
[0073] In some embodiments a locus is non-polymorphic locus. In some embodiments, a non- polymorphic locus refers to a locus having a same nucleic acid sequence in all genomes present in a sample. In some embodiments, a non-polymorphic loci is a locus in a nucleic acid region of interest (e.g., a chromosome of interest; a gene of interest). For example, in some embodiments, a non- polymorphic locus has a different number of copies in a first genome compared to a second genome in a sample. In some embodiments, a non-polymorphic locus has the same number of copies in a first genome compared to a second genome in a sample. In some embodiments, a non-polymorphic locus is a reference locus.
Polymorphic Loci
[0074] In some embodiments, a locus or reference locus is a polymorphic locus. A polymorphic locus often has two or more possible alleles found in a population. In some embodiments, a polymorphic locus comprises a single nucleotide polymorphism (SNP). In some embodiments a polymorphic locus is an informative polymorphic locus. An informative polymorphic locus is a polymorphic locus having a first genotype in a first genome that is different from a second genotype in a second genome of a genetic sample. In a genetic sample comprising genetic material derived from a fetus (2nd Genome) and the mother of the fetus (1st Genome) as shown in Table 1, exemplary informative polymorphic loci are indicated by an asterisk. In this case, a fetus must have at least one allele of the fetal genotype contributed from the mother of the fetus.
Table 1

In Table 1 , R represents a first allele and A represents a second allele for a give polymorphic sequence. The first genome can be a genome of a mother and the second genome can be a genome of a fetus, or the first genome can be a genome of a transplant recipient and the second genome can be a genome of a transplant, or the first genome can be a genome of non-cancerous tissue in a subject and the second genome can be a cancer in the subject.
Probes
[0075] Methods herein may include selectively labeling, tagging, ligating, hybridizing, amplifying and/or isolating one or more nucleic acid sequences (e.g., probes), using a suitable method sufficient to yield reaction products, non-limiting examples of which include probe products, ligated probes, conjugated probes, ligated probe sets, conjugated probe sets, amplicons, extension products, hybridized duplexes (i.e., double stranded nucleic acids), and labeled nucleic acids (e.g., labeled probes, labeled ligated probe sets, labeled amplicons) . For example, an assay may comprise contacting, binding, and/or hybridizing probe sets to a sample, ligating and/or conjugating the probe sets, optionally amplifying the ligated/conjugated probes, and immobilizing the probes to a substrate.
In some embodiments, the assays and methods described herein may be performed on a single input sample in parallel as a multiplex assay as described herein
[0076] A probe product, ligated probe set, conjugated probe set, ligated probes, conjugated probes, and labeled molecules may be single, contiguous molecule resulting from the performance of enzymatic action on a probe set, such as an assay. In a probe product or a labeled molecule, one or more individual probes from a probe set may be covalently modified such that they form a singular distinct molecular species as compared to either probes or probe sets. As a result, probe products or
a labeled molecule may be chemically distinct and may therefore be identified, counted, isolated, or further manipulated apart from probes or probe sets. In one embodiment, at least 10, at least 1,000, at least 10,000 probe sets are used to interrogate the same locus.
[0077] For example, probe products may contain one or more identification labels, and one or more affinity tags for isolation and/or immobilization. In some embodiments, no additional modifications of probe products (e.g., DNA sequence determination) need to be performed. In some embodiments, no additional interrogations of the DNA sequence are required. The probe products containing the labels may be directly counted, typically after an immobilization step onto a solid substrate. For example, organic fluorophore labels are used to label probe products, and the probe products are directly counted by immobilizing the probe products to a glass substrate and subsequent imaging via a fluorescent microscope and a digital camera. In other embodiments, the label may be selectively quenched or removed depending on whether the labeled molecule has interacted with its complementary genomic locus. In additional embodiments, two labels on opposite portions of the probe product may work in concert to deliver a fluorescence resonance energy transfer (FRET) signal depending on whether the labeled molecule has interacted with its complementary genomic locus.
For a given genomic locus, labeling probes containing the labels be designed for any sequence region within that locus. A set of multiple labeling probes with same or different labels may also be designed for a single genomic locus. In this case, a probe may selectively isolate and label a different region within a particular locus, or overlapping regions or the same region within a locus. In some embodiments, the probe products containing affinity tags are immobilized onto a substrate via the affinity tags. For example, affinity tags are used to immobilize probe products onto a substrate, and the probe products containing the affinity tags are directly counted. For a given genomic locus, tagging probes containing affinity tags may be designed for a sequence region within that locus. A set of multiple tagging probes with same or different affinity tags may also be designed for a single genomic locus.
[0078] For a given genomic locus or region of a nucleotide molecule in a genetic sample, a single nucleic acid sequence within that locus, or multiple nucleic acid sequences within that locus may be interrogated and/or quantified via the creation of probe products. The interrogated sequences within a genomic locus may be distinct and/or overlapping, and may or may not contain genetic polymorphisms. A probe product is formed by the design of one or more oligonucleotides called a “probe set”.
[0079] In certain embodiments an oligonucleotide is a probe. A probe is often configured or designed to hybridize to a selected target sequence. Accordingly, a probe often comprises a portion (e.g., 3 or more, 5 or more, or 8 or more contiguous nucleotides) that is complementary to a target locus, or
portion thereof. In some embodiments, at least a portion (e.g., 50, 60, 70, 80, 85, 90, 91, 92, 93, 94, 95, 96, 97, 98, 99, or 100%) of a probe sequence is complementary to a sequence motif and/or hybridization domain present in one or more target molecules, such that the probe is configured to hybridize in part or in total to one or more target molecules or nucleic acid region of interest. The portion of a probe or primer that hybridizes to a target sequence (e.g., target locus or portion thereof) is often referred to as a hybridization domain.
[0080] In certain embodiments, a probe may, or may not be extended by a polymerase. In some embodiments, a probe may comprise an isolated, purified, naturally occurring, non-naturally occurring, and/or artificial material or nucleic acid sequence.
[0081] In some embodiments, a method herein comprises contacting one or more probe sets with a genetic sample. In some embodiment, one or more probe sets are contacted with one or more loci in a genetic sample. In some embodiment, one or more probe sets are contacted with one or more reference loci in a genetic sample. In some embodiment, one or more probe sets are contacted with one or more nucleic acid regions of interest in a genetic sample. One or more probes sets may be contacted with a 1st genome and a 2nd genome, different from the first, in a genetic sample.
[0082] In some embodiments a probe set comprises two or more suitable probes. Exemplary probe sets are described in Figs. 7-15 and in Example 4 herein. Additional exemplary probe sets are described in US Pat. 9,212,394 or International Pat. Application Pub. No. WO/2016/134191, which are incorporated herein by reference, each of which probe sets can be used for a method described herein.
[0083] In some embodiments a probe set comprises two probes. In some embodiments a probe set comprises three or four probes. In certain embodiments, each member of a probe set comprises a portion (e.g., a nucleic acid sequence) complementary to a target sequence present in one or more genomes of a genetic sample. The probes of any one probe set are configured to hybridize to a target region (e.g., a target locus, region of interest, reference locus) in a genetic sample such that at least two of the probes of a set hybridize near each other. In some embodiments, at least two probes of any one probe set hybridize adjacent to each other. The probes of any one probe set are often configured to be joined or ligated together after hybridizing to their intended target region using a suitable method. In some embodiments, the probes of a probe set joined or ligated together as described in US Pat. 9,212,394 or International Pat. Application Pub. No. WO/2016/134191.
[0084] In some embodiments, a probe set comprises at least one labeling probe and at least one tagging probe. In some embodiments, a probe set comprises one labeling probe and one tagging probe. In some embodiments, a probe set comprises one labeling probe, a bridging probe and a tagging probe. In some embodiments, two probe sets comprise a common tagging probe and
different labeling probes (e.g., where a probe set is configured to hybridize to a locus comprising a SNP).
[0085] In certain embodiments, a labeling probe comprises a target specific portion (e.g., a hybridization domain) and a label portion. In some embodiments a labeling probe or a label portion of a labeling probe comprises a label or is configured to have a label attached. A labeling probe or a label portion of a labeling probe may be modified to comprise or bind to a label. In some embodiments a labeling probe or a label portion of a labeling probe is configured to bind to a label. In some embodiments, a labeling probe or a label portion of a labeling probe is configured to hybridize to a primer comprising a label. In some embodiments a labeling probe or a label portion of a labeling probe comprises a primer binding site, or complement thereof. Accordingly, in some embodiments a labeling probe or a label portion of a labeling probe comprises a primer binding site (i.e., a sequence complementary to a portion of a primer (e.g., a 3' portion of a primer)) configured to hybridize to a primer that comprises a label or to a primer configured to incorporate a label into an amplicon or extension product. In certain embodiments, a labeling probe or a label portion of a labeling probe comprises a sequence that is substantially the same as a portion of a primer (e.g., a 3' portion of a primer) configured to hybridize to a complement of a labeling probe or a label portion of a labeling probe where the primer comprises a label or is configured to incorporate a label. A labelling probe may be a labelling probe described in US Pat. 9,212,394 or International Pat. Application Pub. No. WO/2016/134191.
[0086] In some embodiments a tagging probe comprises a target specific portion (e.g., a hybridization domain) and an affinity tag. In some embodiments a tagging probe comprises a target specific portion (e.g., a hybridization domain) and a primer binding site, or complement thereof. In some embodiments a tagging probe comprises a target specific portion (e.g., a hybridization domain), an affinity tag and a primer binding site, or complement thereof. Accordingly, in some embodiments a tagging probe comprises a primer binding site (i.e., a sequence complementary to a portion of a primer (e.g., a 3' portion of a primer)) configured to hybridize to a primer that comprises an affinity tag or to a primer configured to incorporate an affinity tag into an amplicon or extension product. In certain embodiments, a tagging probe comprises a sequence that is substantially the same as a portion of a primer (e.g., a 3' portion of a primer) configured to hybridize to a complement of a tagging probe where the primer comprises an affinity tag or is configured to incorporate an affinity tag into an amplicon or extension product. A tagging probe may be a tagging probe described in US Pat. 9,212,394 or International Pat. Application Pub. No. WO/2016/134191.
Hybridization
[0087] In some embodiments, a probe set comprises a labeling probe and a tagging probe that hybridize to, or are configured to hybridize to, a nucleic acid region of interest or a reference locus. In some embodiments, the hybridization domains of a labeling probe and tagging probe of a probe set hybridize to, or are configured to hybridize to, a nucleic acid region of interest or a reference locus. In some embodiments, a labeling probe and a tagging probe are configured to be joined or ligated together after hybridization to a target sequence or target locus. In some embodiments, the hybridization domain of a labeling probe and the hybridization domain a tagging probe are configured to be joined or ligated together after hybridization to a target sequence or target locus. The labeling probe and tagging probe of a probe set may be joined or ligated together using a suitable method. [0088] In some embodiments, a labeling probe and a tagging probe hybridize to a target sequence where the hybridization domains of the labeling probe and tagging probe are in close proximity. In certain embodiments a labeling probe and a tagging probe hybridize to a target sequence or locus where the hybridization domains of the labeling probe and tagging probe are adjacent (e.g., immediately adjacent) or substantially adjacent. Immediately adjacent indicates that there is no gap (i.e., no unpaired nucleotide) between the hybridized labeling probe and tagging probe such that the hybridization domain of the labeling probe can be ligated directly to the hybridization domain of the tagging probe. In some embodiments, the 3'-end of the hybridization domain of the labeling probe is ligated directly to the 5'-end of the hybridization domain of the tagging probe. In some embodiments, the 3'-end of the hybridization domain of the tagging probe is ligated directly to the 5'-end of the hybridization domain of the labeling probe. In some embodiments, there is a gap (e.g., of 1 to 30 nucleotides, or more) between a hybridization domain of a labeling probe and a hybridization domain of a tagging probe after hybridization to a region of interest or locus. The term, "substantially adjacent" indicates that there may be a gap of or two nucleotides between the hybridized tagging probe and hybridized labeling probe. In some embodiments, a probe set may be designed to hybridize to a non-contiguous, but proximal, portion of the nucleic acid region of interest, such that there is a “gap” of one or more nucleotides on the nucleic acid region of interest, in between hybridized probes from a probe set, that is not occupied by a probe. In some embodiments, a DNA polymerase or another suitable enzyme may be used to synthesize a new polynucleotide sequence, in some cases covalently joining two probes from a single probe set. In some embodiments, a gap may be filled by extending a 3'-end of one of the probes with a polymerase to the 5'-end of the other probe, followed by ligation, thereby providing a ligated probe set. In some embodiments, a gap may be filled by hybridization of a gap probe that hybridizes immediately adjacent to one end of a hybridized labeling probe and immediately adjacent to one end of a hybridized tagging probe, thereby facilitating ligation of the probe set. In some embodiments, a gap between a hybridized gap probe and a labeling probe
and/or a tagging probe may be filled by extending a 3'-end of one of the probes with a polymerase to the 5'-end of the other probe, followed by ligation, thereby providing a ligated probe set. Exemplary probe set designs that include different strategies and methods of hybridization, extension and/or ligation are shown in Figs. 2-26, in US Pat. 9,212,394 and International Pat. Application Pub. No. WO/2016/134191, any one of which can be used for a method described herein to interrogate a region of interest or locus, and/or to generate a ligated probe set.
[0089] Multiple probe sets may be used for a method described herein. In some embodiments multiple probe sets are used to hybridize to, and interrogate, multiple loci within a region of interest (e.g., a chromosome or gene of interest). In some embodiments, multiple probe sets are used to hybridize to, and interrogate, multiple loci (e.g., reference loci) within one or more reference nucleic acids (e.g., one or more reference chromosomes).
Ligation
[0090] In some embodiments, two or more probes of a probe set are joined or ligated together, using a suitable method, upon hybridizing to a target locus (e.g., a locus on a nucleic acid region of interest or a reference locus). In some embodiments, two or more hybridized probes of a probe set are joined either non-covalently or covalently. In certain embodiments, two or more probes of a hybridized probe set are covalently ligated using a suitable ligase. In some embodiments, a plurality of different hybridized probes sets are ligated at about the same time, in a same reaction and/or in a same reaction vessel or well. In certain embodiments, two or more hybridized probes of a probe set are ligated by an enzyme that forms a 3’,5’-phosphodiester bond. In certain embodiments, two or more hybridized probes of a probe set are joined or ligated by a process described in US Pat. 9,212,394 or International Pat. Application Pub. No. WO/2016/134191. Two or more hybridized probes that are ligated by a method disclosed herein are often referred to herein as a ligated probe set. In some embodiments, a ligated probe set comprises a labeling probe and a tagging probe, where the labeling probe is ligated to the tagging probe. In certain embodiments a ligated probe set comprises a labeling probe, a gap probe and a tagging probe.
Amplification/Primers
[0091] In some embodiments, one or more ligated probe sets (i.e., ligated probes) are amplified using a suitable method. Two or more different ligated probe sets can be amplified independently or substantially simultaneously (i.e., at about the same time, e.g., with an error of a few seconds, or 0 to 5 minutes). In some embodiments, two or more different ligated probe sets are amplified in a same amplification reaction and/or in a same reaction vessel or well. In some embodiments, a ligated probe set is amplified using a polymerase chain reaction (PCR) thereby producing a plurality of copies of the ligated probe set often referred to as amplicons. In some embodiments, a ligated probe set is
amplified in a first amplification reaction thereby producing a first set a amplicons (e.g., an amplified ligated probe set). In some embodiments, a ligated probe set is amplified in a first amplification reaction that utilizes a labeled primer that incorporates a label, thereby producing a first set a labeled amplicons. In some embodiments, a ligated probe set is amplified in a first amplification reaction thereby producing a first set a amplicons, which are further subjected to a second amplification or extension reaction using a labeled primer that introduces a label, thereby producing a set of labeled amplicons.
[0092] A PCR reaction often utilizes at least two primers per template (e.g., a ligated probe set). In certain embodiments, a primer is a single stranded oligonucleotide. A primer is often configured to hybridize to a selected complementary nucleic acid and is configured to be extended by a polymerase after hybridizing. Accordingly, a primer or portion thereof (e.g., 3 or more, 5 or more, or 8 or more contiguous nucleotides) is often complementary to a target sequence, locus, template, or portion thereof. A suitable template is often amplified by PCR using a primer pair. In some embodiments, a ligated probe set is amplified using a suitable primer pair. A “primer pair” refers to a set of two primers (e.g., a forward and reverse primer) that flank a nucleic acid sequence intended to be amplified.
Unless specified otherwise, reference to a forward primer and a reverse primer, or a first and second primer is arbitrary, and such phrases do not imply an orientation of where a primer binds on a template, or which strand of a template that a primer binds to. In some embodiments, one primer of a primer pair initiates nucleic acid synthesis from a 3’-end of a first strand of a template, while the other primer of the primer pair initiates nucleic acid synthesis from a 3’-end of a second strand of the template. In some embodiments, a primer, a probe, or a portion thereof (e.g., a 3'-portion of a primer, a 5' or 3' portion of a probe) is substantially complementary to a target nucleic acid. The phrase, "substantially complementary" means that one, or a few nucleotides on each strand of a duplex formed after hybridization may not be complementary, yet still allow efficient hybridization and/or formation of a duplex under suitable conditions.
[0093] In some embodiments, a primer comprises a label. In certain embodiments a primer comprises two or more labels. In some embodiments, a ligated probe set is amplified using one or more primers comprising a label thereby producing labeled amplicons. In some embodiments, a ligated probe set is amplified by PCR using a primer pair wherein one of the primers is labeled such that only one strand of the amplicons is labeled.
[0094] A primer extension or amplification can be performed as described in US Pat. 9,212,394 or International Pat. Application Pub. No. WO/2016/134191. A primer or primer pair used for a method herein can be any suitable prime or primer pair described in US Pat. 9,212,394 or International Pat. Application Pub. No. WO/2016/134191.
Exonuclease
[0095] In some embodiments, a method herein comprises selectively digesting one strand of a double stranded molecule (e.g., a double stranded amplicon)to produce single stranded molecules. In some embodiments, the method comprises contacting an exonuclease to an amplified ligated probe set, and selectively digesting one strand of the amplified ligated probe set from the 5’-end while the other strand is protected from digestion (e.g., by having a blocked 5'-end, e.g., by having a label attached to the 5'-end). In certain embodiments, contacting an exonuclease to a double stranded amplicon may digest an unlabeled strand from the 5’-end while the 5’-end a labeled strand is protected from exonuclease digestion. An exonuclease used for a method described herein can be any suitable exonuclease described in US Pat. 9,212,394 or International Pat. Application Pub. No. WO/2016/134191.
Labels
[0096] In some embodiments a nucleic acid, comprises one or more distinguishable identifiers. Any suitable distinguishable identifier and/or detectable identifier can be used for a method described herein. In certain embodiments a distinguishable identifier can be directly or indirectly associated with (e.g., bound to) a nucleic acid. For example, a distinguishable identifier can be covalently or non- covalently bound to a nucleic acid (e.g., a ligated probe set, an amplicon). In some embodiments a distinguishable identifier is bound to or associated with a binding agent or a member of binding pair that is covalently or non-covalently bound to a nucleic acid. In some embodiments a distinguishable identifier is reversibly associated with a nucleic acid. In certain embodiments a distinguishable identifier that is reversibly associated with a nucleic acid can be removed from a nucleic acid using a suitable method (e.g., by increasing salt concentration, denaturing, washing, adding a suitable solvent and/or by heating).
[0097] In some embodiments a distinguishable identifier is a label. In some embodiments a nucleic acid comprises a detectable label, non-limiting examples of which include a radiolabel (e.g., an isotope), a metallic label, a fluorescent label, a chromophore, a chemiluminescent label, an electro chemiluminescent label (e.g., Origen™), a phosphorescent label, a quencher (e.g., a fluorophore quencher), a fluorescence resonance energy transfer (FRET) pair (e.g., donor and acceptor), a dye, infra-red dyes, a protein (e.g., an enzyme (e.g., alkaline phosphatase and horseradish peroxidase), an antibody, an antigen or part thereof, a linker, a member of a binding pair), an enzyme substrate, a small molecule (e.g., biotin, avidin), a mass tag, quantum dots, nanoparticles, the like or combinations thereof. Any suitable fluorophore can be used as a label. A light emitting label can be detected and/or quantitated by a variety of suitable techniques non-limiting examples of which include flow cytometry, digital imaging, analogue imaging, microarray imaging, CCD camera imaging, a photo
sensor, mass spectrometry, fluorescence microscopy, confocal laser scanning microscopy, laser scanning cytometry, electric field suspension, the like and combinations thereof.
[0098] A suitable label can be used for a method herein. A suitable label can be attached to a probe or primer disclosed herein using a suitable method. In some embodiments, a probe (e.g., a labeling probe), primer, ligation product, extension product, or amplicon comprises one or more labels. A label may be directly detectable or indirectly detectable. In some embodiments, two or more labels are distinguishable from each other, e.g., according to color (e.g., wavelength emission). In some embodiments, a label comprising a fluorescent substance, non-limiting examples of which include fluorescent dyes (e.g., fluorescein, phosphor, rhodamine, polymethine dye derivatives, and the like), BODYPY FL (trademark, produced by Molecular Probes, Inc.), FluorePrime (Amersham Pharmacia Biotech, Inc.), Fluoredite (Millipore Corporation), FAM (ABI Inc.), Cy3 and Cy5 (available at Amersham Pharmacia), TAMRA (Molecular Probes, Inc.), Pacific Blue, Alexa 488, Alexa 594, Alexa 647, Atto 488, Atto 590, Atto 647N and the like.
[0099] A label may be attached anywhere within a sequence of a nucleic acid, including at the 5’ or 3’-end. A label can be any suitable label described in US Pat. 9,212,394 or International Pat. Application Pub. No. WO/2016/134191.
Affinity Tags
[00100] In certain embodiments, a nucleic acid comprises one or more affinity tags. In some embodiments, a tagging probe comprises an affinity tag. In certain embodiments, a primer, a probe, a ligated probe set, and/or amplicons (e.g., amplified ligated probe sets) comprise an affinity tag. In some embodiments, a tagging probe does not comprise an affinity tag, but is configured to incorporate an affinity tag into, for example, an amplicon or extension product. For example, a tagging probe may comprise a primer binding site configured to hybridize to a primer comprising an affinity tag such that an affinity tag in incorporated into an extension or amplification product comprising a sequence, or complement thereof, of the tagging probe. In some embodiments, a tagging probe comprises a binder (e.g., biotin) that is configured to associate with a binding partner (e.g., streptavidin) that is attached to an affinity tag. According, in certain embodiments, an affinity tag can be attached to or incorporated into a nucleic acid comprising a sequence of a tagging probe, or complement thereof, using any suitable method.
[00101] In some embodiments, an affinity tag is configured to and/or designed to immobilize a nucleic acid to a substrate (e.g., an element of a microarray). In certain embodiments, a tagging probe, ligated probe set, or amplicons thereof are designed to have an affinity tag configured to bind to a predetermined location on a substrate or array.
[00102] In some embodiments, an affinity tag is a relatively short nucleic acid having a sequence complementary to another nucleic acid (e.g., capture sequence), or portion thereof, that is often immobilized on a substrate. In some embodiments, an affinity tag comprises a non-naturally occurring sequence, an artificial sequence or synthetic sequence that is not present, or not expected to be present, in a genome of a genetic sample. An affinity tag is often unique to all other sequences present in a sample. An affinity tag is often completely or partially complementary to a capture sequence, or portion thereof. An affinity tag is often configured to specifically hybridize to a capture sequence. In certain embodiments, a capture sequence is a nucleic acid comprising a sequence completely or partially complementary to an affinity tag. A capture sequence is often immobilized or attached to a substrate (e.g., an element of an array).
[00103] An affinity tag or capture sequence may comprise naturally occurring nucleotides or nucleotide analogues. In some embodiments an affinity tag comprises locked nucleic acids.
[00104] An affinity tag can be any suitable tag described in US Pat. 9,212,394 or International Pat. Application Pub. No. WO/2016/134191.
[00105] In some embodiments, a probe comprises a binder. In some embodiments, a tagging probe comprises a binder. In some embodiments, a ligation product, ligated probe product or amplicons thereof comprise a binder. In certain embodiments, a binder is a suitable binding motif that allows for specific isolation, enrichment or immobilization of a nucleic acid (e.g., a ligated probe set or an amplicon thereof). Non-limiting examples of a binder include a binding partner described herein (e.g., an antigen, an antibody, biotin, streptavidin, and the like), a member of a binding pair (e.g., biotin/streptavidin; His-tag/anti-His-tag antibody; His-tag/His-tag binding metal; FLAG tag/anti-Flag antibody), click chemistry motifs (e.g., a functional group that rapidly and selectively reacts with another chemical motif to form a covalent bond), antigen/anti-antigen antibodies, and the like.
Immobilization/Arrays
[00106] In some embodiments, a ligated probe set, or an amplicon thereof is immobilized to a substrate. In certain embodiments, an affinity tag of a ligated probe set, or amplicon is immobilized to a substrate. In certain embodiments, a binder of a ligated probe set, or amplicon is immobilized to a substrate. Ligated probe sets and/or an amplicon thereof are often immobilized to one or more predetermined locations on a substrate. Immobilization may refer to covalent attachment or non- covalent attachment (e.g., to a substrate). In some embodiments, immobilization comprises hybridizing an affinity tag to a complementary nucleic acid molecule (e.g., a capture sequence) immobilized on a substrate. An affinity tag, ligated probe set, extension products thereof or amplicons thereof can be immobilized to a substrate by a method described in US Pat. 9,212,394 or International Pat. Application Pub. No. WO/2016/134191. A microarray comprising immobilized capture
sequences, immobilized affinity tags, immobilized labels, immobilized ligated probe set, immobilized extension products thereof and/or immobilized amplicons thereof can be made by a process described in International Pat. Application Pub. No. WO/2016/134191.
[00107] In some embodiments, immobilized labels are optically resolvable. The term “optically resolvable label” or “optically individually resolvable label” or “optically separated labels” herein means a group of labels that may be distinguished from each other by their photonic emission, or other optical properties, for example, after immobilization as described herein. In additional embodiments, even though the labels may have the same optical and/or spectral emission properties, the immobilized labels may be distinguished from each other spatially. In some embodiments, labels of the same type, which are labels having the same optical properties, are immobilized on the substrate, for example as a member of an array described herein, at a density and/or spacing such that the individual probe products are resolvable as shown in item 12 of Figure 6, or as shown in Figs. 4 and 5. In this disclosure, the “same labels” are defined to be labels having identical chemical and physical compositions. The “different labels” herein mean labels having different chemical and/or physical compositions, including “labels of different types” having different optical properties. The “different labels of the same type” herein means labels having different chemical and/or physical compositions, but the same optical properties.
[00108] Item 12 of Figure 6 depicts an image of an exemplary member of an array comprising immobilized labels or labeled probe products. In these embodiments, the labels are spatially addressable as the location of a molecule specifies its identity (and in spatial combinatorial synthesis, the identity is a consequence of location). In additional embodiments, one member of the array on the substrate may have one or multiple labeled probe products (e.g., ligated probe sets or amplicons thereof) immobilized to the member. In some embodiments, when multiple labeled probe products are immobilized to one member of an array, labels of the same type (i.e., having the same optical properties, e.g., same color, or similar emission wavelengths) may be distinguished from each other spatially as shown in item 12 of Figure 6. In some embodiments, immobilized labels on an element of an array that are of the same type are separated by a distance about from 0.1 to 1000 nm, 1 to 1000 nm, 5 to 500 nm, 5 to 100 nm, or from 10 to 100 nm; about 100, 150, 200, 250, 300, 350, or 400 nm or more; and/or about 50, 100, 150, 200, 250, 300, 350, or 400 nm or less in all dimensions (e.g., at least in the x and y dimensions of a substantially flat substrate). The density of probe products and/or their attached labels on a substrate may be up to many millions (and up to one billion or more) probe products per substrate, or per element on a substrate. In some embodiments, an element of a substrate comprises about 5 to 20,000, about 500 to 10,000, or about 500 to 5000 immobilized labeled probe products. In some embodiments, the numbers of labels immobilized on the substrate,
or element of a substate, are counted. Counts of different labels (e.g., those having different optical properties, e.g., different colors) are often determined and analyzed by a method described herein. [00109] Optically resolvable single molecule arrays may be prepared according to any of the methods described in the present disclosure or by a suitable method descried in International Pat. Application Pub. No. WO/2016/134191.
[00110] Labels, affinity tags, probe products, ligated probe sets, extension products thereof and amplicons thereof can be immobilized to a suitable substrate by a method described herein. In some embodiments, a substrate or solid support used for a method herein is a substrate descried in International Pat. Application Pub. No. WO/2016/134191.
[00111] An array (e.g., a microarray) may have multiple members (e.g., see Fig. 6, 3-10) that may or may not have an overlap (6) between the members. Each member may have at least an area with no overlap with another member (3-5 and 7-10). In additional embodiments, each member may have different shapes (e.g., circular spots (3-8), triangles (9), and squares (10)) and dimensions. A member of an array may have an area about from 1 to 107 micron2, from 100 to 107 micron2, from 103 to 108 micron2, from 104 to 107 micron2; from 105 to 107 micron2; about 0.0001 , 0.001 , 0.01 , 0.1 , 1 , 10, 100, 103, 104, 105, 106, 107, 108 or more micron2; and/or about 0.001 , 0.01 , 0.1 , 1 , 10, 100, 103, 104,
105, 106, 107, 108 or less micron2. Members of an array may be separated by a distance about from 0 to 104 microns, from 0 to 103 microns, from 102 to 104 microns, or from 102 to 103 microns; about 0, 0.001 , 0.1 , 1 , 2, 3, 4, 5, 10, 50, 100, 103, 104, 105, 106, 107, or 108 microns or more; and/or about 0, 0.001 , 0.1 , 1 , 2, 3, 4, 5, 10, 50, 100, 103, 104, 105, 106, 107, or 108 microns or less. Here, the distance by which two members of the array are separated may be determined by the shortest distance between the edges of the members. In some embodiments, a member of an array a member described in International Pat. Application Pub. No. WO/2016/134191. Members of an array may have different shapes and sizes. In some embodiments, each member of an array has the same shape and/or size. In some embodiments, one or more members of an array comprise the same immobilized capture sequence.
[00112] In some embodiments, a size of an array member and/or a density of capture sequences, binding partners or immobilized labeled probe products housed in an element of an array may be controlled and/or defined using a suitable method, e.g., a method described in International Pat. Application Pub. No. WO/2016/134191.
Detection/Counts
[00113] In some embodiments a method herein comprises counting, or determining a count, sum, quantity or amount of individual labeled probe products on an array (e.g., an element of an array). In certain embodiments a method herein comprises counting, or determining a count, sum,
quantity or amount of individual labeled probe products on an array (e.g., an element of an array) of a first type (e.g., a first color) and counting, or determining a count, sum, quantity or amount of individual labeled probe products on the same array (e.g., same element of the array) of a second type (e.g., a different color). In some embodiments, individual labeled probe products on an array (e.g., an element of an array) are counted. In some embodiments, individual optically resolvable labeled probe products on an array (e.g., an element of an array) are counted and/or compared. A count, quantity or sum of individual labeled probe products on an array (e.g., an element of an array) can be determined using a suitable method.
[00114] In some embodiments, probe products are prepared such that they are grouped together by locus (in this case chromosome 21 or chromosome 18) and counted separately on a substrate. For example, probe products corresponding to loci on chromosome 21 may be isolated and/or counted separately, and probe products corresponding to loci on chromosome 18 may be isolated and/or counted separately. In additional embodiments, probe products are grouped together in the same location of a substrate (e.g., the same member of an array) as described herein. In this embodiment, on the same region or element of a substrate, probe products bearing a red fluorophore (e.g., corresponding to chromosome 21), and probe products with a green fluorophore (e.g., corresponding to chromosome 18) are optically resolvable, are distinguishable from each other, are individually counted and the counts are compared. For example, since all of the probe products are individually resolvable and may therefore be counted very accurately, an increased frequency of chromosome 21 probe products relative to chromosome 18 probe products (even as small as 0.01, 0.1 , one or more percent or less) can signify a presence of trisomy 21 in a fetus when analyzed by a method described herein. In this case, the probe products for chromosome 18 may serve as a control.
[00115] In certain embodiments, the methods of the present disclosure may comprise counting the labels of the probe sets immobilized to the substrate. In certain embodiments, the methods may comprise enumerating, quantitating, detecting, discovering, determining, measuring, evaluating, calculating, counting, and assessing the labels, probes, probe sets described herein, for example, including quantitative and/or qualitative determinations, including, for example, identifying the labels, probes, probe sets, determining presence and/or absence, proportion, relative signals, or relative counts of the labels, probes, probe sets, and quantifying the labels, probes, probe sets. In some embodiments, the methods may comprise enumerating, quantitating, detecting, discovering, determining, measuring, evaluating, calculating, counting, and/or assessing (i) a first number of the first label immobilized to the substrate, and (ii) a second number of the second label immobilized to the substrate. The detecting, discovering, determining, measuring, evaluating, calculating, counting,
and/or assessing step may be performed after immobilizing the ligated probe set to a substrate, and the substrate with immobilized ligated probe sets may be stored in a condition to prevent degradation of the ligated probe sets (e.g., at room temperature or a temperature below the room temperature) before this step is performed.
[00116] In some embodiments, the counting step comprises determining the numbers of labels, probes or probe sets based on an intensity, energy, relative signal, signal-to-noise, focus, sharpness, size, or shape of one or more putative labels. The putative labels include, for example, labels, particulate, punctate, discrete or granular background, and/or other background signals or false signals that mimic or are similar to labels. The methods described herein may include the step of enumerating, quantitating, detecting, discovering, determining, measuring, evaluating, calculating, counting, and/or assessing the labels, probes, and probe sets. This step is not limited to integer counting of the labels, probes, and probe sets. For example, counts may be weighted by the intensity of the signal from the label. In some embodiments, higher intensity signals are given greater weight and result in a higher counted number compared to lower intensity signals. In the instance where two molecules are very close together (for example, when imaging is diffraction limited), the two labels will not be easily resolved from one another. In this case they may appear to be a single label, but with greater intensity than a typical single label (i.e., the cumulative signal of both the labels). As such, in certain embodiments, counting can be more accurate when the intensity, or other characteristics or properties of a label (e.g., such as size and shape as described below) are considered or weighted. In some embodiments, the shapes of the labels are considered, and the counting may include or exclude one or more of the labels depending on the shapes of the labels. In additional embodiments, the size of one or more labels or items, objects, or spots on an image may be considered, and the counting may include, exclude, or adjusted depending on the size. In further embodiments, counting may be done on any scale, including but not limited to integers, rational or irrational numbers. Any properties of the label or multiple labels may be used to define the count given to the observation.
[00117] In additional embodiments, the counting step may include determining the numbers of labels, probes or probe sets by summation over a vector or matrix containing the information (e.g., intensity, energy, relative signal, signal-to-noise, focus, sharpness, size or shape) about the putative label. For example, for each discrete observation of a label, information on its size, shape, energy, relative signal, signal-to-noise, focus, sharpness, intensity and other factors may be used to weight the count. Certain examples of the value of this approach would be when two fluors are coincident and appear as a single point. In this case, two fluors would have higher intensity than one fluor, and thus this information may be used to correct the count (i.e., counting 2 instead of 1). In some embodiments, the count can be corrected or adjusted by performing the calibrating described below.
The vector or matrix may contain integer, rational, irrational or other numeric types. In some embodiments, weighting may also include determining, evaluating, calculating, or assessing likelihoods or probabilities, for example, the probability that an observation is a label, not a background particle. These probabilities may be based on prior observations, theoretical predictions or other factors. In additional embodiments, the initial count is the number of putative labels observed. This number may then be improved, corrected or calibrated by weighting each of the putative labels in the appropriate manner.
[00118] In some embodiments, an immobilized label may be detected by scanning probe microscopy (SPM), scanning tunneling microscopy (STM) and atomic force microscopy (AFM), electron microscopy, optical interrogation/detection techniques including, but not limited to, near-field scanning optical microscopy (NSOM), confocal microscopy and evanescent wave excitation. More specific versions of these techniques include far-field confocal microscopy, two-photon microscopy, wide-field epi-illumination, and total internal reflection (TIR) microscopy. Many of the above techniques may also be used in a spectroscopic mode. The actual detection is by charge coupled device (CCD) cameras and intensified CCDs, photodiodes and/or photomultiplier tubes. In some embodiments, the counting step comprises an optical analysis, detecting an optical property of a label.
[00119] In certain embodiments, the counting step comprises reading the substrate in first and second imaging channels that correspond to the first and second labels, respectively, and producing one or more images of the substrate, wherein the first and second labeling probes are resolvable in the one or more images. In some embodiments, the counting step comprises spatial filtering for image segmentation. In additional embodiments, the counting step comprises watershedding analysis, or a hybrid method for image segmentation. Individual methods may be applied more than once, with the same or different parameters or conditions. For, example, watershedding may divide the image into a set of regions, and then a re-application of watershedding within each region may be used to detect one or more labels within the regions defined by the initial watershedding analysis. [00120] In certain embodiments, a count, quantity or sum of individual labeled probe products immobilized on an array (e.g., an element of an array) can be determined using a process described in US Pat. 9,212,394 or International Pat. Application Pub. No. WO/2016/134191.
Methods and Processes
[00121] In some embodiments, one or more method or process described herein are computer implemented methods. In certain embodiments, counting, determining counts, measuring, statistical analysis (e.g., calculations of probability or likelihood), comparison, estimation, quantitation, evaluation, optimization, calculations of a function/metric (e.g., at a given parameter value), decision-
making, and/or goodness-of-fit steps are performed using a computer. In certain embodiments, image analysis is performed using a computer. In some embodiments, counting comprises analyzing an artificial, processed digital images ( e.g ., a matrix of intensity values). In some embodiments, counting does not comprise direct inspection of unprocessed visual light emitted from an array by visual inspection by a naked eye.
[00122] In some embodiments, detection of a label may be by direct observation or measurement or by detecting a resultant property or secondary effect, such as the result of an interaction between and probe and target. For example, the incorporation of a deoxyribonucleotide triphosphate (dNTP) into a DNA strand causes the release of a hydrogen ion that can be detected by an ion sensor (for example, an array of ion-sensitive field-effect transistors). Unlike many biological applications, the signal from single molecule arrays cannot be seen by the human eye. In this way, whether the dye emits in the visible wavelength is less important than for many biological applications. Infra-red (IR) or near infra-red dyes are therefore particularly well suited to this application as they have low contamination.
[00123] In one aspect, the counts described herein may be normalized, for example, by the density of the labels on the surface, the observed density of background particles (that mimic labels) or other factors. In certain embodiments, counts may be transformed using standard mathematical functions and transformations (e.g., logarithm). In certain embodiments, counts can be used to produce ratios. For example, if the count of Label 1 and Label 2 are X and Y, the ratio X/Y may be used to combine the two numbers. These ratios can be compared within and between samples. In some instances, if Label 1 represents Chromosome 21 and Label 2 Chromosome 1, the ratio X/Y would be expected to be higher in cfDNA from a pregnant woman whose fetus has Down's Syndrome than it would be in cfDNA from a pregnant woman whose fetus did not have Down's Syndrome. [00124] The methods described herein may also look at the frequency of different alleles at the same genetic locus (e.g., two alleles of a given single nucleotide polymorphisms). The accuracy of these methods may detect very small changes in frequency (e.g., as low as about 10, 5, 4, 3, 2, 1 ,
0.5, 0.1 or 0.01 % or less). As an example, in the case of organ transplantation, a blood sample will contain a very dilute genetic signature from the donated organ. This signature may be the presence of an allele that is not in the recipient of the donated organ's genome. The methods described herein may detect very small deviations in allele frequency (e.g. , as low as about 10, 5, 4, 3, 2, 1 , 0.5, 0.1 or 0.01 % or less) and may identify the presence of donor DNA in a host sample (e.g., blood sample).
An unhealthy transplanted organ may result in elevated levels of donor DNA in the host blood - a rise of only a few percent (e.g., as low as about 10, 5, 4, 3, 2, 1 , 0.5, 0.1 or 0.01 % or less). The methods described herein may be sensitive enough to identify changes in allele frequency with the necessary
sensitivity, and therefore may accurately determine the presence and changing amounts of donor DNA in host blood.
[00125] In certain embodiments, the methods of the present disclosure may comprise comparing the first and second numbers to determine the genetic variation in the genetic sample. [00126] In certain embodiments, a genetic fraction of a first genome in a genetic sample is determined according to an amount of a plurality of informative polymorphic loci located at a plurality of reference loci in the genetic sample. In certain embodiments, a genetic fraction of a first genome in a genetic sample is determined according to an amount (e.g., counts) of a first allele of a plurality of informative polymorphic loci located at a plurality of reference loci in a first genome and an amount (e.g., counts) of a second allele of each of the plurality of informative polymorphic loci located at the plurality of reference loci in a second genome (different than the first) in the genetic sample. An amount of one or more alleles of an informative polymorphic loci may be determined using a suitable method. In some embodiments, an amount of one or more alleles of an informative polymorphic loci may be determined using an NGS sequencing method (e.g., a targeted sequencing method or a whole genome sequencing method. In some embodiments, an amount of one or more alleles of an informative polymorphic loci are determined using a microarray as described herein, which in certain embodiments comprises hybridizing, ligating and amplifying a suitable probe set described herein (e.g., a probe set shown in Figs. 1-33), immobilizing the amplified ligated probe sets and counting the labeled probe products immobilized to an element of an array. In some embodiments, an amount of one or more alleles of one or more informative polymorphic loci are determined using a method described in US Pat. 9,212,394 or International Pat. Application Pub. No. WO/2016/134191.
[00127] In some embodiments, a genetic fraction determined by a method described herein is a likelihood or probability distribution generated according to a suitable method. In certain embodiments, multiple likelihood distributions are generated.
[00128] In some embodiments, a method comprises determining a copy number of a nucleic acid region of interest in a genome (e.g., a genome of interest). In some embodiments, a method comprises analyzing a genetic sample. A genetic sample may be obtained or provided. A genetic sample often comprises genetic material derived from a first genome and genetic material derived from a second genome.
[00129] In certain embodiments, a method comprises determining a suitable metric (e.g., a first metric) of a copy number hypothesis for a nucleic acid region of interest in a genome (e.g., a first genome). In certain embodiments, a metric is a suitable statistical metric or statistical measure, nonlimiting examples of which include a probability and a likelihood. In certain embodiments, a metric is a suitable statistical metric or statistical measure of a copy number of a nucleic acid region of interest in
a genome based on a particular copy number hypothesis. In some embodiments, a copy number hypothesis is represented by a mathematical expression that defines a particular copy number of a nucleic acid region of interest in a genome. In some embodiments, a metric comprises a distribution (e.g., probability distribution or likelihood distribution). In some embodiments, a metric comprises a function. In certain embodiments, a metric is a combination of two or more metrics (e.g., a joint metric, a joint probability). In some embodiments, a metric is a joint probability and is determined by combining two or more probabilities using a suitable process. In certain embodiments, a metric is a joint probability determined by combining or joining a first probability and a second probability of a copy number hypothesis. Two or more probabilities can be joined using a suitable mathematical process (e.g., by adding or multiplying).
[00130] In certain embodiments, a metric, probability or likelihood of a copy number hypothesis is a function of an amount of one or more loci in a genetic sample. An amount of loci present in a sample can be determined by a suitable process (e.g., a method described herein). In some embodiments, an amount of one or more loci is a sum, mean, average, or absolute amount of one or more loci in a sample. In some embodiments, an amount of one or more loci is determined according to a representative subset or sampling of one or more loci present in a sample. In some embodiments, an amount of one or more loci is sum, mean, average or absolute count of some (e.g., a representative subset) or all of one or more loci present in a sample. In some embodiments, an amount of a plurality of loci is a suitable distribution of one or more loci. In some embodiments, an amount of one or more loci is a z-score.
[00131] In certain embodiments, a metric, likelihood or probability of a copy number hypothesis is a function of an amount of a plurality of non-polymorphic loci in a genetic sample. In certain embodiments, a metric, likelihood or probability of a copy number hypothesis is a function of (i) an amount of a plurality of non-polymorphic reference loci in a genetic sample, and (ii) an amount of a plurality of non-polymorphic loci in a nucleic acid region of interest in the genetic sample. In certain embodiments, a metric, likelihood or probability of a copy number hypothesis is determined, in part, according to a suitable mathematical comparison of i) an amount of a plurality of non-polymorphic reference loci in a genetic sample, and (ii) an amount of a plurality of non-polymorphic loci in a nucleic acid region of interest in the genetic sample. In certain embodiments, a metric, likelihood or probability of a copy number hypothesis is determined, in part, according to a ratio of i) an amount of a plurality of non-polymorphic reference loci in a genetic sample, and (ii) an amount of a plurality of non-polymorphic loci in a nucleic acid region of interest in the genetic sample, or an inverse ration thereof.
[00132] In certain embodiments, a metric, likelihood or probability of a copy number hypothesis is a function of a genetic fraction of genetic material in a genetic sample. In certain embodiments, a metric, likelihood or probability of a copy number hypothesis is a function of a genetic fraction of an amount of genetic material derived from a first genome or source in a genetic sample relative to an amount of genetic material derived from another genome or source in the genetic sample. In certain embodiments, a metric, likelihood or probability of a copy number hypothesis is a function of a likelihood distribution of a genetic fraction of genetic material derived from a first genome or source in the genetic sample relative to an amount of genetic material derived from a second genome or source in a genetic sample. A likelihood distribution can be determined using a suitable statistical method. In some embodiments, a likelihood distribution comprises a probability distribution.
[00133] In certain embodiments, a metric, likelihood or probability of a copy number hypothesis is a function of i) an amount of a plurality of non-polymorphic reference loci in a genetic sample, (ii) an amount of a plurality of non-polymorphic loci in a nucleic acid region of interest in the genetic sample, and (iii) a genetic fraction of genetic material in a genetic sample. In some embodiments, the genetic fraction of (iii) is determined according to i) an amount of a plurality of non-polymorphic reference loci in a genetic sample, and (ii) an amount of a plurality of non-polymorphic loci in a nucleic acid region of interest in the genetic sample. In some embodiments, a genetic fraction is a function of i) an amount of a plurality of non-polymorphic reference loci in a genetic sample, and (ii) an amount of a plurality of non-polymorphic loci in a nucleic acid region of interest in the genetic sample.
[00134] In some embodiments, a genetic fraction of genetic material in a sample is determined according to a one or more polymorphic alleles located at one or more reference loci in a genetic sample. In some embodiments, a genetic fraction of genetic material is determined according to a plurality of informative polymorphic alleles located at a plurality of reference loci in a genetic sample.
In some embodiments, a genetic fraction of genetic material is determined by comparing a first genotype (e.g., a first expected genotype, e.g., a first genotype hypothesis) of a first genome in a sample to a second genotype (e.g., a second expected genotype, e.g., a second genotype hypothesis) of a second genome in the sample, where the first and second genotypes are defined by two different alleles of a polymorphic allele present in a sample.
[00135] In some embodiments, a metric, likelihood or probability of a copy number hypothesis is determining by a joint probability by combining a first and second probability of a copy number hypothesis, each of which first and second probabilities are a function of different genetic fraction metrics. For example, where a copy number hypothesis is a presumption of a trisomy 18 in a fetus, the hypothesis is represented by two probability distributions A and B, where B is a function of i) an amount of a plurality of non-polymorphic reference loci in a genetic sample, (ii) an amount of a
plurality of non-polymorphic loci in a nucleic acid region of interest (i.e., Chr. 18) in the genetic sample, and a probability of a genetic fraction of genetic material derived from the fetus determined according to the amounts of (i) and (ii). In certain embodiments, the second probability distribution B of the trisomy 18 hypothesis is a function of i) an amount of a plurality of non-polymorphic reference loci in a genetic sample, (ii) an amount of a plurality of non-polymorphic loci in a nucleic acid region of interest (i.e., Chr. 18) in the genetic sample, and a probability of a genetic fraction of genetic material derived from the fetus determined according to a plurality of informative polymorphic alleles (e.g., SNPs) located at a plurality of reference loci in the genetic sample. In the above example, the joint probability is determined by combining the probability distribution of A with the probability distribution of B, thereby providing a first metric, likelihood or probability of the copy number hypothesis that the fetus is a trisomy 18.
[00136] In some embodiments, two or more metrics, likelihoods or probabilities of a copy number hypothesis are determining by a joint probability by combining a first and second probability of a copy number hypothesis as described above. For example, a first metric, likelihood or probability of a copy number hypothesis is a hypothesis that the fetus is a trisomy 18, and a second metric, likelihood or probability of a copy number hypothesis is a hypothesis that the fetus is euploid for Chr. 18. In certain embodiments, both the first and second metrics are determined by a joint probability as described above. In some embodiments, the first metric and the second metric are distributions (e.g., probability or likelihood distributions).
[00137] In some embodiments, a first and a second metric are compared to determined which metric has a higher value (e.g., peak value, e.g., highest area under the curve), which often defines a true copy number hypothesis. A first and second metric of a copy number hypothesis can be compared by a suitable method. In some embodiments where the first and second metric are distributions, each of the distributions can be compared graphically. In some embodiments, a peak value of each of the metrics are compared.
[00138] In some embodiments, the measured genetic data from a sample of genetic material that contains both fetal and maternal DNA is analysed, along with the genetic data from the biological parents of the fetus, and the copy number of the chromosome of interest is determined or estimated. However, these methods typically rely on estimating the genetic fraction (e.g., a fraction of genetic material derived from a given source in a genetic sample comprising genetic material from multiple sources) solely by point estimation, which can vary from the actual genetic fraction, thereby introducing error into the method. In other words, the fraction of genetic material from a given source is estimated to be a single value or a constant, and this estimated value or constant can differ from the true value or true estimate of the genetic fraction.
[00139] In certain embodiments, the distribution of fragment sizes may be used to assess the fetal fraction and the presence of trisomy. This information may be used in combination with an array of the current disclosure to provide more information on the presence of fetal material in the sample and the disease status of the fetus (for example, where it carries a trisomy).
[00140] In one aspect, data for determining a genetic fraction may be obtained at the same time as the data for determining the genetic variation is collected. In certain embodiments, the data for determining a genetic fraction is the same data, or a subset of the data, for determining the genetic variation. For example, data from nucleic acid molecules corresponding to chromosomes not expected to have a genetic variation can be used to determine the genetic fraction. In certain embodiments, the data for determining a genetic fraction can be obtained prior to collecting the data for determining the genetic variation. In certain embodiments, the data for determining a genetic fraction can be obtained after collecting the data for determining the genetic variation.
[00141] In some embodiments, detecting, discovering, determining, measuring, evaluating, counting, and assessing the genetic variation are used interchangeably and include quantitative and/or qualitative determinations, including, for example, identifying the genetic variation, determining presence and/or absence of the genetic variation, and quantifying the genetic variation. In further embodiments, the methods of the present disclosure may detect multiple genetic variations.
[00142] The present disclosure also relates to methods of determining genetic variation in a genetic sample, said genetic sample containing a first genetic material and optionally having a second genetic material, the method comprising: (a) determining, using a computer system, a first metric corresponding to a measure of certainty of a null hypothesis that the genetic variation is absent in the genetic sample, wherein the first metric is a continuous or discontinuous function of a fraction of the second genetic material, and conditioned on the absence of the genetic variation in a first data set; (b) determining, using a computer system, a second metric corresponding to a measure of certainty of an alternative hypothesis that the genetic variation is present in the genetic sample, wherein the second metric is a continuous or discontinuous function of the fraction of the second genetic material, and conditioned on the presence of the genetic variation in the first data set; (c) determining, using a computer system, a relative number based on the first metric and the second metric; and (d) determining, using a computer system, if the genetic variation is present in the genetic sample by comparing the relative number to a reference number. In certain embodiments, the present disclosure provides a method comprising determining with certainty, using a computer system, if the genetic variation is present in the genetic sample by comparing the relative number to a reference number. In certain embodiments, the present disclosure provides a method comprising determining, using a computer system, the probability that the genetic variation is present in the genetic sample by
comparing the relative number to a reference number. As used herein, the term “function” can refer to a continuous function, a discontinuous function (e.g., a discrete function), or any combination thereof. [00143] In one aspect, the relative number corresponds to a difference or a ratio (e.g., an odds ratio) between the first metric (disomic) and the second metric (trisomic) occurring at a predetermined fraction of the second genetic material. In one aspect, the predetermined fraction is the same for the first metric and the second metric. In one aspect, the predetermined fraction is different for the first metric and the second metric. In one aspect, the relative number corresponds to a difference or a ratio between the first metric and the second metric occurring at the fraction of the second genetic material that maximizes the first metric. In one aspect, the relative number corresponds to a difference or a ratio between the first metric and the second metric occurring at the fraction of the second genetic material that maximizes the second metric. In one aspect, the relative number corresponds to a difference or a ratio between the first metric and the second metric occurring at the fraction of the second genetic material that maximizes the ratio between the first metric and the second metric. In one aspect, the relative number corresponds to a difference or a ratio between (i) the first metric occurring at a fraction of the second genetic material that maximizes the first metric, and (ii) the second metric occurring at fraction of the second genetic material that maximizes the second metric.
In one aspect, the method further comprises determining the fraction of the second genetic material at which the difference or the ratio between the first and second metric is maximized. In one aspect, the first metric and the second metric are selected from the group consisting of probability and likelihood. In one aspect, the first data set is obtained by: (a) contacting a first probe set to the genetic sample, wherein the first probe set comprises a first labeling probe and a first tagging probe; (b) hybridizing the first probe set to one or more first nucleic acid regions of interest in nucleotide molecules present in the genetic sample; (c) labeling the first labeling probe with a first label; (d) immobilizing the first probe set to a substrate at a density in which the first label is optically resolvable after immobilization; and (e) detecting a number of the first labels corresponding to the first probe set immobilized to the substrate to detect the nucleic acid copy numbers of the one or more first nucleic acid regions of interest, thereby obtaining the first data set. In one aspect, the Statistical Power in detecting the genetic variation is increased by at least 0.05, at least 0.1, at least 0.15, at least 0.2, at least 0.3, at least 0.4, at least 0.5, at least 0.6, at least 0.7, at least 0.8, at least 0.9, or at least 0.99 as compared to a method in which the fraction of the second genetic material is determined by point estimation that does not maximize the probability of the metric. In one aspect, the Statistical Power in detecting the genetic variation is increased by at least 5%, at least 10%, at least 15%, at least 20%, at least 25%, at least 50%, at least 75%, at least 100%, at least 150%, at least 200%, at least 250%, at least 300%, at least 350%, at least 400%, at least 450%, at least 500%, at least 600%, at least 700%, at least 800%,
at least 900%, or at least 1000% as compared to a method in which the fraction of the second genetic material is determined by point estimation that does not maximize the probability of the metric. In one aspect, the Statistical Power is a result of maximizing the metric of the fraction of the second genetic material, as compared to using a point estimate of the fraction of the second genetic material from the first data set. In one aspect, the fraction of the second genetic material is not determined directly by point estimation from the first data set. In one aspect, the first genetic material comprises maternal genetic material from the subject, and the second genetic material comprises fetal genetic material from a fetus. In one aspect, the first genetic material comprises non-tumor derived genetic material, and the second genetic material comprises tumor-derived genetic material. In one aspect, determining the genetic variation comprises performing an additional test selected from the group consisting of microarrays, sequencing-by-synthesis, digital polymerase chain reaction (dPCR), realtime quantitative polymerase chain reaction (rtPCR), array capture, a nucleic acid sequence-based detection, massively parallel genomic sequencing, digital arrays, single molecule arrays, single molecule counting, oligo-ligation assays and single molecule sequencing. In one aspect, determining the genetic variation comprises performing an additional test comprising an array. In one aspect, determining the genetic variation comprises performing an additional test comprising a digital array. In one aspect, determining the genetic variation comprises performing an additional test comprising a single molecule array. In one aspect, determining the genetic variation comprises performing an additional test comprising single molecule counting. In one aspect, the additional test is performed using a digital array. In one aspect, the additional test is not performed using a digital array. It is contemplated that the additional test can comprise performing any test known in the art that may be used to determine a genetic variation. In one aspect, the additional test is performed using the genetic sample or an additional genetic sample from the subject. In one aspect, the additional test is performed only if the relative number exceeds the reference number. In one aspect, the additional genetic sample is collected only if the relative number exceeds the reference number.
[00144] The present disclosure also relates to methods of determining genetic variation in a genetic sample, said genetic sample containing a first genetic material and optionally having a second genetic material, the method comprising: (a) determining, using a computer system, a first metric corresponding to a measure of certainty of a null hypothesis that the genetic variation is absent in the genetic sample, wherein the first metric is a function of a fraction of the second genetic material and conditioned on the absence of the genetic variation in both a first data set and a second data set; (b) determining, using a computer system, a second metric corresponding to a measure of certainty of an alternative hypothesis that the genetic variation is present in the genetic sample, wherein the second metric is a function of the fraction of the second genetic material and conditioned on the presence of
the genetic variation in at least one of the first data set and the second data set; (c) determining, using a computer system, a relative number corresponding to a maximum difference or a ratio between the first metric and the second metric; and (d) determining, using a computer system, if the genetic variation is present in the genetic sample by comparing the relative number to a reference number. [00145] In one aspect, the method further comprises determining the fraction of the second genetic material at which the difference or the ratio between the first and second metric is maximized. In one aspect, the first metric and the second metric are selected from the group consisting of probability and likelihood. In one aspect, the first metric and the second metric are determined using a first data set and a second data set obtained by: (a) contacting a first probe set and a second probe set to the genetic sample, wherein the first probe set and the second probe set comprise a first labeling probe and a second labeling probe, respectively, and a first tagging probe and a second tagging probe, respectively; (b) hybridizing the first probe set to one or more first nucleic acid regions of interest, and the second probe set to one or more second nucleic acid regions of interest, in nucleotide molecules present in the genetic sample; (c) labeling the first labeling probe with a first label and the second labeling probe with a second label; (d) immobilizing the first probe set and the second probe set to one or more substrates at a density in which the first label and the second label are optically resolvable after immobilization; (e) detecting a number of the first labels corresponding to the first probe set, and the second labels corresponding to the second probe set, immobilized to the substrate to detect (i) the nucleic acid copy numbers of the one or more first nucleic acid regions of interest thereby obtaining the first data set, and (ii) the nucleic acid copy numbers of the one or more second nucleic acid regions of interest thereby obtaining the second data set. In one aspect, the method further comprises: (a) contacting a third probe set and a fourth probe set to the genetic sample, wherein the third probe set and the fourth probe set comprise a third labeling probe and a fourth labeling probe, respectively, and a third tagging probe and a fourth tagging probe, respectively; (b) hybridizing the third probe set to one or more third nucleic acid regions of interest, and the fourth probe set to one or more fourth nucleic acid regions of interest, in nucleotide molecules present in the genetic sample; (c) labeling the third labeling probe with a third label and the fourth labeling probe with a fourth label; (d) immobilizing the third probe set and the fourth probe set to one or more substrates at a density in which the third label and the fourth label are optically resolvable after immobilization; and (e) detecting a number of the third labels corresponding to the third probe set, and the fourth labels corresponding to the fourth probe set, immobilized to the substrate to detect (i) one or more third nucleic acid regions of interest thereby obtaining the third data set, and (ii) one or more fourth nucleic acid regions of interest thereby obtaining the fourth data set, wherein the one or more third nucleic acid regions of interest and the one or more fourth nucleic acid regions of interest each
correspond to an allele of a given genetic variant ( e.g ., a SNP). In one aspect, the first probe set and the second probe set comprise probes that interrogate non-polymorphic or polymorphic regions of interest, and the third probe set and the fourth probe set comprise SNP probes. In one aspect, the Statistical Power in detecting the genetic variation is increased by at least 0.05, at least 0.1 , at least 0.15, at least 0.2, at least 0.3, at least 0.4, at least 0.5, at least 0.6, at least 0.7, at least 0.8, at least 0.9, or at least 0.99 as compared to a method in which the fraction of the second genetic material is determined by point estimation that does not maximize the probability of the metric. In one aspect, the Statistical Power in detecting the genetic variation is increased by at least 5%, at least 10%, at least 15%, at least 20%, at least 25%, at least 50%, at least 75%, at least 100%, at least 150%, at least 200%, at least 250%, at least 300%, at least 350%, at least 400%, at least 450%, at least 500%, at least 600%, at least 700%, at least 800%, at least 900%, or at least 1000% as compared to a method in which the fraction of the second genetic material is determined by point estimation that does not maximize the probability of the metric. In one aspect, the increase in the Statistical Power is a result of maximizing the function of the fraction of the second genetic material, as compared to using a predetermined estimate of the fraction of the second genetic material from the first data set. In one aspect, the fraction of the second genetic material is not determined by point estimation. In one aspect, the first genetic material comprises maternal genetic material from the subject, and the second genetic material comprises fetal genetic material from a fetus. In one aspect, the first genetic material comprises non-tumor derived genetic material, and the second genetic material comprises tumor-derived genetic material. In one aspect, determining the genetic variation comprises performing an additional test selected from the group consisting of sequencing-by-synthesis, digital polymerase chain reaction, real-time quantitative polymerase chain reaction, array capture, a nucleic acid sequence-based detection, massively parallel genomic sequencing, digital arrays, single molecule arrays, single molecule counting, oligo-ligation assays and single molecule sequencing. In one aspect, determining the genetic variation comprises performing an additional test comprising a digital array. In one aspect, determining the genetic variation comprises performing an additional test comprising a single molecule array. In one aspect, determining the genetic variation comprises performing an additional test comprising single molecule counting. In one aspect, determining the genetic variation comprises performing an additional test comprising sequencing. In one aspect, the additional test is performed using the genetic sample or an additional genetic sample from the subject. In one aspect, the additional test is performed only if the relative number exceeds the reference number. In one aspect, the additional test is performed only if the relative number subceeds the reference number. In one aspect, the additional genetic sample is collected only if the relative number subceeds the reference number.
[00146] In certain embodiments, the methods of the present disclosure increase the Statistical Power of the method (e.g., a method for determining the presence or absence of a genetic variation). As used herein, the “Statistical Power” of a method can refer to one minus the probability of type II error (beta), where Type II error refers to the false acceptance of the null hypothesis. The null hypothesis generally refers to a hypothesis of “no difference” (e.g., a sample is ‘healthy’, or does not contain a genetic variation). Exemplary null hypotheses can include, for example, the absence of fetal trisomy, the absence of cancer, or the absence of transplant rejection. Generally, Statistical Power should be maximized when selecting a method to increase the probability of correctly rejecting the null hypothesis (e.g., the null hypothesis is truly false). In certain embodiments of the present disclosure, the Statistical Power of the method (e.g., for detecting the genetic variation) is increased by at least 0.05, at least 0.1 , at least 0.15, at least 0.2, at least 0.3, at least 0.4, at least 0.5, at least 0.6, at least 0.7, at least 0.8, at least 0.9, or at least 0.99 as compared to a method in which a genetic fraction is determined solely by point estimation. In certain embodiments of the present disclosure, the Statistical Power of the method (e.g., for detecting the genetic variation) is increased by at least 5%, at least 10%, at least 15%, at least 20%, at least 25%, at least 50%, at least 75%, at least 100%, at least 150%, at least 200%, at least 250%, at least 300%, at least 350%, at least 400%, at least 450%, at least 500%, at least 600%, at least 700%, at least 800%, at least 900%, or at least 1000% as compared to a method in which the fraction of the second genetic material is determined by point estimation that does not maximize the probability of a metric.
Genetic Fraction as a Trigger for Further Analysis
[00147] Estimation of the genetic fraction can be used to inform the collection and/or analysis of the test data (e.g., the data used to determine if a genetic variation is present in a genetic sample). In some embodiments, when the genetic fraction exceeds or equals a predetermined threshold, then a subsequent test is performed. Likewise, in some embodiments, when the genetic fraction does not exceed or equal a predetermined threshold, then a subsequent test is not performed. In other embodiments, when the genetic fraction does not exceed a predetermined threshold, then additional testing is delayed by a given period of time (e.g., days, weeks, months, or years). In yet another embodiment, the genetic fraction can be used to determine the type of additional test used. For example, when the genetic fraction does not exceed a predetermined threshold, then a more sensitive additional test may be used to determine the presence or absence of a genetic variation than if the genetic fraction had exceeded the predetermined threshold. An additional test can comprise, for example, analysing the genetic sample with sequencing-by-synthesis, digital polymerase chain reaction, real-time quantitative polymerase chain reaction, array capture, a nucleic acid sequence-based
detection, massively parallel genomic sequencing, digital arrays, single molecule arrays, single molecule counting, oligo-ligation assays or single molecule sequencing. In some embodiments, if the genetic fraction is below a predetermined threshold, then (i) the sample is re-analyzed, (ii) a new sample is obtained from the subject, and/or (iii) the sample is enriched for nucleic acids in the sample, and the analysis is repeated. In certain embodiments, the sample can be enriched for a particular analyte (e.g., genetic material from a fetus or tumor). Sequencing after such an enrichment results in a higher proportion of the resulting sequence data being relevant to determining the sequence of the region of interest, since a higher percentage of the sequence reads are generated from the region of interest, e.g., by single-molecule sequencing. At least a 10-fold, 25-fold, 100-fold, 200-fold, 300-fold, 500-fold, 700-fold, 1000-fold, 10,000-fold, or greater molar enrichment of the analyte can be achieved relative to the concentration in the original sample.
[00148] In certain embodiments, the genetic fraction may be weighted based on the quality of the estimate. In one example, the genetic fraction can be weighted by the intensity of the signal from various labels. In another example, the genetic fraction can be weighted based on the amount of data used to make the estimate. In another example, the genetic fraction can be weighted based on the distribution of estimates for the genetic fraction in a set of samples (e.g., by comparing the estimate of the genetic fractions for one or more samples against a reference set of samples).
[00149] In certain embodiments, the estimated genetic fraction is compared against a predetermined threshold to determine if an additional test should be performed. In certain embodiments, the predetermined threshold is determined based on the test being performed. For example, in Trisomy 18 testing, the predetermined threshold that the estimated fetal fraction should exceed in order to perform the additional test can be 1 %. In another example, in T risomy 21 testing, the predetermined threshold that the estimated fetal fraction should exceed in order to perform the additional test can 2%. The predetermined threshold can be determined empirically, or by theory or logic.
[00150] In certain embodiments, the estimated genetic fraction may be used to dynamically alter the method (e.g., the type of additional test performed, or a quality of the additional test performed). For example, if the genetic fraction is estimated to be 1%, 5%, or 10%, then 5 million, 3 million, or 1 million counts, respectively, can be collected when performing an additional test to determine the presence of a genetic variation. When a sample is estimated to have a low genetic fraction, more data can be collected when performing the additional test. In one embodiment, a threshold is used to determine how much a digital array is scanned. If the measured value for a specific sample equals or exceeds the threshold a certain portion of the array is scanned (e.g., a certain number of elements of the array). If
the measured value for a specific sample is less than the threshold, a different portion of the array is scanned ( e.g a larger number of elements than if the value had exceeded the threshold).
Optimizing a Metric Using Data from a Single Molecule Array
[00151] In one embodiment, methods of the present disclosure comprise maximizing or optimizing a metric using data from a single molecule array. First, the null hypothesis (e.g., that the sample is diploid, has a given genotype, has a given haplotype, or any combination thereof) is determined. The alternative hypothesis (e.g., that the sample is not diploid, does not has a given genotype, does not have a given haplotype, or any combination thereof) can also be determined. Using a set of probes, the genetic fraction (GF) is calculated (the estimate of GF being f1 ) in a first data set (d1). Using the same or different probes, the presence of the genetic variation is determined from a second data set or a test data set (d2). The first and second data sets can be obtained by analysing the same sample or different samples. A metric (e.g., likelihood, probability, or other measure of certainty of the null or alternative hypothesis) is calculated for each of the two or more hypotheses (e.g., the null and alternative hypotheses). In one example of a method for determining the presence of trisomy in a genetic sample, the two hypotheses can be H0: f(d2|GF=f1 , Ploidy = 2) and H1 :f(d2|GF=f1 , Ploidy = 3), wherein f is the metric (e.g., probability or likelihood) conditioned on the genetic fraction being f1 and the presence or absence of trisomy (Ploidy is 2 or 3 respectively). The two hypotheses are compared (e.g., using a likelihood ratio) to determine a relative number indicative of which hypothesis is more likely to represent the underlying truth about the genetic sample. The term “relative number” as used herein can refer to a value representing a comparison between two or more metrics. It will be understood that a relative number can be determined from two or more metrics in a variety of ways, including taking a difference between the two or more metrics, taking a sum of the two or more metrics, taking a ratio of the two or more metrics, by determining a maximum or minimum of a difference, sum, or ratio of the two or more metrics, or by performing any other mathematical operation involving the two or more metrics.
Optimizing a Metric Under One or More Hypotheses
[00152] In certain embodiments, the genetic fraction (e.g., the fetal fraction or fraction of tumor- derived DNA) in a genetic sample is determined by maximizing a metric with respect to the genetic fraction, where the genetic fraction is a parameter and not an estimate (e.g., a fixed point estimate) from independent data from the genetic sample. For example, a metric (such as probability of observing the given data) can be maximized with respect to the genetic fraction (which can be treated as a variable that ranges from 0 to 1 representing 0% fetal material to 100% fetal material respectively). If the metric is a probability of a copy number change, it can be observed on a digital array by an increase in counts in one locus compared to another (e.g., for trisomy 21 in a fetus, an increase in the counts from probes
that target chromosome 21 compared to the counts for probes that target a control chromosome {e.g., a reference loci). The magnitude of the deviation in the counts would be expected to be proportional to the genetic fraction. That is, the higher the genetic fraction, the greater the proportion of fetal material in the sample and hence the greater the expected deviation due to a copy number change in the fetus. In one embodiment, a genetic fraction parameter is used to inform the detection of a change in copy number (e.g., when using non-polymorphic markers), and the observed deviation in counts used to detect the copy number change is expected to be proportional to the genetic fraction of the sample under a given ploidy hypothesis. The metrics can be compared by comparing a set of probes from a genomic region that is being tested for likely copy number change to a set of probes from a genomic region believed to be diploid (or another known ploidy or having any known genomic characteristic). In one embodiment, the genetic fraction is measured in a first data set, having value f1. In certain embodiments, a metric for detecting a genetic variation is maximized in a second data set (for example, where the metric is a likelihood of a copy number change as a function of the genetic fraction) with respect to a parameter representing the genetic fraction. In some embodiment, a genetic fraction at which a metric is maximized is f2. If f1 and f2 are the same or similar, that provides consistent evidence for the presence of a genetic variation. In some embodiments, a suitable statistical method can be used to determine the consistency of f1 and f2. If f1 and f2 are very different, this implies the two data sets are inconsistent and the metric supporting the presence of a genetic variation may be a false positive (similarly, if the metric does not support a genetic variation, it may be a false negative in the case of f1 and f2 being very different). In this embodiment, a measurement of the genetic fraction in the first data set (f1 ) can be used to determine if the measurement of a metric for detecting a genetic variation is optimized (e.g., maximized) at the value of the genetic fraction (f2) that is consistent with f1 .
Consistency between fland f2 often lends support to the hypothesis that is maximized at f2 (e.g., the presence of a genetic variation).
[00153] The maximum value of a metric does not have to fall at the estimate of genetic fraction from the first data set, d1 . In some embodiments, an estimate of the genetic fraction, f1 , is an estimate from a given set of data (d1) and will not be the exact value of the genetic fraction in the genetic sample. It would require a data set of infinite size to perfectly estimate the genetic fraction in the original genetic sample. Therefore, using an estimate will not necessarily maximize the metric, particularly if genetic fraction is treated as a continuous variable, and therefore has an infinite number of possible values. By maximizing the metric with respect to the genetic fraction, the resulting estimate for the genetic fraction is likely to be a different value than a point estimate of the genetic fraction from the first data set. The value of the genetic fraction at which the metric is maximized in the second data set is the best estimate of the genetic fraction in the test data, d2, (as
opposed to the first data set, d1). In one embodiment, the genetic fraction estimate from the first data, d1 , set is explicitly not used in the determination of the presence or absence of a genetic variation. In another embodiment, the first data set, d1 , is only used to determine whether to collect or analyze the second dataset, d2, and not in the assessment of whether there is a genetic variation (for example, if the genetic fraction estimate in d1 is greater than a threshold, then data set d2 is collected and/or data set d2 is analyzed). In one example of a method for determining the presence of trisomy in a genetic sample, as shown in Figure 16, the two hypotheses can be H0: f(d2|GF= x, Ploidy = 2) and H1 :f(d2|GF=x, Ploidy = 3), wherein f is the metric (for example likelihood) conditioned on the genetic fraction taking value x (where x can take any value between 0 and 1 ) and the presence or absence of a trisomy. The two hypotheses are compared (e.g., max(H1/H0), where the maximization is with respect to x (the FF)) to determine a relative number indicative of which hypothesis is more likely to represent the underlying truth about the genetic sample.
Optimizing a Metric in Both a First Data Set and a Second Data Set/ Test Data Set with Respect to Genetic Fraction
[00154] In certain embodiments, a genetic fraction (e.g., the fetal fraction or fraction of tumor- derived DNA) in a genetic sample is determined by maximizing a metric over a first data set used to determine the genetic fraction and a second data set used to determine the presence of a genetic variation with respect to the genetic fraction (e.g., the value of genetic fraction that best explains both data sets), where the genetic fraction is a parameter and not the estimate (e.g., a fixed point estimate) from independent data from the genetic sample. The advantage of this approach is that all of the data (e.g., from both the first and the second data set) is used to estimate the genetic fraction (under an assumption on the ploidy or other genomic characteristic of the sample). For example, the first data set is used in conjunction with the second data set to find the maximum likelihood of trisomy. The first data set adds information about the genetic fraction that constrains the genetic fraction in the second data set. The first data may be collected on non-test loci (e.g., non-trisomic chromosomes) and the second data set on test loci (for example, on chromosome 21 when looking for trisomy 21 in a fetus). In one example of a method for determining the presence of trisomy in a genetic sample, the two hypotheses can be H0: f(d1 , d2|FF= x, Ploidy = 2,2) and H1 :f(d1 , d2|FF=x, Ploidy = 2, 3), wherein f is a metric (e.g., probability or likelihood) conditioned on the genetic fraction taking value x (where x can take any value between 0 and 1 ) and the presence or absence of a trisomy. And wherein Ploidy = A, B refers to a Ploidy of A in the first data set, and a Ploidy of B in the second data set. In this example, it would be assumed that the first data set, d 1 , was collected on normal (diploid, Ploidy = 2) regions of the genome and data set d2, include a portion of data that potentially came from
a triploid region of the genome ( e.g Ploidy = 3). The two hypotheses are compared ( e.g ., max(H1/H0), where the maximization is with respect to x (the FF)) to determine a relative number indicative of which hypothesis is more likely to represent the underlying truth about the genetic sample.
[00155] In certain embodiments, the present disclosure provides methods for determining genetic variation in a genetic sample, said genetic sample containing a first genetic material and optionally having a second genetic material, the method comprising: determining, using a computer system, a first metric corresponding to a measure of certainty of a null hypothesis that the genetic variation is absent in the genetic sample, wherein the first metric is a function of a fraction of the second genetic material and conditioned on the absence of the genetic variation in both a first data set and a second data set; determining, using a computer system, a second metric corresponding to a measure of certainty of an alternative hypothesis that the genetic variation is present in the genetic sample, wherein the second metric is a function of the fraction of the second genetic material and conditioned on the presence of the genetic variation in at least one of the first data set and the second data set; determining, using a computer system, a relative number corresponding to a maximum difference or a ratio between the first metric and the second metric; and determining, using a computer system, if the genetic variation is present in the genetic sample by comparing the relative number to a reference number. In one embodiment, the metrics are the same for both hypotheses.
[00156] In some embodiments, the method of the present disclosure may comprise selecting and/or isolating genetic locus or loci of interest, and quantifying the amount of each locus present (for example for determining copy number) and/or the relative amounts of different locus variants (for example two alleles of a given DNA sequence).
[00157] The methods described herein may produce highly accurate measurements of genetic variation. One type of variation described herein includes the relative abundance of two or more distinct genomic loci. In this case, the loci may be small (e.g., as small as about 300, 250, 200, 150, 100, or 50 nucleotides or less), moderate in size (e.g., from 1 ,000, 10,000, 100,000 or one million nucleotides), and as large as a portion of a chromosome arm or the entire chromosome or sets of chromosomes. The results of this method may determine the abundance of one locus to another.
The precision and accuracy of the methods of the present disclosure may enable the detection of very small changes in copy number (as low as about 25, 10, 5, 4, 3, 2, 1 , 0.5, 0.1 ,0.05, 0.02 or 0.01 % or less), which enables identification of a very dilute signature of genetic variation. For Example, a signature of fetal aneuploidy may be found in a maternal blood sample where the fetal genetic aberration is diluted by the maternal blood, and an observable copy number change of about 2% is indicative of fetal trisomy.
[00158] The present disclosures according to some embodiments encompass at least two major components: an assay for the selective identification of genomic loci, and a technology for quantifying these loci with high accuracy.
[00159] In some embodiments, a method may comprise interrogating one or a plurality of Single Nucleotide Polymorphism (SNP) sites to determine whether the proportion (e.g., concentration, and number percentage based on the number of nucleotide molecules in the sample) of fetal material (e.g., the fetal fraction) is sufficient so that a genetic variation or copy number of a region of interest in a fetus may be detected from a genetic sample with a reasonable statistical significance. In additional embodiments, the method may further comprise contacting maternal and paternal probe sets to the genetic sample, wherein the maternal probe set comprises a maternal labeling probe and a maternal tagging probe, and the paternal probe set comprises a paternal labeling probe and a paternal tagging probe. The method may further comprise hybridizing at least a part of each of the maternal and paternal probe sets to a nucleic acid region of interest in nucleotide molecules of the genetic sample, the nucleic acid region of interest comprising a predetermined SNP site, wherein the at least a part of the maternal probe set hybridizes to a first allele at the SNP site, the at least a part of the paternal probe set hybridizes to a second allele at the SNP site, and the first and second alleles are different from each other. The method may further comprise ligating the material and paternal probe sets at least by ligating (i) the maternal labeling and tagging probes, and (ii) the paternal labeling and tagging probes. The method may further comprise amplifying the ligated probes. The method may further comprise immobilizing the tagging probes to a pre-determined location on a substrate, wherein the maternal and paternal labeling probes and/or the amplified labeling probes thereof ligated to the immobilized tagging probes comprise maternal and paternal labels, respectively; the maternal and paternal labels are different, and the immobilized labels are optically resolvable. The method may further comprise counting the numbers of the maternal and paternal labels, and determining whether a proportion of a fetal material in the genetic sample is sufficient to detect the genetic variation in the fetus based on the numbers of the maternal and paternal labels. The method may further comprise determining the proportion of the fetal material in the genetic sample.
[00160] In certain embodiments, tumor fraction is analogous to the fetal material or fetal fraction described herein. The tumor fraction may be a measure of the proportion of the material that comes from the tumor in a way that is analogous to the fetal fraction measuring the proportion of the material that comes from the fetus and/or placenta. In general, the tumor fraction is <1% when the cancer is at an early stage (e.g., Stage II or earlier).
[00161] In some embodiments, when the subject is a pregnant subject, and the genetic variation is a genetic variation in the fetus of the pregnant subject, the method may further comprise
contacting allele A and allele B probe sets that are allele-specific to the genetic sample, wherein the allele A probe set comprises an allele A labeling probe and an allele A tagging probe, and the allele B probe set comprises an allele B labeling probe and an allele B tagging probe. The method may further comprise hybridizing at least a part of each of the allele A and allele B probe sets to a nucleic acid region of interest in nucleotide molecules of the genetic sample, the nucleic acid region of interest comprising a predetermined single nucleotide polymorphism (SNP) site for which a maternal allelic profile (i.e., genotype) differs from a fetal allelic profile at the SNP site (For example, maternal allelic composition may be AA and fetal allelic composition may be AB, or BB. In another example, maternal allelic composition may be AB and fetal allelic composition may be AA, or BB. ), wherein the at least a part of the allele A probe set hybridizes to a first allele at the SNP site, the at least a part of the allele B probe set hybridizes to a second allele at the SNP site, and the first and second alleles are different from each other. The method may further comprise ligating the allele A and allele B probe sets at least by ligating (i) the allele A labeling and tagging probes, and (ii) the allele B labeling and tagging probes. The method may further comprise amplifying the ligated probe sets. The method may further comprise immobilizing the tagging probes to a pre-determined location on a substrate, wherein the allele A and allele B labeling probes and/or the amplified labeling probes thereof ligated to the immobilized tagging probes comprise allele A and allele B labels, respectively, the allele A and allele B labels are different, and the immobilized labels are optically resolvable. The method may further comprise counting the numbers of the allele A and allele B labels, and determining whether a proportion of a fetal material in the genetic sample is sufficient to detect the genetic variation in the fetus based on the numbers of the allele A and allele B labels. The method may further comprise determining the proportion of the fetal material in the genetic sample.
[00162] In some embodiments, when the subject is a pregnant subject, the genetic variation is a genetic variation in the fetus of the pregnant subject, and the genetic sample comprises a Y chromosome, the method may further comprise contacting maternal and paternal probe sets to the genetic sample, wherein the maternal probe set comprises a maternal labeling probe and a maternal tagging probe, and the paternal probe set comprises a paternal labeling probe and a paternal tagging probe. The method may further comprise hybridizing at least parts of the maternal and paternal probe sets to maternal and paternal nucleic acid regions of interest in nucleotide molecules of the genetic sample, respectively, wherein the paternal nucleic acid region of interest is located in the Y chromosome, and the maternal nucleic acid region of interest is not located in the Y chromosome.
The method may further comprise ligating the maternal and paternal probe sets at least by ligating (i) the maternal labeling and tagging probes, and (ii) the paternal labeling and tagging probes. The method may further comprise amplifying the ligated probes. The method may further comprise
nucleic acid region of interest comprising a predetermined single nucleotide polymorphism (SNP) site containing more than one SNP, for example two or three SNPs. Further, the SNP site may contain SNPs with high linkage disequilibrium such that labeling and tagging probes are configured to take advantage of the improved energetics of multiple SNP matches or mismatches versus only one. The method may further comprise immobilizing the tagging probes to a pre-determined location on a substrate, wherein the maternal and paternal labeling probes and/or the amplified labeling probes thereof ligated to the immobilized tagging probes comprise maternal and paternal labels, respectively, the maternal and paternal labels are different, and the immobilized labels are optically resolvable.
The method may further comprise counting the numbers of the maternal and paternal labels, and determining whether a proportion of a fetal material in the genetic sample is sufficient to detect the genetic variation in the fetus based on the numbers of the maternal and paternal labels. The method may further comprise determining the proportion of the fetal material in the genetic sample.
[00163] In additional embodiments, other genetic variations (e.g., single base deletion, microsatellite, and small insertions) may be used in place of the genetic variation at the SNP site described herein.
[00164] In certain embodiments, the method described herein excludes identifying a sequence in the nucleotide molecules of the genetic sample, and/or sequencing of the nucleic acid region(s) of interest and/or the probes. In some embodiments, the method excluding sequencing of the probes includes excluding sequencing a barcode and/or affinity tag in a tagging probe. In additional embodiments, the immobilized probe sets to detect different genetic variations, nucleotide regions of interest, and/or peptides of interest need not be detected or scanned separately because sequencing is not required in the methods described herein. In additional embodiments, the counts of different labels immobilized to a substrate are counted simultaneously (e.g., by a single scanning and/or imaging), and thus the counts of different labels are not separately counted. In certain embodiments, the method described herein excludes bulk array readout or analog quantification. The bulk array readout herein means a single measurement that measures the cumulative, combined signal from multiple labels of a single type, optionally combined with a second measurement of the cumulative, combined signal from numerous labels of a second type, without resolving a signal from each label. A result is drawn from the combination of the one or more such measurements in which the individual labels are not resolved. In certain embodiments, the method described herein may include a single measurement that measures the same labels, different labels of the same type, and/or labels of the same type in which the individual labels are resolved. The method described herein may exclude analog quantification and may employ digital quantification, in which only the number of labels is
determined (ascertained through measurements of individual label intensity and shape), and not the cumulative or combined optical intensity of the labels.
[00165] In certain embodiments, the probe set described herein may comprise a binder. In some embodiments, a method further comprises immobilizing a binder to a solid phase after the ligating steps. A method may further comprise isolating a ligated probe set from non-ligated probes.
In additional embodiments, a binder comprises biotin, and a solid phase or substrate comprises a magnetic bead.
[00166] In certain embodiments, the counting step described herein may further comprise calibrating, verifying, and/or confirming the counted numbers. Calibrating herein means checking and/or adjusting the accuracy of the counted number. Verifying and confirming herein mean determining whether the counted number is accurate or not, and/or how much the error is, if exists. [00167] In certain embodiments, intensity and/or single-to-noise is used as a method of identifying single labels. When dye molecules or other optical labels are in close proximity, they are often impossible to discriminate with fluorescence-based imaging due to the intrinsic limit of the diffraction of light. That is, two labels that are close together will be indistinguishable with no visible gap between them. One exemplary method for determining the number of labels at a given location is to examine the relative signal and/or signal-to-noise compared to locations known to have a single fluor. In some embodiments, two or more labels will usually emit a brighter signal (and one that can more clearly be differentiated from the background) than will a single fluor.
[00168] In certain embodiments, energy, relative signal, signal-to-noise, focus, sharpness, size, shape and/or other properties is used as a method of distinguishing single labels from particulate, punctate, discrete or granular background or other background signals or false signals that mimic or are similar to labels. These false signals may be caused by particulate matter, for example, unlabeled molecules, differently labeled molecules, bleed through from other dyes, inorganic or organic particulate material, and/or stochastic effects such as noise, shot noise or other factors. Some exemplary methods for differentiating the label from particulate, punctate, discrete or granular background at a given location is to examine the energy, relative signal, signal-to-noise, focus, sharpness, size, or shape of putative labels on a substrate. Labels will usually emit a brighter (or dimmer) signal than will particulate, punctate, discrete or granular background.
[00169] In some embodiments, the counting step may comprise measuring optical signals from the immobilized labels, and calibrating the counted numbers by distinguishing an optical signal from a single label from the rest of the optical signals from background and/or multiple labels. In some embodiments, the distinguishing comprises calculating a relative signal and/or single-to-noise intensity of the optical signal compared to an intensity of an optical signal from a single label. The
distinguishing may further comprise determining whether the optical signal is from a single label. In additional embodiments, the optical signal is from a single label if the relative signal and/or single-to- noise intensity of an optical signal differs from an intensity of an optical signal from a single label by a predetermined amount or less. In further embodiments, the predetermined amount is from 0% to 100%, from 0% to 150%, 10% to 200%, 0, 1, 2, 3, 4, 5, 10, 20, 30, or 40% or more, and/or 300, 200,
100, 50, 30, 10, or 5% or less of the intensity of the optical signal from a single label.
[00170] In certain embodiments, different labels may have different blinking and bleaching properties. They may also have different excitation properties. In order to compare the number of dye molecules for two different labels, it is necessary to ensure that the two dyes are behaving in a similar manner and have similar emission characteristics. For example, if one dye is much dimmer than another, the number of molecules may be under-counted in this channel. Several factors may be titrated to give the optimal equivalence between the dyes. For example, the counting step and/or calibrating step may comprise optimizing (i) powers of light sources to excite the labels, (ii) types of the light sources, (ii) exposure times for the labels, and/or (iv) filter sets for the labels to match the optical signals from the labels, and measuring optical signals from the labels. These factors may be varied singly or in combination. Further, the metric being optimized may vary. For example, it may be overall intensity, signal-to-noise, least background, lowest variance in intensity or any other characteristic.
[00171] Bleaching profiles are often label specific and in certain embodiments may be used to add information for distinguishing label types.
[00172] In certain embodiments, blinking behavior may be used as a method of identifying single labels. Many dye molecules are known to temporarily go into a dark state (e.g., Burnette et al., Proc. Natl. Acad. Sci. USA (2011) 108: 21081-21086). This produces a blinking effect, where a label will go through one or more steps of bright-dark-bright. The length and number of these dark periods may vary. In certain embodiments, the methods of the present disclosure use this blinking behavior to discriminate one label from two or more labels that may appear similar in diffraction limited imaging. If there are multiple labels present, it is unlikely the signal will completely disappear during the blinking. More likely is that the intensity will fall as one of the labels goes dark, but the others do not. The probability of all the labels blinking simultaneously (and so looking like a single fluor) may be calculated based on the specific blinking characteristics of a dye.
[00173] In some embodiments, the optical signals from the labels are measured for at least two time points, and an optical signal is from a single label if the intensity of the optical signal is reduced by a single step function. In some embodiments, the two time points may be separated by from 0.1 to 30 minutes, from 1 second to 20 minutes, from 10 seconds to 10 minutes; 0.01, 0.1, 1, 2, 3, 4, 5, 10,
20, 30, 40, 50, 60 seconds or more; and/or 1 , 2, 3, 4, 5, 10, 20, 30, 40, 50, 60 seconds or less. In additional embodiments, an intensity of the optical signal from a single label has a single step decrease over time, and an intensity of the optical signal from two or more labels has multiple step decreases over time. In further embodiments, the optical signals from the labels are measured for at least two time points and are normalized to bleaching profiles of the labels. In certain embodiments, the method described herein and/or the counting step may further comprises measuring an optical signal from a control label for at least two time points, and comparing the optical signal from the control label with the optical signals from the labels to determine an increase or decrease of the optical signal from the labels.
[00174] In certain embodiments, the counting step further comprises confirming the counting by using a control molecule. A control molecule may be used to determine the change in frequency of a molecule type. Often, the experimental goal is to determine the abundance of two or more types of molecules either in the absolute or in relation to one another. Consider the example of two molecules labeled with two different dyes. If the null hypothesis is that they are at equal frequency, they may be enumerated on a single-molecule array and the ratio of the counts compared to the null hypothesis. The “single-molecule array” herein is defined as an array configured to detect a single molecule, including, for example, the arrays described in U.S. Patent Application Publication No. 2013/0172216. If the ratio varies from 1:1, this implies they two molecules are at different frequencies. However, it may not be clear a priori whether one has increased abundance or the other has decreased abundance. If a third dye is used as a control molecule that should also be at equal frequency, this should have a 1:1 ratio with both the other dyes. Consider the example of two molecules labeled with dyes A and B, the goal being to see if the molecule labeled with dye B is at increased or decreased frequency compared to the molecule labeled with dye A. A third molecule labeled with dye C is included in the experiment in a way that it should be at the same abundance as the other two molecules. If the ratio of molecules labeled A and B respectively is 1:2, then either the first molecule has decreased frequency or the second has increased frequency. If the ratio of the molecules labeled A and C is 1:1 and the ratio of molecules labeled B and C is 1:2, then it is likely that the molecule labeled with dye B has increased with frequency with respect to the molecule labeled with dye A. An example of this would be in determining DNA copy number changes in a diploid genome. It is important to know if one sequence is amplified or the other deleted and using a control molecule allows for this determination. Note the control may be another region of the genome or an artificial control sequence.
[00175] In some embodiments, results of a method described herein (e.g., counted numbers of labels) are confirmed using different labels but the same affinity tags used in the initial method. Such
confirming may be performed simultaneously with the initial method or after performing the initial method. In additional embodiments, the confirming described herein comprises contacting first and second control probe sets to the genetic sample, wherein the first control probe set comprises a first control labeling probe and the first tagging probe, which is the same affinity tag of the first probe set described herein, and the second control probe set comprises a second control labeling probe and the second tagging probe, which is the same affinity tag of the second probe set described herein. The confirmation may further comprise hybridizing at least a part of the first and second control probe sets to the first and second nucleic acid regions of interest in nucleotide molecules of the genetic sample, respectively. The confirmation may further comprise ligating the first control probe set at least by ligating the first control labeling probe and the first tagging probe. The confirmation may further comprise ligating the second control probe set at least by ligating the second control labeling probe and the second tagging probe. The confirmation may further comprise amplifying the ligated probe sets. The confirmation may further comprise immobilizing each of the tagging probes to a pre- determined location on a substrate, wherein the first and second control labeling probes and/or the amplified labeling probes thereof ligated to the immobilized tagging probes comprise first and second control labels, respectively, the first and second control labels are different, and the immobilized labels are optically resolvable. The confirmation may further comprise measuring the optical signals from the control labels immobilized to the substrate. The confirmation may further comprise comparing the optical signals from the immobilized first and second control labels to the optical signals from the immobilized first and second labels to determine whether an error based on the labels exists. In some embodiments, the first label and the second control label are the same, and the second label and the first control label are the same.
[00176] In certain embodiments, the method herein may comprise calibrating and/or confirming the counted numbers by label swapping or dye swapping.
[00177] In some embodiments, the first nucleic acid region of interest is located in a first chromosome, and the second nucleic acid region of interest is located in a second chromosome, different from the first chromosome. The counting step may further comprise confirming the counting, wherein the confirming step comprises contacting first and second control probe sets to the genetic sample, wherein the first control probe set comprises a first control labeling probe and a first control tagging probe, and the second control probe set comprises a second control labeling probe and the second control tagging probe. The confirming step may further comprise hybridizing at least a part of the first and second control probe sets to first and second control regions located in the first and second chromosomes, respectively, wherein the first and second control regions are different from the first and second nucleic acid regions of interest. The confirming step may further comprise ligating
the first and second control probe sets at least by ligating (i) the first control labeling and tagging probes, and (ii) the second control labeling and tagging probes. The confirming step may further comprise amplifying the ligated probe sets. The confirming step may further comprise immobilizing (i) the first probe set and the second control probe set to a first p re-determined location, and (ii) the second probe set and the first control probe set to a second pre-determined location. In some embodiments, the first and second control labeling probes and/or the amplified labeling probes thereof ligated to the immobilized tagging probes comprise a first and second control labels, respectively, the first label and the second control label are different, the second label and the first control labels are different, the immobilized labels are optically resolvable, the immobilized first and second control tagging probes and/or the amplified tagging probes thereof comprise first and second control affinity tags, respectively, and the immobilizing step is performed by immobilizing the affinity tags to the predetermined locations. The confirming step may further comprise measuring the optical signals from the control labels immobilized to the substrate. The confirming step may further comprise comparing the optical signals from the immobilized control labels to the optical signals from the immobilized first and second labels to determine whether an error based on the nucleic acid region of interest exists. In further embodiments, the first affinity tag and the second control affinity tag are the same, and the second affinity tag and the first control affinity tag are the same.
[00178] In certain embodiments, the counting step of the method described herein may further comprise calibrating and/or confirming the counted numbers by (i) repeating some or all the steps of the methods (e.g., steps including the contacting, binding, hybridizing, ligating, amplifying, and/or immobilizing) described herein with a different probe set(s) configured to bind and/or hybridize to the same nucleotide and/or peptide region(s) of interest or a different region(s) in the same chromosome of interest, and (ii) averaging the counted numbers of labels in the probe sets bound and/or hybridized to the same a nucleotide and/or peptide region of interest or to the same chromosome of interest. In some embodiments, the averaging step may be performed before the comparing step so that the averaged counted numbers of labels in a group of different probe sets that bind and/or hybridize to the same nucleotide and/or peptide region of interest are compared, instead of the counted numbers of the labels in the individual probe sets. In certain embodiments, the method described herein may further comprise calibrating and/or confirming the detection of the genetic variation by (i) repeating some or all the steps of the methods (e.g., steps including the contacting, binding, hybridizing, ligating, amplifying, immobilizing, and/or counting) described herein with different probe sets configured to bind and/or hybridize to control regions that does not have any known genetic variation, and (ii) averaging the counted numbers of labels in the probe sets bound and/or hybridized to the control regions. In some embodiments, the averaged numbers of the labels in the probe sets that
bind and/or hybridize to control regions are compared to the numbers of the labels in the probe sets that bind and/or hybridized to the regions of interest described herein to confirm the genetic variation in the genetic sample. In certain embodiments, the steps of the calibrating and/or confirming may be repeated simultaneously with the initial steps, or after performing the initial steps.
[00179] In certain embodiments, labels (e.g., fluorescent dyes) from one or more populations may be measured and/or identified based on their underlying spectral characteristics. Most fluorescent imaging systems include an option of collecting images in multiple spectral channels, controlled by the combination of light source and spectral excitation/emission/dichroic filters. This enables the same fluorescent species on a given sample to be interrogated with multiple different input light color bands as well as capturing desired output light color bands. Under normal operation, excitation of a fluorophore is achieved by illuminating with a narrow spectral band aligned with the absorption maxima of that species (e.g., with a broadband LED or arc lamp and excitation filter to spectrally shape the output, or a spectrally homogenous laser), and the majority of the emission from the fluorophore is collected with a matched emission filter and a long-pass dichroic to differentiate excitation and emission. In alternate operations, the unique identity of a fluorescent moiety may be confirmed through interrogation with various excitation colors and collected emission bands different from (or in addition to) the case for standard operation. The light from these various imaging configurations, e.g., various emission filters, is collected and compared to calibration values for the fluorophores of interest. In the example case, the experimental measurement (dots) matches the expected calibration/reference data for that fluorophore (triangles) but does not agree well with an alternate hypothesis (squares). Given test and calibration data for one or more channels, a goodness- of-fit or chi-squared may be calculated for each hypothesis calibration spectrum, and the best fit selected, in an automated and robust fashion.
[00180] Given probe products may be labeled with more than one type of fluorophore such that the spectral signature is more complex. For example, probe products may always carry a universal fluor, e.g., Alexa647, and a locus-specific fluorophore, e.g., Alexa 555 for locus 1 and Alexa 594 for locus 2. Since contaminants will rarely carry yield the signature of two fluors, this may further increase the confidence of contamination rejection. Implementation would involve imaging in three or more channels in this example such that the presence or absence of each fluor may be ascertained, by the aforementioned goodness-of-fit method comparing test to reference, yielding calls of locus 1, locus 2 or not a locus product. Adding extra fluors aids fluor identification since more light is available for collection, but at the expense of yield of properly formed assay products and total imaging time (extra channels may be required). Other spectral modifiers may also be used to increase spectral
information and uniqueness, including FRET pairs that shift the color when in close proximity or other moieties.
[00181] In certain embodiments, the array described herein may be used in conjunction with other methods of testing to improve its accuracy. For example, phenotypic data about the patient ( e.g age, weight, BMI, disease states) may be used to predict the probability of an abnormal pregnancy or of the patient's cfDNA having low amounts of fetal material (i.e., low fetal fraction). Alternatively, the array of this disclosure may be used directly with an assay (for example, an oligo- ligation assay, with the product being captured on the array) or with an independent assay that can be used to replicate, confirm or improve the results from the array. For example, DNA sequencing, mass spectroscopy, genotyping, standard microarrays, karyotyping, PCR-based methods or other methods could be used as an orthogonal method and the data from these methods can be integrated with data from the array of this disclosure to provide a more accurate or less ambiguous result. The array as described herein may be used for screening, diagnosing, replicating, confirming, validating, excluding or monitoring a disease of condition, for example, for Down's Syndrome in a fetus.
[00182] In one aspect, the assays and methods described herein may be performed on a single input sample simultaneously. For example, the method may comprise verifying the presence of fetal genomic molecules at or above a minimum threshold as described herein, followed by a step of estimating the target copy number state if and only if that minimum threshold is met. Therefore, one may separately run an allele-specific assay on the input sample for performing fetal fraction calculation, and a genomic target assay for computing the copy number state. In other embodiments, both assays and methods described herein may be carried out in parallel on the same sample at the same time in the same fluidic volume. Further quality control assays may also be carried out in parallel with the same universal assay processing steps. Since affinity tags, and/or tagging probes in the probe products, ligated probe set, or labeled molecule to be immobilized to a substrate may be uniquely designed for every assay and every assay product, all of the parallel assay products may be localized, imaged and quantitated at different physical locations on an imaging substrate. In certain embodiments, the same assay or method (or some of their steps) described herein using the same probes and/or detecting the same genetic variation or control may be performed on multiple samples simultaneously either in the same or different modules (e.g., testing tube) described herein. In certain embodiments, assays and methods (or some of their steps) described herein using different probes and/or detecting different genetic variations or controls may be performed on single or multiple sample(s) simultaneously either in the same or different modules (e.g., testing tube).
[00183] In certain embodiments, image analysis may include image preprocessing, image segmentation to identify the labels, characterization of the label quality, filtering the population of
detected labels based on quality, and performing statistical calculations depending on the nature of the image data. In some instances, such as when an allele-specific assay is performed and imaged, the fetal fraction may be computed. In others, such as the genomic target assay and imaging, the relative copy number state between two target genomic regions is computed. Analysis of the image data may occur in real-time on the same computer that is controlling the image acquisition, or on a networked computer, such that results from the analysis may be incorporated into the test workflow decision tree in near real-time.
[00184] Ideally, members of the array will be designed such that they are large enough that they encompass the field of view or size of the image being collected. That is, the entire image captured by the camera captures the area inside of a member. In some cases, >90%, >80%, >50%, 25% or >10% of the image will be of the area contained within a member.
[00185] In this case, the size of the image is a function of the size of the camera sensor, the magnification and members of the optical path ( e.g the field diaphragm). In this way, the entire sensor is filled with molecules (as opposed to the blank area outside of the members), so maximizing data collection and so sample throughput. Having members larger than the camera sensor will also reduce problems such as ringing or donating seen with spotted arrays.
[00186] This method of selecting the magnification, member size, optical path and sensor size are in contrast to traditional microarrays where a single frame includes many members. This is possible for traditional arrays because each member is giving a single measurement. Conversely in a single molecule array, each member is giving thousands, tens of thousands or hundreds of thousands of measurements (with each measurement being the presence of a labeled molecule).
[00187] If the average number of fluors per member is known, then the total number of members needed to collect a given number of counts can be calculated. In one embodiment 2, 5, 10, 50, 100, 500 or 1000 members are produced on a single array. The number of flours counted per member depends on the density of the labeled molecules. Each member may contain on average, 100, 500, 1,000, 5,000, 10,000. 20,000, 50,000, 100,000 or more labeled molecules. The combination of members and labeled molecules per member leads to the total number of labeled molecules that can be counted. The total number of molecules can be used to calculate the sensitivity, specificity, positive predictive value, negative predictive value and other parameters or factors. The total number of molecules can be used to calculate the statistical power, the expected false positive and expected false negative rates. Ideally, 10,000, 100,000, 500,000, 1 ,000,000, 5,000,000, 10,000,000, 100,000,000 or more labeled molecules will be counted for each sample. These will be contained in 1 or more member. The molecules may be labeled with one of more labels. In prenatal testing, the molecules will be counted for each genomic region being tested. Statistical power for the test can be
calculated using standard methods and tailored for the specific application (see for example Statistical Methods in Cancer Research - Volumes I & II, edited by Breslow & Day, IARC Scientific Publications).
[00188] In prenatal testing, it is preferred to count at least 100,000 molecules and ideally at least 1 ,000,000 per genomic region being tested. If significant error, contamination or other form of noise are present, then the number of molecules counted will ideally be greater still. The amount of data collected from a single molecule array is very different from a sequencing-based test. For example. In whole-genome sequencing, many of sequencing reads will map to chromosomes that are not being tested. Even for targeted sequencing approaches, many sequencing reads will not uniquely map to the genome, will be primer dimers or other artifacts. In a preferred embodiment, a single molecule array does not require sequencing or the mapping of sequences to the genome.
[00189] In certain embodiments, the number of probes that need to be counted for the methods described herein may be so high that multiple substrates are needed to analyze a single sample. For example, if a coverslip ( e.g 22mm x 22mm) is used, the number of molecules available for counting may not be enough to reach the desired sensitivity. In this case, either multiple coverslips or a larger format substrate will be needed. For prenatal testing, substrates of on average 10mmΛ2, 100mmΛ2, 1000mmΛ2 or >1000mmΛ2 may be used either individually or in combination.
[00190] In certain embodiments, not every SNP probed in the allele-specific assay may result in useful information. For example, the maternal genomic material may have heterozygous alleles for a given SNP (e.g., allele pair AB), and the fetal material may also be heterozygous at that site (e.g., AB), hence the fetal material is indistinguishable and calculation of the fetal fraction fails. Another SNP site for the same input sample, however, may again show the maternal material to be heterozygous (e.g., AB) while the fetal material is homozygous (e.g., AA). In this example, the allele- specific assay may yield slightly more A counts than B counts due to the presence of the fetal DNA, from which the fetal fraction may be calculated. Since the SNP profile (i.e., genotype) cannot be known a priori for a given sample, multiple or numerous SNP sites should be designed such that nearly every possible sample will yield an informative SNP site. Each SNP site may be localized to a different physical location on the imaging substrate, for example by using a different affinity tag for each SNP. However, for a given test, the fetal fraction may only be calculated successfully once. Therefore, a single or multiple locations on the substrate used to interrogate SNPs may be imaged and analyzed (e.g., in groups of one, two, three, four, five, ten, twenty, fifty or less and/or one, two, three, four, five, ten, twenty, fifty or more) until an informative SNP is detected. By alternating imaging and analysis, one may bypass imaging all possible SNP spots and significantly reduce average test duration while maintaining accuracy and robustness.
[00191] In certain embodiments, determining the fetal fraction of a sample may aide other aspects of the system beyond terminating tests for which the portion of fetal fraction in a sample is inadequate. For example, if the fetal fraction is high (e.g., 20%) then for a given statistical power, the number of counts required per genetic target (e.g., chr21 ) will be lower; if the fetal fraction is low (e.g., 1%) then for the same statistical power, a very high number of counts is required per genomic target to reach the same statistical significance. Therefore, following (4-1 ) imaging of the fetal fraction region 1, (5-1) analysis of those data resulting in a required counting throughput per genomic target, (4-2) imaging of genomic target region 2 commences at the required throughput, followed by (5-2) analysis of those image data and the test result for genomic variation of the input targets.
[00192] In certain embodiments, steps (4) and (5) of the test above may be repeated further for quality control purposes, including assessment of background levels of fluors on the imaging substrate, contaminating moieties, positive controls, or other causes of copy number variation beyond the immediate test (e.g., cancer in the mother or fetus, fetal chimerism, twinning). Because image analysis may be real-time, and does not require completion of the entire imaging run before generating results (unlike DNA sequencing methods), intermediate results may dictate next steps from a decision tree, and tailor the test for ideal performance on an individual sample. Quality control may also encompass verification that the sample is of acceptable quality and present, the imaging substrate is properly configured, that the assay product is present and/or at the correct concentration or density, that there is acceptable levels of contamination, that the imaging instrument is functional and that analysis is yielding proper results, all feeding into a final test report for review by the clinical team.
[00193] In certain embodiments, the test above comprises one or more of the following steps: (1) receiving a requisition (from, for example, an ordering clinician or physician), (2) receiving a patient sample, (3) performing an assay (including a allele-specific portion, genomic target portion and quality controls) on that sample resulting in a assay-product-containing imaging substrate, (4-1) imaging the allele-specific region of the substrate in one or more spectral channels, (5-1) analyzing allele-specific image data to compute the fetal fraction, (pending sufficient fetal fraction) (4-2) imaging the genomic target region of the substrate in one or more spectral channels, (5-2) analyzing genomic target region image data to compute the copy number state of the genomic targets, (4-3) imaging the quality control region of the substrate in one or more spectral channels, (5-3) analyzing quality control image data to compute validate and verify the test, (6) performing statistical calculations, (7) creating and approving the clinical report, and (8) sending the report back to the ordering clinician or physician.
[00194] In some embodiments, a general algorithm for single molecule counting, once the single molecules have been labelled by for example thresholding, is:
Loop through all pixels, p(x,y) left to right, top to bottom a. If p(x,y)=0, do nothing b. If p(x,y)=1 , add to counter
[00195] The methods of this disclosure require basic image processing operations and counting, measuring and assignment operations to be performed on the raw images that are obtained. The disclosure includes the adaptation and application of general methods including software and algorithms, known in the art for digital signal processing, counting, measuring and making assignments from the raw data. This includes Bayesian, heuristic, machine learning and knowledge- based methods.
Combining the power of different assay methods
[00196] The power of primer extension and ligation can be combined in a technique called gap ligation (the processivity and discriminatory power of two enzymes are combined). Here a first and a second oligonucleotide are designed that hybridize in close proximity to the target but with a gap of preferably a single base. The last base of one of the oligonucleotides ends one base upstream or downstream of the polymorphic site. In cases where it ends downstream, the first level of discrimination is through hybridization. Another level of discrimination occurs through primer extension which extends the first oligonucleotide by one base. The extended first oligonucleotide now abuts the second oligonucleotide. The final level of discrimination occurs where the extended first oligonucleotide is ligated to the second oligonucleotide.
[00197] Alternatively, the ligation and primer extension reactions described in c. and d. above can be performed simultaneously, with some molecules of the array giving results due to ligation and others giving results due to primer extension, within the same array member. This can increase confidence in the base call, being made independently by two assay/enzyme systems. The products of ligation may be differently labelled than the products of primer extension.
[00198] The primer or ligation oligonucleotides may be designed on purpose to have mismatch base at a site other than the base that serves to interrogate the polymorphic site. This serves to reduce error as duplex with two mismatch bases is considerably less stable than a duplex with only one mismatch.
[00199] It may be desirable to use probes that are fully or partially composed of LNA (which have improved binding characteristics and are compatible with enzymes) in the above-described enzymatic assays.
[00200] The present disclosure provides a method for SNP typing which enables the potential of genomic SNP analysis to be realised in an acceptable timeframe and at affordable cost. The ability to type SNPs through single-molecule recognition intrinsically reduces errors due to inaccuracy and PCR-induced bias which are inherent in mass-analysis techniques. Moreover, if errors occur which left a percentage of SNPs untyped, assuming errors are random with regard to position of SNP in the genome, the fact that the remaining SNPs are typed without the need to perform individual (or multiplexed) PCR still confers an advantage. It allows large-scale association studies to be performed in a time- and cost-effective way. Thus, all available SNPs may be tested in parallel and data from those in which there is confidence selected for further analysis.
[00201] If signal is obtained from probes or labels representing only one allele, then the sample is likely to be homozygous. If it is from both, in substantially a 1:1 ratio then the sample is likely to be heterozygous. As the assays are based on single molecule counting, highly accurate allele frequencies can be determined when DNA pooling strategies are used. In these cases, the ratio of molecules might be 1:100. Similarly, a rare mutant allele in a background of the wild-type allele might be found to have ratio of molecules as 1:1000.
[00202] 2. Haplotyping
[00203] Capture of singly resolvable DNA molecules is the basis for haplotype determination in the target by various means. This can be done either by analysing signals from the single foci containing the single DNA molecule or by linearizing the DNA and analysing the spatial arrangement of signal along the length of the DNA.
[00204] Two or more polymorphic sites on the same DNA strand can be analysed. This may involve hybridization of oligonucleotides to the different sites, but each labelled with different fluorophores. As described, the enzymatic approaches can equally be applied to these additional sites on the captured single molecule.
[00205] In one embodiment, each probe in a biallelic probe set may be differentially labelled and these labels are distinct from the labels associated with probes for the second site. The assay readout may be by simultaneous readout, by splitting of the emission by wavelength obtained from the same foci or from a focal region defined by the 2-D radius of projection of a DNA target molecule immobilized at one end. This radius is defined by the distance between the site of immobilized probe and the second probe. If the probes from the first biallelic set are removed or their fluors photobleached then a second acquisition can be made with the second biallelic set which in this case do not need labels that are distinct from labels for the first biallelic set. In another embodiment haplotyping can be performed on single molecules captured on allele-specific microarrays. Haplotype information can be obtained for nearest neighbor SNPs by for example, determining the first SNP by
spatially addressable allele specific probes (see Item A, Fig 75). The labelling is due to the allelic probes (which are provided in solution) for the second SNP. Depending on which foci color is detected within a SNP 1 allele specific spot determines the allele for the second SNP. So spatial position of microarray spot determines the allele for the first SNP and then color of foci within the microarray spot determines the allele for the second SNP. If the captured molecule is long enough and the array probes are far enough apart then further SNP allele specific probe, each labelled with a different color can be resolved by co-localization of signal to the same foci.
[00206] More extensive haplotypes, for three or more SNPs can be reconstructing from analysis of overlapping nearest neighbor SNP haplotypes or by further probing with differently labeled probes on the same molecule.
[00207] In this assay, specificity is achieved through sequence-specific hybridization and ligation. In a preferred embodiment, the specificity of forming probe products occurs in the reaction vessel, prior to isolating or enriching for probe products, for example immobilization onto a surface or other solid substrate. This side-steps the challenge of standard surface-based hybridization (e.g., genomic microarray) in which specificity must be entirely achieved through hybridization only with long (>40bp) oligonucleotide sequences (e.g., Agilent and Affymetrix arrays).
[00208] The use of affinity tags allows probe products to be immobilized on a substrate and for excess unbound probes to be washed away or removed using suitable methods. Therefore, all or most of the labels on the surface are a part of a specifically formed probe product that is immobilized to the surface.
[00209] One feature according to some embodiments is that the surface capture does not affect the accuracy. That is, it does not introduce any bias. In one example, if the same affinity tag is used for probe sets from different genomic loci, with probe sets targeting each locus having a different label. Probe products from both genomic loci may be immobilized to the same location on the substrate using the same affinity tag. That is, in certain embodiments, probe products from Locus 1 and Locus 2 are captured with the same efficiency, so not introducing any locus specific bias.
[00210] In some embodiments, some or all of the unbound probes and/or target molecules are removed prior to surface capture using standard methods. This decreases interference between unbound probes and/or target molecules and the probe products during surface capture.
[00211] In some embodiments, the probe sets of the present disclosure may be configured to target known genetic variations associated with tumors. These may include mutations, SNPs, copy number variants (e.g., amplifications, deletions), copy neutral variants (e.g., inversions, translocations), and/or complex combinations of these variants. For example, the known genetic variations associated with tumors include those listed in
cancer.sanger.ac.uk/cancergenome/projects/cosmic; nature.com/ng/journal/v45/n10/full/ng.2760. html#supplementary-information; and Tables 2 and 3 below: BGENE = p-value from corrected to FDR within peak; KKnown frequently amplified oncogene or deleted TSG; pPutative cancer gene; EEpigenetic regulator; MMitochondria-associated gene; **lmmediately adjacent to peak region; TAdjacent to telomere or centromere of acrocentric chromosome. Additional known variations associated with cancers are provided in US Pat. no. 9,212,394 and International Pat. Application Pub. No. WO/2016/134191 , which can be detected by a method described herein.
Exemplary Statistical Models [00212] Symbols nR: Count of probes labeled with Cy5 (red). nG: Count of probes labeled with Cy3 (green). r Loci tag ratio: r = nR/nG. f: Fetal fraction.
M: Maternal ploidy.
F: The number of copies of the tested chromosome per diploid fetal cell.
F = 2: Euploid state of the tested fetal chromosome.
F = 3: Trisomy state of the tested fetal chromosome.
B: P2P1 bias due to PCR artefacts or out-of-focus imaging.
L: Bias due to probe lengths and sample-specific template fragment length distribution, as well as GC content.
W(r,μ,σ2): Approximate distribution of a ratio r of two Poisson random variables. The parameters μ and σ2 represent the mean and the variance of r, respectively.
H(x,x0): Heaviside stepwise function that rises from zero to one when x reaches x0.
G(x;μ,σ2): Gaussian centered at μ, with standard deviation s.
E(x0;μ,σ2): Error function (the cumulative distribution of the Gaussian G(x;μ,σ2) from -∞ up to X0).
PE(r): Probability of observing loci tag ratio r, given that the fetus is euploid.
L(E|r): Likelihood that the fetus is euploid (E), given the observed loci tag ratio r.
U: Set of up-loci tags for the tested chromosome. Up-loci tags are the loci tags where Cy5 (red) labels come from the chromosome in question, while Cy3 (green) labels target another, reference chromosome. The tested chromosome contributes the numerator nR to the observed up-loci tag ratio r.
D: Set of down-loci tags for the tested chromosome. Down-loci tags are the loci tags where Cy3 (green) labels come from the chromosome in question, while Cy5 (red) labels target
another, reference chromosome. The tested chromosome contributes the denominator nGto the observed down-loci tag ratio r.
U U D: Set of all loci tags involving the tested chromosome labeled either with red Cy5 (numerator) or green Cy3 (denominator).
L(E|{r}): Likelihood that the sample is euploid, given the set of observed loci tag ratios {r}.
L(T|{r}): Likelihood that the sample is affected by trisomy, given the set of observed loci tag ratios {r}.
[00213] In some embodiments, statistical models may be used to formulate likelihood ratios. In some cases, such models can make one or more assumptions. Examples of assumptions that can be incorporated into models are listed below:
• Each array element contains a single affinity tag.
• Each affinity tag is associated with two sets of probes, one of which targets loci on one chromosome, while the other targets a different chromosome.
• The two sets of probes are identified and quantified based on the two fluorophores, Cy3 (green) and Cy5 (red).
• One set of probes (associated with one chromosome) carries Cy3. The other set of probes carries Cy5.
• Probes' abundances on the array linearly reflect the amount of tested DNA (fetal and maternal) in the sample.
• Fetal fraction can be estimated with uncertainty within ±2.5%.
• P2P1 bias B has already been estimated.
• Bias L due to GC content or probe lengths and sample-specific template fragment length distributions has already been estimated and corrected, leaving only negligible residual error.
[00214] The below arguments in the framework are illustrative purposes only. These can be tested using simulations and can further optimized as needed.
[00215] Distributions of Loci Tag Counts: In some cases, for a given affinity tag (an array element), the count of red Cy5 probes nR may be a random variable that approximately follows a Poisson distribution. The count of green Cy3 probes nG may also be distributed according to Poisson. The two Poisson distributions may have mean values (parameters λR and λG, respectively) that may be determined by the relative abundances of the two chromosomes in cfDNA, as well as the total coverage depth per sample, fraction of reads expected at the given element (e.g., for a given affinity tag), fetal fraction f , and the various biases B and L. The variances of the Poisson random variables
nR and nG equal their mean values, which can be estimated as the observed count values, yielding the following expressions for the uncertainties in the probe counts:

[00216] Distribution of Tag Ratios: In some cases, the loci tag ratio r= nR/nG may be a random variable representing a fraction of two Poisson random variables. The distribution of the ratio of two Poisson random variables is described in T. Griffin, 1992: Distribution of the Ratio of Two Poisson Random Variables, MSc thesis available here: https://ttuir.tdl. org/bitstream/handle/2346/59954/31295007034522.pdf?sequence=1) which is incorporated herein by reference.
[00217] In some cases, the following derivations can use the already existing distribution for the ratio of two Poisson variables. The likelihood ratio derivations may use an approximation W that may be adequate at sufficiently high per-locus depths (e.g., exceeding 100x). The approximation W is chosen as an example and does not in any way limit the generality of the model. The model can replace the approximate distribution W with more accurate expressions as needed.
[00218] In some cases, the approximate distribution W of the ratio r is a left-truncated and renormalized Gaussian centered at μ, with parameter σ2 representing the variance of the untruncated Gaussian:

[00219] The support for W (r, μ, σ2) consists of all non-negative rational values. In some cases, non-negative irrational values may be incorporated:

[00220] In Eq. 3, the term H(r,0) represents the Heaviside function:
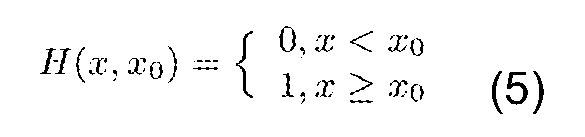
[00221] In some cases, Heaviside H(r,0) may not be needed since the support is non-negative. It may be included to emphasize the truncation at zero. G(r;μ,σ2) is the Gaussian centered at μ with variance σ2:

[00222] The term E(0;μ,σ2) represents the cumulative distribution of G(r;μ,σ2) at r = 0:
 [00223] The purpose of dividing the truncated Gaussian G(r;μ,σ2) with 1 - E(0,μ,σ2) is to secure that W(r;μ,σ2) satisfies the normalization condition:
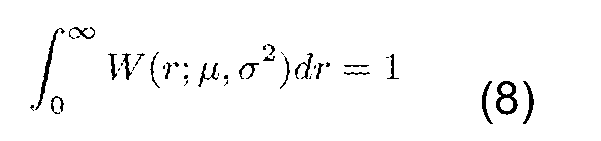
[00224] Variance of Loci Tag Ratios: The variance σ2 of the ratio r can be approximately estimated using the perturbation method (expansion of the random variable into a Taylor series around μ and truncation after the linear term):

[00225] The ellipsis in Eq. 9 represents higher-order terms, including correlations. Although nR and nG may be correlated (since both are proportional to the overall depth per sample, as well as to the fraction of reads apportioned to their shared loci tag), we may neglect the cross-term and focus on individual contributions. The partial derivatives
 and
and
 may be evaluated further:


[00226] Combining Eqs. 9-11 and Eqs. 1-2 gives:
 ( )
( )
[00227] Distribution of Euploid Loci Tag Ratios: In a cfDNA sample where both the mother and the fetus are diploid and there are no biases, the distribution W(r;μ,σ2) may be centered at μ = 1. In the presence of P2P1 bias B ≠1, the central tendency becomes μ = B. In the following, the bias B may be neglected (i.e., equated to 1). B may be re-introduced into the relevant expressions.
[00228] In the absence of P2P1 bias B, the variance of the euploid loci tag ratio r can be derived from Eq. 12:

[00229] As with μ, extension to P2P1 -biased situation can be computed. Note that both the variance and the mean of the loci tag ratio in a euploid sample may be independent of the fetal fraction. Given that the fetus is euploid, the probability distribution of loci tag ratios can be:
 [00230] In some cases, the likelihood L(E|r) that the fetus is euploid can be given by using the observed loci tag ratio rand using the same expression, with r and euploid status switching roles as condition and conditioned variable:

[00231] Distribution of Trisomy Loci Tag Ratios in Up Loci Tags: Given a trisomy fetal status for the tested chromosome, up-loci tags may contain the affected counts nR in the numerator and the mean may become μ = 1 + f/2. As in the euploid case, bias B may be included as necessary.
[00232] The variance of the up-loci tag ratio in a trisomy sample may be obtained from Eq. 12:

[00233] The probability distribution of up-loci tag ratios given in a trisomy sample may then be:

[00234] Similarly, the likelihood L(T]r) that the fetus may be affected by trisomy, given the observed loci tag ratio r, may be given as:

[00235] Distribution of Trisomy Loci Tag Ratios in Down Loci Tags: In a down-loci tag, the tested trisomy chromosome may contribute to the denominator nG. The mean for the down-loci tag ratio in a trisomy fetus may be given as follows:

[00236] The variance of the down-loci tag ratio in a trisomy sample may be obtained from Eq. 12:

[00237] The probability distribution of down-loci tag ratios given in a trisomy sample may then be:

[00238] Similarly, the likelihood L(7]r) that the fetus may be affected by trisomy given the observed loci tag ratio r may be given as:

[00239] In some cases, the trisomy scenario may make both mean and variance of loci tag ratios dependent on the fetal fraction, for example, up- and down-loci tags. In such cases, as the fetal fraction increases, up-loci tag mean and variance both increases, while down-loci tag mean and variance both decreases. In some cases, variance may be inversely proportional to nG, which reflects (but does not equal) the per-loci tag coverage depth.
[00240] Likelihood Ratio: In an array with multiple loci tags, a chromosome to be tested may be selected. All up-loci tags (the loci tags where the tested chromosome contributes counts nR to the numerator) and down-loci tags (where the chromosome in question provides denominator counts nG) may be identified. Rest of the loci tags may not be included in the analysis if they didn't contribute any information on the tested chromosome. The up-loci tags form the set U while the set D collects all down-loci tags for the given chromosome.
[00241] The likelihood that the fetus may be affected by trisomy given the observed up- and down-loci tag ratios is the product of contributions from individual loci tags:

[00242] The likelihood that the fetus may be euploid given the observed loci tag ratios is also the product of contributions from individual loci tags. In this case, up- and down-loci tags may not be distinguished from each other.

[00243] The test statistic for detection of fetal trisomy may be given as the ratio between the alternative hypothesis likelihood L(7]{r}) and the null-hypothesis likelihood L(E|{r}). For example, by taking the logarithm of the likelihood ratio, the following expression can be derived:
 [00244] The above expression may sum up a set of parabolas, two contributions (H1 and H0) per loci tag. A single parabola may further be derived. The parabola may be a sum of squared Mahalanobis distances, justifying the X2 distribution for the null hypothesis.
[00245] Classification: The critical value for classification can be obtained from scaled X2 distribution, using scaling factor of 2 and a desired Type I (false positive) error rate a. Note that the definition of the log likelihood ratio (Eq. 25) requires reversal of the sign of the test statistic, as the support for the X2 distribution excludes negative values.
[00246] Model Extensions: The model can be extended in multiple ways. For example, in addition to diploid maternal state, the model can include maternal deletions and duplications. Some practical applications may require extension to non-negligible P2P1 bias ( B ≠1 ). Correlations between nR and nG may need to be considered when estimating variances for euploid, up-loci tag trisomy, and down-loci tag trisomy variances σ2.
[00247] The variance expressions in trisomy cases may include contributions from fetal fraction f . The estimated value of f comes with an error bar 5f. For example, the error can be about 1 %, 2%, 3%, 4%, 5% or more. In some cases, the error can be between 2% and 3%. One can account for the additional uncertainty propagated from measured fetal fraction either by explicitly using the posterior distribution of f as a term in the joint distribution for f and r, or by applying the perturbation analysis of the error propagation as in the case of counts. In the first case, marginalization over all admissible values of f may remove explicit dependence on the continuum of f -values, while leaving the central tendency and the spread of f in the expression for the distribution of r. Both approaches may yield similar results. The impact of 5f may need to be further characterized.
[00248] The model presented in the current disclosure assumes that loci tag counts have been corrected for probe length bias and/or GC bias prior to evaluating loci tag ratios. Alternatively, one can incorporate explicit terms for these biases into the likelihood functions.
[00249] The approximation W is used primarily for illustrative purposes and more accurate expressions for the distribution of the ratio may be used as mentioned elsewhere in the disclosure. [00250] The approach described here for whole chromosome aneuploidies can be applied with minimal modifications to enhance the detection of microdeletions/microduplications.
[00251] The procedure disclosed herein may be applied to determine fetal sex and/or detection of fetal sex aneuploidies, for example. Similar expressions can also be used to estimate fetal fraction from chromosomes X and/or Y when the fetal karyotype is X, XXX, XY, XYY, OR XXY.
[00252] Application to Sex Determination: If fetal fraction fis determined using SNP allele counts, its estimate can be used to enhance sex determination based on loci tags that involve sex chromosomes (X and Y). There are three main groups of such loci tags: XA (where the probes target
ChrX and one of the autosomes A), YA (targeting ChrY and an autosome A), and XY (where one polarity targets ChrX and the other binds to ChrY). Within each of these three main categories, there are two types of loci tags, depending on whether X and/or Y is assigned polarity P1 (Cy3, green) or polarity P2 (Cy5, red). In the following, symbols a, x, and y refer to counts on the autosome, ChrX, or ChrY, respectively. Six types of ratios can be formed: x/a, a/x, y/a, a/y, x/y, and y/x, where the numerator is the P2 polarity (red, Cy5) and the denominator is P1 (green, Cy3). Because the expected ChrY count in female fetuses is zero, the reciprocal of x/y and a/y can be taken to avoid division by zero.
[00253] Sex determination can incorporate sex chromosomal aneuploidies, such as Turner (female with single X chromosome), Triple X (female with three X chromosomes), Jacobs (male with one X and two Y chromosomes), and Klinefelter (male with one Y and two X chromosomes).
[00254] Expectation values and variances for all possible scenarios can be derived. Since there are many scenarios, we can apply the following general definitions, where r is the loci tag ratio, N is the numerator, and D is the denominator:

[00255] In the above result, μ represents the expectation value for r μ = E(r) (27)
[00256] Eq. 26 can be equivalently rewritten as follows:

[00257] With these general formulas, the different karyotypes (XX, X, XXX, XY, XYY, and XXY) and the different loci tag types (XA, YA, and XY, with both polarity assignments) may yield the following expectation values and variances for loci tag ratios:
[00258] Normal Female (karyotype XX), Loci Tag XA, Polarity assignment P1=A, P2=X:


[00259] Normal Female (karyotype XX), Loci Tag XA, Polarity assignment P1=X, P2=A:


[00260] Normal Female (karyotype XX), Loci Tag YA, either polarity assignment:

 where b stands for background noise.
[00261] Normal Female (karyotype XX), Loci Tag YX, either polarity assignment:


[00262] Turner Female (karyotype X), Loci Tag XA, Polarity assignment P1=A, P2=X:

V

[00263] Turner Female (karyotype X), Loci Tag XA, Polarity assignment P1=X, P2=A:


[00264] Turner Female (karyotype X), Loci Tag YA, either polarity assignment:

[00265] Turner Female (karyotype X), Loci Tag YX, either polarity assignment:


[00266] Triple-X Female (karyotype XXX), Loci Tag XA, Polarity assignment P1=A, P2=X:

[00267] Triple-X Female (karyotype XXX), Loci Tag XA, Polarity assignment P1=X, P2=A:

[00268] Triple-X Female (karyotype XXX), Loci Tag YA, either polarity assignment:


[00269] Triple-X Female (karyotype XXX), Loci Tag YX, either polarity assignment:


[00270] Normal Male (karyotype XY), Loci Tag XA, Polarity assignment P1=A, P2=X:

[00271] Normal Male (karyotype XY), Loci Tag XA, Polarity assignment P1=X, P2=A:

[00272] Normal Male (karyotype XY), Loci Tag YA, either polarity assignment:


[00273] Normal Male (karyotype XY), Loci Tag XY, either polarity assignment:

[00274] Jacobs Male (karyotype XYY), Loci Tag XA, Polarity assignment P1=A, P2=X:


[00275] Jacobs Male (karyotype XYY), Loci Tag XA, Polarity assignment P1=X, P2=A:

[00276] Jacobs Male (karyotype XYY), Loci Tag YA, either polarity assignment:

[00277] Jacobs Male (karyotype XYY), Loci Tag XY, either polarity assignment:

[00278] Klinefelter Male (karyotype XXY), Loci Tag XA, Polarity assignment P1=A, P2=X:

[00279] Klinefelter Male (karyotype XXY), Loci Tag XA, Polarity assignment P1=X, P2=A:

[00280] Klinefelter Male (karyotype XXY), Loci Tag YA, either polarity assignment:


[00281] Klinefelter Male (karyotype XXY), Loci Tag XY, either polarity assignment:

[00282] Application to Fetal Fraction Estimation from ChrX and/or ChrY in Male, Turner, and Triple X Pregnancies: In some cases where fetal sex is known, fetal fraction can be estimated using X and/or Y representation. We can take the expressions for likelihood listed above for karyotypes X, XXX, XY, XYY, and XXY and plug them into maximum likelihood estimation. Uncertainty can be estimated using Cramer-Rao bound.
[00283] Alternative Formulations: In some cases, Loci tag fractions such as x/(x + a), y/(y + a), or y/(y + x) may be used. In that case, the likelihoods would take the form of the beta distribution, with shape parameters given by α = x + 1 and β = a + 1 in the case of x/(x + a) and analogously for the other two fractions.
[00284] In some embodiments, P1 may be dissociated from P2 and individual probe counts can directly be used. In that case, Poisson distributions can be used as building blocks for likelihoods, with the parameter λ (the mean) absorbing per-sample depth, loci tag/polarity-specific fraction of sample reads, and the terms reflecting fetal fraction. For example, the distribution of a trisomy count n for given loci tag and polarity would be P(n, Nφ( 1 + f/ 2)), where P is the Poisson distribution, N is the total coverage depth for the given sample, f is the fraction of reads expected at the given loci tag/polarity, and f is the fetal fraction.
Table 2: Exemplary genetic variations associated with tumors (Amplification of the gene)


Table 3: Exemplary genetic variations associated with tumors (Deletion of the gene)


[00285] In some embodiments, the probe sets of the present disclosure may be configured to target known genetic variations associated with tumors. These may include mutations, SNPs, copy number variants (e.g., amplifications, deletions), copy neutral variants (e.g., inversions, translocations), and/or complex combinations of these variants.
[00286] In the method of diagnosing cancer according to some embodiments, inversions that occur at known locations may easily be targeted by designing probes that at least partially overlap the breakpoint in one probe arm. A first probe that binds the “normal” sequence targets non-inverted genomic material and carries a first label type. A second probe that binds the “inverted” target carries a second label type. A common right probe arm binds native sequence that is not susceptible to inversion, immediately adjacent the first two probes. This right probe arm further carries a common pull-down affinity tag or binding that localizes the probe products to the same region of an imaging substrate. In this way, the probe pairs may hybridize to the genomic targets, ligate, and be imaged to yield relative counts of the two underlying species.
[00287] Similarly, translocations that have known breakpoints may also be assayed. Figure 68A shows two genetic elements that are either in their native order or translocated. Probe arms that at least partially overlap these translocation breakpoints allow differentiation between normal and transposed orders of genetic material. By choosing unique labels on the two left arms, the resulting ligated probe products may be distinguished and counted during imaging.
[00288] These methods for detecting copy neutral changes (e.g., inversions, translocation) may also be used to detect germline variants in cancer or in other disease or conditions.
[00289] Mutations or SNPs are also implicated in numerous cancers, and are targeted in a similar manner to those that are interrogated in determining fetal fraction in the prenatal diagnostics application. In some embodiments, left probe arms are designed to take advantage of an energetic imbalance caused by one or more mismatched SNPs. This causes one probe arm (carrying one label) to bind more favorably than a second probe arm (carrying a second type of label). Both designs ligate to the same right probe arm that carries the universal affinity tag.
[00290] A given patient's blood may be probed by one method, or a hybrid of more than one method. Further, in some cases, customizing specific probes for a patient may be valuable. This would involve characterizing tumor features (SNPs, translocations, inversions, etc.) in a sample from the primary tumor (e.g., a biopsy) and creating one or more custom probe sets that is optimized to detect those patient-specific genetic variations in the patient's blood, providing a low-cost, non- invasive method for monitoring. This could have significant value in the case of relapse, where
detecting low-level recurrence of a tumor type (identical or related to the original tumor) as early as possible is ideal.
[00291] For common disease progression pathways, additional panels may be designed to anticipate and monitor for disease advancement. For example, if mutations tend to accumulate in a given order, probes may be designed to monitor current status and progression “checkpoints,” and guide therapy options.
[00292] Early detection of cancer: For example, the ALK translocation has been associated with lung cancer. A probe designed to interrogate the ALK translocation may be used to detect tumors of this type via a blood sample. This would be highly advantageous, as the standard method for detecting lung tumors is via a chest x-ray an expensive procedure that may be deleterious to the patient’s health and so is not standardly performed.
[00293] Detection of recurrence of the primary tumor type: For example, a HER2+ breast tumor is removed by surgery and the patient is in remission. A probe targeting the HER2 gene may be used to monitor for amplifications of the HER2 gene at one or more time points. If these are detected, the patient may have a second HER2+ tumor either at the primary site or elsewhere.
[00294] Detection of non-primary tumor types: For example, a HER2+ breast tumor is removed by surgery and the patient is in remission. A probe targeting the EGFR gene may be used to monitor for EGFR+ tumors. If these are detected, the patient may have a second EGFR+ tumor either at the primary site or elsewhere.
[00295] Detection of metastasis: For example, the patient has a HER2+ breast tumor. A probe designed to interrogate the ALK translocation may be used to detect tumors of this type via a blood sample. This tumor may not be in the breast and is more likely to be in the lung. If these are detected, the patient may have a metastatic tumor distal to the primary organ.
[00296] Determining tumor heterogeneity: Many tumors have multiple clonal populations characterized by different genetic variants. For example, a breast tumor may have one population of cells that are HER2+ and another population of cells that are EGFR+. Using probes designed to target both these variants would allow the identification of this underlying genetic heterogeneity.
[00297] Measurement of tumor load: In all the above examples, the quantity of tumor cfDNA may be measured and may be used to determine the size, growth rate, aggressiveness, stage, prognosis, diagnosis and other attributes of the tumor and the patient. Ideally, measurements are made at more than one time point to show changes in the quantity of tumor cfDNA.
[00298] Monitoring treatment: For example, a HER2+ breast tumor is treated with Herceptin. A probe targeting the HER2 gene may be used to monitor for quantity of tumor cfDNA, which may be a proxy for the size of the tumor. This may be used to determine if the tumor is changing in size and
treatment may be modified to optimize the patient’s outcome. This may include changing the dose, stopping treatment, changing to another therapy, combing multiple therapies.
[00299] Screening for tumor DNA: There is currently no universal screen for cancer. The present disclosure offers a way to detect tumors at some or all locations in the body. For example, a panel of probes is developed at a spacing of 100 kb across the genome. This panel may be used as a way to detect genetic variation across the genome. In one example, the panel detects copy number changes of a certain size across the genome. Such copy number changes are associated with tumor cells and so the test detects the presence of tumor cells. Different tumor types may produce different quantities of tumor cfDNA or may have variation in different parts of the genome. As such, the test may be able to identify which organ is affected. Further the quantity of tumor cfDNA measured may indicate the stage or size of the tumor or the location of the tumor. In this way, the test is a whole- genome screen for many or all tumor types.
[00300] For all the above tests, in order to mitigate false positives, a threshold may be used to determine the presence or certainty of a tumor. Further, the test may be repeat on multiple sample or at multiple time points to increase the certainty of the results. The results may also be combined with other information or symptoms to provide more information or more certain information on the tumor.
[00301] In this disclosure, references are made to the accompanying drawings, and specific examples are disclosed below, which form a part of the description and in which are shown specific embodiments in accordance with the described embodiments. Although these embodiments are described in sufficient detail to enable one skilled in the art to practice the described embodiments, it is understood that these examples are not limiting; such that other embodiments may be used, and changes may be made without departing from the spirit and scope of the described embodiments.
Additional Embodiments
A1. A method of determining a genetic variation of a nucleic acid region of interest in a genome of interest, the method comprising:
(A) providing a genetic sample comprising genetic material derived from a first genome and genetic material derived from a second genome;
(B) determining a first metric representative of a joint probability of a first copy number hypothesis for a nucleic acid region of interest in the first genome by a process comprising: determining a first probability and a second probability of the first copy number hypothesis wherein, each of the first probability and the second probability of the first copy number hypothesis is a function of (i) an amount of a plurality of non-polymorphic reference loci in the genetic sample, and (ii) an amount of a plurality of non-polymorphic loci in the nucleic acid region of interest in the genetic sample, the first probability of the first copy number hypothesis is further a function of a first likelihood distribution (f1) of a genetic fraction of genetic material derived from the first genome in the genetic sample relative to an amount of genetic material derived from the second genome in the genetic sample, wherein f1 is determined according to (i) and (ii), and the second probability of the first copy number hypothesis is further a function of a second likelihood distribution (f2) of the genetic fraction, wherein f2 is determined according to a plurality of informative polymorphic alleles located at a plurality of reference loci in the genetic sample; and combining the first and the second probability of the first copy number hypothesis, thereby providing the first metric;
(C) determining a second metric representative of a joint probability of a second copy number hypothesis for the nucleic acid region of interest in the first genome by a process comprising:
determining a first probability and a second probability of the second copy number hypothesis wherein, each of the first probability and a second probability of the second copy number hypothesis is a function of (i) and (ii), the first probability of the second copy number hypothesis is further a function of f1 , the second probability of the second copy number hypothesis is further a function of f2; and combining the first and the second probability of the second copy number hypothesis, thereby providing the second metric; and
(D) determining the presence or absence of the genetic variation in the nucleic acid region of interest in the first genome according to a comparison of the first metric and the second metric.
A1.1. A method of determining a copy number of a nucleic acid region of interest in a genome of interest, the method comprising:
(A) providing a genetic sample comprising genetic material derived from a first genome and genetic material derived from a second genome;
(B) determining a first metric representative of a joint probability of a first copy number hypothesis for a nucleic acid region of interest in the first genome by a process comprising: determining a first probability and a second probability of the first copy number hypothesis wherein, each of the first probability and the second probability of the first copy number hypothesis is a function of (i) an amount of a plurality of non-polymorphic reference loci in the genetic sample, and (ii) an amount of a plurality of non-polymorphic loci in the nucleic acid region of interest in the genetic sample, the first probability of the first copy number hypothesis is further a function of a first likelihood distribution (f1) of a genetic fraction of genetic material derived from the first genome in the genetic sample relative to an amount of genetic material derived from the second genome in the genetic sample, wherein f1 is determined according to (i) and (ii), and the second probability of the first copy number hypothesis is further a function of a second likelihood distribution (f2) of the genetic fraction, wherein f2 is determined according to a plurality of informative polymorphic alleles located at a plurality of reference loci in the genetic sample; and
combining the first and the second probability of the first copy number hypothesis, thereby providing the first metric;
(C) determining a second metric representative of a joint probability of a second copy number hypothesis for the nucleic acid region of interest in the first genome by a process comprising: determining a first probability and a second probability of the second copy number hypothesis wherein, each of the first probability and a second probability of the second copy number hypothesis is a function of (i) and (ii), the first probability of the second copy number hypothesis is further a function of f1 , the second probability of the second copy number hypothesis is further a function of f2; and combining the first and the second probability of the second copy number hypothesis, thereby providing the second metric; and
(D) determining the copy number of the nucleic acid region of interest in the first genome according to a comparison of the first metric and the second metric.
A1.3. The method of embodiment A1 or A1.1 , wherein the genetic sample is derived from a subject.
A1.4. The method of any one of embodiments A1 to A1.3, wherein the genetic sample is obtained directly or indirectly from a subject.
A1.5. The method of any one of embodiments A1 to A1.4, wherein the subject is a mammal.
A1.6.. The method of embodiment A1.5, wherein the subject is a human.
A2. The method of any one of embodiments A1 to A1.6, wherein the first genome is a genome of a fetus and the second genome is a genome of a mother of the fetus.
A3. The method of any one of embodiments A1 to A1.6, wherein the first genome is a genome of a mother of a fetus and the second genome is a genome of the fetus.
A4. The method of embodiment A2 or A3, wherein the subject is a pregnant female.
A5. The method of any one of embodiments A1 to A1.6, wherein the first genome is a genome of a cancer and the second genome is a genome of non-cancerous tissue.
A5.1. The method of embodiment A5, wherein the subject has or is suspected of having a cancer. A5.2. The method of embodiment A5 or A5.1 , wherein the cancer comprises a tumor.
A5.3. The method of embodiment A5 or A5.1 , wherein the cancer comprises a blood cancer.
A6. The method of any one of embodiments A1 to A1.6, wherein the first genome is a genome of a transplant and the second genome is a genome of transplant recipient.
A6.1. The method of embodiment A6, wherein the subject is a transplant recipient.
A6.2. The method of embodiment A6 or A6.1 , wherein the transplant comprises a transplanted organ or tissue.
A6.3. The method of embodiment A6.2, wherein the transplanted organ is selected from the group consisting of liver, kidney, heart, pancreas, intestine, lung and portions thereof.
A6.4. The method of embodiment A6.2, wherein the transplanted tissue is selected from the group consisting of skin, bone marrow, bone, heart valve, cornea, veins, and connective tissue.
A7. The method of any one of embodiments A1 to A6.4, wherein the first genome is different than the second genome.
A8. The method of any one of embodiments A1 to A7, wherein the genetic sample comprises a mixture of genetic material derived from the first genome and the second genome.
A8.1. The method of any one of embodiments A1 to A8, wherein the genetic sample comprises nucleic acids.
A8.2. The method of embodiment A8.1 , wherein the nucleic acids comprise DNA.
A8.3. The method of embodiment A8.2, wherein the DNA comprises genomic DNA.
A8.4. The method of any one of embodiments A1 to A8.3, wherein the genetic sample or nucleic acids comprise cell-free DNA (cfDNA).
A8.5. The method of any one of embodiments A1 to A8.4, wherein the genetic sample comprises nucleic acids derived from a fetus and nucleic acids derived from the mother of the fetus.
A8.6. The method of any one of embodiments A1 to A8.4, wherein the genetic sample comprises nucleic acids derived from a cancer and nucleic acids derived from non-cancerous tissue.
A8.7. The method of any one of embodiments A1 to A8.6, wherein the genetic sample is acellular or is derived from a sample that is substantially devoid of cells.
A8.8. The method of any one of embodiments A1 to A8.6, wherein the genetic sample comprises cells or is derived from a sample comprising cells.
A8.9. The method of any one of embodiments A1 to A8.8, wherein the genetic sample comprises, is derived from, or is isolated from, a bodily fluid or secretion.
A8.10. The method of any one of embodiments A1 to A8.9, wherein the genetic sample comprises or is derived from a blood product.
A8.11. The method of embodiment A8.10, wherein the blood product is selected from whole blood, plasma, serum, and buffy coat.
A8.12. The method of any one of embodiments A1 to A8.11 , wherein the genetic sample is or is derived from a sample selected from the group consisting of whole blood, blood plasma, blood serum,
buffy coat, lymph, urine, vaginal fluid, semen, cerebrospinal fluid, saliva, sweat, tears, amniotic fluid, bronchoalveolar lavage, breast milk, colostrum, the like and combinations thereof.
A9. The method of any one of embodiments A1 to A8.12, wherein the reference loci each comprise a locus or region of a chromosome having a same number of copies in the first genome and the second genome.
A10. The method of any one of embodiments A1 to A9, wherein the polymorphic alleles comprise single nucleotide polymorphisms (SNPs).
A11. The method of any one of embodiments A1 to A10, wherein the non-polymorphic reference loci comprise a region or locus of an autosome being diploid in the first genome and diploid in the second genome.
A12. The method of any one of embodiments A1 to A11 , wherein the first genome and the second genome is derived from a female subject and the non-polymorphic reference loci comprise a region or locus of an X chromosome being diploid in the first genome and diploid in the second genome.
A13. The method of any one of embodiments A1 to A12, wherein the first copy number hypothesis is a null hypothesis.
A14. The method of any one of embodiments A1 to A13, wherein the first copy number hypothesis is a hypothesis that the nucleic acid region of interest is an autosome being diploid in the first genome.
A15. The method of any one of embodiments A1 to A13, wherein the first copy number hypothesis is a hypothesis that the nucleic acid region of interest is an X chromosome being monoploid or diploid in the first genome.
A16. The method of any one of embodiments A1 to A13, wherein the first copy number hypothesis is a hypothesis that the nucleic acid region of interest is a Y chromosome being monoploid in the first genome.
A16.1. The method of any one of embodiments A1 to A13, wherein the first copy number hypothesis is a hypothesis that the nucleic acid region of interest is a portion of an autosome having two copies present in the first genome.
A16.2. The method of any one of embodiments A1 to A13, wherein the first copy number hypothesis is a hypothesis that the nucleic acid region of interest is a portion of a X chromosome having one or two copies present in the first genome.
A16.3. The method of any one of embodiments A1 to A13, wherein the first copy number hypothesis is a hypothesis that the nucleic acid region of interest is a portion of a Y chromosome having one copy present in the first genome.
A17. The method of any one of embodiments A1 to A16.3, wherein the second copy number hypothesis is a hypothesis that the nucleic acid region of interest is aneuploid in the first genome.
A18. The method of any one of embodiments A1 to A17, wherein the second copy number hypothesis is a hypothesis that the nucleic acid region of interest is an autosome being triploid in the first genome.
A19. The method of any one of embodiments A1 to A17, wherein the second copy number hypothesis is a hypothesis that the nucleic acid region of interest is an autosome being monoploid in the first genome.
A20. The method of any one of embodiments A1 to A17, wherein the second copy number hypothesis is a hypothesis that the nucleic acid region of interest is an X chromosome being absent, monoploid, diploid or triploid in the first genome.
A21. The method of any one of embodiments A1 to A17, wherein the second copy number hypothesis is a hypothesis that the nucleic acid region of interest is a Y chromosome being absent, monoploid, diploid or triploid in the first genome.
A22. The method of any one of embodiments A1 to A16.3, wherein the second copy number hypothesis is a hypothesis that the nucleic acid region of interest is a portion of an autosome having less than or more than two copies present in the first genome.
A23. The method of any one of embodiments A1 to A22, wherein the nucleic acid region of interest is selected from a chromosome or a portion thereof, or a gene or portion thereof, [spec, add repetitive regions]
A24. The method of any one of embodiments A1 to A23, wherein the first metric and/or the second metric comprises a likelihood or likelihood distribution.
A24.1. The method of any one of embodiments A1 to A24, wherein the first metric and/or the second metric comprises a measure of certainty.
A24.2. The method of any one of embodiments A1 to A24.1 , wherein the first metric and/or the second metric comprises a measure of error.
A25. The method of any one of embodiments A1 to A 24.2, wherein the first or second probability of the first copy number hypothesis and/or the first or second probability of the second copy number hypothesis comprise a likelihood distribution.
A26. The method of any one of embodiments A1 to A25, wherein the comparison comprises determining a ratio of the first metric to the second metric.
A27. The method of any one of embodiments A1 to A26, wherein the combining of the first and the second probability of the first copy number hypothesis comprises multiplying the first and the second probabilities of the first copy number hypothesis.
A28. The method of any one of embodiments A1 to A27, wherein the combining of the first and the second probability of the second copy number hypothesis comprises multiplying the first and the second probabilities of the second copy number hypothesis.
A29. The method of any one of embodiments A1 to A28, wherein the combining of the first and the second probability of the first copy number hypothesis comprises determining a ratio of the first and the second probabilities of the first copy number hypothesis.
A30. The method of any one of embodiments A1 to A29, wherein the combining of the first and the second probability of the second copy number hypothesis comprises determining a ratio of the first and the second probabilities of the second copy number hypothesis.
A31. The method of any one of embodiments A1 to A30, wherein the comparison of the first metric and the second metric comprises determining which of the first or the second metric has the highest value.
A32. The method of embodiment A31 , wherein upon the first metric being greater than the second metric, the first copy number hypothesis is true, or upon the second metric being greater than the first metric, the second copy number hypothesis is true.
A33. The method of embodiment A31 , wherein upon the first metric being greater than the second metric, the copy number of the nucleic acid region of interest in the first genome is determined according to the first copy number hypothesis, or upon the second metric being greater than the first metric, the copy number of the nucleic acid region of interest in the first genome is determined according to the second copy number hypothesis.
A34. The method of any one of embodiments A1 to A33, further comprising determining (i) the amount of the plurality of non-polymorphic reference loci in the genetic sample, and (ii) the amount of the plurality of non-polymorphic loci in the nucleic acid region of interest in the genetic sample.
A35. The method of any one of embodiments A1 to A34, further comprising determining a relative amount of (i) and (ii).
A36. The method of embodiment A34 or A35, wherein (i) is determined by a process comprising:
I.) contacting at least a first and a second probe set to the genetic sample, wherein
(1 ) the first probe set comprises a first labeling probe and a first tagging probe comprising an affinity tag, wherein the first labeling probe hybridizes adjacent to the first tagging probe on a first non-polymorphic reference locus of the plurality of non-polymorphic reference loci, and
(2) the second probe set comprises a second labeling probe, and a second tagging probe comprising the affinity tag, wherein the second labeling probe hybridizes adjacent to the second tagging probe on a first non-polymorphic locus in the nucleic acid region of interest of the plurality of non-polymorphic loci in the nucleic acid region of interest;
II.) ligating the first labeling probe to the first tagging probe thereby providing a first ligated probe set, and ligating the second labeling probe to the second tagging probe, thereby providing a second ligated probe set;
III.) amplifying the first and second ligated probe sets to form first and second amplified ligated probe sets, respectively, wherein,
(1 ) the first ligated probe set is amplified using a first primer that hybridizes to a portion of the first labeling probe, or complement thereof, and comprises a first label, and a second primer that hybridizes to a portion of the first tagging probe, or complement thereof, wherein the first amplified probe set comprises the first label and the affinity tag, or a complement thereof, and
(2) the second ligated probe set is amplified using a third primer that hybridizes to a portion of the second labeling probe, or complement thereof, and comprises a second label, and the second primer, wherein the second primer hybridizes to a portion of the second tagging probe, wherein the second amplified probe set comprises the second label and the affinity tag, or a complement thereof, and the first and second labels are different; and
IV.) immobilizing the affinity tag or a complement thereof, of the first and second amplified ligated probe sets to a member of an array having a pre-defined location on the array; and
V.) determining a first count of the first label immobilized on the member of the array, and determining a second count of the second label immobilized on the member of the array, wherein each of the first and the second labels are individually optically resolvable on the member of the array. A37. The method of any one of embodiments A1 to A36, further comprising determining f1.
A38. The method of embodiment A37, wherein f1 is determined according to a process comprising I, II, III, IV and V of embodiment A36.
A39. The method of any one of embodiments A1 to A38, wherein f2 is a predetermined value.
A40. The method of any one of embodiments A1 to A38, further comprising determining f2.
A41. The method of embodiment A40, wherein f1 is determine prior to, at the same time, at substantially the same time, or after determining f2.
A42. The method of embodiment A40 or A41 , wherein f2 is determined by a process comprising:
I.) contacting at least a first and a second probe set to the genetic sample, wherein (1 ) the first probe set comprises a first labeling probe and a first tagging probe comprising an affinity tag, wherein the first labeling probe hybridizes adjacent to the first tagging probe at a first allele of an informative polymorphic locus of the plurality of non-polymorphic reference loci, and
(2) the second probe set comprises a second labeling probe, and the first tagging probe, wherein the second labeling probe hybridizes adjacent to the first tagging probe on a second allele of the informative polymorphic locus of the plurality of non-polymorphic reference loci;
II.) ligating the first labeling probe to the first tagging probe thereby providing a first ligated probe set, and ligating the second labeling probe to the first tagging probe, thereby providing a second ligated probe set;
III.) amplifying the first and second ligated probe sets to form first and second amplified ligated probe sets, respectively, wherein,
(1 ) the first ligated probe set is amplified using a first primer that hybridizes to a portion of the first labeling probe, or complement thereof, and comprises a first label, and a second primer that hybridizes to a portion of the first tagging probe, or complement thereof, wherein the first amplified probe set comprises the first label and the affinity tag, or a complement thereof, and
(2) the second ligated probe set is amplified using a third primer that hybridizes to a portion of the second labeling probe, or complement thereof, and comprises a second label, and the second primer, wherein the second amplified probe set comprises the second label and the affinity tag, or a complement thereof, and the first and second labels are different; and
IV.) immobilizing the affinity tag or a complement thereof, of the first and second amplified ligated probe sets to a member of an array having a pre-defined location on the array;
V.) determining a first count of the first label immobilized on the member of the array, and determining a second count of the second label immobilized on the member of the array, wherein each of the first and the second labels are individually optically resolvable on the member of the array. A43. The method of any one of embodiments A1 to A42, wherein the method comprises or consists of a computer-implemented method,
A44. The method of any one of embodiments A1 to A43, wherein (A), (B), (C) and/or (D) are implemented by a computer or require use of a computer.
A45. A non-transitory computer readable medium configured to carry out the method of any one of claims A1 to A44.
B1. A method of analyzing a genetic sample from a subject, said genetic sample containing a first genetic material and optionally having a second genetic material, the method comprising: determining a fraction of the second genetic material in the genetic sample based on a first number and a second number, the first number and the second number obtained by: contacting first and second probe sets to the genetic sample, wherein the first probe set comprises a first labeling probe and a first tagging probe,
and wherein the second probe set comprises a second labeling probe and a second tagging probe; hybridizing the first and second probe sets to first and second nucleic acid regions of interest in nucleotide molecules present in the genetic sample, respectively; labeling the first and second labeling probes with first and second labels, respectively; immobilizing the first and second probe sets to a substrate at a density in which the first and second labels of the first and second probe sets are optically resolvable after immobilization; and detecting:
(i) a first number of the first label corresponding to a first subset of the first probe set immobilized to the substrate, and
(ii) a second number of the second label corresponding to a second subset of the second probe set immobilized to the substrate to detect the nucleic acid copy numbers, wherein the probes of the first subset and the second subset hybridize to the first and the second nucleic acid regions of interest, respectively, that contain one or more biomarkers informative of the fraction of the second genetic material in the genetic sample.
B2. The method of embodiment B1 , wherein the genetic material from the first genetic material comprises maternal genetic material from the subject, and the second genetic material comprises fetal genetic material from a fetus.
B3. The method of embodiment B1 or B2, wherein a ratio of the first number and the second number corresponds to a measure of the fetal fraction.
B4. The method of embodiment B1 , wherein the genetic material from the first genetic material comprises non-tumor derived genetic material, and the second genetic material comprises tumor- derived genetic material.
B5. The method of any one of embodiments B1-B4, wherein the first and the second nucleic acid regions of interest are the same region.
B6. The method of embodiment B5, wherein the first and the second probe sets are allele-specific and each hybridize to the same or about the same region of the genome.
B7. The method of any one of embodiments B1-B4, wherein the first and the second probe sets are allele-specific and each hybridize to different regions of the genome.
B8. The method of any one of embodiments B1-B7, further comprising determining a genetic variation in the genetic sample when the fraction exceeds a predetermined threshold.
B9. The method of any one of embodiments B1-B8, wherein the one or more biomarkers are selected from the group consisting of a SNP, an indel, a microsatellite, a bi-allelic marker, a multi- allelic marker, a polymorphic marker, a polynucleotide repeat, a fragment size, a copy number variant, a methylation marker and combinations thereof.
B10. The method of any one of embodiments B1-B8, wherein the one or more biomarkers comprise one or more SNPs.
B11. The method of any one of embodiments B1-B8, wherein the one or more biomarkers comprise one or more indels.
B12. The method of any one of embodiments B1-B8, wherein the one or more biomarkers comprise one or more microsatellites.
B13. The method of any one of embodiments B1-B8, wherein the one or more biomarkers comprise one or more bi-allelic markers.
B14. The method of any one of embodiments B1-B8, wherein the one or more biomarkers one or more multi-allelic markers.
B15. The method of any one of embodiments B1-B8, wherein the one or more biomarkers comprise one or more polymorphic markers.
B16. The method of any one of embodiments B1-B8, wherein the one or more biomarkers comprise one or more polynucleotide repeats.
B17. The method of any one of embodiments B1-B8, wherein the one or more biomarkers comprise a fragment size.
B18. The method of any one of embodiments B1-B8, wherein the one or more biomarkers comprise one or more copy number variants.
B19. The method of any one of embodiments B1-B8, wherein the one or more biomarkers one or more methylation markers.
B20. The method of any one of embodiments B1-B19, wherein the genetic variation is selected from the group consisting of an aneuploidy, a copy number change, a deletion, an indel, an inversion, a monosomy, a mutation, a SNP, a translocation, and a trisomy.
B21. The method of any one of embodiments B1-B19, wherein the genetic variation comprises an aneuploidy.
B22. The method of any one of embodiments B1-B19, wherein the genetic variation comprises a copy number change.
B23. The method of any one of embodiments B1-B19, wherein the genetic variation comprises a deletion.
B24. The method of any one of embodiments B1-B19, wherein the genetic variation comprises an indel.
B25. The method of any one of embodiments B1-B19, wherein the genetic variation comprises an inversion.
B26. The method of any one of embodiments B1-B19, wherein the genetic variation comprises a monosomy.
B27. The method of any one of embodiments B1-B19, wherein the genetic variation comprises a mutation.
B28. The method of any one of embodiments B1-B19, wherein the genetic variation comprises a SNP.
B29. The method of any one of embodiments B1-B19, wherein the genetic variation comprises a translocation.
B30. The method of any one of embodiments B1-B19, wherein the genetic variation comprises a trisomy.
B31. The method of any one of embodiments B1-B30, wherein the fetal fraction is weighted based on the genetic variation.
B32. The method of any one of embodiments B1-B30, wherein the fetal fraction is weighted according to the first number and/or the second number.
B33. The method of any one of embodiments B1-B32, wherein determining the genetic variation comprises performing an additional test selected from the group consisting of sequencing-bysynthesis, digital polymerase chain reaction, real-time quantitative polymerase chain reaction, array capture, a nucleic acid sequence-based detection, massively parallel genomic sequencing, digital arrays, single molecule arrays, single molecule counting, oligo-ligation assays and single molecule sequencing.
B34. The method of any one of embodiments B1-B32, wherein determining the genetic variation comprises performing an additional test comprising a digital array.
B35. The method of any one of embodiments B1-B32, wherein determining the genetic variation comprises performing an additional test comprising a single molecule array.
B36. The method of any one of embodiments B1-B32, wherein determining the genetic variation comprises performing an additional test comprising single molecule counting.
B37. The method of any one of embodiments B33-B36, wherein the additional test is performed using the genetic sample or an additional genetic sample from the subject.
B38. The method of any one of embodiments B33-B37, wherein the additional test is performed only if the fraction subceeds a predetermined threshold.
B39. The method of any one of embodiments B33-B38, wherein the additional genetic sample is collected only if the fraction subceeds a predetermined threshold.
B40. The method of any one of embodiments B1-B39, wherein the genetic sample is selected from the group consisting of whole blood, blood plasma, blood serum, buffy coat, urine, vaginal fluid, fluid from a hydrocele (e.g., of the testis), vaginal flushing fluids, pleural fluid, ascitic fluid, cerebrospinal fluid, saliva, sweat, tears, sputum, bronchoalveolar lavage fluid, and discharge fluid from the nipple. B41. The method of any one of embodiments B1-B40, wherein the fraction of the second genetic material in the genetic sample is not determined by point estimation.
C1. A method of determining genetic variation in a genetic sample, said genetic sample containing a first genetic material and optionally having a second genetic material, the method comprising: determining, using a computer system, a first metric corresponding to a measure of certainty of a null hypothesis that the genetic variation is absent in the genetic sample, wherein the first metric is a continuous function of a fraction of the second genetic material, and conditioned on the absence of the genetic variation in a first data set; determining, using a computer system, a second metric corresponding to a measure of certainty of an alternative hypothesis that the genetic variation is present in the genetic sample, wherein the second metric is a continuous function of the fraction of the second genetic material, and conditioned on the presence of the genetic variation in the first data set; determining, using a computer system, a relative number based on the first metric and the second metric; and determining, using a computer system, if the genetic variation is present in the genetic sample by comparing the relative number to a reference number.
C2. The method of embodiment C1 , wherein the relative number corresponds to a difference or a ratio between the first metric and the second metric occurring at a predetermined fraction of the second genetic material.
C3. The method of embodiment C2, wherein the predetermined fraction is the same for the first metric and the second metric.
C4. The method of embodiment C2, wherein the predetermined fraction is different for the first metric and the second metric.
C5. The method of embodiment C1 , wherein the relative number corresponds to a difference or a ratio between the first metric and the second metric occurring at the fraction of the second genetic material that maximizes the first metric.
C6. The method of embodiment C1 , wherein the relative number corresponds to a difference or a ratio between the first metric and the second metric occurring at the fraction of the second genetic material that maximizes the second metric.
C7. The method of embodiment C1 , wherein the relative number corresponds to a difference or a ratio between the first metric and the second metric occurring at the fraction of the second genetic material that maximizes the ratio between the first metric and the second metric.
C8. The method of embodiment C1 , wherein the relative number corresponds to a difference or a ratio between (i) the first metric occurring at a fraction of the second genetic material that maximizes the first metric, and (ii) the second metric occurring at fraction of the second genetic material that maximizes the second metric.
C9. The method of any one of embodiments C1-C8, further comprising determining the fraction of the second genetic material at which the difference or the ratio between the first and second metric is maximized.
C10. The method of any one of embodiments C1-C9, wherein the first metric and the second metric are selected from the group consisting of probability and likelihood.
C11. The method of any one of embodiments C1-C10, wherein the first data set is obtained by: contacting a first probe set to the genetic sample, wherein the first probe set comprises a first labeling probe and a first tagging probe; hybridizing the first probe set to one or more first nucleic acid regions of interest in nucleotide molecules present in the genetic sample; labeling the first labeling probe with a first label; immobilizing the first probe set to a substrate at a density in which the first label is optically resolvable after immobilization; and detecting a number of the first labels corresponding to the first probe set immobilized to the substrate to detect the nucleic acid copy numbers of the one or more first nucleic acid regions of interest, thereby obtaining the first data set.
C12. The method of any one of embodiments C1-C11 , wherein the genetic variation is selected from the group consisting of an aneuploidy, a copy number change, a deletion, an indel, an inversion, a monosomy, a mutation, a SNP, a translocation, and a trisomy.
C13. The method of any one of embodiments C1-C12, wherein the Statistical Power in detecting the genetic variation is increased by at least 0.05, at least 0.1, at least 0.15, at least 0.2, at least 0.3, at least 0.4, at least 0.5, at least 0.6, at least 0.7, at least 0.8, at least 0.9, or at least 0.99 as compared to a method in which the fraction of the second genetic material is determined by point estimation.
C14. The method of embodiment C13, wherein the increase in the Statistical Power is a result of maximizing the continuous function of the fraction of the second genetic material, as compared to using a point estimate of the fraction of the second genetic material from the first data set.
C15. The method of any one of embodiments C1-C14, wherein the genetic sample is selected from the group consisting of whole blood, blood plasma, blood serum, buffy coat, urine, vaginal fluid, fluid from a hydrocele (e.g., of the testis), vaginal flushing fluids, pleural fluid, ascitic fluid, cerebrospinal fluid, saliva, sweat, tears, sputum, bronchoalveolar lavage fluid, and discharge fluid from the nipple.
C16. The method of any one of embodiments C1-C15, wherein the fraction of the second genetic material is not determined directly by point estimation from the first data set.
C17. The method of any one of embodiments C1-C16, wherein the first genetic material comprises maternal genetic material from the subject, and the second genetic material comprises fetal genetic material from a fetus.
C18. The method of any one of embodiments C1-C17, wherein the first genetic material comprises non-tumor derived genetic material, and the second genetic material comprises tumor-derived genetic material.
C19. The method of any one of embodiments C1-C18, wherein determining the genetic variation comprises performing an additional test selected from the group consisting of sequencing-bysynthesis, digital polymerase chain reaction, real-time quantitative polymerase chain reaction, array capture, a nucleic acid sequence-based detection, massively parallel genomic sequencing, digital arrays, single molecule arrays, single molecule counting, oligo-ligation assays and single molecule sequencing.
C20. The method of any one of embodiments C1-C19, wherein determining the genetic variation comprises performing an additional test comprising a digital array.
C21. The method of any one of embodiments C1-C20, wherein determining the genetic variation comprises performing an additional test comprising a single molecule array.
C22. The method of any one of embodiments C1-C21 , wherein determining the genetic variation comprises performing an additional test comprising single molecule counting.
C23. The method of any one of embodiments C1-C22, wherein the additional test is performed using the genetic sample or an additional genetic sample from the subject.
C24. The method of any one of embodiments C1-C23, wherein the additional test is performed only if the relative number subceeds the reference number.
C25. The method of embodiment C23 or C24, wherein the additional genetic sample is collected only if the relative number subceeds the reference number.
D1. A method of determining genetic variation in a genetic sample, said genetic sample containing a first genetic material and optionally having a second genetic material, the method comprising: determining, using a computer system, a first metric corresponding to a measure of certainty of a null hypothesis that the genetic variation is absent in the genetic sample, wherein the first metric is a continuous function of a fraction of the second genetic material and conditioned on the absence of the genetic variation in both a first data set and a second data set; determining, using a computer system, a second metric corresponding to a measure of certainty of an alternative hypothesis that the genetic variation is present in the genetic sample, wherein the second metric is a continuous function of the fraction of the second genetic material and conditioned on the presence of the genetic variation in at least one of the first data set and the second data set; determining, using a computer system, a relative number corresponding to a maximum difference or a ratio between the first metric and the second metric; and determining, using a computer system, if the genetic variation is present in the genetic sample by comparing the relative number to a reference number.
D2. The method of embodiment D1 , further comprising determining the fraction of the second genetic material at which the difference or the ratio between the first and second metric is maximized. D3. The method of embodiment D1 or D2, wherein the first metric and the second metric are selected from the group consisting of probability and likelihood.
D4. The method of any one of embodiments D1-D3, wherein the first metric and the second metric are determined using a first data set and a second data set obtained by: contacting a first probe set and a second probe set to the genetic sample, wherein the first probe set and the second probe set comprise a first labeling probe and a second labeling probe, respectively, and a first tagging probe and a second tagging probe, respectively; hybridizing the first probe set to one or more first nucleic acid regions of interest, and the second probe set to one or more second nucleic acid regions of interest, in nucleotide molecules present in the genetic sample; labeling the first labeling probe with a first label and the second labeling probe with a second label; immobilizing the first probe set and the second probe set to one or more substrates at a density in which the first label and the second label are optically resolvable after immobilization; and detecting a number of the first labels corresponding to the first probe set, and the second labels corresponding to the second probe set, immobilized to the substrate to detect (i) the nucleic
acid copy numbers of the one or more first nucleic acid regions of interest thereby obtaining the first data set, and (ii) the nucleic acid copy numbers of the one or more second nucleic acid regions of interest thereby obtaining the second data set.
D5. The method of any one of embodiments D1- D4, further comprising: contacting a third probe set and a fourth probe set to the genetic sample, wherein the third probe set and the fourth probe set comprise a third labeling probe and a fourth labeling probe, respectively, and a third tagging probe and a fourth tagging probe, respectively; hybridizing the third probe set to one or more third nucleic acid regions of interest, and the fourth probe set to one or more fourth nucleic acid regions of interest, in nucleotide molecules present in the genetic sample; labeling the third labeling probe with a third label and the fourth labeling probe with a fourth label; immobilizing the third probe set and the fourth probe set to one or more substrates at a density in which the third label and the fourth label are optically resolvable after immobilization; and detecting a number of the third labels corresponding to the third probe set, and the fourth labels corresponding to the fourth probe set, immobilized to the substrate to detect (i) the single nucleotide polymorphisms (SNPs) in the one or more third nucleic acid regions of interest thereby obtaining the third data set, and (ii) the SNPs in the one or more fourth nucleic acid regions of interest thereby obtaining the fourth data set.
D6. The method of any one of embodiments D1-D5, wherein the first probe set and the second probe set comprise non-polymorphic probes, and the third probe set and the fourth probe set comprise SNP probes.
D7. The method of any one of embodiments D1-D6, wherein the genetic variation is selected from the group consisting of an aneuploidy, a copy number change, a deletion, an indel, an inversion, a monosomy, a mutation, a SNP, a translocation, and a trisomy.
D8. The method of any one of embodiments D1-D7, wherein the Statistical Power in detecting the genetic variation is increased by at least 0.05, at least 0.1, at least 0.15, at least 0.2, at least 0.3, at least 0.4, at least 0.5, at least 0.6, at least 0.7, at least 0.8, at least 0.9, or at least 0.99 as compared to a method in which the fraction of the second genetic material is determined by point estimation.
D9. The method of embodiment D8, wherein the increase in the Statistical Power is a result of maximizing the continuous function of the fraction of the second genetic material, as compared to using a point estimate of the fraction of the second genetic material from the first data set.
D10. The method of any one of embodiments D1 -D9, wherein the genetic sample is selected from the group consisting of whole blood, blood plasma, blood serum, buffy coat, urine, vaginal fluid, fluid
from a hydrocele (e.g., of the testis), vaginal flushing fluids, pleural fluid, ascitic fluid, cerebrospinal fluid, saliva, sweat, tears, sputum, bronchoalveolar lavage fluid, and discharge fluid from the nipple.
D11. The method of any one of embodiments D1-D10, wherein the fraction of the second genetic material is not determined by point estimation.
D12. The method of any one of embodiments D1-D11 , wherein the first genetic material comprises maternal genetic material from the subject, and the second genetic material comprises fetal genetic material from a fetus.
D13. The method of any one of embodiments D1-D12, wherein the first genetic material comprises non-tumor derived genetic material, and the second genetic material comprises tumor-derived genetic material.
D14. The method of any one of embodiments D1-D13, wherein determining the genetic variation comprises performing an additional test selected from the group consisting of sequencing-bysynthesis, digital polymerase chain reaction, real-time quantitative polymerase chain reaction, array capture, a nucleic acid sequence-based detection, massively parallel genomic sequencing, digital arrays, single molecule arrays, single molecule counting, oligo-ligation assays and single molecule sequencing.
D15. The method of any one of embodiments D1-D14, wherein determining the genetic variation comprises performing an additional test comprising a digital array.
D16. The method of any one of embodiments D1-D15, wherein determining the genetic variation comprises performing an additional test comprising a single molecule array.
D17. The method of any one of embodiments D1- D16, wherein determining the genetic variation comprises performing an additional test comprising single molecule counting.
D18. The method of any one of embodiments D1- D17, wherein the additional test is performed using the genetic sample or an additional genetic sample from the subject.
D19. The method of any one of embodiments D1- D18, wherein the additional test is performed only if the relative number subceeds the reference number.
D20. The method of embodiment D1 or D19, wherein the additional genetic sample is collected only if the relative number subceeds the reference number.
E1. A method for typing single nucleotide polymorphisms (SNPs) and mutations in nucleic acids, comprising the steps of: a) providing a repertoire of probes complementary to one or more nucleic acids present in a sample, which nucleic acids may possess one or more polymorphisms; b) arraying said repertoire such that each probe in the repertoire is resolvable individually;
c) exposing the sample to the repertoire and allowing nucleic acids present in the sample to hybridize to the probes at a desired stringency and optionally be processed by enzymes such that hybridized/processed nucleic acid/probe pairs are detectable; d) eluting the unhybridized nucleic acids from the repertoire and detecting individual hybridized/processed nucleic acid/probe pairs; e) analysing the signal derived from step (d) and computing the confidence in each detection event to generate a PASS table of high-confidence results; and f) displaying results from the PASS table to assign base calls and type polymorphisms present in the nucleic acid sample.
E2. A method according to embodiment E1 , wherein step (e) involves analysing the signal from step (d) and computing in each detection event a FAIL table of low confidence results and using this table to inform primer and assay design.
E3. A method according to embodiment E1 or E2, wherein the process is iterated for sequencing by synthesis.
E4. A method according to any one of embodiments E1 to E3, wherein confidence in each detection event is computed in accordance with the methods described herein.
E5. A method according to any one of embodiments E1 to E4, wherein detection events are generated by labelling the sample nucleic acids and/or the probe molecules, and imaging said labels on the array using a detector.
E6. A method according to any one of embodiments E1 to E5, wherein the SNPs that are probed are loci tags for a haplotype block or a region of linkage disequilibrium.
F1. A non-transitory computer readable medium configured to carry out the method of any one of embodiments A1 to E6.
G1. The method of any one of embodiments A1 to E6, wherein the method is partially or completely a computer-implemented process.
H1. A non-transitory computer-readable storage medium with an executable program stored thereon, which program is configured to instruct a microprocessor to:
(A) obtain counts or an amount of a pluraltiy of non-polymorphic reference loci in a genetic sample, obtain counts or an amount of a pluraltiy of non-polymorphic loci in a nucleic acid region of interest in the genetic sample, and obtain counts or an amount of a plurality of informative polymorphic alleles located at a plurality of reference loci in the genetic sample, wherein the genetic sample comprising genetic material derived from a first genome and genetic material derived from a second genome;
(B) determine a first metric representative of a joint probability of a first copy number hypothesis for the nucleic acid region of interest in the first genome by a process comprising: determining a first probability and a second probability of the first copy number hypothesis wherein, each of the first probability and the second probability of the first copy number hypothesis is a function of (i) the counts or amount of the plurality of non-polymorphic reference loci in the genetic sample, and (ii) the counts or amount of the plurality of non-polymorphic loci in the nucleic acid region of interest in the genetic sample, the first probability of the first copy number hypothesis is further a function of a first likelihood distribution (f1) of a genetic fraction of genetic material derived from the first genome in the genetic sample relative to an amount of genetic material derived from the second genome in the genetic sample, wherein f1 is determined according to (i) and (ii), and the second probability of the first copy number hypothesis is further a function of a second likelihood distribution (f2) of the genetic fraction, wherein f2 is determined according to the counts or amount of the plurality of informative polymorphic alleles located at the plurality of reference loci in the genetic sample; and combining the first and the second probability of the first copy number hypothesis, thereby providing the first metric;
(C) determine a second metric representative of a joint probability of a second copy number hypothesis for the nucleic acid region of interest in the first genome by a process comprising: determining a first probability and a second probability of the second copy number hypothesis wherein, each of the first probability and a second probability of the second copy number hypothesis is a function of (i) and (ii), the first probability of the second copy number hypothesis is further a function of f1 , the second probability of the second copy number hypothesis is further a function of f2; and combining the first and the second probability of the second copy number hypothesis, thereby providing the second metric; and
(D) determine the copy number of the nucleic acid region of interest in the first genome according to a comparison of the first metric and the second metric.
H2. The non-transitory computer-readable storage medium of embodiment H1 , further configured to carry out any one of the embodiments of A1 to E6.
[00302] Citation of patents, patent applications, publications and documents herein is not an admission that any of the foregoing is prior art, nor does it constitute any admission as to the contents or date of these publications or documents.
[00303] The technology illustratively described herein suitably may be practiced in the absence of any element(s) not specifically disclosed herein. Thus, for example, in each instance herein any of the terms “comprising,” “consisting essentially of,” and “consisting of” may be replaced with either of the other two terms. The terms and expressions which have been employed are used as terms of description and not of limitation, and use of such terms and expressions do not exclude any equivalents of the features shown and described or portions thereof, and various modifications are possible within the scope of the technology claimed.
[00304] The term “and/or” used herein is defined to indicate any combination of the components. Moreover, the singular forms “a,” “an,” and “the” may further include plural referents unless the context clearly dictates otherwise. Thus, for example, reference to “a nucleotide region” refers to one, more than one, or mixtures of such regions, and reference to “an assay” may include reference to equivalent steps and methods known to those skilled in the art, and so forth.
[00305] The term “about” refers to a range of values that are similar to the stated reference value, which range of values is within 10%, 9%, 8%, 7%, 6%, 5%, 4%, 3%, 2%, or 1% percent of the stated reference value.
[00306] When a listing of values is described herein (e.g., about 50%, 60%, 70%, 80%, 85% or 86%) the listing includes all intermediate and fractional values thereof (e.g., 54%, 85.4%).
[00307] The term, "substantially" as used herein means, depending on the context used, that a small degree of error or difference in the referenced noun, item, characteristic, time, metric, method or description may exist (e.g., within a range of plus or minus 0 to 5%, 0 to 3%, or 0 to 1%).
[00308] The headings and subheading used herein are not limiting and do not restrict the content or subject matter under those headings or subheadings in any way.
EXAMPLES
Example 1 - Using Fetal Fraction Estimation as a Trigger for Further Analysis
Fetal Fraction Exceeds Predetermined Threshold
[00309] Arrays for single molecule detection of cell-free nucleic acid molecules are prepared according to the methods provided in the present disclosure, including Examples 2 and 3 below. Whole blood obtained from a pregnant subject is analyzed using a single molecule array as described herein to determine fetal fraction. Data is collected using a single molecule array, and the fetal fraction is determined. Briefly, the fetal fraction is determined by contacting first and second probe sets to the whole blood sample, wherein the first probe set comprises a first labeling probe and a first tagging probe, and wherein the second probe set comprises a second labeling probe and a second tagging probe; hybridizing the first and second probe sets to first and second nucleic acid regions informative of the fetal fraction in nucleotide molecules present in the whole blood sample, respectively; labeling the first and second labeling probes with first and second labels, respectively; immobilizing the first and second probe sets to a substrate at a density in which the first and second labels of the first and second probe sets are optically resolvable after immobilization; and detecting: (i) a first number of the first label corresponding to a first subset of the first probe set immobilized to the substrate, and (ii) a second number of the second label corresponding to a second subset of the second probe set immobilized to the substrate to detect the nucleic acid copy numbers, wherein the probes of the first subset and the second subset hybridize to the first and the second nucleic acid regions, respectively, that contain one or more biomarkers informative of the fetal fraction in the whole blood sample. In some embodiments, the fetal fraction is determined to be 5%, and to exceed a predetermined threshold of 2%; the fetal fraction is determined to be sufficient, and the cell-free nucleic acid molecules in the sample are sequenced to determine the presence of a genetic variation associated with Down Syndrome (e.g., Trisomy 21) in the fetus.
Fetal Fraction Does Not Exceed Predetermined Threshold [00310] Arrays for single molecule detection of cell-free nucleic acid molecules are prepared according to the methods provided in the present disclosure, including Examples 3 through 5 below. Whole blood obtained from a pregnant subject is analyzed using a single molecule array as described herein to determine fetal fraction. Data is collected using a single molecule array, and the fetal fraction is determined. Briefly, the fetal fraction is determined by contacting first and second probe sets to the whole blood sample, wherein the first probe set comprises a first labeling probe and a first tagging probe, and wherein the second probe set comprises a second labeling probe and a second tagging probe; hybridizing the first and second probe sets to first and second nucleic acid regions informative of the fetal fraction in nucleotide molecules present in the whole blood sample, respectively; labeling the first and second labeling probes with first and second labels, respectively; immobilizing the first and second probe sets to a substrate at a density in which the first and second labels of the first and second probe sets are optically resolvable after immobilization; and detecting: (i) a first number of the
first label corresponding to a first subset of the first probe set immobilized to the substrate, and (ii) a second number of the second label corresponding to a second subset of the second probe set immobilized to the substrate to detect the nucleic acid copy numbers, wherein the probes of the first subset and the second subset hybridize to the first and the second nucleic acid regions, respectively, that contain one or more biomarkers informative of the fetal fraction in the whole blood sample. In some embodiments, the fetal fraction is determined to be 0.8%, and does not exceed a predetermined threshold of 1 %; the fetal fraction is determined to be too low to proceed with the test, and a new sample is obtained from the subject for repeat analysis.
Example 2 - Sample Preparation Using a High Molecular Weight Cut
[00311] Cell-free DNA was extracted from a plasma sample using the cfPure Cell-Free DNA Extraction Kit (BioChain; Newark, CA; Cat. No. K5011610, K5011625) according to the User's Manual and Instructions (Doc. No. F-753-3UMRevC), which is incorporated by reference herein in its entirety. Briefly, plasma separated from whole blood samples collected from pregnant women at Planned Parenthood clinics by Advanced Bioscience Resources was treated with Proteinase K and lysed using cfPure Lysis/Binding Buffer and cfPure Magnetic Bead Solution. Following a first wash with cfPure Wash Buffer, and a second wash with 80% ethanol (EtOH), cell-free DNA was eluted from the sample by adding cfPure Elution Buffer to the sample, vortexing the sample, centrifuging the sample, and transferring the centrifuged sample to a magnetic rack. The magnetic beads were re-suspended, and a high molecular weight cut was performed accordingly to the following protocol.
[00312] The volume of each sample in a 96-well plate was brought to 120 μL by addition of
LTE buffer. 60 μL of AMPure XP beads (Beckman Coulter; Indianapolis, IN; https://www.beckman.com/landing/ppc/genomics/cleanup-and-size-selection) were added to each well, and mixed by pipetting up and down 20 times. Samples were subsequently incubated on a bench for 10 minutes. The 96-well plate was placed on a magnet and magnetized until clear. 2 aliquots of 90 μL each of supernatant was transferred into duplicate wells of a new plate. Next, 180 μL AMPure XP beads were added to each of the duplicate wells, and mixed by pipetting up and down 20 times. Samples were subsequently incubated on a bench for 10 minutes. The 96-well plate was placed on a magnet and magnetized until clear, and the supernatant was discarded. The samples were washed twice with 200 μL fresh 75% EtOH. All traces of EtOH were removed using P20, and the beads were allowed to dry for 4 minutes. cfDNA was eluted by adding 13 μL of LTE buffer into one duplicate well per sample, and resuspending the beads. The resuspended beads were added to the duplicate well and resuspended. The sample were spun to pellet the beads, and the 96-well plate was
placed on a magnet and magnetized until clear. The eluate was transferred into a new plate, and analysed by DNA quantitation and Bioanalyzer analysis.
[00313] Table 4 shows data from Bioanalyzer analysis for four replicates of the HMW cut procedure on a sample (HMW Cut, Rep 1, Rep 2, Rep 3, and Rep 4) and data from Bioanalyzer analysis for the same sample without the HMW cut (Uncut, Control CTL). The results include the peak cell-free DNA concentration (cfDNA Peak, Cone. [pg/μI]), the peak high molecular weight DNA concentration (HMW DNA Peak, Cone. [pg/μI]), and the ratio of the peak cell-free DNA concentration to the peak high molecular weight DNA concentration (Ratio, cfDNA/HMW DNA).
Table 4: Results of High Molecule Weight Cut Size Enrichment

Example 3
[00314] The following protocol describes the processing of up to 24 cell-free DNA samples through hybridization-ligation of one or more loci-specific probe sets (e.g., a probe set comprising a labeling probe and a tagging probe), purification, amplification, microarray preparation, microarray hybridization, microarray washing and counting. Additional embodiments and examples of hybridization-ligation of one or more loci-specific probe sets (e.g., a probe set comprising a labeling probe and a tagging probe), amplification of ligated probe sets, microarray preparation, microarray hybridization, microarray washing and counting are disclosed in US Pat. no. 9,212,394 and International Pat. Application Pub. No. WO/2016/134191. Additional examples of probe sets that can be used to identify non-polymorphic reference loci, non-polymorphic loci in a nucleic acid region of interest and polymorphic loci (e.g., alleles of SNPs) as described herein are also disclosed in US Pat. no. 9,212,394 and International Pat. Application Pub. No. WO/2016/134191.
[00315] The following materials were prepared or obtained: Cell-free DNA (cfDNA) in a volume of 20 μL water; Probe Mix: mixture of all Tagging and Labeling probe oligonucleotides at a concentration of 2 nM each; Tag Ligase (40 U/μL); Magnetic Beads: MyOne Streptavidin C1 Dynabeads; Bead Binding and Washing Buffer, 1X and 2X concentrations; Forward amplification
primer, 5’ phosphate modified; Reverse amplification primer, labeled; AmpliTaq Gold Enzyme (5 U/μL); dNTP Mix; Lambda Exonuclease (5 U/μL); Hybridization Buffer, 1.25X; Hybridization control oligonucleotides; Microarray Wash Buffer A; Microarray Wash Buffer B; Microarray Wash Buffer C. [00316] Hybridization-ligation Reaction: The cfDNA samples (20 μL) were added to wells A3-H3 of a 96-well reaction plate. The following reagents were added to each cfDNA sample for a total reaction volume of 50 μL, and mixed by pipetting up and down 5-8 times.

[00317] The plate was placed in a thermal cycler and ligate using the following cycling profile:
(i) 95 °C for 5 minutes; (ii) 95 °C for 30 seconds; (iii) 45 °C for 25 minutes; (iv) Repeat steps b to c 4 times; and (v) 4 °C hold.
Hybridization-ligation Product Purification:
[00318] Wash Dynabeads: a vial of Dynabeads was vortexed at highest setting for 30 seconds. 260 μL beads were transferred to a 1.5 mL tube. 900 μL of 2X Bead Binding and Washing Buffer and mix beads were mixed by pipetting up and down 5-8 times. The tube was placed on a magnetic stand for 1 min, and the supernatant was discarded. The tube from the magnetic stand was removed and resuspended the washed magnetic beads in 900 μL of 2X Bead Binding and Washing Buffer by pipetting up and down 5-8 times. The tube was placed on the magnetic stand for 1 min and discard the supernatant. The tube was removed from the magnetic stand and add 1 ,230 μL of 2X Bead Binding and Washing Buffer. The beads were resuspended by pipetting up and down 5-8 times. [00319] Immobilize HL Products: 50 μL of washed beads was transferred to each hybridization- ligation reaction product in the 96-well reaction plate and mix by pipetting up and down 8 times, was incubated for 15 min at room temperature, mixed on a plate magnet twice during the incubation time. The beads were separated with on a plate magnet for 3 min and then remove and discard the supernatant. The plate was removed from the plate magnet, 200 μL 1X Bead Binding and Washing Buffer were added, and the beads were resuspended by pipetting up and down 5-8 times. The plate was placed on the plate magnet for 1 min, and the supernatant was discarded. The plate was removed from the plate magnet, 180 μL 1X SSC was added, and the beads were resuspended by
pipetting up and down 5-8 times. The plate was placed on the plate magnet for 1 min, and the supernatant was discarded.
[00320] Purify Hyb-Ligation Products: 50 μL of freshly prepared 0.15 M NaOH was added to each well and, the beads were resuspended by pipetting up and down 5-8 times, and incubated at room temperature for 10 minutes. The plate was placed on the plate magnet for 2 minutes and then was removed, and the supernatant was discarded. The plate was removed from the plate magnet,
200 μL of freshly prepared 0.1 M NaOH was added, and the beads were resuspended by pipetting up and down 5-8 times. The plate was placed on the plate magnet for 1 min, and the supernatant was discarded. The plate was removed from the plate magnet, and 180 μL 0.1 M NaOH was added, and the beads were resuspended by pipetting up and down 5-8 times. The plate was placed on the plate magnet for 1 min, and the supernatant was discarded. The plate was removed from the plate magnet, 200 μL of 1X Binding and Wash Buffer were added, and the beads were resuspended by pipetting up and down 5-8 times. Place the plate on the plate magnet for 1 min and discard the supernatant. Remove the plate from the plate magnet, add 180 μL TE, and the beads were resuspended by pipetting up and down 5-8 times. The plate was placed on the plate magnet for 1 min, and the supernatant was discarded. 20 μL water was added to each well and the beads were resuspended by pipetting up and down 5-8 times. The plate was sealed and store at 4 °C until used in subsequent steps.
[00321] Amplification: The following reagents were added to each hybridization-ligation reaction product in the 96-well reaction plate for a total reaction volume of 50 μL.

The plate was placed in a thermal cycler, and the probes were ligated using the following cycling profile: (i) 95 °C for 5 minutes; (ii) 95 °C for 30 seconds; (iii) 45 °C for 25 minutes; (iv) Repeat steps b to c 4 times; and (v) 4 °C hold.
[00322] Hybridization-ligation Product Purification: the reagents were mixed by pipetting up and down 5-8 times. The plate was placed in a thermal cycler, and the probes were amplified using the following cycling profile: (i) 95 °C for 5 minutes; (ii) 95 °C for 30 seconds; (iii) 54 °C for 30 seconds; (iv)
72 °C for 60 seconds, (v) Repeat steps b to d 29 times; (vi) 72 °C for 5 minutes; (vii) Repeat steps b to c 4 times; and (v) 4 °C hold.
[00323] Microarray Target Preparation (single strand digestion): the following reagents were added to each amplified reaction product in the 96-well reaction plate for a total reaction volume of 60 μL

[00324] The reagents were mixed by pipetting up and down 5-8 times. The plate was placed in a thermal cycler, and the probes were digested using the following cycling profile: (i) 37 °C for 60 minutes; (ii) 80 °C for 30 minutes; (iii) 4 °C hold. The plate was placed in Speed-vac and dry down samples using medium heat setting for about 60 minutes or until all liquid has evaporated. Samples were stored at 4 °C in the dark until used in subsequent steps.
[00325] Microarray hybridization: the following reagents were added to each dried Microarray Target in the 96-well reaction plate for a total reaction volume of 20 μL.

[00326] The reagents were mixed by pipetting up and down 10-20 times to be resuspended and were spun briefly to bring contents to the bottoms of the plate wells. The plate was placed in a thermal cycler, and the probes were denatured using the following cycling profile: (i) 70 °C for 3 minutes; (ii) 42 °C hold. The barcode of the microarray to be used was recorded for each sample in the Tracking Sheet. A hybridization chamber containing a Lifter Slip for each microarray to be processed is prepared. For each sample, 15 μL of Microarray Target was added to the center of a Lifter Slip in a hybridization chamber, and the appropriate microarray was immediately placed onto the target fluid by placing the top edge down onto the lifter slip and slowly letting it fall down flat. The hybridization chambers were closed and incubated them at 42 °C for 60 minutes. The hybridization chambers were opened, and each microarray was removed from the Lifter Slips and placed into a rack immersed in Microarray Wash Buffer A. Once all the microarrays were in the rack, the rack was
stirred at 650 rpm for 5 minutes. The rack of microarrays was removed from Microarray Wash Buffer A, excess liquid on a clean room wipe was tapped off, and the rack were quickly placed into Microarray Wash Buffer B. The rack was stirred at 650 rpm for 5 minutes. The rack of microarrays was removed from Microarray Wash Buffer B, excess liquid was tapped off on a clean room wipe, and the rack was quickly placed into Microarray Wash Buffer C. The rack was stirred at 650 rpm for 5 minutes. Immediately upon completion of the 5 minute wash in Microarray Wash Buffer C, the rack of microarrays was slowly removed from the buffer. This took 5-10 seconds to maximize the sheeting of the wash buffer from the cover slip surface. Excess liquid was tapped off on a clean room wipe. A vacuum aspirator was used to remove any remaining buffer droplets present on either surface of each microarray. The microarrays were stored in a slide rack under nitrogen and in the dark until the microarrays were analyzed.
Example 4
[00327] Blood samples from 368 pregnant females were obtained. Cell-free DNA (cfDNA) from the samples was extracted and enriched for fetal fraction by size selection, for example, fragments of about 80-180 base pairs. The sample were categorized according to the fetuses carried by the pregnant females as shown below:
• 176 female euploid
• 176 male euploid
• 10 male trisomy 21
• 6 female trisomy 21
[00328] Two ng of DNA from each sample was used in a probe set hybridization/ligation assay as described herein and in Example 3 to detect specific regions of chromosomes 13, 18, 21, X and Y in addition to 95 unique SNP loci. Probe selection methods are briefly described below. The ligated probe sets were then amplified by PCR. A portion of the PCR products were converted into lllumina- compatible sequencing libraries by adding lllumina adapters in another round of PCR. The NGS libraries were sequenced in several runs of Hi-seq 2500 with 10% Phi X spike-in, generating over 2 million paired-end reads (2x81) per sample.
[00329] A representative subset of the samples are listed in Table 5 and were used to demonstrate the workflow. The data were collected in two separate representative experiments: NGS250 and NGS259. For validation, fetal sex and autosomal trisomy status were independently determined using whole genome sequencing.
Table 5: Three euploid female fetuses (a-c), three euploid male fetuses (d-f), one T21 female fetus (g), and two T21 male fetuses (h-i).

Table 6 - Representative SNP loci tags used in this example.

Table 6 shows SNP IDs, SNP Loci Tag IDs, genomic locations, and population minor allele frequencies (MAF) for the selected SNP loci. Genomic coordinates correspond to GRCh38. MAF values were based on the 1,000 Genomes Project data.
Table 7A

Tab e 7A shows SNP probe characteristics for the two representative SNP loci of Table 6, including loci tag ID, targeted allele (alternative or reference), loci tag type (SNP, as opposed to CNV, SEX-X, SEX-XY, or SEX-Y), left and right homology region sequences. *Primer binding sites and/or affinity tag portion of probes not shown.
Table 7B - Affinity Tag Sequences of Tagging Probes


[00330] Table 8 shows the characteristics of a small representative number of CNV probe sets used to target the non-polymorphic autosomal loci on the reference chromosomes and chromosome of interest. These probes were used to quantify the abundance of the loci shown. Table 8 includes genomic locations where the CNV probes hybridize. Multiple loci were targeted on each chromosome. The following four affinity tags were used in the current example: T7321 (48 probe sets targeting Chr13 and 25 probe sets targeting Chr21), T5509 (48 probe sets targeting Chr21 and 25 probe sets targeting Chr13), T6793 (47 probe sets targeting Chr18 and 23 probe sets targeting Chr21), and T3223 (50 probe sets targeting Chr21 and 25 probe sets targeting Chr18). In this example, Chr13 and Chr18 were reference chromosomes and Chr21 was the nucleic acid region of interest.
Table 8: CNV probe characteristics. Five representative probes shown per affinity tag.

Table 9: Sequences of the homology regions of the CNV probes listed in Table 8.


*Primer binding sites and/or affinity tag portion of probes not shown.
[00331] After sequencing, sequence reads were aligned to the full set of CNV and SNP probe set panels. Reads that were perfect or near perfect matches were included in the validation analysis. [00332] Table 10 shows SNP counts classified as most likely maternal or fetal origin based on the observed probe count and using the procedure outlined described in the Analysis Workflow section.
Table 10
 Table 10 shows SNP Allele counts and most likely maternal and fetal genotypes at selected SNP loci for the selected samples. NR(k) = reference allele count, NA(k) = alternate allele count, M(k) = maternal genotype, and F(k) = fetal genotype at locus k.
[00333] Normalization ratio per loci tag (e.g., Chr21 :Reference Chromosome) was calculated for the reads mapping to the CNV probes for each sample. Loci tag ratios were normalized by multiplying each raw loci tag ratio per sample with normalization coefficients to reduce bias from the observed raw loci tag ratios. Table 11 shows results of such normalization.

Results
[00334] Log Maximum Likelihood estimation was used to determine the probability of a specific genotype and karyotype combination for all samples. Results for T21 and Euploid pregnancies are described below.
[00335] Likelihood distribution profiles as a function of fetal fraction were determined for each SNP probe set. Fig. 17 shows a likelihood distribution profile for the genotype combinations RA.aa and RA.rr in the T21 male pregnancy sample i, at the locus tagged with tag T4239. Similarly, Fig. 18 shows likelihood distribution profiles for the same genotype in the same sample at a different locus (tagged with tag T4424).
[00336] Likelihood distribution profiles for all possible genotypes at each locus for every sample were determined in an iterative manner. Fig. 19 shows an example of the combination of all possible genotypes for a given locus as identified by the Tag associated with it in T21 pregnancy sample /'.
[00337] The overall SNP likelihood for T21 pregnancy sample / was obtained by combining likelihood distribution profiles derived from data measured on both SNP loci T4239 and T4424 as shown in Fig. 20.
[00338] Next, CNV tag ratio likelihood profiles corresponding to a euploid fetus (the null hypothesis) and to a T21 fetus (the alternate hypothesis), derived from the data were determined for the T21 male pregnancy / (Fig. 21). The CNV tag ratio likelihood profiles shown in Fig. 21 were combined with the overall SNP likelihood profiles shown in Figure 20. The sample was correctly classified as T21 as shown in Fig. 22.
Euploid pregnancy
[00339] The euploid samples were analyzed similarly as described above. Figs. 23A-23B show the likelihood profile for the specific genotype combinations in the euploid pregnancy sample c at the locus tagged with tag T4239 (Fig. 23A) and T4424 (Fig. 23B).
[00340] Figs. 24A and 24B show the combined SNP likelihood distributions for the euploid sample c, obtained by combining likelihood profiles derived from data measured on both SNP loci T4239 (Fig. 24A) and T4424 (Fig. 24B) for all genotypes. Fig. 25 shows the combined SNP likelihood distributions for the euploid sample c, obtained by combining likelihood profiles derived from all SNP loci.
[00341] For the CNV classification, an approach like the one used for the T21 pregnancy was used. However, the data were derived from the measurement on the euploid female pregnancy c (Fig. 26 and Fig. 27). Input values comprised the four experimentally measured and normalized tag ratios (Table 11 ) obtained for the euploid female sample c. The maximum joint log-likelihood value for the null hypothesis (Euploid, gray data point) exceeded the maximum joint log-likelihood value corresponding to the alternative hypothesis (T21, gray data point). The sample c was therefore correctly classified as a euploid pregnancy (Fig. 27).
[00342] In all nine samples, autosomal trisomy status as determined using the joint optimization of SNP allele likelihoods and CNV tag ratio likelihoods was concordant with the trisomy status independently determined using whole genome sequencing on the same set of samples. Six samples (three female and three male pregnancies) were called euploid both using the joint optimization of SNP and CNV tag measurements and using whole genome sequencing, and three samples (one female and two male pregnancies) were called T21 by both methods. The concordance with whole genome sequencing was therefore 100%.
Example Workflows
SNP Steps
[00343] Inputs: SNP probe counts, population MAF, SNP correction coefficients. Procedure starts by initializing SNP likelihood to 0. Next: SNP loop over all input loci:
SNP Step 1 - extract NR, NA from inputs, evaluate Ntotal = NR + NA.
SNP Step 2 - Skip this locus if Ntotai is too low (here below 20).
SNP Step 3 - Applying correction (optional, not used here).
SNP Step 4 - evaluate MAF (population minor allele frequency for the current locus).
Next: loop over all possible genotype scenarios (RR.rr, RR.ra, RA.rr, RA.ra, RA.aa, AA.ra, AA.aa).
SNP Step 5 - print current genotypeScenario.
SNP Step 6 - Evaluate alternate allele frequency from the trial fetal fraction values by applying function that is appropriate for the current genotype scenario.
SNP Step 7 - List alternate allele frequencies evaluated in SNP Step 6.
SNP Step 8 - Select the population prior expression appropriate for the current genotype scenario.
SNP Step 9 - List likelihood values ( b distribution with shape parameters NA + 1 and NR + 1). SNP Step 10 - Print the contribution, which is composed of the population prior from SNP step 8 and the likelihood from SNP step 9.
SNP Step 11 - Add current genotype contribution to locusLikelihood (for current locus).
SNP Step 12 - Add current locus contribution to total logLikelihood.
SNP Step 13 - Account for prior distribution of fetal fractions observed in the population.
SNP Step 14 - List final logLikelihood values for all trial fetal fractions.
Sample Classification
[00344] Evaluate SNP likelihood, as detailed in the previous section (SNP Steps).
CNV Step 1 : Loop over hypotheses. For this example, only two hypotheses are tested: Euploid and T21. In a real workflow, multiple hypotheses can be tested, including Male/Female fetal sex and Euploid/T13/T18/T21.
CNV Looping over hypotheses Step 2 - list current hypothesis.
Next: Evaluate tag ratio log likelihood over all copy number tags. This part of the workflow is detailed in the next section (Collective Copy Number Tag Ratio Log Likelihood Evaluation Steps).
CNV Looping over hypotheses Step 3 - list tagRatioLogLikelihood values from the previous step.
CNV Looping over hypotheses Step 4 (JOINT STEP!) - evaluate total likelihood by combining SNP likelihood and CN likelihood for the current hypothesis.
CNV Looping over hypotheses Step 5 - identify the trial fetal fraction index at which total likelihood for the currently tested hypothesis reaches its maximum.
CNV Looping over hypotheses Step 6 - list the maximal value of joint logLikelihood for the currently tested hypothesis.
CNV Looping over hypotheses Step 7 - list fetal fraction value at which total likelihood for the currently tested hypothesis reaches its maximum.
CNV Step 8 - identify bestlndex (the index of the hypothesis with highest likelihood)
CNV Step 9 - list best hypothesis.
CNV Step 10 - list second best hypothesis.
[00345] Collective Copy Number Tag Ratio Log Likelihood Evaluation Steps
TagRatio Step 1 - Loop over trial FF values.
TagRatio Step 2 - Looping over all copy number tags.
TagRatio Step 3 - Get denominator count.
TagRatio Step 4 - Get residual error.
Next: call function getLogLikelihoodSingleTag(), which takes the observed tag ratio, the denominator count, and the residual error and evaluates contribution from the current tag. This step is detailed in the next section (Single Copy Number Tag Ratio Log Likelihood Evaluation Steps).
TagRatio Step 5 - list the contribution from the current copy number tag.
TagRatio Step 6 - add the contribution from the current tag to the overall copy number log likelihood.
Single Copy Number Tag Ratio Log Likelihood Evaluation Steps.
[00346] List inputs: normalized tag ratio values, denominator count, residual error, tag ID, currently tested hypothesis, and flag that turns on/off the use of population prior for various conditions (T21. T18, T13, ...).
SingleTag Step 1 - list polarity assignments p1 , p2 for the chromosomes paired by the current tag.
SingleTag Step 2 - gathering functions to be used to evaluate mathematical expectation μ and standard deviation w. The actual forms of the functions are listed in the attached output. For example, μ where both p1 and p2 chromosomes are diploid is evaluated as μ(f) = 1 , a trisomy p2 gives rise to μ(f) = 1 + f /2, a monosomy p2 (with diploid p1) results in μ(f) = 1 - f /2. Expressions for width are also listed in the output. The expressions relevant for this example include euploid width
 trisomy width is
 and reciprocal trisomy width is
 where ND is the denominator count (p1 depth in the case of CNV and SEX-X tags). Additional expressions are used in actual data that include Y tags and possible monosomy (as in ChrX).
SingleTag Step 3 - evaluate the expectation μ for the current hypothesis and the current trial fetal fraction value.
SingleTag Step 4 - evaluate the width w for the current hypothesis and the current trial fetal fraction value.
SingleTag Step 5 - if the input flag for population prior is turned on, take the prior for the current hypothesis into account. In this example, population prior for T21 was turned off.
Final step: evaluate truncated Gaussian using μ from SingleTag Step 3 and width wfrom SingleTag Step 4. This value is listed in agRatio Step 5. The truncated Gaussian is the Gaussian centered at mu, having width width, rescaled by dividing with 1 - cumulative function from negative infinity to zero (to account for the requirement that tag ratios are non-negative).
Claims
1. A method of determining a copy number of a nucleic acid region of interest in a genome of interest, the method comprising:
(A) providing a genetic sample comprising genetic material derived from a first genome and genetic material derived from a second genome;
(B) determining a first metric representative of a joint probability of a first copy number hypothesis for a nucleic acid region of interest in the first genome by a process comprising: determining a first probability and a second probability of the first copy number hypothesis wherein, each of the first probability and the second probability of the first copy number hypothesis is a function of (i) an amount of a plurality of non-polymorphic reference loci in the genetic sample, and (ii) an amount of a plurality of non-polymorphic loci in the nucleic acid region of interest in the genetic sample, the first probability of the first copy number hypothesis is further a function of a first likelihood distribution (f1) of a genetic fraction of genetic material derived from the first genome in the genetic sample relative to an amount of genetic material derived from the second genome in the genetic sample, wherein f1 is determined according to (i) and (ii), and the second probability of the first copy number hypothesis is further a function of a second likelihood distribution (f2) of the genetic fraction, wherein f2 is determined according to a plurality of informative polymorphic alleles located at a plurality of reference loci in the genetic sample; and combining the first and the second probability of the first copy number hypothesis, thereby providing the first metric;
(C) determining a second metric representative of a joint probability of a second copy number hypothesis for the nucleic acid region of interest in the first genome by a process comprising: determining a first probability and a second probability of the second copy number hypothesis wherein, each of the first probability and a second probability of the second copy number hypothesis is a function of (i) and (ii), the first probability of the second copy number hypothesis is further a function of f1 , the second probability of the second copy number hypothesis is further a function of f2; and
combining the first and the second probability of the second copy number hypothesis, thereby providing the second metric; and
(D) determining the copy number of the nucleic acid region of interest in the first genome according to a comparison of the first metric and the second metric.
2. The method of claim 1 , wherein the genetic sample is obtained directly or indirectly from a subject.
3. The method of claim 1 or 2, wherein the subject is a human.
4. The method of claim 1 or 2, wherein the first genome is a genome of a fetus and the second genome is a genome of a mother of the fetus.
5. The method of any one of claims 1 to 4, wherein the polymorphic alleles comprise single nucleotide polymorphisms (SNPs).
6. The method of any one of claims 1 to 5, wherein the reference loci each comprise a locus or region of a chromosome having a same number of copies in the first genome and the second genome.
7. The method of any one of claims 1 to 6, wherein the non-polymorphic reference loci comprise a region or locus of an autosome being diploid in the first genome and diploid in the second genome.
8. The method of any one of claims 1 to 7, wherein the first copy number hypothesis is a hypothesis that the nucleic acid region of interest is an autosome being diploid in the first genome and the second copy number hypothesis is a hypothesis that the nucleic acid region of interest is aneuploid in the first genome.
9. The method of any one of claims 1 to 8, wherein the first metric and/or the second metric comprises a likelihood or likelihood distribution.
10. The method of any one of claims 1 to 9, wherein the first or second probability of the first copy number hypothesis and/or the first or second probability of the second copy number hypothesis comprise a likelihood distribution.
11. The method of any one of claims 1 to 10, wherein the comparison comprises determining a ratio of the first metric to the second metric.
12. The method of any one of claims 1 to 11 , wherein the combining of the first and the second probability of the first copy number hypothesis comprises multiplying the first and the second probabilities of the first copy number hypothesis, and wherein the combining of the first and the second probability of the second copy number hypothesis comprises multiplying the first and the second probabilities of the second copy number hypothesis.
13. The method of any one of claims 1 to 12, wherein the comparison of the first metric and the second metric comprises determining which of the first or the second metric has the highest value.
14. The method of claim 13, wherein upon the first metric being greater than the second metric, the copy number of the nucleic acid region of interest in the first genome is determined according to the first copy number hypothesis, or upon the second metric being greater than the first metric, the copy number of the nucleic acid region of interest in the first genome is determined according to the second copy number hypothesis.
15. The method of any one of claims 1 to 14, further comprising, prior to (B), determining (i) the amount of the plurality of non-polymorphic reference loci in the genetic sample, and (ii) the amount of the plurality of non-polymorphic loci in the nucleic acid region of interest in the genetic sample.
16. The method of any one of claims 1 to 15, wherein (i) or (ii) is determined by a process comprising:
I.) contacting at least a first and a second probe set to the genetic sample, wherein
(1 ) the first probe set comprises a first labeling probe and a first tagging probe comprising an affinity tag, wherein the first labeling probe hybridizes adjacent to the first tagging probe on a first locus, and
(2) the second probe set comprises a second labeling probe, and a second tagging probe comprising the affinity tag, wherein the second labeling probe hybridizes adjacent to the second tagging probe on a second locus;
II.) ligating the first labeling probe to the first tagging probe thereby providing a first ligated probe set, and ligating the second labeling probe to the second tagging probe, thereby providing a second ligated probe set;
III.) amplifying the first and second ligated probe sets to form first and second amplified ligated probe sets, respectively, wherein,
(1 ) the first ligated probe set is amplified using a first primer that hybridizes to a portion of the first labeling probe, or complement thereof, and comprises a first label, and a second primer that hybridizes to a portion of the first tagging probe, or complement thereof, wherein the first amplified probe set comprises the first label and the affinity tag, or a complement thereof, and
(2) the second ligated probe set is amplified using a third primer that hybridizes to a portion of the second labeling probe, or complement thereof, and comprises a second label, and the second primer, wherein the second primer hybridizes to a portion of the second tagging probe, wherein the second amplified probe set comprises the second label and the affinity tag, or a complement thereof, and the first and second labels are different; and
IV.) immobilizing the affinity tag or a complement thereof, of the first and second amplified ligated probe sets to a member of an array having a pre-defined location on the array; and
V.) determining a first count of the first label immobilized on the member of the array, and determining a second count of the second label immobilized on the member of the array, wherein each of the first and the second labels are individually optically resolvable on the member of the array, thereby providing the amount of (i) or (ii).
17. The method of any one of claims 1 to 16, wherein f2 is determined by a process comprising:
I.) contacting at least a first and a second probe set to the genetic sample, wherein
(1 ) the first probe set comprises a first labeling probe and a first tagging probe comprising an affinity tag, wherein the first labeling probe hybridizes adjacent to the first tagging probe at a first allele of an informative polymorphic locus of the plurality of non-polymorphic reference loci, and
(2) the second probe set comprises a second labeling probe, and the first tagging probe, wherein the second labeling probe hybridizes adjacent to the first tagging probe on a second allele of the informative polymorphic locus of the plurality of non-polymorphic reference loci;
II.) ligating the first labeling probe to the first tagging probe thereby providing a first ligated probe set, and ligating the second labeling probe to the first tagging probe, thereby providing a second ligated probe set;
III.) amplifying the first and second ligated probe sets to form first and second amplified ligated probe sets, respectively, wherein,
(1 ) the first ligated probe set is amplified using a first primer that hybridizes to a portion of the first labeling probe, or complement thereof, and comprises a first label, and a second primer that hybridizes to a portion of the first tagging probe, or complement thereof, wherein the first amplified probe set comprises the first label and the affinity tag, or a complement thereof, and
(2) the second ligated probe set is amplified using a third primer that hybridizes to a portion of the second labeling probe, or complement thereof, and comprises a second label, and the second primer, wherein the second amplified probe set comprises the second label and the affinity tag, or a complement thereof, and the first and second labels are different; and
IV.) immobilizing the affinity tag or a complement thereof, of the first and second amplified ligated probe sets to a member of an array having a pre-defined location on the array;
V.) determining a first count of the first label immobilized on the member of the array, and determining a second count of the second label immobilized on the member of the array, wherein each of the first and the second labels are individually optically resolvable on the member of the array.
18. A non-transitory computer readable medium configured to carry out the method of any one of claims 1 to 17.
19. A method of analyzing a genetic sample from a subject, said genetic sample containing a first genetic material and optionally having a second genetic material, the method comprising: determining a fraction of the second genetic material in the genetic sample based on a first number and a second number, the first number and the second number obtained by: contacting first and second probe sets to the genetic sample, wherein the first probe set comprises a first labeling probe and a first tagging probe, and wherein the second probe set comprises a second labeling probe and a second tagging probe; hybridizing the first and second probe sets to first and second nucleic acid regions of interest in nucleotide molecules present in the genetic sample, respectively; labeling the first and second labeling probes with first and second labels, respectively; immobilizing the first and second probe sets to a substrate at a density in which the first and second labels of the first and second probe sets are optically resolvable after immobilization; and detecting:
(i) a first number of the first label corresponding to a first subset of the first probe set immobilized to the substrate, and
(ii) a second number of the second label corresponding to a second subset of the second probe set immobilized to the substrate to detect the nucleic acid copy numbers, wherein the probes of the first subset and the second subset hybridize to the first and the second nucleic acid regions of interest, respectively, that contain one or more biomarkers informative of the fraction of the second genetic material in the genetic sample.
20. The method of claim 19, wherein the genetic material from the first genetic material comprises maternal genetic material from the subject, and the second genetic material comprises fetal genetic material from a fetus, and wherein a ratio of the first number and the second number corresponds to a measure of the fetal fraction.
21. The method of claim 19 or 20, wherein the first and the second probe sets are allele-specific.
22. The method of any one of claims 19-21 , further comprising determining a genetic variation in the genetic sample when the fraction exceeds a predetermined threshold.
23. The method of any one of claims 1-22, wherein the one or more biomarkers are selected from the group consisting of a SNP, an indel, a microsatellite, a bi-allelic marker, a multi-allelic marker, a polymorphic marker, a polynucleotide repeat, a fragment size, a copy number variant, a methylation marker and combinations thereof.
24. The method of any one of claims 19-23, wherein the genetic variation is selected from the group consisting of an aneuploidy, a copy number change, a deletion, an indel, an inversion, a monosomy, a mutation, a SNP, a translocation, and a trisomy.
25. A method of determining genetic variation in a genetic sample, said genetic sample containing a first genetic material and optionally having a second genetic material, the method comprising: determining, using a computer system, a first metric corresponding to a measure of certainty of a null hypothesis that the genetic variation is absent in the genetic sample, wherein the first metric is a continuous function of a fraction of the second genetic material, and conditioned on the absence of the genetic variation in a first data set; determining, using a computer system, a second metric corresponding to a measure of certainty of an alternative hypothesis that the genetic variation is present in the genetic sample, wherein the second metric is a continuous function of the fraction of the second genetic material, and conditioned on the presence of the genetic variation in the first data set; determining, using a computer system, a relative number based on the first metric and the second metric; and determining, using a computer system, if the genetic variation is present in the genetic sample by comparing the relative number to a reference number.
26. The method of claim 25, wherein the relative number corresponds to a difference or a ratio between the first metric and the second metric occurring at a predetermined fraction of the second genetic material.
27. The method of claim 25 or 26, wherein the relative number corresponds to a difference or a ratio between the first metric and the second metric occurring at the fraction of the second genetic material that maximizes the first metric, or wherein the relative number corresponds to a difference or a ratio between the first metric and the second metric occurring at the fraction of the second genetic material that maximizes the second metric.
28. The method of any one of claims 25 to 27, wherein the first data set is obtained by: contacting a first probe set to the genetic sample, wherein the first probe set comprises a first labeling probe and a first tagging probe; hybridizing the first probe set to one or more first nucleic acid regions of interest in nucleotide molecules present in the genetic sample; labeling the first labeling probe with a first label; immobilizing the first probe set to a substrate at a density in which the first label is optically resolvable after immobilization; and detecting a number of the first labels corresponding to the first probe set immobilized to the
substrate to detect the nucleic acid copy numbers of the one or more first nucleic acid regions of interest, thereby obtaining the first data set.
29. The method of any one of claims 25 to 28, wherein the genetic variation is selected from the group consisting of an aneuploidy, a copy number change, a deletion, an indel, an inversion, a monosomy, a mutation, a SNP, a translocation, and a trisomy.
30. The method of any one of claims 25 to 29, wherein the Statistical Power in detecting the genetic variation is increased by at least 0.05, at least 0.1, at least 0.15, at least 0.2, at least 0.3, at least 0.4, at least 0.5, at least 0.6, at least 0.7, at least 0.8, at least 0.9, or at least 0.99 as compared to a method in which the fraction of the second genetic material is determined by point estimation.
31. A method of determining genetic variation in a genetic sample, said genetic sample containing a first genetic material and optionally having a second genetic material, the method comprising: determining, using a computer system, a first metric corresponding to a measure of certainty of a null hypothesis that the genetic variation is absent in the genetic sample, wherein the first metric is a continuous function of a fraction of the second genetic material and conditioned on the absence of the genetic variation in both a first data set and a second data set; determining, using a computer system, a second metric corresponding to a measure of certainty of an alternative hypothesis that the genetic variation is present in the genetic sample, wherein the second metric is a continuous function of the fraction of the second genetic material and conditioned on the presence of the genetic variation in at least one of the first data set and the second data set; determining, using a computer system, a relative number corresponding to a maximum difference or a ratio between the first metric and the second metric; and determining, using a computer system, if the genetic variation is present in the genetic sample by comparing the relative number to a reference number.
31. The method of any one of claims 1 to 30, wherein the method does not comprise sequencing nucleic acids or analyzing sequencing reads.
Applications Claiming Priority (2)
| Application Number | Priority Date | Filing Date | Title |
|---|---|---|---|
| US202063029163P | 2020-05-22 | 2020-05-22 | |
| US63/029,163 | 2020-05-22 |
Publications (1)
| Publication Number | Publication Date |
|---|---|
| WO2021237105A1 true WO2021237105A1 (en) | 2021-11-25 |
Family
ID=78707690
Family Applications (1)
| Application Number | Title | Priority Date | Filing Date |
|---|---|---|---|
| PCT/US2021/033681 WO2021237105A1 (en) | 2020-05-22 | 2021-05-21 | Methods for determining a genetic variation |
Country Status (1)
| Country | Link |
|---|---|
| WO (1) | WO2021237105A1 (en) |
Cited By (2)
| Publication number | Priority date | Publication date | Assignee | Title |
|---|---|---|---|---|
| WO2022246291A1 (en) * | 2021-05-21 | 2022-11-24 | Invitae Corporation | Methods for determining a genetic variation |
| WO2024058850A1 (en) * | 2022-09-16 | 2024-03-21 | Myriad Women's Health, Inc. | Rna-facs for rare cell isolation and detection of genetic variants |
Citations (4)
| Publication number | Priority date | Publication date | Assignee | Title |
|---|---|---|---|---|
| US20020086289A1 (en) * | 1999-06-15 | 2002-07-04 | Don Straus | Genomic profiling: a rapid method for testing a complex biological sample for the presence of many types of organisms |
| US20070202525A1 (en) * | 2006-02-02 | 2007-08-30 | The Board Of Trustees Of The Leland Stanford Junior University | Non-invasive fetal genetic screening by digital analysis |
| US20090087847A1 (en) * | 2007-07-23 | 2009-04-02 | The Chinese University Of Hong Kong | Determining a nucleic acid sequence imbalance |
| US20180023124A1 (en) * | 2015-02-18 | 2018-01-25 | Singular Bio, Inc. | Arrays for Single Molecule Detection and Use Thereof |
-
2021
- 2021-05-21 WO PCT/US2021/033681 patent/WO2021237105A1/en active Application Filing
Patent Citations (4)
| Publication number | Priority date | Publication date | Assignee | Title |
|---|---|---|---|---|
| US20020086289A1 (en) * | 1999-06-15 | 2002-07-04 | Don Straus | Genomic profiling: a rapid method for testing a complex biological sample for the presence of many types of organisms |
| US20070202525A1 (en) * | 2006-02-02 | 2007-08-30 | The Board Of Trustees Of The Leland Stanford Junior University | Non-invasive fetal genetic screening by digital analysis |
| US20090087847A1 (en) * | 2007-07-23 | 2009-04-02 | The Chinese University Of Hong Kong | Determining a nucleic acid sequence imbalance |
| US20180023124A1 (en) * | 2015-02-18 | 2018-01-25 | Singular Bio, Inc. | Arrays for Single Molecule Detection and Use Thereof |
Non-Patent Citations (1)
| Title |
|---|
| TAN ET AL.: "A multiplex droplet digital PCR assay for non-invasive prenatal testing of fetal aneuploidies", ANALYST, vol. 144, no. 7, 25 March 2019 (2019-03-25), pages 2239 - 47, XP055820640, DOI: 10.1039/C8AN02018C * |
Cited By (2)
| Publication number | Priority date | Publication date | Assignee | Title |
|---|---|---|---|---|
| WO2022246291A1 (en) * | 2021-05-21 | 2022-11-24 | Invitae Corporation | Methods for determining a genetic variation |
| WO2024058850A1 (en) * | 2022-09-16 | 2024-03-21 | Myriad Women's Health, Inc. | Rna-facs for rare cell isolation and detection of genetic variants |
Similar Documents
| Publication | Publication Date | Title |
|---|---|---|
| JP6684775B2 (en) | Methods and compositions for diagnosis of thyroid status | |
| US20200251180A1 (en) | Resolving genome fractions using polymorphism counts | |
| JP6683752B2 (en) | Non-invasive determination of fetal or tumor methylome by plasma | |
| Demko et al. | Effects of maternal age on euploidy rates in a large cohort of embryos analyzed with 24-chromosome single-nucleotide polymorphism–based preimplantation genetic screening | |
| TWI661049B (en) | Using cell-free dna fragment size to determine copy number variations | |
| JP2022037145A (en) | High degree multiple pcr method and composition | |
| AU2014308980B2 (en) | Assays for single molecule detection and use thereof | |
| TWI732771B (en) | Methylation pattern analysis of haplotypes in tissues in a dna mixture | |
| TW201700732A (en) | Detecting mutations for cancer screening and fetal analysis | |
| Tong et al. | Epigenetic-genetic chromosome dosage approach for fetal trisomy 21 detection using an autosomal genetic reference marker | |
| WO2013088457A1 (en) | Genetic variants useful for risk assessment of thyroid cancer | |
| JP2022533137A (en) | Systems and methods for assessing tumor fractions | |
| WO2021237105A1 (en) | Methods for determining a genetic variation | |
| WO2022246291A1 (en) | Methods for determining a genetic variation | |
| WO2010064016A2 (en) | Methods for determining a prognosis in multiple myeloma | |
| Liu et al. | Preimplantation genetic haplotyping for six Chinese pedigrees with thalassemia using a single nucleotide polymorphism microarray | |
| Yang et al. | The Technologies: Comparisons on Efficiency, Reliability, and Costs | |
| Galata | Identification of genetic factors associated with myeloid neoplasms | |
| Chau | Deciphering Novel Chromosomal Structural Variants by Low-Pass Whole Genome Sequencing in the Human Genome |
Legal Events
| Date | Code | Title | Description |
|---|---|---|---|
| 121 | Ep: the epo has been informed by wipo that ep was designated in this application |
Ref document number: 21807530 Country of ref document: EP Kind code of ref document: A1 |
|
| NENP | Non-entry into the national phase |
Ref country code: DE |
|
| 122 | Ep: pct application non-entry in european phase |
Ref document number: 21807530 Country of ref document: EP Kind code of ref document: A1 |