CN109172559B - Application of ethacrynic acid in preparing medicine for treating and preventing obesity and related metabolic diseases - Google Patents
Application of ethacrynic acid in preparing medicine for treating and preventing obesity and related metabolic diseases Download PDFInfo
- Publication number
- CN109172559B CN109172559B CN201811134227.XA CN201811134227A CN109172559B CN 109172559 B CN109172559 B CN 109172559B CN 201811134227 A CN201811134227 A CN 201811134227A CN 109172559 B CN109172559 B CN 109172559B
- Authority
- CN
- China
- Prior art keywords
- mice
- ethacrynic acid
- fat
- obesity
- artificial sequence
- Prior art date
- Legal status (The legal status is an assumption and is not a legal conclusion. Google has not performed a legal analysis and makes no representation as to the accuracy of the status listed.)
- Active
Links
Images


Classifications
-
- A—HUMAN NECESSITIES
- A61—MEDICAL OR VETERINARY SCIENCE; HYGIENE
- A61K—PREPARATIONS FOR MEDICAL, DENTAL OR TOILETRY PURPOSES
- A61K31/00—Medicinal preparations containing organic active ingredients
- A61K31/185—Acids; Anhydrides, halides or salts thereof, e.g. sulfur acids, imidic, hydrazonic or hydroximic acids
- A61K31/19—Carboxylic acids, e.g. valproic acid
- A61K31/192—Carboxylic acids, e.g. valproic acid having aromatic groups, e.g. sulindac, 2-aryl-propionic acids, ethacrynic acid
-
- A—HUMAN NECESSITIES
- A61—MEDICAL OR VETERINARY SCIENCE; HYGIENE
- A61K—PREPARATIONS FOR MEDICAL, DENTAL OR TOILETRY PURPOSES
- A61K31/00—Medicinal preparations containing organic active ingredients
- A61K31/12—Ketones
- A61K31/122—Ketones having the oxygen directly attached to a ring, e.g. quinones, vitamin K1, anthralin
-
- A—HUMAN NECESSITIES
- A61—MEDICAL OR VETERINARY SCIENCE; HYGIENE
- A61K—PREPARATIONS FOR MEDICAL, DENTAL OR TOILETRY PURPOSES
- A61K31/00—Medicinal preparations containing organic active ingredients
- A61K31/21—Esters, e.g. nitroglycerine, selenocyanates
- A61K31/215—Esters, e.g. nitroglycerine, selenocyanates of carboxylic acids
- A61K31/216—Esters, e.g. nitroglycerine, selenocyanates of carboxylic acids of acids having aromatic rings, e.g. benactizyne, clofibrate
-
- A—HUMAN NECESSITIES
- A61—MEDICAL OR VETERINARY SCIENCE; HYGIENE
- A61K—PREPARATIONS FOR MEDICAL, DENTAL OR TOILETRY PURPOSES
- A61K31/00—Medicinal preparations containing organic active ingredients
- A61K31/33—Heterocyclic compounds
- A61K31/335—Heterocyclic compounds having oxygen as the only ring hetero atom, e.g. fungichromin
- A61K31/35—Heterocyclic compounds having oxygen as the only ring hetero atom, e.g. fungichromin having six-membered rings with one oxygen as the only ring hetero atom
- A61K31/352—Heterocyclic compounds having oxygen as the only ring hetero atom, e.g. fungichromin having six-membered rings with one oxygen as the only ring hetero atom condensed with carbocyclic rings, e.g. methantheline
-
- A—HUMAN NECESSITIES
- A61—MEDICAL OR VETERINARY SCIENCE; HYGIENE
- A61K—PREPARATIONS FOR MEDICAL, DENTAL OR TOILETRY PURPOSES
- A61K31/00—Medicinal preparations containing organic active ingredients
- A61K31/33—Heterocyclic compounds
- A61K31/395—Heterocyclic compounds having nitrogen as a ring hetero atom, e.g. guanethidine or rifamycins
- A61K31/40—Heterocyclic compounds having nitrogen as a ring hetero atom, e.g. guanethidine or rifamycins having five-membered rings with one nitrogen as the only ring hetero atom, e.g. sulpiride, succinimide, tolmetin, buflomedil
- A61K31/403—Heterocyclic compounds having nitrogen as a ring hetero atom, e.g. guanethidine or rifamycins having five-membered rings with one nitrogen as the only ring hetero atom, e.g. sulpiride, succinimide, tolmetin, buflomedil condensed with carbocyclic rings, e.g. carbazole
- A61K31/404—Indoles, e.g. pindolol
- A61K31/405—Indole-alkanecarboxylic acids; Derivatives thereof, e.g. tryptophan, indomethacin
-
- A—HUMAN NECESSITIES
- A61—MEDICAL OR VETERINARY SCIENCE; HYGIENE
- A61K—PREPARATIONS FOR MEDICAL, DENTAL OR TOILETRY PURPOSES
- A61K31/00—Medicinal preparations containing organic active ingredients
- A61K31/33—Heterocyclic compounds
- A61K31/395—Heterocyclic compounds having nitrogen as a ring hetero atom, e.g. guanethidine or rifamycins
- A61K31/435—Heterocyclic compounds having nitrogen as a ring hetero atom, e.g. guanethidine or rifamycins having six-membered rings with one nitrogen as the only ring hetero atom
- A61K31/44—Non condensed pyridines; Hydrogenated derivatives thereof
- A61K31/445—Non condensed piperidines, e.g. piperocaine
- A61K31/45—Non condensed piperidines, e.g. piperocaine having oxo groups directly attached to the heterocyclic ring, e.g. cycloheximide
-
- A—HUMAN NECESSITIES
- A61—MEDICAL OR VETERINARY SCIENCE; HYGIENE
- A61K—PREPARATIONS FOR MEDICAL, DENTAL OR TOILETRY PURPOSES
- A61K31/00—Medicinal preparations containing organic active ingredients
- A61K31/33—Heterocyclic compounds
- A61K31/395—Heterocyclic compounds having nitrogen as a ring hetero atom, e.g. guanethidine or rifamycins
- A61K31/435—Heterocyclic compounds having nitrogen as a ring hetero atom, e.g. guanethidine or rifamycins having six-membered rings with one nitrogen as the only ring hetero atom
- A61K31/47—Quinolines; Isoquinolines
- A61K31/49—Cinchonan derivatives, e.g. quinine
-
- A—HUMAN NECESSITIES
- A61—MEDICAL OR VETERINARY SCIENCE; HYGIENE
- A61K—PREPARATIONS FOR MEDICAL, DENTAL OR TOILETRY PURPOSES
- A61K31/00—Medicinal preparations containing organic active ingredients
- A61K31/33—Heterocyclic compounds
- A61K31/395—Heterocyclic compounds having nitrogen as a ring hetero atom, e.g. guanethidine or rifamycins
- A61K31/495—Heterocyclic compounds having nitrogen as a ring hetero atom, e.g. guanethidine or rifamycins having six-membered rings with two or more nitrogen atoms as the only ring heteroatoms, e.g. piperazine or tetrazines
- A61K31/505—Pyrimidines; Hydrogenated pyrimidines, e.g. trimethoprim
-
- A—HUMAN NECESSITIES
- A61—MEDICAL OR VETERINARY SCIENCE; HYGIENE
- A61K—PREPARATIONS FOR MEDICAL, DENTAL OR TOILETRY PURPOSES
- A61K31/00—Medicinal preparations containing organic active ingredients
- A61K31/557—Eicosanoids, e.g. leukotrienes or prostaglandins
- A61K31/5575—Eicosanoids, e.g. leukotrienes or prostaglandins having a cyclopentane, e.g. prostaglandin E2, prostaglandin F2-alpha
-
- A—HUMAN NECESSITIES
- A61—MEDICAL OR VETERINARY SCIENCE; HYGIENE
- A61K—PREPARATIONS FOR MEDICAL, DENTAL OR TOILETRY PURPOSES
- A61K31/00—Medicinal preparations containing organic active ingredients
- A61K31/63—Compounds containing para-N-benzenesulfonyl-N-groups, e.g. sulfanilamide, p-nitrobenzenesulfonyl hydrazide
- A61K31/635—Compounds containing para-N-benzenesulfonyl-N-groups, e.g. sulfanilamide, p-nitrobenzenesulfonyl hydrazide having a heterocyclic ring, e.g. sulfadiazine
-
- A—HUMAN NECESSITIES
- A61—MEDICAL OR VETERINARY SCIENCE; HYGIENE
- A61K—PREPARATIONS FOR MEDICAL, DENTAL OR TOILETRY PURPOSES
- A61K31/00—Medicinal preparations containing organic active ingredients
- A61K31/70—Carbohydrates; Sugars; Derivatives thereof
- A61K31/7135—Compounds containing heavy metals
-
- A—HUMAN NECESSITIES
- A61—MEDICAL OR VETERINARY SCIENCE; HYGIENE
- A61P—SPECIFIC THERAPEUTIC ACTIVITY OF CHEMICAL COMPOUNDS OR MEDICINAL PREPARATIONS
- A61P3/00—Drugs for disorders of the metabolism
- A61P3/04—Anorexiants; Antiobesity agents
-
- A—HUMAN NECESSITIES
- A61—MEDICAL OR VETERINARY SCIENCE; HYGIENE
- A61P—SPECIFIC THERAPEUTIC ACTIVITY OF CHEMICAL COMPOUNDS OR MEDICINAL PREPARATIONS
- A61P3/00—Drugs for disorders of the metabolism
- A61P3/08—Drugs for disorders of the metabolism for glucose homeostasis
- A61P3/10—Drugs for disorders of the metabolism for glucose homeostasis for hyperglycaemia, e.g. antidiabetics
Landscapes
- Health & Medical Sciences (AREA)
- Life Sciences & Earth Sciences (AREA)
- Chemical & Material Sciences (AREA)
- Medicinal Chemistry (AREA)
- Pharmacology & Pharmacy (AREA)
- Animal Behavior & Ethology (AREA)
- General Health & Medical Sciences (AREA)
- Public Health (AREA)
- Veterinary Medicine (AREA)
- Epidemiology (AREA)
- Diabetes (AREA)
- Chemical Kinetics & Catalysis (AREA)
- Organic Chemistry (AREA)
- Engineering & Computer Science (AREA)
- Bioinformatics & Cheminformatics (AREA)
- Nuclear Medicine, Radiotherapy & Molecular Imaging (AREA)
- Hematology (AREA)
- Obesity (AREA)
- Emergency Medicine (AREA)
- General Chemical & Material Sciences (AREA)
- Molecular Biology (AREA)
- Child & Adolescent Psychology (AREA)
- Endocrinology (AREA)
- Micro-Organisms Or Cultivation Processes Thereof (AREA)
- Medicines That Contain Protein Lipid Enzymes And Other Medicines (AREA)
Abstract
The invention belongs to the technical field of biological medicines, and particularly relates to application of ethacrynic acid in preparation of a medicine for preventing and treating obesity and related metabolic diseases. The application comprises the application of an ethacrynic acid inhibitor in preparing a medicament for preventing or treating obesity and related metabolic diseases; the use of its biological target GSTM1 in promoting browning of white fat; the application of other GST inhibitors in preparing medicaments for preventing or treating obesity and related metabolic diseases and the like; mice showed significant weight loss and decreased adipose tissue content following intraperitoneal injection of ethacrynic acid. The level of browning of cells and adipose tissue was enhanced by knocking down GSTM1 in the in vitro preadipocyte differentiation model and in the white adipose tissue of mice, respectively. The fact that the ethacrynic acid can prevent and treat the body obesity and the metabolic abnormality induced by high fat diet through targeting GSTM1 is proved, and the ethacrynic acid can be used for developing and preparing a novel small molecular preparation for resisting the body obesity and the metabolic abnormality.
Description
Technical Field
The invention belongs to the technical field of biological medicines, and particularly relates to application of ethacrynic acid in preparing a medicine for treating and preventing obesity and related metabolic diseases.
Background
With the rapid development of global economy, the improvement of the living standard of people, and the appearance of unreasonable dietary patterns, bad life styles and the like, the prevalence rate of obesity is increasing and the onset of obesity is becoming more and less aged. The data show that the number and proportion of the globally obese and overweight population has been increasing in the last 30 years. The global population for obesity and overweight has increased from 8.57 billion people in 1980 to 21 billion people in 2013, with an overall increase in 27.5% in adult obesity and overweight population and 47.1% in childhood obesity and overweight population. According to the statistical data published on the lancets in 2013, although the incidence rate of obesity of adults is low in China, the total number of adults suffering from central obesity or peripheral obesity is second in the world and becomes a world-wide obesity population country second only in the United states. In addition, the obesity problem of children and teenagers is prominent in China, and the obesity of the teenagers can cause growth retardation, impaired cardio-pulmonary function, hypertension and even early death, so that the self-confidence of the children and the teenagers is reduced, and the social adaptability is reduced. Obesity and various accompanying metabolic diseases such as type II diabetes, hypertension, hyperlipidemia, fatty liver and the like have become global focus problems threatening the physical and mental health of human beings.
Studies have shown that obesity is a state in which fat volume is increased due to imbalance in energy metabolism, excessive intake or insufficient energy consumption. Adipose tissue is a huge energy storage system in the body, is in the core position in the occurrence and development process of obesity, and plays a significant role in maintaining the energy metabolism balance of the body. Three types of adipose tissue are currently known to exist in the human body: white fat, brown fat and beige fat. White adipose tissue is widely distributed in the subcutaneous and visceral regions of the body, and is mainly responsible for storing energy in the form of triglyceride in large lipid droplets and secreting various endocrine hormones such as leptin (leptin), resistin (resistin) and adiponectin (adiponectin) to regulate the energy balance of the body. Brown adipocytes in the body are divided into two types: classical brown adipocytes and brown-like adipocytes dispersed among white adipocytes, i.e., beige adipocytes. The brown fat cells are derived from brown fat cells expressing Myf5 cell lines, are mainly distributed in neck and back, shoulder blades, armpits, kidneys and the like, contain a large number of fat droplets and high-concentration mitochondria, are main sites of non-castration of mammals, and contain a large number of marker molecule uncoupling protein 1 (UCP 1). UCP1 is localized in the inner mitochondrial membrane and can leak protons from the inner mitochondrial membrane into the mitochondrial matrix, reducing ATP synthesis, converting chemical energy into thermal energy, and thereby allowing oxidative phosphorylation to enter an idle state, which is a hallmark of brown adipocyte activation. When the body is in a low-temperature environment, the hypothalamus of the thermoregulation center causes sympathetic nerve excitation, and the non-coupling oxidative phosphorylation decomposition of the fatty acid in the cell generates heat to supply energy to the body and maintain the body temperature balance of the body. It has been found that when the body's sympathetic nerves are excited, such as by exercise or in a cold environment, the white fat turns brown to beige. The thermogenesis effect caused by the browning of white adipose tissue is a new direction for research on prevention and treatment of obesity and related metabolic diseases, and the activation of brown fat in vivo to increase body energy consumption provides new assistance for the treatment of obesity, so that the research on obesity becomes a key point.
UCP1 is specifically expressed on brown fat mitochondrial inner membrane, and generates heat by cutting off coupling of electron transfer chain and ATP synthesis and blocking respiration. UCP1 is not only involved in thermogenic regulation and energy metabolism of brown adipose tissue, but also is a phenotypic marker of thermogenic adipose tissue. In addition to UCP1, PGC1 α, PRDM16 and Cytochrome C are also important molecules involved in the browning process.
Glutathione mercaptotransferase (GSTs) superfamily mainly includes subtypes of alpha, mu, pi, theta and the like, is one of the most important II-phase metabolic enzymes for in vivo biotransformation, and is the main detoxification system for resisting damage and canceration of cells. Ethacrynic Acid (EA) is a diuretic used in clinical practice, is also an inhibitor of GST isoenzyme, and inhibits GSH metabolism by competitively or non-competitively binding with GSH in a nucleophilic addition manner of a carbon-carbon double bond of an α, β -unsaturated carbonyl compound. But ethacrynic acid has not been studied in the treatment of obesity and its associated imbalance in carbohydrate metabolism and energy metabolism.
Based on the theory, the invention discusses the application of ethacrynic acid in preventing and treating obesity and related sugar metabolism and energy metabolism disorder.
Disclosure of Invention
The invention aims to provide application of ethacrynic acid in preparing a medicament for treating and preventing body obesity and related metabolic diseases.
The invention provides an application of ethacrynic acid in preparing drugs for preventing or treating obesity and related metabolic diseases, which comprises the following steps:
use of an ethacrynic acid inhibitor for the preparation of a medicament for the prevention or treatment of obesity and related metabolic disorders;
use of the biological target GSTM1 of ethacrynic acid to promote lipolysis;
use of a further inhibitor of GST in the manufacture of a medicament for the prophylaxis or treatment of obesity and associated metabolic disorders thereof.
Wherein the Ethacrynic acid (Ethacrynic acid) is a GST inhibitor; the promotion of lipolysis refers to the promotion of browning of white fat; the obesity and related metabolic diseases comprise hyperglycemia, glucose tolerance, insulin tolerance, energy metabolism disorder and the like of the body induced by the obesity.
Other inhibitors of GST are specifically: ethacrynic acid and its analogs, auranofin, piperlongumine, NBDEHX, TER199, quercetin, quinidine, pyrimethamine, clofibrate, gossypol, indomethacin, 1- (2-hydroxy-3-methoxypropyl) -2-nitroimidazole, piraprost, sulfasalazine. The structural formulas are respectively as follows:


experiments show that mice fed with high-fat diet show obvious weight reduction and fat tissue content reduction after the mice are injected with ethacrynic acid in the abdominal cavity. In addition, the sugar metabolism level of the mice is obviously improved, the oxygen consumption and the energy consumption are enhanced, and the capacity of the mice for keeping the body temperature of the mice in a cold environment is increased. In addition, knock-down of GSTM1 in an in vitro preadipocyte differentiation model and in mouse white adipose tissue, respectively, enhanced the browning levels of cells and adipose tissue. Therefore, the ethacrynic acid can prevent and improve the body obesity and the metabolic abnormality induced by high fat diet by targeting GSTM1, and can be used for developing and preparing a novel small molecule preparation for resisting the body obesity and the metabolic abnormality.
The invention has the beneficial effects that:
ethacrynic acid can promote fat decomposition by inhibiting GSTM1 so as to improve high fat diet-induced weight gain, lipid accumulation, carbohydrate metabolism and energy metabolism imbalance, has good clinical treatment potential, and provides a new way for treating obesity and related carbohydrate metabolism and energy metabolism imbalance.
Drawings
Embodiments of the invention are described in detail by referring to the drawings, wherein:
FIGS. 1-3 show the brown fat-like morphology of rosiglitazone-directed C3H10T1/2 by ethacrynic acid. In which FIG. 1 shows the cell morphology of etanide-treated rosiglitazone-directed C3H10T 1/2. FIGS. 2-3 show that Western Blot detects transcriptional and protein expression levels of UCP1, PGC1a, and PRDM16 genes associated with brown fat of BMP 4-targeted C3H10T1/2 after treatment with rosiglitazone-targeted C3H10T1/2 and varying concentrations of ethacrynic acid. P <0.05, p <0.01, p < 0.001.
FIGS. 4-7 show the browning of subcutaneous fat in mice raised in high fat induced by intraperitoneal injection of ethacrynic acid for one week. Wherein, fig. 4 shows the body temperature change of high fat-fed mice in a 4 ℃ environment after a week of intraperitoneal injection of ethacrynic acid. Fig. 5 shows HE staining and UCP1 staining of subcutaneous adipose tissue. FIGS. 6-7 show the expression of mRNA and protein of UCP1 and other brown fat-related genes in inguinal adipose tissue after a high-fat-fed mouse was treated with cold exposure for 8 hours after intraperitoneal injection of ethacrynic acid for one week. P <0.05, p <0.01, p < 0.001.
FIGS. 8 to 10 show the expression of the GSTM1 family protein in each adipose tissue of mice. FIG. 8 shows mRNA expression of each subtype of GST family protein in subcutaneous adipose tissue of normal mice. Fig. 9 shows mRNA expression of Gstm1, Gstp1 in mouse inguinal white fat, epididymal white fat, and scapular brown adipose tissue. FIG. 10 shows protein expression levels of GSTM1 and GSTP1 when mature C3H10T1/2 was induced to brown using different concentrations of CL316,243. P <0.05, p <0.01, p < 0.001.
FIGS. 11-13 show that knocking down GSTM1 during differentiation of SVF primary adipose precursor cells can confer brown adipose-like morphological features on SVF primary adipose precursor cells. FIG. 11 shows the change in morphology of SVF cells following knockdown of GSTM1 during differentiation. FIGS. 12 to 13 show the expression levels of brown-related genes PRDM16, PGC1 alpha and UCP1 and the protein expression level of UCP1 after the knock-down of GSTM1 during the differentiation of SVF cells. P <0.05, p <0.01, p < 0.001.
FIGS. 14-16 show that knock-down of GSTM1 in mouse inguinal fat using adenovirus technology and cold exposure treatment of mice enhanced the brown phenotype of mouse inguinal fat tissue. Fig. 14 shows HE staining and UCP1 staining after the GSTM1 was knocked down in the mouse inguinal adipose tissue and the mice were treated for cold exposure for 8 hours. FIGS. 15-16 show protein expression of UCP1 and mRNA from brown related genes in inguinal adipose tissue after cold exposure treatment of mice. P <0.05, p <0.01, p < 0.001.
Figure 17 shows that ethacrynic acid inhibits high fat diet-induced weight gain in C57BL/6 mice. Wherein, fig. 17A shows weight gain in C57BL/6 mice intraperitoneally injected with ethacrynic acid under high fat diet conditions; fig. 17B shows the magnitude of body weight gain of mice in each treatment group under high fat diet conditions. P <0.05, p <0.01, p < 0.001.
Figure 18 shows that intraperitoneal injection of ethacrynic acid can reduce adipose tissue in mice fed high-fat diets. Wherein, figure 18A shows a body type comparison of mice intraperitoneally injected with ethacrynic acid to control mice; FIG. 18B shows the volume of inguinal fat, epididymal fat, and interscapular brown fat in mice intraperitoneally injected with ethacrynic acid versus control mice; figure 18C shows the comparison of fat and muscle content of mice intraperitoneally injected with ethacrynic acid with control mice, # p <0.05, # p <0.01, # p < 0.001.
FIG. 19 shows the change of serum lipid metabolism-related markers in mice of the experimental group injected with ethacrynic acid intraperitoneally, compared with mice of the control group, eight weeks after the mice were fed with a high-fat diet. P <0.05, p <0.01, p < 0.001.
Figure 20 shows that intraperitoneal injection of ethacrynic acid can improve glucose metabolism in mice fed a high-fat diet. Wherein, fig. 20A shows the glucose tolerance of mice raised with high fat after 8 weeks of intraperitoneal injection of ethacrynic acid; fig. 20B shows insulin tolerance in mice from different treatment groups. P <0.05, p <0.01, p < 0.001.
Figure 21 shows that intraperitoneal injection of ethacrynic acid enhanced oxygen consumption and energy production in mice on a high fat diet. Wherein, fig. 21A shows oxygen consumption in high fat-fed mice 8 weeks after intraperitoneal injection of ethacrynic acid; fig. 21B shows the heat generation of mice in each treatment group. P <0.05, p <0.01, p < 0.001.
FIGS. 22-23 show browning of subcutaneous fat in mice fed a high-fat diet 8 weeks after intraperitoneal injection of ethacrynic acid. Among them, fig. 22 shows the body temperature change during cold exposure of high fat-fed mice after 8 weeks of intraperitoneal injection of ethacrynic acid. FIGS. 23A-23B show the expression of the mRNA and protein levels of UCP1 in inguinal adipose tissue after 8 weeks of intraperitoneal injection of ethacrynic acid and 8 hour cold exposure treatment of high fat-fed mice. Fig. 23C shows HE staining and UCP1 staining of subcutaneous adipose tissue in mice of each treatment group. P <0.05, p <0.01, p < 0.001.
Figure 24 shows that ethacrynic acid can significantly improve obesity in mice induced by high fat diet. In a mouse obesity model (DIO) induced by a two-month high-fat diet, the treatment with ethacrynic acid significantly reduced the body weight of obese mice by up to 20%.
Figure 25 shows that intraperitoneal injection of ethacrynic acid reduced adipose tissue in DIO mice. Wherein, fig. 25A shows a body type comparison of DIO mice given intraperitoneal ethacrynic acid to control mice; fig. 25B shows the volume of inguinal fat, epididymal fat, and interscapular brown fat in mice intraperitoneally administered with ethacrynic acid versus control mice; figure 25C shows the abdominal cavity of ethacrynic acid mice and control mice in fat content and muscle content comparison. P <0.05, p <0.01, p < 0.001.
Figure 26 shows the effect of ethacrynic acid on mouse carbohydrate metabolism in a DIO mouse model. Fig. 26A shows the effect of i.p. injection of ethacrynic acid on fasting plasma glucose and random plasma glucose in mice, and fig. 26B, C shows the effect of i.p. injection of ethacrynic acid glucose on glucose tolerance and insulin tolerance in mice, respectively. P <0.05, p <0.01, p < 0.001.
Figure 27 shows that intraperitoneal injection of ethacrynic acid enhanced oxygen consumption and energy production in DIO mice. Wherein, figure 27A shows oxygen consumption in DIO mice 4 weeks after intraperitoneal injection of ethacrynic acid; fig. 27B shows the heat generation of mice 4 weeks after intraperitoneal injection of ethacrynic acid. P <0.05, p <0.01, p < 0.001.
FIG. 28 shows that DIO mice develop brownish subcutaneous fat after 4 weeks of intraperitoneal injection of ethacrynic acid. Wherein, fig. 28A shows the expression of the mRNA level of UCP1 in inguinal adipose tissue after cold exposure of DIO mice for 8 hours after 4 weeks of intraperitoneal injection of ethacrynic acid; figure 28B shows HE staining and UCP1 staining of subcutaneous adipose tissue, # p <0.05, # p <0.01, # p < 0.001.
Detailed Description
Example 1 Induction of C3H10T1/2 mesenchymal Stem cells by Etanenic acid in the differentiation into adipocytes
1.1 materials
1.1.1C3H10T1/2 mesenchymal stem cell line
1.1.2DMEM Medium (Gibco)
1.1.3 fetal bovine serum (Gibco)
1.1.4 Calf serum (sigma)
1.1.5 Biotin (Sigma)
1.1.6 penicillin and streptomycin
1.1.7 Etanenic acid (Beijing Zhongke quality inspection)
1.1.8 rosiglitazone
1.1.9PVDF membrane (Millipore Immunobilon)
1.1.10 chemiluminescence liquid (Shanghai Qixiang biotechnology limited)
1.2 devices
1.2.1 constant temperature aseptic incubator Thermo Scientific forms II Water Jacket
1.2.2 microscope Olympus IX711
1.2.3 electrophoresis apparatus BioRad PowerPac HC
1.2.4 automated chemiluminescence apparatus ImageQuant LAS4000Mini
1.3 solutions
1.3.1 culture Medium
C3H10T1/2 cell growth medium:


C3H10T1/2 induced differentiation medium:
| DMEM | 500ml |
| fetal |
10% |
| Biotin | 8mg/ml |
| Penicillin | 100U/ml |
| Streptomycin | 100U/ml |
1.3.2 Etitanic acid stock solutions were dissolved in DMSO at a stock concentration of 20 mmol/L.
1.3.3 Biotin
80mg of biotin and 40mg of calcium pantothenate are dissolved in 100ml of deionized water. Heating to dissolve. 0.22 μm filter membrane filtration sterilization.
1.3.43-isobutyl-1-methylxanthine (50mMol/L)
1.15g of 3-isobutyl-1-methylxanthine are dissolved in 100ml of 0.2M potassium hydroxide and filter sterilized through a 0.22 μ M filter.
1.3.5 dexamethasone (1mMol/L)
0.039g of dexamethasone was dissolved in 100ml of water and sterilized by filtration through a 0.22 μm membrane filter.
1.3.6 insulin (1mg/ml)
0.1g of insulin is dissolved in 100ml of water, a few drops of hydrochloric acid are added to dissolve the insulin, and the resulting solution is filtered through a 0.22 μm filter to sterilize the solution.
1.3.7 lysate used for cell protein extraction
| Tris-HCL(pH6.8) | 50mMol/ |
| SDS | |
| 2%(w/v) | |
| |
10%(w/v) |
| NaF | 10mMol/L |
| Na 3 VO 4 | 100mMol/L |
1.4 methods
1.4.1 culture and differentiation of C3H10T1/2
Adding 10% calf serum, 8mg/L biotin, 100IU/mL penicillin and 100IU/mL streptomycin into a high-sugar DMEM culture medium, namely a growth culture medium of C3H10T1/2 mesenchymal stem cells, wherein the culture conditions of the cells are 37 ℃ and 10% CO 2. After the C3H10T1/2 mesenchymal stem cells are inoculated in a culture dish of 3.5cm, and the cells are induced according to a standard preadipocyte in-vitro differentiation scheme after the cells grow until contact inhibition and are confluent for two days. The method comprises the following specific steps: the C3H10T1/2 cells that were two days inhibited in contact were formed and induced for differentiation in high glucose DMEM medium containing 10% FBS, rosiglitazone, 0.5mM 3-isobutyl-1-methylxanthine, 1. mu.g/mL insulin and 1. mu.M dexamethasone. After 2 days, the culture medium was changed to a high-glucose DMEM medium containing 10% FBS, rosiglitazone and 1 μ g/mL insulin for another 2 days, after which the high-glucose DMEM medium containing 10% FBS was changed every two days until differentiation into mature adipocytes.
1.4.2 Etanenic acid treatment
To evaluate the effect of ethacrynic acid in the differentiation process of C3H10T1/2, the medium was treated with ethacrynic acid added to the medium while changing the medium every two days before differentiation. And (3) performing oil red staining and extracting total protein and RNA of the cells on 6-7 days of cell differentiation, and performing subsequent western blotting and Q-PCR to detect expression change of related genes.
1.4.3 oil Red dyeing
The differentiated adipocytes were washed twice with PBS, fixed with 4% formaldehyde at room temperature for 15 minutes, washed twice with PBS, stained with an oil red working solution at room temperature for 4 hours, washed twice with deionized water, and photographed under a microscope. Counterstaining overnight, and air drying.
1.4.4 extraction of total cellular RNA from C3H10T1/2 and reverse transcription into cDNA
Washing the monolayer adherent cells by PBS, adding a proper amount of TRIzol Reagent, blowing by a pipette until the liquid is clear, and standing for 5 minutes at room temperature; adding 200 μ L of chloroform, shaking vigorously for 15 seconds, mixing well, standing at room temperature for 3-5 minutes, and centrifuging at 4 deg.C for 12000g × 15 minutes; sucking the upper-layer water phase by a liquid transfer machine, placing the upper-layer water phase in another 1.5mL centrifugal tube, adding isopropanol with the same volume, reversing, uniformly mixing, and standing at room temperature for 10 minutes; centrifuge at 12000g × 10 min at 4 ℃. Discarding the supernatant, adding 1mL of 75% ethanol, centrifuging at 4 ℃ for 7500g × 5 min, and washing; the supernatant was discarded and dried at room temperature for 5-10 minutes. The subsequent reverse transcription reaction was performed by dissolving in RNase-free water (DEPC water) (about 20-30. mu.L) and then solubilizing at 55-60 ℃ for 10 minutes.
After RNA quantification, 1 mu g of total RNA is taken, and a TaKaRa reverse transcription kit is used for carrying out reverse transcription reaction, wherein the specific reaction system is as follows:

and (3) uniformly mixing the reaction systems, incubating at 37 ℃ for 15 minutes to perform reverse transcription reaction, then incubating at 85 ℃ for 10 seconds to terminate the reaction, and freezing and storing the generated cDNA at-20 ℃ for later use.
1.4.5Real time qPCR
The primers used in Q-PCR were synthesized in Shanghai. Using cDNA as amplification template, and using upstream and downstream primers to make PCR amplification of target fragment. The reaction system is as follows:


after mixing, the mixture was centrifuged and subjected to PCR reaction in a Q-PCR apparatus.
Reaction conditions are as follows:

the primer sequences involved in the Q-PCR reaction were as follows (5 '-3'):

the relative amount of mRNA was calculated by the Δ Δ CT method, 18S was used as an internal reference, the mRNA level of the control was set to 1, and the treatment groups were compared with the control group to obtain the relative amount.
1.4.6 extraction of Total cellular protein
The medium was removed and the cells were washed 2 times with pre-cooled PBS. Cell lysate (containing protease inhibitors) is added to the dish, typically 1mL of lysate is added to a 10cm dish. The lysates were lysed on ice for 10 min, scraped with a cell scraper and transferred to a 1.5mL centrifuge tube. The lysate was heated at 100 ℃ for 10 minutes, centrifuged at 12000rpm for 10 minutes, and the centrifuged supernatant was stored frozen at-80 ℃ for further use.
1.4.7Western blot
(1) Taking the same amount according to the concentration of the protein sample, and performing SDS-polyacrylamide gel electrophoresis (SDS-PAGE);
(2) after electrophoresis, the NC membrane and the filter paper are soaked in a membrane transfer buffer. Stacking 2 pieces of filter paper-gel-NC membrane-2 pieces of filter paper in sequence, wherein the gel faces to the negative electrode, the NC membrane is close to the positive electrode, and the bubbles between the NC membrane and the gel are eliminated. Transferring constant current 200mA for 1 h;
(3) taking out the NC membrane, putting into a proper amount of blocking liquid (1 XPBST containing 5% BSA or skimmed milk powder), placing on a shaker at room temperature, and slightly shaking for blocking for 1 h;
(4) carrying out immunoblotting reaction on the NC membrane by using a corresponding first antibody, and diluting the first antibody to a proper concentration by using a confining liquid; adding a first antibody into an incubation box in which an NC membrane is placed, and incubating for 2-4h at room temperature or incubating overnight at 4 ℃ by shaking;
(5) after incubation, the membrane was washed with 1 × PBST for 3 times, 5 minutes each time;
(6) incubating with the corresponding secondary antibody diluent labeled with HRP at room temperature for 1h, washing the membrane with 1 XPBST for 3 times, each time for 5 minutes;
(7) preparing a required chromogenic substrate (1:1), and placing the chromogenic substrate into a chemiluminescence instrument for developing and imaging.
The antibody cargo numbers and antibody dilution ratios are shown in the following table:
| antibodies | Goods number | Dilution ratio |
| β-acting | Proteintech HRP-60008 | 1:10000 |
| UCP1 | Abcam Ab10983 | 1:200 |
| Second antibody | Jackson Immunology 111-035-003 | 1:10000 |
1.5 results
1.5.1 Etanenic acid A brown fat-like morphological feature of rosiglitazone-directed C3H10T1/2
C3H10T1/2 is a mesenchymal stem cell with multipotent differentiation potential, differentiating into brown adipocytes with rosiglitazone targeting. Concurrent addition of ethacrynic acid (1. mu. mol/L and 2. mu. mol/L) during rosiglitazone directed C3H10T1/2 differentiation. Cell morphology was observed and it was found that ethacrynic acid-treated C3H10T1/2 cells appeared brown-like in character, smaller in size and with many small and numerous lipid droplets. (as shown in fig. 1).
1.5.2 after BMP 4-directed C3H10T1/2 cells are differentiated and matured by ethacrynic acid, the protein level of the brown fat related gene is detected by calling Q-PCR and Western blot on the expression of the brown fat related gene, and beta-Tubulin is used as an internal reference. The results show that ethacrynic acid increased the transcript and protein levels of the brown related gene UCP1 in rosiglitazone-targeted C3H10T1/2 cells and had a concentration-dependent trend (as shown in fig. 2-3).
Example 2 intraperitoneal injection of ethacrynic acid induces browning of subcutaneous fat in mice raised at high fat
2.1 materials
2.1.1 Male C57BL/6J mouse (4-6week)
2.1.2 high fat diet (Research Diets, USA)
2.1.3 mouse thermometer (physiotemp BAT-12)
2.1.4UCP1 specific antibodies (Abcam, ab10983, 1:50)
2.1.5 Etanenic acid (Beijing Zhongke quality testing Biotechnology Co., Ltd.)
2.1.6 Castor oil (Sigma)
2.2 methods
2.2.1 feeding and administration of mice
The mice are raised in SPF animal laboratories of the laboratory animal center of the university of Compound Dan, the room temperature is 21-23 ℃, the light and dark cycle is carried out every 12hr, and the fat content of the high-fat feed used by the obese mice is induced to be 60 percent. When the mice grew to 8-week, they were randomly divided into control groups and administration groups, 7 mice per group. 7mg/kg of ethacrynic acid was intraperitoneally injected while feeding with high-fat diet. Once daily for one week. After the administration, the mice were fasted and placed in a 4 ℃ incubator and their rectal temperature was measured every 2 hours. After 8 hours, the mice were sacrificed by cervical dislocation, and inguinal fat was taken and analyzed histologically. Immunohistochemical experiments involving tissue fixation, paraffin embedding, sectioning and UCP1 were assigned to shanghai rui yu bio ltd.
2.2.2 data analysis
Data differences were analyzed by Student T test method, and statistical differences were considered when p < 0.05.
2.3 results
One week after administration, mice intraperitoneally injected with ethacrynic acid when exposed to a 4 ℃ environment had slightly higher body temperature than control mice (fig. 4). The body temperature preservation capability of the mice in the administration group is obviously enhanced, and the subcutaneous fat is obviously browned. The inguinal fat of the mice was taken out and subjected to immunohistochemical detection, fluorescent quantitative PCR analysis and immunoblot detection of UCP1, indicating that the subcutaneous fat of the mice of the administered group exhibited significant UCP1 expression (fig. 5-7). This indicates that one week of intraperitoneal injection of ethacrynic acid can promote browning of the inguinal fat in mice.
Example 3 reduction of GSTM1 expression during CL316,243-induced cell browning
3.1 materials
3.1.1 Male C57BL/6J mouse (6week)
3.1.2C3H10T1/2 mesenchymal stem cell line
3.1.3DMEM Medium (Gibco)
3.1.4 fetal bovine serum (Gibco)
3.1.5 Calf serum (sigma)
3.1.6 Biotin (Sigma)
3.1.7 penicillin and streptomycin
3.1.8BMP4(R&D)
3.1.9NC membrane (Millipore Immunobilon)
3.2 devices
3.2.1 microscope Olympus IX711
3.2.2 chemiluminescent liquid (Shanghai Qixiang Biotechnology Co., Ltd.)
3.2.3 protein electrophoresis apparatus
3.3 solutions
3.3.1 culture Medium
C3H10T1/2 maintenance medium:
| DMEM | up to 500ml |
| |
10% |
| Biotin | 8mg/ml |
| Penicillin | 100U/ml |
| Streptomycin | 100U/ml |
3.3.2 lysate used for cell protein extraction:
| Tris-HCL(pH6.8) | 50mMol/ |
| SDS | |
| 2%(w/v) | |
| |
10%(w/v) |
| NaF | 10mMol/L |
| Na 3 VO 4 | 100mMol/L |
3.4 methods
3.4.1 Total RNA from inguinal fat of Normal mice was extracted and reverse transcribed into cDNA
After dissolving inguinal fat of a normal mouse by Trizol, total RNA of adipose tissues is extracted according to 1.4.4 and reverse transcription is carried out.
3.4.2Real-time qPCR
Reference of reaction system and reaction conditions 1.4.5
The primer sequences involved in the reaction are as follows:

relative amounts of mRNA were calculated by the Δ Δ CT method, 18S was used as an internal reference, mRNA levels of the controls were set to 1, and the treatment groups were compared with the controls to obtain relative amounts.
3.4.3Western blot
Protein samples from CL316,243-treated cells were subjected to immunoblot assays as referenced 1.4.6-1.4.7.
3.5 results
Transcriptome level detection of GST subtypes in tissue samples of mouse inguinal fat revealed that the expression levels of Gstm1 and Ggstp 1 were much higher than those of other subtypes (FIG. 8). Among them, Gstm1 was expressed at a significantly higher level in mouse white adipose tissue than in brown adipose tissue (fig. 9). During CL316,243-induced adipocyte browning, protein expression levels of GSTM1 were slightly decreased and protein expression levels of GSTP1 were almost unchanged (fig. 10).
Example 4 knock-down of GSTM1 during differentiation of Vascular Stromal component (SVF) results in brown adipocyte-like features
4.1 materials
4.1.1 Male C57BL/6J mice (4-6week, Shanghai Slek laboratory animals Co., Ltd.)
4.1.2 penicillin and streptomycin (Gibco)
4.1.3 fetal bovine serum (Gibco)
4.1.4 Biotin (Sigma)
4.1.5DMEM/F12(1:1) medium (Gibco)
4.1.6NC Membrane (Millipore)
4.1.7 chemiluminescent reagent (Shanghai Ling Xiang)
4.1.8Si-GSTM1 oligonucleotide (Gima organism)
4.2 apparatus
4.2.1CO2 cell culture Box is Series II water Jacketed CO2incubator
4.2.2 high power microscope Olympus
4.2.3 ultrapure Water System Milli-Q is Millipore Corp
4.2.4 real-time fluorescent quantitative PCR instrument Roche LightCycler480(Switzerland)
4.2.5 protein electrophoresis apparatus BioRad
4.2.6 automated chemiluminescence apparatus ImageQuant LAS4000
4.3 solutions
4.3.1 culture Medium (differentiation and culture) of SVF
| DMEM/F12(1:1) | Up to 500ml |
| Fetal |
10% |
| Biotin | 8mg/ml |
| Penicillin | 100U/ml |
| Streptomycin | 100U/ml |
4.3.2 lysate used for cell protein extraction
| Tris-HCL(pH6.8) | 50mMol/ |
| SDS | |
| 2%(w/v) | |
| |
10%(w/v) |
| NaF | 10mMol/L |
| Na3VO4 | 100mMol/L |
4.4 methods
4.4.1 isolation, culture and differentiation of SVF
Inguinal fat of 4-6week C57BL/6 mice was taken, gently minced with scissors, and digested with collagenase at 37 ℃ for 40-45 minutes. Centrifuge at 2500rpm for 5 minutes. After resuspending the cells using F12/DMEM medium and slowly filtering with a 100 μm cell strainer, SVF cells were collected by centrifugation at 2500rpm for 5 minutes at room temperature and seeded in DMEM/F12 medium containing 20% FBS. The cells were cultured until growth contact inhibition, and differentiation induction was performed two days later. The specific process is as follows: induced with high-glucose F12/DMEM medium containing 10% FBS, 0.5mM 3-isobutyl-1-methylxanthine, 5. mu.g/mL insulin, 1. mu.M dexamethasone and 1. mu.M rosiglitazone, two days later replaced with high-glucose F12/DMEM medium containing 10% FBS, 5. mu.g/mL insulin and 1. mu.M rosiglitazone, culture was continued for two days, after which time the DMEM high-glucose medium containing 10% FBS was replaced every two days until differentiation into mature adipocytes.
4.4.2 knockdown of GSTM1 during SVF differentiation
During the differentiation of SVF cells, siRNA of transient transfection GSTM1 was performed while changing the culture medium two days before and two days after the treatment with the inducer until the cells were differentiated and matured.
4.4.3 extraction of total SVF cell protein and Western Blot
The method for extracting the total protein of the SVF is the same as 1.4.6, and the Western blot method and the antibody cargo number are the same as 1.4.7.
4.4.4 Total RNA extraction from cells and Q-PCR
The extraction method and subsequent QPCR refer to 1.4.4-1.4.5.
4.5 results
4.5.1 knocking down GSTM1 in the differentiation process of SVF Primary adipose precursor cells can induce SVF to obtain brown adipose-like morphological characteristics
And (3) carrying out protein knock-down of GSTM1 in the differentiation process of the SVF primary precursor adipocytes until the SVF cells are differentiated and mature, and carrying out oil red staining treatment. We found that the lipid droplets of the fat cells in the GSTM1 knockdown group were significantly smaller and characterized by multi-chambered lipid droplets compared to the standard differentiated control cells (see fig. 11).
4.5.2 knock-down of GSTM1 during SVF differentiation upregulated expression of brown fat-related genes
Q-PCR and Western Blot are used for detecting the expression of brown related genes in SVF cells after GSTM1 knockdown. We found elevated transcriptome expression levels of brown related genes such as UCP1 and Tbx1, as shown in fig. 12. Protein expression levels of UCP1 were also increased as shown in fig. 13. SVF is a primary adipogenic precursor cell that undergoes GSTM1 knockdown during its differentiation process, allowing SVF to differentiate in vitro into adipocytes with brown adipose characteristics.
Example 5 knock-down of GSTM1 in mouse inguinal adipose tissue with adenovirus promoted the browning phenotype in mouse inguinal adipose tissue
5.1 materials/reagents
5.1.1 Male C57BL/6J mice (4-6week, university of Nanjing model animal research institute)
5.1.2 mouse thermometer (physiotemp BAT-12)
5.1.3UCP1 antibody (Abcam, ab10983, 1:50)
5.1.4Si-GSTM1 oligonucleotide (Shanghai Jima pharmaceutical technology Co., Ltd.)
5.2 methods
5.2.1 packaging and amplification of Adenoviral
The adenovirus vector used for the GSTM1 knockdown was prepared from the ViraPower adenovirus expression system (Invitrogen, Carlsbad, Calif.) with shLacZ adenovirus expression vector as a negative control. The adenovirus is expressed and purified as described above, and the specific steps are as follows:
(1) before virus packaging, the adenovirus vector is cut by restriction enzyme Pac I, and an ITR sequence is exposed, so that the packaging of the adenovirus in HEK293A cells can be facilitated;
(2) HEK293A cells were inoculated into a 3.5cm dish, and when they grew to 90% confluency, they were transferred to 1. mu.g adenovirus vector using PEI, the medium was changed after 12 hours, and after 2 days of transfection, they were passaged to a 10cm dish for continuous culture. Then replacing the culture medium every 2 days, and observing the growth state of the cells under a microscope;
(3) after about 10 days of transfection, when the transfected cells begin to become round, bright and have poor state, the cells are suggested to begin to package the recombinant adenovirus. When about 80% of the cells become round and begin to fall off, the pipette blows the cells and collects them into a 15mL centrifuge tube. Freezing and storing the cell suspension at-80 deg.C (no less than 40 min), thawing at 37 deg.C (no more than 15 min), repeatedly freezing and thawing for 3 times, centrifuging at 3000rpm for 10 min, collecting supernatant, subpackaging, and freezing and storing at-80 deg.C for use;
(4) the supernatant collected at this time was P0 virus, and generally required further amplification before use in subsequent experiments. The method for amplifying the adenovirus comprises the following steps: HEK293A cells were passaged to 10cm dishes and approximately 80% of the cell state was observed to deteriorate or die after 2-3 days when 100. mu. L P0 generation adenovirus was added when the cells grew to 90% confluence. Collecting adenovirus according to the steps;
(5) adenovirus purification was accomplished using a kit (Sartorius, Germany).
5.2.2 feeding and administration of mice
The mice are raised in SPF grade experimental animal research center of the university of Compound Dan, the room temperature is maintained at 21-23 ℃, and the light-dark circulation is carried out every 12 hr. When the mice grew to 8 weeks of age, they were randomly divided into control and knockdown groups of 6 mice each. The knockdown of GSTM1 was performed by bilateral inguinal injection of purified adenovirus under conditions of feeding with normal feed. Control mice were injected with the same volume of shLacZ control virus 200 μ l on each side for a total of 3 injections within two weeks. The mice were then fasted, placed in a 4 ℃ incubator for cold exposure treatment, rectal temperature every 2 hours, and after 8 hours the mice were sacrificed by breaking the neck, inguinal fat was taken and subjected to histological analysis. Histological analysis including tissue fixation, paraffin embedding, sectioning, immunohistochemistry of UCP1 and HE staining experiments were entrusted to Shanghai Ruiyi Biotechnology Limited. The experimental method of Q-PCR is referred to as 1.4.4-1.4.5, and the experimental method of western is referred to as 1.4.6-1.4.7.
5.2.3 data analysis
Data differences were analyzed by Student T test method, and statistical differences were considered when p < 0.05.
5.3 results
After two groups of mice were exposed to 4 ℃ environment for 8 hours, white inguinal fat of the mice was taken out and subjected to immunohistochemical detection of UCP1, which indicated that subcutaneous fat of the mice in the knockdown group was significantly expressed by UCP1, and HE staining was significantly reduced in lipid droplets (fig. 14). QPCR and western results showed that after the GSTM1 was knocked down in the inguinal fat, the expression of browning-associated genes was increased and the protein level of UCP1 was increased (FIGS. 15-16). Indicating that the subcutaneous white adipose tissue appeared visibly browned after the knock-down of GSTM1 in the mouse inguinal fat.
Example 6 Etanenic acid inhibits high fat diet-induced weight gain in mice
6.1 materials
6.1.1 Male C57BL/6J mouse (4-6week) (Nanjing university model animal research center)
6.1.2 high fat diet (Research Diets, USA)
6.1.3 balance (Sartorius company, Germany)
6.1.4 Etanenic acid (Beijing Zhongke quality testing Biotechnology Co., Ltd.)
6.1.5 Castor oil (Sigma, USA)
6.2 methods
6.2.1 feeding and administration of mice
The C57BL/6 mice were housed in the SPF-class laboratory animal research center, university of Beden. The breeding temperature is maintained at 22 + -1 deg.C, the humidity is maintained at 45 + -10%, and light-dark circulation is performed every 12 hr. All mice were ready to receive water and food unless otherwise noted. The fat content of the high-fat feed used for the induced obesity mouse model is 60%.
Adult male C57BL/6J mice at 6-8 weeks were randomly divided into 2 groups (6-7/group) as a blank control group (PBS + 5% ethanol + 5% castor oil), ethacrynic acid treated group (5mg/kg), respectively. While feeding mice with a high-fat diet, the mice were treated by intraperitoneal administration, which was administered once a day for eight weeks, and the change in body weight of the mice was recorded every three days.
6.2.2 data analysis
Data differences were analyzed by Student T test method, and statistical differences were considered when p < 0.05.
6.3 results
Mice injected intraperitoneally with ethacrynic acid had significantly lower body weights than control mice, and the body weight differences between the two groups were statistically different, as shown in fig. 17A. The body weight gain of mice in the administered group was significantly slower than in the control group, as shown in fig. 17B. Therefore, the weight increase of the mice is obviously inhibited by injecting the ethacrynic acid into the abdominal cavity under the condition of high fat feeding.
Example 7 intraperitoneal injection of ethacrynic acid reduces adipose tissue content in mice fed with a high-fat diet
7.1 materials
7.1.1 Male C57BL/6J mice (4-6 weeks, Shanghai Si Laike laboratory animals Co., Ltd.)
7.1.2 high fat diet (Research Diets, USA)
7.1.3 Paraformaldehyde (4%, Sigma)
7.1.4 Etanenic acid (Beijing Zhongke quality testing Biotechnology Co., Ltd.)
7.1.5 Castor oil (Sigma)
7.1.6NMR (Bruker, Germany)
7.2 methods
7.2.1 mice raising, drug delivery and adipose tissue content detection
The C57BL/6 mice were housed in the laboratory of SPF-grade laboratory animal research center, university of double denier. The breeding temperature is maintained at 22 + -1 deg.C, the humidity is maintained at 45 + -10%, and light-dark circulation is performed every 12 hours. All mice were given access to water and food at any time, unless otherwise noted. The fat content of the high-fat feed used for the induced obesity mouse model is 60%.
Adult male C57BL/6J mice at 6-8 weeks were randomly divided into 2 groups (6-7/group) as a blank control group (PBS + 5% ethanol + 5% castor oil), ethacrynic acid treated group (5mg/kg), respectively. While feeding mice with a high-fat diet, the mice were treated by intraperitoneal administration, once a day for eight weeks.
After 8 weeks of administration, each treatment group of mice was examined for nmr. The mice were sacrificed by cervical dislocation, and inguinal fat (subcutaneous fat), epididymal fat (visceral fat), and interscapular brown fat (BAT) of the mice were dissected out.
7.2.2 data analysis
Data differences were analyzed by Student's T test method, and statistical differences were considered when p < 0.05.
7.3 results
Intraperitoneal injection of ethacrynic acid significantly improved high fat diet-induced body abnormalities in mice (fig. 18A). After 2 months of administration, the mice were sacrificed by cervical dislocation, and the inguinal white fat, epididymal white fat and scapular brown fat of the mice were separately stripped off, and it was found that the volume of adipose tissue of the mice intraperitoneally injected with ethacrynic acid (fig. 18B) was significantly smaller than that of the control mice. In addition, the nuclear magnetic resonance results show that the body fat content of the mice in the ethacrynic acid treatment group is obviously lower than that of the control group, and the muscle tissue content is obviously higher than that of the control group (fig. 18C). Therefore, the mice fat accumulation caused by high fat diet can be effectively inhibited by injecting ethacrynic acid into the abdominal cavity.
Example 8 intraperitoneal injection of ethacrynic acid can relieve blood sugar and blood lipid abnormality of mice fed with high-fat diet
8.1 materials
8.1.1 Male C57BL/6J mice (4-6 weeks, Shanghai Si Laike laboratory animals Co., Ltd.)
8.1.2 high fat diet (Research Diets, USA)
8.1.3 micro blood collection tube
8.1.4 Etanenic acid (Beijing Zhongke quality testing Biotechnology Co., Ltd.)
8.1.5 Castor oil (Sigma)
8.1.6 Isoflurane
8.1.7 blood sugar test paper (Roche)
8.1.8 blood sugar monitor (Roche)
8.2 methods
8.2.1 feeding and administration of mice
The C57BL/6 mice were housed in the laboratory of SPF-grade laboratory animal research center, university of double denier. The breeding temperature is maintained at 22 + -1 deg.C, the humidity is maintained at 45 + -10%, and light-dark circulation is performed every 12 hr. All mice were given access to water and food at any time, unless otherwise noted. The fat content of the high-fat feed used for the induced obesity mouse model is 60%.
Adult male C57BL/6J mice at 6-8 weeks were randomly divided into 2 groups (6-7/group) as a blank control group (PBS + 5% ethanol + 5% castor oil) and an ethacrynic acid-treated group (5 mg/kg). While feeding mice with a high-fat diet, the mice were treated by intraperitoneal administration, once a day for eight weeks.
8.2.2 detection of mouse serological indicators
After 8 weeks of administration treatment, the mice were anesthetized with isoflurane, blood was taken from the canthus veins in the eyes of the mice using a micro blood collection tube, serum was taken after centrifugation, and then various biochemical indicators in the serum were detected and analyzed by a full-automatic biochemical analyzer.
8.2.3 data analysis
Data differences were analyzed using the Student T test method and were considered statistically significant when p < 0.05.
8.3 results
We found through experiments that there was a significant decrease in random blood glucose, fasting blood glucose levels, and triglyceride levels in blood in the ethacrynic acid-treated mice compared to the control mice (fig. 19).
Example 9 intraperitoneal injection of ethacrynic acid can significantly improve the decrease in glucose tolerance and insulin tolerance in high-fat diet-induced obese mice
9.1 materials
9.1.1 female C57BL/6J mice (4-6 weeks, Shanghai slyke laboratory animals Co., Ltd.)
9.1.2 high fat diet (Research Diets, USA)
9.1.3 Etanenic acid (Beijing Zhongke quality testing Biotechnology Co., Ltd.)
9.1.4 Castor oil (Sigma)
9.1.5 blood sugar test paper (Roche)
9.1.6 blood sugar monitor (Roche)
9.2 Experimental methods
9.2.1 feeding and administration of mice
The C57BL/6 mice were housed in the SPF-class laboratory animal research center, university of Beden. The breeding temperature is maintained at 22 + -1 deg.C, the humidity is maintained at 45 + -10%, and light-dark circulation is performed every 12 hours. All mice were ready to receive water and food unless otherwise noted. The fat content of the high-fat feed used for the induced obesity mouse model is 60%.
Adult male C57BL/6J mice at 6-8 weeks were randomly divided into 2 groups (6-7/group) as a blank control group (PBS + 5% ethanol + 5% castor oil), ethacrynic acid treated group (5mg/kg), respectively. While feeding mice with a high-fat diet, the mice were treated by intraperitoneal administration, once a day for eight weeks.
9.2.2 Glucose Tolerance Test (GTT) and insulin resistance test (ITT)
Glucose Tolerance Test (GTT): after the mice were fasted for 16 hours, 2mg/kg body weight of glucose injection was intraperitoneally injected, and the levels of tail vein blood glucose of the mice were measured at 0min, 30 min, 60 min, 90 min, and 120 min after the injection, respectively, to evaluate the glucose tolerance of the mice of different treatment groups.
Insulin resistance test (ITT): after fasting treatment for 4 hours, the mice were intraperitoneally injected with 0.75U/kg body weight of insulin, and at 0min, 30 min, 60 min, 90 min, and 120 min after the injection, tail vein blood glucose levels of the mice were measured to evaluate insulin resistance of the mice of different treatment groups.
9.2.3 data analysis
Data differences were analyzed using the Student T test method and were considered statistically significant when p < 0.05.
9.3 results
As shown in fig. 20, in the high fat diet-induced obesity mouse model, the intraperitoneal injection of ethacrynic acid significantly improved the abnormal conditions of glucose tolerance (fig. 20A) and insulin resistance (fig. 20B) in the mice.
Example 10 intraperitoneal injection of ethacrynic acid can enhance oxygen and energy consumption in high fat diet-induced obese mice
10.1 materials and instruments
10.1.1 Male C57BL/6J mice (4-6 weeks, Shanghai Si Laike laboratory animals Co., Ltd.)
10.1.2 high fat diet (Research Diets, USA)
10.1.3 Etanenic acid (Beijing Zhongke quality testing Biotechnology Co., Ltd.)
10.1.4 Castor oil (Sigma)
10.1.5 Small animal metabolism monitoring System: (Columbus company, USA)
10.2 method
10.2.1 mice raising and drug treatment
The C57BL/6 mice were housed in the SPF-class laboratory animal research center, university of Beden. The breeding temperature is maintained at 22 + -1 deg.C, the humidity is maintained at 45 + -10%, and light-dark circulation is performed every 12 hr. All mice were ready to receive water and food unless otherwise noted. The fat content of the high-fat diet used for the induced obesity mouse model was 60%.
Adult male C57BL/6J mice at 6-8 weeks were randomly divided into 2 groups (6-7/group) as a blank control group (PBS + 5% ethanol + 5% castor oil), ethacrynic acid treated group (5mg/kg), respectively. While feeding mice with a high-fat diet, the mice were treated by intraperitoneal administration, once a day for eight weeks.
10.2.2 monitoring of energy metabolism in mice
The energy metabolism analysis and the monitoring of the day and night activities were carried out on mice of different treatment groups using a small animal metabolism monitoring system (metabolism cage), with a total monitoring time of 72 hours.
10.2.3 data analysis
Data differences were analyzed using the Student T test method and were considered statistically significant when p < 0.05.
10.3 results
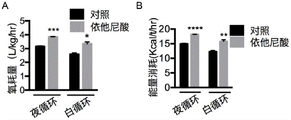
As shown in fig. 21, both oxygen consumption and energy consumption in the white circulation of the mice of the ethacrynic acid-treated group were significantly increased compared to the blank control mice in the high fat diet-induced obese mouse model.
Example 11 intraperitoneal injection of Etanenic acid enhances Cold tolerance in high fat diet-induced obese mice
11.1 materials and instruments
11.1.1 Male C57BL/6J mice (4-6 weeks, Shanghai slyke laboratory animals Co., Ltd.)
11.1.2 high fat diet (Research Diets, USA)
11.1.3 Etanenic acid (Beijing Zhongke quality testing Biotechnology Co., Ltd.)
11.1.4 Castor oil (Sigma)
11.1.5 mouse rectum temperature detector (Physitemp, USA)
11.2 methods
11.2.1 feeding and administration treatment of mice
The C57BL/6 mice were housed in the laboratory of SPF-grade laboratory animal research center, university of double denier. The breeding temperature is maintained at 22 + -1 deg.C, the humidity is maintained at 45 + -10%, and light-dark circulation is performed every 12 hr. All mice were given access to water and food at any time, unless otherwise noted. The fat content of the high-fat feed used for the induced obesity mouse model is 60%.
Adult male C57BL/6J mice at 6-8 weeks were randomly divided into 2 groups (6-7/group) as a blank control group (PBS + 5% ethanol + 5% castor oil), ethacrynic acid treated group (5mg/kg), respectively. While feeding mice with a high-fat diet, the mice were treated by intraperitoneal administration, once a day for eight weeks.
11.2.2 rectal temperature monitoring of mice under cold exposure
Mice from different treatment groups were treated with 4 ℃ cold exposure for a total of 8 hours, and the rectal temperature of the mice was monitored every two hours.
11.2.3 data analysis
Data differences were analyzed using the Student T test method and were considered statistically significant when p < 0.05.
11.3 results
As shown in fig. 22, in the high fat diet-induced obese mouse model, the body temperature of the mice in the different treatment groups was significantly higher than that in the control group when the mice in the etaniic acid treatment group were subjected to cold exposure treatment, although the body temperature of both groups of mice was gradually decreased with time, at 6 hours and 8 hours of cold exposure, indicating that the ability of the etaniic acid treatment group to store the body temperature was higher than that in the control group when the mice in the etaniic acid treatment group were subjected to low-temperature stimulation, and the cold tolerance was increased, indicating that the function of the thermogenic adipose tissue of the body was enhanced and the thermogenesis of the body was increased.
Example 12 intraperitoneal injection of ethacrynic acid can promote browning of white fat in high-fat diet-induced obese mice
12.1 materials and instruments
12.1.1 female C57BL/6J mice (4-6 weeks, Shanghai Slek laboratory animals Co., Ltd.)
12.1.2 high fat diet (Research Diets, USA)
12.1.3 Etanenic acid (Beijing Zhongke quality testing Biotechnology Co., Ltd.)
12.1.4 Castor oil (Sigma)
12.1.5 tissue grinding machine (TissueLyser-24)
12.2 methods
12.2.1 mice raising and drug administration treatment
The C57BL/6 mice were housed in the laboratory of SPF-grade laboratory animal research center, university of double denier. The breeding temperature is maintained at 22 + -1 deg.C, the humidity is maintained at 45 + -10%, and light-dark circulation is performed every 12 hr. All mice were ready to receive water and food unless otherwise noted. The fat content of the high-fat feed used for the induced obesity mouse model is 60%.
Adult male C57BL/6J mice at 6-8 weeks were randomly divided into 2 groups (6-7/group) as a blank control group (PBS + 5% ethanol + 5% castor oil), ethacrynic acid treated group (5mg/kg), respectively. While feeding mice with a high-fat diet, the mice were treated by intraperitoneal administration, once a day for eight weeks.
12.2.2 detection of genes related to browning of white fat
After 8 weeks of administration, the mice of each treatment group were subjected to cold exposure treatment at 4 ℃ for a total of eight hours. The mice were then sacrificed by cervical dislocation and their inguinal adipose tissue, visceral adipose tissue and scapular brown adipose tissue were sequentially taken. Each tissue is divided into two parts, one part is subjected to tissue grinding, then tissue protein and RNA are extracted, western blotting and Q-PCR are respectively carried out to detect the expression of related proteins, and the other part is fixed in 4% paraformaldehyde to carry out subsequent HE staining and UCP1 staining analysis.
12.2.3 data analysis
Data differences were analyzed using the Student T test method and were considered statistically significant when p < 0.05.
12.3 results
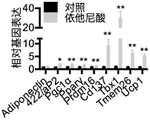
As shown in fig. 23A, in white adipose tissue of mice treated with ethacrynic acid, the gene expression level of UCP1 and other related browning related proteins such as CD137 and PRDM16 was increased, and the expression level of UCP1 protein in white adipose tissue of mice treated with ethacrynic acid was also significantly increased (fig. 23B). The inguinal white adipose tissues of the mice of each treatment group were HE-stained, and the adipose tissues were immunohistochemically stained using an antibody to UCP 1. From the staining results, it can be seen that the white adipose tissue of the mice treated with ethacrynic acid had a smaller volume of adipocytes and a significantly reduced lipid accumulation. In addition, UCP1 was deeply stained in white adipose tissue of the ethacrynic acid-treated mice to some extent, indicating that protein expression of UCP1 was increased (fig. 23C), and significant browning of white adipose tissue in groin occurred.
Example 13 Etanenic acid can reduce body weight in high fat diet-induced obese mice (DIO)
13.1 materials
13.1.1 female C57BL/6J mouse (4-6week) (Nanjing university model animal research center)
13.1.2 high fat diet (Research Diets, USA)
13.1.3 balance (Sartorius company, Germany)
13.1.4 Etanenic acid (Beijing Zhongke quality testing Biotechnology Co., Ltd.)
13.1.5 Castor oil (Sigma Co., USA)
13.2 methods
13.2.1 mouse raising and administration
The C57BL/6 mice were housed in the SPF-class laboratory animal research center, university of Beden. The breeding temperature is maintained at 22 + -1 deg.C, the humidity is maintained at 45 + -10%, and light-dark circulation is performed every 12 hr. All mice were ready to receive water and food unless otherwise noted. The fat content of the high-fat diet used for the induced obesity mouse model was 60%.
Adult male C57BL/6J mice were raised for 2 months on a high-fat diet for 6-8 weeks, and a model of type ii diabetes and obesity mice (i.e., DIO mice) was constructed. DIO mice were randomly divided into 2 groups (7/group) as a blank control group (PBS + 5% ethanol + 5% castor oil), ethacrynic acid treated group (5mg/kg), respectively. Mice were treated by intraperitoneal administration, once daily for 4 weeks, and the body weight changes were recorded every third day.
13.2.2 data analysis
Data differences were analyzed using the Student T test method and were considered statistically significant when p < 0.05.
13.3 results
As shown in fig. 24A, the body weight of the mice of the ethacrynic acid-treated group was significantly lower than that of the control group in the DIO mouse model. The weight loss in DIO mice was increasingly significant with prolonged dosing time (figure 24B).
Example 14 intraperitoneal injection of ethacrynic acid can significantly reduce the adipose tissue content in DIO mice
14.1 materials
14.1.1 female C57BL/6J mice (4-6 weeks, Shanghai Slek laboratory animals Co., Ltd.)
14.1.2 high fat fodder (Research Diets, USA)
14.1.3 Etanenic acid (Beijing Zhongke quality testing Biotechnology Co., Ltd.)
14.1.4 Castor oil (Sigma)
14.1.5NMR (Bruker, Germany)
14.2 methods
14.2.1 mouse raising, administration and fat tissue content detection
The C57BL/6 mice were housed in the SPF-class laboratory animal research center, university of Beden. The breeding temperature is maintained at 22 + -1 deg.C, the humidity is maintained at 45 + -10%, and light-dark circulation is performed every 12 hr. All mice were ready to receive water and food unless otherwise noted. The fat content of the high-fat diet used for the induced obesity mouse model was 60%.
Adult male C57BL/6J mice were raised for 2 months on a high-fat diet for 6-8 weeks, and a model of type ii diabetes and obesity mice (i.e., DIO mice) was constructed. DIO mice were randomly divided into 2 groups (7/group) as a blank control group (PBS + 5% ethanol + 5% castor oil), ethacrynic acid treated group (5mg/kg), respectively. Mice were treated with intraperitoneal administration, once daily for 4 weeks.
After 4 weeks of administration, each treatment group of mice was examined for the presence of nuclear magnetic resonance to determine the level of fat and muscle content. The mice were sacrificed by cervical dislocation, and inguinal fat (subcutaneous fat), epididymal fat (visceral fat), and interscapular brown fat (BAT) were dissected out.
14.2.2 data analysis
Data differences were analyzed by Student T test method, and statistical differences were considered when p < 0.05.
14.3 results
The intraperitoneal injection of ethacrynic acid significantly improved the body abnormality of DIO mice (fig. 25A). After 4 weeks of administration, the mice were sacrificed by cervical dislocation, and the inguinal white fat, epididymal white fat and scapular brown fat of the mice were stripped off, respectively, and it was found that the volume of adipose tissues of the mice in the group to which ethacrynic acid was intraperitoneally injected (fig. 25B) was significantly smaller than that of the control group. In addition, it can be seen from the nuclear magnetic resonance results that the body fat content of the mice in the ethacrynic acid-treated group is significantly lower than that of the control group, and the muscle tissue content is significantly higher than that of the control group (fig. 25C). Therefore, the fat accumulation of DIO mice can be effectively inhibited by injecting ethacrynic acid into the abdominal cavity.
Example 15 intraperitoneal injection of ethacrynic acid can improve sugar metabolism disorder of DIO mice
15.1 materials
15.1.1 female C57BL/6J mice (4-6 weeks, Shanghai slyke laboratory animals Co., Ltd.)
15.1.2 high fat diet (Research Diets, USA)
15.1.3 Etanenic acid (Beijing Zhongke quality testing Biotechnology Co., Ltd.)
15.1.4 Castor oil (Sigma)
15.1.5 blood sugar test paper (Roche)
15.1.6 blood sugar monitor (Roche)
15.2 method
15.2.1 mouse raising and administration
The C57BL/6 mice were housed in the SPF-class laboratory animal research center, university of Beden. The breeding temperature is maintained at 22 + -1 deg.C, the humidity is maintained at 45 + -10%, and light-dark circulation is performed every 12 hr. All mice were ready to receive water and food unless otherwise noted. The fat content of the high-fat feed used for the induced obesity mouse model is 60%.
Adult male C57BL/6J mice were raised for 2 months on a high-fat diet for 6-8 weeks, and a mouse model for type ii diabetes and obesity (i.e., DIO mice) was constructed. DIO mice were randomly divided into 2 groups (7/group) as a placebo group (PBS + 5% ethanol + 5% castor oil) and an ethacrynic acid-treated group (5 mg/kg). Mice were treated with intraperitoneal administration, once daily for 4 weeks.
15.2.2 detection of fasting plasma glucose, random plasma glucose, GTT, ITT in DIO mice
After 4 weeks of ethacrynic acid treatment of DIO mice, blood was collected from the mouse tail vein, and random blood glucose and fasting glucose of the mice were measured using a glucometer.
GTT: after the DIO mice are fasted for 16 hours, injecting glucose injection with 2mg/kg body weight into the abdominal cavity, and detecting the tail vein blood sugar level of the mice at 0 minute, 30 minutes, 60 minutes, 90 minutes and 120 minutes after the injection to evaluate the glucose tolerance of the mice of different treatment groups;
ITT: DIO mice were treated with insulin at 0.75U/kg body weight intraperitoneally after 4 hours of fasting, and the level of tail vein blood glucose was measured at 0min, 30 min, 60 min, 90 min, and 120 min after injection to evaluate the insulin resistance of mice in different treatment groups;
15.2.3 data analysis
Data differences were analyzed using the Student T test method and were considered statistically significant when p < 0.05.
15.3 results
As shown in fig. 26A, in DIO mouse model, there was a significant decrease in both random and fasting blood glucose in the ethacrynic acid-treated mice compared to the control mice. In addition, intraperitoneal injection of ethacrynic acid also improved glucose tolerance (fig. 26B) and insulin resistance (fig. 26C) abnormalities in DIO mice.
Example 16 intraperitoneal injection of Etanenic acid enhances oxygen and energy consumption in DIO mice
16.1 materials and instruments
16.1.1 female C57BL/6J mouse (4-6 weeks, Shanghai slyke laboratory animals Co., Ltd.)
16.1.2 high fat fodder (Research Diets, USA)
16.1.3 Etanenic acid (Beijing Zhongke quality testing Biotechnology Co., Ltd.)
16.1.4 Castor oil (Sigma)
16.1.5 Small animal metabolism monitoring System: (Columbus company, USA)
16.2 methods
16.2.1 mouse raising and administration
The C57BL/6 mice were housed in the SPF-class laboratory animal research center, university of Beden. The breeding temperature is maintained at 22 + -1 deg.C, the humidity is maintained at 45 + -10%, and light-dark circulation is performed every 12 hr. All mice were ready to receive water and food unless otherwise noted. The fat content of the high-fat diet used for the induced obesity mouse model was 60%.
Adult male C57BL/6J mice were raised for 2 months on a high-fat diet for 6-8 weeks, and a mouse model for type ii diabetes and obesity (i.e., DIO mice) was constructed. DIO mice were randomly divided into 2 groups (7/group) as a blank control group (PBS + 5% ethanol + 5% castor oil), ethacrynic acid treated group (5mg/kg), respectively. Mice were treated with intraperitoneal administration, once daily for 4 weeks.
16.2.2 monitoring of energy metabolism in DIO mice
The energy metabolism analysis and the monitoring of the day and night activities were carried out on mice of different treatment groups using a small animal metabolism monitoring system (metabolism cage) for a total of 72 hours.
16.2.3 data analysis
Data differences were analyzed using the Student T test method and were considered statistically significant when p < 0.05.
16.3 results
As shown in fig. 27, in the DIO mouse model, oxygen consumption and energy consumption in both white and night cycles were significantly increased in the ethacrynic acid-treated mice compared to the blank control mice.
Example 17 intraperitoneal injection of ethacrynic acid can promote browning of white fat in DIO mice
17.1 materials and instruments
17.1.1 female C57BL/6J mouse (4-6 weeks, Shanghai Si Laike laboratory animals Co., Ltd.)
17.1.2 high fat diet (Research Diets, USA)
17.1.3 Etanenic acid (Beijing Zhongke quality testing Biotechnology Co., Ltd.)
17.1.4 Castor oil (Sigma)
17.1.5 tissue grinding machine (TissueLyser-24)
17.2 methods
17.2.1 mice raising and drug treatment
The C57BL/6 mice were housed in the SPF-class laboratory animal research center, university of Beden. The breeding temperature is maintained at 22 + -1 deg.C, the humidity is maintained at 45 + -10%, and light-dark circulation is performed every 12 hr. All mice were given access to water and food at any time, unless otherwise noted. The fat content of the high-fat feed used for the induced obesity mouse model is 60%.
Adult male C57BL/6J mice were raised for 2 months on a high-fat diet for 6-8 weeks, and a model of type ii diabetes and obesity mice (i.e., DIO mice) was constructed. DIO mice were randomly divided into 2 groups (7/group) as a blank control group (PBS + 5% ethanol + 5% castor oil), ethacrynic acid treated group (5mg/kg), respectively. Mice were treated with intraperitoneal administration, once daily for 4 weeks.
17.2.2 detection of genes associated with Brown color of white fat
After 4 weeks of ethacrynic acid treatment, mice were exposed to cold in a 4 ℃ freezer for 8 hours. The mice were then sacrificed by cervical dislocation and their inguinal adipose tissue, visceral adipose tissue, and scapular brown adipose tissue were sequentially dissected away. Each tissue is divided into two parts, one part is subjected to tissue grinding, then tissue protein and RNA are extracted, western blotting and Q-PCR are respectively carried out to detect the expression of related proteins, and the other part is fixed in 4% paraformaldehyde to carry out subsequent HE staining and UCP1 staining analysis.
17.2.3 data analysis
Data differences were analyzed using the Student T test method and were considered statistically significant when p < 0.05.
17.3 results
As shown in fig. 28A, increased UCP1 gene expression was detected in white adipose tissue of ethacrynic acid-treated DIO mice. The inguinal white adipose tissues of the mice of each treatment group were HE-stained, and the adipose tissues were immunohistochemically stained using an antibody to UCP 1. From the staining results, it can be seen that the white adipose tissue of the mice treated with ethacrynic acid had a smaller volume of adipocytes and a significantly reduced lipid accumulation. In addition, UCP1 was deeply stained in white adipose tissue of the ethacrynic acid-treated mice to some extent, indicating that protein expression of UCP1 was increased (fig. 28B), and white fat in groin of DIO mice was significantly browned.
Sequence listing
<110> university of Compound Dan
Application of <120> ethacrynic acid in preparing medicine for treating and preventing obesity and related metabolic diseases
<130> 001
<160> 34
<170> SIPOSequenceListing 1.0
<210> 1
<211> 23
<212> DNA
<213> Artificial Sequence (Artificial Sequence)
<400> 1
ggcccttgta aacaacaaaa tac 23
<210> 2
<211> 23
<212> DNA
<213> Artificial Sequence (Artificial Sequence)
<400> 2
ggcaacaaga gctgacagta aat 23
<210> 3
<211> 23
<212> DNA
<213> Artificial Sequence (Artificial Sequence)
<400> 3
accatgacta ctgtcagtca ctc 23
<210> 4
<211> 22
<212> DNA
<213> Artificial Sequence (Artificial Sequence)
<400> 4
gtcacaggag gcatctttga ag 22
<210> 5
<211> 21
<212> DNA
<213> Artificial Sequence (Artificial Sequence)
<400> 5
tgttcctctt aatcctgccc a 21
<210> 6
<211> 21
<212> DNA
<213> Artificial Sequence (Artificial Sequence)
<400> 6
ccaacctgca caagttccct t 21
<210> 7
<211> 19
<212> DNA
<213> Artificial Sequence (Artificial Sequence)
<400> 7
cctttgtggg aacctggaa 19
<210> 8
<211> 18
<212> DNA
<213> Artificial Sequence (Artificial Sequence)
<400> 8
<210> 9
<211> 22
<212> DNA
<213> Artificial Sequence (Artificial Sequence)
<400> 9
atacataaag tccttcccgc tg 22
<210> 10
<211> 22
<212> DNA
<213> Artificial Sequence (Artificial Sequence)
<400> 10
gtgatttgtc cgttgtcttt cc 22
<210> 11
<211> 19
<212> DNA
<213> Artificial Sequence (Artificial Sequence)
<400> 11
ccaccagcga ggacttcac 19
<210> 12
<211> 21
<212> DNA
<213> Artificial Sequence (Artificial Sequence)
<400> 12
ggaggactct cgtagctcga a 21
<210> 13
<211> 20
<212> DNA
<213> Artificial Sequence (Artificial Sequence)
<400> 13
<210> 14
<211> 18
<212> DNA
<213> Artificial Sequence (Artificial Sequence)
<400> 14
<210> 15
<211> 21
<212> DNA
<213> Artificial Sequence (Artificial Sequence)
<400> 15
atcttcagag cagttcaagg g 21
<210> 16
<211> 21
<212> DNA
<213> Artificial Sequence (Artificial Sequence)
<400> 16
gctttgtccc tttcctaaac g 21
<210> 17
<211> 20
<212> DNA
<213> Artificial Sequence (Artificial Sequence)
<400> 17
<210> 18
<211> 19
<212> DNA
<213> Artificial Sequence (Artificial Sequence)
<400> 18
tgtcatctac gggcacaaa 19
<210> 19
<211> 21
<212> DNA
<213> Artificial Sequence (Artificial Sequence)
<400> 19
ctctggtagc ggacattaca c 21
<210> 20
<211> 20
<212> DNA
<213> Artificial Sequence (Artificial Sequence)
<400> 20
<210> 21
<211> 22
<212> DNA
<213> Artificial Sequence (Artificial Sequence)
<400> 21
gttcttgaag accatccctg ag 22
<210> 22
<211> 21
<212> DNA
<213> Artificial Sequence (Artificial Sequence)
<400> 22
gggctcaaac atacggtact g 21
<210> 23
<211> 21
<212> DNA
<213> Artificial Sequence (Artificial Sequence)
<400> 23
<210> 24
<211> 21
<212> DNA
<213> Artificial Sequence (Artificial Sequence)
<400> 24
tggcgatgta gttgagaatg g 21
<210> 25
<211> 21
<212> DNA
<213> Artificial Sequence (Artificial Sequence)
<400> 25
ccagatgacc cgtacaagaa g 21
<210> 26
<211> 22
<212> DNA
<213> Artificial Sequence (Artificial Sequence)
<400> 26
gttcggagag tcttcctttc tc 22
<210> 27
<211> 21
<212> DNA
<213> Artificial Sequence (Artificial Sequence)
<400> 27
cgcatcctgg aactcttcta c 21
<210> 28
<211> 22
<212> DNA
<213> Artificial Sequence (Artificial Sequence)
<400> 28
ccgcaactgc agctttatat tc 22
<210> 29
<211> 20
<212> DNA
<213> Artificial Sequence (Artificial Sequence)
<400> 29
<210> 30
<211> 21
<212> DNA
<213> Artificial Sequence (Artificial Sequence)
<400> 30
<210> 31
<211> 22
<212> DNA
<213> Artificial Sequence (Artificial Sequence)
<400> 31
gatgaggtat ccatggctga tg 22
<210> 32
<211> 22
<212> DNA
<213> Artificial Sequence (Artificial Sequence)
<400> 32
gttgatgtga ctgatggtag gg 22
<210> 33
<211> 20
<212> DNA
<213> Artificial Sequence (Artificial Sequence)
<400> 33
<210> 34
<211> 18
<212> DNA
<213> Artificial Sequence (Artificial Sequence)
<400> 34
Claims (1)
1. Use of ethacrynic acid in the preparation of a medicament for the prevention or treatment of obesity in a body.
Priority Applications (1)
| Application Number | Priority Date | Filing Date | Title |
|---|---|---|---|
| CN201811134227.XA CN109172559B (en) | 2018-09-27 | 2018-09-27 | Application of ethacrynic acid in preparing medicine for treating and preventing obesity and related metabolic diseases |
Applications Claiming Priority (1)
| Application Number | Priority Date | Filing Date | Title |
|---|---|---|---|
| CN201811134227.XA CN109172559B (en) | 2018-09-27 | 2018-09-27 | Application of ethacrynic acid in preparing medicine for treating and preventing obesity and related metabolic diseases |
Publications (2)
| Publication Number | Publication Date |
|---|---|
| CN109172559A CN109172559A (en) | 2019-01-11 |
| CN109172559B true CN109172559B (en) | 2022-08-19 |
Family
ID=64906596
Family Applications (1)
| Application Number | Title | Priority Date | Filing Date |
|---|---|---|---|
| CN201811134227.XA Active CN109172559B (en) | 2018-09-27 | 2018-09-27 | Application of ethacrynic acid in preparing medicine for treating and preventing obesity and related metabolic diseases |
Country Status (1)
| Country | Link |
|---|---|
| CN (1) | CN109172559B (en) |
Families Citing this family (1)
| Publication number | Priority date | Publication date | Assignee | Title |
|---|---|---|---|---|
| CN115778968A (en) * | 2021-04-27 | 2023-03-14 | 中国科学院南海海洋研究所 | Application of natural product in preparing medicine for treating obesity and related metabolic diseases |
Citations (3)
| Publication number | Priority date | Publication date | Assignee | Title |
|---|---|---|---|---|
| CN105624288A (en) * | 2016-03-16 | 2016-06-01 | 上海中优生物高科技有限责任公司 | Toxin accumulation type obese gene individual treatment composition and preparing method and system thereof |
| CN106924736A (en) * | 2017-05-09 | 2017-07-07 | 北京师范大学 | Gp130 inhibitor is preparing the application in intervening and treating fat caused metabolism of blood glucose disease product |
| CN107349198A (en) * | 2016-05-10 | 2017-11-17 | 复旦大学 | Artemether is preparing the purposes in promoting lipolysis and improving glycometabolism preparation |
-
2018
- 2018-09-27 CN CN201811134227.XA patent/CN109172559B/en active Active
Patent Citations (3)
| Publication number | Priority date | Publication date | Assignee | Title |
|---|---|---|---|---|
| CN105624288A (en) * | 2016-03-16 | 2016-06-01 | 上海中优生物高科技有限责任公司 | Toxin accumulation type obese gene individual treatment composition and preparing method and system thereof |
| CN107349198A (en) * | 2016-05-10 | 2017-11-17 | 复旦大学 | Artemether is preparing the purposes in promoting lipolysis and improving glycometabolism preparation |
| CN106924736A (en) * | 2017-05-09 | 2017-07-07 | 北京师范大学 | Gp130 inhibitor is preparing the application in intervening and treating fat caused metabolism of blood glucose disease product |
Non-Patent Citations (7)
| Title |
|---|
| Carbohydrate Metabolism During Treatment with Chlorthalidone and Ethacrynic Acid;O.ortved andersen;《British medical journal》;19680629;全文 * |
| Celastrol Protects against Obesity and Metabolic;xinran ma;《cell metabolism》;20151006;全文 * |
| Comparative Studies of Substrate and InhibitorSpecificity of Glutathione S-Transferases in Six Tissues of Oxya chinensis;wu haihua;《Agricultural Sciences in China》;20080430;第7卷(第4期);全文 * |
| Competitive profiling of celastrol targets in human cervical cancer HeLa cells via quantitative chemical proteomics;yiqing zhou;《molecular biosystems》;20161107;全文 * |
| α,β-不饱和酮衍生物的设计合成及活性研究;王小兵;《中国优秀硕士学位论文全文数据库 医药卫生科技辑》;20061231;全文 * |
| 白色脂肪细胞棕色化:肥胖症及其相关代谢性疾病治疗的新靶点;王相清等;《医学综述》;20130520(第10期);全文 * |
| 白藜芦醇改善高脂饮食小鼠的糖代谢并棕化腹股沟白色脂肪;周逸亭等;《上海医药》;20140110(第01期);全文 * |
Also Published As
| Publication number | Publication date |
|---|---|
| CN109172559A (en) | 2019-01-11 |
Similar Documents
| Publication | Publication Date | Title |
|---|---|---|
| Cipriani et al. | Change in populations of macrophages promotes development of delayed gastric emptying in mice | |
| Guo et al. | Taurine-mediated browning of white adipose tissue is involved in its anti-obesity effect in mice | |
| Yu et al. | MicroRNA-125b-5p improves pancreatic β-cell function through inhibiting JNK signaling pathway by targeting DACT1 in mice with type 2 diabetes mellitus | |
| Chen et al. | Carbohydrate response element‐binding protein regulates lipid metabolism via mTOR complex1 in diabetic nephropathy | |
| Han et al. | Chlorogenic acid stimulates the thermogenesis of brown adipocytes by promoting the uptake of glucose and the function of mitochondria | |
| JP2019521085A (en) | Artemisinin analogues and uses, methods and compositions for promoting lipid catabolism and for improving glucose metabolism | |
| Qu et al. | SIRT2 inhibits oxidative stress and inflammatory response in diabetic osteoarthritis. | |
| Feng et al. | The ameliorative effect of melatonin on LPS-induced Sertoli cells inflammatory and tight junctions damage via suppression of the TLR4/MyD88/NF-κB signaling pathway in newborn calf | |
| Huo et al. | Downregulated lncRNA-MIAT confers protection against erectile dysfunction by downregulating lipoprotein lipase via activation of miR-328a-5p in diabetic rats | |
| Wang et al. | Thyroid hormone (T3) is involved in inhibiting the proliferation of newborn calf Sertoli cells via the PI3K/Akt signaling pathway in vitro | |
| Chen et al. | Reduction of motion sickness through targeting histamine N-methyltransferase in the dorsal vagal complex of the brain | |
| Hou et al. | Taurine transporter regulates adipogenic differentiation of human adipose-derived stem cells through affecting Wnt/β-catenin signaling pathway | |
| Gao et al. | Schisandrin A protects against isoproterenol‑induced chronic heart failure via miR‑155 | |
| CN109172559B (en) | Application of ethacrynic acid in preparing medicine for treating and preventing obesity and related metabolic diseases | |
| Li et al. | Ellagic acid alters muscle Fiber-type composition and promotes mitochondrial biogenesis through the AMPK signaling pathway in healthy pigs | |
| Wang et al. | TBC domain family 7-like enhances the tolerance of Penaeus vannamei to ammonia nitrogen by the up-regulation of autophagy | |
| Zhao et al. | AdipoRon alleviates fatty acid–induced lipid accumulation and mitochondrial dysfunction in bovine hepatocytes by promoting autophagy | |
| Kuo et al. | Activation of receptors δ (PPARδ) by agonist (GW0742) may enhance lipid metabolism in heart both in vivo and in vitro | |
| TW201119663A (en) | Composition of Chinese medicine recipes for cancer therapy. | |
| Ma et al. | Uncarboxylated osteocalcin reverses the high glucose‑induced inhibition of the osteogenic differentiation of MC3T3E1 cells via the GPRC6A/cAMP/PKA/AMPK signaling pathway | |
| CN111560433B (en) | Application of human NUFIP1 and related products | |
| Fang et al. | Hydroxytyrosol inhibits apoptosis in ischemia/reperfusion-induced acute kidney injury via activating Sonic Hedgehog signaling pathway | |
| WO2021093401A1 (en) | Use of lncrna-266 in preparation of a medicament for inducing differentiation of brown adipose cells | |
| CN112516318A (en) | Application of CUL4B in treatment of type II diabetes | |
| Hao et al. | Melatonin alleviates endoplasmic reticulum stress and follicular granulosa cell apoptosis by regulating ATF4 to activate mTOR signaling pathway in chickens |
Legal Events
| Date | Code | Title | Description |
|---|---|---|---|
| PB01 | Publication | ||
| PB01 | Publication | ||
| SE01 | Entry into force of request for substantive examination | ||
| SE01 | Entry into force of request for substantive examination | ||
| GR01 | Patent grant | ||
| GR01 | Patent grant |