CN107532214B - Method for sepsis diagnosis - Google Patents
Method for sepsis diagnosis Download PDFInfo
- Publication number
- CN107532214B CN107532214B CN201680023601.1A CN201680023601A CN107532214B CN 107532214 B CN107532214 B CN 107532214B CN 201680023601 A CN201680023601 A CN 201680023601A CN 107532214 B CN107532214 B CN 107532214B
- Authority
- CN
- China
- Prior art keywords
- sepsis
- infection
- subject
- polynucleotide
- biomarkers
- Prior art date
- Legal status (The legal status is an assumption and is not a legal conclusion. Google has not performed a legal analysis and makes no representation as to the accuracy of the status listed.)
- Active
Links
Images


Classifications
-
- C—CHEMISTRY; METALLURGY
- C12—BIOCHEMISTRY; BEER; SPIRITS; WINE; VINEGAR; MICROBIOLOGY; ENZYMOLOGY; MUTATION OR GENETIC ENGINEERING
- C12Q—MEASURING OR TESTING PROCESSES INVOLVING ENZYMES, NUCLEIC ACIDS OR MICROORGANISMS; COMPOSITIONS OR TEST PAPERS THEREFOR; PROCESSES OF PREPARING SUCH COMPOSITIONS; CONDITION-RESPONSIVE CONTROL IN MICROBIOLOGICAL OR ENZYMOLOGICAL PROCESSES
- C12Q1/00—Measuring or testing processes involving enzymes, nucleic acids or microorganisms; Compositions therefor; Processes of preparing such compositions
- C12Q1/68—Measuring or testing processes involving enzymes, nucleic acids or microorganisms; Compositions therefor; Processes of preparing such compositions involving nucleic acids
- C12Q1/6876—Nucleic acid products used in the analysis of nucleic acids, e.g. primers or probes
- C12Q1/6883—Nucleic acid products used in the analysis of nucleic acids, e.g. primers or probes for diseases caused by alterations of genetic material
-
- G—PHYSICS
- G16—INFORMATION AND COMMUNICATION TECHNOLOGY [ICT] SPECIALLY ADAPTED FOR SPECIFIC APPLICATION FIELDS
- G16B—BIOINFORMATICS, i.e. INFORMATION AND COMMUNICATION TECHNOLOGY [ICT] SPECIALLY ADAPTED FOR GENETIC OR PROTEIN-RELATED DATA PROCESSING IN COMPUTATIONAL MOLECULAR BIOLOGY
- G16B25/00—ICT specially adapted for hybridisation; ICT specially adapted for gene or protein expression
- G16B25/10—Gene or protein expression profiling; Expression-ratio estimation or normalisation
-
- G—PHYSICS
- G16—INFORMATION AND COMMUNICATION TECHNOLOGY [ICT] SPECIALLY ADAPTED FOR SPECIFIC APPLICATION FIELDS
- G16B—BIOINFORMATICS, i.e. INFORMATION AND COMMUNICATION TECHNOLOGY [ICT] SPECIALLY ADAPTED FOR GENETIC OR PROTEIN-RELATED DATA PROCESSING IN COMPUTATIONAL MOLECULAR BIOLOGY
- G16B25/00—ICT specially adapted for hybridisation; ICT specially adapted for gene or protein expression
- G16B25/20—Polymerase chain reaction [PCR]; Primer or probe design; Probe optimisation
-
- G—PHYSICS
- G16—INFORMATION AND COMMUNICATION TECHNOLOGY [ICT] SPECIALLY ADAPTED FOR SPECIFIC APPLICATION FIELDS
- G16H—HEALTHCARE INFORMATICS, i.e. INFORMATION AND COMMUNICATION TECHNOLOGY [ICT] SPECIALLY ADAPTED FOR THE HANDLING OR PROCESSING OF MEDICAL OR HEALTHCARE DATA
- G16H50/00—ICT specially adapted for medical diagnosis, medical simulation or medical data mining; ICT specially adapted for detecting, monitoring or modelling epidemics or pandemics
- G16H50/20—ICT specially adapted for medical diagnosis, medical simulation or medical data mining; ICT specially adapted for detecting, monitoring or modelling epidemics or pandemics for computer-aided diagnosis, e.g. based on medical expert systems
-
- C—CHEMISTRY; METALLURGY
- C12—BIOCHEMISTRY; BEER; SPIRITS; WINE; VINEGAR; MICROBIOLOGY; ENZYMOLOGY; MUTATION OR GENETIC ENGINEERING
- C12Q—MEASURING OR TESTING PROCESSES INVOLVING ENZYMES, NUCLEIC ACIDS OR MICROORGANISMS; COMPOSITIONS OR TEST PAPERS THEREFOR; PROCESSES OF PREPARING SUCH COMPOSITIONS; CONDITION-RESPONSIVE CONTROL IN MICROBIOLOGICAL OR ENZYMOLOGICAL PROCESSES
- C12Q2600/00—Oligonucleotides characterized by their use
- C12Q2600/106—Pharmacogenomics, i.e. genetic variability in individual responses to drugs and drug metabolism
-
- C—CHEMISTRY; METALLURGY
- C12—BIOCHEMISTRY; BEER; SPIRITS; WINE; VINEGAR; MICROBIOLOGY; ENZYMOLOGY; MUTATION OR GENETIC ENGINEERING
- C12Q—MEASURING OR TESTING PROCESSES INVOLVING ENZYMES, NUCLEIC ACIDS OR MICROORGANISMS; COMPOSITIONS OR TEST PAPERS THEREFOR; PROCESSES OF PREPARING SUCH COMPOSITIONS; CONDITION-RESPONSIVE CONTROL IN MICROBIOLOGICAL OR ENZYMOLOGICAL PROCESSES
- C12Q2600/00—Oligonucleotides characterized by their use
- C12Q2600/158—Expression markers
-
- Y—GENERAL TAGGING OF NEW TECHNOLOGICAL DEVELOPMENTS; GENERAL TAGGING OF CROSS-SECTIONAL TECHNOLOGIES SPANNING OVER SEVERAL SECTIONS OF THE IPC; TECHNICAL SUBJECTS COVERED BY FORMER USPC CROSS-REFERENCE ART COLLECTIONS [XRACs] AND DIGESTS
- Y02—TECHNOLOGIES OR APPLICATIONS FOR MITIGATION OR ADAPTATION AGAINST CLIMATE CHANGE
- Y02A—TECHNOLOGIES FOR ADAPTATION TO CLIMATE CHANGE
- Y02A90/00—Technologies having an indirect contribution to adaptation to climate change
- Y02A90/10—Information and communication technologies [ICT] supporting adaptation to climate change, e.g. for weather forecasting or climate simulation
Abstract
Methods for sepsis diagnosis are disclosed. In particular, the invention relates to the use of biomarkers for aiding diagnosis, prognosis and treatment of sepsis, and to a set of biomarkers that can be used to distinguish sepsis from non-infectious sources of inflammation, such as that caused by traumatic injury, surgery, autoimmune disease, thrombosis or Systemic Inflammatory Response Syndrome (SIRS).
Description
Statement regarding federally sponsored research or development
The invention was made with government support under the contract of National Institutes of Health (AI 057229, AI109662 and LM007033 awarded by the National Institutes of Health). The government has certain rights in the invention.
Technical Field
The present invention relates generally to methods for sepsis diagnosis. In particular, the invention relates to the use of biomarkers for aiding diagnosis, prognosis and treatment of sepsis, and more particularly to biomarkers that can be used to distinguish sepsis from non-infectious sources of inflammation, such as that caused by traumatic injury, surgery, autoimmune disease, thrombosis or Systemic Inflammatory Response Syndrome (SIRS).
Background
Sepsis, a systemic inflammatory syndrome responsive to infection, kills approximately 750,000 people annually in the united states (Angus et al (2001) critical Care Med 29: 1303-. It is also the single most expensive condition to treat in the united states, costing the medical system more than $ 240 million each year (Lagu et al (2012) critical care medicine 40: 754-; torio and Andrews (2013) hospital cost of domestic inpatients: the Most Expensive Conditions of The payers (National initiative Costs: The last outstanding Conditions by Payer), 2011 (statistical summary # 160, Healthcare Research and Quality management department of Rockwell, Md., 2013, 8 months). Early diagnosis and treatment of sepsis is critical to reducing mortality, with hourly delays increasing the risk of death (Gaieski et al (2010) critical care medicine 38: 1045-. Sepsis is defined by the presence of Systemic Inflammatory Response Syndrome (SIRS) in addition to a known or suspected source of infection (Dellinger et al (2013) Intensive Care medicine (Intensive Care Med) 39: 165-228). However, SIRS is not specific for sepsis, as sterile inflammation can occur as a non-specific response to trauma, surgery, thrombosis, and other non-infectious injuries. Thus, sepsis may be difficult to clinically distinguish from systemic inflammation caused by non-infectious sources, such as tissue trauma (Coburn et al Journal of American Medical Association (JAMA) (2012)308: 502-511). There is no 'gold standard' blood test used at diagnosis to distinguish infected patients before results can be obtained from standard microbial cultures. The total area under the working characteristic curve of a subject with the most common infection biomarker procalcitonin (procalcitonin) is 0.78 (range 0.66-0.90) (Tang et al (2007) Lancet infectious disease (Lancet infectious Dis) 7: 210-217; Uzzan et al (2006) Critical Care Med. 34: 1996-2003; Cheval et al (2000) Critical Care Med. 26, suppl. 2: S153-158; Ugarte et al (1999) Critical Care Med. 27: 498-504). Several groups have evaluated whether cytokine or gene expression arrays can accurately diagnose sepsis; however, because of the high variability of host responses and human genetics, robust diagnostic signatures have not been found (Cobb et al (2009) Ann Surg 250: 531-539; Xiao et al (2011) J Exp Med 208: 2581-2590; Pankla et al (2009) Genome Biol 10: R127; Tang et al (2009) Crit Care 16: 204; Johnson et al (2007) Ann scientific Oncd 245: 611-621). In fact, "finding ' perfect ' sepsis markers has been one of the most difficult dreams to achieve in modern medicine" (Vega et al (2009) ' critical care medicine "37: 1806-.
Both infection and tissue trauma activate many of the same innate immune receptor families, such as Toll-like receptors and NOD-like receptors, and, therefore, greatly activate overlapping transcriptional pathways. Therefore, it has been extremely difficult to distinguish between conserved downstream effects attributable only to infection. Recent studies have shown that there are pattern recognition receptors that may be specific for pathogen responses, such as the c-type lectins, CEACAM, and the siglec receptor family (Geijtenbeek et al (2009) Nature Immunol 9: 465-479; Crocker (2007) Nature Immunol 7: 255-266; Kuespert et al (2006) New cytology (Curr Opin Cell Biol) 18: 565-571). Thus, it is possible to be able to distinguish between infection-specific immune responses and sterile inflammation.
Ongoing discovery of new therapies for sepsis and new prognostic and diagnostic biomarkers has resulted in tens of microarray-based whole genome expression studies over the past decade, with different focus on diagnosis, prognosis, pathogen response, and underlying sepsis pathophysiology (Johnson et al, supra; mass et al (2014): molecular medicine Trends (Trends Mol Med.) 20(4): 204-213). Despite the tremendous gains in understanding gene expression in sepsis, little insight has turned into improvements in clinical practice. Importantly, many of these studies have been deposited into common repositories, such as NIH gene expression boxcar (GEO) and ArrayExpress, and thus there is currently a large amount of publicly available data on sepsis. In particular, there are several studies comparing septic patients with patients who develop non-infectious inflammation (such as SIRS) after major surgery, traumatic injury, or in non-sepsis related ICU recovery (thrombosis, respiratory failure, etc.).
A data set, specifically the Inflammation and Host Response to Injury project (Glue Grant) (Cobb et al (2005) Proc Natl Acad Sci USA 102:4801-4806), has yielded several important findings on the effects of time on gene expression after trauma and in sepsis. One part of the Glue Grant examined longitudinally the gene expression of patients after severe traumatic injury. Several groups have examined these data with respect to time; noteworthy findings were (1) differential expression of more than 80% of the expressed genes after traumatic injury (Xiao et al, supra), (2) recovery of different gene clusters over significantly different time periods (Seok et al (2013) journal of the american academy of sciences, american academy of america (Proc Natl Acad Sci USA) 110: 3507-. Thus, the importance of the changes that underlie wound recovery and their impact on specific clinical outcomes is becoming increasingly understood.
There remains a need for sensitive, specific diagnostic tests for sepsis that can distinguish sepsis from non-infectious sources of inflammation, such as caused by traumatic injury and SIRS.
Disclosure of Invention
The present invention relates to the use of biomarkers for sepsis diagnosis. In particular, the inventors have found biomarkers that can be used to diagnose sepsis and to distinguish sepsis from non-infectious sources of systemic inflammation, such as that caused by traumatic injury, surgery, autoimmune disease, thrombosis, or Systemic Inflammatory Response Syndrome (SIRS). These biomarkers can be used alone or in combination with one or more additional biomarkers or related clinical parameters for prognosis, diagnosis or monitoring of treatment of sepsis.
Biomarkers useful in the practice of the invention include polynucleotides comprising nucleotide sequences from genes or RNA transcripts of genes, including (but not limited to) CEACAM1, ZDHHC19, C9orf95, GNA15, BATF, C3AR1, KIAA1370, TGFBI, MTCH1, RPGRIP1, and HLA-DPB 1.
In certain embodiments, a panel of biomarkers is used for sepsis diagnosis. Any size biomarker panel may be used in the practice of the present invention. The biomarker panel for diagnosing sepsis typically comprises at least 3 biomarkers and up to 30 biomarkers, including any number of biomarkers in between, such as 3, 4, 5, 6,7, 8, 9, 10, 11, 12, 13, 14, 15, 16, 17, 18, 19, 20, 21, 22, 23, 24, 25, 26, 27, 28, 29, or 30 biomarkers. In certain embodiments, the invention encompasses a biomarker panel comprising at least 3, at least 4, or at least 5, or at least 6, or at least 7, or at least 8, or at least 9, or at least 10, or at least 11 or more biomarkers. While smaller biomarker panels are generally more economical, larger biomarker panels (i.e., greater than 30 biomarkers) have the advantage of providing more detailed information and may also be used in the practice of the present invention.
In one embodiment, the biomarker panel comprises a plurality of biomarkers for diagnosing sepsis, wherein the plurality of biomarkers comprises one or more polynucleotides comprising a nucleotide sequence from a gene or an RNA transcript of a gene selected from the group consisting of: CEACAM1, ZDHHC19, C9orf95, GNA15, BATF, C3AR1, KIAA1370, TGFBI, MTCH1, RPGRIP1, and HLA-DPB 1. In certain embodiments, the biomarker panel comprises at least 11 biomarkers. In one embodiment, the biomarker panel comprises a CEACAM1 polynucleotide, a ZDHHC19 polynucleotide, a C9orf95 polynucleotide, a GNA15 polynucleotide, a BATF polynucleotide, a C3AR1 polynucleotide, a KIAA1370 polynucleotide, a TGFBI polynucleotide, a MTCH1 polynucleotide, an RPGRIP1 polynucleotide, and an HLA-DPB1 polynucleotide.
In one aspect, the invention includes a method for diagnosing sepsis in a subject. The method comprises a) measuring the levels of a plurality of biomarkers in a biological sample derived from the subject; and b) analyzing the levels of the biomarkers in combination with the respective reference value ranges of the plurality of biomarkers, wherein differential expression of the one or more biomarkers in the biological sample as compared to the reference value ranges of the biomarkers of an uninfected control subject is indicative of the subject having sepsis. The reference value range may represent the level of one or more biomarkers found in one or more samples of one or more subjects not suffering from sepsis (e.g., healthy subjects or uninfected subjects). Alternatively, the reference value may represent the level of one or more biomarkers found in one or more samples from one or more subjects with sepsis. In certain embodiments, the level of the biomarker is compared to a time-matched reference value range for an uninfected or infected/septic subject.
In certain embodiments, the invention includes a method of diagnosing sepsis in a subject using the biomarker panel described herein. The method comprises the following steps: a) collecting a biological sample from a subject; b) measuring each biomarker of the biomarker panel in the biological sample; and c) comparing the measured value for each biomarker to a corresponding reference value range for the biomarker, wherein a differential expression of the biomarkers of the biomarker panel in the biological sample as compared to the reference values for the biomarkers of the control subject indicates that the subject has sepsis.
In one embodiment, the invention includes a method for diagnosing sepsis in a subject, the method comprising: a) collecting a biological sample from the subject; b) measuring the expression level of CEACAM1, ZDHHC19, C9orf95, GNA15, BATF, C3AR1, KIAA1370, TGFBI, MTCH1, RPGRIP1, and HLA-DPB1 in the biological sample; and C) analyzing the expression level of each biomarker in combination with a respective reference value range for the biomarker, wherein an increased expression level of the CEACAM1, ZDHHC19, C9orf95, GNA15, BATF, and C3AR1 biomarkers and a decreased expression level of the KIAA1370, TGFBI, MTCH1, RPGRIP1, and HLA-DPB1 biomarkers compared to a reference value range for the biomarker of an uninfected control subject indicates that the subject has sepsis.
In another embodiment, the invention includes a method for diagnosing sepsis in a subject comprising determining a sepsis score for the subject based on the levels of biomarkers according to the formula:

wherein a higher sepsis score for the subject as compared to a reference value range for an uninfected control subject indicates that the subject has sepsis.
As described herein, the methods of the invention can be used to distinguish sepsis diagnosis in a subject from inflammation of non-infectious origin, such as that caused by traumatic injury, surgery, autoimmune disease, thrombosis, or Systemic Inflammatory Response Syndrome (SIRS).
The biological sample may comprise, for example, whole blood, buffy coat (buffy coat), plasma, serum, Peripheral Blood Mononuclear Cells (PBMC), rod shaped cells, neutrophils, monocytes or T cells.
Biomarker polynucleotides (e.g., encoding transcripts) may be detected, for example, by microarray analysis, Polymerase Chain Reaction (PCR), reverse transcriptase polymerase chain reaction (RT-PCR), Northern blot, or Serial Analysis of Gene Expression (SAGE).
In another aspect, the invention includes a method of determining an infection Z-score of a subject suspected of having sepsis, the method comprising: a) collecting a biological sample from the subject; b) measuring the levels of a plurality of sepsis biomarkers in the biological sample; and c) determining an infection Z-score for the biomarker by subtracting the geometric mean of the expression levels of all biomarkers that are overexpressed compared to the control reference value for the biomarker from the geometric mean of the expression levels of all biomarkers that are underexpressed compared to the control reference value for the biomarker, and multiplying the difference by the ratio of the number of biomarkers that are overexpressed compared to the control reference value for the biomarker to the number of biomarkers that are underexpressed.
In certain embodiments, the infection Z-score is calculated from the expression levels of a plurality of biomarkers comprising one or more polynucleotides comprising a nucleotide sequence of a gene or RNA transcript of a gene selected from the group consisting of: CEACAM1, ZDHHC19, C9orf95, GNA15, BATF, C3AR1, KIAA1370, TGFBI, MTCH1, RPGRIP1, and HLA-DPB 1. In one embodiment, the plurality of biomarkers comprises a CEACAM1 polynucleotide, a ZDHHC19 polynucleotide, a C9orf95 polynucleotide, a GNA15 polynucleotide, a BATF polynucleotide, a C3AR1 polynucleotide, a KIAA1370 polynucleotide, a TGFBI polynucleotide, a MTCH1 polynucleotide, an RPGRIP1 polynucleotide, and an HLA-DPB1 polynucleotide.
In another aspect, the invention includes a method of treating a subject having sepsis, the method comprising: a) diagnosing a subject with sepsis according to the methods described herein; and b) administering to the subject a therapeutically effective amount of a broad spectrum antibiotic if the subject is diagnosed positive for sepsis.
In another aspect, the invention includes a method of treating a subject suspected of having sepsis, the method comprising: a) receiving diagnostic information about the subject according to the methods described herein; and b) administering to the subject a therapeutically effective amount of a broad spectrum antibiotic if the patient is diagnosed positive for sepsis.
In certain embodiments, subject data is analyzed by one or more methods including, but not limited to, multivariate Linear Discriminant Analysis (LDA), Receiver Operating Characteristics (ROC) analysis, Principal Component Analysis (PCA), ensemble data mining methods, cell-specific significance analysis of microarrays (csSAM), and multidimensional protein identification technology (MUDPIT) analysis.
In another embodiment, the invention includes a method of assessing the effect of an agent that treats sepsis in a subject using a biomarker panel described herein, the method comprising: analyzing the measured value of each biomarker of the biomarker panel in a sample derived from the subject in combination with the respective reference value range for each biomarker before and after the subject is treated with the agent.
In another embodiment, the invention includes a method of monitoring the efficacy of a therapy for treating sepsis in a subject using a biomarker panel described herein, the method comprising: analyzing the measured value of each biomarker of the biomarker panel in a sample derived from the subject in combination with the respective reference value range for each biomarker before and after the subject has undergone the therapy.
In another embodiment, the invention includes a method for monitoring the efficacy of a therapy for treating sepsis in a subject, the method comprising: measuring the expression levels of CEACAM1, ZDHHC19, C9orf95, GNA15, BATF, C3AR1, KIAA1370, TGFBI, MTCH1, RPGRIP1, and HLA-DPB1 biomarkers in a first sample derived from the subject prior to the subject undergoing the therapy and in a second sample derived from the subject subsequent to the subject undergoing the therapy, wherein an increased expression level of the CEACAM1, ZDHHC19, C9orf95, GNA15, BATF, and C3AR1 biomarkers and a decreased expression level of the KIAA1370, TGFBI, MTCH1, RPGRIP1, and HLA-DPB1 biomarkers in the second sample as compared to the expression level of the biomarkers in the first sample is indicative of worsening in the subject, and a decreased expression level of the CEACAM1, ZDHHC19, C9orf95, GNA15, BATF, and C3AR1 biomarkers and an increased expression level of the KIAA1370, TGFBI, MTCH1, RPGRIP1, and HLA-DPB1 biomarkers in the second sample as compared to the expression level of the biomarkers in the first sample is indicative of the subject improving.
In another aspect, the invention includes a kit for diagnosing sepsis in a subject. The kit may comprise a container for holding a biological sample isolated from a human subject suspected of having sepsis, at least one agent that specifically detects a sepsis biomarker; and printed instructions for reacting the agent with the biological sample or a portion of the biological sample to detect the presence or amount of at least one sepsis biomarker in the biological sample. The medicament may be enclosed in a separate container. The kit may additionally comprise one or more control reference samples and reagents for performing PCR or microarray analysis to detect biomarkers as described herein.
In certain embodiments, the kit comprises a medicament for detecting a polynucleotide of a biomarker panel comprising a plurality of biomarkers for diagnosing sepsis, wherein one or more biomarkers are selected from the group consisting of: CEACAM1 polynucleotide, ZDHHC19 polynucleotide, C9orf95 polynucleotide, GNA15 polynucleotide, BATF polynucleotide, C3AR1 polynucleotide, KIAA1370 polynucleotide, TGFBI polynucleotide, MTCH1 polynucleotide, RPGRIP1 polynucleotide and HLA-DPB1 polynucleotide. In one embodiment, the kit comprises a medicament for detecting a biomarker of a biomarker panel comprising: CEACAM1 polynucleotide, ZDHHC19 polynucleotide, C9orf95 polynucleotide, GNA15 polynucleotide, BATF polynucleotide, C3AR1 polynucleotide, KIAA1370 polynucleotide, TGFBI polynucleotide, MTCH1 polynucleotide, RPGRIP1 polynucleotide and HLA-DPB1 polynucleotide. Furthermore, the kit may comprise agents for detecting more than one biomarker panel (e.g. two or three biomarker panels), which may be used alone or in any combination and/or in combination with clinical parameters for sepsis diagnosis.
In certain embodiments, the kit comprises a microarray for analyzing a plurality of biomarker polynucleotides. In one embodiment, the kit comprises a microarray comprising an oligonucleotide that hybridizes to a CEACAM1 polynucleotide, an oligonucleotide that hybridizes to a ZDHHC19 polynucleotide, an oligonucleotide that hybridizes to a C9orf95 polynucleotide, an oligonucleotide that hybridizes to a GNA15 polynucleotide, an oligonucleotide that hybridizes to a BATF polynucleotide, an oligonucleotide that hybridizes to a C3AR1 polynucleotide, an oligonucleotide that hybridizes to a KIAA1370 polynucleotide, an oligonucleotide that hybridizes to a TGFBI polynucleotide, an oligonucleotide that hybridizes to a MTCH1 polynucleotide, an oligonucleotide that hybridizes to an RPGRIP1 polynucleotide, and an oligonucleotide that hybridizes to an HLA-DPB1 polynucleotide.
In another aspect, the invention includes an assay comprising: a) measuring at least one biomarker in a biological sample taken from a subject suspected of having sepsis; and b) comparing the measured value of the at least one biomarker in the biological sample with a reference value of the biomarker for a control subject, wherein a differential expression of the at least one biomarker in the biological sample compared to the reference value indicates that the subject has sepsis. The biological sample may comprise, for example, whole blood, buffy coat, plasma, serum, Peripheral Blood Mononuclear Cells (PBMCs), rod shaped nuclear cells, neutrophils, monocytes or T cells. In one embodiment, the analyzing further comprises determining an infection Z score of the subject.
In one embodiment, the invention includes an assay comprising: a) measuring each biomarker of a biomarker panel described herein in a biological sample collected from a subject suspected of having sepsis; and b) comparing the measured value for each biomarker of the biomarker panel in the biological sample to a reference value for each biomarker of a control subject, wherein differential expression of the biomarker in the biological sample as compared to the reference value indicates that the subject has sepsis. The biological sample may comprise, for example, whole blood, buffy coat, plasma, serum, Peripheral Blood Mononuclear Cells (PBMCs), rod shaped nuclear cells, neutrophils, monocytes or T cells. The analysis may further comprise determining an infection Z-score of the subject.
In other embodiments, measuring at least one biomarker comprises performing microarray analysis, Polymerase Chain Reaction (PCR), reverse transcriptase polymerase chain reaction (RT-PCR), a Northern blot, or Serial Analysis of Gene Expression (SAGE). In one embodiment, the microarray analysis is performed using a microarray comprising: an oligonucleotide that hybridizes to a CEACAM1 polynucleotide, an oligonucleotide that hybridizes to a ZDHHC19 polynucleotide, an oligonucleotide that hybridizes to a C9orf95 polynucleotide, an oligonucleotide that hybridizes to a GNA15 polynucleotide, an oligonucleotide that hybridizes to a BATF polynucleotide, an oligonucleotide that hybridizes to a C3AR1 polynucleotide, an oligonucleotide that hybridizes to a KIAA1370 polynucleotide, an oligonucleotide that hybridizes to a TGFBI polynucleotide, an oligonucleotide that hybridizes to a MTCH1 polynucleotide, an oligonucleotide that hybridizes to an RPGRIP1 polynucleotide, and an oligonucleotide that hybridizes to an HLA-DPB1 polynucleotide.
In another aspect, the invention includes a diagnostic system comprising a storage component (i.e., memory) for storing data, wherein the storage component has instructions for determining a diagnosis of a subject stored therein; a computer processor for processing data, wherein the computer processor is coupled to the storage component and configured to execute instructions stored in the storage component in order to receive patient data and analyze the patient data according to an algorithm; and a display assembly for displaying diagnostic information about the patient. The storage component may include instructions for calculating an infection Z score or sepsis score as described herein (see examples 1 and 2). Further, the storage component can additionally include instructions for performing multivariate Linear Discriminant Analysis (LDA), Receiver Operating Characteristics (ROC) analysis, Principal Component Analysis (PCA), aggregate data mining methods, cell-specific significance analysis of microarrays (csSAM), and multidimensional protein identification technology (MUDPIT) analysis.
In certain embodiments, the invention includes a computer-implemented method for diagnosing a patient suspected of having sepsis, the computer performing steps comprising: a) receiving input patient data comprising values for levels of a plurality of sepsis biomarkers in a biological sample from the patient; b) analyzing the levels of a plurality of sepsis biomarkers and comparing to corresponding reference value ranges for the sepsis biomarkers; c) calculating an infection Z score or a sepsis score for the patient based on the level of the sepsis biomarker; d) calculating a likelihood that the patient has sepsis based on the value of the infection Z score; and e) displaying diagnostic information about the patient.
In certain embodiments, the input patient data comprises values for levels of at least 11 sepsis biomarkers in a biological sample from the patient. For example, the patient data entered may comprise level values for CEACAM1 polynucleotide, ZDHHC19 polynucleotide, C9orf95 polynucleotide, GNA15 polynucleotide, BATF polynucleotide, C3AR1 polynucleotide, KIAA1370 polynucleotide, TGFBI polynucleotide, MTCH1 polynucleotide, RPGRIP1 polynucleotide, and HLA-DPB1 polynucleotide.
In another embodiment, the invention includes a computer-implemented method for diagnosing a patient suspected of having sepsis, the computer performing steps comprising: a) receiving entered patient data comprising expression level values for CEACAM1, ZDHHC19, C9orf95, GNA15, BATF, C3AR1, KIAA1370, TGFBI, MTCH1, RPGRIP1, and HLA-DPB1 biomarkers in a biological sample from the patient; b) analyzing the level of each biomarker and comparing to a corresponding reference value range for each biomarker; c) calculating a sepsis score for the patient based on the expression levels of the biomarkers according to the formula:

d) calculating a likelihood that the patient has sepsis based on the value of the sepsis score, wherein a sepsis score for the patient that is higher compared to a reference value range for an uninfected control subject indicates that the patient has sepsis; and e) displaying diagnostic information about the patient.
These and other embodiments of the present invention will be readily apparent to those skilled in the art in view of the disclosure herein.
Drawings
Figures 1A and 1B show a labeled Principal Component Analysis (PCA) comparing sterile SIRS/trauma patients with sepsis patients. Figure 1A shows that sterile SIRS/trauma and sepsis patients appear to be mostly separable in the transcriptomics space, with only a minimal non-separable set. FIG. 1B shows the PCA of the same marker, with the marker updated to reflect patients recovering from non-infectious SIRS/trauma and patients with hospital-acquired sepsis; the 'late' group (> 48 hours after admission) was more difficult to isolate. N1094, from a combination of 15 studies.
FIGS. 2A-2D show the effect of the size of a set of 11 genes. Forest plots of random effect model estimates for positive gene effect magnitude are shown comparing SIRS/trauma/ICU to infected/septic patients in each discovery cohort.
Fig. 3A-3F show the results of finding a set of 11 genes in the dataset and the neutrophil validation dataset. Figure 3A shows a ROC curve separating sterile SIRS/ICU/trauma patients from sepsis patients in the discovery dataset. Figure 3B shows ROC curves separating infected wound patients from time-matched uninfected wound patients in the Glue Grant neutrophil validation dataset. After >1 day from injury, the Glue Grant (fig. 3C) buffy coat discovery sample and (fig. 3D) neutrophil validation sample show the mean infection Z-score for uninfected patients versus patients within +/-24 hours of diagnosis. In both cases, there is a significant effect due to time and infection status. For the buffy coat discovery sample (fig. 3E) and the neutrophil validation sample (fig. 3F), a box plot is shown of infection Z score as a function of time from injury: patients who were not infected were compared to patients >5 days before infection, 5 to 1 day before infection, 1 day (case) +/-diagnosis and 2 to 5 days after infection diagnosis. The JT trend test was significant for a trend that increased from no infection to +/-1 day of infection at each time point after admission (p < 0.01).
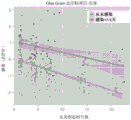
FIGS. 4A-4D show the no-control dataset for trauma/ICU patients with VAP. These data sets do not include uninfected patients, so they were empirically bayesian co-normalized with time-matched Glue Grant patients. Gray lines show the Glue Grant local weighted regression curves for EMEXP3001 (fig. 4A), GSE6377 (fig. 4B), and GSE12838 neutrophils and whole blood samples (fig. 4C). In all cases, only the first 8 days from admission are shown, and patients receive examination >1 day after infection diagnosis. FIG. 4D shows ROC curves comparing patients within +/-1 day of diagnosis (dark gray points in FIGS. 4A-4C) with time-matched uninfected Glue Grant patients. See table 5 for more data set details.
Fig. 5A and 5B show the difference between healthy patients versus septic patients. Eight independent validation datasets that met the inclusion criteria (peripheral whole blood or neutrophils, sampled within 48 hours of sepsis diagnosis) were tested using the infection Z score. Fig. 5A shows infection Z scores for all n-446 patients combined in a single violin plot with error bars showing the median quartile. P values were calculated using Wilcoxon rank sum test (Wilcoxon rank-sum test). Figure 5B shows a separate ROC curve for each of the 8 data sets that distinguished septic patients from healthy controls. The average ROC AUC was 0.98. See table 6 for more data set details.
Fig. 6A and 6B show cell type enrichment analysis. Shown are (fig. 6A) normalized enrichment scores (Z-score, black dots) for human immune cell types found in the multi-population analysis as a significant complete set of 82 genes and (fig. 6B) a set of 11 genes found after the forward search method (subset of 82 genes). Fig. 6B also shows a box plot of Z-score distribution.
Figures 7A and 7B show labeled PCA comparing healthy versus SIRS/trauma versus sepsis patients. Figure 7A shows that healthy patients, SIRS/trauma patients and sepsis patients appear to be mostly separable in the transcriptomics space with only a minimal non-separable set. FIG. 7B shows the PCA for the same marker, where the marker is updated to reflect patients recovering from non-infectious SIRS/trauma and patients with hospital-acquired sepsis; the 'late' group (> 48 hours after admission) was more difficult to isolate. 1316, combined from 15 studies.
FIG. 8 shows the neutrophil percentage of Glue Grant patients with complete blood counts and microarray data. The median percentage of neutrophils at all time points was between 75-85%. Patients who had been infected during hospitalization were compared to patients who had never been infected during hospitalization.
Fig. 9A-9I show violin diagrams of data sets included in discovery multi-cohort analysis, including gps si specific (fig. 9A), GSE28750 (fig. 9B), GSE32707 (fig. 9C), and GSE40012 (fig. 9D). Shown is a data set comparing SIRS/ICU/trauma patients to sepsis patients at the time of admission. Error bars show the middle quartile. P values were calculated using the wilcoxon rank sum test. Fig. 9E-9I show violin plots for the data set included in the discovery multi-cohort analysis for the Glue Grant buffy coat cohort, comparing uninfected wound patients with septic patients at matched time points, including [1,3) (fig. 9E), [3,6) (fig. 9F), [6,10) (fig. 9G), [10,18) (fig. 9H) and [18,24) (fig. 9I). Error bars show the middle quartile. P values were calculated using the wilcoxon rank sum test.
FIGS. 10A and 10B show the expression of infection Z scores in monocytes sorted from the Glue Grant cohort. These were the same patients as the neutrophil validation cohort in fig. 3B, 3D and 3F. Fig. 10A shows an ROC curve for each of four sample time bins. Fig. 10B shows a box plot of infection Z score as a function of time from injury. Patients who were not infected were compared to patients >5 days before infection, 5 to 1 day before infection, 1 day (case) +/-diagnosis and 2 to 5 days after infection.
FIGS. 11A and 11B show the expression of infection Z scores in T cells sorted from the Glue Grant cohort. These were the same patients as the neutrophil validation cohort in fig. 3B, 3D and 3F. Fig. 11A shows an ROC curve for each of four sample time bins. Fig. 11B shows a box plot of infection Z score as a function of time from injury. Patients who were not infected were compared to patients >5 days before infection, 5 to 1 day before infection, 1 day (case) +/-diagnosis and 2 to 5 days after infection.
Fig. 12A and 12B show linear models of SIRS criteria and infection Z scores. FIG. 12A shows a logistic regression model for Glue Grant patients for which SIRS data and microarray data are available. The SIRS standard is expressed in terms of binary variables. The first model shows SIRS criteria in combination; the second model adds an infection Z score. The significance code: p <0.001 '. multidot.'; 0.01 '. star'; 0.05'*'. FIG. 12B shows a box plot of the patient's predicted log probability of infection output by the logistic regression model in FIG. 12A.
Fig. 13A shows infection Z scores for datasets that are not time matched. Four data sets compared SIRS/ICU/trauma patients with sepsis patients at unmatched time points. These data sets examined neutrophils (GSE5772, N-93), whole blood (EMTAB1548, N-73) and PBMCs (GSE9960, N-30; EMEXP3621, N-10). See table 7 for more data set details. Fig. 13B-13E show infection Z scores for datasets that were not time matched. Violin diagrams of unmatched point-in-time data sets are shown, including GSE5772 (fig. 13B), GSE9960 (fig. 13C), EMTAB1548 (fig. 13D), and EMEXP3621 (fig. 13E). Error bars show the middle quartile. The test was performed using the wilcoxon rank sum test.
Figures 14A and 14B show a comparison of infection Z scores for patients with acute infection with healthy controls and patients with autoimmune disease. GSE22098 compares healthy controls with patients with acute autoimmune inflammation or acute infection. The infection Z score shows a good distinction of infection from healthy patients and those with autoimmune inflammation. Fig. 14A shows a violin diagram; error bars show the middle quartile. Patients with autoimmune inflammation were tested against those with sepsis using the wilcoxon rank sum test. Figure 14B shows ROC plots of autoimmune patients or healthy controls versus septic patients.
FIG. 15 shows a schematic diagram of an overall integrated multi-cohort analysis.
Fig. 16 shows a schematic diagram of a diagnostic system.
Fig. 17 shows a schema of the system search and selection of the clinical sepsis data set.
Figures 18A-18C show ROC plots for sepsis/acute infection versus patients who were not infected with inflammation at the time of admission. Figure 18A shows scores for 11 genes. FIG. 18B shows the FAIM3: PLAC8 ratio. FIG. 18C shows Septicyte Lab.
Fig. 19A-19C show ROC plots for trauma patients with sepsis/acute infection versus time-matched, uninfected trauma patients. Figure 19A shows scores for 11 genes. FIG. 19B shows the FAIM3: PLAC8 ratio. FIG. 19C shows the Septicyte Lab.
Detailed Description
The practice of the present invention will employ, unless otherwise indicated, conventional methods of pharmacology, chemistry, biochemistry, recombinant DNA techniques and immunology, which are within the skill of the art. These techniques are explained fully in the literature. See, e.g., j.r.brown "sepsis: symptoms, Diagnosis and Treatment (Sepsis: Symptoms, Diagnosis and Treatment) [ Public Health in the 21st Century Series (Nova Science Publishers Inc., 2013) ]; sepsis and non-infectious systemic inflammation: from Biology to Critical Care (Sepsis and Non-invasive System IC information: From Biology to clinical Care) (J.Cavallon, ed. by C.Adrie, Wiley-Blackwell, 2008); sepsis: diagnosis, Management and Health Outcomes (Sepsis: diagnostics, Management and Health Outcome) ("allergy and Infectious Diseases" (Allergies and Infectious Diseases), N.Khardori, Nova Science Pub, 2014); handbook of Experimental Immunology, volumes I-IV (D.M. Weir and C.C. Blackwell, Blackwell publishing Co., Ltd. (Blackwell Scientific Publications)); l. lehninger, "Biochemistry (Biochemistry) (Worth Publishers, current edition); sambrook et al, molecular cloning: a Laboratory Manual (Molecular Cloning: A Laboratory Manual) (3 rd edition, 2001); methods In Enzymology (Methods In Enzymology), eds (edited by Colowick and N.Kaplan, Academic Press, Inc.).
All publications, patents, and patent applications cited herein, whether supra or infra, are hereby incorporated by reference in their entirety.
I. Definition of
In describing the present invention, the following terminology will be employed and is intended to be defined as indicated below.
It must be noted that, as used in this specification and the appended claims, the singular forms "a," "an," and "the" include plural referents unless the content clearly dictates otherwise. Thus, for example, reference to "a biomarker" includes mixtures of two or more biomarkers and the like.
The term "about", particularly with respect to a given quantity, is intended to encompass deviations of plus or minus 5%.
In the context of the present invention, a "biomarker" refers to a biological compound, such as a polynucleotide, that is differentially expressed in a sample obtained from a patient with sepsis compared to a comparable sample obtained from a control subject (e.g., a person who is negative in diagnosis, a normal or healthy subject, or an uninfected subject). A biomarker may be a nucleic acid, nucleic acid fragment, polynucleotide, or oligonucleotide that is detectable and/or quantitative. Sepsis biomarkers include polynucleotides comprising nucleotide sequences from genes or RNA transcripts of genes, including (but not limited to) CEACAM1, ZDHHC19, C9orf95, GNA15, BATF, C3AR1, KIAA1370, TGFBI, MTCH1, RPGRIP1, and HLA-DPB 1.
The terms "polypeptide" and "protein" refer to a polymer of amino acid residues and are not limiting of minimum length. Accordingly, peptides, oligopeptides, dimers, multimers, etc. are included within the definition. Full-length proteins and fragments thereof are encompassed by the definition. The term also includes post-expression modifications of the polypeptide, such as glycosylation, acetylation, phosphorylation, hydroxylation, oxidation, and the like.
The terms "polynucleotide", "oligonucleotide", "nucleic acid" and "nucleic acid molecule" are used herein to include nucleotides (ribonucleotides or deoxyribonucleotides) of any length in the form of a polymer. This term refers only to the primary structure of the molecule. Thus, the term includes triple-stranded, double-stranded and single-stranded DNA as well as triple-stranded, double-stranded and single-stranded RNA. It also includes modifications, such as by methylation and/or by capping, and unmodified forms of the polynucleotide. More specifically, the terms "polynucleotide", "oligonucleotide", "nucleic acid" and "nucleic acid molecule" include polydeoxyribonucleotides (containing 2-deoxy-D-ribose), polyribonucleotides (containing D-ribose), and any other type of polynucleotide (which is an N-or C-glycoside of a purine or pyrimidine base). There is no intended length distinction between the terms "polynucleotide", "oligonucleotide", "nucleic acid" and "nucleic acid molecule", and these terms are used interchangeably.
The phrase "differential expression" refers to a difference in the number and/or frequency of biomarkers present in a sample obtained from a patient having, for example, sepsis, as compared to a control subject or an uninfected subject. For example, the biomarker may be a polynucleotide present at an elevated level or a reduced level in a sample from a septic patient compared to a sample from a control subject. Alternatively, the biomarker may be a polynucleotide detected at a higher or lower frequency in a sample from a septic patient compared to a sample from a control subject. Biomarkers can differ in number, frequency, or both.
A polynucleotide is differentially expressed between two samples if the amount of the polynucleotide in one sample is statistically significantly different from the amount of the polynucleotide in the other sample. For example, a polynucleotide is differentially expressed in two samples if it is present in an amount of at least about 120%, at least about 130%, at least about 150%, at least about 180%, at least about 200%, at least about 300%, at least about 500%, at least about 700%, at least about 900%, or at least about 1000% of the amount it is present in the other sample, or if it is detectable in one sample and not detectable in the other sample.
Alternatively or additionally, the polynucleotides are differentially expressed in the two sets of samples if the frequency of detection of the polynucleotides in the sample of the patient suffering from sepsis is statistically significantly higher or lower than in the control sample. For example, a polynucleotide is differentially expressed in two sets of samples if it is detected that the polynucleotide is observed more frequently or less frequently in one set of samples than in another set of samples by at least about 120%, at least about 130%, at least about 150%, at least about 180%, at least about 200%, at least about 300%, at least about 500%, at least about 700%, at least about 900%, or at least about 1000%.
The "similarity value" is a numerical value indicating the degree of similarity between two things being compared. For example, the similarity value can be a numerical value indicative of the overall similarity between the expression profile of the patient using the specific phenotype-associated biomarker and a reference value range of the biomarker or reference expression profile in one or more control samples (e.g., similarity to a "sepsis" expression profile or a "sterile inflammation" expression profile). The similarity value may be expressed as a similarity measure (e.g., a correlation coefficient) between the levels of the biomarkers or reference expression profiles in the patient sample and the control sample, or may simply be expressed as a difference in expression level or an aggregate difference in expression level.
The terms "subject", "individual" and "patient" are used interchangeably herein and refer to any mammalian subject, particularly a human, in need of diagnosis, prognosis, treatment or therapy. Other subjects may include cows, dogs, cats, guinea pigs, rabbits, rats, mice, horses, and so forth. In some cases, the methods of the invention find application in the development of laboratory animals, veterinary applications, and animal disease models, including (but not limited to) rodents, including mice, rats, and hamsters, and primates.
As used herein, "biological sample" refers to a sample of tissue, cells, or fluid isolated from a subject, including, but not limited to, samples such as blood, buffy coat, plasma, serum, blood cells (e.g., Peripheral Blood Mononuclear Cells (PBMCs), rod shaped nuclear cells, neutrophils, monocytes, or T cells), fecal matter, urine, bone marrow, bile, spinal fluid, lymph fluid, skin samples, external secretions of the skin, respiratory tract, intestinal tract, and genitourinary tract, tears, saliva, milk, organs, biopsies, and in vitro cell culture components, including, but not limited to, conditioned media resulting from the growth of cells and tissue in culture, such as recombinant cells and cell components.
The "test amount" of a biomarker refers to the amount of the biomarker present in the sample being tested. The test amount may be an absolute amount (e.g., μ g/ml) or a relative amount (e.g., relative intensity of signal).
A "diagnostic amount" of a biomarker refers to the amount of the biomarker in a sample from a subject that is consistent with a diagnosis of sepsis. The diagnostic amount may be an absolute amount (e.g., μ g/ml) or a relative amount (e.g., relative intensity of signal).
The "control amount" of a biomarker can be any amount or range of amounts to be compared to the test amount of the biomarker. For example, the control amount of the biomarker can be the amount of the biomarker in an individual without sepsis. The control amount can be an absolute amount (e.g., μ g/ml) or a relative amount (e.g., relative intensity of signal).
The term "antibody" encompasses polyclonal and monoclonal antibody preparations, as well as preparations comprising hybrid, altered, chimeric, and humanized antibodies, and: hybrid (chimeric) antibody molecules (see, e.g., Winter et al (1991) Nature 349:293 & 299; and U.S. Pat. No. 4,816,567); f (ab')2And F (ab) a fragment; fvMolecules (non-covalent heterodimers, see, e.g., Inbar et al (1972) Proc. Natl. Acad. Sci. USA 69: 2659-2662; and Ehrlich et al (1980) biochemistry 19: 4091-4096); single-chain Fv molecules (sFv) (see, e.g., Huston et al (1988) Proc. Natl. Acad. Sci. USA 85: 5879-); dimeric and trimeric antibody fragment constructs; minibodies (see, e.g., Pack et al (1992) biochemistry 31: 1579-1584; Cumber et al (1992) Immunology 149B: 120-126); humanized antibody molecules (see, e.g., Riechmann et al (1988) Nature 332: 323-153327; Verhoeyan et al (1988) Science 239: 1534-1536; and British patent publication No. GB 2,276,169, 21/9, 1994); and any functional fragments obtained from such molecules, wherein such fragments retain the specific binding properties of the parent antibody molecule.
Contemplated for use in the present invention "detectable moiety" or "detectable label" including (but not limited to) radioactive homologousMetastin, fluorescent dyes, such as fluorescein, phycoerythrin, Cy-3, Cy-5, allophycocyanin, DAPI, Texas Red (Texas Red), rhodamine (rhodamine), Oregon Green (Oregon Green), Lucifer yellow (Lucifer yellow), etc., Green Fluorescent Protein (GFP), Red fluorescent protein (DsRed), Cyan Fluorescent Protein (CFP), Yellow Fluorescent Protein (YFP), Hibiscus goniacanthus orange fluorescent protein (cOFP), Alkaline Phosphatase (AP), beta-lactamase, Chloramphenicolin Acetyltransferase (CAT), Adenosine Deaminase (ADA), aminoglycoside phosphotransferase (neo)r、G418r) Dihydrofolate reductase (DHFR), hygromycin B phosphotransferase (HPH), Thymidine Kinase (TK), lacZ (encoding beta-galactosidase) and xanthine guanine phosphoribosyl transferase (XGPRT), beta-glucuronidase (gus), placental alkaline phosphatase (PLAP), Secreted Embryonic Alkaline Phosphatase (SEAP), or firefly or bacterial Luciferase (LUC). Enzyme tags are used with their cognate substrates. The term also includes color-coded microspheres with known fluorescence intensity (see, e.g., microspheres with xMAP technology produced by Luminex (Austin, TX), texas), microspheres containing quantum dot nanocrystals, e.g., Qdot nanocrystals containing different ratios and combinations of quantum dot pigments (e.g., produced by Life Technologies (Carlsbad, CA)), glass-coated metal nanoparticles (see, e.g., SERS nanotags produced by Nanoplex Technologies, inc. Mountain View, CA), barcode materials (see, e.g., striped metal rods of submicron size, such as nano-barcodes produced by Nanoplex Technologies, inc.), microparticles encoded with colored barcodes (see, e.g., laser, diamond, inc., produced by Nanoplex biosciences, and glass microparticles with digital code images (see, e.g., holographic microparticles produced by sanfogay, San france, CA)) produced CyVera microbeads. As with many of the standard procedures associated with the practice of this invention, those skilled in the art will appreciate additional indicia that may be used.
As used herein, "diagnosis" generally includes a determination as to whether a subject is likely to suffer from a given disease, disorder, or dysfunction. One of skill in the art typically diagnoses based on one or more diagnostic indicators (i.e., biomarkers), the presence, absence, or amount of which is indicative of the presence or absence of a disease, disorder, or dysfunction.
As used herein, "prognosis" generally refers to the prediction of the likely course and outcome of a clinical condition or disease. Prognosis of a patient is usually performed by assessing the factors or symptoms of the disease, which are indicative of a favorable or unfavorable course or outcome of the disease. It is to be understood that the term "prognosis" does not necessarily refer to the ability to predict the course or outcome of a condition with 100% accuracy. Indeed, it will be understood by those skilled in the art that the term "prognosis" refers to an increased probability that a particular course or outcome will occur; that is, the course or outcome is more likely to occur in patients exhibiting a given condition when compared to those individuals not exhibiting the condition.
By "substantially purified" is meant that the nucleic acid molecule or protein is removed from its natural environment and isolated or separated, and is at least about 60%, preferably about 75%, and most preferably about 90% free of other components with which it is naturally associated.
Modes for carrying out the invention
Before the present invention is described in detail, it is to be understood that this invention is not limited to particular formulations or process parameters, as such may, of course, vary. It is also to be understood that the terminology used herein is for the purpose of describing particular embodiments of the invention only, and is not intended to be limiting.
Although many methods and materials similar or equivalent to those described herein can be used in the practice of the present invention, the preferred materials and methods are described herein.
The present invention relates to the use of biomarkers alone or in combination with clinical parameters for the diagnosis of sepsis. In particular, the inventors have found a set of biomarkers whose expression profiles can be used to diagnose sepsis and to distinguish sepsis from non-infectious sources of systemic inflammation, such as that caused by traumatic injury, surgery, autoimmune disease, thrombosis, or systemic inflammatory response syndrome (see example 1).
A. Biomarkers
Biomarkers useful in the practice of the invention include polynucleotides comprising nucleotide sequences from genes or RNA transcripts of genes, including (but not limited to) CEACAM1, ZDHHC19, C9orf95, GNA15, BATF, C3AR1, KIAA1370, TGFBI, MTCH1, RPGRIP1, and HLA-DPB 1. Differential expression of these biomarkers is associated with sepsis and thus, the expression profile of these biomarkers can be used to diagnose sepsis and distinguish sepsis from non-infectious inflammatory conditions, such as those caused by traumatic injury, surgery, autoimmune disease, thrombosis, or Systemic Inflammatory Response Syndrome (SIRS).
Accordingly, in one aspect, the invention provides a method for diagnosing sepsis in a subject, comprising measuring the levels of a plurality of biomarkers in a biological sample derived from a subject suspected of having sepsis, analyzing the levels of the biomarkers and comparing to respective reference value ranges for the biomarkers, wherein differential expression of one or more biomarkers in the biological sample as compared to one or more biomarkers in a control sample indicates that the subject has sepsis. When analyzing the levels of the biomarkers in the biological samples, the reference value range used for comparison may represent the levels of the one or more biomarkers found in one or more samples of one or more subjects not suffering from sepsis (i.e., normal or uninfected control samples). Alternatively, the reference value may represent the level of one or more biomarkers found in one or more samples from one or more subjects with sepsis. In certain embodiments, the level of the biomarker is compared to a time-matched reference value for an uninfected or infected/septic subject.
The biological sample obtained from the subject to be diagnosed is typically whole blood, buffy coat, plasma, serum or blood cells (e.g., Peripheral Blood Mononuclear Cells (PBMCs), rod-shaped nuclear cells, neutrophils, monocytes or T cells), but may be any sample from a body fluid, tissue or cells containing the expressed biomarker. As used herein, a "control" sample refers to a biological sample, such as a body fluid, tissue, or cell, that is not diseased. That is, the control sample is obtained from a normal or uninfected subject (e.g., an individual known not to have sepsis). The biological sample may be obtained from the subject by conventional techniques. For example, blood may be obtained by venipuncture, and a solid tissue sample may be obtained by surgical techniques according to methods well known in the art.
In certain embodiments, a panel of biomarkers is used for sepsis diagnosis. Any size biomarker panel may be used in the practice of the present invention. The biomarker panel for diagnosing sepsis typically comprises at least 3 biomarkers and up to 30 biomarkers, including any number of biomarkers in between, such as 3, 4, 5, 6,7, 8, 9, 10, 11, 12, 13, 14, 15, 16, 17, 18, 19, 20, 21, 22, 23, 24, 25, 26, 27, 28, 29, or 30 biomarkers. In certain embodiments, the invention encompasses a biomarker panel comprising at least 3, at least 4, or at least 5, or at least 6, or at least 7, or at least 8, or at least 9, or at least 10, or at least 11 or more biomarkers. While smaller biomarker panels are generally more economical, larger biomarker panels (i.e., greater than 30 biomarkers) have the advantage of providing more detailed information and may also be used in the practice of the present invention.
In certain embodiments, the invention includes a set of biomarkers for diagnosing sepsis, the biomarkers comprising one or more polynucleotides comprising a nucleotide sequence of a gene or an RNA transcript of a gene selected from the group consisting of: CEACAM1, ZDHHC19, C9orf95, GNA15, BATF, C3AR1, KIAA1370, TGFBI, MTCH1, RPGRIP1, and HLA-DPB 1. In one embodiment, the biomarker of said panel comprises a CEACAM1 polynucleotide, a ZDHHC19 polynucleotide, a C9orf95 polynucleotide, a GNA15 polynucleotide, a BATF polynucleotide, a C3AR1 polynucleotide, a KIAA1370 polynucleotide, a TGFBI polynucleotide, a MTCH1 polynucleotide, an RPGRIP1 polynucleotide, and an HLA-DPB1 polynucleotide.
In certain embodiments, the infection Z score is used for sepsis diagnosis. The infection Z-score is calculated by subtracting the geometric mean of the expression levels of all measured biomarkers that are over-expressed compared to the control reference value for the biomarker by the geometric mean of the expression levels of all measured biomarkers that are under-expressed compared to the control reference value for the biomarker, and multiplying the difference by the ratio of the number of over-expressed biomarkers to the number of under-expressed biomarkers compared to the control reference value for the biomarker. A higher infection Z-score for the subject compared to the reference value range for an uninfected control subject indicates that the subject has sepsis (see example 1).
In other embodiments, the sepsis score is used for sepsis diagnosis. The sepsis score of a patient can be calculated based on the expression levels of CEACAM1, ZDHHC19, C9orf95, GNA15, BATF, C3AR1, KIAA1370, TGFBI, MTCH1, RPGRIP1, and HLA-DPB1 biomarkers according to the following formula:

a higher sepsis score for the subject compared to the reference value range for an uninfected control subject indicates that the subject has sepsis (see example 2).
In another aspect, the invention includes an assay comprising: a) measuring each biomarker of a biomarker panel described herein in a biological sample collected from a subject suspected of having sepsis; and b) comparing the measured value for each biomarker of the biomarker panel in the biological sample to a reference value for each biomarker of a control subject, wherein differential expression of the biomarker in the biological sample as compared to the reference value indicates that the subject has sepsis. In certain embodiments, the analysis further comprises determining an infection Z score as described herein.
The methods described herein can be used to determine whether a patient with systemic inflammation should be treated for sepsis. For example, if the patient is diagnosed as positive for sepsis based on the biomarker expression profile or infection Z-score or sepsis score as described herein, the patient is selected for sepsis therapy.
In one embodiment, the invention includes a method of treating a subject having sepsis, the method comprising: a) diagnosing a subject with sepsis according to the methods described herein; and b) administering to the subject a therapeutically effective amount of a broad spectrum antibiotic if the subject is diagnosed positive for sepsis.
In another embodiment, the invention includes a method of treating a subject suspected of having sepsis, the method comprising: a) receiving diagnostic information about the subject according to the methods described herein; and b) administering to the subject a therapeutically effective amount of a broad spectrum antibiotic if the patient is diagnosed positive for sepsis.
In another embodiment, the invention includes a method for monitoring the efficacy of a therapy for treating sepsis in a subject, the method comprising: measuring the expression levels of CEACAM1, ZDHHC19, C9orf95, GNA15, BATF, C3AR1, KIAA1370, TGFBI, MTCH1, RPGRIP1, and HLA-DPB1 biomarkers in a first sample derived from the subject prior to the subject undergoing the therapy and in a second sample derived from the subject subsequent to the subject undergoing the therapy, wherein an increased expression level of the CEACAM1, ZDHHC19, C9orf95, GNA15, BATF, and C3AR1 biomarkers and a decreased expression level of the KIAA1370, TGFBI, MTCH1, RPGRIP1, and HLA-DPB1 biomarkers in the second sample as compared to the expression level of the biomarkers in the first sample is indicative of worsening in the subject, and a decreased expression level of the CEACAM1, ZDHHC19, C9orf95, GNA15, BATF, and C3AR1 biomarkers and an increased expression level of the KIAA1370, TGFBI, MTCH1, RPGRIP1, and HLA-DPB1 biomarkers in the second sample as compared to the expression level of the biomarkers in the first sample is indicative of the subject improving. The method may further comprise calculating a sepsis score for the subject, wherein a higher sepsis score for the second sample as compared to the sepsis score for the first sample indicates worsening in the subject, and a lower sepsis score for the second sample as compared to the sepsis score for the first sample indicates improvement in the subject.
B. Detecting and measuring biomarkers
It is understood that the biomarkers in the sample can be measured by any suitable method known in the art. The measurement of the expression level of the biomarker may be direct or indirect. For example, the abundance level of RNA or protein can be quantified directly. Alternatively, the amount of a biomarker can be determined indirectly by measuring the abundance level of cDNA, amplified RNA or DNA, or by measuring the amount or activity of RNA, protein or other molecules (e.g., metabolites) indicative of the expression level of the biomarker. Methods for measuring biomarkers in a sample have many applications. For example, one or more biomarkers may be measured to aid in the diagnosis of sepsis, to determine a treatment appropriate for the subject, to monitor the subject's response to treatment, or to identify therapeutic compounds that modulate the expression of the biomarkers in vivo or in vitro.
Detecting biomarker polynucleotides
In one embodiment, the expression level of the biomarker is determined by measuring the polynucleotide level of the biomarker. Transcript levels of a particular biomarker gene may be determined from the amount of mRNA or polynucleotide derived therefrom present in the biological sample. Polynucleotides can be detected and quantified by a variety of methods including, but not limited to, microarray analysis, Polymerase Chain Reaction (PCR), reverse transcriptase polymerase chain reaction (RT-PCR), Northern blotting, and Serial Analysis of Gene Expression (SAGE). See, e.g., Draghicii "Tools for Data Analysis of DNA Microarrays (Data Analysis Tools for DNA microarray"), Chapman and Hall/CRC, 2003; simon et al Design and Analysis of DNA Microarray Studies (Design and Analysis of DNA Microarray investments), Springer, 2004; real-time PCR: current technologies and Applications (Real-Time PCR), Logan, Edwards and Saunders, Caister Academic Press, 2009; bustin "Quantitative PCR A-Z (A-Z of Quantitative PCR)", (IUL Biotechnology, stage 5), International University Line, 2004; velculescu et al (1995) science 270: 484-; matsumura et al (2005) cytomicrobiology (cell. Microbiol.) 7: 11-18; serial Analysis of Gene Expression (SAGE): methods and Protocols (Methods in Molecular Biology) (Serial Analysis of Gene Expression (SAGE): Methods and Protocols (Methods in Molecular Biology)), Humana Press, 2008; which is incorporated herein by reference in its entirety.
In one embodiment, the microarray is used to measure the level of a biomarker. An advantage of microarray analysis is that the expression of each biomarker can be measured simultaneously, and microarrays can be specifically designed to provide diagnostic expression profiles for a particular disease or condition (e.g., sepsis).
Microarrays are prepared by selecting probes comprising polynucleotide sequences and then immobilizing such probes on a solid support or surface. For example, the probe may comprise a DNA sequence, an RNA sequence, or a copolymer sequence of DNA and RNA. The polynucleotide sequence of the probe may further comprise DNA and/or RNA analogs or combinations thereof. For example, the polynucleotide sequence of a probe may be a complete or partial fragment of genomic DNA. The polynucleotide sequence of the probe may also be a synthetic nucleotide sequence, such as a synthetic oligonucleotide sequence. The probe sequence may be synthesized enzymatically in vivo, enzymatically in vitro (e.g., by PCR), or non-enzymatically in vitro.
The probes used in the method of the invention are preferably immobilized on a solid support, which may be porous or non-porous. For example, the probe may be a polynucleotide sequence covalently linked to a nitrocellulose or nylon membrane or filter at the 3 'or 5' end of the polynucleotide. Such hybridization probes are well known in the art (see, e.g., Sambrook et al, molecular cloning: A laboratory Manual (3 rd edition, 2001.) alternatively, the solid support or surface can be a glass or plastic surface.
In one embodiment, the microarray comprises a support or surface having an ordered array of binding (e.g., hybridization) sites or "probes" each representing one of the biomarkers described herein. Preferably, the microarray is an addressable array, and more preferably a positionally addressable array. More particularly, each probe of the array is preferably located at a known, predetermined position on the solid support, such that the identity (i.e., sequence) of each probe can be determined by its position in the array (i.e., on the support or surface). Each probe is preferably covalently attached to the solid support at a single site.
Microarrays can be fabricated in a variety of ways, several of which are described below. Microarrays share some features regardless of how they are produced. The arrays are reproducible, allowing multiple copies of a given array to be produced and easily compared to each other. Preferably, the microarray is made of a material that is stable under binding (e.g., nucleic acid hybridization) conditions. Microarrays are generally small, e.g., at 1cm2And 25cm2To (c) to (d); however, larger arrays may also be used, for example in screening arrays. Preferably, a given binding site or a unique set of binding sites in a microarray will specifically bind (e.g., hybridize) to the product of a single gene in a cell (e.g., a specific mRNA or a specific cDNA derived therefrom). However, in general, other related or similar sequences will cross-hybridize to a given binding site.
As noted above, a "probe" that specifically hybridizes to a particular polynucleotide molecule contains a complementary polynucleotide sequence. The probes of the microarray generally consist of a nucleotide sequence of not more than 1,000 nucleotides. In some embodiments, the probes of the array consist of a nucleotide sequence having from 10 to 1,000 nucleotides. In one embodiment, the nucleotide sequence of the probe is in the range of 10-200 nucleotides in length and is a genomic sequence of one species of organism, so that there are a plurality of different probes whose sequences are complementary to and thus capable of hybridizing to the genome of such species of organism, laid out sequentially over all or a portion of the genome. In other embodiments, the probe is in the range of 10-30 nucleotides in length, in the range of 10-40 nucleotides in length, in the range of 20-50 nucleotides in length, in the range of 40-80 nucleotides in length, in the range of 50-150 nucleotides in length, in the range of 80-120 nucleotides in length, or is 60 nucleotides in length.
The probe may comprise DNA or DNA "mimics" (e.g., derivatives and analogs) corresponding to a portion of the organism's genome. In another embodiment, the probes of the microarray are complementary RNAs or RNA mimics. DNA mimetics are polymers composed of subunits that can hybridize to DNA-specific Watson-Crick-like hybridization (Watson-Crick-like hybridization) or to RNA-specific hybridization. The nucleic acid may be modified at the base moiety, sugar moiety, or phosphate backbone (e.g., phosphorothioate).
The DNA may be obtained, for example, by Polymerase Chain Reaction (PCR) amplification of genomic DNA or cloned sequences. The PCR primers are preferably selected based on the known sequence of the genome, which will allow amplification of specific fragments of genomic DNA. Computer programs well known in the art can be used to design primers with the desired specificity and optimal amplification properties, such as Oligo version 5.0 (National Biosciences). The length of each probe on the microarray will typically be between 10 bases and 50,000 bases, usually between 300 bases and 1,000 bases. PCR methods are well known in the art and are described, for example, in Innis et al, eds. "PCR protocols: methods And application guidelines (PCR Protocols: A Guide To Methods And Applications), academic Press, san Diego, Calif. (1990); which is incorporated herein by reference in its entirety. It will be clear to those skilled in the art that controlled robotic systems can be used to isolate and amplify nucleic acids.
A preferred alternative for generating polynucleotide probes is by synthesis of polynucleotides or oligonucleotides, for example using N-phosphonate or phosphoramidite chemistry (Froehler et al, Nucleic Acid research Res. 14:5399-5407 (1986); McBride et al, Tetrahedron letters 24:246-248 (1983)). The length of the synthetic sequence is typically between about 10 and about 500 bases, more typically between about 20 and about 100 bases and most preferably between about 40 and about 70 bases in length. In some embodiments, the synthetic nucleic acid includes a non-natural base, such as (but in no way limited to) inosine. As indicated above, the nucleic acid analogs can serve as binding sites for hybridization. Examples of suitable nucleic acid analogues are peptide nucleic acids (see, e.g., Egholm et al, Nature 363:566-568 (1993); U.S. Pat. No. 5,539,083).
Probes are preferably selected using algorithms that take into account binding energy, base composition, sequence complexity, cross-hybridization binding energy, and secondary structure. See Friend et al, published in international patent publication WO 01/05935,2001, 1 month 25; hughes et al, Nature Biotechnology (Nat. Biotech.) 19:342-7 (2001).
It will also be appreciated by those skilled in the art that positive control probes (e.g., probes known to be complementary to and hybridizable to sequences in the target polynucleotide molecule) and negative control probes (e.g., probes known to be non-complementary to and non-hybridizable to sequences in the target polynucleotide molecule) should be included on the array. In one embodiment, positive controls are synthesized along the perimeter of the array. In another embodiment, positive controls are synthesized in diagonal stripes across the array. In yet another embodiment, the reverse complement of each probe is synthesized at a position immediately adjacent to the probe to serve as a negative control. In yet another embodiment, sequences from other species of organisms are used as negative controls or as "incorporation" controls.
The probe is attached to a solid support or surface, which may be fabricated, for example, from glass, plastic (e.g., polypropylene, nylon), polyacrylamide, nitrocellulose, gel, or other porous or non-porous material. One method for attaching nucleic acids to a surface is by printing on a glass plate, as generally described by Schena et al, science 270:467-470 (1995). This method is particularly useful for the preparation of microarrays of cDNA (see also DeRisi et al, Nature Genetics 14:457-460 (1996); Shalon et al, Genome research 6:639-645 (1996); and Schena et al, Proc. Natl. Acad. Sci. USA 93:10539-11286 (1995); incorporated herein by reference in its entirety).
The second method for manufacturing microarrays produces high density oligonucleotide arrays. Techniques are known for generating arrays containing thousands of oligonucleotides complementary to a defined sequence at defined locations on a surface using photolithographic techniques for in situ synthesis (see Fodor et al, 1991, science 251: 767-773; Pease et al, 1994, Proc. Natl. Acad. Sci. USA 91: 5022-5022; Lockhart et al, 1996, Nature. Biotechnology 14: 1675; U.S. Pat. No. 5,578,832; 5,556,752; and 5,510,270; incorporated herein by reference in their entirety) or other methods for rapid synthesis and deposition of defined oligonucleotides (Blancard et al, Biosensors and Bioelectronics 11: 687-690; incorporated herein by reference in its entirety). When using these methods, oligonucleotides (e.g., 60 mers) of known sequence are synthesized directly on a surface (e.g., derivatized glass slides). Typically, the resulting array is redundant, with several oligonucleotide molecules per RNA.
Other methods for making microarrays can also be used, such as by masking (Maskos and Southern,1992, nucleic acids Res. 20: 1679-. In principle, any type of array can be used, for example dot blots on nylon hybridization membranes (cf. Sambrook et al, molecular cloning: A laboratory Manual, 3 rd edition, 2001). However, those skilled in the art will recognize that very small arrays will often be preferred because the hybridization volume will be smaller.
Microarrays can also be made with the aid of inkjet printing devices for oligonucleotide synthesis, for example using a microarray manufactured by Blanchard in U.S. patent No. 6,028,189; blancard et al, 1996, biosensor and bioelectronics 11: 687-; blancard, 1998 Synthetic DNA Arrays in Genetic Engineering, Vol.20, J.K. Setlow, Plenum Press, N.Y. at page 111-The methods and systems described (which are incorporated herein by reference in their entirety). In particular, the oligonucleotide probes in such microarrays are synthesized in an array format, e.g., on a glass slide, by successively depositing individual nucleotide bases in "microdroplets" of a high surface tension solvent, such as propylene carbonate. The microdroplets have a small volume (e.g., 100pL or less, more preferably 50pL or less) and are separated from each other on the microarray (e.g., by hydrophobic domains) to form circular surface tension wells that define the locations of the array elements (i.e., different probes). Microarrays made by this ink-jet method typically have a high density, preferably with every 1cm2A density of at least about 2,500 different probes. The polynucleotide probe is covalently linked to a support at the 3 'or 5' end of the polynucleotide.
Biomarker polynucleotides that can be measured by microarray analysis can be expressed RNA or nucleic acids derived therefrom (e.g., cDNA or amplified RNA derived from cDNA incorporated into an RNA polymerase promoter), including naturally occurring nucleic acid molecules as well as synthetic nucleic acid molecules. In one embodiment, the polynucleotide molecule of interest comprises RNA, including (but in no way limited to) total cellular RNA, poly (A)+Messenger RNA (mRNA) or fragments thereof, cytoplasmic mRNA, or RNA transcribed from cDNA (i.e., cRNA; see, e.g., Linsley and Schelter, U.S. patent application Ser. No. 09/411,074 filed 10/4 1999 or U.S. Pat. Nos. 5,545,522, 5,891,636, or 5,716,785). For the preparation of Total RNA and Poly (A)+Methods for RNA are well known in the art and are generally described, for example, in Sambrook et al, molecular cloning: a laboratory Manual (3 rd edition, 2001). Guanidinium thiocyanate lysis followed by CsCl centrifugation (Chirgwin et al, 1979, biochemistry 18:5294-&Sons corporation, new yorkPages 13.12.1-13.12.5). Poly (A)+RNA can be selected, for example, by selection with oligo-dT cellulose or, alternatively, by reverse transcription of oligo-dT-guided total cellular RNA. RNA can be prepared by methods known in the art, e.g., by reaction with ZnCl2Incubated together and fragmented to produce RNA fragments.
In one embodiment, the total RNA, mRNA, or nucleic acid derived therefrom is isolated from a sample obtained from a septic patient. Biomarker polynucleotides that are weakly expressed in specific cells may be enriched using normalization techniques (Bonaldo et al, 1996, genomic research 6: 791-806).
As described above, the biomarker polynucleotide may be detectably labeled at one or more nucleotides. Any method known in the art may be used to label the target polynucleotide. Preferably, this label is incorporated uniformly along the length of the RNA, and more preferably, the labeling is performed with a high degree of efficiency. For example, polynucleotides may be labeled by oligo dT-directed reverse transcription. Random primers (e.g., 9 mers) can be used for reverse transcription to incorporate labeled nucleotides uniformly over the entire length of the polynucleotide. Alternatively, random primers can be used in conjunction with PCR methods or in vitro transcription methods based on the T7 promoter to amplify the nucleotides.
The detectable label may be a luminescent label. For example, fluorescent, bioluminescent, chemiluminescent, and colorimetric labels may be used in the practice of the present invention. Fluorescent labels that may be used include, but are not limited to, fluorescein, phosphor, rhodamine, or polymethine dye derivatives. In addition, commercially available fluorescent labels may be used, including, but not limited to, fluorescent phosphoramidites such as FluorePrime (Amersham Pharmacia, Piscataway, N.J.), Fluoredite (Miiliplore, Bedford, Mass.), FAM (ABI, Foster City, Calif.) and Cy3 or Cy5(Amersham Pharmacia, Piscataway, N.J.). Alternatively, the detectable label may be a radiolabeled nucleotide.
In one embodiment, biomarker polynucleotide molecules from a patient sample are labeled in a manner that is distinguishable from the corresponding polynucleotide molecules of a reference sample. The reference can comprise a polynucleotide molecule from a normal biological sample (i.e., a control sample, e.g., blood from a subject not suffering from sepsis) or from a sepsis reference biological sample (e.g., blood from a subject suffering from sepsis).
Nucleic acid hybridization and washing conditions are selected such that the polynucleotide molecule of interest specifically binds or specifically hybridizes to a specific array site of the array at which the complementary polynucleotide sequence, preferably its complementary DNA, is located. The array containing double-stranded probe DNA positioned thereon is preferably subjected to denaturing conditions to render the DNA single-stranded prior to contact with the target polynucleotide molecule. Arrays containing single-stranded probe DNA (e.g., synthetic oligodeoxynucleotides) may need to be denatured prior to contacting with the target polynucleotide molecules, e.g., to remove hairpins or dimers formed due to self-complementary sequences.
Optimal hybridization conditions will depend on the length (e.g., oligo pair of polynucleotides greater than 200 bases) and type (e.g., RNA or DNA) of the probe and target nucleic acid. It will be appreciated by those skilled in the art that, due to the short length of the oligonucleotide, it may be necessary to adjust its length to achieve a relatively uniform melting temperature in order to obtain satisfactory hybridization results. General parameters for specific (i.e., stringent) hybridization conditions for nucleic acids are described in Sambrook et al, molecular cloning: a laboratory Manual (3 rd edition, 2001) and Ausubel et al, modern methods in molecular biology, Vol.2, Current Protocols Publishing, New York (1994). Typical hybridization conditions for cDNA microarrays by Schena et al are hybridization in 5 XSSC + 0.2% SDS at 65 ℃ for four hours, followed by washing in low stringency wash buffer (1 XSSC + 0.2% SDS) at 25 ℃ followed by washing in higher stringency wash buffer (0.1 XSSC + 0.2% SDS) at 25 ℃ for 10 minutes (Schena et al, Proc. Natl. Acad. Sci. USA 93:10614 (1993)). Useful Hybridization conditions are also provided in, for example, Tijessen,1993, "Hybridization With Nucleic Acid Probes (Hybridization With Nucleic Acid Probes"), Elsevier Science Publishers; and Kricka,1992, "Nonisotopic DNA Probe technology" (Biotech research), academic Press, san Diego, Calif. Particularly preferred hybridization conditions include hybridization in 1M NaCl, 50mM MES buffer (pH 6.5), 0.5% sodium sarcosinate and 30% formamide at a temperature at or near the average melting temperature of the probe (e.g., within 51 ℃, more preferably within 21 ℃).
When fluorescently labeled gene products are used, the fluorescence emission at each site of the microarray can preferably be detected by scanning confocal laser microscopy. In one embodiment, a separate scan is performed for each of the two fluorophores used, using the appropriate excitation light line. Alternatively, a laser that allows simultaneous sample illumination at wavelengths specific for two fluorophores can be used, and emissions from both fluorophores can be analyzed simultaneously (see Shalon et al, 1996, "DNA microarray system for analyzing complex DNA samples using two-color fluorescent probe hybridization," genomic research 6:639-645, incorporated by reference in its entirety for all purposes). The array can be scanned using a laser fluorescence scanner with a computer controlled X-Y stage and microscope objective. Sequential excitation of the two fluorophores is achieved using a multi-line mixed gas laser, and the emitted light is separated by wavelength and detected with two photomultiplier tubes. Fluorescent laser scanning devices are described in Schena et al, genome research 6: 639-. Alternatively, a fiber optic bundle as described by Ferguson et al, Nature Biotechnology 14: 1681-.
In one embodiment, the invention includes a microarray comprising an oligonucleotide that hybridizes to a CEACAM1 polynucleotide, an oligonucleotide that hybridizes to a ZDHHC19 polynucleotide, an oligonucleotide that hybridizes to a C9orf95 polynucleotide, an oligonucleotide that hybridizes to a GNA15 polynucleotide, an oligonucleotide that hybridizes to a BATF polynucleotide, an oligonucleotide that hybridizes to a C3AR1 polynucleotide, an oligonucleotide that hybridizes to a KIAA1370 polynucleotide, an oligonucleotide that hybridizes to a TGFBI polynucleotide, an oligonucleotide that hybridizes to a MTCH1 polynucleotide, an oligonucleotide that hybridizes to an RPGRIP1 polynucleotide, and an oligonucleotide that hybridizes to an HLA-DPB1 polynucleotide.
Polynucleotides can also be analyzed by other methods, including (but not limited to) northern blotting, nuclease protection analysis, RNA fingerprinting, polymerase chain reaction, ligase chain reaction, Q.beta.replicase, isothermal amplification methods, strand displacement amplification, transcription-based amplification systems, nuclease protection (S1 nuclease or RNase protection analysis), SAGE, and methods disclosed in International publications Nos. WO 88/10315 and WO 89/06700 and International applications Nos. PCT/US87/00880 and PCT/US 89/01025; which is incorporated herein by reference in its entirety.
Standard Northern blot analysis may be used to determine the size of the RNA transcript, identify alternatively spliced RNA transcripts, and the relative amount of mRNA in the sample, according to conventional Northern hybridization techniques known to those of ordinary skill in the art. In Northern blotting, RNA samples are first size separated by agarose gel electrophoresis under denaturing conditions. The RNA is then transferred to a membrane, crosslinked and hybridized with labeled probes. Non-isotopically or highly radioactive radiolabeled probes may be used, including randomly guided, nicked translated or PCR generated DNA probes, in vitro transcribed RNA probes and oligonucleotides. In addition, sequences having only partial homology (e.g., cDNAs from different species or genomic DNA fragments that may contain exons) may be used as probes. A labeled probe (e.g., radiolabeled cDNA) containing a full-length single-stranded DNA or a fragment of a DNA sequence may be at least 20, at least 30, at least 50, or at least 100 contiguous nucleotides in length. The probes may be labeled by any of a number of different methods known to those of skill in the art. The labels most commonly used for these studies are radioactive elements, enzymes, chemicals that fluoresce when exposed to ultraviolet light, and the like. A variety of fluorescent materials are known and can be used as labels. These fluorescent materials include, but are not limited to, fluorescein, rhodamine, auramine, Texas Red, AMCA blue, and fluorescein. The specific detection material is an anti-rabbit antibody prepared in goat and conjugated with fluorescein via isothiocyanate. Proteins may also be labeled with radioactive elements or enzymes. RadioactivityThe marker may be detected by any of the currently available counting procedures. Isotopes that can be used include (but are not limited to)3H、14C、32P、35S、36Cl、35Cr、57Co、58Co、59Fe、90Y、125I、131I and186re. Enzyme labels are also useful and can be detected by any of the presently employed colorimetric, spectrophotometric, fluorospectrophotometric, amperometric or gasometric techniques. The enzyme is bound to the selected particle by reaction with a bridging molecule such as carbodiimide, diisocyanate, glutaraldehyde, and the like. Any enzyme known to those skilled in the art may be used. Examples of such enzymes include, but are not limited to, peroxidase, beta-D-galactosidase, urease, glucose oxidase plus peroxidase, and alkaline phosphatase. For example, reference is made to the disclosures of U.S. patent nos. 3,654,090, 3,850,752, and 4,016,043 for alternative marking materials and methods.
Nuclease protection assays (including ribonuclease protection assays and S1 nuclease assays) can be used to detect and quantify specific mRNA. In nuclease protection assays, antisense probes (e.g., radiolabeled or non-isotopically labeled) are hybridized to RNA samples in solution. After hybridization, the unhybridized single-stranded probe and RNA are degraded with a nuclease. The remaining protected fragments were separated using an acrylamide gel. In general, solution hybridization is more efficient than membrane-based hybridization and can accommodate up to 100. mu.g of sample RNA compared to blot hybridization of up to 20-30. mu.g.
Ribonuclease protection assays, the most common type of nuclease protection assay, require the use of RNA probes. Oligonucleotides and other single stranded DNA probes can only be used for assays containing S1 nuclease. Single-stranded antisense probes must generally be completely homologous to the target RNA to prevent nuclease cleavage of the probe-target hybridization.
Serial Analysis of Gene Expression (SAGE) can also be used to determine RNA abundance in cell samples. See, e.g., Velculescu et al, 1995, science 270: 484-7; caruli et al, 1998, Journal of cell biochemistry (Journal of Cellular biochemistry)y) increasing supplement 30/31, 286-96; which is incorporated herein by reference in its entirety. SAGE analysis does not require a special detection device and is one of the preferred analytical methods for simultaneously detecting the expression of a large number of transcripts. First, poly A is extracted from cells+RNA. Next, the RNA was converted to cDNA using biotinylated oligo (dT) primer and treated with four base recognition restriction enzyme (Anchorase: AE) to generate AE treated fragments containing a biotin group at the 3' end. The AE treated fragments were then incubated with streptavidin for binding. The bound cDNA is divided into two portions and each portion is then ligated to a different double-stranded oligonucleotide adaptor (linker) a or B. These linkers are composed of: (1) an overhanging single-stranded portion having a sequence complementary to that of the overhanging portion formed by the action of the anchor enzyme, (2) a 5' nucleotide recognition sequence of a type IIS restriction enzyme acting as a Taggant (TE) (cleaved at a predetermined position not more than 20bp away from the recognition site), and (3) an additional sequence of sufficient length for constructing a PCR-specific primer. The linker-ligated cDNA is cleaved using a taglase and only the portion of the linker-ligated cDNA sequence present as a short sequence tag is retained. Next, pools of short sequence tags from two different types of linkers are ligated to each other, followed by PCR amplification using primers specific for linkers A and B. Thus, amplification products are obtained as a mixture of sequences comprising two adjacent sequence tags (ditags) bound to linkers a and B. The amplification product is treated with an anchor enzyme and free ditag moieties are ligated into strands in a standard ligation reaction. The amplification product is subsequently cloned. Determination of the nucleotide sequence of the clone can be used to obtain a read sequence of a continuous ditag of constant length. The presence of mRNA corresponding to each tag can then be identified from the cloned nucleotide sequence and information about the sequence tags.
Quantitative reverse transcriptase PCR (qRT-PCR) can also be used to determine the expression profile of a biomarker (see, e.g., U.S. patent application publication No. 2005/0048542a 1; which is incorporated by reference herein in its entirety). The first step in gene expression profiling by RT-PCR is to reverse transcribe the RNA template into cDNA, which is then exponentially amplified in a PCR reaction. The two most commonly used reverse transcriptases are avian myeloblastosis virus reverse transcriptase (AMV-RT) and Moloney murine leukemia virus reverse transcriptase (MLV-RT). The reverse transcription step is usually primed with specific primers, random hexamer or oligo dT primers, depending on the context and target of the expression profiling. For example, the extracted RNA can be reverse transcribed using the GeneAmp RNA PCR kit (Perkin Elmer, ca, usa) according to the manufacturer's instructions. The resulting cDNA can then be used as a template for subsequent PCR reactions.
Although a variety of thermostable DNA-dependent DNA polymerases can be used for the PCR step, it is common to employ Taq DNA polymerase, which has 5'-3' nuclease activity but does not have 3'-5' proofreading endonuclease activity. TAQMAN PCR thus generally utilizes the 5 '-nuclease activity of Taq or Tth polymerase to hydrolyze hybridization probes bound to their target amplicons, but any enzyme having equivalent 5' nuclease activity can be used. Two oligonucleotide primers were used to generate amplicons typical of a PCR reaction. The third oligonucleotide or probe is designed to detect a nucleotide sequence located between the two PCR primers. The probe is not extendable by Taq DNA polymerase and is labeled with a reporter fluorescent dye and a quencher fluorescent dye. When the two dyes are positioned as closely together as they are on the probe, any laser-induced emission from the reporter dye is quenched by the quenching dye. During the amplification reaction, Taq DNA polymerase cleaves the probe in a template-dependent manner. The resulting probe fragments dissociate in solution and the signal from the released reporter dye is free of quenching effects of the second fluorophore. Newly synthesized release one molecule of reporter dye per molecule, and detection of unquenched reporter dye provides the basis for quantitative interpretation of the data.
TAQMAN RT-PCR can be performed using commercially available equipment, such as the ABI PRISM 7700 sequence detection System (Perkin Elmer applied biosystems, Forster, Calif., USA) or Lightcycler (Roche Molecular Biochemicals, Mannheim, Germany). In a preferred embodiment, the 5' nuclease program is run on a real-time quantitative PCR device such as the ABI PRISM 7700 sequence detection system. The system consists of a thermal cycler, a laser, a charge-coupled device (CCD), a camera and a computer. The system includes software for running the instrument and for analyzing the data. The 5' -nuclease assay data was first expressed as Ct or threshold cycle. Fluorescence values were recorded during each cycle and represent the amount of product amplified to that point in the amplification reaction. The point when the fluorescence signal was first recorded as statistically significant is the threshold cycle (Ct).
To minimize the effects of errors and sample-to-sample variations, RT-PCR is typically performed using internal standards. The ideal internal standard is expressed at a constant level among different tissues and is not affected by experimental treatment. The most frequently used RNAs for normalizing gene expression profiles are the mRNAs for the housekeeping genes glyceraldehyde-3-phosphate dehydrogenase (GAPDH) and β -actin.
A more recent variation of the RT-PCR technique is real-time quantitative PCR, which measures the accumulation of PCR products via a dual-labeled fluorogenic probe (i.e., TAQMAN probe). Real-time PCR is compatible with both quantitative competitive PCR using normalization by an internal competitor for each target sequence and quantitative comparative PCR using normalization genes contained within the sample or housekeeping genes for RT-PCR. For more details, see, e.g., Held et al, genome research 6: 986-.
Analysis of biomarker data
To assess whether a patient has sepsis or systemic inflammation due to a non-infectious source, such as traumatic injury, surgery, autoimmune disease, thrombosis, or Systemic Inflammatory Response Syndrome (SIRS), biomarker data may be analyzed by various methods to identify biomarkers and determine the statistical significance of the observed differences in biomarker levels between the test expression profile and the reference expression profile. In certain embodiments, the patient data is analyzed by one or more methods including, but not limited to, multivariate Linear Discriminant Analysis (LDA), Receiver Operating Characteristics (ROC) analysis, Principal Component Analysis (PCA), ensemble data mining methods, Significance Analysis of Microarrays (SAM), cell-specific significance analysis of microarrays (csSAM), spanning tree progression analysis of density normalized events (SPADE), and multi-dimensional protein identification technology (MUDPIT) analysis. (see, e.g., Hilbe (2009) Logistic Regression Models, Chapman & Hall/CRC Press, McLachlan (2004) Discriminant Analysis and Statistical Pattern Recognition, Wiley Interscience 577, Zweig et al (1993) clinical chemistry, Clin.Chem., 39:561-577, Pepe (2003) Statistical evaluation of medical tests for classification and prediction, The national information for classification and prediction, NY: Oxford, Sing et al (2005) bioinformation (bioinformation 3921: 21: 40; Sha & predition), The national information for clinical research Models and prediction, The national information for clinical research Models, 5142, The national information for research, Biond, Biotechnology, Biometrics, Biond 3, Biometrics 3940, The journal of clinical research, No. 3, Ten & gt, No. 11, The national information for research, No. 21, 5, The national information for biological research, Zollings, and Statistical evaluation, The national information for research, Zollings, The national research, The national information for research, No. 11, The national information for research, The national information for research, The national Models, The national information for research, The national Models, The national information for research, The national information for research, The national information for The national Models, The national information for The national Models, The national research, The national information for The national Models, The national research, The national information for The national research, The national Models, The national information for The national Models 230; Shen-Orr et al (2010) J Immunol 184: 144-130; 886-891 in Qiu et al (2011) Nature & Biotechnology 29 (10); ru, et al (2006) J.chromatographic journal A (J.chromatographic. A.) -1111 (2) 166-174, Jolliffe principal component analysis (Springer Series Statistics in Statistics, 2 nd edition, Springer, N.Y., 2002), Koren, et al (2004) IEEE visualization and computer graphics (IEEE Trans Vis comprehensive Graph) 10: 459-470; which is incorporated herein by reference in its entirety. )
C. Reagent kit
In yet another aspect, the present invention provides a kit for diagnosing sepsis, wherein the kit can be used to detect the biomarkers of the present invention. For example, the kit can be used to detect any one or more of the biomarkers described herein that are differentially expressed in samples of septic patients and healthy or uninfected subjects. The kit may include one or more agents for detecting a biomarker, a container for holding a biological sample isolated from a human subject suspected of having sepsis; and printed instructions for reacting the agent with the biological sample or a portion of the biological sample to detect the presence or amount of at least one sepsis biomarker in the biological sample. The medicament may be enclosed in a separate container. The kit may additionally comprise one or more control reference samples and reagents for performing an immunoassay or microarray analysis.
In certain embodiments, the kit comprises an agent for measuring the level of at least eleven biomarkers of interest. For example, a kit can include an agent for detecting a panel of biomarkers comprising a CEACAM1 polynucleotide, a ZDHHC19 polynucleotide, a C9orf95 polynucleotide, a GNA15 polynucleotide, a BATF polynucleotide, a C3AR1 polynucleotide, a KIAA1370 polynucleotide, a TGFBI polynucleotide, a MTCH1 polynucleotide, an RPGRIP1 polynucleotide, and an HLA-DPB1 polynucleotide. In addition, the kit may include agents for detecting more than one biomarker panel (e.g., two or three biomarker panels), which may be used alone or in any combination and/or in combination with clinical parameters for sepsis diagnosis.
In certain embodiments, the kit comprises a microarray for analyzing a plurality of biomarker polynucleotides. Exemplary microarrays included in the kit comprise oligonucleotides that hybridize to CEACAM1 polynucleotide, oligonucleotides that hybridize to ZDHHC19 polynucleotide, oligonucleotides that hybridize to C9orf95 polynucleotide, oligonucleotides that hybridize to GNA15 polynucleotide, oligonucleotides that hybridize to BATF polynucleotide, oligonucleotides that hybridize to C3AR1 polynucleotide, oligonucleotides that hybridize to KIAA1370 polynucleotide, oligonucleotides that hybridize to TGFBI polynucleotide, oligonucleotides that hybridize to MTCH1 polynucleotide, oligonucleotides that hybridize to RPGRIP1 polynucleotide, and oligonucleotides that hybridize to HLA-DPB1 polynucleotide.
The kit may comprise one or more containers for holding the compositions contained in the kit. The composition may be in liquid form or may be lyophilized. Suitable containers for the composition include, for example, bottles, vials, syringes, and test tubes. The container may be formed from a variety of materials, including glass or plastic. The kit may further comprise a package insert containing written instructions for a method of diagnosing sepsis.
The kits of the invention have a variety of applications. For example, the kit may be used to determine whether a subject has sepsis or some other inflammatory condition caused by a non-infectious source, such as traumatic injury, surgery, autoimmune disease, thrombosis, or Systemic Inflammatory Response Syndrome (SIRS). In another example, the kit can be used to determine whether a patient should be treated for sepsis, e.g., with a broad spectrum antibiotic. In another example, the kit can be used to monitor the effectiveness of a treatment in a patient with sepsis. In another example, the kit can be used to identify compounds that modulate the expression of one or more biomarkers in an in vitro or in vivo animal model to determine a therapeutic effect.
D. Diagnostic system and computerized method for sepsis diagnosis
In another aspect, the invention includes a computer-implemented method for diagnosing a patient suspected of having sepsis. The computer executes steps comprising: receiving input patient data comprising values for levels of one or more sepsis biomarkers in a biological sample from a patient; analyzing the level of one or more sepsis biomarkers and comparing to corresponding reference value ranges for the sepsis biomarkers; calculating an infection Z score or sepsis score for the patient; calculating a likelihood that the patient has sepsis; and displaying diagnostic information about the patient. In certain embodiments, the input patient data comprises values for levels of a plurality of sepsis biomarkers in a biological sample from the patient. In one embodiment, the patient data entered comprises level values for CEACAM1, ZDHHC19, C9orf95, GNA15, BATF, C3AR1, KIAA1370, TGFBI, MTCH1, RPGRIP1, and HLA-DPB1 polynucleotides.
In another aspect, the invention includes a diagnostic system for performing a computer-implemented method, as described. As shown in fig. 16, the diagnostic system 100 includes a computer 110 having a processor 130, a storage component (i.e., memory) 120, a display component 150, and other components typically found in general purpose computers. The storage component 120 stores information accessible by the processor 130, including instructions executable by the processor 130 and data retrievable, manipulated, or stored by the processor.
The storage component includes instructions for determining a diagnosis of the subject. For example, the storage component includes instructions for calculating an infection Z score or sepsis score for the subject based on the biomarker expression levels as described herein (see examples 1 and 2). Further, the storage component can additionally comprise instructions for performing multivariate Linear Discriminant Analysis (LDA), Receiver Operating Characteristics (ROC) analysis, Principal Component Analysis (PCA), ensemble data mining methods, cell-specific significance analysis of microarrays (csSAM), and multidimensional protein identification technology (MUDPIT) analysis. The computer processor 130 is coupled to the storage component 120 and is configured to execute instructions stored in the storage component in order to receive patient data and analyze the patient data according to one or more algorithms. The display assembly 150 displays diagnostic information about the patient.
The instructions may be any set of instructions to be executed directly (e.g., machine code) or indirectly (e.g., scripts) by the processor. For purposes of this specification, the terms "instructions," "steps," and "programs" are used interchangeably herein. The instructions may be stored in object code that is directly processed by the processor, or in any other computer language including scripts or separate sets of source code modules that are interpreted on demand or compiled in advance.
Data may be retrieved, stored, or modified by the processor 130 according to instructions. For example, while the diagnostic system is not limited by any particular data structure, the data may be stored in computer registers, in a relational database in the form of a table, XML document, or flat file having a variety of different fields or records. The data may also be formatted in any computer-readable format, such as (but not limited to) binary values, ASCII, or unicode. Further, the data may contain any information sufficient to identify the relevant information, such as numbers, descriptive text, proprietary codes, pointers, references to data stored in other memories (including other network locations), or information used by functions that calculate the relevant data.
In certain embodiments, the processor and memory components may comprise multiple processors and memory components that may or may not be stored within the same physical housing. For example, some instructions and data may be stored on a removable CD-ROM and other instructions and data stored within a read-only computer chip. Some or all of the instructions and data may be stored in a location that is physically remote from the processor but still accessible by the processor. Similarly, a processor may actually comprise a collection of processors that may or may not operate in parallel.
In one aspect, the computer 110 is a server in communication with one or more client computers 140, 170. Each client computer may be configured similarly to server 110, with a processor, storage components, and instructions. Each client computer 140, 170 may be a personal computer dedicated for use by an individual 190 and 191, having all internal components typically found in a personal computer, such as a Central Processing Unit (CPU), a display 150 (e.g., a monitor that displays information processed by the processor), a CD-ROM, a hard drive, a user input device (e.g., a mouse, keyboard, touch screen, or microphone) 160, speakers, a modem, and/or a network interface device (telephone, cable, or otherwise), and all components used to connect these elements to one another and allow them to communicate (directly or indirectly) with one another. Further, a computer according to the systems and methods described herein may include any device capable of processing instructions and transmitting data to and from human beings and other computers, including network computers that do not have local storage capabilities.
Although client computers 140 and 170 may comprise full-size personal computers, many aspects of the systems and methods are particularly advantageous when used in conjunction with mobile devices capable of wirelessly exchanging data with a server via a network, such as the internet. For example, client computer 170 may be a wireless-enabled PDA, such as a blackberry cell phone, apple iPhone, or other Internet-enabled cell phone. In these aspects, the user may enter information using a keypad, touch screen, or any other user input means. The computer may have an antenna 180 for receiving wireless signals.
The server 110 and client computers 140, 170 are capable of direct and indirect communication, such as over a network 200. Although only a few computers are depicted in fig. 16, it should be understood that a typical system may include a large number of connected computers, each at a different node of the network 200. The networks and intervening nodes may comprise various combinations of devices and communication protocols, including the internet, world wide web, intranets, virtual private networks, wide area networks, local area networks, cellular telephone networks, private networks using one or more company-specific communication protocols, ethernet, WiFi, and HTTP. Such communications may be facilitated by any means capable of transmitting data to and from other computers, such as modems (e.g., dial-up or cable), networks, and wireless interfaces. The server 110 may be a web server.
While certain advantages are obtained when information is transmitted or received as noted above, other aspects of the systems and methods are not limited to any particular manner of information transmission. For example, in some aspects, information may be transferred via media such as magnetic disks, magnetic tapes, flash drives, DVDs, or CD-ROMs. In other aspects, the information may be transmitted in a non-electronic format and manually entered into the system. Further, while some functions are indicated as being performed on a server and other functions as being performed on a client, various aspects of the systems and methods may be implemented by a single computer having a single processor.
Experiment III
The following are examples of carrying out particular embodiments of the present invention. The examples are provided for illustrative purposes only and are not intended to limit the scope of the present invention in any way.
Efforts have been made to ensure accuracy with respect to numbers used (e.g., amounts, temperature, etc.) but some experimental error and deviation should be accounted for.
Example 1
Time-course-based comprehensive multi-population analysis of sepsis and sterile inflammation reveals a robust set of diagnostic genes
SUMMARY
We hypothesized that only time-matched comparisons, such as those comparing SIRS/trauma to sepsis at the same clinical time point, would result in genes that are robust in diagnosing sepsis. We performed a comprehensive time-course-based multi-population analysis of publicly available sepsis gene expression data to identify a conserved set of 11 genes that could robustly distinguish non-infectious inflammation (such as SIRS, trauma, and ICU arrest) from inflammation due to acute infection (such as in sepsis). This set of 11 genes had excellent diagnostic ability in the discovery cohort and was subsequently validated in 15 independent cohorts.
Results
Comprehensive search and labeled Principal Component Analysis (PCA) visualization
We identified 27 independent sets of gene expression data meeting our criteria from GEO and Arrayexpress including a total of 2,903 microarrays (Pankla et al (2009) < genome biology > 10: R127; Tang et al (2009) < critical Care medicine > < 37:882-888 >, Cvijanovich et al (2008) < physiological genes genol Genomics > < 34: 127-134; Shanley et al < 2007 > < molecular medicine > < 13:495-508 >; Wong et al < 2007 > < physiological genes > < 30:146-155 >; Wong et al < 2009 > < critical Care medicine > < 37 > < 1558-1566 >; Wong et al < 2010 > < pediatric Med > < pediatric risk medicine > < 11:349 >; Wong et al < 309 > < 11 >; Wong critical Care medicine > < 29 > < 11 > < J >; Mar 1558 > < 11 > < critical Care medicine > < 11 >; < 190 > < 11 >; Mar < 190 > < 11 >; Mar < 190 > < 11 >; < 190 > < 11 >; Shang > for critical Care medicine > < 11 > < 11 >; < 190 > < 11 >; < 190 >; Ben < 190 >; Wang > and > for critical Care medicine > < 9 > < 9 >; Wang > for critical Care medicine > < 9 >; < 190 > < 9 > < 9 > Loeches et al (2012) in intensive Care medical (Med Intensiva) 36: 257-263; tamayo et al (2012) J Critical Care & guards 27: 616-; hu et al (2013) Proc. Natl. Acad. Sci. USA 110: 12792-; parnell et al (2012) 'Critical Care' 16: R157; sutherland et al (2011) Critical Care 15: R149; tang et al (2006) J front Blood Flow Metab (J front Blood Flow Metab) 26: 1089-1102; tang et al (2007) Am J Respir Crit Care Med 176: 676-684; ahn et al (2013) public science library Integrated services (PLoS One) 8: e 48979; dolinay et al (2012) J.Med.Res.Med.Critical Med.Pat.No.185: 1225-1234; berdal et al (2011) J infection 63: 308-; berry et al (2010) Nature 466: 973-977; fredriksson et al (2008)' public science library & synthesis 3: e 3686; McDunn et al (2008) public science library, complex 3: e 1564; chung et al (2006) 203: 585-; parnell et al (2011) public science library & synthesis 6: e 17186; and emerts, the thesis of Ph.D. thesis, Erasmus University Rotterdam, University of Lutdanda (2008); which is incorporated herein by reference in its entirety). These 27 datasets contained only 22 independent cohorts, as six datasets from children SIRS/Septic Shock Genomics researchers (Genomics of Pediatric SIRS/Septic Shock Investigators, GPSSSI) were combined into a single cohort containing 219 SIRS or sepsis patients (cvijannovich et al, supra; Shanley et al, supra; Wong et al (2007), supra; Wong et al (2009), supra; Wong et al (2010, supra; Wong et al (2011), supra). Many of the samples used were from the Glue Grant wound dataset with a total of 333 patients (1301 samples used herein) sampled at up to 8 time points post traumatic injury. These 27 data sets contained a cohort of children and adults, males, and females with a mix of community-and hospital-acquired sepsis sampled from whole blood, neutrophils, and PBMCs.
First, we tried to use as simple a method as possible to find whether uninfected SIRS/trauma patients and sepsis/infected patients could be isolated by gene expression. We therefore co-normalised all available datasets comparing SIRS/trauma with sepsis/infection in a single matrix. Labeled PCA (using 168 genes identified by 10-fold cross-validated Lasso penalty logistic regression) showed that SIRS/trauma patients could be separated from sepsis patients with modest overlap (fig. 1A). Next, we labeled each sample as "early" (within 48 hours of admission) or "late" (more than 48 hours of admission). Most of the inseparable samples are 'late' samples (fig. 1B). This study result remained true even when we included healthy patients as a separate category (fig. 7). Previous studies have shown that gene expression changes non-linearly over time after trauma, burns or endotoxemia (Cobb et al, supra; Xiao et al, supra; Seok et al, supra; Desai et al, supra; and McDunn et al, supra). This continuous change in expression after the initial insult may explain that if treated equally for all time points, uninfected SIRS/trauma cannot be distinguished from sepsis in 'late' samples.
Therefore, we sought to qualitatively understand whether gene expression was similar among different cohorts during hospitalization after injury. We include all peripheral blood datasets that were examined longitudinally for gene expression over time after admission to a non-septic event. We used CUR matrix factorization to identify 100 genes that were mostly orthogonal to each other, and these were used for labeled PCA in categories determined by days post injury. It is reassuring that the gene expression set at each time point is closest to its defined time point (e.g., day [1,2) set preceded by day [0,1) and followed by day [2, 3)). Furthermore, changes in expression over time account for most of the variance in the dataset, as evidenced by changes in each of the first three labeled principal components for different day groups. In summary, our analysis showed that changes in gene expression after wound/ICU harvesting (1) continued in a non-linear fashion over time, and (2) showed similar changes over time across the data set.
Time-matched multi-cohort analysis
Since changes in gene expression account for the large number of variances in the data set after a wound admission, and since these changes continue non-linearly, direct comparison of patients at admission to the same patient days post-infection will be confused by 'normal' changes in expression due to recovery from the stimulatory event and 'abnormal' changes due to hospital-acquired infection. Cleaning up these variations would be extremely difficult, if not impossible. Therefore, a biomarker that can robustly distinguish infected from non-infected patients will not be available regardless of the comparison of clinical time (fig. 1). Therefore, we only focus on the infection data set of the uninfected group that also includes time matching (to allow direct comparison of time matching). We therefore split the data set into two groups: (1) comparing patient hospitalized for trauma, surgery or critical illness to datasets of patients hospitalized for sepsis (GSE28750(Sutherland et al, supra), GSE32707(Dolinay et al, supra), GSE40012(Parnell et al, supra) and gps si characteristic combined dataset (n 408 samples) (Cvijanovich et al, supra; Shanley et al, supra; Wong et al (2007), supra; Wong et al (2009), supra; Wong et al (2010), supra; and Wong et al (2011, supra) and (2) data sets of Glue Grant containing patients with hospital-acquired infections and day-matched uninfected patients, wherein we only used patients in the buffy coat sample cohort (table 1) to divide the Glue Grant cohort into groups of patients with approximately 0.5, 1, 4, 7, 14, 28, and day-matched uninfected patients at the same time of sampling, and thus forming a group of uninfected patients at the same time as the patients who were diagnosed for infection at the given time of sampling . For buffy coat samples, there were at least 10 patients in five time bins, and these samples were therefore taken for additional studies. Thus, we compared time-matched SIRS/trauma to sepsis/infection using a total of 9 cohorts, containing 663 samples (326 SIRS/trauma controls and 337 sepsis/infection cases; Table 2 shows cohorts in a multi-cohort assay.
We then applied the multi-panel gene expression analysis framework we previously described (Khatri et al (2013) J Exp Med 210:2205-2221) to compare SIRS/trauma and sepsis/infection including all 9 panels in a manner that leaves a data set. The output of this analysis was subjected to a three-step thresholding (pooled effector and Fischer-method False Discovery Rate (FDR) < 1%, heterogeneity p >0.01 between datasets, and absolute summary effector fold change >1.5) to yield 82 genes differentially expressed across all time points between SIRS/trauma patients and sepsis patients (summary statistics for all 82 genes are shown in table 8). To obtain the simplest set of important genes that best differentiate between classes, we performed a greedy forward search to identify the 82-gene combination that best improved the AUC across all the found datasets. Here, the differentiation is based on an 'infection Z score', which combines the gene expression levels (using the difference in geometric mean between positive and negative genes) of each sample in each dataset into a normalized score. This resulted in a final set of 11 genes (6 overexpressed and 5 underexpressed in sepsis; table 3 and fig. 2). The mean ROC AUC for the set of 11 genes in the 9 discovery cohorts was 0.87 (range 0.70-0.98; FIG. 3A and FIG. 9).
Glue Grant sorting cell cohort validation
The Glue Grant wound group had two independent subgroups; one is the buffy coat cohort (treated sample 2004-. These groups are individual patients, isolated in time and profiled using different techniques. While inclusion criteria and enrollment sites are largely the same, they are inherently independent. We therefore validated our 11 gene signatures in the sorted cell Glue Grant cohort. Here, we group sorted cell populations into the same time bins as the buffy coat groups were found and treated each time bin separately.
From the sorted cell subpopulation, we expected that the neutrophil pool behaved most similarly to the whole blood sample, as neutrophils post-traumatic in infected and uninfected patients accounted for 75-85% of the total leukocyte pool (and thus most gene expression was present in peripheral blood) (fig. 8). Indeed, the set of 11 genes performed excellently when time-matched uninfected trauma patients were isolated from septic trauma patients (4 cohorts, 218 samples; mean AUC 0.83, range 0.73-0.89) (FIG. 3B). Surprisingly, the set of 11 genes also showed discriminatory ability in monocytes and T cells from these same patients (monocyte AUC range 0.71-0.97, T cell AUC range 0.69-0.9) (fig. 10A, 11A). Since we excluded any sorted cell dataset from the multi-cohort analysis, we did not expect diagnostic capability in these cell types. Interestingly, in sorted cell populations, AUC increased with longer time from initial trauma; this may indicate that inflammation due to infection is more easily distinguished as the 'genomic storm' of traumatic injury begins to recover.
Examination of the set of 11 genes in the Glue Grant cohort
As expected, in the Glue Grant buffy coat cohort, patients within +/-24 hours of diagnosis of infection had significantly higher infection Z scores at all time points compared to time-matched uninfected patients; this was verified in the neutrophil cohort (repeated measures ANOVA p < 0.0001; fig. 3C-3D, table 9A). Infection Z scores showed a significant decrease over time in the buffy coat cohort compared to time from injury (repeated measures of ANOVA change p <0.0001 over time), but the effect appeared to be less (but still significant) in the neutrophil validation cohort (repeated measures of ANOVA change p <0.05 over time) (fig. 3C-3D, table 9A). The interaction of cohorts with time from injury was not significant in the discovery or validation cohorts, indicating that the decline in infection Z scores over time for both groups may be due to recovery from traumatic injury, resulting in reduced inflammation (table 9A).
Next, we analyzed how infection Z scores of infected patients before and after diagnosis of infection (samples not included in the set of identified 11 genes) changed. We divided samples of patients diagnosed with infection who had been hospitalized in the same hospital into four groups according to the time of infection diagnosis (more than 5 days before infection, 5 to 1 days before infection, within +/-1 day of infection diagnosis, or 2 to 5 days after infection diagnosis, wherein none of the groups except +/-1 day of infection diagnosis was included in the multi-cohort analysis for finding a set of 11 genes). We further divided these groups into bins according to the number of days from injury. Within each time bin, infection Z scores for the diagnostic groups increased significantly as they progressed to infection for the buffy coat found and neutrophil confirmed groups (Jonckheere trend (JT) test p < 0.01; fig. 3E-3F). Furthermore, in all cohorts, the infection Z score of the cohort was decreased 2-5 days after infection diagnosis when patients began to recover from infection, possibly due to antibiotic treatment. This may also explain that diagnostic ability increases with time from the initial injury. We emphasize that the resulting 'peak' of infection Z scores around the time of infection diagnosis verifies the relevance of infection Z scores to clinical infection, since none of the >5 day pre-cohort, 1-5 day pre-cohort, and 2-5 post-cohort were included in the multi-cohort analysis, but still showed a hypothetical trend in finding the buffy coat cohort and verifying the neutrophil cohort. Similar results were seen in monocyte and T cell samples (same patients as the neutrophil validation cohort; FIGS. 10B, 11B).
Of interest, patients infected later during hospitalization had significantly higher infection Z scores in buffy coat samples at the time of admission than patients who were not infected during admission (p < 0.01; neutrophil validation group p ═ 0.05; fig. 3E-3F). One possibility is that there is a baseline difference in the severity of the injury, and this may affect the infection Z score. Patients with severe injury are known to be more susceptible to infection (Osborn et al (2004) Critical Care Med. 32: 2234-. To test this hypothesis, we used linear regression of the final hospital-acquired infection status, injury severity scores, and their interactions to predict infection Z scores as independent variables (table 9B). The final hospital-acquired infection status and injury severity score were each significant in predicting the infection Z score at admission, indicating that injury severity alone could not explain these effects. The interaction terms were significant and negative in the buffy coat group found and neutrophil group validated samples, possibly indicating that a higher infection Z score at the time of admission may indicate greater susceptibility to later infection. Other studies are needed to examine this observation.
Clinical utility in Glue Grant
To test whether the infection Z-score can be added to the clinical assay of infection, we compared logistic regression using SIRS standards alone with that using SIRS standards plus our infection Z-score when differentiating between infected and non-infected Glue Grant trauma patients (buffy coat and neutrophil cohorts). The AUC of the logistic regression model using only the SIRS criteria was 0.64, while the overall AUC (using a single infection coefficient at all time points) of the SIRS criteria plus the infection Z score was 0.81 (fig. 12). The continuous Net Reclassification Index (NRI) is a measure of how many patients will be correctly reclassified by improving disease markers; here, the continuous NRI with the infection Z score increased to SIRS only was 0.90 (95% CI 0.62-1.17), with continuous NRI greater than 0.6 associated with 'strong' improvement in prediction (Pencina et al (2012) medical statistics (Stat Med) 31: 101-.
Independent validation of infection Z scores
Next, we validated our scores in three independent longitudinal cohorts including only the final infected wound or ICU patients: GSE6377(McDunn et al, see above), GSE12838 and EMEXP3001(Martin-Loeches et al, see above) (Table 4). All three cohorts followed patients from the day of admission until at least the day of infection diagnosis (mainly ventilator associated pneumonia, VAP). Since all patients in each of the three cohorts were infected, they did not have time-matched uninfected controls. To compare the validation cohort infected cases to uninfected wound patients, we used the Glue Grant buffy coat uninfected controls. We normalized each cohort internally using housekeeping genes and then co-normalized with Glue Grant buffy coat patients using empirical bayesian batch correction. Subsequently, we compared the validation cohort to the Glue Grant uninfected patients at the matching time points referenced as variables. Comparison of wound/ICU patients with time-matched baseline was necessary because our previous study results (fig. 3C-3F) showed changes in infection Z scores of uninfected patients over time (table 9A). Three independent longitudinal trauma/ICU cohorts showed that patients within +/-1 day of infection were generally separable from time-matched uninfected Glue Grant patients, with ROC AUC ranging from 0.68-0.84 (fig. 4).
We further validated a set of 11 genes (total N446: GSE11755 (emerts et al, supra), GSE13015(Pankla et al, supra), GSE20346 (panell et al, supra), GSE21802 (berrmmo-Martin et al, supra), GSE25504(Smith et al (2014): natural communication (Nat commu) 5:4649), GSE27131(Berdal et al, supra), GSE33341(Ahn et al, supra) and GSE40396(Hu et al, supra), table 5, in 8 additional independent datasets comparing healthy patients with those with bacterial or viral sepsis using whole blood samples at the time of admission. Infection Z scores for all 8 datasets were combined in a single violin plot, showing excellent separation (wilcoxon p <1e-63, fig. 5A). The mean ROC for the isolated healthy and septic patients was 0.98 (range: 0.94-1.0, FIG. 5B).
Our results provide strong evidence that infection Z scores of whole blood, buffy coat, neutrophils and monocytes are reduced over time from admission/injury. We have also shown that non-time matched comparisons yield inaccurate classification of infections, especially for late acquired infections in SIRS/trauma patients. Therefore, comparing the infection Z-score of a SIRS/trauma patient at the time of admission to the infection Z-score of a late stage acquired sepsis/infection patient would be an inaccurate measure of diagnostic ability. However, since the effect of the reduction in infection Z score over time is relatively monotonic, comparison of hospitalized SIRS/trauma/surgical patients with late stage acquired sepsis/infection will provide a lower limit on the detection ROC AUC of the infection Z score. In other words, because the infection Z score decreases over time, if tested non-patients' infections are sampled later (at the time of matching with septic patients) at the time of admission, their infection Z score will be lower at a later time (and thus can be more easily separated from the higher infection Z score of septic patients). Using this inference, we examined four independent data sets comparing SIRS/trauma/surgery patients to the same patients later in the hospital at the onset of sepsis or to a mixed cohort of patients with community-and hospital-acquired sepsis. These data sets investigated whole blood (EMTAB1548(Almansa et al, supra)), neutrophils (GSE5772(Tang et al (2007, supra)) and PBMCs (GSE9960(Tang et al (2009, supra)); EMEXP3621(Vassiliou et al (2013) Critical Care's 17: R199)) (Table 6). In each of these four data sets, the infection Z score segregated late acquired infection from hospitalization SIRS or trauma, with ROC AUC ranging from PBMC 0.48-0.76 to whole blood 0.86 (fig. 13). We emphasize that these AUCs are expected to be lower due to comparison of their time mismatches, and are essentially the lower limit of the appropriate time-matched infection Z score for each of these cell compartments.
Finally, we examined our set of 11 genes in a dataset (GSE22098, n 274) comparing healthy patients or those with autoimmune inflammation to acute bacterial infection after diagnosis (Berry et al, supra; Allantaz et al (2007) J. Experimental medicine 204: 2131-S. 2144). Accurate sampling times are not available, but infection is usually confirmed to take 24-72 hours, so these infected samples are expected to show lower Z scores than at diagnosis. In addition, the infection Z score still allowed to distinguish healthy and autoimmune inflammatory patients from those with acute infection (ROC AUC 0.72; FIG. 14). Given that the cohort studied autoimmune inflammation was not included in our findings, this provided validation of the specificity of infection Z score for infectious inflammation.
Effect of infection type on infection Z score
To check whether there were any infection type specific differences in the infection Z score, we compared patients infected with gram positive versus gram negative bacteria, and patients infected with a viral infection with bacterial infection. The Glue Grant patients were not analyzed because there were too few time-matched infected patients in each subgroup. Four data sets have information about gram positive versus gram negative infection and four data sets have data about bacterial versus viral infection; in either case, there was a clear trend for differences in infection Z scores based on the infection subtype (table 10).
Gene set pathway assessment and transcription factor analysis
On the premise that the set of 11 genes has been validated, we examined whether there is any mechanism that could explain why these genes work together. We analyzed a set of 11 genes using Ingeneity Pathway Analysis, showing that several genes are under the control of IL-6 and JUN (FIG. 16). All 11 genes identified by multi-cohort analysis were loaded into EncodeQT and pasaa (selected for confounding experimental results and in silico transcription factor prediction). EncodeQT found only one important transcription factor (Max) among the 6 positive genes and none of the negative genes (EncodeQT Q value ≦ 0.01, Table 10A). PASTA shows the well-known enrichment of pro-inflammatory transcription factors, such as the Nf-KB members c-Rel, Stat5 and Interferon Response Factors (IRF)1 and 10 (Table 10B). However, no obvious conclusion could be drawn as the two methods for transcription factor analysis did not agree on the enriched set of factors to merge.
Since no apparent network drivers were found, we next investigated whether enrichment of genes in certain immune cell types could explain their relationship to sepsis. We searched GEO for human immune cell type specific gene expression profiles and found 277 samples from 18 data sets that met our criteria. We aggregated these into a broad immune cell type signature using the mean gene expression score. We then calculated the normalized enrichment score using the same method as the infection Z score (difference in geometric mean between positive and negative genes). We did so for the initial set of 82 genes found to be significantly enriched in the multi-cohort analysis and the set of 11 genes found after the forward search (genes scored for infection Z) (fig. 6). The set of all 82 important genes was found to be highly enriched only in rod-shaped nuclear cells (above mean >4 standard deviations, p <1 e-6). Interestingly, the set of 11 genes was significantly enriched in rod-shaped nuclear cells (> 2 standard deviations above the mean, p ═ 0.015), and also shown to be regulatory T cell upregulation and dendritic cell downregulation. This suggests that one driving force for differential gene expression between sterile SIRS and sepsis is the presence of rod shaped nuclear cells; however, the best set of genes for diagnosis contains information that may incorporate immediate translocation of multiple cell types.
Discussion of the invention
Changes in gene expression following trauma and during sepsis have been described as 'genomic storms' (Xiao et al (2011) J.EXPERIMENT MEDICAL (208: 2581-2590)). Several dozen studies we examined here have reported valuable insights into changes in gene expression that occur in response to SIRS, trauma, surgery and sepsis; however, none of the previous single study analyses produced a common clinical tool to reduce morbidity and mortality associated with sepsis. We used comprehensive multi-cohort analysis to distinguish gene expression in SIRS/trauma from gene expression in sepsis based on an increasing understanding of time-dependent gene expression changes. We thus found a set of 11 genes optimized for diagnostic ability, which we have validated in 15 independent cohorts. Under further prospective clinical validation, this set of 11 genes can aid in clinical sepsis diagnosis, which in turn can have a significant impact on patient monitoring.
Infectious and non-infectious inflammation can cause SIRS via activation of the same innate immune pathway (TLRs, RLRs, NLRs, etc.), so 'canonical' proinflammatory genes and cytokines such as TNF and interleukins are generally expressed in sterile and infectious inflammation (Newton et al (2012) Cold Spring harbor biology project (Cold Spring Harb sport) | 4). For example, one recent study showed a high correlation of gene expression between sterile inflammation (Glue Grant burn group) and four independent sepsis datasets with up to 93% of the genes in the two conditions varying in the same direction (Seok et al (2013) journal of the american national academy of sciences 110: 3507-. Thus, given that the 'standard' suite of cytokines and chemokines that are known to be expressed in sepsis is also likely to be activated in sterile SIRS, a standard hypothesis-driven approach to search for biomarkers that are specifically differentially expressed between sterile SIRS and sepsis is unlikely to be successful. However, several protein families, such as lectins and CEACAMs, have been shown to be specific only for pathogen-associated molecular patterns, thus raising the possibility of infecting specific innate immune signaling pathways (Geijtenbeek et al (2009) nature & immunology review 9: 465-. We therefore took a data-driven unbiased approach to search across multiple cohort-specific genes that were statistically uniformly differentially expressed between sterile SIRS/trauma patients and sepsis patients.
We systematically identified all publicly available microarray-based whole genome expression studies in SIRS, trauma, critical illness, acute infection, and sepsis, and sorted through all datasets to identify those comparing uninfected SIRS, ICU, or trauma patients to patients with acute infection or sepsis. The time after injury is known to be an important factor in gene expression following trauma (Xiao et al, supra; Seok et al, supra; Desai et al, supra; McDunn et al, supra). Across multiple independent cohorts, we show that the change in gene expression over time is non-linear, but follows a similar trajectory. In addition, normal recovery from trauma induces large changes in gene expression over time. Thus, comparison of gene expression by the same patient at or near the time of injury with gene expression at a later point in time (e.g., at the time of infection diagnosis) will yield a large number of differentially expressed genes due solely to the recovery process. Therefore, it is very difficult to identify relatively small changes in gene expression due to infection from the large number of changes caused by recovery. We therefore limited our group of findings to those studies comparing SIRS/trauma and sepsis/infection patients only at matching time points. However, unlike trauma or surgery, sepsis does not easily define a 'start' because infection appears time consuming. We therefore used patients within 48 hours of admission to hospital or within +/-24 hours of infection diagnosis for sepsis as cases, as these are the time at which infectious diseases and symptoms exist, and clinical diagnosis is necessary. We used a multi-cohort analysis method (Khatri et al (2013) J.EXPERIMENTAL MEDICAL 210: 2205-. We then optimized the sample size weighted ROC AUC using a forward search method to select a reduced set of statistically significant genes optimized for discriminative power (FDR < 1%, absolute summary effect >1.5 fold). The mean ROC AUC for an infection Z score, defined as the geometric mean of a set of 11 genes, in the discovery cohort used to distinguish SIRS/trauma from sepsis/infected patients was 0.87.
We validated this gene set in an independent patient group from Glue Grant. In the neutrophil validation cohort, the average AUC for distinguishing sepsis from non-infectious inflammation was 0.83, with a clear trend towards better diagnostic ability with longer time from initial injury. Although we expect the whole blood transcript profile to be driven primarily by neutrophils, the signal in sorted cells will of course be different from that of whole blood. Therefore, the use of sorted cells instead of whole blood for diagnosis is expected to result in a reduction in the discrimination ability. Despite such limitations, infection Z scores can be performed equally in the validation cohort, particularly three or more days from initial injury, when initial traumatic inflammation subsides and hospital-acquired infection manifests (Hietbrink et al (2013) Shock (Shock) 40: 21-27).
Using the extensive clinical phenotypic data available for patients in the Glue Grant, we illustrated several emphases on applying infection Z scores. First, the infection Z score shows that the decline over time from injury is similar for infected and uninfected patients. We also show that using the time-variable uninfected baseline in the Glue Grant as a reference threshold allows us to distinguish septic patients from uninfected wound patients in three independent longitudinal cohorts, with ROC AUC ranging between 0.68-0.84. Thus, for maximum discriminative power, if the infection Z score is to be prospectively tested in a longitudinal study, the diagnostic threshold will need to be a function of time from the initial injury. Second, the infection Z score increases over the days preceding infection, peaks and then decreases within +/-1 day around the time of diagnosis of the infection (possibly due to treatment of the infection). This observation raises the following possibilities: although further studies are needed, it is possible to use a set of 11 genes to diagnose or stratify patients at risk for sepsis earlier. In particular, we note that the early rise in infection Z score prior to clinical diagnosis of infection is not a false positive but an 'early positive' result. Finally, patients with higher Injury Severity Score (ISS) had higher infection Z scores at the time of admission; the initial infection Z score therefore depends on the relative time of ISS and clinical infection. However, trauma patients within 24 hours of admission are generally not suspected of having an insignificant infection (except for open wounds, peritoneal contamination, etc.), and therefore we would not expect an infection Z-score to have clinical utility anyway.
In the Glue Grant buffy coat cohort, the SIRS binary parameter performed poorly in differentiating patients at infection from uninfected patients for those patients for which all four SIRS markers were available (ROC AUC 0.64). The SIRS criteria plus infection Z score with an overall cutoff (i.e., not broken down into separate time bins) increased discriminatory power (ROC AUC 0.81), with a continuous NRI of 0.9. However, SIRS is only one of several criteria for diagnosing sepsis. Procalcitonin is a well studied biomarker for distinguishing sepsis from SIRS; both binary analyses of procalcitonin showed a collective ROC AUC of 0.78 (range 0.66-0.90) (Tang et al (2007) Lancet infectivity [ 7: 210-. The mean AUC in our finding cohort was 0.87 and the mean AUC for the time-matched neutrophil validation cohort was 0.83, both thus at least comparable to procalcitonin. However, we emphasize that each of these labels need not be used for separation. No publicly available data set includes procalcitonin levels at the time of sepsis diagnosis. Thus, any prospective study of infection Z-scores should include both traditional biomarkers and new biomarkers to test for better diagnostic performance and head-to-head comparison using biomarker combinations.
We validated the infection Z score in several additional external datasets comprising three longitudinal cohorts of ICU/trauma patients suffering from VAP/VAT; eight cohorts of healthy patients compared to bacterial or viral sepsis; four cohorts of admitted SIRS/trauma patients compared to patients using whole blood, neutrophils, PBMCs at mixed or later time points; and a cohort of patients with autoimmune inflammation compared to patients with acute infection. In each publicly available data set that meets our inclusion criteria, the infection Z score has the ability to differentiate. Furthermore, in those data sets where infection type information is available, the infection Z score does not have a systematic trend with respect to infection type (gram positive versus gram negative and bacteria versus virus). We emphasize that based on the findings in the Glue Grant data that baseline infection Z-score decreased over time from injury, comparison of admission SIRS/trauma to later time points in any of these compartments would have worse diagnostic capabilities than the time-matched studies. Thus, the discriminatory power of the infection Z score in the four independent non-time matched cohorts may be the lower limit of the true discriminatory power in the respective blood compartments.
Some of the sepsis-specific 11 gene sets have previously been associated with sepsis or infection, such as CEACAM1, C3AR1, GNA15, and HLA-DPB1(Madsen-Bouterse et al (2010) journal of reproductive immunology in usa (Am J Reprod Immunol) 63: 73-92; Wong et al (2012) critical care 16: R213; Kwan et al (2013) public science library-complex 8: e 60501). Based on in silico analysis, regulatory control of these genes can enrich for proinflammatory factors such as IL-6, JUN, c-Rel, Stat5, and IRF 1/10, but no single consensus factor explains the network. The set of genes found here can be better explained by cell type enrichment analysis. We show that the baculocyte and myeloid cell lines are highly enriched for the full set of 82 genes found to be significantly differentially expressed between sterile SIRS and sepsis. The results of the studies with enrichment in rod-shaped nuclear cells are particularly attractive because rod-shaped nuclear cells have previously been shown to help distinguish sterile SIRS from sepsis (Cavallazzi et al (2010) J. am. Med. 25: 353-357; Drifte et al (2013) J. am. Med. Critical Care. 41: 820-832). In addition, there was very high variability in the counts by automatic blood counters and manual rod-shaped nuclei (Cornbleet et al (2002) clinical laboratory medicine (Clin Lab Med) 22: 101-. However, the set of 11 genes may better distinguish sepsis from sterile SIRS, at least in part because it also includes information about regulatory T cell increase and dendritic cell depletion that has previously been implicated in sepsis (Saito et al (2008) J northeast Experimental medical journal (Tohoku J Exp Med) 216: 61-68; Venet et al (2008) J Leukoc Biol 83: 523-535; Grimalldi et al (2011) Critical Care's medicine 37: 1438-1446). The association between the set of 11 genes and different immune cell types may help explain some sepsis biology, but of course these 11 genes need further investigation.
The potential shift from current research to clinical use depends on two factors. First, both the set of 11 genes and the protein products of these genes should require prospective testing in a time-matched fashion. Protein analysis currently has a faster response time than PCR, although many advances in PCR technology have led to a reduction in the time to produce results towards a range of clinical applicability (Park et al (2011) Biotechnology Adv 29: 830-. Secondly, our results show that changes in gene expression due to normal recovery from traumatic events (such as injury or surgery) mean that time must be properly considered in gene expression studies for any acute disease. We searched for several studies that found a time course for SIRS/post-traumatic (GSE6377, GSE12838, GSE40012, emixp 3001) and for the time course from sepsis/infection onset (GSE20346, GSE2713, GSE40012, emixp 3850). However, we have found only one publicly available microarray study (Glue Grant) that examines patient cohorts over time, some of which present infection and some of which do not. Therefore, based on our results, we recommend that future sepsis diagnostic studies should be designed with longitudinal cohorts of infection and non-infection to enable appropriate time-matched comparisons (Johnson et al (2007) annual science Ann. 245: 611-.
Overall, our comprehensive analysis of gene expression data publicly available for SIRS/trauma and sepsis has resulted in a reduced set of 11 genes with excellent discriminatory power in both the discovery cohort and 15 independent cohorts. It should be feasible to optimize the clinical analysis against this gene set in order to get the results within the clinical relevance window. Further studies should be needed to validate our clinical findings and study the molecular pathways upstream of these genes in a prospective fashion.
Method
Design of research
The objective of this study was to analyze multiple gene expression datasets using an integrated multi-cluster combinatorial analysis framework to identify gene sets that would separate patients with sterile inflammation from those with infectious inflammation. This framework has been described previously (Khatri et al (2013) J.EXPERIMENTAL MEDICAL (210) 2205-2221; Chen et al (2014) cancer Res (74) 2892-2902).
Searching
Two public gene expression microarray repositories (NIH GEO, ArrayExpress) were searched for all human datasets matching any of the following search terms: sepsis, SIRS, trauma, shock, surgery, infection, pneumonia, critical, ICU, inflammation, nosocomial. Data sets comparing healthy controls or patients with non-infectious inflammation (SIRS, trauma, surgery, autoimmunity) with patients with acute infection and/or sepsis were retained for further study. Data sets using endotoxin injection as a model for SIRS or sepsis were not included.
Multi-cohort analysis
A multi-cohort analysis was performed comparing gene expression of uninfected SIRS/trauma patients versus patients with infection or sepsis. All datasets comparing SIRS/trauma patients to sepsis/infection patients at the same time point were selected for inclusion in the multi-cohort analysis; therefore, a comparison of hospitalized patients with septic patients at a later point in time was not included (see adjustment of secondary model in results). Admission data sets were limited to samples from patients within 48 hours of admission. The Glue Grant wound data set was divided into time bins of days from injury, excluding the initial 24 hours after admission (see supplementary methods). Each of these time bins was processed as a separate data set in a multi-cohort analysis, where time-matched patients who were never infected were compared to patients within +/-24 hours of diagnosis of infection (infection as defined above). Patients greater than 24 hours after diagnosis of infection are therefore examined in this comparison. This method allows the detection of deviations from 'standard' changes in gene expression over time due to infection and due to recovery from trauma.
After selecting the input data set, we apply two meta-analysis methods; one using hedgeg combinatorial effect amounts; the other combines the p-values using Fisher's log-sum method (see schematic in fig. 15). In the case of n data sets, the method is applied n times in a manner that leaves one data set. A False Discovery Rate (FDR) threshold (0.01) was set and genes with q values below the FDR threshold in effector and Fischer logarithmic sum analysis were selected for each round of one-out analysis. Subsequently performing a dataset heterogeneity test on the genes, such that the p-value of each gene needs to be greater than 0.01 in the heterogeneity test of all input datasets; this removes genes that show significantly different effects in different datasets. Next, all genes with a summary effector amount <1.5 fold were discarded. Finally, a greedy forward search model was performed on all genes found to be statistically significant in the multi-cohort analysis according to all three or more criteria (table 8), where, starting with the most significant gene, all remaining genes were added one at a time to the gene score, and the gene with the greatest increase in discriminatory power was added to the final gene list.
Replenishment method
Data set details
Six publicly available whole blood datasets were from the child SIRS/septic shock genomics investigator (GPSSSI) (Cvijanovich et al (2008) physiology genomics 34: 127-134; Shanley et al (2007) molecular medicine 13: 495-508; Wong et al (2007) physiology genomics 30: 146-155; Wong et al (2009) Critical diseases guardianship medicine 37: 1558-1566; Wong et al (2010) pediatric Critical diseases guardianship medicine 11: 349-355; Wong et al (2011) Critical diseases guardianship medicine 39: 2511-2517). These data sets contained overlapping samples, for which Hector Wong provided an important unique patient. Those unique patients were then normalized together gcRMA and treated as a single data set (gps si unique).
In addition to publicly available data sets, we also used the inflammation and host response to injury program (Glue Grant) wound data set (Cobb et al, supra). The Glue Grant dataset consisted of a separate trauma patient cohort sampling either whole buffy coat or sorted cells (neutrophils, monocytes, T cells). The inclusion criteria are described elsewhere (Desai et al, supra). Patients were sampled on the following days after admission: 0.5, 1, 4, 7, 14, 21, 28 days. Patients in the Glue Grant trauma group are classified as 'infected' if they have nosocomial infections (pneumonia, urinary tract infections, catheter-related bloodstream infections, etc.), surgical infections (excluding superficial wound infections), or undergo visceral perforation surgery; infection definitions can be found in gluegrant. For meta-analysis, samples taken within +/-24 hours on the day of infection diagnosis are included as infection cases. Time points of less than 20 patients were not included in the multi-cohort analysis. The Glue Grant also contained burn patients, but these were excluded due to the difficulty of distinguishing clinically relevant infections from clustered infection burn wounds. The use of Glue Grant was co-approved by the Glue Grant alliance and Stanford University IRB (protocol 29798).
Normalization of Gene expression
All Affymetrix datasets were downloaded as CEL files and re-normalized using gcRMA (R affy package). Output from the Agilent chip and custom arrays analyzed on GenePix scanners were background corrected, locally weighted regression normalized within the array and then normalized by inter-array quantile (R limma package) (g.smyth, Bioinformatics and Computational Solutions Using R and Bioconductor (Bioinformatics and Computational Solutions Using R and Bioconductor), c.v.geneman R, duoit, Irizarry R and Huber W (eds.), version (Springer, new york, 2005), page 397 @). And (4) carrying out quantile normalization on the Illumina data set. Analyzing the Glue Grant sorted cell datasets (GGH-1, GGH-2) using custom arrays; these data sets were normalized as described previously and used in their processed state (Xu et al (2011) Proc. Natl. Acad. Sci. USA 108: 3707-. For all gene analyses, the average of probes for common genes was set as the gene expression level. All probes and gene maps were downloaded from the GEO latest SOFT file on day 12, month 14, 2014.
Labeled PCA method
The labeled Principal Component Analysis (PCA) method is an implementation of constraint optimization described in equations 6 and 7 in section 4.1 of Koren and Carmel (IEEE Provisions for visualization and computer graphics (2004)10: 459-. This optimization calculates a linear transformation of the data that maximizes the pair-wise distance between points in different labeled classes of data while maintaining constraints on the orthogonality of the transformed data with respect to each other. This orthogonal constraint is slightly different from the constraint imposed by PCA, which requires that the transformed bases be orthogonal to each other, rather than the transformed data themselves. While PCA is a projection scheme, labeled PCA is a general form of linear transformation due to this difference in constraints.
The raw data set is referred to as X, which has m rows (data points) and n columns (each data point having n elements). Y is an m1 matrix with a different list for each category. In other words, y (i) equals y (j) if and only if elements i and j are part of the same mark class. L is a symmetric m matrix whose (i, j) elements are-1 unless Y (i) is equal to Y (j). In this latter case, the element is 0. Finally, all diagonal elements are filled in (where i equals j) so that row i sums to 0. Koren and Carmel demonstrated in Lemma 3.2 that the feature vectors of the transposed matrix (X) × L × X provide a map that maximizes the pairwise distance between points in different labeled classes of data. However, this transformation is still a projection scheme, which means that the feature vectors are orthogonal to each other. This latter result limits the utility of the transformed data, but is more generalizable. Instead of finding a vector v solving the equation Av ═ λ Bv, a is the transposed matrix (X) × X, and B is the transposed matrix (X) × X, a general linear projection is used in this paper. Although more idealistic, this approach is less robust than the labelled PCA projection scheme, since the solution to this general formula requires that B not be singular. Since B is not an identity matrix, the old orthogonal constraints used in the projection do not have to be maintained. In practice, this form of solution requires that the bases be orthogonal to each other relative to the covariance base of the original data.
Labeled PCA applications
The labeled PCA method is described in a complementary method. All data sets containing comparisons of non-infectious SIRS, ICU, or trauma patients with sepsis patients were converted from probes to genes and subsequently combined into a single large matrix and quantile normalized. Genes not present in all data sets were discarded. Patients with sepsis at any time (at admission or hospital acquired) were grouped into a single category and Lasso penalty regression was applied to separate sterile SIRS patients from septic patients (R glmnet package). Based on the class of aseptic SIRS versus sepsis, labeled PCA was performed using genes selected by penalized regression. The same figures are then relabeled to show which samples were from hospital acquired (or later stage) sterile SIRS or sepsis patients. The same set of genes from the penalized regression was then used for labeled PCA to compare healthy, sterile SIRS and sepsis patients. This same figure was then re-labeled to show which samples were from hospital acquired or later sterile SIRS or sepsis patients.
To examine the effect of time on gene expression in SIRS/trauma and infection, all datasets were selected that included continuous measurements over time. Only buffy coat arrays from the Glue Grant data set are included so as not to overwhelm signals from other data sets. The selected data sets were converted from probes to genes and subsequently combined into a single large matrix and subjected to quantile normalization. Genes not present in all data sets were discarded. To reduce the gene set in an unbiased manner, the first 100 genes in the merged dataset with the greatest orthogonality (R rCUR packets) were selected using CUR matrix decomposition (Bodor et al (2012) BMC Bioinformatics 13: 103). Subsequently, labeled PCA was performed with each time point serving as a different category (segmented at 1,2, 3, 4, 5, 6,10, 20, and 40 days). The resulting PCA is illustrated in 3D, colored in time points, and 3D spatially rotated short video is captured using the R rgb packets.
Infection Z score
Genes found to be significant after multi-population analysis were isolated according to whether their effect was positive or negative (where 'positive' means the amount of positive effect of sepsis compared to SIRS/trauma, and 'negative' means the amount of negative effect of sepsis compared to SIRS/trauma). The set of genes was then tested for class discrimination using individual gene scores. The gene score used was the geometric mean of the gene expression levels of all positive genes minus the geometric mean of the gene expression levels of all negative genes, multiplied by the ratio of positive to negative gene counts. This is calculated for each sample in the dataset and then the score for each dataset is normalized to produce a Z-score ('infection Z-score'). Excluding genes not present in the complete data set; the gene deletion of each sample was set to 1. To obtain an infection Z score for a dataset with negative gene expression values (two-channel array), the complete dataset was adjusted to the minimum value present in the dataset to ensure that all values were positive (since the geometric mean of the negative inputs produced an imaginary value).
The class discrimination ability was examined and the infection Z scores of the classes of interest in each examined dataset were compared. Infection Z score ranges were examined with violin charts and shown at 25% -75% interquartile range and compared using wilcoxon rank sum test since it cannot be assumed that infection Z score ranges have a normal distribution. ROC curves for infection Z scores were constructed to compare classes of interest (as sterile SIRS compared to sepsis) and to show the area under the total ROC curve (AUC) along with the 95% confidence interval.
Forward search
To obtain a reduced set of genes to distinguish SIRS/trauma patients from sepsis/infection patients, a greedy forward search model was performed on all genes found to be statistically significant in a multi-cohort analysis, where starting with the most significant gene in the data set, all remaining genes were added one at a time to the gene score, and the gene with the greatest increase in discriminatory power was added to the final gene list. Here, discriminative power is defined as a weighted ROC AUC, where each finding dataset is tested for infection Z-score and the resulting AUC is multiplied by the total number of samples in the dataset. The run then maximizes the sum of the weighted AUC of all found datasets in each step. In this way, excellent class discrimination in small datasets does not outweigh the modest increase in class discrimination in very large datasets. Stopping operation at any defined threshold; we used a stop threshold of one (so that when a run fails to find that will increase the total finding weighted AUC of the current infection Z score by more than one, it will terminate). This resulting set of genes thus maximizes discriminatory power in the discovery cohort, but does not optimize to the overall maximum. Probe level data for genes retained after the forward search are shown in table 8.
Discovery group inspection
The final gene score was used to calculate the infection Z score for each of the discovery datasets. Admission data sets were analyzed separately and separate ROC plots were plotted. For the hospital acquired (Glue Grant) dataset, infection scores for all cohorts were normalized (converted to Z-scores) once to show changes in the same patient over time, as opposed to normalizing the different time bins separately. Significance of infection Z scores was then analyzed using repeated measures analysis of variance. ROC curves are plotted for individual time bins processed as separate data sets in a multi-cluster analysis.
For the Glue Grant dataset, two time course analyses of infection Z scores were performed for the buffy coat and neutrophil datasets. First, mean infection Z scores were compared over time using linear regression for patient and non-patient infections within +/-24 hours of infection. Repeated measures analysis of variance was used to compare the infected and uninfected groups to each other and to examine the significance of the changes over time. Next, a box plot was constructed for each time window such that the infection Z score of patients who were not infected in the time window was compared to patients >5 days prior to the day of infection diagnosis, 5-1 days prior to diagnosis, or +/-24 hours of diagnosis. For each time point (except for the 0-1 day window), the trend of infection Z scores in the different groups was tested using the Jonckhere Trend (JT) test. Infection Z scores at the time point of admission ([0,1)) were examined as a result variable in multiple linear regression to examine the effect of injury severity scores and time on infection contribution.
Authentication
The final gene set was examined in several validation cohorts that were completely separate from the discovery cohorts. The sorted cell cohort of Glue Grant was broken down into time bins and the AUC for each time bin was calculated separately. It was noted that no diagnosis of +/-1 day infection was captured in this cohort after 18 days post injury, so no [18,24) day bins were shown.
The validation cohort included three datasets (GSE6377, GSE12838, and emixp 3001) examining trauma patients over time, all of which had an infection (primarily Ventilator Associated Pneumonia (VAP)). These data sets did not include controls, and therefore they were compared to the Glue Grant uninfected patients as baseline. The three validation data sets and the Glue Grant buffy coat uninfected samples were first linearly scaled by the geometric mean factor of the four housekeeping genes (GAPDH, ACTN1, RPL9, KARS) (Vandesampele et al (2002) genome biol. 3: RESEARCH 0034). The datasets were then joined together with respect to overlapping genes and batch corrected between datasets using a ComBat empirical Bayesian batch correction tool with parameter priors (R sva package) (Leek et al (2012) < bioinformatics > 28: 882-. ComBat correction on days post injury was controlled (so that the relative difference between days remained relatively different). Infection Z-scores for the joined datasets were then calculated and validation datasets were plotted against local weighted regression curves for uninfected Glue Grant cohorts. Validation data was then concentrated in patients within +/-24 hours of diagnosis of infection compared to day-matched ComBat co-normalized uninfected Glue Grant buffy coat patients and ROC curves were constructed.
All other data sets found in the initial search that allow comparison between healthy or SIRS/trauma patients and sepsis patients were used for simple category-specific validation. All data sets performed on whole blood or neutrophils are shown. Studies performed on PBMCs were selected for those datasets that were examined only for SIRS/trauma and sepsis patients. Data sets using PBMC samples not including the sterile SIRS and sepsis groups were excluded. All peripheral blood health versus sepsis patient data sets were grouped into a single violin plot and tested for separation collectively (wilcoxon rank sum) as they were all used to make the same comparison. ROC curves were plotted separately for each individual dataset to show the discriminatory power of infection Z scores within each dataset.
Glue Grant SIRS assessment
To evaluate the effectiveness of SIRS as a screening criterion for infection in the Glue Grant cohort, all patients were classified as uninfected or within +/-24 hours of infection, with infection as defined above. Patients were examined >24 hours after infection diagnosis. The SIRS criteria are defined according to the International Standard guidelines (temperature <36C or >38C, respiration rate >20 or PaCO2<32, Total WBC <4,000 or >12,000 and HR > 90). Patients who did not meet any criteria were excluded. Each standard for each patient per day is stored as a binary variable. Logistic regression was performed on the data with and without Z scores and ROC AUC was calculated for both models. The two models are then compared using a successive net reclassification index (R PredictABEL packet).
Gene set assessment
The final gene set was evaluated for transcription factor binding sites using two online tools EncodeQT (Auerbach et al (2013) bioinformatics 29: 1922-. Positive and negative genes were evaluated separately, as they were assumed to be under separate regulation. The EncodeQT tool is used 5000 base pairs upstream and 5000 base pairs downstream of the transcription start site. Similar analysis was performed using pasaa, examining the-200 base pair region from the transcription start site, examining only those factors that are conserved for mouse and human. The first ten significant transcription factors for the two analyses were recorded.
Cell type enrichment assay
Gene expression profiles of clinical samples of GEO-related immune cell types were searched. The search was limited to samples run only on the Affymetrix platform to ensure platform effect homogeneity. All data sets used were downloaded in RAW format and separately gcRMA normalized. For each sample, the average of multiple probes that map to the same gene is taken as the gene value. Genes not present in all samples were discarded. For multiple samples, all corresponding to the same cell type, the average of the samples is taken as the final value, thereby forming a single vector for each cell type. To obtain the Z score for the gene set in each cell type vector, the geometric mean of 'positive gene' expression was taken and subtracted, multiplied by the ratio of negative to positive genes (same procedure as infection Z score). These scores for all cell types were then normalized so that the scores represent the number of standard deviations away from the group mean. This therefore represents the degree to which a given set of genes is enriched in a given cell type relative to other test cell types.
A total of 18 GEO datasets were used that met the criteria: GSE3982(Jeffrey et al (2006) Nature & Immunity & 7:274-283), GSE5099(Martinez et al (2006) Immunity & 177:7303-7311), GSE8668 (from-Aizik et al (2008) applied physiology & journal (J Appl Physiol) 104:236-243), GSE11292(He et al (2012) molecular systems biology & gt 8:624), GSE12453(Giefing et al (2013) public science library & integrated syndrome & E848: 84928), GSE13987(Meyers et al (2009) immunology & 182:5400-5411), GSE14879 (Eckelle et al (2009) Leukemia (Leukemia & 21323: 2139), GSE & str & 403 & 182 & gt 200-121 & 45), and BMC 121 & 115 & gt [ 2010 & gt 29 & gt 11 & gt, GSE24759(Novershtern et al (2011) Cell (Cell) 144:296- & 309), GSE28490(Allantaz et al (2012) public science library & complex 7: e29979), GSE28491(Allantaz et al, supra), GSE31773 (Tsistiou et al (2012) J Allergy and clinical immunology journal (J Allergy Clin Immunol) 129:95-103), GSE34515(Frankenberger et al (2012) European immunology journal (Eubr J Immunol) 42:957- & 974), GSE 43(Huen et al (2013) International Cancer journal (Int J Cancer) 133: 382), GSE39889 (Malholm et al (Maltsc 3) complex 2013808), and blood library 57904 (2014 et al) (BMC 57632: 632: 519) 102), GSE39889 (Maltsfoot et al (20143) integrated study library 31: 2018).
Two gene sets were tested in this way: both complete gene sets were found to be significant after the initial multi-population analysis, and the gene subsets were found to be most diagnostic after the forward search. Their corresponding plots show the Z score (enriched for a given set of genes) for each cell subtype (black dots) and a box plot of the overall distribution of Z scores (any outliers are shown as open circles).
Statistical data and R
All calculations and operations were performed in the R language for statistical calculations (version 3.0.2). Unless otherwise specified, the significance level of the p-value was set at 0.05 and a two-tailed analysis was performed.
Table 1. publicly available gene expression data sets comparing SIRS/ICU/trauma with sepsis/infection. CAP, community acquired pneumonia. ARDS, acute respiratory distress syndrome.


Table 2. all data sets used in the multi-cohort analysis. The numbers following the Glue Grant cohort heading indicate that the number of days from infection (e.g., [1,3) in a given cohort are patients 1-3 days from injury).


Table 11a. encodeqt output results. The 6 positive genes and 5 negative genes were analyzed separately using default settings. The Q value is determined by the Benjamini-Hochberg corrected hyper-geometric test.
ENCODEQT-positive gene +/-5000bp

ENCODEQT-minus gene +/-5000bp

Table 11b output results of pastaa. Using-200 base pairs from the transcription start site, conserved human/mouse sequences were searched for 6 positive genes and 5 negative genes, respectively. P values are from the hyper-geometric test.
The PASTA-positive gene is from-200 bp of TSS, conservative human/mouse
| Rank matrix | Transcription factor | Relevance scoring | P value |
| 1ZBRK1_01 | N/A | 3.353 | 1.28E-03 |
| 2PAX_Q6 | Pax-1、Pax-2 | 2.967 | 3.70E-03 |
| 3IRF_Q6_01 | Irf-1、Irf-10 | 2.72 | 6.74E-03 |
| 4CREL_01 | C-rel | 2.647 | 7.42E-03 |
| 5GATA4_Q3 | Gata-4 | 2.522 | 1.02E-02 |
| 6PAX4_03 | Pax-4a | 2.522 | 1.02E-02 |
| 7PPAR_DR1_Q2 | Ppar-α、Ppar-β | 2.521 | 1.02E-02 |
| 8STAT5A_04 | Stat5a | 2.503 | 1.02E-02 |
| 9PTF1BETA_Q6 | N/A | 2.372 | 1.43E-02 |
| 10MYB_Q3 | C-myb | 2.371 | 1.43E-02 |
The PASTA-negative gene is from-200 bp of TSS, conservative human/mouse
| Rank of | Matrix array | Transcription factor | Relevance scoring | |
| 1 | KAISO_01 | N/A | 3.264 | 1.28 |
| 2 | PAX5_01 | Pax-5 | 3.236 | 1.28 |
| 3 | TCF11_01 | Lcr-f1 | 3.066 | 1.78 |
| 4 | STRA13_01 | Stra13 | 2.823 | 4.06E-03 |
| 5 | HNF4ALPHA_Q6 | Hnf-4、Hnf-4α | 2.473 | 9.47 |
| 6 | ARNT_02 | Arnt | 2.346 | 1.31E-02 |
| 7 | USF_Q6 | Usf1、Usf2a | 2.346 | 1.31 |
| 8 | PAX4_01 | Pax-4a | 2.221 | 1.70E-02 |
| 9 | TFIII_Q6 | Tfii-i | 2.22 | 1.70E-02 |
| 10 | AP1_Q6_01 | Fosb、Fra-1 | 2.204 | 1.70E-02 |
Reference to the literature
1.D.C.Angus,W.T.Linde-Zwirble,J.Lidicker,G.Clermont,J.Carcillo,M.R.Pinsky,Epidemiology of severe sepsis in the United States:analysis of incidence,outcome,and associated costs of care.Crit Care Med 29,1303-1310(2001).
2.T.Lagu,M.B.Rothberg,M.S.Shieh,P.S.Pekow,J.S.Steingrub,P.K.Lindenauer,Hospitalizations,costs,and outcomes of severe sepsis in the United States 2003to 2007.Crit Care Med 40,754-761(2012).
3.C.A.Torio,R.A.Andrews.(Agency for Healthcare Research and Quality,Rockville,MD,August 2013).
4.D.F.Gaieski,M.E.Mikkelsen,R.A.Band,J.M.Pines,R.Massone,F.F.Furia,F.S.Shofer,M.Goyal,Impact of time to antibiotics on survival in patients with severe sepsis or septic shock in whom early goal-directed therapy was initiated in the emergency department.Crit Care Med 38,1045-1053(2010).
5.R.Ferrer,I.Martin-Loeches,G.Phillips,T.M.Osborn,S.Townsend,R.P.Dellinger,A.Artigas,C.Schorr,M.M.Levy,Empiric antibiotic treatment reduces mortality in severe sepsis and septic shock from the first hour:results from a guideline-based performance improvement program*.Crit Care Med 42,1749-1755(2014).
6.R.P.Dellinger,M.M.Levy,A.Rhodes,D.Annane,H.Gerlach,S.M.Opal,J.E.Sevransky,C.L.Sprung,I.S.Douglas,R.Jaeschke,T.M.Osborn,M.E.Nunnally,S.R.Townsend,K.Reinhart,R.M.Kleinpell,D.C.Angus,C.S.Deutschman,F.R.Machado,G.D.Rubenfeld,S.Webb,R.J.Beale,J.L.Vincent,R.Moreno,S.S.C.G.C.i.T.P.Subgroup,Surviving Sepsis Campaign:international guidelines for management of severe sepsis and septic shock,2012.Intensive Care Med 39,165-228(2013).
7.B.Coburn,A.M.Morris,G.Tomlinson,A.S.Detsky,Does this adult patient with suspected bacteremia require blood culturesJAMA 308,502-511(2012).
8.B.M.Tang,G.D.Eslick,J.C.Craig,A.S.McLean,Accuracy of procalcitonin for sepsis diagnosis in critically ill patients:systematic review and meta-analysis.Lancet Infect Dis 7,210-217(2007).
9.B.Uzzan,R.Cohen,P.Nicolas,M.Cucherat,G.Y.Perret,Procalcitonin as a diagnostic test for sepsis in critically ill adults and after surgery or trauma:a systematic review and meta-analysis.Crit Care Med 34,1996-2003(2006).
10.C.Cheval,J.F.Timsit,M.Garrouste-Orgeas,M.Assicot,B.De Jonghe,B.Misset,C.Bohuon,J.Carlet,Procalcitonin(PCT)is useful in predicting the bacterial origin of an acute circulatory failure in critically ill patients.Intensive Care Med 26 Suppl 2,S153-158(2000).
11.H.Ugarte,E.Silva,D.Mercan,A.De J.L.Vincent,Procalcitonin used as a marker
of infection in the intensive care unit.Crit Care Med 27,498-504(1999).
12.J.P.Cobb,E.E.Moore,D.L.Hayden,J.P.Minei,J.Cuschieri,J.Yang,Q.Li,N.Lin,B.H.Brownstein,L.Hennessy,P.H.Mason,W.S.Schierding,D.J.Dixon,R.G.Tompkins,H.S.Warren,D.A.Schoenfeld,R.V.Maier,Validation of the riboleukogram to detect ventilator-associated pneumonia after severe injury.Ann Surg 250,531-539(2009).
13.W.Xiao,M.N.Mindrinos,J.Seok,J.Cuschieri,A.G.Cuenca,H.Gao,D.L.Hayden,L.Hennessy,E.E.Moore,J.P.Minei,P.E.Bankey,J.L.Johnson,J.Sperry,A.B.Nathens,T.R.Billiar,M.A.West,B.H.Brownstein,P.H.Mason,H.V.Baker,C.C.Finnerty,M.G.Jeschke,M.C.López,M.B.Klein,R.L.Gamelli,N.S.Gibran,B.Arnoldo,W.Xu,Y.Zhang,S.E.Calvano,G.P.McDonald-Smith,D.A.Schoenfeld,J.D.Storey,J.P.Cobb,H.S.Warren,L.L.Moldawer,D.N.Herndon,S.E.Lowry,R.V.Maier,R.W.Davis,R.G.Tompkins,I.a.H.R.t.I.L.-S.C.R.Program,A genomic storm in critically injured humans.J Exp Med 208,2581-2590(2011).
14.R.Pankla,S.Buddhisa,M.Berry,D.M.Blankenship,G.J.Bancroft,J.Banchereau,G.Lertmemongkolchai,D.Chaussabel,Genomic transcriptional profiling identifies a candidate blood biomarker signature for the diagnosis of septicemic melioidosis.Genome Biol 10,R127(2009).
15.B.M.Tang,A.S.McLean,I.W.Dawes,S.J.Huang,R.C.Lin,Gene-expression profiling of peripheral blood mononuclear cells in sepsis.Crit Care Med 37,882-888(2009).
16.H.R.Wong,Clinical review:sepsis and septic shock--the potential of gene arrays.Crit Care 16,204(2012).
17.S.B.Johnson,M.Lissauer,G.V.Bochicchio,R.Moore,A.S.Cross,T.M.Scalea,Gene expression profiles differentiate between sterile SIRS and early sepsis.Ann Surg 245,611-621(2007).
18.V.L.Vega,A marker for posttraumatic-sepsis:searching for the Holy Grail around intensive care units.Crit Care Med 37,1806-1807(2009).
19.T.B.Geijtenbeek,S.I.Gringhuis,Signalling through C-type lectin receptors:shaping immune responses.Nat Rev Immunol 9,465-479(2009).
20.P.R.Crocker,J.C.Paulson,A.Varki,Siglecs and their roles in the immune system.Nat Rev Immunol 7,255-266(2007).
21.K.Kuespert,S.Pils,C.R.Hauck,CEACAMs:their role in physiology and pathophysiology.Curr Opin Cell Biol 18,565-571(2006).
22.D.M.Maslove,H.R.Wong,Gene expression profiling in sepsis:timing,tissue,and translational considerations.Trends Mol Med,(2014).
23.J.P.Cobb,M.N.Mindrinos,C.Miller-Graziano,S.E.Calvano,H.V.Baker,W.Xiao,K.Laudanski,B.H.Brownstein,C.M.Elson,D.L.Hayden,D.N.Herndon,S.F.Lowry,R.V.Maier,D.A.Schoenfeld,L.L.Moldawer,R.W.Davis,R.G.Tompkins,P.Bankey,T.Billiar,D.Camp,I.Chaudry,B.Freeman,R.Gamelli,N.Gibran,B.Harbrecht,W.Heagy,D.Heimbach,J.Horton,J.Hunt,J.Lederer,J.Mannick,B.McKinley,J.Minei,E.Moore,F.Moore,R.Munford,A.Nathens,G.O'keefe,G.Purdue,L.Rahme,D.Remick,M.Sailors,M.Shapiro,G.Silver,R.Smith,G.Stephanopoulos,G.Stormo,M.Toner,S.Warren,M.West,S.Wolfe,V.Young,I.a.H.R.t.I.L.-S.C.R.Program,Application of genome-wide expression analysis to human health and disease.Proc Natl Acad Sci U S A 102,4801-4806(2005).
24.J.Seok,H.S.Warren,A.G.Cuenca,M.N.Mindrinos,H.V.Baker,W.Xu,D.R.Richards,G.P.McDonald-Smith,H.Gao,L.Hennessy,C.C.Finnerty,C.M.López,S.Honari,E.E.Moore,J.P.Minei,J.Cuschieri,P.E.Bankey,J.L.Johnson,J.Sperry,A.B.Nathens,T.R.Billiar,M.A.West,M.G.Jeschke,M.B.Klein,R.L.Gamelli,N.S.Gibran,B.H.Brownstein,C.Miller-Graziano,S.E.Calvano,P.H.Mason,J.P.Cobb,L.G.Rahme,S.F.Lowry,R.V.Maier,L.L.Moldawer,D.N.Herndon,R.W.Davis,W.Xiao,R.G.Tompkins,L.r.S.C.R.P.Inflammation and Host Response to Injury,Genomic responses in mouse models poorly mimic human inflammatory diseases.Proc Natl Acad Sci U S A 110,3507-3512(2013).
25.K.H.Desai,C.S.Tan,J.T.Leek,R.V.Maier,R.G.Tompkins,J.D.Storey,I.a.t.H.R.t.I.L.-S.C.R.Program,Dissecting inflammatory complications in critically injured patients by within-patient gene expression changes:a longitudinal clinical genomics study.PLoS Med 8,e1001093(2011).
26.H.S.Warren,C.M.Elson,D.L.Hayden,D.A.Schoenfeld,J.P.Cobb,R.V.Maier,L.L.Moldawer,E.E.Moore,B.G.Harbrecht,K.Pelak,J.Cuschieri,D.N.Herndon,M.G.Jeschke,C.C.Finnerty,B.H.Brownstein,L.Hennessy,P.H.Mason,R.G.Tompkins,I.a.H.R.t.I.L.S.C.R.Program,A genomic score prognostic of outcome in trauma patients.Mol Med 15,220-227(2009).
27.N.Cvijanovich,T.P.Shanley,R.Lin,G.L.Allen,N.J.Thomas,P.Checchia,N.Anas,R.J.Freishtat,M.Monaco,K.Odoms,B.Sakthivel,H.R.Wong,G.o.P.S.S.S.Investigators,Validating the genomic signature of pediatric septic shock.Physiol Genomics 34,127-134(2008).
28.T.P.Shanley,N.Cvijanovich,R.Lin,G.L.Allen,N.J.Thomas,A.Doctor,M.Kalyanaraman,N.M.Tofil,S.Penfil,M.Monaco,K.Odoms,M.Barnes,B.Sakthivel,B.J.Aronow,H.R.Wong,Genome-level longitudinal expression of signaling pathways and gene networks in pediatric septic shock.Mol Med 13,495-508(2007).
29.H.R.Wong,T.P.Shanley,B.Sakthivel,N.Cvijanovich,R.Lin,G.L.Allen,N.J.Thomas,A.Doctor,M.Kalyanaraman,N.M.Tofil,S.Penfil,M.Monaco,M.A.Tagavilla,K.Odoms,K.Dunsmore,M.Barnes,B.J.Aronow,G.o.P.S.S.S.Investigators,Genome-level expression profiles in pediatric septic shock indicate a role for altered zinc homeostasis in poor outcome.Physiol Genomics 30,146-155(2007).
30.H.R.Wong,N.Cvijanovich,G.L.Allen,R.Lin,N.Anas,K.Meyer,R.J.Freishtat,M.Monaco,K.Odoms,B.Sakthivel,T.P.Shanley,G.o.P.S.S.S.Investigators,Genomic expression profiling across the pediatric systemic inflammatory response syndrome,sepsis,and septic shock spectrum.Crit Care Med 37,1558-1566(2009).
31.H.R.Wong,R.J.Freishtat,M.Monaco,K.Odoms,T.P.Shanley,Leukocyte subset-derived genomewide expression profiles in pediatric septic shock.Pediatr Crit Care Med 11,349-355(2010).
32.H.R.Wong,N.Z.Cvijanovich,G.L.Allen,N.J.Thomas,R.J.Freishtat,N.Anas,K.Meyer,P.A.Checchia,R.Lin,T.P.Shanley,M.T.Bigham,D.S.Wheeler,L.A.Doughty,K.Tegtmeyer,S.E.Poynter,J.M.Kaplan,R.S.Chima,E.Stalets,R.K.Basu,B.M.Varisco,F.E.Barr,Validation of a gene expression-based subclassification strategy for pediatric septic shock.Crit Care Med 39,2511-2517(2011).
33.R.Almansa,E.Tamayo,M.Heredia,S.Gutierrez,P.Ruiz,E.Alvarez,E.Gomez-Sanchez,D.Andaluz-Ojeda,R. L.Rico,V.Iglesias,J.I.Gomez-Herreras,J.F.Bermejo-Martin,Transcriptomic evidence of impaired immunoglobulin G production in fatal septic shock.J Crit Care 29,307-309(2014).
34.J.F.Bermejo-Martin,I.Martin-Loeches,J.Rello,A.Antón,R.Almansa,L.Xu,G.Lopez-Campos,T.Pumarola,L.Ran,P.Ramirez,D.Banner,D.C.Ng,L.Socias,A.Loza,D.Andaluz,E.Maravi,M.J.Gómez-Sánchez,M.Gordón,M.C.Gallegos,V.Fernandez,S.Aldunate,C.León,P.Merino,J.Blanco,F.Martin-Sanchez,L.Rico,D.Varillas,V.Iglesias,M.Marcos,F.Gandía,F.Bobillo,B.Nogueira,S.Rojo,S.Resino,C.Castro,R.Ortiz de Lejarazu,D.Kelvin,Host adaptive immunity deficiency in severe pandemic influenza.Crit Care 14,R167(2010).
35.I.Martin-Loeches,E.Papiol,R.Almansa,G.López-Campos,J.F.Bermejo-Martin,J.Rello,Intubated patients developing tracheobronchitis or pneumonia have distinctive complement system gene expression signatures in the pre-infection period:a pilot study.Med Intensiva 36,257-263(2012).
36.E.Tamayo,A.Fernández,R.Almansa,E.Carrasco,L.Goncalves,M.Heredia,D.AndaluzOjeda,G.March,L.Rico,J.I.Gómez-Herreras,R.O.de Lejarazu,J.F.Bermejo-Martin,Beneficial role of endogenous immunoglobulin subclasses and isotypes in septic shock.J Crit Care 27,616-622(2012).
37.X.Hu,J.Yu,S.D.Crosby,G.A.Storch,Gene expression profiles in febrile children with defined viral and bacterial infection.Proc Natl Acad Sci U S A 110,12792-12797(2013).
38.G.P.Parnell,A.S.McLean,D.R.Booth,N.J.Armstrong,M.Nalos,S.J.Huang,J.Manak,W.Tang,O.Y.Tam,S.Chan,B.M.Tang,A distinct influenza infection signature in the blood transcriptome of patients with severe community-acquired pneumonia.Crit Care 16,R157(2012).
39.A.Sutherland,M.Thomas,R.A.Brandon,R.B.Brandon,J.Lipman,B.Tang,A.McLean,R.Pascoe,G.Price,T.Nguyen,G.Stone,D.Venter,Development and validation of a novel molecular biomarker diagnostic test for the early detection of sepsis.Crit Care 15,R149(2011).
40.Y.Tang,H.Xu,X.Du,L.Lit,W.Walker,A.Lu,R.Ran,J.P.Gregg,M.Reilly,A.Pancioli,J.C.Khoury,L.R.Sauerbeck,J.A.Carrozzella,J.Spilker,J.Clark,K.R.Wagner,E.C.Jauch,D.J.Chang,P.Verro,J.P.Broderick,F.R.Sharp,Gene expression in blood changes rapidly in neutrophils and monocytes after ischemic stroke in humans:a microarray study.J Cereb Blood Flow Metab 26,1089-1102(2006).
41.B.M.Tang,A.S.McLean,I.W.Dawes,S.J.Huang,R.C.Lin,The use of gene-expression profiling to identify candidate genes in human sepsis.Am J Respir Crit Care Med 176,676-684(2007).
42.S.H.Ahn,E.L.Tsalik,D.D.Cyr,Y.Zhang,J.C.van Velkinburgh,R.J.Langley,S.W.Glickman,C.B.Cairns,A.K.Zaas,E.P.Rivers,R.M.Otero,T.Veldman,S.F.Kingsmore,J.Lucas,C.W.Woods,G.S.Ginsburg,V.G.Fowler,Gene expression-based classifiers identify Staphylococcus aureus infection in mice and humans.PLoS One 8,e48979(2013).
43.T.Dolinay,Y.S.Kim,J.Howrylak,G.M.Hunninghake,C.H.An,L.Fredenburgh,A.F.Massaro,A.Rogers,L.Gazourian,K.Nakahira,J.A.Haspel,R.Landazury,S.Eppanapally,J.D.Christie,N.J.Meyer,L.B.Ware,D.C.Christiani,S.W.Ryter,R.M.Baron,A.M.Choi,Inflammasomeregulated cytokines are critical mediators of acute lung injury.Am J Respir Crit Care Med 185,1225-1234(2012).
44.J.E.Berdal,T.E.Mollnes,T. O.K.Olstad,B.Halvorsen,T.Ueland,J.H.Laake,M.T.Furuseth,A.Maagaard,H.Kjekshus,P.Aukrust,C.M.Jonassen,Excessive innate immune response and mutant D222G/N in severe A(H1N1)pandemic influenza.J Infect 63,308-316(2011).
45.M.P.Berry,C.M.Graham,F.W.McNab,Z.Xu,S.A.Bloch,T.Oni,K.A.Wilkinson,R.Banchereau,J.Skinner,R.J.Wilkinson,C.Quinn,D.Blankenship,R.Dhawan,J.J.Cush,A.Mejias,O.Ramilo,O.M.Kon,V.Pascual,J.Banchereau,D.Chaussabel,A.O'Garra,An interferon-inducible neutrophil-driven blood transcriptional signature in human tuberculosis.Nature 466,973-977(2010).
46.K.Fredriksson,I. P.Keller,N.Petrovic,B.Ahlman,C.Schéele,J.Wernerman,J.A.Timmons,O.Rooyackers,Dysregulation of mitochondrial dynamics and the muscle transcriptome in ICU patients suffering from sepsis induced multiple organ failure.PLoS One 3,e3686(2008).
47.J.E.McDunn,K.D.Husain,A.D.Polpitiya,A.Burykin,J.Ruan,Q.Li,W.Schierding,N.Lin,D.Dixon,W.Zhang,C.M.Coopersmith,W.M.Dunne,M.Colonna,B.K.Ghosh,J.P.Cobb,Plasticity of the systemic inflammatory response to acute infection during critical illness:development of the riboleukogram.PLoS One 3,e1564(2008).
48.T.P.Chung,J.M.Laramie,D.J.Meyer,T.Downey,L.H.Tam,H.Ding,T.G.Buchman,I.Karl,G.D.Stormo,R.S.Hotchkiss,J.P.Cobb,Molecular diagnostics in sepsis:from bedside to bench.J Am Coll Surg 203,585-598(2006).
49.G.Parnell,A.McLean,D.Booth,S.Huang,M.Nalos,B.Tang,Aberrant cell cycle and apoptotic changes characterise severe influenza A infection--a meta-analysis of genomic signatures in circulating leukocytes.PLoS One 6,e17186(2011).
50.M.Emonts,Ph.D.thesis,Erasmus University Rotterdam,(2008).
51.P.Khatri,S.Roedder,N.Kimura,K.De Vusser,A.A.Morgan,Y.Gong,M.P.Fischbein,R.C.Robbins,M.Naesens,A.J.Butte,M.M.Sarwal,A common rejection module(CRM)for acute rejection across multiple organs identifies novel therapeutics for organ transplantation.J Exp Med 210,2205-2221(2013).
52.T.M.Osborn,J.K.Tracy,J.R.Dunne,M.Pasquale,L.M.Napolitano,Epidemiology of sepsis in patients with traumatic injury.Crit Care Med 32,2234-2240(2004).
53.M.J.Pencina,R.B.D'Agostino,O.V.Demler,Novel metrics for evaluating improvement in discrimination:net reclassification and integrated discrimination improvement for normal variables and nested models.Stat Med 31,101-113(2012).
54.C.L.Smith,P.Dickinson,T.Forster,M.Craigon,A.Ross,M.R.Khondoker,R.France,A.Ivens,D.J.Lynn,J.Orme,A.Jackson,P.Lacaze,K.L.Flanagan,B.J.Stenson,P.Ghazal,Identification of a human neonatal immune-metabolic network associated with bacterial infection.Nat Commun 5,4649(2014).
55.A.G.Vassiliou,N.A.Maniatis,S.E.Orfanos,Z.Mastora,E.Jahaj,T.Paparountas,A.Armaganidis,C.Roussos,V.Aidinis,A.Kotanidou,Induced expression and functional effects of aquaporin-1 in human leukocytes in sepsis.Crit Care 17,R199(2013).
56.F.Allantaz,D.Chaussabel,D.Stichweh,L.Bennett,W.Allman,A.Mejias,M.Ardura,W.Chung,E.Smith,C.Wise,K.Palucka,O.Ramilo,M.Punaro,J.Banchereau,V.Pascual,Blood leukocyte microarrays to diagnose systemic onset juvenile idiopathic arthritis and follow the response to IL-1 blockade.J Exp Med 204,2131-2144(2007).
57.K.Newton,V.M.Dixit,Signaling in innate immunity and inflammation.Cold Spring Harb Perspect Biol 4,(2012).
58.R.Chen,P.Khatri,P.K.Mazur,M.Polin,Y.Zheng,D.Vaka,C.D.Hoang,J.Shrager,Y.Xu,S.Vicent,A.J.Butte,E.A.Sweet-Cordero,A meta-analysis of lung cancer gene expression identifies PTK7 as a survival gene in lung adenocarcinoma.Cancer Res 74,2892-2902(2014).
59.F.Hietbrink,L.Koenderman,M.Althuizen,J.Pillay,V.Kamp,L.P.Leenen,Kinetics of the innate immune response after trauma:implications for the development of late onset sepsis.Shock 40,21-27(2013).
60.S.A.Madsen-Bouterse,R.Romero,A.L.Tarca,J.P.Kusanovic,J.Espinoza,C.J.Kim,J.S.Kim,S.S.Edwin,R.Gomez,S.Draghici,The transcriptome of the fetal inflammatory response syndrome.Am J Reprod Immunol 63,73-92(2010).
61.H.R.Wong,N.Z.Cvijanovich,M.Hall,G.L.Allen,N.J.Thomas,R.J.Freishtat,N.Anas,K.Meyer,P.A.Checchia,R.Lin,M.T.Bigham,A.Sen,J.Nowak,M.Quasney,J.W.Henricksen,A.Chopra,S.Banschbach,E.Beckman,K.Harmon,P.Lahni,T.P.Shanley,Interleukin-27 is a novel candidate diagnostic biomarker for bacterial infection in critically ill children.Crit Care 16,R213(2012).
62.A.Kwan,M.Hubank,A.Rashid,N.Klein,M.J.Peters,Transcriptional instability during evolving sepsis may limit biomarker based risk stratification.PLoS One 8,e60501(2013).
63.R.Cavallazzi,C.L.Bennin,A.Hirani,C.Gilbert,P.E.Marik,Is the band count useful in the diagnosis of infectionAn accuracy study in critically ill patients.J Intensive Care Med 25,353-357(2010).
64.G.Drifte,I.Dunn-Siegrist,P.Tissières,J.Pugin,Innate immune functions of immature neutrophils in patients with sepsis and severe systemic inflammatory response syndrome.Crit Care Med 41,820-832(2013).
65.P.J.Cornbleet,Clinical utility of the band count.Clin Lab Med 22,101-136(2002).
66.W.van der Meer,W.van Gelder,R.de Keijzer,H.Willems,Does the band cell survive the 21st centuryEur J Haematol 76,251-254(2006).
67.K.Saito,T.Wagatsuma,H.Toyama,Y.Ejima,K.Hoshi,M.Shibusawa,M.Kato,S.Kurosawa,Sepsis is characterized by the increases in percentages of circulating CD4+CD25+regulatory T cells and plasma levels of soluble CD25.Tohoku J Exp Med 216,61-68(2008).
68.F.Venet,C.S.Chung,G.Monneret,X.Huang,B.Horner,M.Garber,A.Ayala,Regulatory T cell populations in sepsis and trauma.J Leukoc Biol 83,523-535(2008).
69.D.Grimaldi,S.Louis,F.Pène,G.Sirgo,C.Rousseau,Y.E.Claessens,L.Vimeux,A.Cariou,J.P.Mira,A.Hosmalin,J.D.Chiche,Profound and persistent decrease of circulating dendritic cells is associated with ICU-acquired infection in patients with septic shock.Intensive Care Med 37,1438-1446(2011).
70.S.Park,Y.Zhang,S.Lin,T.H.Wang,S.Yang,Advances in microfluidic PCR for point-of-care infectious disease diagnostics.Biotechnol Adv 29,830-839(2011).
71.M.A.Poritz,A.J.Blaschke,C.L.Byington,L.Meyers,K.Nilsson,D.E.Jones,S.A.Thatcher,T.Robbins,B.Lingenfelter,E.Amiott,A.Herbener,J.Daly,S.F.Dobrowolski,D.H.Teng,K.M.Ririe,FilmArray,an automated nested multiplex PCR system for multi-pathogen detection:development and application to respiratory tract infection.PLoS One 6,e26047(2011).
72.G.Smyth,in Bioinformatics and Computational Biology Solutions Using R and Bioconductor,C.V.Gentleman R,Dudoit S,Irizarry R and Huber W(eds.),Ed.(Springer,New York,2005),pp.pp.397-420.
73.W.Xu,J.Seok,M.N.Mindrinos,A.C.Schweitzer,H.Jiang,J.Wilhelmy,T.A.Clark,K.Kapur,Y.Xing,M.Faham,J.D.Storey,L.L.Moldawer,R.V.Maier,R.G.Tompkins,W.H.Wong,R.W.Davis,W.Xiao,I.a.H.R.t.I.L.-S.C.R.Program,Human transcriptome array for high-throughput clinical studies.Proc Natl Acad Sci U S A 108,3707-3712(2011).
74.Y.Koren,L.Carmel,Robust linear dimensionality reduction.IEEE Trans Vis Comput Graph 10,459-470(2004).
75.A.Bodor,I.Csabai,M.W.Mahoney,N.Solymosi,rCUR:an R package for CUR matrix decomposition.BMC Bioinformatics 13,103(2012).
76.J.Vandesompele,K.De Preter,F.Pattyn,B.Poppe,N.Van Roy,A.De Paepe,F.Speleman,Accurate normalization of real-time quantitative RT-PCR data by geometric averaging of multiple internal control genes.Genome Biol 3,RESEARCH0034(2002).
77.J.T.Leek,W.E.Johnson,H.S.Parker,A.E.Jaffe,J.D.Storey,The sva package for removing batch effects and other unwanted variation in high-throughput experiments.Bioinformatics 28,882-883(2012).
78.R.K.Auerbach,B.Chen,A.J.Butte,Relating genes to function:identifying enriched transcription factors using the ENCODE ChIP-Seq significance tool.Bioinformatics 29,1922-1924(2013).
79.H.G.Roider,T.Manke,S.O'Keeffe,M.Vingron,S.A.Haas,PASTAA:identifying transcription factors associated with sets of co-regulated genes.Bioinformatics 25,435-442(2009).
80.K.L.Jeffrey,T.Brummer,M.S.Rolph,S.M.Liu,N.A.Callejas,R.J.Grumont,C.Gillieron,F.Mackay,S.Grey,M.Camps,C.Rommel,S.D.Gerondakis,C.R.Mackay,Positive regulation of immune cell function and inflammatory responses by phosphatase PAC-1.Nat Immunol 7,274-283(2006).
81.F.O.Martinez,S.Gordon,M.Locati,A.Mantovani,Transcriptional profiling of the human monocyte-to-macrophage differentiation and polarization:new molecules and patterns of gene expression.J Immunol 177,7303-7311(2006).
82.S.Radom-Aizik,F.Zaldivar,S.Y.Leu,P.Galassetti,D.M.Cooper,Effects of 30min of aerobic exercise on gene expression in human neutrophils.J Appl Physiol(1985)104,236-243(2008).
83.F.He,H.Chen,M.Probst-Kepper,R.Geffers,S.Eifes,A.Del Sol,K.Schughart,A.P.Zeng,R.Balling,PLAU inferred from a correlation network is critical for suppressor function of regulatory T cells.Mol Syst Biol 8,624(2012).
84.M.Giefing,S.Winoto-Morbach,J.Sosna,C. W.Klapper,R.Küppers,S.
 D.Adam,R.Siebert,S.Schütze,Hodgkin-Reed-Sternberg cells in classical Hodgkin lymphoma show alterations of genes encoding the NADPH oxidase complex and impaired reactive oxygen species synthesis capacity.PLoS One 8,e84928(2013).
85.J.A.Meyers,D.W.Su,A.Lerner,Chronic lymphocytic leukemia and B and T cells differ in their response to cyclic nucleotide phosphodiesterase inhibitors.J Immunol 182,5400-5411(2009).
86.S.Eckerle,V.Brune,C. E.Tiacci,V.Bohle,C.
 R.Kodet,M.Paulli,B.Falini,W.Klapper,A.B.Chaubert,K.Willenbrock,D.Metzler,A.
 R.Küppers,M.L.Hansmann,Gene expression profiling of isolated tumour cells from anaplastic large cell lymphomas:insights into its cellular origin,pathogenesis and relation to Hodgkin lymphoma.Leukemia 23,2129-2138(2009).
87.K.A.Stegmann,N.K. H.Veber,S.Ciesek,P.Riese,J.Wiegand,J.Hadem,P.V.Suneetha,J.Jaroszewicz,C.Wang,V.Schlaphoff,P.Fytili,M.Cornberg,M.P.Manns,R.Geffers,T.Pietschmann,C.A.Guzmán,H.G.Ljunggren,H.Wedemeyer,Interferon-alpha induced TRAIL on natural killer cells is associated with control of hepatitis C virus infection.Gastroenterology 138,1885-1897(2010).
88.D.C.Vinh,S.Y.Patel,G.Uzel,V.L.Anderson,A.F.Freeman,K.N.Olivier,C.Spalding,S.Hughes,S.Pittaluga,M.Raffeld,L.R.Sorbara,H.Z.Elloumi,D.B.Kuhns,M.L.Turner,E.W.Cowen,D.Fink,D.Long-Priel,A.P.Hsu,L.Ding,M.L.Paulson,A.R.Whitney,E.P.Sampaio,D.M.Frucht,F.R.DeLeo,S.M.Holland,Autosomal dominant and sporadic monocytopenia with susceptibility to mycobacteria,fungi,papillomaviruses,and myelodysplasia.Blood 115,1519-1529(2010).
89.P.Ancuta,K.Y.Liu,V.Misra,V.S.Wacleche,A.Gosselin,X.Zhou,D.Gabuzda,Transcriptional profiling reveals developmental relationship and distinct biological functions of CD16+and CD16-monocyte subsets.BMC Genomics 10,403(2009).
90.N.Novershtern,A.Subramanian,L.N.Lawton,R.H.Mak,W.N.Haining,M.E.McConkey,N.Habib,N.Yosef,C.Y.Chang,T.Shay,G.M.Frampton,A.C.Drake,I.Leskov,B.Nilsson,F.Preffer,D.Dombkowski,J.W.Evans,T.Liefeld,J.S.Smutko,J.Chen,N.Friedman,R.A.Young,T.R.Golub,A.Regev,B.L.Ebert,Densely interconnected transcriptional circuits control cell states in human hematopoiesis.Cell 144,296-309(2011).
91.F.Allantaz,D.T.Cheng,T.Bergauer,P.Ravindran,M.F.Rossier,M.Ebeling,L.Badi,B.Reis,H.Bitter,M.D'Asaro,A.Chiappe,S.Sridhar,G.D.Pacheco,M.E.Burczynski,D.Hochstrasser,J.Vonderscher,T.Matthes,Expression profiling of human immune cell subsets identifies miRNA-mRNA regulatory relationships correlated with cell type specific expression.PLoS One 7,e29979(2012).
92.E.Tsitsiou,A.E.Williams,S.A.Moschos,K.Patel,C.Rossios,X.Jiang,O.D.Adams,P.Macedo,R.Booton,D.Gibeon,K.F.Chung,M.A.Lindsay,Transcriptome analysis shows activation of circulating CD8+T cells in patients with severe asthma.J Allergy Clin Immunol 129,95-103(2012).
93.M.Frankenberger,T.P.Hofer,A.Marei,F.Dayyani,S.Schewe,C.Strasser,A.Aldraihim,F.Stanzel,R.Lang,R.Hoffmann,O.Prazeres da Costa,T.Buch,L.Ziegler-Heitbrock,Transcript profiling of CD16-positive monocytes reveals a unique molecular fingerprint.Eur J Immunol 42,957-974(2012).
94.N.Y.Huen,A.L.Pang,J.A.Tucker,T.L.Lee,M.Vergati,C.Jochems,C.Intrivici,V.Cereda,W.Y.Chan,O.M.Rennert,R.A.Madan,J.L.Gulley,J.Schlom,K.Y.Tsang,Up-regulation of proliferative and migratory genes in regulatory T cells from patients with metastatic castration-resistant prostate cancer.Int J Cancer 133,373-382(2013).
95.K.C.Malcolm,E.M.Nichols,S.M.Caceres,J.E.Kret,S.L.Martiniano,S.D.Sagel,E.D.Chan,L.Caverly,G.M.Solomon,P.Reynolds,D.L.Bratton,J.L.Taylor-Cousar,D.P.Nichols,M.T.Saavedra,J.A.Nick,Mycobacterium abscessus induces a limited pattern of neutrophil activation that promotes pathogen survival.PLoS One 8,e57402(2013).
96.N.Rapin,F.O.Bagger,J.Jendholm,H.Mora-Jensen,A.Krogh,A.Kohlmann,C.Thiede,N.Borregaard,L.Bullinger,O.Winther,K.Theilgaard- B.T.Porse,Comparing cancer vs normal gene expression profiles identifies new disease entities and common transcriptional programs in AML patients.Blood 123,894-904(2014).
97.N.A.Mabbott,J.K.Baillie,H.Brown,T.C.Freeman,D.A.Hume,An expression atlas of human primary cells:inference of gene function from coexpression networks.BMC Genomics 14,632(2013).
Example 2
Testing sepsis gene expression diagnostics using a common data benchmark
There is no gold standard molecule test available quickly to determine whether a patient with systemic inflammation is likely to be infected. Missed diagnosis of sepsis leads to delayed treatment and increased mortality, while inappropriate antibiotics increase antibiotic resistance and may cause complications (Ferrer et al (2014) Critical Care 42(8): 1749-. Therefore, there is an urgent unmet need for new diagnostics that can separate patients with non-infectious inflammation from those with sepsis (Cohen et al (2015) Lancet infection 15(5): 581-614).
New diagnoses that can distinguish sepsis from non-infectious inflammation are difficult to obtain, because many cellular pathways activated in response to infection are also activated in response to tissue trauma and non-infectious inflammation. Therefore, high throughput 'omics' techniques, such as gene expression profiling via microarrays, are good ways to study sepsis, as they allow testing of tens of thousands of genes simultaneously. Statistical techniques can then be used to derive new classifiers optimized for diagnosis. However, high-throughput datasets consistently have more variables than samples and are therefore prone to irreproducible overfitting results (Shi et al (2008) BMC bioinformatics 9 suppl 9: S10; Ioanidis et al (2001) Nature genetics (Nat Genet) 29(3):306- > 309). Furthermore, to increase statistical efficacy, individual biomarker datasets are created in clinically homogeneous cohorts, and are typically created using only a single type of microarray. While this design does allow greater efficacy in detecting differences between the groups studied, the results are unlikely to remain true in different clinical groups using different laboratory techniques. Therefore, independent validation is absolutely necessary to estimate the general applicability of any new classifier derived from high-throughput studies.
To our knowledge, three gene expression diagnostics have been developed specifically using microarray data to isolate patients with sepsis from those with non-infectious inflammation. These are a collection of 11 genes referred to hereinafter as 'Sepsis MetaScore' (SMS) (Sweeney et al (2015) science transformation medicine (Sci Transl Med) 7(287):287ra271), FAIM3: PLAC8 ratios (Scischuna et al (2015) American journal of respiratory and intensive Care medicine (Am J Respir Crit Care Med.) (192 (7): 826-) 835) and Septic Lab (McHugh et al (2015) public science library medical (12): e 1001916). In addition, there are several dozen publicly available data sets that examine patients with sepsis or acute infection. They cover a very wide range of clinical conditions, including different age groups, infection types, co-existing conditions and control (non-infectious) conditions. This relatively unutilized public resource can therefore be used to assess the relative advantages and disadvantages of different diagnoses across a vast number of patient samples. Here we used all available published gene expression data to study and directly compare the diagnostic capabilities of the three sepsis gene expression diagnostics.
Method
We completed a systematic search of two public gene expression repositories (NIH GEO and EBI ArrayExpress) in 2015, 12, 10, using the following terminology: sepsis, SIRS, pneumonia, trauma, ICU, infection, acute, shock, and surgery. We automatically excluded non-microarray, non-human data. Subsequently, using the digests of the corresponding originals for screening, we removed (1) the non-clinical dataset, (2) the non-time matched dataset, and (3) the non-whole blood dataset. The remaining data sets were then sorted according to whether the reference cohort (compared to sepsis) was a healthy control or an uninfected SIRS patient. A schematic diagram is shown in fig. 17. In addition to data from systematic searches, we included two longitudinal trauma groups from inflammation and host response to injury (Glue Grant) groups, as previously described (Sweeney et al (2015) science transformation medicine 7(287):287ra 2717). Groups from the same study run on different microarrays were treated as independent groups.
All data sets available for the original material are renormalized, if possible. Affymetrix arrays were renormalized using gcRMA (on arrays available with perfectly matched probes) or RMA. Illumina, Agilent, GE and other commercially available arrays were renormalized via normal exponential background correction followed by quantile normalization. The custom array is not renormalized. All data is used in the log2 transform state. The probes were assembled into genes in the dataset using a fixed effect model (Ramasamamy et al (2008) public science library & medicine 5(9): e 184).
A literature review was performed to search for gene expression signatures that specifically optimize sepsis diagnosis compared to uninfected patients. The resulting model was then tested for sepsis diagnostic ability as measured by the area under the subject's operating characteristic curve (AUC). Data sets that may not be able to calculate any sepsis score (all upregulated or all downregulated gene deletions) were excluded from the final results. For a given comparison (e.g., non-infectious SIRS versus sepsis at the time of admission), the average of all the types of data sets and only non-discovery data sets was calculated, as discovery data sets were expected to show an overestimated diagnostic power compared to independently validated data sets. Finally, we compared the overlapping validation sets for each diagnostic score using paired t-tests (e.g., comparing the set of 11 genes to the ability of the FAIM3: PLAC8 ratio to diagnose sepsis in GSE74227, E-MEXP-3589, and Glue Grant neutrophils, as these groups are the only groups validating both data sets).
Patient samples in GSE28750(11) (N21) were also used for late dataset GSE74224(McHugh et al (2015) public science library-medicine 12(12): e1001916) (N105), although these two datasets were run using different microarray types (Affymetrix HG 2.0 vs Affymetrix Exon 1.0 ST). Thus, GSE28750 is not included in the validation calculations for the Septicyte Lab (found in GSE 74224), whereas in calculating the validation average for the Sepsis MetaScore, the AUC in GSE74224 is penalized (penalty AUC 0.8+ actual AUC 0.2 in GSE 28750) to the actual AUC, taking into account the fact that there are 20% of GSE74224 patients in the findings.
To test for confounding infection types, each dataset was screened for the presence of (1) gram-positive and gram-negative infections or (2) bacterial and viral infections. It is assumed that the microbiological assay as described by the original author of the data is correct. Cases of co-infection were not included in the scrambled comparison. To test for confounding, each gene expression score was calculated for a dataset comprising two categories of interest, and the resulting scores between the categories were compared via wilcoxon rank sum test within the dataset.
Meta-analysis was performed as previously described. Briefly, differential gene expression between non-infectious SIRS and sepsis patients within the hedgeg summary dataset was used, followed by a model of the der simonian-Laird random effect, followed by comparison between datasets by Benjamini-Hochberg correction. Forest plots of individual genes show the individual effects within each data set in log2 space, as well as the aggregated 'meta-effects'. All analyses were performed using the R statistical calculation language. The significance test was always a two-tailed test. Codes and data for comparison of sepsis with non-infectious SIRS readmitted for the gene set examined are available at http:// khatrilab. The uploaded data is in the renormalized form as used herein. The Glue Grant data is available to researchers who have been approved by the Glue Grant consortium; the instructions are on our website. If the results are used in a manuscript, the author application cites this article and an article describing the original data set.
Results
We performed a systematic search of public gene expression databases (fig. 17), and we also used two independent Glue Grant wound cohorts, broken down into time-matched bins of uninfected patients and patients within +/-24 hours of sepsis diagnosis, as described previously (Sweeney et al (2015) science transformation medicine 7(287):287ra 271). This results in a total of 39 standard-compliant datasets consisting of 3241 patient samples (Scicluna et al, supra; McHugh et al, supra; Dolinay et al (2012), journal of respiratory and intensive Care medicine in the United states 185(11): 1225-1234; Parnell et al (2012) Critical Care's disease Surveillance 16(4): R157; Wong et al (2007) Genomics 30(2): 146-155; Wynn et al (2011) molecular medicine 17(11-12): 1146-1156; Wong et al (2009) Critical Care's medicine 37(5): 20158-1566; Shanley et al (2007) molecular medicine BMC 13(9-10) -508; Notvinovich et al (2008): Biocal Mun et al [ 201 ] Psyc 127 ] Psyc [10 ] Psyc 134; Wong et al (2008) Psyc 127 [10 ] Psyc [ 12 ] Psyc ] 201, Wong et al (2008) Psyc Library learning neglected tropical diseases (PLoS Negl Trop Dis) 9(3) e 0003522; antibodies m. (thesis, doctor), pleomorphism of immunoreactive Genes in Infectious Diseases and Autoimmune Diseases (polymorphism in Immune Response Genes in Infectious Diseases and Autoimmune Diseases): university of winterdan ilastim; 2008; pankla et al (2009) genome biology 10(11) R127; zaas et al (2009) Cell Host and microorganisms (Cell Host Microbe) 6(3) 207-217; parnell et al (2011) public science library & synthesis 6(3) e 17186; Bermejo-Martin et al (2010) Critical Care 14(5) R167; berry et al (2010) Nature 466(7309) 973-977; smith et al (2014) Nature Commission 5: 4649; berdal et al (2011) J.infectious diseases 63(4) 308-; ahn et al (2013) public science library & synthesis 8(1) e 48979; mejias et al (2013) public science library & medicine 10(11) e 1001549; hu et al (2013) Proc. Natl. Acad. Sci. USA 110(31): 12792-; herberg et al (2013) J infectious diseases 208(10) 1664-1668; kwissa et al (2014) cell hosts and microorganisms 16(1) 115-127; cazalis et al (2014) Intensive Care Med Exp (Intensive Care Med Exp) 2(1) 20; suarez et al (2015) journal of infectious diseases 212(2): 213-222; zhai et al (2015) public science library & pathogens (PLoS Patholog) 11(6) e 1004869; conejero et al (2015) J Immunol 195(7): 3248-3261; xiao et al (2011) journal of Experimental medicine 208(13): 2581-2590; and Warren et al (2009) molecular medicine 15(7-8): 220-.
Our literature review reveals three gene expression classifiers that are specifically optimized to distinguish non-infectious SIRS from sepsis in whole blood samples. They are: our previously disclosed set of 11 genes (SMS) (Sweeney et al, science & transform medicine 2015); FAIM3 PLAC8 ratio (Scicluna et al, AJRCCM 2015) and Septicyte Lab (McHugh et al, public science library & medicine 2015). For each sample, scores for 11 genes were calculated according to the following formula:

FAIM3 PLAC8 ratio was calculated as follows: PLAC8/FAIM 3. The Septicyte Lab is calculated as follows: (PLAC8+ LAMP1) - (PLA2G7+ CEACAM 4). In all cases, the calculations were performed on log2 transformed data.
The robustness and reproducibility of each of the three sepsis scores was dependent on robust and reproducible expression changes of each of its constituent genes. Therefore, we explored how the individual genes constantly change in each of the three tests in a 12 whole blood cohort comparing uninfected SIRS/trauma patients to sepsis patients. Our meta-analysis of these data sets revealed that each of the 16 genes included in any of the 3 gene scores (except CEACAM4) varied in the desired direction (FDR < 5%). Notably, one gene in CEACAM4, Septicyte Lab, was significantly down-regulated only in its corresponding discovery cohort.
Next, we divide the data set into two broad types of comparisons: patients with non-infectious SIRS or trauma to sepsis or acute infected patients (table 1); and healthy controls versus patients with sepsis or acute infection (table 2). For both types of comparisons, we calculated the total mean AUC and the AUC when only independent validation datasets were included; for each of the three signatures, we exclude its respective discovery dataset.
In the noninfectious SIRS/trauma dataset vs sepsis dataset (16 cohorts, 1148 samples, table 1), there were no significant differences in paired t-tests between AUC comparing the diagnostic scores of three gene expression for the overlap validation dataset (all p >0.1, fig. 18 and 19). When comparing AUC from all 16 cohorts (i.e. including the finding cohort), Sepsis MetaScore AUC was significantly higher than AUC of the other two gene scores (both p <0.05), with no significant difference between FAIM3: PLAC8 ratio and Septicyte Lab. However, these results do not necessarily indicate that the overall performance of Sepsis MetaScore is better, as Sepsis MetaScore uses 9 of these discovery groups. The FAIM3: PLAC8 ratio showed reduced performance in GSE32707 and GSE40012, but as previously discussed it was specifically designed to test for the presence of CAP and may not be universally applicable to other forms of non-infectious inflammation (41, 42). Finally, the performance of the Septicyte Lab in isolating pediatric SIRS/sepsis patients and hospitalized COPD patients with and without infection was significantly reduced (AUC < 0.5). It is likely that this decrease in AUC for the septiyte Lab is due to differences in clinical condition or microarray type compared to the initial discovery cohort for the septiyte Lab.
We next examined the data set comparing healthy controls to patients with sepsis or acute infection (26 data sets, 2417 samples, table 2). Most, but not all, of these patients suffer from sepsis; however, for sepsis diagnostic tests it is reasonable to expect that it should be able to distinguish most infections from healthy controls. Here, both the Sepsis MetaScore and FAIM3: PLAC8 ratios were shown as expected, with mean validation AUC of 0.96+/-0.05 and 0.94+/-0.09 (Table 2). However, AUC for the septiyte Lab in 12 datasets (43% of the total) consisting of 1562 samples (64% of the total) was <0.7, so that the mean validation AUC was 0.71+/-0.20 (table 2), significantly lower than Sepsis MetaScore and FAIM3: PLAC8 ratios (both P <1 e-5). Again, this reduction in performance is attributable to the Septicyte Lab, including CEACAM4, which was found to be insignificant in the meta-analysis. One may argue that there is no clinical need for a diagnosis to separate healthy controls from septic patients; however, poor performance in distinguishing the two groups may indicate a deeper bias and may increase the risk of non-universal applicability.
An ideal sepsis diagnosis should not show a change in performance depending on the type of infection present. To investigate whether any diagnosis is biased towards a particular infection type, we searched through all included datasets to find those comparing patients with bacterial and viral infections and those comparing gram-positive and gram-negative infections. We then compared the diagnostic ability in detecting these infection types (compared to healthy controls) and comparing the score distribution. Since a higher score indicates a higher likelihood of infection, a consistently lower score in one infection type may indicate a decreased diagnostic performance for that type, even if the change in diagnostic performance is not detected compared to a healthy control.
There are 8 data sets that provide information about whether a patient has a bacterial or viral infection. In general, there was little difference between AUC for bacterial and viral infection for any of the three scores (table 3); however, this may be due to the small number and relatively high AUC when comparing these infections to healthy controls. However, despite these warnings, the Sepsis MetaScore and FAIM3: PLAC8 ratios both showed higher mean scores in 7/8 test data sets compared to patients with bacterial infections, and both reached significance in 2/8 data sets (table 5). In contrast, the Septicyte Lab did not show a strong trend in comparing bacterial and viral infections, showing in one data set a significantly higher average in viral infections than in bacterial infections.
The presence of 8 data sets provides information on whether a patient has gram-positive and gram-negative infections. Comparison of gram-positive and gram-negative infections revealed no difference in AUC for Sepsis MetaScore or FAIM3: PLAC8 ratio; the Septicyte Lab showed some variability, but this could be due to a high variability between gram-positive and gram-negative infections in diagnostic performance relative to healthy controls rather than differences (Table 4). Sepsis MetaScore, FAIM3: PLAC8 ratio and Septicyte lab show 2, 1 and 1 datasets, respectively, with scores significantly higher in gram-negative patients than in gram-positive patients (table 6).
Discussion of the invention
Here we compared three Sepsis gene expression diagnostics (Sepsis MetaScore, FAIM3: PLAC8 ratio and Septicyte Lab) in all available time-matched whole blood clinical Sepsis datasets. There was no significant difference in AUC distributions comparing all validated non-infectious SIRS/trauma and sepsis datasets. However, there were several FAIM3: PLAC8 ratios and Septicyte Lab showing individual datasets with AUC < 0.7. Notably, the Septicyte Lab also had significantly reduced performance in the validation cohort when healthy controls were compared to patients with sepsis or acute infection, where Septicyte Lab showed AUC <0.7 in 43% of all datasets. The Septicyte Lab was first validated in a large independent patient cohort from the MARS alliance using targeted qPCR and showed a total validated AUC of 0.88(McHugh et al (2015) public science library & medicine 12(12): e 1001916); thus, a decrease in performance in our analysis may indicate a difference in clinical condition, a difference in technology, or both. Forest plots indicate that the effective amount of CEACAM4 in GSE74224 (discovery cohort of Septicyte Lab) may be an outlier, which may result in relatively worse universal applicability.
There were some signs of a trend towards higher scores in bacterial infections compared to viral infections for Sepsis MetaScore and FAIM3: PLAC8 ratios, while Septicyte Lab showed some signs of higher scores in viral infections. There was a statistically insignificant trend towards higher scores in gram-negative infections compared to gram-positive infections for all three scores. However, different pathogen types were not matched for disease severity, age, gender, or other clinical confounders in their individual datasets; therefore, these trends must be carefully explained. For example, if a bacterial infection is generally more severe than a viral infection and gram negative is generally more severe than gram positive, then these scores may indicate confounding by severity. In all groups of all tests used for comparison here, further tests for confounders would therefore be necessary.
Sepsis MetaScore was previously validated on the Glue Grant neutrophil cohort and on a subset of healthy versus infected cohorts (Sweeney et al (2015) science transformation medicine 7(287):287ra 271). In the additional cohorts tested here, Sepsis MetaScore continued to show similar results to previous validation. FAIM3: PLAC8 ratio was validated in subsequent publications in some of these data (Sweeney et al (2015) U.S. journal of respiratory and Severe Care medicine 192(10):1260 1261), although the authors noted that their gene set was originally designed to determine the problem of extreme stenosis of CAP in patients admitted to the ICU suspected of having CAP (Scicluna et al (2015) U.S. journal of respiratory and Severe Care medicine 192(10):1261 1262). Septicyte Lab was tested in cohort E-TABM-1548 (McHugh et al, supra), but we have previously shown that the cohort is not suitable for testing sepsis diagnostics due to expected changes in baseline gene expression profiles resulting from recovery from surgery (Sweeney et al (2015, supra).
The fact that common data is not used for new diagnostic validation may reflect the difficulty and cognitive tortuosity some researchers face in acquiring and using such data. In view of the difficulty in transforming common data into a form that is easy to use, we have provided a hand-drawn universal repository for such data and an R-script (khatrilab. stanford. edu/sepsis) that facilitates applying the classifiers of interest to the data set. We suggest that the practice of any new gene expression classifier for sepsis should be tested in these data to ease benchmarking and comparisons between classifiers. We recognize that simply measuring AUC cannot account for all possible measures of clinical utility. In addition, scoring performed repeatedly enough in a single clinical domain may have great clinical utility even if failing in different clinical domains, and should require careful application. Notwithstanding this, it is important to elucidate the advantages and disadvantages of any new sepsis diagnosis to help focus resources on other clinical trials in areas that show the greatest promise.
Each set of diagnostic genes tested here has advantages and disadvantages. Generally, for any sepsis diagnostic to become clinically useful, it must retain good diagnostic power in its final form across a wide range of patient settings. The microarray cohort used here allows head-to-head comparison of different gene expression diagnostics, but when targeted analysis is used (i.e., no technical variables spanning multiple microarray platforms), any test underestimated diagnostic performance can be shown. Therefore, further prospective validation of any gene set should be required before they are transferred to clinical practice. In addition, given the increased technical accuracy, the molecular profile of the host response will likely become a valuable part of the clinical tool set for diagnosis, treatment and possibly prevention of sepsis.
While the preferred embodiments of the invention have been illustrated and described, it will be appreciated that various changes can be made therein without departing from the spirit and scope of the invention.
Table 1. non-infectious SIRS/trauma versus sepsis/infection data set. (D) The method comprises the following steps A scored discovery data set is given. GSE28750 is a subset of GSE74224 and was therefore counted as findings from the Septicyte Lab. GSE28750 is a subset of GSE74224 and is processed as described in the methods.

Table 2. health versus sepsis/acute infection. (D) The method comprises the following steps Discovery data set given a score


TABLE 3 comparison of AUC for bacterial and viral infections versus healthy controls. (D) The method comprises the following steps A scored discovery data set is given.

TABLE 4 comparison of AUC for gram negative and gram positive infections versus healthy controls. (D) The method comprises the following steps A scored discovery data set is given.


Claims (21)
1. Use of an agent for measuring the expression level of CEACAM1, ZDHHC19, C9orf95, GNA15, BATF, C3AR1, KIAA1370, TGFBI, MTCH1, RPGRIP1, and HLA-DPB1 in a biological sample for the manufacture of a kit for diagnosing sepsis in a subject,
wherein an increased expression level of the CEACAM1, ZDHHC19, C9orf95, GNA15, BATF, and C3AR1 biomarkers and a decreased expression level of the KIAA1370, TGFBI, MTCH1, RPGRIP1, and HLA-DPB1 biomarkers compared to a reference value range of biomarkers for an uninfected control subject indicates that the subject has sepsis.
2. The use of claim 1, wherein the expression level of the biomarker is compared to a time-matched reference value range for an infected or uninfected subject.
3. The use of claim 1, wherein the subject's sepsis score is calculated based on the expression levels of the biomarkers according to the formula:

wherein a higher sepsis score for the subject as compared to a reference value range for an uninfected control subject indicates that the subject has sepsis.
4. The use of claim 1, wherein sepsis is differentiated from non-infectious inflammatory conditions.
5. The use of claim 4, wherein the non-infectious inflammatory condition is selected from the group consisting of: systemic Inflammatory Response Syndrome (SIRS), autoimmune disorders, traumatic injury, and surgery.
6. The use of claim 1, wherein the subject is a human.
7. The use of claim 1, wherein the expression level of the biomarker is measured by microarray analysis, Polymerase Chain Reaction (PCR), reverse transcriptase polymerase chain reaction (RT-PCR), Northern blot, or Serial Analysis of Gene Expression (SAGE).
8. The use of claim 1, wherein the biological sample comprises whole blood, buffy coat, plasma, serum, Peripheral Blood Mononuclear Cells (PBMCs), rod shaped nuclear cells, neutrophils, monocytes or T cells.
9. Use of an agent for measuring the expression level of CEACAM1, ZDHHC19, C9orf95, GNA15, BATF, C3AR1, KIAA1370, TGFBI, MTCH1, RPGRIP1, and HLA-DPB1 in the manufacture of a kit for monitoring the efficacy of a therapy for treating sepsis in a subject, the monitoring comprising: measuring the expression levels of CEACAM1, ZDHHC19, C9orf95, GNA15, BATF, C3AR1, KIAA1370, TGFBI, MTCH1, RPGRIP1, and HLA-DPB1 biomarkers in a first sample derived from the subject prior to the subject undergoing the therapy and in a second sample derived from the subject subsequent to the subject undergoing the therapy, wherein an increased expression level of the CEACAM1, ZDHHC19, C9orf95, GNA15, BATF, and C3AR1 biomarkers and a decreased expression level of the KIAA1370, TGFBI, MTCH1, RPGRIP1, and HLA-DPB1 biomarkers in the second sample as compared to the expression level of the biomarkers in the first sample is indicative of worsening in the subject, and a decrease in the expression level of the CEACAM1, ZDHHC19, C9orf95, GNA15, BATF, and C3AR1 biomarkers and an increase in the expression level of the KIAA1370, TGFBI, MTCH1, RPGRIP1, and HLA-DPB1 biomarkers in the second sample as compared to the expression level of the biomarkers in the first sample indicates that the subject is improved.
10. The use of claim 9, wherein calculating the sepsis score for the subject, wherein a higher sepsis score for the second sample as compared to the sepsis score for the first sample indicates worsening in the subject, and a lower sepsis score for the second sample as compared to the sepsis score for the first sample indicates improvement in the subject.
11. A kit comprising reagents for measuring the expression levels of 11 to 30 sepsis biomarkers including CEACAM1, ZDHHC19, C9orf95, GNA15, BATF, C3AR1, KIAA1370, TGFBI, MTCH1, RPGRIP1, and HLA-DPB 1.
12. The kit of claim 11, further comprising a microarray.
13. The kit of claim 12, wherein the kit comprises a microarray comprising an oligonucleotide that hybridizes to a CEACAM1 polynucleotide, an oligonucleotide that hybridizes to a ZDHHC19 polynucleotide, an oligonucleotide that hybridizes to a C9orf95 polynucleotide, an oligonucleotide that hybridizes to a GNA15 polynucleotide, an oligonucleotide that hybridizes to a BATF polynucleotide, an oligonucleotide that hybridizes to a C3AR1 polynucleotide, an oligonucleotide that hybridizes to a KIAA1370 polynucleotide, an oligonucleotide that hybridizes to a TGFBI polynucleotide, an oligonucleotide that hybridizes to a MTCH1 polynucleotide, an oligonucleotide that hybridizes to an RPGRIP1 polynucleotide, and an oligonucleotide that hybridizes to an HLA-DPB1 polynucleotide.
14. The kit of claim 11, further comprising information in electronic or paper form comprising instructions relating the detected level of each biomarker to sepsis.
15. A diagnostic system for performing a computer-implemented method for diagnosing a patient suspected of having sepsis, the computer performing steps comprising:
a) receiving entered patient data comprising expression level values for CEACAM1, ZDHHC19, C9orf95, GNA15, BATF, C3AR1, KIAA1370, TGFBI, MTCH1, RPGRIP1, and HLA-DPB1 biomarkers in a biological sample from the patient;
b) analyzing the level of each biomarker and comparing to a corresponding reference value range for each biomarker;
c) calculating a sepsis score for the patient based on the expression levels of the biomarkers according to the formula:

d) calculating a likelihood that the patient has sepsis based on the value of the sepsis score, wherein a sepsis score for the patient that is higher compared to a reference value range for an uninfected control subject indicates that the patient has sepsis; and
e) displaying diagnostic information about the patient,
wherein the diagnostic system comprises:
a) a storage component for storing data, wherein the storage component has instructions for determining a diagnosis of a subject stored therein;
b) a computer processor for processing data, wherein the computer processor is coupled to the storage component and configured to execute instructions stored in the storage component in order to receive patient data and analyze the patient data according to one or more algorithms; and
c) a display assembly for displaying diagnostic information about the patient.
16. The diagnostic system of claim 15, wherein the storage component further comprises instructions for performing multivariate Linear Discriminant Analysis (LDA), Receiver Operating Characteristics (ROC) analysis, collective data mining methods, cell-specific significance analysis of microarrays (csSAM), and multidimensional protein identification technology (MUDPIT) analysis.
17. A composition comprising a plurality of in vitro complexes, wherein the plurality of in vitro complexes comprise labeled probes that hybridize to nucleic acids of 11 to 30 sepsis biomarkers including CEACAM1, ZDHHC19, C9orf95, GNA15, BATF, C3AR1, KIAA1370, TGFBI, MTCH1, RPGRIP1, and HLA-DPB1, the labeled probes hybridize to the biomarker gene sequences or complements thereof, wherein the nucleic acids are extracted from a patient with sepsis or are amplification products of nucleic acids extracted from a patient with sepsis.
18. The composition of claim 17, wherein the in vitro complex is in a detection device.
19. The composition of claim 17, wherein the labeled probe comprises a fluorescent label, a bioluminescent label, a chemiluminescent label, a colorimetric label, or an isotopic label.
20. Use of a labelled probe capable of detecting the gene sequences of the biomarkers CEACAM1, ZDHHC19, C9orf95, GNA15, BATF, C3AR1, KIAA1370, TGFBI, MTCH1, RPGRIP1 and HLA-DPB1 in a biological sample for the preparation of a kit for the diagnosis of sepsis in a patient,
the labeled probe is capable of hybridizing to the biomarker CEACAM1, ZDHHC19, C9orf95, GNA15, BATF, C3AR1, KIAA1370, TGFBI, MTCH1, RPGRIP1, and HLA-DPB1 gene sequences, or complements thereof, so as to produce the composition of claim 17, wherein
Measuring the amount of in vitro complexes the expression level of the biomarker nucleic acid in the biological sample; and
an increase in the expression level of the CEACAM1, ZDHHC19, C9orf95, GNA15, BATF, or C3AR1 biomarker nucleic acid as compared to a reference value range of the biomarker nucleic acid for a control subject indicates that the patient has sepsis, or a decrease in the expression level of the KIAA1370, TGFBI, MTCH1, RPGRIP1, or HLA-DPB1 biomarker nucleic acid as compared to a reference value range of the biomarker nucleic acid for a control subject indicates that the patient has sepsis.
21. The use of claim 20, wherein calculating a sepsis score for the patient based on the expression level of the biomarker nucleic acid, wherein a sepsis score for the patient that is higher compared to the reference value range for the control subject indicates that the patient has sepsis.
Applications Claiming Priority (3)
| Application Number | Priority Date | Filing Date | Title |
|---|---|---|---|
| US201562132293P | 2015-03-12 | 2015-03-12 | |
| US62/132,293 | 2015-03-12 | ||
| PCT/US2016/022233 WO2016145426A1 (en) | 2015-03-12 | 2016-03-12 | Methods for diagnosis of sepsis |
Publications (2)
| Publication Number | Publication Date |
|---|---|
| CN107532214A CN107532214A (en) | 2018-01-02 |
| CN107532214B true CN107532214B (en) | 2021-08-31 |
Family
ID=56878909
Family Applications (1)
| Application Number | Title | Priority Date | Filing Date |
|---|---|---|---|
| CN201680023601.1A Active CN107532214B (en) | 2015-03-12 | 2016-03-12 | Method for sepsis diagnosis |
Country Status (8)
| Country | Link |
|---|---|
| US (3) | US10533224B2 (en) |
| EP (1) | EP3268499B1 (en) |
| JP (3) | JP6995622B2 (en) |
| CN (1) | CN107532214B (en) |
| AU (2) | AU2016228508A1 (en) |
| CA (1) | CA2977422A1 (en) |
| IL (3) | IL297699A (en) |
| WO (1) | WO2016145426A1 (en) |
Families Citing this family (17)
| Publication number | Priority date | Publication date | Assignee | Title |
|---|---|---|---|---|
| CN106661765B (en) | 2014-03-14 | 2020-06-05 | 罗伯特·E·W·汉考克 | Diagnosis of sepsis |
| GB201616557D0 (en) * | 2016-09-29 | 2016-11-16 | Secretary Of State For Health The | Assay for distinguishing between sepsis and systemic inflammatory response syndrome |
| WO2018129413A1 (en) * | 2017-01-08 | 2018-07-12 | The Henry M. Jackson Foundation For The Advancement Of Military Medicine, Inc. | Systems and methods for using supervised learning to predict subject-specific bacteremia outcomes |
| EP3477305A1 (en) | 2017-10-25 | 2019-05-01 | Universität Heidelberg | Delta-like ligand 1 for diagnosing severe infections |
| US10433191B2 (en) * | 2018-01-08 | 2019-10-01 | Cisco Technology, Inc. | Channel management in a virtual access point (VAP) |
| US11538566B2 (en) * | 2018-05-23 | 2022-12-27 | Beckman Coulter, Inc. | Sample analysis with test determination based on identified condition |
| AU2019355036A1 (en) * | 2018-10-04 | 2021-05-06 | Western Sydney Local Health District | Bacteriophage treatment and reduction in inflammatory response |
| US20210388443A1 (en) * | 2018-11-05 | 2021-12-16 | Institute For Systems Biology | Sepsis biomarker panels and methods of use |
| US11104946B2 (en) * | 2019-04-23 | 2021-08-31 | Inflammatix, Inc. | DNA sequences related to diagnosis and treatment of systemic inflammatory response syndrome |
| CN112391460A (en) * | 2019-08-19 | 2021-02-23 | 四川生美思达生物科技有限公司 | Biomarker group for sepsis, sepsis judgment method and kit |
| CA3198903A1 (en) | 2019-12-13 | 2021-03-19 | Autonomous Medical Devices Inc. | Apparatus and method for point-of-care, rapid, field-deployable diagnostic testing of covid-19, viruses, antibodies and markers |
| KR102281512B1 (en) * | 2020-03-26 | 2021-07-23 | 경북대학교 산학협력단 | Composition for diagnosing inflammatory diseases comprising agents detecting the level of acetylation of transforming growth factor β-induced protein |
| CN111563891B (en) * | 2020-05-09 | 2023-09-26 | 吾征智能技术(北京)有限公司 | Disease prediction system based on color cognition |
| FR3112211A1 (en) * | 2020-07-06 | 2022-01-07 | bioMérieux | Method for determining the risk of occurrence of an infection associated with care in a patient |
| FR3112209A1 (en) * | 2020-07-06 | 2022-01-07 | bioMérieux | Method for determining the risk of complications in a patient |
| FR3112207A1 (en) * | 2020-07-06 | 2022-01-07 | bioMérieux | Method for determining the risk of occurrence of an infection associated with care in a patient |
| CN111721941B (en) * | 2020-07-17 | 2023-08-25 | 南方科技大学 | Device for judging sepsis infection condition and application thereof |
Citations (2)
| Publication number | Priority date | Publication date | Assignee | Title |
|---|---|---|---|---|
| CN103649329A (en) * | 2010-11-26 | 2014-03-19 | ImmuneXpress有限公司 | Diagnostic and/or screening agents and uses therefor |
| WO2014201516A2 (en) * | 2013-06-20 | 2014-12-24 | Immunexpress Pty Ltd | Biomarker identification |
Family Cites Families (5)
| Publication number | Priority date | Publication date | Assignee | Title |
|---|---|---|---|---|
| DE102004009952B4 (en) * | 2004-03-01 | 2011-06-01 | Sirs-Lab Gmbh | Method of detecting sepsis |
| SG119251A1 (en) | 2004-08-04 | 2006-02-28 | Agency Science Tech & Res | Methods |
| BRPI0609302A2 (en) * | 2005-04-15 | 2011-10-11 | Becton Dickinson Co | methods for predicting the development of sepsis and for diagnosing sepsis in an individual to be tested, microarray, kit for predicting the development of sepsis in an individual to be tested, computer program product, computer, computer system for determining if an individual is likely to develop sepsis, digital signal embedded in a carrier wave, and, graphical user interface to determine if an individual is likely to develop sepsis |
| DE102005050933A1 (en) | 2005-10-21 | 2007-04-26 | Justus-Liebig-Universität Giessen | Invention relating to expression profiles for the prediction of septic states |
| US20150038351A1 (en) | 2012-09-11 | 2015-02-05 | The Regents Of The University Of California | Gene Signatures That Predispose Or Protect Individuals From Low-Dose Radiation Induced Breast Cancer Or Are Associated with Disease-Free Survival |
-
2016
- 2016-03-12 CA CA2977422A patent/CA2977422A1/en active Pending
- 2016-03-12 AU AU2016228508A patent/AU2016228508A1/en not_active Abandoned
- 2016-03-12 IL IL297699A patent/IL297699A/en unknown
- 2016-03-12 JP JP2017546801A patent/JP6995622B2/en active Active
- 2016-03-12 CN CN201680023601.1A patent/CN107532214B/en active Active
- 2016-03-12 WO PCT/US2016/022233 patent/WO2016145426A1/en active Application Filing
- 2016-03-12 EP EP16762690.2A patent/EP3268499B1/en active Active
- 2016-03-12 US US15/526,306 patent/US10533224B2/en active Active
-
2017
- 2017-08-30 IL IL254229A patent/IL254229B/en unknown
-
2019
- 2019-11-20 US US16/689,926 patent/US20200131577A1/en not_active Abandoned
-
2021
- 2021-09-30 IL IL286853A patent/IL286853B2/en unknown
- 2021-12-15 JP JP2021203291A patent/JP2022058359A/en active Pending
-
2022
- 2022-05-18 AU AU2022203348A patent/AU2022203348A1/en active Pending
-
2023
- 2023-03-08 US US18/180,833 patent/US20230227911A1/en active Pending
- 2023-06-30 JP JP2023107866A patent/JP2023138990A/en active Pending
Patent Citations (2)
| Publication number | Priority date | Publication date | Assignee | Title |
|---|---|---|---|---|
| CN103649329A (en) * | 2010-11-26 | 2014-03-19 | ImmuneXpress有限公司 | Diagnostic and/or screening agents and uses therefor |
| WO2014201516A2 (en) * | 2013-06-20 | 2014-12-24 | Immunexpress Pty Ltd | Biomarker identification |
Non-Patent Citations (1)
| Title |
|---|
| Identification of candidate genes associated with salivary adenoid cystic carcinomas using combined comparative genomic hybridization and oligonucleotide microarray analyses;Atsushi Kasamatsu,et al;《The International Journal of Biochemistry & Cell Biology》;20051231;1869–1880页 * |
Also Published As
| Publication number | Publication date |
|---|---|
| US20200131577A1 (en) | 2020-04-30 |
| IL286853B2 (en) | 2023-04-01 |
| EP3268499A4 (en) | 2018-09-05 |
| IL297699A (en) | 2022-12-01 |
| JP2023138990A (en) | 2023-10-03 |
| US10533224B2 (en) | 2020-01-14 |
| US20180291449A1 (en) | 2018-10-11 |
| CN107532214A (en) | 2018-01-02 |
| US20230227911A1 (en) | 2023-07-20 |
| JP2018514189A (en) | 2018-06-07 |
| AU2022203348A1 (en) | 2022-06-09 |
| AU2016228508A1 (en) | 2017-09-07 |
| JP6995622B2 (en) | 2022-01-14 |
| IL254229B (en) | 2021-10-31 |
| IL286853A (en) | 2021-10-31 |
| EP3268499A1 (en) | 2018-01-17 |
| CA2977422A1 (en) | 2016-09-15 |
| EP3268499B1 (en) | 2020-05-13 |
| WO2016145426A8 (en) | 2017-04-06 |
| WO2016145426A1 (en) | 2016-09-15 |
| IL254229A0 (en) | 2017-10-31 |
| JP2022058359A (en) | 2022-04-12 |
| IL286853B (en) | 2022-12-01 |
Similar Documents
| Publication | Publication Date | Title |
|---|---|---|
| CN107532214B (en) | Method for sepsis diagnosis | |
| US20210348233A1 (en) | Methods for Diagnosis of Tuberculosis | |
| EP2392678B1 (en) | Prognosis prediction for colorectal cancer | |
| US20110183856A1 (en) | Diagnosis and Prognosis of Infectious Disease Clinical Phenotypes and other Physiologic States Using Host Gene Expression Biomarkers In Blood | |
| US20220251647A1 (en) | Gene expression signatures useful to predict or diagnose sepsis and methods of using the same | |
| JP2019520042A (en) | Methods for diagnosing bacterial and viral infections | |
| US20160244834A1 (en) | Sepsis biomarkers and uses thereof | |
| GB2527164A (en) | Apparatus, kits and methods for the prediction of onset of sepsis | |
| CN109451744B (en) | Biomarkers for mortality prognosis in critically ill patients | |
| WO2015179777A2 (en) | Gene expression profiles associated with sub-clinical kidney transplant rejection | |
| AU2021221905A1 (en) | Gene expression profiles associated with sub-clinical kidney transplant rejection | |
| WO2020096796A1 (en) | Method for predicting severe dengue |
Legal Events
| Date | Code | Title | Description |
|---|---|---|---|
| PB01 | Publication | ||
| PB01 | Publication | ||
| SE01 | Entry into force of request for substantive examination | ||
| SE01 | Entry into force of request for substantive examination | ||
| GR01 | Patent grant | ||
| GR01 | Patent grant |