CN102855757A - Identification method based on queuing detector information bottleneck state - Google Patents
Identification method based on queuing detector information bottleneck state Download PDFInfo
- Publication number
- CN102855757A CN102855757A CN2012100543422A CN201210054342A CN102855757A CN 102855757 A CN102855757 A CN 102855757A CN 2012100543422 A CN2012100543422 A CN 2012100543422A CN 201210054342 A CN201210054342 A CN 201210054342A CN 102855757 A CN102855757 A CN 102855757A
- Authority
- CN
- China
- Prior art keywords
- value
- bottleneck
- occupation rate
- queuing
- time
- Prior art date
- Legal status (The legal status is an assumption and is not a legal conclusion. Google has not performed a legal analysis and makes no representation as to the accuracy of the status listed.)
- Granted
Links
Images


Abstract
The invention discloses an identification method based on a queuing detector information bottleneck state. The identification method provided by the invention comprises the following steps of: adopting the detection information of a queuing detector as a foundation; and carrying out real-time discrimination on a road section transportation state by taking the continuously occurring number of occupancies of rolling time exceeding a threshold as a discrimination index, and distinguishing the position of a detector as a bottleneck state when a queue length is greater than or equal to the distance of the queuing detector and the stop line. The identification method provided by the invention adopts the rolling time occupancy as the discrimination index of the bottleneck state, and improves the discrimination real-time property of the bottleneck state.
Description
Technical field
The present invention relates to bottleneck recognition technology field, particularly a kind of bottleneck recognition methods based on the queuing sensor information.
Background technology
Along with increasingly sharpening of Urban Traffic Jam Based, the traffic flow operation of a lot of nodes often is in hypersaturated state, even the queue length in part highway section is approaching or equal road section length, queuing occurs trace back phenomenon, form highway section " bottleneck ", have a strong impact on the operational efficiency of city road network traffic flow.Generally speaking, when highway section queue length during close to road section length, the residing traffic behavior in this highway section can be thought " bottleneck ", and this highway section can be referred to as bottleneck road.Bottleneck belongs to a kind of special hypersaturated state, is the extreme performance that worsens of road section traffic volume state.
When certain road section traffic volume state reaches bottleneck, need to carry out a kind of special control mode to the upstream and downstream crossing in this highway section, i.e. bottleneck control.So-called bottleneck control refers to the signal timing dial parameter by reasonable adjusting upstream and downstream crossing, and the input of minimizing upstream, highway section, increase downstream, highway section are supplied with, to alleviate a kind of control mode of road section traffic volume pressure.Real-Time Monitoring road section traffic volume state, determine that the triggering of bottleneck control is prerequisite and the basis of bottleneck control constantly, directly determining the effect of bottleneck control.In order to obtain the required essential information of bottleneck control, the urban traffic signal control system is all buried the queuing detecting device underground at inboard or the middle lane of upstream, highway section.
At present, very few for the achievement in research of bottleneck recognition methods, and algorithm still is in theoretical research stage mostly, disconnects seriously the engineering application difficult with actual conditions; In addition, existing achievement in research is identified the highway section bottleneck based on the transport information that queuing is traced back after occuring mostly, causes the bottleneck control program to implement evening, the control poor effect.Therefore further investigate the recognition methods of bottleneck, the bottleneck road traffic pressure is very necessary for alleviating.
Summary of the invention
The object of the present invention is to provide a kind of highway section bottleneck recognition methods based on the queuing sensor information.The detection information of detecting device of it is characterized in that lining up is the basis, take the continuous number that occurs of the rolling time occupation rate that exceeds threshold value as discriminant criterion, the highway section traffic behavior is carried out real time discriminating, think when queue length more than or equal to queuing detecting device and stop line apart from the time, the state at detector location place is bottleneck.
The basic thought of the method is when highway section queuing tail of the queue approaches the queuing detector location, follow-up arrival vehicle approaches the speed of blocking up by the queuing detector speed, and can determine to characterize the contingent time occupancy threshold value of blocking up in conjunction with effective length of wagon of different automobile types; Utilize the queuing detecting device to detect the traffic flow data that obtains under low state of saturation, statistics obtains the rolling time occupation rate under the unsaturated state; Take different positive integers as the slip interval, the minimum value of rolling time occupation rate forms new ordered series of numbers in getting between sliding area, and utilize the Johnson curve to convert the time occupancy ordered series of numbers to the normal state data, and then utilize the basic thought of quality control chart to determine that the rolling time occupation rate that exceeds threshold value of different numbers forms the upper control limit of sample; Upper control limit under comparative analysis time occupancy threshold value and the different interval, choose the minimum number that makes the control chart upper limit be less than or equal to the desired continuous rolling time occupation rate that exceeds threshold value of time occupancy threshold value, the standard that must occur as bottleneck; The bottleneck trigger condition be the rolling time occupation rate continuously greater than the number of threshold value more than or equal to this standard.
To achieve these goals, the highway section bottleneck recognition methods that proposes of the present invention comprises that the rolling time occupation rate is calculated, rolling time occupation rate threshold value is determined under the congestion status, the bottleneck trigger condition determines several steps.
Concrete step comprises:
The arithmetic for real-time traffic flow parameter in c1, this this track of section of queuing detector acquisition by need detecting the track section, and it is carried out pre-service obtain the rolling time occupation rate.
C2, according to the effective length of wagon of car and the compact car speed of the blocking up contingent rolling time occupation rate threshold value of determining to block up.

In the formula:
 ---characterize the contingent time occupancy threshold value of blocking up;
t J, c ---car crowds the holding time;
T---the time scale of rolling time occupation rate;
L Eff, c ---the effective length of wagon of car;
u J, c ---the car speed of blocking up.
---characterize the contingent time occupancy threshold value of blocking up;
t J, c ---car crowds the holding time;
T---the time scale of rolling time occupation rate;
L Eff, c ---the effective length of wagon of car;
u J, c ---the car speed of blocking up.
C3, determine the bottleneck activation threshold value, namely determine to differentiate and block up rolling time occupation rate in the time of to occur continuously greater than the number of its threshold value
N
C4, according to the corresponding threshold value index of bottleneck, judge whether the highway section reaches bottleneck.
C5, according to the differentiation result of c4, if judge and arrive bottleneck, then trigger the bottleneck control strategy, otherwise jump to step c1.
Further, the process of obtaining the arithmetic for real-time traffic flow parameter among the step c1 comprises:
C11, on the inboard or middle lane of the upstream, highway section that needs detect, lay the queuing detecting device in the position of distance upstream crossing 50m, and use the mode of electric wire, optical cable or radio communication to link to each other with traffic surveillance and control center.
C12, determined the time scale of rolling time occupation rate by the crowded holding time of large car
T


In the formula:
t J, b ---large car crowds the holding time;
L Eff, b ---the effective length of wagon of large car;
u J, b ---the large car speed of blocking up.
C13, calculating rolling time occupation rate.The rolling time occupation rate is with △
tBe the rolling interval, calculate a series of continuous time intervals
TInterior time occupancy.Its computing formula is as follows:
o i =
t i /
T
In the formula:
o i ---the
iThe individual time interval
TInterior rolling time occupation rate;
t i ---the
iThe individual time interval
TIn, vehicle takies queuing detecting device duration.
Further, among the step c3, used the thought of quality control chart, determined by enumerative technique
N
Concrete definite method is:
C31, selection
N * (
N * Since 1 value) minimum value in the individual continuous time occupation rate forms a new samples
X N*
X N*
In data can be represented by the formula:

The nonnormal sample data of the time occupancy that obtains among c32, the step c31 is converted to the normal state data.
C33, determine sample
X N*
Upper control limit UCL, centre line C L and the lower control limit LCL of quality control chart.
C34, definite according to the parameter of gained quality control chart
NValue.
Further, in step c31, owing to when the rolling time occupation rate is passed through the time of queuing detecting device less than car with common speed, must not get congestion near the detector location, namely work as
o i <t F, c / TThe time, this sample is rejected from overall, wherein
t F, c Car is with the holding time of free stream velocity by the queuing detecting device.
Further, step c32 has utilized the Johnson curve to convert nonnormal data to the normal state data.With the best Johnson curve distribution of Percentiles and Shapiro-Wilk or the definite fitting data of Epps-Pulley normal state check, and then the rule of normal state being changed according to the Johnson curve becomes the normal state data with nonnormal rolling time occupation rate data-switching.
Concrete steps are:
C321, determine the match conversion value
zIn order to seek best match conversion value, at best-fit
zThe value possible range
g{
z:
z=0.25,0.26 ..., the interior ascending one by one inspection of carrying out of 1.25}, step-length is 0.01, amounts to 101 numerical value.At first order
zValue is 0.25.
C322, calculate in the standardized normal distribution corresponding to-
Sz,-
z,
z,
SzDistribution probability
q 1,
q 2,
q 3,
q 4 s>1
,Suggestion
sValue is 3.
C323, estimation
X N*
Correspond respectively in the sample
q 1,
q 2,
q 3,
q 4Quantile
 For data ascending order in the sample arrange the
jIndividual observed reading, wherein
j=
Nq i+ 0.5 (
nBe sample size).When
jNon-when whole, can adopt method of interpolation to ask
For data ascending order in the sample arrange the
jIndividual observed reading, wherein
j=
Nq i+ 0.5 (
nBe sample size).When
jNon-when whole, can adopt method of interpolation to ask

In the formula: mod is the modulo operation symbol.
C324, calculating fractile ratio QR.
QR=
mn/
p 2
In the formula:

C325, determine Johnson converting system curve form according to QR, and utilize
z,
m,
n,
p,
x -z,
x zCarry out the parameter in the estimation curve.Wherein
x -zThe 1-of expression standardized normal distribution
zQuantile;
x zThe expression standardized normal distribution
zQuantile.Calculation method of parameters in the concrete curve is:
When QR<1, namely the Johnson curve is S
BDuring system, each parameter value is as follows.

In the formula:
 Be inverse hyperbolic function, wherein:
 ,
,

Work as QR〉1, namely the Johnson curve is S
UDuring system, each parameter value following formula.

Work as QR=1, namely the Johnson curve is S
LDuring system, each parameter value following formula.

In the above calculating formula
 ,
,
 ,
,
 ,
,
 Be all the Johnson parameter of curve.After calculating each parameter, utilize the Johnson converting system that data are carried out the normal state conversion.
C326, the data after the normal state conversion are carried out test of normality
Work as sample size
n, adopt the Shapiro-Wilk check at<50 o'clock.This moment is in the level of signifiance
αLower, if according to the statistic of sample calculation
W<
W α(
W αBe
W αFractile can obtain by tabling look-up), then refuse normality assumption.
Work as sample size
n50 o'clock, adopt the Epps-Pulley check, under insolation level α, according to sample statistic
TEp determines whether to refuse normality assumption.
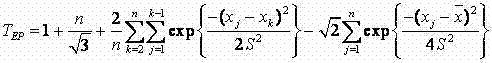
TEp normalized set formula is as follows.

Wherein:

If the statistic that is calculated by sample data
T EPMore than or equal to
αFractile under the level is then refused normality assumption.
If the refusal normality assumption then will
zValue increases by 0.01, and returns c322; If not refusing normality assumption then exports
zValue and corresponding
WOr
TThe ep value.
C327, output
WOr
TIn the ep value, find out
WMaximal value or
TThe minimum value of ep, corresponding
zValue is the optimal fitting conversion values, and the conversion normal state data that calculate by this value are required data-switching result
Further, in step c33, the rolling time occupation rate sample that obtains by c32
X N*
The normal state transformation result, can calculate sample
X N*
Upper control limit UCL, centre line C L and the lower control limit LCL of quality control chart.Circular is as follows.
For S
UAnd S
LCurve has:

For S
BCurve has:
In the formula:
x 0.50.5 quantile of expression standardized normal distribution;
x 0.001350.00135 quantile of expression standardized normal distribution;
x 0.998650.99865 quantile of expression standardized normal distribution.
Further, in step c34, the contrast sample
X N*
UCL and the rolling time occupation rate threshold value of quality control chart
 If UCL is less than or equal to
 , then this moment
N * Value is the bottleneck activation threshold value
NOtherwise will
N * Value increases by 1, and returns c31 and recomputate.
, then this moment
N * Value is the bottleneck activation threshold value
NOtherwise will
N * Value increases by 1, and returns c31 and recomputate.
Further, in step c4, if rolling time occupation rate overtime occupation rate threshold value
 Continuous number greater than
N, then the highway section is in bottleneck, otherwise judges that the highway section is not in bottleneck.
Continuous number greater than
N, then the highway section is in bottleneck, otherwise judges that the highway section is not in bottleneck.
Beneficial effect of the present invention:
1, with the discriminant criterion of rolling time occupation rate as bottleneck, improved the real-time of bottleneck identification;
2, take the queuing detection information of bottleneck road as the basis, can fundamentally change take the hysteresis quality of upstream monitoring information as the trigger condition on basis, provide prerequisite for effectively avoiding queuing to trace back;
3, the analysis of the main based on data of the method obtains the bottleneck activation threshold value, can react comparatively accurately actual traffic.
Description of drawings
Fig. 1 is overview flow chart of the present invention;
Fig. 2 is queuing Loop detector layout schematic diagram;
Fig. 3 is the rolling time occupation rate
t i The statistical method schematic diagram;
Fig. 4 is that activation threshold value is determined process flow diagram.
Embodiment
The present invention will be described in detail below in conjunction with accompanying drawing.
Bottleneck recognition methods of the present invention be line up the detection information of detecting device be the basis.The method can utilize the telecommunication flow information of real-time detection that the highway section traffic behavior is analyzed, and differentiates in time, accurately the highway section bottleneck, for alleviating road section traffic volume pressure, avoiding queuing to trace back phenomenon providing the basis.
With reference to figure 1, illustrate the present invention to the overall procedure of bottleneck recognition methods.This bottleneck method of discrimination is comprised of hardware and software two parts, the hardware devices such as its existing data acquisition equipment, teleseme and server also have and finish the computer program part that the rolling occupation rate is calculated, the bottleneck activation threshold value is determined and judged whether to reach bottleneck.This bottleneck recognition methods is on the basis of queuing sensor information, realize by self-editing computer program, complete says, its detecting device judgement of determining, whether triggering bottleneck to the determining of the collection of traffic flow parameter, the calculating of rolling time occupation rate, the contingent rolling time occupation rate threshold value of blocking up, bottleneck activation threshold value that comprises the steps: to line up.The below will be explained in detail the bottleneck recognition methods based on the queuing sensor information according to time sequencing:
With reference to figure 2, the queuing detecting device is installed in the highway section.Concrete realization queuing detecting device gathers the transport information parameter and needs to install following hardware device:
Detecting on the highway section, bury the queuing detecting device that design specification is 2 * 2m on the middle lane (or inside lane) apart from 50m place, crossing, upstream underground, be used for the parameter information of acquisition time occupation rate.

After detecting device gathers the highway section telecommunication flow information by queuing, utilize the information that gathers to calculate calculating the rolling time occupation rate, step is as follows:
Determined the time scale of rolling time occupation rate by the crowded holding time of large car
T


In the formula:
t J, b ---large car crowds the holding time;
L Eff, b ---the effective length of wagon of large car;
u J, b ---the large car speed of blocking up;
T---the time scale of rolling time occupation rate.

o i =
t i /
T
In the formula:
o i ---the
iThe individual time interval
TInterior rolling time occupation rate;
t i ---the
iThe individual time interval
TIn, vehicle takies queuing detecting device duration.Fig. 3 be with
T=5 △
tBe the example explanation
t i Statistical method.
Step 3, calculate the contingent rolling time occupation rate threshold value of blocking up
Determine to characterize the contingent rolling time occupation rate threshold value of blocking up according to the effective length of wagon of car and the compact car speed of blocking up.


In the formula:
 ---characterize the contingent time occupancy threshold value of blocking up;
t J, c ---car crowds the holding time;
L Eff, c ---the effective length of wagon of car;
u J, c ---the car speed of blocking up.
---characterize the contingent time occupancy threshold value of blocking up;
t J, c ---car crowds the holding time;
L Eff, c ---the effective length of wagon of car;
u J, c ---the car speed of blocking up.
Determining of step 4, bottleneck activation threshold value
Single rolling time occupation rate can not represent near the traffic behavior the detecting device, in order to determine more accurately whether the highway section is in bottleneck, needs to determine to represent near surpassing of the traffic behavior of detecting device
 The number that occurs continuously of rolling time occupation rate
N
The number that occurs continuously of rolling time occupation rate
N
Because bottleneck road is not when supersaturation occurs, the get congestion probability of phenomenon of queuing detecting device place is very low, and the UCL that can represent the rolling time occupation rate control chart of queuing detector location place traffic behavior should be not more than
 , therefore determining
NThe time, from
N*=1 begin to enumerate, if do not satisfy condition then
N* value increases by 1 and continues computing, until
N* arrive certain numerical value, the UCL of the quality control chart that is obtained by this numerical value is less than or equal to
, therefore determining
NThe time, from
N*=1 begin to enumerate, if do not satisfy condition then
N* value increases by 1 and continues computing, until
N* arrive certain numerical value, the UCL of the quality control chart that is obtained by this numerical value is less than or equal to
 , then this moment
N * Value is required
NValue.
, then this moment
N * Value is required
NValue.
Moreover because the non-normality of rolling time occupation rate sample need to utilize the Johnson curve that data are carried out normalize, and its first step is to seek best match conversion values.
Here with reference to figure 4, the concrete steps of definite bottleneck activation threshold value have been provided.


Owing to when the rolling time occupation rate is passed through the time occupancy of queuing detecting device less than car with free stream velocity, must not get congestion near the detector location, namely working as
o i <t F, c / TThe time, this sample is rejected from overall, wherein
t F, c Car is with the holding time of free stream velocity by the queuing detecting device.。


In the formula: mod is the modulo operation symbol.
Calculate fractile ratio QR.
QR=
mn/
p 2
In the formula:

Determine the matched curve form according to QR, and estimate the response curve correlation parameter and carry out the normal state conversion.Several translation types of Johnson curve and various types of restriction on the parameters and variable-value scope are as shown in table 1.
Table 1 Johnson converting system
Parameter in the curve can be utilized
z,
m,
n,
p,
x -z,
x zEstimate, wherein
x -zThe 1-of expression standardized normal distribution
zQuantile;
x zThe expression standardized normal distribution
zQuantile.
When QR<1, namely the Johnson curve is S
BDuring system, each parameter value is as follows.
In the formula:
Be inverse hyperbolic function, wherein:
 ,
,
Work as QR〉1, namely the Johnson curve is S
UDuring system, each parameter value following formula.

Work as QR=1, namely the Johnson curve is S
LDuring system, each parameter value following formula.

After calculating parameters, can be according to table 1 pair
X N*
Carry out the normal state conversion.

Work as sample size
n, adopt the Shapiro-Wilk check at<50 o'clock.This moment is in the level of signifiance
αLower, if according to the statistic of sample calculation
W<
W α(
W αBe
W αFractile can obtain by tabling look-up), then refuse normality assumption.
Work as sample size
n50 o'clock, adopt the Epps-Pulley check, under insolation level α, according to sample statistic
TEp determines whether to refuse normality assumption.
TEp normalized set formula is as follows.
Wherein:

If the statistic that is calculated by sample data
T EPMore than or equal to
αFractile under the level is then refused normality assumption.
If the refusal normality assumption, then
zValue increases by 0.01, and returns
If accepting normality assumption then exports
zValue and corresponding
WOr
TThe ep value.


Then according to final normalize result
 The Johnson parameter of curve that calculates can calculate sample
X N*
Upper control limit UCL, centre line C L and the lower control limit LCL of quality control chart.Circular is as follows.
The Johnson parameter of curve that calculates can calculate sample
X N*
Upper control limit UCL, centre line C L and the lower control limit LCL of quality control chart.Circular is as follows.
For S
UAnd S
LCurve has:

For S
BCurve has:
The contrast sample
X N*
Quality control chart upper bound UCL value and rolling time occupation rate threshold value
 If UCL is less than or equal to
 ,
N * Value is the bottleneck activation threshold value
NOtherwise will
N * Value increases by 1, and returns
,
N * Value is the bottleneck activation threshold value
NOtherwise will
N * Value increases by 1, and returns
 Recomputate.
Step 5, judgement rolling time occupation rate are greater than the time occupancy threshold value
 Continuous number whether greater than
NIf, judge that then the highway section is in bottleneck, should implement the bottleneck control strategy, otherwise judge that the highway section is not in bottleneck.
Continuous number whether greater than
NIf, judge that then the highway section is in bottleneck, should implement the bottleneck control strategy, otherwise judge that the highway section is not in bottleneck.
Claims (7)
1. based on the recognition methods of queuing sensor information bottleneck, it is characterized in that the method may further comprise the steps:
The arithmetic for real-time traffic flow parameter in c1, this this track of section of queuing detector acquisition by need detecting the track section, and it is carried out pre-service obtain the rolling time occupation rate;
C2, according to the effective length of wagon of car and the compact car speed of the blocking up contingent rolling time occupation rate threshold value of determining to block up;


In the formula:
 Represent to block up contingent rolling time occupation rate threshold value;
t J, c The crowded holding time of expression car;
L Eff, c The effective length of wagon of expression car;
u J, c The expression car speed of blocking up;
TThe time scale of expression rolling time occupation rate;
Represent to block up contingent rolling time occupation rate threshold value;
t J, c The crowded holding time of expression car;
L Eff, c The effective length of wagon of expression car;
u J, c The expression car speed of blocking up;
TThe time scale of expression rolling time occupation rate;
C3, determine the bottleneck activation threshold value, namely determine to differentiate and block up rolling time occupation rate in the time of to occur continuously greater than the number of its threshold value
N
C4, according to the corresponding threshold value index of bottleneck, judge whether the highway section reaches bottleneck;
C5, according to the differentiation result of c4, if judge and arrive bottleneck, then trigger the bottleneck control strategy, otherwise jump to step c1.
2. according to claim 1 based on the recognition methods of queuing sensor information bottleneck, it is characterized in that: the process of obtaining the arithmetic for real-time traffic flow parameter among the step c1 comprises:
C11, on the inboard or middle lane of the upstream, highway section that needs detect, lay the queuing detecting device in the position of distance upstream crossing 50m, and use the mode of electric wire, optical cable or radio communication to link to each other with traffic surveillance and control center;
C12, definite by the crowded holding time of large car
T

In the formula:
t J, b The crowded holding time of expression large car;
L Eff, b The effective length of wagon of expression large car;
u J, b The expression large car speed of blocking up;
C13, calculating rolling time occupation rate; The rolling time occupation rate is with △
tBe the rolling interval, calculate a series of continuous time intervals
TInterior time occupancy; Its computing formula is as follows:
o i =
t i /
T
In the formula:
o i Expression the
iThe individual time interval
TInterior rolling time occupation rate;
t i Represent the th
iThe individual time interval
TIn, vehicle takies queuing detecting device duration.
3. according to claim 1 based on the recognition methods of queuing sensor information bottleneck, it is characterized in that: among the step c3, used the thought of quality control chart, determined by enumerative technique
N
Concrete definite method is:
C31, selection
N * Minimum value in the individual continuous time occupation rate forms a new samples
X N*
X N*
In data can be represented by the formula:

C32, the nonnormal sample data of the time occupancy that obtains among the step c31 is converted to the normal state data;
C33, determine sample
X N*
Upper control limit UCL, centre line C L and the lower control limit LCL of quality control chart;
C34, definite according to the parameter of gained quality control chart
NValue.
4. according to claim 3 based on the recognition methods of queuing sensor information bottleneck, it is characterized in that: in step c31, owing to when the rolling time occupation rate is passed through the time of queuing detecting device less than car with common speed, must not get congestion near the detector location, namely working as
o i <t F, c / TThe time, this sample is rejected from overall, wherein
t F, c Car is with the holding time of free stream velocity by the queuing detecting device.
5. according to claim 3 based on the recognition methods of queuing sensor information bottleneck, it is characterized in that:
Step c32 has utilized the Johnson curve to convert nonnormal data to the normal state data; With the best Johnson curve distribution of Percentiles and Shapiro-Wilk or the definite fitting data of Epps-Pulley normal state check, and then the rule of normal state being changed according to the Johnson curve becomes the normal state data with nonnormal rolling time occupation rate data-switching;
Concrete steps are:
C321, determine the match conversion value
zIn order to seek best match conversion value, at best-fit
zThe value possible range
g{
z:
z=0.25,0.26 ..., the interior ascending one by one inspection of carrying out of 1.25}, step-length is 0.01, amounts to 101 numerical value; At first order
zValue is 0.25;
C322, calculate in the standardized normal distribution corresponding to-
Sz,-
z,
z,
SzDistribution probability
q 1,
q 2,
q 3,
q 4, wherein
S>1
C323, estimation
X N*
Correspond respectively in the sample
q 1,
q 2,
q 3,
q 4Quantile

 For data ascending order in the sample arrange the
jIndividual observed reading, wherein
j=
Nq i+ 0.5,
nBe sample size; When
jNon-when whole, can adopt method of interpolation to ask
For data ascending order in the sample arrange the
jIndividual observed reading, wherein
j=
Nq i+ 0.5,
nBe sample size; When
jNon-when whole, can adopt method of interpolation to ask


In the formula: mod represents the modulo operation symbol;
C324, calculating fractile ratio QR;
QR=
mn/
p 2
In the formula:

C325, determine Johnson converting system curve form according to QR, and utilize
z,
m,
n,
p,
x -z,
x zCarry out the parameter in the estimation curve; Wherein
x -zThe 1-of expression standardized normal distribution
zQuantile;
x zThe expression standardized normal distribution
zQuantile; Calculation method of parameters in the concrete curve is:
When QR<1, namely the Johnson curve is S
BDuring system, each parameter value is as follows;

In the formula:
 Be inverse hyperbolic function, wherein:
 ,
,

Work as QR〉1, namely the Johnson curve is S
UDuring system, each parameter value following formula;

Work as QR=1, namely the Johnson curve is S
LDuring system, each parameter value following formula;

In the above calculating formula
 ,
,
,
,
,
,
 Be all the Johnson parameter of curve; After calculating each parameter, utilize the Johnson converting system that data are carried out the normal state conversion;
C326, the data after the normal state conversion are carried out test of normality
Work as sample size
n, adopt the Shapiro-Wilk check at<50 o'clock; This moment is in the level of signifiance
αLower, if according to the statistic of sample calculation
W<
W α, then refuse normality assumption, wherein
W αBe
W αFractile can obtain by tabling look-up;
Work as sample size
n50 o'clock, adopt the Epps-Pulley check, under insolation level α, according to sample statistic
TEp determines whether to refuse normality assumption;
TEp normalized set formula is as follows;

Wherein:

If the statistic that is calculated by sample data
T EPMore than or equal to
αFractile under the level is then refused normality assumption;
If the refusal normality assumption then will
zValue increases by 0.01, and returns c322; If not refusing normality assumption then exports
zValue and corresponding
WOr
TThe ep value;
C327, output
WOr
TIn the ep value, find out
WMaximal value or
TThe minimum value of ep, corresponding
zValue is the optimal fitting conversion values, and the conversion normal state data that calculate by this value are required data-switching result

6. according to claim 3 based on the recognition methods of queuing sensor information bottleneck, it is characterized in that:
In step c33, the rolling time occupation rate sample that obtains by c32
X N*
The normal state transformation result, can calculate sample
X N*
Upper control limit UCL, centre line C L and the lower control limit LCL of quality control chart; Circular is as follows;
For S
UAnd S
LCurve has:

For S
BCurve has:
In the formula:
x 0.50.5 quantile of expression standardized normal distribution;
x 0.001350.00135 quantile of expression standardized normal distribution;
x 0.998650.99865 quantile of expression standardized normal distribution.
7. according to claim 3 based on the recognition methods of queuing sensor information bottleneck, it is characterized in that:
In step c34, the contrast sample
X N*
UCL and the rolling time occupation rate threshold value of quality control chart
If UCL is less than or equal to
 , then this moment
N * Value is the bottleneck activation threshold value
NOtherwise will
N * Value increases by 1, and returns c31 and recomputate.
, then this moment
N * Value is the bottleneck activation threshold value
NOtherwise will
N * Value increases by 1, and returns c31 and recomputate.
8. according to claim 1 based on the recognition methods of queuing sensor information bottleneck, it is characterized in that:
In step c4, if rolling time occupation rate overtime occupation rate threshold value
 Continuous number greater than
N, then the highway section is in bottleneck, otherwise judges that the highway section is not in bottleneck.
Continuous number greater than
N, then the highway section is in bottleneck, otherwise judges that the highway section is not in bottleneck.
Priority Applications (1)
| Application Number | Priority Date | Filing Date | Title |
|---|---|---|---|
| CN201210054342.2A CN102855757B (en) | 2012-03-05 | 2012-03-05 | Identification method based on queuing detector information bottleneck state |
Applications Claiming Priority (1)
| Application Number | Priority Date | Filing Date | Title |
|---|---|---|---|
| CN201210054342.2A CN102855757B (en) | 2012-03-05 | 2012-03-05 | Identification method based on queuing detector information bottleneck state |
Publications (2)
| Publication Number | Publication Date |
|---|---|
| CN102855757A true CN102855757A (en) | 2013-01-02 |
| CN102855757B CN102855757B (en) | 2014-05-21 |
Family
ID=47402305
Family Applications (1)
| Application Number | Title | Priority Date | Filing Date |
|---|---|---|---|
| CN201210054342.2A Expired - Fee Related CN102855757B (en) | 2012-03-05 | 2012-03-05 | Identification method based on queuing detector information bottleneck state |
Country Status (1)
| Country | Link |
|---|---|
| CN (1) | CN102855757B (en) |
Cited By (11)
| Publication number | Priority date | Publication date | Assignee | Title |
|---|---|---|---|---|
| CN105654720A (en) * | 2016-01-21 | 2016-06-08 | 浙江大学 | Detector laying method based on urban road jam identification |
| CN105654741A (en) * | 2016-01-26 | 2016-06-08 | 浙江大学 | Single-point bottleneck oriented upstream region signal control parameter optimization method |
| CN105825669A (en) * | 2015-08-15 | 2016-08-03 | 李萌 | System and method for identifying urban expressway traffic bottlenecks |
| CN105825683A (en) * | 2015-08-16 | 2016-08-03 | 李萌 | Road traffic condition evaluation method |
| CN106846809A (en) * | 2017-03-12 | 2017-06-13 | 浙江大学 | A kind of farthest point calculating method of queuing based on vehicle parking number of times |
| CN106920389A (en) * | 2015-12-28 | 2017-07-04 | 北京亿阳信通科技有限公司 | A kind of traffic control method and system based on user's telecommunications behavior |
| CN109935076A (en) * | 2018-05-21 | 2019-06-25 | 吉林化工学院 | A kind of city expressway often sends out sexual intercourse bottleneck link recognition methods |
| CN111811640A (en) * | 2020-03-19 | 2020-10-23 | 同济大学 | Spectrum induction method based on Johnson rule |
| WO2020258918A1 (en) * | 2019-06-24 | 2020-12-30 | 中山大学 | Power transform analysis method for non-normally distributed water quality observation data |
| CN112902946A (en) * | 2021-01-14 | 2021-06-04 | 南京英锐创电子科技有限公司 | Tire condition detection method, tire condition detection device, computer device, and storage medium |
| CN114155724A (en) * | 2021-12-23 | 2022-03-08 | 连云港杰瑞电子有限公司 | Intersection traffic signal control method under Internet of vehicles environment |
Citations (6)
| Publication number | Priority date | Publication date | Assignee | Title |
|---|---|---|---|---|
| JP2001331827A (en) * | 2000-05-18 | 2001-11-30 | Toshiba Corp | System and method for vehicle detection and on-vehicle device |
| CN101154317A (en) * | 2006-09-27 | 2008-04-02 | 株式会社查纳位资讯情报 | Traffic state predicting apparatus |
| CN101295436A (en) * | 2007-04-26 | 2008-10-29 | 爱信艾达株式会社 | Traffic situation determination system |
| CN101303801A (en) * | 2008-06-30 | 2008-11-12 | 北京交通大学 | Method for real time discriminating traffic stream state of city quick road |
| WO2009075443A1 (en) * | 2007-12-11 | 2009-06-18 | Thinkware Systems Corporation | Method and apparatus for estimating traffic flow |
| CN101783074A (en) * | 2010-02-10 | 2010-07-21 | 北方工业大学 | Method and system for real-time distinguishing traffic flow state of urban road |
-
2012
- 2012-03-05 CN CN201210054342.2A patent/CN102855757B/en not_active Expired - Fee Related
Patent Citations (6)
| Publication number | Priority date | Publication date | Assignee | Title |
|---|---|---|---|---|
| JP2001331827A (en) * | 2000-05-18 | 2001-11-30 | Toshiba Corp | System and method for vehicle detection and on-vehicle device |
| CN101154317A (en) * | 2006-09-27 | 2008-04-02 | 株式会社查纳位资讯情报 | Traffic state predicting apparatus |
| CN101295436A (en) * | 2007-04-26 | 2008-10-29 | 爱信艾达株式会社 | Traffic situation determination system |
| WO2009075443A1 (en) * | 2007-12-11 | 2009-06-18 | Thinkware Systems Corporation | Method and apparatus for estimating traffic flow |
| CN101303801A (en) * | 2008-06-30 | 2008-11-12 | 北京交通大学 | Method for real time discriminating traffic stream state of city quick road |
| CN101783074A (en) * | 2010-02-10 | 2010-07-21 | 北方工业大学 | Method and system for real-time distinguishing traffic flow state of urban road |
Non-Patent Citations (2)
| Title |
|---|
| 段青等: "城市道路交通路面车流量拥堵程度算法探讨", 《2007第三届中国智能交通年会论文集》, 31 December 2007 (2007-12-31), pages 640 - 648 * |
| 赵莹莹: "瓶颈交叉口信号控制方法研究", 《吉林大学硕士论文》, 7 August 2011 (2011-08-07), pages 25 - 30 * |
Cited By (18)
| Publication number | Priority date | Publication date | Assignee | Title |
|---|---|---|---|---|
| CN105825669A (en) * | 2015-08-15 | 2016-08-03 | 李萌 | System and method for identifying urban expressway traffic bottlenecks |
| CN105825669B (en) * | 2015-08-15 | 2018-06-08 | 北京数行健科技有限公司 | A kind of system and method for identifying urban expressway traffic bottleneck |
| CN105825683A (en) * | 2015-08-16 | 2016-08-03 | 李萌 | Road traffic condition evaluation method |
| CN105825683B (en) * | 2015-08-16 | 2018-11-13 | 北京数行健科技有限公司 | A kind of road traffic condition evaluation method |
| CN106920389B (en) * | 2015-12-28 | 2020-03-27 | 北京亿阳信通科技有限公司 | Traffic condition control method and system based on user telecommunication behaviors |
| CN106920389A (en) * | 2015-12-28 | 2017-07-04 | 北京亿阳信通科技有限公司 | A kind of traffic control method and system based on user's telecommunications behavior |
| CN105654720A (en) * | 2016-01-21 | 2016-06-08 | 浙江大学 | Detector laying method based on urban road jam identification |
| CN105654720B (en) * | 2016-01-21 | 2018-06-29 | 浙江大学 | Loop detector layout method based on urban road congestion identification |
| CN105654741B (en) * | 2016-01-26 | 2018-07-17 | 浙江大学 | A kind of upstream region signal Optimization about control parameter method towards "bottleneck" |
| CN105654741A (en) * | 2016-01-26 | 2016-06-08 | 浙江大学 | Single-point bottleneck oriented upstream region signal control parameter optimization method |
| CN106846809A (en) * | 2017-03-12 | 2017-06-13 | 浙江大学 | A kind of farthest point calculating method of queuing based on vehicle parking number of times |
| CN106846809B (en) * | 2017-03-12 | 2019-06-14 | 浙江大学 | A kind of farthest point calculating method of queuing based on vehicle parking number |
| CN109935076A (en) * | 2018-05-21 | 2019-06-25 | 吉林化工学院 | A kind of city expressway often sends out sexual intercourse bottleneck link recognition methods |
| WO2020258918A1 (en) * | 2019-06-24 | 2020-12-30 | 中山大学 | Power transform analysis method for non-normally distributed water quality observation data |
| CN111811640A (en) * | 2020-03-19 | 2020-10-23 | 同济大学 | Spectrum induction method based on Johnson rule |
| CN112902946A (en) * | 2021-01-14 | 2021-06-04 | 南京英锐创电子科技有限公司 | Tire condition detection method, tire condition detection device, computer device, and storage medium |
| CN112902946B (en) * | 2021-01-14 | 2024-01-30 | 南京英锐创电子科技有限公司 | Tire condition detection method, apparatus, computer device, and storage medium |
| CN114155724A (en) * | 2021-12-23 | 2022-03-08 | 连云港杰瑞电子有限公司 | Intersection traffic signal control method under Internet of vehicles environment |
Also Published As
| Publication number | Publication date |
|---|---|
| CN102855757B (en) | 2014-05-21 |
Similar Documents
| Publication | Publication Date | Title |
|---|---|---|
| CN102855757B (en) | Identification method based on queuing detector information bottleneck state | |
| CN103021176B (en) | Discriminating method based on section detector for urban traffic state | |
| CN102968901B (en) | Method for acquiring regional congestion information and regional congestion analyzing device | |
| CN102622798B (en) | Passenger flow statistical analysis system | |
| CN101739824B (en) | Data fusion technology-based traffic condition estimation method | |
| CN104157156B (en) | A kind of highway Dangerous Area speed of a motor vehicle dynamic management method for early warning | |
| CN103236166B (en) | Method for recognizing vehicle violation behaviors with satellite positioning technology | |
| CN102592451B (en) | Method for detecting road traffic incident based on double-section annular coil detector | |
| CN106920403B (en) | A kind of single-point self-adaptation control method based on array radar | |
| Kaewkamnerd et al. | Vehicle classification based on magnetic sensor signal | |
| CN104183134B (en) | The highway short-term traffic flow forecast method of vehicle is divided based on intelligence | |
| CN104464307B (en) | A kind of tunnel traffic based on video blocks up event automatic detection method | |
| CN103280113A (en) | Self-adaptive intersection signal control method | |
| CN104751642A (en) | Real-time estimating method for high-grade road traffic flow running risks | |
| CN103646542A (en) | Forecasting method and device for traffic impact ranges | |
| CN104851287B (en) | Method for urban road link travel time detection based on video detector | |
| CN104575035A (en) | Intersection self-adaptation control method based on car networking environment | |
| CN105788289A (en) | Method and system for realizing traffic condition assessment and analysis based on computer software system | |
| CN111145544B (en) | Travel time and route prediction method based on congestion spreading dissipation model | |
| CN103345842A (en) | Road vehicle classification system and method | |
| CN104794895A (en) | Multisource traffic information fusion method for expressways | |
| CN105654720A (en) | Detector laying method based on urban road jam identification | |
| JPH10124791A (en) | Method for predicting trip time and device therefor | |
| CN102819956B (en) | Detecting method for road traffic accident on basis of single-section annular coil detector | |
| KR20160054921A (en) | Interval detector using received signal strength indicator (rssi), and travel time estimating system and method having the same |
Legal Events
| Date | Code | Title | Description |
|---|---|---|---|
| C06 | Publication | ||
| PB01 | Publication | ||
| C10 | Entry into substantive examination | ||
| SE01 | Entry into force of request for substantive examination | ||
| C14 | Grant of patent or utility model | ||
| GR01 | Patent grant | ||
| CF01 | Termination of patent right due to non-payment of annual fee |
Granted publication date: 20140521 Termination date: 20150305 |
|
| EXPY | Termination of patent right or utility model |