WO2018182015A1 - Medical information processing device and medical information processing method - Google Patents
Medical information processing device and medical information processing method Download PDFInfo
- Publication number
- WO2018182015A1 WO2018182015A1 PCT/JP2018/013976 JP2018013976W WO2018182015A1 WO 2018182015 A1 WO2018182015 A1 WO 2018182015A1 JP 2018013976 W JP2018013976 W JP 2018013976W WO 2018182015 A1 WO2018182015 A1 WO 2018182015A1
- Authority
- WO
- WIPO (PCT)
- Prior art keywords
- conversion
- data
- medical
- display
- medical data
- Prior art date
Links
Images


Classifications
-
- G—PHYSICS
- G16—INFORMATION AND COMMUNICATION TECHNOLOGY [ICT] SPECIALLY ADAPTED FOR SPECIFIC APPLICATION FIELDS
- G16H—HEALTHCARE INFORMATICS, i.e. INFORMATION AND COMMUNICATION TECHNOLOGY [ICT] SPECIALLY ADAPTED FOR THE HANDLING OR PROCESSING OF MEDICAL OR HEALTHCARE DATA
- G16H50/00—ICT specially adapted for medical diagnosis, medical simulation or medical data mining; ICT specially adapted for detecting, monitoring or modelling epidemics or pandemics
- G16H50/20—ICT specially adapted for medical diagnosis, medical simulation or medical data mining; ICT specially adapted for detecting, monitoring or modelling epidemics or pandemics for computer-aided diagnosis, e.g. based on medical expert systems
-
- G—PHYSICS
- G06—COMPUTING; CALCULATING OR COUNTING
- G06F—ELECTRIC DIGITAL DATA PROCESSING
- G06F3/00—Input arrangements for transferring data to be processed into a form capable of being handled by the computer; Output arrangements for transferring data from processing unit to output unit, e.g. interface arrangements
- G06F3/14—Digital output to display device ; Cooperation and interconnection of the display device with other functional units
-
- G—PHYSICS
- G16—INFORMATION AND COMMUNICATION TECHNOLOGY [ICT] SPECIALLY ADAPTED FOR SPECIFIC APPLICATION FIELDS
- G16H—HEALTHCARE INFORMATICS, i.e. INFORMATION AND COMMUNICATION TECHNOLOGY [ICT] SPECIALLY ADAPTED FOR THE HANDLING OR PROCESSING OF MEDICAL OR HEALTHCARE DATA
- G16H10/00—ICT specially adapted for the handling or processing of patient-related medical or healthcare data
- G16H10/60—ICT specially adapted for the handling or processing of patient-related medical or healthcare data for patient-specific data, e.g. for electronic patient records
-
- G—PHYSICS
- G16—INFORMATION AND COMMUNICATION TECHNOLOGY [ICT] SPECIALLY ADAPTED FOR SPECIFIC APPLICATION FIELDS
- G16H—HEALTHCARE INFORMATICS, i.e. INFORMATION AND COMMUNICATION TECHNOLOGY [ICT] SPECIALLY ADAPTED FOR THE HANDLING OR PROCESSING OF MEDICAL OR HEALTHCARE DATA
- G16H15/00—ICT specially adapted for medical reports, e.g. generation or transmission thereof
-
- G—PHYSICS
- G16—INFORMATION AND COMMUNICATION TECHNOLOGY [ICT] SPECIALLY ADAPTED FOR SPECIFIC APPLICATION FIELDS
- G16H—HEALTHCARE INFORMATICS, i.e. INFORMATION AND COMMUNICATION TECHNOLOGY [ICT] SPECIALLY ADAPTED FOR THE HANDLING OR PROCESSING OF MEDICAL OR HEALTHCARE DATA
- G16H30/00—ICT specially adapted for the handling or processing of medical images
- G16H30/20—ICT specially adapted for the handling or processing of medical images for handling medical images, e.g. DICOM, HL7 or PACS
-
- G—PHYSICS
- G16—INFORMATION AND COMMUNICATION TECHNOLOGY [ICT] SPECIALLY ADAPTED FOR SPECIFIC APPLICATION FIELDS
- G16H—HEALTHCARE INFORMATICS, i.e. INFORMATION AND COMMUNICATION TECHNOLOGY [ICT] SPECIALLY ADAPTED FOR THE HANDLING OR PROCESSING OF MEDICAL OR HEALTHCARE DATA
- G16H40/00—ICT specially adapted for the management or administration of healthcare resources or facilities; ICT specially adapted for the management or operation of medical equipment or devices
- G16H40/60—ICT specially adapted for the management or administration of healthcare resources or facilities; ICT specially adapted for the management or operation of medical equipment or devices for the operation of medical equipment or devices
- G16H40/63—ICT specially adapted for the management or administration of healthcare resources or facilities; ICT specially adapted for the management or operation of medical equipment or devices for the operation of medical equipment or devices for local operation
-
- G—PHYSICS
- G09—EDUCATION; CRYPTOGRAPHY; DISPLAY; ADVERTISING; SEALS
- G09G—ARRANGEMENTS OR CIRCUITS FOR CONTROL OF INDICATING DEVICES USING STATIC MEANS TO PRESENT VARIABLE INFORMATION
- G09G2340/00—Aspects of display data processing
- G09G2340/14—Solving problems related to the presentation of information to be displayed
-
- G—PHYSICS
- G09—EDUCATION; CRYPTOGRAPHY; DISPLAY; ADVERTISING; SEALS
- G09G—ARRANGEMENTS OR CIRCUITS FOR CONTROL OF INDICATING DEVICES USING STATIC MEANS TO PRESENT VARIABLE INFORMATION
- G09G2380/00—Specific applications
- G09G2380/08—Biomedical applications
Definitions
- Embodiments described herein relate generally to a medical information processing apparatus and a medical information processing method.
- the problem to be solved by the present invention is to provide a medical information processing apparatus and a medical information processing method capable of presenting medical data in an appropriate display format according to a clinical examination purpose.
- the medical information processing apparatus includes a display control unit and a conversion unit.
- the display control unit displays the medical data based on a medical data space having a dimension associated with a data display format defined for each medical data.
- the said conversion part switches the display of the said medical data displayed by the said display control part by performing space conversion on the said medical data space on the basis of the designated conversion reference point.
- FIG. 1 is a diagram illustrating a configuration example of the medical information processing apparatus according to the first embodiment.
- FIG. 2 is a diagram illustrating an outline of display of medical data performed by the medical information processing apparatus according to the first embodiment.
- FIG. 3 is a diagram illustrating an example of a medication table according to the first embodiment.
- FIG. 4 is a diagram illustrating an example of a medication summary table according to the first embodiment.
- FIG. 5 is a diagram illustrating an example of an image table according to the first embodiment.
- FIG. 6 is a diagram illustrating an example of an image measurement value table according to the first embodiment.
- FIG. 7 is a diagram illustrating an example of an interpretation report table according to the first embodiment.
- FIG. 8 is a diagram illustrating an example of an electrocardiogram table according to the first embodiment.
- FIG. 1 is a diagram illustrating a configuration example of the medical information processing apparatus according to the first embodiment.
- FIG. 2 is a diagram illustrating an outline of display of medical data performed by the medical information processing apparatus
- FIG. 9 is a diagram illustrating an example of an electrocardiogram measurement value table according to the first embodiment.
- FIG. 10 is a diagram illustrating an example of an electrocardiogram report table according to the first embodiment.
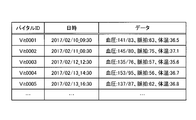
- FIG. 11 is a diagram illustrating an example of a vital table according to the first embodiment.
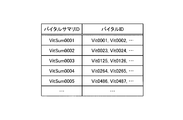
- FIG. 12 is a diagram illustrating an example of a vital summary table according to the first embodiment.
- FIG. 13 is a diagram illustrating an example of a nursing record table according to the first embodiment.
- FIG. 14 is a diagram illustrating an example of a specimen test table according to the first embodiment.
- FIG. 15 is a diagram illustrating an example of a sample test summary table according to the first embodiment.
- FIG. 16 is a diagram illustrating an example of a specimen test report table according to the first embodiment.
- FIG. 17 is a diagram illustrating an example of the classification of the data display format according to the first embodiment.
- FIG. 18 is a diagram illustrating an example of a panel master table according to the first embodiment.
- FIG. 19 is a diagram illustrating an example of a data display table according to the first embodiment.
- FIG. 20 is a diagram illustrating an example of a display coordinate master table according to the first embodiment.
- FIG. 21 is a diagram illustrating an example of a correspondence between a data display format by the display coordinate master according to the first embodiment and coordinates in the medical data space.
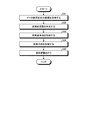
- FIG. 22 is a flowchart illustrating a flow of processing performed by the display control function and the conversion function according to the first embodiment.
- FIG. 23 is a flowchart illustrating a flow of processing performed by the display control function according to the first embodiment.
- FIG. 24 is a diagram illustrating an example of a display screen generated by the display control function.
- FIG. 25 is a diagram illustrating an example of a display screen generated by the display control function.
- FIG. 26 is a diagram illustrating an example of a display screen generated by the display control function.
- FIG. 27 is a diagram illustrating an example of a display screen generated by the display control function.
- FIG. 28 is a diagram illustrating an example of accepting means provided by the display control function according to the first embodiment.
- FIG. 29 is a diagram illustrating another example of the reception unit provided by the display control function according to the first embodiment.
- FIG. 24 is a diagram illustrating an example of a display screen generated by the display control function.
- FIG. 25 is a diagram illustrating an example of a display screen generated by the display control function.
- FIG. 26 is a diagram illustrating an example of a display screen generated
- FIG. 30 is a diagram illustrating another example of the reception unit provided by the display control function according to the first embodiment.
- FIG. 31 is a diagram illustrating another example of the reception unit provided by the display control function according to the first embodiment.
- FIG. 32 is a flowchart showing a flow of processing performed by the conversion function according to the first embodiment.
- FIG. 33 is a diagram illustrating an example of display state determination by the conversion function according to the first embodiment.
- FIG. 34 is a diagram showing an example of display state determination by the conversion function according to the first embodiment.
- FIG. 35 is a diagram illustrating an example of display state determination by the conversion function according to the first embodiment.
- FIG. 36 is a diagram illustrating an example of display state determination by the conversion function according to the first embodiment.
- FIG. 37 is a diagram illustrating an example of display state determination by the conversion function according to the first embodiment.
- FIG. 38 is a diagram illustrating an example of acquisition of a conversion reference point and a conversion direction by the conversion function according to the first embodiment.
- FIG. 39 is a diagram illustrating an example of calculation of coordinates indicating a post-conversion state by the conversion function according to the first embodiment.
- FIG. 40 is a diagram illustrating an example of enlargement conversion performed by the conversion function according to the first embodiment.
- FIG. 41 is a diagram illustrating another example of the enlargement conversion performed by the conversion function according to the first embodiment.
- FIG. 42 is a diagram illustrating an example of reduction conversion performed by the conversion function according to the first embodiment.
- FIG. 43 is a diagram illustrating another example of the reduction conversion performed by the conversion function according to the first embodiment.
- FIG. 44 is a diagram illustrating an example of rotation conversion performed by the conversion function according to the first embodiment.
- FIG. 45 is a diagram illustrating another example of the rotation conversion performed by the conversion function according to the first embodiment.
- FIG. 46 is a diagram illustrating another example of the rotation conversion performed by the conversion function according to the first embodiment.
- FIG. 47 is a diagram illustrating another example of the rotation conversion performed by the conversion function according to the first embodiment.
- FIG. 48 is a diagram illustrating an example of translation conversion performed by the conversion function according to the first embodiment.
- FIG. 49 is a diagram illustrating another example of the translation conversion performed by the conversion function according to the first embodiment.
- FIG. 50 is a diagram illustrating an example of accepting means provided by the display control function according to the second embodiment.
- FIG. 51 is a diagram illustrating an example of a pull-down menu displayed by the display control function according to the second embodiment.
- FIG. 52 is a diagram illustrating an example of a granularity mapping table according to the second embodiment.
- FIG. 53 is a diagram illustrating an example of calculation of coordinates indicating a post-conversion state by the conversion function according to the second embodiment.
- FIG. 54 is a diagram illustrating an example of a display coordinate master table according to the second embodiment.
- FIG. 55 is a diagram showing a unit of coordinate values in the width direction set in the display coordinate master table according to the second embodiment.
- FIG. 56 is a diagram illustrating an example of enlargement or reduction conversion performed by the conversion function according to the second embodiment.
- FIG. 57 is a diagram illustrating another example of enlargement or reduction conversion performed by the conversion function according to the second embodiment.
- FIG. 58 is a diagram illustrating an example of translation conversion performed by the conversion function according to the second embodiment.
- FIG. 59 is a diagram illustrating an example of accepting means provided by the display control function according to the third embodiment.
- FIG. 60 is a diagram illustrating an example of guide information displayed by the display control function according to the fifth embodiment.
- FIG. 61 is a diagram illustrating an example of guide information displayed by the display control function according to the fifth embodiment.
- FIG. 62 is a diagram illustrating an example of guide information displayed by the display control function according to the fifth embodiment.
- FIG. 1 is a diagram illustrating a configuration example of the medical information processing apparatus according to the first embodiment.
- the medical information processing apparatus 100 includes a HIS (Hospital Information System) 300, a RIS (Radiology Information System) 400, and a PACS (Picture Archiving and Communication Systems) via a network 200.
- HIS Hospital Information System
- RIS Radiology Information System
- PACS Picture Archiving and Communication Systems
- 500 and the medical image diagnostic apparatus 600 are communicably connected.
- these devices and systems are installed in a hospital or the like, and are connected to each other by a network 200 such as a hospital LAN (Local Area Network).
- a network 200 such as a hospital LAN (Local Area Network).
- the medical image diagnostic apparatus 600 is an apparatus that generates a medical image based on data collected from a subject.
- the medical image diagnostic apparatus 600 includes an X-ray diagnostic apparatus, an X-ray CT (Computed Tomography) apparatus, an MRI (Magnetic Resonance Imaging) apparatus, an ultrasonic diagnostic apparatus, a SPECT (Single Photon Emission Computed Tomography) apparatus, and a PET (Positron Emission).
- a computed tomography) apparatus a SPECT-CT apparatus in which a SPECT apparatus and an X-ray CT apparatus are integrated
- PET-CT apparatus in which a PET apparatus and an X-ray CT apparatus are integrated, and the like.
- the medical information processing apparatus 100 acquires various medical data from the HIS 300, the RIS 400, the PACS 500, and the medical image diagnostic apparatus 600 via the network 200, and performs various information processing using the acquired medical data.
- the medical information processing apparatus 100 is realized by a computer device such as a workstation.
- the medical information processing apparatus 100 includes an I / F (interface) circuit 110, a storage circuit 120, an input circuit 130, a display 140, and a processing circuit 150.
- I / F interface
- the I / F circuit 110 is connected to the processing circuit 150, and controls transmission and communication of various data performed between the HIS 300, the RIS 400, the PACS 500, and the medical image diagnostic apparatus 600.
- the I / F circuit 110 receives medical data from the HIS 300, the RIS 400, the PACS 500, and the medical image diagnostic apparatus 600 and outputs the received medical data to the processing circuit 150.
- the I / F circuit 110 is realized by a network card, a network adapter, a NIC (Network Interface Controller), or the like.
- the storage circuit 120 is connected to the processing circuit 150 and stores various data.
- the storage circuit 120 stores medical data received from the HIS 300, the RIS 400, the PACS 500, and the medical image diagnostic apparatus 600.
- the storage circuit 120 is realized by a semiconductor memory device such as a RAM (Random Access Memory) or a flash memory, a hard disk, an optical disk, or the like.
- the input circuit 130 is connected to the processing circuit 150, converts an input operation received from the operator into an electrical signal, and outputs the electrical signal to the processing circuit 150.
- the input circuit 130 is realized by a trackball, a switch button, a mouse, a keyboard, a touch panel, or the like.
- the display 140 is connected to the processing circuit 150 and displays various information and various image data output from the processing circuit 150.
- the display 140 is realized by a liquid crystal monitor, a CRT (Cathode Ray Tube) monitor, a touch panel, or the like.
- the processing circuit 150 controls the components of the medical information processing apparatus 100 according to the input operation received from the operator via the input circuit 130.
- the processing circuit 150 stores medical data output from the I / F circuit 110 in the storage circuit 120.
- the processing circuit 150 reads out medical data from the storage circuit 120 and displays it on the display 140.
- the processing circuit 150 is realized by a processor.
- the configuration example of the medical information processing apparatus 100 according to the present embodiment has been described above. Under such a configuration, the medical information processing apparatus 100 according to the present embodiment displays various medical data related to the subject on the display 140.
- FIG. 2 is a diagram showing an outline of display of medical data performed by the medical information processing apparatus 100 according to the first embodiment.
- the medical information processing apparatus 100 displays various medical data such as image data, image measurement values, and interpretation reports on the subject on the display screen.
- various medical data such as image data, image measurement values, and interpretation reports on the subject on the display screen.
- the subject is a patient will be described.
- the medical information processing apparatus 100 has a function for presenting medical data in an appropriate display format in accordance with a clinical examination purpose.
- the processing circuit 150 has an acquisition function 151, a display control function 152, and a conversion function 153.
- the display control function 152 is an example of a display control unit.
- the conversion function 153 is an example of a conversion unit.
- the display control function 152 displays medical data based on a medical data space having a dimension associated with a data display format defined for each medical data. Then, the conversion function 153 switches the display of the medical data displayed by the display control function 152 by performing spatial conversion with reference to the specified conversion reference point on the medical data space.
- the medical data space has three dimensions of width, depth, and time.
- width indicates the data type.
- Depth indicates a data interpretation classification.
- the “data interpretation classification” here is defined by, for example, a DIKW model. In the DIKW model, data is classified into four types, Data, Information, Knowledge, and Wisdom. The amount of data decreases and the value as information increases in the order of Data, Information, Knowledge, and Wisdom. For example, raw data such as images and numerical values corresponds to Data, and data that already includes a high level interpretation of data such as reports corresponds to Knowledge and wisdom.
- the medical data is browsed from various points of view with the currently displayed information as a starting point by performing spatial conversion on the basis of the designated conversion reference point and switching the display of the medical data.
- medical data can be presented in an appropriate display format according to the purpose of clinical examination.
- Each processing function of the processing circuit 150 is stored in the storage circuit 120 in the form of a program that can be executed by a computer, for example.
- the processing circuit 150 reads each program from the storage circuit 120 and executes each read program, thereby realizing a processing function corresponding to each program.
- the processing circuit 150 in a state where each program is read has the processing functions shown in FIG.
- the acquisition function 151 acquires various medical data from the HIS 300, the RIS 400, the PACS 500, and the medical image diagnostic apparatus 600, and stores the acquired medical data in an integrated medical DB (Data Base) constructed by the storage circuit 120.
- the acquisition function 151 acquires medical information such as patient information, order information, order execution information, image examination information, and various measurement information as medical data.
- the information acquired by the acquisition function 151 may be information held by the HIS 300, the RIS 400, the PACS 500, and the medical image diagnostic apparatus 600, or may be information obtained by integrating these information. It may be information created for the purpose of secondary use.
- the process in which the acquisition function 151 acquires the above-described medical data from the HIS 300, the RIS 400, the PACS 500, and the medical image diagnostic apparatus 600 is asynchronous with the process performed by the display control function 152 and the conversion function 153 described below.
- the processing performed by the acquisition function 151 is realized, for example, when the processing circuit 150 reads a predetermined program corresponding to the acquisition function 151 from the storage circuit 120 and executes it.
- the integrated medical care DB has a plurality of tables prepared for each type of medical care data.
- the integrated medical treatment DB includes a medication table, a medication summary table, an image table, an image measurement value table, an interpretation report table, an electrocardiogram table, an electrocardiogram measurement value table, an electrocardiogram report table, a vital table, a vital summary table, a nursing record table, a sample It has a test table, a sample test summary table, and a sample test report table.
- the medication table and the medication summary table are examples of tables based on order information or order execution information.
- the image table, the image measurement value table, and the interpretation report table described here are examples of tables based on image inspection information.
- the electrocardiogram table, the electrocardiogram measurement value table, the electrocardiogram report table, the vital table, the vital summary table, the nursing record table, the specimen examination table, the specimen examination summary table, and the specimen examination report table are examples of tables based on various measurement information. It is.
- FIG. 3 is a diagram showing an example of a medication table according to the first embodiment.
- the medication table stores medical data regarding medication administered to the patient.
- the medication table stores information in which a medication ID, date and data are associated with each other.
- the medication ID identification information for uniquely identifying medical data related to medication is set.
- the date and time when the medication is performed is set.
- the data information indicating the drug that has been administered is set.
- a medication table is prepared for each type of medicine.
- FIG. 4 is a diagram showing an example of a medication summary table according to the first embodiment.
- the medication summary table stores medical data related to medication summary data that summarizes medications administered to a patient at a plurality of times.
- the medication summary table stores information in which a medication summary ID is associated with an order ID.
- a medication summary ID identification information for uniquely identifying medication summary data is set.
- the order ID a medication ID of each medication included in the medication summary data is set.
- table based on the order information or the order execution information in addition to the medication table and the medication summary table, for example, tables relating to various orders such as images, meals, rehabilitation, surgery, endovascular treatment, radiotherapy, etc.
- a table regarding the execution of the order may be further included in the integrated medical care DB.
- FIG. 5 is a diagram illustrating an example of an image table according to the first embodiment.
- the image table stores medical data regarding an image obtained by imaging a patient.
- the image table stores information in which an image ID, a date and time, and data are associated with each other.
- image ID identification information for uniquely identifying medical data regarding the image is set.
- the date and time when the image is captured is set.
- image data of the image is set.
- the image referred to here is a medical image diagnostic apparatus 600 (for example, an X-ray diagnostic apparatus, an X-ray CT apparatus, an MRI apparatus, an ultrasonic diagnostic apparatus, a SPECT apparatus, a PET apparatus, etc.) SPECT-CT apparatus in which the X-ray CT apparatus is integrated, PET-CT apparatus in which the PET apparatus and the X-ray CT apparatus are integrated, or a group of these devices).
- the image referred to here is, for example, generated in a format such as DICOM (Digital Imaging and Communication in Medicine) image (dcm), PNG (Portable Network Graphics) image, JPEG (Joint Photographic Experts Group) image, etc. .
- the image referred to here may be a still image or a moving image.
- FIG. 6 is a diagram illustrating an example of an image measurement value table according to the first embodiment.
- the image measurement value table stores medical data related to measurement values measured based on an image obtained by imaging a patient.
- the image measurement value table stores information in which a measurement value ID, an image ID, a measurement type, and data are associated with each other.
- the measurement value ID identification information for uniquely identifying the medical data related to the measurement value of the image is set.
- the image ID identification information for uniquely identifying an image used for measurement of the measurement value is set.
- the measurement type information indicating the type of the measurement value (eg, tumor diameter, blood vessel diameter, flow rate, etc.) is set. The measurement value is set in the data.
- FIG. 7 is a diagram showing an example of an interpretation report table according to the first embodiment.
- the interpretation report table stores medical data related to an interpretation report created based on an image obtained by imaging a patient.
- the interpretation report table stores information in which an interpretation report ID, an image ID, and a report are associated with each other.
- the interpretation report ID identification information for uniquely identifying medical data related to the interpretation report is set.
- the image ID identification information for uniquely identifying the image used for creating the interpretation report is set.
- the document data of the interpretation report is set.
- the document data of the interpretation report referred to here may be in various document formats other than the doc format or in a text format.
- FIG. 8 is a diagram showing an example of an electrocardiogram table according to the first embodiment.
- the electrocardiogram table stores medical data related to the patient's electrocardiogram measured in the examination.
- the electrocardiogram table stores information in which an electrocardiogram ID, a date and time, and data are associated with each other.
- the electrocardiogram ID identification information for uniquely identifying medical data related to the electrocardiogram is set.
- the date and time when the electrocardiogram is measured is set.
- image data of the electrocardiogram is set.
- the electrocardiogram here is generated in a format such as a PNG image or a JPEG image, for example.
- the electrocardiogram here may be waveform data expressed by MFER (Medical waveform Format Encoding Rules) or CSV (Comma Separated Value).
- FIG. 9 is a diagram showing an example of an electrocardiogram measurement value table according to the first embodiment.
- the electrocardiogram measurement value table stores medical data related to the measurement values measured based on the patient's electrocardiogram.
- the electrocardiogram measurement value table stores information in which a measurement value ID, an electrocardiogram ID, a measurement type, and data are associated with each other.
- the measurement value ID identification information for uniquely identifying medical data related to the measurement value of the electrocardiogram is set.
- the electrocardiogram ID identification information for uniquely identifying the electrocardiogram used for measuring the measurement value is set.
- the measurement type information indicating the type of the measurement value (for example, heart rate, P wave height, P wave width, etc.) is set. The measurement value is set in the data.
- FIG. 10 is a diagram showing an example of an electrocardiogram report table according to the first embodiment.
- the electrocardiogram report table stores medical data related to the electrocardiogram report created based on the electrocardiogram of the patient.
- the electrocardiogram report table stores information in which an electrocardiogram report ID, an electrocardiogram ID, and a report are associated with each other.
- the electrocardiogram report ID identification information for uniquely identifying medical data related to the electrocardiogram report is set.
- the electrocardiogram ID identification information for uniquely identifying the electrocardiogram used for creating the electrocardiogram report is set.
- the document data of the electrocardiogram report is set in the report.
- the ECG report document data here may be in various document formats other than the doc format, or in a text format.
- FIG. 11 is a diagram illustrating an example of a vital table according to the first embodiment.
- a vital table memorize
- the vital table stores information in which a vital ID, a date and time, and data are associated with each other.
- the vital ID identification information for uniquely identifying the medical data related to the vital is set.
- the date and time the date and time when the vital measurement is performed is set.
- the measured value of the vital for example, blood pressure, pulse, body temperature, etc.
- FIG. 12 is a diagram illustrating an example of a vital summary table according to the first embodiment.
- the vital summary table stores medical data related to vital summary data in which vitals measured at a plurality of times from a patient are collected.
- the vital summary table stores information in which a vital summary ID is associated with a vital ID.
- identification information for uniquely identifying vital summary data is set.
- the vital ID of each vital included in the vital summary data is set.
- FIG. 13 is a diagram showing an example of a nursing record table according to the first embodiment.
- the nursing record table stores medical data relating to nursing records created based on patient vitals.
- the nursing record table stores information in which a nursing record ID, a vital ID, and a report are associated with each other.
- the nursing record ID identification information for uniquely identifying medical data related to the nursing record is set.
- the vital ID identification information for uniquely identifying the vital used to create the nursing record is set.
- Document data of the nursing record is set in the report.
- the nursing record document data here may be in various document formats other than the doc format, or in a text format.
- FIG. 14 is a diagram illustrating an example of a specimen test table according to the first embodiment.
- the sample test table stores medical data related to patient sample tests.
- the sample test table stores information in which a sample test ID, date and data are associated with each other.
- the specimen test ID identification information for uniquely identifying medical data related to the specimen test is set.
- the date and time when the sample test is performed is set.
- measurement values of the sample test for example, measurement values of uric acid (UA), total protein (TP), etc. are set.
- FIG. 15 is a diagram showing an example of a sample test summary table according to the first embodiment.
- the sample test summary table stores medical data related to sample test summary data that summarizes sample tests performed on a patient at a plurality of points in time.
- the sample test summary table stores information in which a sample test summary ID is associated with a sample test ID.
- a sample test summary ID identification information for uniquely identifying the sample test summary data is set.
- a sample test ID of each sample test included in the sample test summary data is set.
- FIG. 16 is a diagram showing an example of a specimen test report table according to the first embodiment.
- the specimen test report table stores medical data related to the specimen test report created based on the patient specimen test.
- the sample test report table stores information in which a sample test report ID, a sample test ID, and a report are associated with each other.
- the specimen test report ID identification information for uniquely identifying medical data related to the specimen test report is set.
- the sample test ID identification information for uniquely identifying the sample test used to create the sample test report is set.
- document data of the sample test report is set. Note that the document data of the specimen test report here may be in various document formats other than the doc format or in a text format.
- a data display format suitable for each browsing is defined for each medical data described above.
- the data display format includes medical data and a specific display format for displaying the medical data (for example, table format, time series format, image display format, electrocardiogram display format, report display format, etc.) It is defined by the combination with the panel showing.
- each data display format defined for every medical data is classified from various viewpoints according to the clinical examination purpose.
- FIG. 17 is a diagram illustrating an example of the classification of the data display format according to the first embodiment.
- each data display format is classified into a data display format related to intervention and a data display format related to response.
- the data display format related to intervention is further classified into a data display format related to medication, and the data display format related to medication is further classified according to the type of drug.
- the data display format related to the response is further classified into a data display format related to the image, a data display format related to the electrocardiogram, a data display format related to the vitals, and a data display format related to the specimen examination.
- each data display format is classified into a data display format related to objective data and a data display format related to subjective data.
- the data display format related to objective data is further classified into a data display format related to raw data and a data display format related to processed data, and the data display format related to subjective data is further classified into a data display format related to character data.
- each data display format is classified and classified for each time point in time series.
- the data display format of the medical data stored in the above-described medication table is classified as a data display format related to medication and raw data as shown in the first row from the top and the first column from the left in FIG. Furthermore, it is divided and classified for each time point in time series. Further, the data display format of the medical data stored in the above-mentioned medication summary table is classified as a data display format related to medication and processing data as shown in the first row from the top and the second column from the left in FIG. It is classified as a data format that summarizes medications from multiple time points.
- the data display format of the medical data stored in the image table described above is classified as a data display format related to images and raw data, as shown in the second row from the top and the first column from the left in FIG.
- the time series is divided and classified.
- the data display format of the medical data stored in the above-described image measurement value table is classified as a data display format related to images and processed data as shown in the second row from the top and the second column from the left in FIG.
- the time series is divided and classified.
- the data display format of the medical data stored in the above-described interpretation report table is classified as a data display format related to image and character data, as shown in the second row from the top and the third column from the left in FIG. They are classified by time points.
- the data display format of the medical data stored in the above-described ECG table is classified as a data display format related to the ECG and raw data, as shown in the third row from the top and the first column from the left in FIG.
- the time series is divided and classified.
- the data display format of the medical data stored in the above-described electrocardiogram measurement value table is classified as a data display format relating to the electrocardiogram and the processed data as shown in the third row from the top and the second column from the left in FIG.
- the time series is divided and classified.
- the data display format of the medical data stored in the above-described ECG report table is classified as a data display format related to the ECG and character data, as shown in the third row from the top and the third column from the left in FIG. They are classified by time points.
- the data display format of the medical data stored in the vital table described above is classified as a data display format related to vital and raw data as shown in the fourth row from the top and the first column from the left in FIG.
- the time series is divided and classified.
- the data display format of the medical data stored in the vital summary table described above is classified as a data display format related to vital and processed data, as shown in the fourth row from the top and the second column from the left in FIG. It is classified as a data format that summarizes the measured values of vitals at multiple points in time.
- the data display format of the medical data stored in the above-described nursing record table is classified as a data display format related to vital and character data, as shown in the fourth row from the top and the third column from the left in FIG. They are classified by time points.
- the data display format of the medical data stored in the above-described sample test table is classified as the data display format related to the sample test and raw data as shown in the fifth row from the top and the first column from the left in FIG. Further, the time series are divided and classified. Further, the data display format of the medical data stored in the above-described sample test summary table is classified as a data display format related to sample test and processing data as shown in the fifth row from the top and the second column from the left in FIG. Then, it is classified as a data format in which the measurement values of the specimen tests at a plurality of time points are collected.
- the data display format of the medical data stored in the above-described sample test report table is classified as a data display format related to the sample test and character data as shown in the fifth row from the top and the third column from the left in FIG. And are divided and classified for each time point in time series.
- the storage circuit 120 stores a master for associating each data display format with coordinates in the medical data space according to the above-described classification of the data display format.
- the medical data space has three dimensions of width, depth, and time, and is defined by three coordinate axes corresponding to each dimension. That is, the medical data space is a space having three axes of data type, time, and data interpretation classification as coordinate axes.
- the storage circuit 120 stores a data display format master and a display coordinate master.
- the data display format master stores information indicating in what format (hereinafter referred to as a panel) the medical data stored in the integrated medical DB.
- the data display format master includes a panel master table and a data display table.
- the display coordinate master stores information indicating mapping of which panel and medical data correspond to which coordinate.
- the display coordinate master includes a display coordinate master table.
- FIG. 18 is a diagram illustrating an example of a panel master table according to the first embodiment.
- the panel master table stores information on various panels for displaying medical data.
- the panel master table stores information in which a panel ID is associated with a panel.
- identification information for uniquely identifying the panel is set.
- a specific form of the panel is set for the panel.
- FIG. 19 is a diagram illustrating an example of a data display table according to the first embodiment.
- the data display table stores information on the data display format defined by the combination of the medical data and the panel.
- the data display table stores information in which a data display ID, a panel ID, and a data ID are associated with each other.
- the data display ID identification information for uniquely identifying the data display format is set.
- the panel ID the panel ID of the panel used in the data display format is set.
- the data ID the data ID of medical data displayed in the data display format is set.
- the data ID includes the aforementioned medication ID (see FIG. 3), medication summary ID (see FIG. 4), image ID (see FIG. 5), measurement value ID (see FIG. 6), interpretation report. ID (see FIG. 7), electrocardiogram ID (see FIG. 8), measurement value ID (see FIG. 9), electrocardiogram report ID (see FIG. 10), vital ID (see FIG. 11), vital summary ID ( 12), nursing record ID (see FIG. 13), sample test ID (see FIG. 14), sample test summary ID (see FIG. 15), or sample test report ID (see FIG. 16) Is set.
- it is defined on which panel the medical data stored in each table of the integrated medical DB is displayed.
- FIG. 20 is a diagram illustrating an example of a display coordinate master table according to the first embodiment.
- the display coordinate master table stores information in which coordinates in the medical data space are associated with each data display format defined by the combination of the medical data and the panel. Accordingly, the medical data has a data structure associated with the coordinate axes of the medical data space.
- the display coordinate master table stores information in which a coordinate ID, a data display ID, a width (width), a time (time), and a depth (depth) are associated with each other.
- a coordinate ID identification information for uniquely identifying coordinates in the medical data space is set.
- a data display ID in a data display format associated with the coordinates is set.
- Width, Time, and Depth coordinate values indicating the coordinates are set.
- the coordinate value (1, (1, 2, 3), 2) associated with the coordinate ID “Coor0007” and the coordinate ID “Coor0008” are associated.
- Each coordinate value (4, (2-6), 2) represents a line segment along the time direction in the medical data space.
- the coordinate values (5, *, 2) associated with the coordinate ID “Coor0009” represent lines along the time direction in the medical data space.
- a point on the medical data space is indicated. Furthermore, although not illustrated in FIG. 20, a plane in the medical data space is shown by setting “*” to any two coordinate values of Width, Time, and Depth.
- FIG. 21 is a diagram showing an example of the correspondence between the data display format by the display coordinate master according to the first embodiment and the coordinates in the medical data space.
- FIG. 21 shows an example in which coordinates in the medical data space are associated with each data display format shown in FIG.
- the coordinates (Width (width), Time (in the medical data space) for each data display format defined for each medical data by the display coordinate master according to each classification. Time), Depth (depth)).
- coordinates are associated with each data display format so that coordinate values increase in the order of medication, image, electrocardiogram, vital, and specimen test.
- coordinates are associated with each data display format so that coordinate values increase in the order of raw data, processed data, and character data.
- Time (time) direction inclining direction toward the right in FIG. 21
- the coordinates are associated with each data display format so that the coordinate values increase in order of time series.
- the integrated medical DB may store medical data in units of tables different from this.
- the medical data held in the integrated medical DB is not limited to the above-described data, and other various medical data may be used.
- the display control function 152 displays medical data based on a medical data space having a dimension associated with a data display format defined for each medical data.
- the conversion function 153 switches the display of the medical data displayed by the display control function 152 by performing spatial conversion on the basis of the designated conversion reference point in the medical data space.
- FIG. 22 is a flowchart showing a flow of processing performed by the display control function 152 and the conversion function 153 according to the first embodiment.
- FIG. 22 shows an overall flow of processing performed by the display control function 152 and the conversion function 153.
- the display control function 152 displays a display screen of medical data (step S11). Specifically, the display control function 152 generates a display screen for displaying the medical data based on the above-described medical data space, and displays the generated display screen on the display 140.
- the conversion function 153 acquires the display state before the space conversion (step S12). Specifically, the conversion function 153 is based on the information being displayed on the display screen and the screen operation of the operator, and the display state before spatial conversion (which coordinate is displayed, which dimension (point, Is displayed in line, surface, etc.). Here, the display state before the space conversion is indicated by a point, a line, or a plane on the medical data space. Hereinafter, the display state before spatial conversion is referred to as “pre-conversion state”.
- the conversion function 153 acquires a reference point for spatial conversion (step S13). Specifically, the conversion function 153 acquires a reference point for spatial conversion based on the screen operation of the operator.
- the reference point for space conversion is indicated by a point, a line, or a plane on the medical data space.
- the reference point for spatial conversion is referred to as “conversion reference point”.
- the conversion function 153 acquires the direction of spatial conversion (step S14). Specifically, the conversion function 153 acquires the direction of spatial conversion based on the screen operation of the operator. In the following, the direction of spatial conversion is referred to as “conversion direction”.
- the conversion function 153 performs space conversion (step S15). Specifically, the conversion function 153 determines the display state (which coordinate is displayed, which dimension is to be displayed) based on the acquired pre-conversion state, conversion reference point and conversion direction, and display coordinate master information. (Do you want to display it as a point, line, surface, etc.)? Here, the display state after the space conversion is indicated by a point, a line, or a plane on the medical data space. In the following, the display state after spatial conversion is referred to as “post-conversion state”.
- the display control function 152 displays the display screen after the space conversion (step S16). Specifically, the display control function 152 generates a display screen after spatial conversion based on the post-conversion state acquired by the spatial conversion by the conversion function 153 and the information of the data display format master and the integrated medical care DB. The generated display screen is displayed on the display 140.
- steps S11 and S16 described above is realized, for example, by the processing circuit 150 reading and executing a predetermined program corresponding to the display control function 152 from the storage circuit 120. Further, the processing of steps S12 to S15 described above is realized, for example, when the processing circuit 150 reads a predetermined program corresponding to the conversion function 153 from the storage circuit 120 and executes it.
- the display control function 152 uses the post-conversion state acquired by the conversion function 153 and data display format master information to determine the data display format (layout, type of medical data, etc.) of the post-conversion state. Then, the display control function 152 generates a display screen using the data held in the integrated medical care DB, and displays the generated display screen on the display 140.
- FIG. 23 is a flowchart showing a flow of processing performed by the display control function 152 according to the first embodiment.
- the display control function 152 first searches for the data display ID of the display coordinate master table based on the coordinates calculated as the post-conversion state by the conversion function 153 (step S21). At this time, the display control function 152 searches for a plurality of data display IDs when the coordinates calculated by the conversion function 153 represent a line or a surface.
- the display control function 152 acquires a panel ID and a data ID from the data display table of the data display format master based on the searched data display ID (step S22). At this time, if there are a plurality of searched data display IDs, the display control function 152 acquires a plurality of combinations of panel IDs and data IDs.
- the display control function 152 acquires the corresponding data from the integrated medical care DB based on the acquired data ID, and further selects the corresponding panel from the panel master table of the data display format master based on the acquired panel ID. Acquire and apply the acquired data to the panel to generate a display screen. Then, the display control function 152 displays the generated display screen on the display 140 (step S23).
- FIGS. 24 to 27 are diagrams showing examples of display screens generated by the display control function 152.
- FIG. Here, the examples shown in FIGS. 24 to 27 are examples when the data display format illustrated in FIGS. 17 and 21 is displayed.
- the examples shown in FIGS. 24 to 27 are the image table shown in FIG. 5, the image measurement value table shown in FIG. 6, the interpretation report table shown in FIG. 7, the panel master table shown in FIG. This corresponds to the data display table illustrated and the display coordinate master table illustrated in FIG.
- coordinates (Width, Time, Depth) indicating positions in the medical data space are simply expressed as (W, T, D).
- the display control function 152 acquires the data display ID of “DView0002” from the display coordinate master table based on the coordinates (2, 1, 1) calculated by the conversion function 153. Subsequently, the display control function 152 acquires the panel ID “Panel0003” and the data ID “Img0001” from the data display table based on the acquired data display ID “DView0002”. After that, the display control function 152 acquires “20170210 — 1020.dcm” data from the image table of the integrated medical care DB based on the acquired data ID of “Img0001”, and further, based on the acquired panel ID of “Panel0003”. Then, the “image display panel” is acquired from the panel master table.
- the display control function 152 applies the acquired data “20110210 — 1020.dcm” to the “image display panel”, generates the data display format 1 of the image data, and generates the display screen on which the data display format 1 is arranged. To do.
- the display control function 152 acquires the data display ID of “DView0003” from the display coordinate master table based on the coordinates (2, 1, 2) calculated by the conversion function 153. Subsequently, based on the acquired data display ID of “DView0003”, the display control function 152 uses the panel ID of “Panel0001” and the data IDs of “ImgMes0001”, “ImgMes0002”,. To get. After that, the display control function 152 acquires the measurement type and data corresponding to each data ID from the image measurement value table of the integrated medical care DB based on the acquired data IDs of “ImgMes0001”, “ImgMes0002”,.
- “table format panel” is acquired from the panel master table. Then, the display control function 152 applies each acquired measurement type and each data to the “table format panel”, generates the data display format 2 of the measured values of the image, and displays the display screen on which the data display format 2 is arranged. Generate.
- the display control function 152 acquires the data display ID of “DView0010” from the display coordinate master table based on the coordinates (2, 1, 3) calculated by the conversion function 153. Subsequently, the display control function 152 acquires the panel ID “Panel0005” and the data ID “ImgRep0001” from the data display table based on the acquired data display ID “DView0010”. Thereafter, the display control function 152 acquires the data of “Report 0001.doc” from the interpretation report table of the integrated medical care DB based on the acquired data ID of “ImgRep0001”, and further acquires the panel ID of the acquired “Panel0005”.
- a “report display panel” is acquired from the panel master table. Then, the display control function 152 applies the obtained data of “report 0001.doc” to the “report display panel”, generates the data display format 3 of the interpretation report, and displays the display screen on which the data display format 3 is arranged. Generate.
- the display control function 152 reads the coordinates (2, 1, 1), (2, 1, 1) from the display coordinate master table based on the coordinates (2, 1, *) calculated by the conversion function 153.
- the data display IDs of “DView0002”, “DView0003”, and “DView0010” corresponding to 2) and (2,1,3) are acquired.
- the display control function 152 uses a combination of “Panel0003” and “Img0001”, “Panel0001” and “ImgMes0001” as a combination of the panel ID and the data ID from the data display table. , “ImgMes0002”,... And a combination of “Panel0005” and “ImgRep0001”.
- the display control function 152 acquires data “20170210 — 1020.dcm” from the image table of the integrated medical care DB based on the acquired combination of “Panel0003” and “Img0001”, and “image display panel” from the panel master table. Is applied to the “image display panel” to generate the data display format 1 of the image data.
- the display control function 152 selects the measurement type corresponding to each data ID from the image measurement value table of the integrated medical treatment DB based on the acquired combination of “Panel0001”, “ImgMes0001”, “ImgMes0002”,.
- a “table format panel” is acquired from the panel master table, and each acquired measurement type and each data is applied to the “table format panel” to generate a data display format 2 of image measurement values.
- the display control function 152 acquires “Report 0001.doc” data from the interpretation report table of the integrated medical care database based on the acquired combination of “Panel0005” and “ImgRep0001”, and “Report” from the panel master table.
- the “display panel” is acquired, and the acquired data of “report 0001.doc” is applied to the “report display panel” to generate the data display format 3 of the interpretation report.
- the display control function 152 generates a display screen in which the generated data display formats 1 to 3 are arranged. At this time, the display control function 152 generates a plurality of data display formats when there are a plurality of combinations of panel IDs and data IDs acquired from the data display table of the data display format master. Then, when a plurality of data display formats are generated, the display control function 152 generates a display screen layout based on a predetermined rule. For example, the display control function 152 generates a display screen layout so that each data is displayed side by side in the order of raw data, processed data, and character data from the left. Alternatively, for example, the display control function 152 generates a display screen layout so that data relating to an image is displayed largely on the left side, and processed data and character data are displayed side by side on the right side.
- the display control function 152 provides an accepting unit for accepting designation of the pre-conversion state, the conversion reference point, and the conversion direction from the operator via the display screen.
- FIG. 28 is a diagram illustrating an example of accepting means provided by the display control function 152 according to the first embodiment.
- the display control function 152 uses a data display format 4 that displays a plurality of data display formats 1 to 3 as a unit of a state before conversion, and uses the data display format 4 as a unit.
- An operation accepting unit for accepting an operation for designating the pre-conversion state and the conversion direction is arranged on the display screen.
- the display control function 152 arranges three icons 5 side by side in the left-right direction on the data display format 4 in which a plurality of data display formats 1 to 3 are collected as the operation receiving unit.
- the display control function 152 receives an operation for any one of the three icons 5
- the display control function 152 identifies that the data display format in which the icon is arranged is designated as the pre-conversion state.
- the display control function 152 identifies that the depth direction is designated as the conversion direction.
- the display control function 152 identifies that the time direction is designated as the conversion direction.
- the display control function 152 identifies that the width direction is designated as the conversion direction.
- the display control function 152 is an operation for receiving designation of a conversion reference point on the display screen in units of individual data display formats included in the data display format 4 in which the plurality of data display formats 1 to 3 are collected. Arrange the reception part. For example, the display control function 152 sets an area in each panel as the operation receiving unit for each data display format. The display control function 152 identifies that the data display format is designated as the conversion reference point when an operation is performed on an area in the panel of any data display format.
- the display control function 152 uses a data display format indicated by a line summarizing a plurality of points and a data display format indicated by a plane summarizing a plurality of lines, for each data display format of lines, or You may receive designation
- the display control function 152 does not place an icon on the display screen in advance, but operates according to the type of operation (position on the display screen where the operation is performed, mouse click method, etc.). May be accepted.
- FIG. 29 is a diagram illustrating another example of accepting means provided by the display control function 152 according to the first embodiment.
- the display control function 152 identifies the data display format at the position designated by the left mouse click as the pre-conversion state, and displays the data at the position designated by the right mouse click. Identifies the format as a transformation reference point. Further, for example, the display control function 152 displays an icon for designating the depth direction, an icon for designating the time direction, and an icon for designating the width direction when the right mouse click is performed.
- the conversion direction is accepted by displaying the context menu 6 arranged in a row.
- the operation designates a point on the medical data space.
- the display control function 152 identifies the data display format at the position designated by the right click as the pre-conversion state and the conversion reference point.
- the display control function 152 may accept an operation for designating a point or a line in the time direction on the medical data space when accepting an operation for designating the pre-conversion state and the conversion reference point.
- FIG. 30 is a diagram illustrating another example of the accepting means provided by the display control function 152 according to the first embodiment.
- the display control function 152 displays a graphic 7 for designating a time point or a time range on a data display format including components in the time direction. Then, for example, the display control function 152 accepts an operation for changing the position or size of the graphic 7 by an operation such as mouse click or dragging, and thereby identifies a point or a line segment in the time direction.
- the display control function 152 displays the graphic 7 on each data display format, and at the same time point. Alternatively, each graphic is linked so as to indicate a time range.
- the display control function 152 may further display guide information indicating a position on the medical data space corresponding to the data display format being displayed.
- FIG. 31 is a diagram showing another example of accepting means provided by the display control function 152 according to the first embodiment.
- the display control function 152 displays guide information corresponding to the medical data space on the display screen so that the position of the displayed data display format in the medical data space can be grasped. 8 is displayed.
- the display control function 152 displays, as the guide information 8, an icon indicating the presence or absence of medical data in a display format in which the horizontal axis is time series and the vertical axis is a data type. Then, the display control function 152 highlights a position corresponding to the currently displayed medical data in the guide information 8.
- the display control function 152 may perform highlighting using a color, an icon, or the like in order to display a two-dimensional or higher axis.
- the display control function 152 may dynamically switch the axis displayed as the guide information 8 according to the medical data being displayed. For example, when the display control function 152 displays the depth direction and the time direction planes for the medical data related to the image, the vertical axis is the depth axis instead of the data type.
- the display control function 152 may accept an operation in which the operator designates a pre-conversion state, a conversion reference point, and a conversion direction on the guide information 8. In this case, for example, the display control function 152 highlights the displayed data display format corresponding to the position selected on the guide information 8. As a result, the operator can intuitively select the pre-conversion state and the conversion reference point.
- the conversion function 153 obtains the coordinates of the pre-conversion state, the conversion reference point, and the conversion direction specified by the operator, and calculates the coordinates indicating the post-conversion state by performing spatial conversion based on the acquired coordinates. To do.
- FIG. 32 is a flowchart showing a flow of processing performed by the conversion function 153 according to the first embodiment.
- the conversion function 153 first acquires the coordinates of the data display format being displayed on the display screen (step S31). At this time, the conversion function 153 uses the accepting means provided by the display control function 152 for all data display formats designated as the pre-conversion state by the operator based on the display coordinate master table of the display coordinate master. Get the coordinates in the data space. At this time, for example, when a data display format in which a plurality of data display formats are combined is designated, the conversion function 153 acquires coordinates for all data display formats included in the data display format. Alternatively, the conversion function 153 may acquire coordinates for all data display formats displayed on the display screen by the display control function 152 in accordance with an instruction from the operator.
- the conversion function 153 determines the pre-conversion state (step S32). At this time, the conversion function 153 determines the display state of the data display format selected by the operator or the data display format displayed on the display screen based on the acquired coordinates. Then, the conversion function 153 sets the coordinates indicating the determined display state as coordinates indicating the pre-conversion state.
- 33 to 37 are diagrams showing an example of display state determination by the conversion function 153 according to the first embodiment.
- a data display format in which (W, T, D) (2, 1, 3)
- a data display format in which (W, T, D) (1, *, 2)
- (W, T, D) (5, *, 2)
- the conversion function 153 acquires a conversion reference point (step S33).
- the conversion function 153 uses the reception means provided by the display control function 152 to determine the data display format designated by the operator as the conversion reference point based on the display coordinate master table of the display coordinate master. Get the coordinates at. Then, the conversion function 153 sets the acquired coordinates as coordinates indicating the conversion reference point.
- the conversion function 153 acquires the conversion direction (step S34). At this time, the conversion function 153 sets the coordinate indicating the conversion direction as the coordinate indicating the conversion direction with respect to the direction designated by the operator as the conversion direction using the receiving unit provided by the display control function 152.
- FIG. 38 is a diagram illustrating an example of acquisition of a conversion reference point and a conversion direction by the conversion function 153 according to the first embodiment.
- the conversion function 153 acquires the corresponding coordinates (2, 1, 1) from the display coordinate master based on the data display ID of the data display format.
- the conversion function 153 performs space conversion (step S35). At this time, the conversion function 153 calculates coordinates indicating the post-conversion state based on the coordinates indicating the pre-conversion state, the coordinates indicating the conversion reference point, and the coordinates indicating the conversion direction obtained by the above-described processing.
- FIG. 39 is a diagram illustrating an example of calculation of coordinates indicating a post-conversion state by the conversion function 153 according to the first embodiment.
- the image data, the measured value of the image, and the interpretation report are displayed for one time point by the display control function 152 before conversion.
- the image data is displayed for a plurality of time points, and the measurement value of the image and the interpretation report are displayed for the one time point.
- the conversion function 153 performs, as spatial conversion, the pre-conversion state indicated by a point, a line, or a plane on the medical data space with reference to the conversion reference point specified in the pre-conversion state. Convert to a post-conversion state indicated by a point, line or plane.
- the conversion reference point is also indicated by a point, a line, or a plane in the medical data space.
- the conversion function 153 performs rotation, parallel movement, enlargement, or reduction in the medical data space as space conversion.
- FIG. 40 is a diagram illustrating an example of enlargement conversion performed by the conversion function 153 according to the first embodiment.
- FIG. 40 shows an example of converting a point into a line display by enlarging.
- conversion function 153 coordinates indicating the pre-conversion state (W A, T A, D A) , and coordinates representing the converted state (W A, T A , *).
- Such a spatial transformation is performed by expanding the pre-conversion state indicated by a point in the depth direction with reference to the conversion reference point indicated by the point, to a post-conversion state indicated by a line extending in the depth direction. It corresponds to converting.
- the display control function 152 has displayed the image data at one time point before the conversion, and the image data and the image at the same time point after the conversion.
- the measured value and the interpretation report are displayed.
- FIG. 41 is a diagram illustrating another example of the expansion conversion performed by the conversion function 153 according to the first embodiment.
- FIG. 41 shows an example in which a line is converted into a surface display by enlargement.
- the conversion function 153 converts the coordinates (W B , *, D B ) indicating the state before conversion into the coordinates (*, *, D indicating the state after conversion. B ) to convert.
- Such spatial transformation is indicated by a plane extending in the width direction and the time direction by enlarging the pre-conversion state indicated by the line extending in the time direction in the width direction with reference to the conversion reference point indicated by the line. This corresponds to conversion to a post-conversion state.
- the display control function 152 shows that the sample test summary data is displayed for a plurality of time points before the conversion, but the conversion is performed for the plurality of time points after the conversion.
- the summary data, the specimen inspection summary data, and the vital summary data are switched to the displayed state.
- FIG. 42 is a diagram illustrating an example of reduction conversion performed by the conversion function 153 according to the first embodiment.
- FIG. 42 shows an example in which a line is converted into a point display by reduction.
- an icon 9 for designating reduction in the designated direction is further arranged on the data display format.
- the conversion function 153 converts the coordinates (W C , *, D C ) indicating the pre-conversion state into coordinates (W C , T C ) indicating the post-conversion state. , D C ).
- Such spatial transformation is indicated by a point by reducing the pre-conversion state indicated by a line extending in the time direction in the time direction with reference to a conversion reference point indicated by one point included in the line. This corresponds to conversion to a post-conversion state.
- the display control function 152 shows that the sample test summary data is displayed for a plurality of time points before the conversion. At one time point, the measurement value of the sample test is switched to the displayed state.
- FIG. 43 is a diagram illustrating another example of the reduction conversion performed by the conversion function 153 according to the first embodiment.
- FIG. 43 shows an example of converting the surface into a line display by reduction.
- an icon 9 for designating reduction in the designated direction is further arranged on the data display format.
- the conversion function 153 converts the coordinates (*, *, D D ) indicating the state before conversion into the coordinates (*, T D , D indicating the state after conversion. D ) to convert.
- the pre-conversion state indicated by the plane extending in the width direction and the time direction is reduced in the time direction with reference to the conversion reference point indicated by one line extending in the width direction included in the plane. This corresponds to the conversion into the post-conversion state indicated by the line extending in the width direction.
- the state in which the medication summary data, the specimen test summary data, and the vital summary data are displayed for a plurality of time points by the display control function 152 is as follows. After the conversion, for one time point included in the plurality of time points, the information indicating the medicine, the measurement value of the specimen test, and the measurement value of the vital are switched to a displayed state.
- FIG. 44 is a diagram illustrating an example of rotation conversion performed by the conversion function 153 according to the first embodiment.
- FIG. 44 shows an example in the case of rotationally converting a line.
- (W, T, D) (W E1 , T E1 , D E1 )
- the conversion function 153 converts the coordinates (W E1 , *, D E1 ) indicating the pre-conversion state into coordinates (W E1 , T E1 ) indicating the post-conversion state. , *).
- the pre-conversion state indicated by the line extending in the time direction is rotated in the depth direction with reference to the conversion reference point indicated by one point included in the line, thereby the depth direction. This corresponds to the conversion into a post-conversion state indicated by a line extending in a circle.
- the state in which the image data is displayed at a plurality of time points before the conversion by the display control function 152 is converted into one of the plurality of time points after the conversion.
- the image data, the measured value of the image, and the interpretation report are switched to the displayed state.
- FIG. 45 is a diagram illustrating another example of the rotation conversion performed by the conversion function 153 according to the first embodiment.
- FIG. 45 shows another example in the case of rotationally converting a line.
- (W, T, D) (W E2 , T E2 , D E2 )
- the conversion function 153 uses the coordinates (W E2 , *, D E2 ) indicating the pre-conversion state as coordinates (*, T E2 , D E2 ).
- Such spatial transformation extends in the width direction by rotating the pre-conversion state indicated by the line extending in the time direction with respect to the conversion reference point indicated by one point included in the line. This corresponds to conversion to a post-conversion state indicated by a line.
- the display control function 152 controls the state in which the specimen test summary data is displayed for a plurality of time points before the conversion. At one point in time, the information indicating the medicine, the measured value of the specimen test, and the measured value of the vital are switched to the displayed state.
- FIG. 46 is a diagram illustrating another example of the rotation conversion performed by the conversion function 153 according to the first embodiment.
- FIG. 46 shows an example of the case where the surface is rotationally converted.
- the conversion function 153 converts the coordinates (*, *, D F1 ) indicating the state before conversion into the coordinates (W F1 , *, * indicating the state after conversion. ).
- the pre-conversion state indicated by the plane extending in the width direction and the time direction is rotated in the depth direction with reference to the conversion reference point indicated by one line extending in the time direction included in the plane. By doing so, it corresponds to the conversion to the post-conversion state indicated by the plane extending in the time direction and the depth direction.
- the display control function 152 displays the state in which the image measurement values, the specimen inspection summary data, and the vital summary data are displayed for a plurality of time points before the conversion. After the conversion, the measured values of the image, the image data, and the interpretation report are switched to the displayed states for the plurality of time points.
- FIG. 47 is a diagram illustrating another example of the rotation conversion performed by the conversion function 153 according to the first embodiment.
- FIG. 47 shows another example when the surface is rotationally converted.
- the conversion function 153 converts the coordinates (*, *, D F2 ) indicating the pre-conversion state into coordinates (*, T F2 , * indicating the post-conversion state. ).
- the pre-conversion state indicated by the plane extending in the width direction and the time direction is rotated in the depth direction with reference to the conversion reference point indicated by one line extending in the width direction included in the plane. This corresponds to the conversion into a post-conversion state indicated by a surface extending in the width direction and the depth direction.
- the display control function 152 by the display control function 152, the state in which the measured values of the image and the measured values of the electrocardiogram are displayed at a plurality of time points before the conversion is
- the image data, the image measurement value, the interpretation report, the electrocardiogram image data, the electrocardiogram measurement value, and the electrocardiogram report can be switched to one time point included in the plurality of time points. become.
- FIG. 48 is a diagram illustrating an example of translational conversion performed by the conversion function 153 according to the first embodiment.
- FIG. 48 shows an example in the case where the line is translated and converted.
- an icon 10 for designating the forward direction or the backward direction of the time direction as the conversion direction is arranged on the data display format.
- W, T, D data display format
- the forward direction (-T) in the time direction is designated as the conversion direction.
- the conversion function 153 converts the coordinates (*, T G , D G ) indicating the pre-conversion state into coordinates (*, T G ⁇ T, D G ).
- Such spatial conversion is indicated by another line extending in the width direction by translating the pre-conversion state indicated by the line extending in the width direction in the time direction with reference to the conversion reference point indicated by the line. This corresponds to conversion to a post-conversion state.
- the information indicating the medicine, the measured value of the specimen test, and the measured value of the vital test were displayed at one time point by the display control function 152 before the conversion. After the state is converted, the information indicating the medicine, the measured value of the sample test, and the measured value of the vital are switched to a state in which the information is displayed at another time point.
- FIG. 49 is a diagram illustrating another example of the translation conversion performed by the conversion function 153 according to the first embodiment.
- FIG. 49 shows an example of a case where the surface is translated and converted.
- an icon 11 for designating the forward direction or the backward direction in the depth direction as the conversion direction is arranged on the data display format.
- W, T, D (*, *, D H )
- the backward direction (+ D) in the depth direction is designated as the conversion direction.
- conversion function 153 coordinates indicating the pre-conversion state (*, *, D H) of the coordinates indicating the converted state (*, *, D H + D).
- Such spatial conversion is performed by translating the pre-conversion state indicated by the plane extending in the width direction and the time direction in the depth direction with reference to the conversion reference point indicated by the plane, so that the width direction and the time direction. This corresponds to the conversion to the post-conversion state indicated by the other surface extending in (1).
- the display control function 152 displays the image measurement values and the electrocardiogram measurement values for a plurality of time points before conversion.
- the image data and the electrocardiogram image data are switched to the displayed state for the plurality of time points.
- the spatial transformation performed by the transformation function 153 is not limited to the two-dimensional spatial transformation as described above.
- the conversion function 153 may perform three-dimensional or more spatial conversion such as expansion from a surface to space, rotation or translation of the space, reduction from space to surface, and the like.
- the space is based on the conversion reference point designated by the operator. By performing the conversion, the display of the medical data is switched.
- the viewpoint is switched from the currently displayed information as a starting point. For example, in the confirmation of a bird's eye inspection result, if there is an inspection result that you are interested in, check the details of the inspection result or check the temporal transition of the inspection result. Is called. Also, in the confirmation of detailed test results, if there is a test result that you are interested in, switch to the viewpoint such as comparing with the treatment content (medicine etc.) immediately before that, or comparing with the test results of other patients. Is done.
- the tabular display is limited to two types of attributes, and thus the viewpoint of analysis may be limited. For example, when data of different levels of detail are compared, or when data is compared between different patients of the same data, switching including these cannot be realized in the tabular format and its selection method.
- the medical data is started from the currently displayed information by performing spatial conversion on the basis of the designated conversion reference point and switching the display of the medical data. Can be viewed from various angles. Therefore, according to the present embodiment, medical data can be presented in an appropriate display format according to the clinical examination purpose.
- the conversion function 153 may further perform spatial conversion based on the specified conversion amount.
- the description will focus on the points that differ from the above-described embodiment, and the description of the contents that overlap with the above-described embodiment will be omitted.
- the display control function 152 provides an accepting unit for accepting an operation for designating the conversion amount of the spatial transformation from the operator via the display screen.
- FIG. 50 is a diagram illustrating an example of a reception unit provided by the display control function 152 according to the second embodiment.
- the display control function 152 displays, on the display screen, an operation reception unit for designating a conversion amount when an operation is performed on an icon for designating a conversion direction.
- the display control function 152 displays a pull-down menu 12 listing medical data classifications as an operation receiving unit for designating the conversion amount.
- FIG. 51 is a diagram showing an example of the pull-down menu 12 displayed by the display control function 152 according to the second embodiment.
- the pull-down menu 12 displayed by the display control function 152 lists information indicating classifications such as “intervention” and “response”.
- the storage circuit 120 stores a granularity mapping table in which a conversion amount is defined for each classification of medical data as one integrated medical DB.
- FIG. 52 is a diagram showing an example of a granularity mapping table according to the second embodiment.
- the granularity mapping table stores information in which a mapping ID, a name, and a table are associated with each other.
- mapping ID identification information that uniquely identifies the classification of the medical data is set.
- name the name of the classification is set.
- information indicating a table of medical data to be displayed is set as information indicating the conversion amount in the direction corresponding to the classification.
- the conversion function 153 performs spatial conversion based on the pre-conversion state, conversion reference point, conversion direction, and conversion amount specified by the operator. Specifically, the conversion function 153 acquires the coordinates and dimensions of the post-conversion state based on the acquired pre-conversion state, conversion reference point, conversion direction, display coordinate master information, and granularity mapping table information. To do.
- FIG. 53 is a diagram illustrating an example of calculation of coordinates indicating a post-conversion state by the conversion function 153 according to the second embodiment.
- (W, T, D) ((1, 5), *, 2).
- 2) means to further display the data display format.
- the conversion function 153 is a table stored in the granularity mapping table based on the classification specified by the operator from the classifications displayed in the pull-down menu 12 and the specified conversion direction.
- the medical data to be displayed is acquired with reference to the information.
- the conversion function 153 identifies the data display format to be added or deleted as a display target by comparing the acquired medical data with the medical data included in the pre-conversion state.
- the display control function 152 shows that the specimen test summary data is displayed for a plurality of time points as medical data related to the specimen test before the conversion.
- the medication summary data is switched to the state where the medication summary data is displayed for the plurality of time points as the medical data regarding the medication.
- the amount of medical data displayed may increase, and the information on the display screen may be difficult to see (see the lower left in FIG. 53).
- the second embodiment by performing spatial conversion using the conversion amount, the number of medical data displayed on the display screen can be adjusted, and the information on the display screen can be easily viewed. .
- information indicating the conversion amount may be included in the display coordinate master table of the display coordinate master.
- FIG. 54 is a diagram showing an example of a display coordinate master table according to the second embodiment.
- FIG. 55 is a diagram showing a unit of coordinate values in the width direction set in the display coordinate master table according to the second embodiment.
- coordinate values are set in the Width size in units of data concerning intervention and data concerning response.
- coordinate values are set in units of data relating to medication, data relating to images, data relating to electrocardiograms, data relating to vitals, and data relating to specimen examinations.
- the coordinate value set to large Width is set so that more data display IDs are associated with one coordinate value than the coordinate value set to small Width.
- the display control function 152 displays the pull-down menu 12 including information indicating “large” and information indicating “small”. Then, when “large” is designated by the operator, the conversion function 153 performs spatial conversion based on the coordinate value set to the large Width of the display coordinate master table. In addition, when “small” is designated by the operator, the conversion function 153 performs space conversion based on the coordinate value set to the small Width of the display coordinate master table.
- the display control function 152 displays more medical data on the display screen when “large” is designated by the operator than when “small” is designated by the operator. Will be.
- FIG. 56 is a diagram illustrating an example of enlargement or reduction conversion performed by the conversion function 153 according to the second embodiment.
- FIG. 56 shows an example in the case of designating an expansion or reduction range in the width direction.
- a pull-down menu 12 for designating the classification of medical data is displayed as an operation accepting unit for designating the conversion amount on the data display format.
- the pull-down menu 12 displayed by the display control function 152 lists information indicating classifications such as “intervention” and “response”.
- the conversion function 153 displays coordinates (5, *, 2) is converted into coordinates ((1, 5), *, 2) indicating the state after conversion.
- Such spatial conversion is performed by expanding the pre-conversion state indicated by the line extending in the time direction in the width direction within the scope of the intervention with reference to the conversion reference point indicated by the line. This corresponds to the conversion to the post-conversion state indicated by the plane extending in the figure.
- the display control function 152 shows that the specimen test summary data is displayed for a plurality of time points before the conversion. With respect to the time point, the medication summary data and the specimen test summary data are switched to the displayed state.
- the conversion function 153 has coordinates (5, *, 2) indicating the state before conversion. Is converted into coordinates ((2 to 5), *, 2) indicating the post-conversion state.
- Such spatial conversion is performed by expanding the pre-conversion state indicated by the line extending in the time direction in the width direction within the range of the response with reference to the conversion reference point indicated by the line. This corresponds to the conversion to the post-conversion state indicated by the plane extending in the figure.
- the state in which the specimen test summary data is displayed for a plurality of time points by the display control function 152 before the conversion is displayed.
- the specimen test summary data, the vital summary data, the measured values of the image, and the measured values of the electrocardiogram are switched to the displayed state.
- FIG. 57 is a diagram illustrating another example of enlargement or reduction conversion performed by the conversion function 153 according to the second embodiment.
- FIG. 57 shows an example in the case of designating an expansion or reduction range in the time direction.
- a pull-down menu 13 for designating a range in the time direction is displayed on the data display format as an operation accepting unit for designating the conversion amount.
- the pull-down menu 13 lists “up to a selection range”, “before and after an event”, and “all time range”.
- the conversion function 153 displays the coordinates (2, 1, 1) is converted into coordinates (2, (1, 2), 1) indicating the post-conversion state.
- Such a spatial transformation is a post-conversion state indicated by a line extending in the time direction by expanding the pre-conversion state indicated by the point in the time direction up to the selection range with reference to the conversion reference point indicated by the point.
- the display control function 152 shows that the image data is displayed for one time point before the conversion, but after the conversion, from the one time point. At a plurality of time points up to the selection range, the image data is switched to the displayed state.
- the conversion function 153 displays coordinates (2, 1, 1) indicating the state before conversion. ) Is converted into coordinates (2, (1-3), 1) indicating the post-conversion state.
- Such spatial conversion is performed after the conversion indicated by the line extending in the time direction by expanding the pre-conversion state indicated by the point in the time direction until crossing the event with reference to the conversion reference point indicated by the point. It corresponds to converting to a state.
- the state in which image data is displayed for one time point before conversion by the display control function 152 is one time point after conversion.
- FIG. 58 is a diagram illustrating an example of translational conversion performed by the conversion function 153 according to the second embodiment.
- FIG. 58 shows an example in which the amount of movement in the time direction is designated.
- a pull-down menu 14 for specifying a movement amount in the time direction is displayed on the data display format as an operation reception unit for specifying the conversion amount.
- “Previous”, “One month ago”, “One year ago”, and “Before event” are listed in the pull-down menu 14.
- the conversion function 153 has coordinates (2, 2, 2) indicating the state before conversion. *) Is converted into coordinates (2, 1, *) indicating the state after conversion.
- Such spatial conversion is achieved by moving the pre-conversion state indicated by the line extending in the depth direction in the time direction up to the previous time with reference to the conversion reference point indicated by the line, so as to extend in the depth direction. This corresponds to conversion to a post-conversion state indicated by a line.
- the display control function 152 displays the image data, the measured value of the image, and the interpretation report for one time point before the conversion. However, after the conversion, the image data, the measured value of the image, and the interpretation report are switched to the state displayed for the previous time point of the one time point.
- the conversion function 153 displays coordinates (2, 2, * ) Is converted into coordinates (2, 5, *) indicating the state after conversion.
- Such spatial conversion is performed by moving the pre-conversion state indicated by the line extending in the depth direction in the depth direction by moving in the time direction until a predetermined event with reference to the conversion reference point indicated by the line. This corresponds to conversion to a post-conversion state indicated by another line that extends.
- the display control function 152 displayed the image data, the measured value of the image, and the interpretation report for one time point before the conversion. After the conversion, the state is switched to the state in which the image data, the measured value of the image, and the interpretation report are displayed at the time point before the event different from the one time point.
- space conversion is performed based on the specified conversion amount in addition to the pre-conversion state, the conversion reference point, and the conversion direction. Therefore, according to the second embodiment, by acquiring the conversion amount of the spatial conversion, it is possible to arbitrarily specify the display range after conversion that cannot be specified only by the conversion direction or the like.
- the display amount of the medical data increases, which may reduce the visibility of the medical data.
- the conversion amount it is possible to limit to an appropriate expansion range (limit the data types to be displayed), and to improve the visibility of medical data. Become. In parallel translation conversion in the time direction, the conversion to medical data at a desired time becomes easy by specifying the amount of movement.
- the medical data space may further have a dimension corresponding to the patient.
- a third embodiment such an example will be described as a third embodiment. Note that, in the third embodiment, the description will be focused on differences from the above-described embodiment, and the description overlapping with the above-described embodiment will be omitted.
- the display control function 152 provides an accepting means for accepting an operation for designating the position in the patient direction from the operator via the display screen.
- FIG. 59 is a diagram showing an example of accepting means provided by the display control function 152 according to the third embodiment.
- the display control function 152 further includes an icon 15 for designating conversion to the patient direction in addition to three icons for designating the conversion direction on the data display format. Deploy.
- the conversion function 153 has the same data display format as the medical data of the corresponding patient displayed when the pre-conversion state is specified when conversion to the patient direction is specified by the operator. Then, the medical data of other patients is displayed.
- the coordinates of the medical data space further including the patient (P) direction are represented by (W, T, D, P).
- the coordinates (W # , *, D # , P # ) indicating the pre-conversion state are displayed as the post-conversion state. Convert to the indicated coordinates (W # , *, D # , *).
- Such spatial conversion is indicated by a plane extending in the time direction and the patient direction by reducing the pre-conversion state indicated by the line extending in the time direction to the patient direction with reference to the conversion reference point indicated by the line. This corresponds to conversion to a post-conversion state.
- the display control function 152 before the conversion, as the medical data related to the medication, the specimen test, and the vital data, the medication summary data, the specimen test summary data, and the vital summary are converted.
- the state in which the data is displayed is switched to the state in which the specimen test summary data is displayed as the medical data related to the specimen test for each patient, patient A, patient B, and patient C.
- the example in the case of displaying the medical data of another patient for every patient was demonstrated here, embodiment is not restricted to this.
- the medical data of other patients may be displayed together as an average value or the like as one data display format.
- the patients to be displayed may be narrowed down by disease or medical treatment phase, or may be limited to patients specified by the operator or the system. Further, by specifying the conversion amount of the spatial conversion as in the second embodiment, the operator may specify the patient to be displayed.
- the medical data space further has a dimension corresponding to the patient. Therefore, according to the third embodiment, it is possible to switch data display including dimensions including the patient axis. This makes it possible to compare medical data across patients in any data display format.
- the conversion function 153 may be dynamically changed according to a disease, an operator, or a medical care phase.
- the operator is a doctor, a radiologist, a nurse, or the like.
- the medical care phase is outpatient, diagnosis, preoperative, postoperative, etc.
- the display control function 152 and the conversion function 153 change the type of medical data associated with the medical data space according to the disease, the operator, or the medical service phase.
- the display control function 152 and the conversion function 153 change the coordinates associated with each data display format in the medical data space according to the disease, the operator, or the medical care phase.
- the storage circuit 120 holds a table storing necessary types of medical data in the integrated medical database, and stores the data display format of each medical data in the data display format master. Furthermore, the storage circuit 120 stores a combination of a data display format master and a display coordinate master for each disease, operator, or medical care phase. Then, for example, the display control function 152 and the conversion function 153 accept the designation of the disease, the operator's occupation type or the medical care phase from the operator, and the data display format master and the display coordinate master used for each process according to the received contents. Switch.
- the display control function 152 and the conversion function 153 use a data display format master and a display coordinate master so that meal data is used as medical data when the disease is heart failure, and pathological images are used as medical data when the disease is cancer. Switch.
- the display control function 152 and the conversion function 153 are configured so that the clinical application screen data is used as the medical data instead of the image interpretation report. Switch between display format master and display coordinate master.
- the display control function 152 and the conversion function 153 use data regarding intervention and response as medical data when the occupation of the operator is a physician, and HIS 300 and RIS 400 when the operator is a radiologist. And the data display format master and the display coordinate master are switched so that the data acquired from the PACS 500 is used.
- the display control function 152 and the conversion function 153 switch the data display format master and the display coordinate master so as not to include vitals and nursing records as medical data.
- the medical data and the medical data space are dynamically changed according to the disease, the operator, or the medical care phase. Therefore, according to the fourth embodiment, it is possible to switch the display of medical data more appropriately according to the clinical examination purpose.
- the display control function 152 uses the time series on the horizontal axis and the data type on the vertical axis as guide information indicating the position in the medical data space corresponding to the data display format being displayed.
- guide information indicating the position in the medical data space corresponding to the data display format being displayed.
- the display control function 152 displays, as guide information, a graphic that three-dimensionally shows the dimensions of the medical data space, and displays information that indicates the position corresponding to the data display format being displayed on the graphic. To do.
- 60 to 62 are diagrams showing examples of guide information displayed by the display control function 152 according to the fifth embodiment.
- the display control function 152 displays a cubic graphic 81 having sides along the width direction, the depth direction, and the time direction on the display screen.
- the display control function 152 may always display the graphic 81 while the display screen is displayed on the display 140, or may not be displayed in the initial display, but may be displayed when requested by the operator. May be.
- the display control function 152 may display the graphic 81 on a sub-screen different from the display screen that displays medical data, such as PIP (Picture In Picture).
- the display control function 152 displays information indicating a position corresponding to the data display format being displayed on the cubic graphic 81.
- An example of displaying a plurality of data display formats is shown.
- a graphic 82 is displayed.
- An example of displaying a plurality of data display formats is shown.
- the graphic 83 is displayed.
- An example of displaying a plurality of data display formats is shown.
- the display control function 152 when the display control function 152 simultaneously displays a plurality of data display formats represented by a plurality of points, lines, or planes in the medical data space, the display control function 152 has a plurality of points, lines, Or a planar graphic is simultaneously displayed on the cubic graphic 81.
- the display control function 152 displays a graphic 81 having a shape in which a plurality of cubes are arranged in three axial directions.
- the display control function 152 may change the display mode of each cube according to the classification of the data display format being displayed. For example, as an example regarding the width direction, the display control function 152 displays a cube corresponding to the data display format related to intervention and a cube corresponding to the data display format related to response in different colors.
- the display control function 152 displays, as guide information, a graphic that three-dimensionally represents the dimension of the medical data space, and a position corresponding to the data display format being displayed on the graphic.
- the operator can more intuitively grasp the position of the data display format being displayed in the medical data space.
- the display control function 152 may further receive an instruction to switch the display of the medical data on the graphic 81 that three-dimensionally shows the dimensions of the above-described medical data space from the operator.
- the display control function 152 operates an operation of rotating, translating, enlarging, or reducing a dot-like graphic, a line-like graphic, or a planar graphic displayed on the graphic 81 indicating the dimension of the medical data space. Accept from the person.
- the display control function 152 receives an operation on a dotted graphic, a linear graphic, or a planar graphic displayed on the graphic 81 indicating the dimension of the medical data space, thereby receiving an operation from the operator.
- the specification of the state before conversion, the conversion reference point, and the conversion direction is accepted.
- the display control function 152 accepts the designation of the pre-conversion state from the operator by accepting an operation of selecting any graphic displayed on the graphic 81 indicating the dimension of the medical data space.
- the display control function 152 receives an operation for selecting a point, a line, or a surface on the selected graphic, thereby receiving a designation of a conversion reference point from the operator.
- the designation of the conversion direction is accepted from the operator.
- the enlargement operation is an operation of switching a dotted graphic to a linear graphic or a planar graphic, or an operation of switching a linear graphic to a planar graphic.
- the reduction operation is an operation for switching a planar graphic to a dot graphic or a line graphic, or an operation for switching a line graphic to a dot graphic.
- the conversion function 153 is based on the pre-conversion state, the conversion reference point, and the conversion direction received by the display control function 152, as in the first embodiment.
- the display of medical data is switched by performing conversion or reduction conversion.
- the display control function 152 receives an instruction to switch the display of the medical data on the graphic 81 that three-dimensionally shows the dimensions of the medical data space, so that the operator The display of data can be switched more intuitively.
- the medical data space has three dimensions, but the embodiment is not limited thereto.
- the number of dimensions of the medical data space may be less than three, or may be four or more.
- each processing function described above is realized by a single processing circuit 150
- the processing circuit 150 may be configured by combining a plurality of independent processors, and each processor may implement each processing function by executing each program.
- each processing function of the processing circuit 150 may be realized by being appropriately distributed or integrated into a single or a plurality of processing circuits.
- processor used in the above description is, for example, a CPU (Central Processing Unit), a GPU (Graphics Processing Unit), an application-specific integrated circuit (ASIC), or a programmable logic device. It means a circuit such as a simple programmable logic device (SPLD), a complex programmable logic device (CPLD), or a field programmable gate array (FPGA).
- SPLD simple programmable logic device
- CPLD complex programmable logic device
- FPGA field programmable gate array
- the processor implements a function by reading and executing the program stored in the storage circuit 120. Instead of storing the program in the storage circuit 120, the program may be directly incorporated in the processor circuit. In this case, the processor realizes the function by reading and executing the program incorporated in the circuit.
- each processor of the present embodiment is not limited to being configured as a single circuit for each processor, but may be configured as a single processor by combining a plurality of independent circuits to realize its function. Good.
- the program executed by the processor is provided by being incorporated in advance in a ROM (Read Only Memory) or a storage circuit.
- This program is a file in a format that can be installed or executed in these devices, such as CD (Compact Disk) -ROM, FD (Flexible Disk), CD-R (Recordable), DVD (Digital Versatile Disk), etc. It may be provided by being recorded on a computer-readable storage medium.
- the program may be provided or distributed by being stored on a computer connected to a network such as the Internet and downloaded via the network.
- this program is composed of modules including the above-described functional units.
- the CPU reads a program from a storage medium such as a ROM and executes it, whereby each module is loaded on the main storage device and generated on the main storage device.
Landscapes
- Engineering & Computer Science (AREA)
- Health & Medical Sciences (AREA)
- Public Health (AREA)
- Medical Informatics (AREA)
- Epidemiology (AREA)
- General Health & Medical Sciences (AREA)
- Primary Health Care (AREA)
- Biomedical Technology (AREA)
- Pathology (AREA)
- Theoretical Computer Science (AREA)
- Data Mining & Analysis (AREA)
- Databases & Information Systems (AREA)
- Nuclear Medicine, Radiotherapy & Molecular Imaging (AREA)
- Radiology & Medical Imaging (AREA)
- Business, Economics & Management (AREA)
- General Business, Economics & Management (AREA)
- Human Computer Interaction (AREA)
- General Engineering & Computer Science (AREA)
- General Physics & Mathematics (AREA)
- Physics & Mathematics (AREA)
- Medical Treatment And Welfare Office Work (AREA)
- Measuring And Recording Apparatus For Diagnosis (AREA)
- Digital Computer Display Output (AREA)
- User Interface Of Digital Computer (AREA)
Abstract
A medical information processing device (100) according to an embodiment of the present invention is provided with a display control unit (152) and a conversion unit (153). The display control unit (152) displays medical care data on the basis of a medical care data space having dimensions associated with data display formats defined for each piece of medical care data. The conversion unit (153) performs spatial conversion on the medical care data space using specified conversion reference points as references, to switch the display of the medical care data displayed by the display control unit.
Description
本発明の実施形態は、医用情報処理装置及び医用情報処理方法に関する。
Embodiments described herein relate generally to a medical information processing apparatus and a medical information processing method.
従来、医師が診断や治療方針を検討するために必要な種々の診療データを、一つの画面上で表示するシステムが望まれている。例えば、投薬等の治療に関する情報や、検体検査や画像検査等の検査に関する情報等を比較しながら同時に見ることができるシステムや、被検体の状態や現在の治療内容等を高い一覧性で把握できるシステムが期待されている。
Conventionally, there is a demand for a system that displays various medical data necessary for a doctor to examine a diagnosis and a treatment policy on a single screen. For example, it is possible to see information related to treatment such as medication, information related to examinations such as sample examinations and image examinations, etc. at the same time, and to grasp the state of the subject and the current treatment content with a high list. The system is expected.
本発明が解決しようとする課題は、臨床的な検討目的に応じて、適切な表示形式で診療データを提示することができる医用情報処理装置及び医用情報処理方法を提供することである。
The problem to be solved by the present invention is to provide a medical information processing apparatus and a medical information processing method capable of presenting medical data in an appropriate display format according to a clinical examination purpose.
実施形態に係る医用情報処理装置は、表示制御部と、変換部とを備える。前記表示制御部は、診療データごとに定義されたデータ表示形式に対応付けられた次元を有する診療データ空間に基づいて、前記診療データを表示する。前記変換部は、前記診療データ空間上で、指定された変換基準点を基準にして空間変換を行うことで、前記表示制御部によって表示される前記診療データの表示を切り替える。
The medical information processing apparatus according to the embodiment includes a display control unit and a conversion unit. The display control unit displays the medical data based on a medical data space having a dimension associated with a data display format defined for each medical data. The said conversion part switches the display of the said medical data displayed by the said display control part by performing space conversion on the said medical data space on the basis of the designated conversion reference point.
以下、図面を参照しながら、医用情報処理装置及び医用情報処理方法の実施形態について詳細に説明する。
Hereinafter, embodiments of the medical information processing apparatus and the medical information processing method will be described in detail with reference to the drawings.
(第1の実施形態)
図1は、第1の実施形態に係る医用情報処理装置の構成例を示す図である。 (First embodiment)
FIG. 1 is a diagram illustrating a configuration example of the medical information processing apparatus according to the first embodiment.
図1は、第1の実施形態に係る医用情報処理装置の構成例を示す図である。 (First embodiment)
FIG. 1 is a diagram illustrating a configuration example of the medical information processing apparatus according to the first embodiment.
例えば、図1に示すように、本実施形態に係る医用情報処理装置100は、ネットワーク200を介して、HIS(Hospital Information System)300、RIS(Radiology Information System)400、PACS(Picture Archiving and Communication Systems)500、及び、医用画像診断装置600と通信可能に接続される。例えば、これらの装置及びシステムは、病院等に設置され、院内LAN(Local Area Network)等のネットワーク200によって相互に接続される。
For example, as illustrated in FIG. 1, the medical information processing apparatus 100 according to the present embodiment includes a HIS (Hospital Information System) 300, a RIS (Radiology Information System) 400, and a PACS (Picture Archiving and Communication Systems) via a network 200. ) 500 and the medical image diagnostic apparatus 600 are communicably connected. For example, these devices and systems are installed in a hospital or the like, and are connected to each other by a network 200 such as a hospital LAN (Local Area Network).
ここで、医用画像診断装置600は、被検体から収集したデータに基づいて医用画像を生成する装置である。例えば、医用画像診断装置600は、X線診断装置、X線CT(Computed Tomography)装置、MRI(Magnetic Resonance Imaging)装置、超音波診断装置、SPECT(Single Photon Emission Computed Tomography)装置、PET(Positron Emission computed Tomography)装置、SPECT装置とX線CT装置とが一体化されたSPECT-CT装置、PET装置とX線CT装置とが一体化されたPET-CT装置等である。
Here, the medical image diagnostic apparatus 600 is an apparatus that generates a medical image based on data collected from a subject. For example, the medical image diagnostic apparatus 600 includes an X-ray diagnostic apparatus, an X-ray CT (Computed Tomography) apparatus, an MRI (Magnetic Resonance Imaging) apparatus, an ultrasonic diagnostic apparatus, a SPECT (Single Photon Emission Computed Tomography) apparatus, and a PET (Positron Emission). a computed tomography) apparatus, a SPECT-CT apparatus in which a SPECT apparatus and an X-ray CT apparatus are integrated, a PET-CT apparatus in which a PET apparatus and an X-ray CT apparatus are integrated, and the like.
医用情報処理装置100は、ネットワーク200を介して、HIS300、RIS400、PACS500、及び、医用画像診断装置600から各種の診療データを取得し、取得した診療データを用いて各種の情報処理を行う。例えば、医用情報処理装置100は、ワークステーション等のコンピュータ機器によって実現される。
The medical information processing apparatus 100 acquires various medical data from the HIS 300, the RIS 400, the PACS 500, and the medical image diagnostic apparatus 600 via the network 200, and performs various information processing using the acquired medical data. For example, the medical information processing apparatus 100 is realized by a computer device such as a workstation.
具体的には、医用情報処理装置100は、I/F(インターフェース)回路110と、記憶回路120と、入力回路130と、ディスプレイ140と、処理回路150とを有する。
Specifically, the medical information processing apparatus 100 includes an I / F (interface) circuit 110, a storage circuit 120, an input circuit 130, a display 140, and a processing circuit 150.
I/F回路110は、処理回路150に接続され、HIS300、RIS400、PACS500、及び、医用画像診断装置600との間で行われる各種データの伝送及び通信を制御する。例えば、I/F回路110は、HIS300、RIS400、PACS500、及び、医用画像診断装置600から診療データを受信し、受信した診療データを処理回路150に出力する。例えば、I/F回路110は、ネットワークカードやネットワークアダプタ、NIC(Network Interface Controller)等によって実現される。
The I / F circuit 110 is connected to the processing circuit 150, and controls transmission and communication of various data performed between the HIS 300, the RIS 400, the PACS 500, and the medical image diagnostic apparatus 600. For example, the I / F circuit 110 receives medical data from the HIS 300, the RIS 400, the PACS 500, and the medical image diagnostic apparatus 600 and outputs the received medical data to the processing circuit 150. For example, the I / F circuit 110 is realized by a network card, a network adapter, a NIC (Network Interface Controller), or the like.
記憶回路120は、処理回路150に接続され、各種データを記憶する。例えば、記憶回路120は、HIS300、RIS400、PACS500、及び、医用画像診断装置600から受信した診療データを記憶する。例えば、記憶回路120は、RAM(Random Access Memory)、フラッシュメモリ等の半導体メモリ素子や、ハードディスク、光ディスク等によって実現される。
The storage circuit 120 is connected to the processing circuit 150 and stores various data. For example, the storage circuit 120 stores medical data received from the HIS 300, the RIS 400, the PACS 500, and the medical image diagnostic apparatus 600. For example, the storage circuit 120 is realized by a semiconductor memory device such as a RAM (Random Access Memory) or a flash memory, a hard disk, an optical disk, or the like.
入力回路130は、処理回路150に接続され、操作者から受け付けた入力操作を電気信号に変換して処理回路150に出力する。例えば、入力回路130は、トラックボール、スイッチボタン、マウス、キーボード、タッチパネル等によって実現される。
The input circuit 130 is connected to the processing circuit 150, converts an input operation received from the operator into an electrical signal, and outputs the electrical signal to the processing circuit 150. For example, the input circuit 130 is realized by a trackball, a switch button, a mouse, a keyboard, a touch panel, or the like.
ディスプレイ140は、処理回路150に接続され、処理回路150から出力される各種情報及び各種画像データを表示する。例えば、ディスプレイ140は、液晶モニタやCRT(Cathode Ray Tube)モニタ、タッチパネル等によって実現される。
The display 140 is connected to the processing circuit 150 and displays various information and various image data output from the processing circuit 150. For example, the display 140 is realized by a liquid crystal monitor, a CRT (Cathode Ray Tube) monitor, a touch panel, or the like.
処理回路150は、入力回路130を介して操作者から受け付けた入力操作に応じて、医用情報処理装置100の構成要素を制御する。例えば、処理回路150は、I/F回路110から出力される診療データを記憶回路120に記憶させる。また、例えば、処理回路150は、記憶回路120から診療データを読み出し、ディスプレイ140に表示する。例えば、処理回路150は、プロセッサによって実現される。
The processing circuit 150 controls the components of the medical information processing apparatus 100 according to the input operation received from the operator via the input circuit 130. For example, the processing circuit 150 stores medical data output from the I / F circuit 110 in the storage circuit 120. Further, for example, the processing circuit 150 reads out medical data from the storage circuit 120 and displays it on the display 140. For example, the processing circuit 150 is realized by a processor.
以上、本実施形態に係る医用情報処理装置100の構成例について説明した。このような構成のもと、本実施形態に係る医用情報処理装置100は、被検体に関する各種の診療データをディスプレイ140に表示する。
The configuration example of the medical information processing apparatus 100 according to the present embodiment has been described above. Under such a configuration, the medical information processing apparatus 100 according to the present embodiment displays various medical data related to the subject on the display 140.
図2は、第1の実施形態に係る医用情報処理装置100によって行われる診療データの表示の概要を示す図である。
FIG. 2 is a diagram showing an outline of display of medical data performed by the medical information processing apparatus 100 according to the first embodiment.
例えば、図2に示すように、本実施形態に係る医用情報処理装置100は、被検体に関する画像データや画像の計測値、読影レポート等の各種の診療データを表示画面上に表示する。なお、本実施形態では、被検体が患者である場合の例を説明する。
For example, as shown in FIG. 2, the medical information processing apparatus 100 according to the present embodiment displays various medical data such as image data, image measurement values, and interpretation reports on the subject on the display screen. In the present embodiment, an example in which the subject is a patient will be described.
ここで、各種の診療データを表示画面上に同時に表示する場合には、情報量が多くなることで視認性が低下することがあり得るため、診療データの使用するシーンに応じて、最適にデータ表示を切り替えることが求められる。また、このような診療データの表示では、検査結果の時系列変化に着目する場合や種々のデータを俯瞰的に確認する等のように、診療データを多角的に閲覧するための切り替えが求められる。
Here, when various types of medical data are displayed on the display screen at the same time, visibility may decrease due to an increase in the amount of information. Therefore, optimal data is used according to the scene used by the medical data. It is required to switch the display. Also, in such display of medical data, switching to view medical data from various perspectives is required, such as when attention is paid to time-series changes in test results or various data are viewed from a bird's-eye view. .
このようなことから、本実施形態に係る医用情報処理装置100は、臨床的な検討目的に応じて、適切な表示形式で診療データを提示するための機能を有する。
For this reason, the medical information processing apparatus 100 according to the present embodiment has a function for presenting medical data in an appropriate display format in accordance with a clinical examination purpose.
具体的には、本実施形態では、処理回路150が、取得機能151と、表示制御機能152と、変換機能153とを有する。なお、表示制御機能152は、表示制御部の一例である。また、変換機能153は、変換部の一例である。
Specifically, in the present embodiment, the processing circuit 150 has an acquisition function 151, a display control function 152, and a conversion function 153. The display control function 152 is an example of a display control unit. The conversion function 153 is an example of a conversion unit.
ここで、表示制御機能152は、診療データごとに定義されたデータ表示形式に対応付けられた次元を有する診療データ空間に基づいて、診療データを表示する。そして、変換機能153は、診療データ空間上で、指定された変換基準点を基準にして空間変換を行うことで、表示制御機能152によって表示される診療データの表示を切り替える。なお、本実施形態では、診療データ空間は、幅、深さ及び時間の三つの次元を有する。
Here, the display control function 152 displays medical data based on a medical data space having a dimension associated with a data display format defined for each medical data. Then, the conversion function 153 switches the display of the medical data displayed by the display control function 152 by performing spatial conversion with reference to the specified conversion reference point on the medical data space. In the present embodiment, the medical data space has three dimensions of width, depth, and time.
ここで、「幅」は、データ種別を示す。また、「深さ」は、データ解釈分類を示す。なお、ここでいう「データ解釈分類」は、例えば、DIKWモデルによって定義される。DIKWモデルでは、データがData、Information、Knowledge、Wisdomの4つに分類され、Data、Information、Knowledge、Wisdomの順に、データ量が減少し、情報としての価値が増加する。例えば、画像や数値等の生データはDataに相当し、レポート等のデータの高度な解釈が既に入ったものはKnowledgeやWisdomに相当する。
Here, “width” indicates the data type. “Depth” indicates a data interpretation classification. The “data interpretation classification” here is defined by, for example, a DIKW model. In the DIKW model, data is classified into four types, Data, Information, Knowledge, and Wisdom. The amount of data decreases and the value as information increases in the order of Data, Information, Knowledge, and Wisdom. For example, raw data such as images and numerical values corresponds to Data, and data that already includes a high level interpretation of data such as reports corresponds to Knowledge and Wisdom.
このように、本実施形態では、指定された変換基準点を基準にして空間変換を行って診療データの表示を切り替えることで、現在表示されている情報を起点として診療データを多角的に閲覧することができるようにしている。これにより、本実施形態によれば、臨床的な検討目的に応じて、適切な表示形式で診療データを提示することができる。
As described above, in the present embodiment, the medical data is browsed from various points of view with the currently displayed information as a starting point by performing spatial conversion on the basis of the designated conversion reference point and switching the display of the medical data. To be able to. Thus, according to the present embodiment, medical data can be presented in an appropriate display format according to the purpose of clinical examination.
なお、処理回路150が有する各処理機能は、例えば、コンピュータによって実行可能なプログラムの形態で記憶回路120に記憶される。処理回路150は、各プログラムを記憶回路120から読み出し、読み出した各プログラムを実行することで、各プログラムに対応する処理機能を実現する。換言すると、各プログラムを読み出した状態の処理回路150は、図1に示した各処理機能を有することとなる。
Each processing function of the processing circuit 150 is stored in the storage circuit 120 in the form of a program that can be executed by a computer, for example. The processing circuit 150 reads each program from the storage circuit 120 and executes each read program, thereby realizing a processing function corresponding to each program. In other words, the processing circuit 150 in a state where each program is read has the processing functions shown in FIG.
以下、上述した処理回路150が有する各機能について、詳細に説明する。
Hereinafter, each function of the processing circuit 150 described above will be described in detail.
取得機能151は、HIS300、RIS400、PACS500、及び、医用画像診断装置600から各種の診療データを取得し、取得した診療データを、記憶回路120によって構築されている統合診療DB(Data Base)に記憶させる。例えば、取得機能151は、診療データとして、患者情報、オーダ情報、オーダ実施情報、画像検査情報、各種計測情報等の診療に関する情報を取得する。なお、取得機能151によって取得される情報は、HIS300、RIS400、PACS500、及び、医用画像診断装置600によって保持されている情報そのものでもよいし、それらの情報を統合した情報であってもよいし、2次利用を目的として作成された情報であってもよい。
The acquisition function 151 acquires various medical data from the HIS 300, the RIS 400, the PACS 500, and the medical image diagnostic apparatus 600, and stores the acquired medical data in an integrated medical DB (Data Base) constructed by the storage circuit 120. Let For example, the acquisition function 151 acquires medical information such as patient information, order information, order execution information, image examination information, and various measurement information as medical data. Note that the information acquired by the acquisition function 151 may be information held by the HIS 300, the RIS 400, the PACS 500, and the medical image diagnostic apparatus 600, or may be information obtained by integrating these information. It may be information created for the purpose of secondary use.
例えば、取得機能151が上述した診療データをHIS300、RIS400、PACS500、及び、医用画像診断装置600から取得する処理は、以下で説明する表示制御機能152及び変換機能153によって行われる処理とは非同期で実施される。なお、取得機能151によって行われる処理は、例えば、処理回路150が取得機能151に対応する所定のプログラムを記憶回路120から読み出して実行することにより実現される。
For example, the process in which the acquisition function 151 acquires the above-described medical data from the HIS 300, the RIS 400, the PACS 500, and the medical image diagnostic apparatus 600 is asynchronous with the process performed by the display control function 152 and the conversion function 153 described below. To be implemented. Note that the processing performed by the acquisition function 151 is realized, for example, when the processing circuit 150 reads a predetermined program corresponding to the acquisition function 151 from the storage circuit 120 and executes it.
ここで、統合診療DBは、診療データの種類ごとに用意された複数のテーブルを有する。例えば、統合診療DBは、投薬テーブル、投薬サマリテーブル、画像テーブル、画像計測値テーブル、読影レポートテーブル、心電図テーブル、心電図計測値テーブル、心電図レポートテーブル、バイタルテーブル、バイタルサマリテーブル、看護記録テーブル、検体検査テーブル、検体検査サマリテーブル、及び、検体検査レポートテーブルを有する。
Here, the integrated medical care DB has a plurality of tables prepared for each type of medical care data. For example, the integrated medical treatment DB includes a medication table, a medication summary table, an image table, an image measurement value table, an interpretation report table, an electrocardiogram table, an electrocardiogram measurement value table, an electrocardiogram report table, a vital table, a vital summary table, a nursing record table, a sample It has a test table, a sample test summary table, and a sample test report table.
なお、投薬テーブル及び投薬サマリテーブルは、オーダ情報又はオーダ実施情報に基づくテーブルの一例である。また、ここで説明した画像テーブル、画像計測値テーブル及び読影レポートテーブルは、画像検査情報に基づくテーブルの一例である。また、心電図テーブル、心電図計測値テーブル、心電図レポートテーブル、バイタルテーブル、バイタルサマリテーブル、看護記録テーブル、検体検査テーブル、検体検査サマリテーブル、及び、検体検査レポートテーブルは、各種計測情報に基づくテーブルの一例である。
Note that the medication table and the medication summary table are examples of tables based on order information or order execution information. The image table, the image measurement value table, and the interpretation report table described here are examples of tables based on image inspection information. In addition, the electrocardiogram table, the electrocardiogram measurement value table, the electrocardiogram report table, the vital table, the vital summary table, the nursing record table, the specimen examination table, the specimen examination summary table, and the specimen examination report table are examples of tables based on various measurement information. It is.
図3は、第1の実施形態に係る投薬テーブルの一例を示す図である。ここで、投薬テーブルは、患者に対して行われた投薬に関する診療データを記憶する。
FIG. 3 is a diagram showing an example of a medication table according to the first embodiment. Here, the medication table stores medical data regarding medication administered to the patient.
例えば、図3に示すように、投薬テーブルは、投薬IDと、日時と、データとを対応付けた情報を記憶する。投薬IDには、投薬に関する診療データを一意に識別する識別情報が設定される。日時には、当該投薬が実施された日時が設定される。データには、当該投薬が行われた薬剤を示す情報が設定される。なお、例えば、投薬テーブルは、薬剤の種類ごとに用意される。
For example, as shown in FIG. 3, the medication table stores information in which a medication ID, date and data are associated with each other. In the medication ID, identification information for uniquely identifying medical data related to medication is set. At the time of day, the date and time when the medication is performed is set. In the data, information indicating the drug that has been administered is set. For example, a medication table is prepared for each type of medicine.
図4は、第1の実施形態に係る投薬サマリテーブルの一例を示す図である。ここで、投薬サマリテーブルは、患者に対して複数の時点で行われた投薬をまとめた投薬サマリデータに関する診療データを記憶する。
FIG. 4 is a diagram showing an example of a medication summary table according to the first embodiment. Here, the medication summary table stores medical data related to medication summary data that summarizes medications administered to a patient at a plurality of times.
例えば、図4に示すように、投薬サマリテーブルは、投薬サマリIDと、オーダIDとを対応付けた情報を記憶する。投薬サマリIDには、投薬サマリデータを一意に識別する識別情報が設定される。オーダIDには、当該投薬サマリデータに含まれる各投薬の投薬IDが設定される。
For example, as shown in FIG. 4, the medication summary table stores information in which a medication summary ID is associated with an order ID. In the medication summary ID, identification information for uniquely identifying medication summary data is set. In the order ID, a medication ID of each medication included in the medication summary data is set.
なお、オーダ情報又はオーダ実施情報に基づくテーブルとしては、投薬テーブル及び投薬サマリテーブル以外にも、例えば、画像、食事、リハビリ、手術、血管内治療、放射線治療等の各種オーダに関するテーブルや、当該各種オーダの実施に関するテーブルが、さらに統合診療DBに含まれてもよい。
As the table based on the order information or the order execution information, in addition to the medication table and the medication summary table, for example, tables relating to various orders such as images, meals, rehabilitation, surgery, endovascular treatment, radiotherapy, etc. A table regarding the execution of the order may be further included in the integrated medical care DB.
図5は、第1の実施形態に係る画像テーブルの一例を示す図である。ここで、画像テーブルは、患者を撮像した画像に関する診療データを記憶する。
FIG. 5 is a diagram illustrating an example of an image table according to the first embodiment. Here, the image table stores medical data regarding an image obtained by imaging a patient.
例えば、図5に示すように、画像テーブルは、画像IDと、日時と、データとを対応付けた情報を記憶する。画像IDには、画像に関する診療データを一意に識別する識別情報が設定される。日時には、当該画像が撮像された日時が設定される。データには、当該画像の画像データが設定される。なお、ここでいう画像は、医用画像診断装置600(例えば、X線診断装置、X線CT装置、MRI装置、超音波診断装置、SPECT装置、PET装置等の各種医用画像診断装置、SPECT装置とX線CT装置とが一体化されたSPECT-CT装置、PET装置とX線CT装置とが一体化されたPET-CT装置、又はこれらの装置群等)によって撮像された医用画像である。また、ここでいう画像は、例えば、DICOM(Digital Imaging and Communication in Medicine)画像(dcm)、PNG(Portable Network Graphics)画像、JPEG(Joint Photographic Experts Group)画像等の形式で生成されたものである。また、ここでいう画像は、静止画であってもよいし、動画であってもよい。
For example, as shown in FIG. 5, the image table stores information in which an image ID, a date and time, and data are associated with each other. In the image ID, identification information for uniquely identifying medical data regarding the image is set. At the time of day, the date and time when the image is captured is set. In the data, image data of the image is set. The image referred to here is a medical image diagnostic apparatus 600 (for example, an X-ray diagnostic apparatus, an X-ray CT apparatus, an MRI apparatus, an ultrasonic diagnostic apparatus, a SPECT apparatus, a PET apparatus, etc.) SPECT-CT apparatus in which the X-ray CT apparatus is integrated, PET-CT apparatus in which the PET apparatus and the X-ray CT apparatus are integrated, or a group of these devices). In addition, the image referred to here is, for example, generated in a format such as DICOM (Digital Imaging and Communication in Medicine) image (dcm), PNG (Portable Network Graphics) image, JPEG (Joint Photographic Experts Group) image, etc. . Further, the image referred to here may be a still image or a moving image.
図6は、第1の実施形態に係る画像計測値テーブルの一例を示す図である。ここで、画像計測値テーブルは、患者を撮像した画像に基づいて計測された計測値に関する診療データを記憶する。
FIG. 6 is a diagram illustrating an example of an image measurement value table according to the first embodiment. Here, the image measurement value table stores medical data related to measurement values measured based on an image obtained by imaging a patient.
例えば、図6に示すように、画像計測値テーブルは、計測値IDと、画像IDと、計測種と、データとを対応付けた情報を記憶する。計測値IDには、画像の計測値に関する診療データを一意に識別する識別情報が設定される。画像IDには、当該計測値の計測に用いられた画像を一意に識別する識別情報が設定される。計測種には、当該計測値の種類(例えば、腫瘍直径、血管径、流量等)を示す情報が設定される。データには、当該計測値が設定される。
For example, as shown in FIG. 6, the image measurement value table stores information in which a measurement value ID, an image ID, a measurement type, and data are associated with each other. In the measurement value ID, identification information for uniquely identifying the medical data related to the measurement value of the image is set. In the image ID, identification information for uniquely identifying an image used for measurement of the measurement value is set. In the measurement type, information indicating the type of the measurement value (eg, tumor diameter, blood vessel diameter, flow rate, etc.) is set. The measurement value is set in the data.
図7は、第1の実施形態に係る読影レポートテーブルの一例を示す図である。ここで、読影レポートテーブルは、患者を撮像した画像に基づいて作成された読影レポートに関する診療データを記憶する。
FIG. 7 is a diagram showing an example of an interpretation report table according to the first embodiment. Here, the interpretation report table stores medical data related to an interpretation report created based on an image obtained by imaging a patient.
例えば、図7に示すように、読影レポートテーブルは、読影レポートIDと、画像IDと、レポートとを対応付けた情報を記憶する。読影レポートIDには、読影レポートに関する診療データを一意に識別する識別情報が設定される。画像IDには、当該読影レポートの作成に用いられた画像を一意に識別する識別情報が設定される。レポートには、当該読影レポートの文書データが設定される。なお、ここでいう読影レポートの文書データは、doc形式以外の各種ドキュメント形式、又はテキスト形式であってもよい。
For example, as shown in FIG. 7, the interpretation report table stores information in which an interpretation report ID, an image ID, and a report are associated with each other. In the interpretation report ID, identification information for uniquely identifying medical data related to the interpretation report is set. In the image ID, identification information for uniquely identifying the image used for creating the interpretation report is set. In the report, the document data of the interpretation report is set. The document data of the interpretation report referred to here may be in various document formats other than the doc format or in a text format.
図8は、第1の実施形態に係る心電図テーブルの一例を示す図である。ここで、心電図テーブルは、検査で計測された患者の心電図に関する診療データを記憶する。
FIG. 8 is a diagram showing an example of an electrocardiogram table according to the first embodiment. Here, the electrocardiogram table stores medical data related to the patient's electrocardiogram measured in the examination.
例えば、図8に示すように、心電図テーブルは、心電図IDと、日時と、データとを対応付けた情報を記憶する。心電図IDには、心電図に関する診療データを一意に識別する識別情報が設定される。日時には、当該心電図が計測された日時が設定される。データには、当該心電図の画像データが設定される。なお、ここでいう心電図は、例えば、PNG画像、JPEG画像等の形式で生成されたものである。また、ここでいう心電図は、MFER(Medical waveform Format Encoding Rules)やCSV(Comma Separated Value)で表現される波形データであってもよい。
For example, as shown in FIG. 8, the electrocardiogram table stores information in which an electrocardiogram ID, a date and time, and data are associated with each other. In the electrocardiogram ID, identification information for uniquely identifying medical data related to the electrocardiogram is set. At the time of day, the date and time when the electrocardiogram is measured is set. In the data, image data of the electrocardiogram is set. The electrocardiogram here is generated in a format such as a PNG image or a JPEG image, for example. Moreover, the electrocardiogram here may be waveform data expressed by MFER (Medical waveform Format Encoding Rules) or CSV (Comma Separated Value).
図9は、第1の実施形態に係る心電図計測値テーブルの一例を示す図である。ここで、心電図計測値テーブルは、患者の心電図に基づいて計測された計測値に関する診療データを記憶する。
FIG. 9 is a diagram showing an example of an electrocardiogram measurement value table according to the first embodiment. Here, the electrocardiogram measurement value table stores medical data related to the measurement values measured based on the patient's electrocardiogram.
例えば、図9に示すように、心電図計測値テーブルは、計測値IDと、心電図IDと、計測種と、データとを対応付けた情報を記憶する。計測値IDには、心電図の計測値に関する診療データを一意に識別する識別情報が設定される。心電図IDには、当該計測値の計測に用いられた心電図を一意に識別する識別情報が設定される。計測種には、当該計測値の種類(例えば、心拍数、P波高さ、P波幅等)を示す情報が設定される。データには、当該計測値が設定される。
For example, as shown in FIG. 9, the electrocardiogram measurement value table stores information in which a measurement value ID, an electrocardiogram ID, a measurement type, and data are associated with each other. In the measurement value ID, identification information for uniquely identifying medical data related to the measurement value of the electrocardiogram is set. In the electrocardiogram ID, identification information for uniquely identifying the electrocardiogram used for measuring the measurement value is set. In the measurement type, information indicating the type of the measurement value (for example, heart rate, P wave height, P wave width, etc.) is set. The measurement value is set in the data.
図10は、第1の実施形態に係る心電図レポートテーブルの一例を示す図である。ここで、心電図レポートテーブルは、患者の心電図に基づいて作成された心電図レポートに関する診療データを記憶する。
FIG. 10 is a diagram showing an example of an electrocardiogram report table according to the first embodiment. Here, the electrocardiogram report table stores medical data related to the electrocardiogram report created based on the electrocardiogram of the patient.
例えば、図10に示すように、心電図レポートテーブルは、心電図レポートIDと、心電図IDと、レポートとを対応付けた情報を記憶する。心電図レポートIDには、心電図レポートに関する診療データを一意に識別する識別情報が設定される。心電図IDには、当該心電図レポートの作成に用いられた心電図を一意に識別する識別情報が設定される。レポートには、当該心電図レポートの文書データが設定される。なお、ここでいう心電図レポートの文書データは、doc形式以外の各種ドキュメント形式、又はテキスト形式であってもよい。
For example, as shown in FIG. 10, the electrocardiogram report table stores information in which an electrocardiogram report ID, an electrocardiogram ID, and a report are associated with each other. In the electrocardiogram report ID, identification information for uniquely identifying medical data related to the electrocardiogram report is set. In the electrocardiogram ID, identification information for uniquely identifying the electrocardiogram used for creating the electrocardiogram report is set. The document data of the electrocardiogram report is set in the report. The ECG report document data here may be in various document formats other than the doc format, or in a text format.
図11は、第1の実施形態に係るバイタルテーブルの一例を示す図である。ここで、バイタルテーブルは、検査で計測された患者のバイタルに関する診療データを記憶する。
FIG. 11 is a diagram illustrating an example of a vital table according to the first embodiment. Here, a vital table memorize | stores the medical data regarding the vital of a patient measured by the test | inspection.
例えば、図11に示すように、バイタルテーブルは、バイタルIDと、日時と、データとを対応付けた情報を記憶する。バイタルIDには、バイタルに関する診療データを一意に識別する識別情報が設定される。日時には、当該バイタルの計測が行われた日時が設定される。データには、当該バイタルの計測値(例えば、血圧、脈拍、体温等)が設定される。
For example, as shown in FIG. 11, the vital table stores information in which a vital ID, a date and time, and data are associated with each other. In the vital ID, identification information for uniquely identifying the medical data related to the vital is set. At the date and time, the date and time when the vital measurement is performed is set. In the data, the measured value of the vital (for example, blood pressure, pulse, body temperature, etc.) is set.
図12は、第1の実施形態に係るバイタルサマリテーブルの一例を示す図である。ここで、バイタルサマリテーブルは、患者から複数の時点で計測されたバイタルをまとめたバイタルサマリデータに関する診療データを記憶する。
FIG. 12 is a diagram illustrating an example of a vital summary table according to the first embodiment. Here, the vital summary table stores medical data related to vital summary data in which vitals measured at a plurality of times from a patient are collected.
例えば、図12に示すように、バイタルサマリテーブルは、バイタルサマリIDと、バイタルIDとを対応付けた情報を記憶する。バイタルサマリIDには、バイタルサマリデータを一意に識別する識別情報が設定される。バイタルIDには、当該バイタルサマリデータに含まれる各バイタルのバイタルIDが設定される。
For example, as shown in FIG. 12, the vital summary table stores information in which a vital summary ID is associated with a vital ID. In the vital summary ID, identification information for uniquely identifying vital summary data is set. In the vital ID, the vital ID of each vital included in the vital summary data is set.
図13は、第1の実施形態に係る看護記録テーブルの一例を示す図である。ここで、看護記録テーブルは、患者のバイタルに基づいて作成された看護記録に関する診療データを記憶する。
FIG. 13 is a diagram showing an example of a nursing record table according to the first embodiment. Here, the nursing record table stores medical data relating to nursing records created based on patient vitals.
例えば、図13に示すように、看護記録テーブルは、看護記録IDと、バイタルIDと、レポートとを対応付けた情報を記憶する。看護記録IDには、看護記録に関する診療データを一意に識別する識別情報が設定される。バイタルIDには、当該看護記録の作成に用いられたバイタルを一意に識別する識別情報が設定される。レポートには、当該看護記録の文書データが設定される。なお、ここでいう看護記録の文書データは、doc形式以外の各種ドキュメント形式、又はテキスト形式であってもよい。
For example, as shown in FIG. 13, the nursing record table stores information in which a nursing record ID, a vital ID, and a report are associated with each other. In the nursing record ID, identification information for uniquely identifying medical data related to the nursing record is set. In the vital ID, identification information for uniquely identifying the vital used to create the nursing record is set. Document data of the nursing record is set in the report. Note that the nursing record document data here may be in various document formats other than the doc format, or in a text format.
図14は、第1の実施形態に係る検体検査テーブルの一例を示す図である。ここで、検体検査テーブルは、患者の検体検査に関する診療データを記憶する。
FIG. 14 is a diagram illustrating an example of a specimen test table according to the first embodiment. Here, the sample test table stores medical data related to patient sample tests.
例えば、図14に示すように、検体検査テーブルは、検体検査IDと、日時と、データとを対応付けた情報を記憶する。検体検査IDには、検体検査に関する診療データを一意に識別する識別情報が設定される。日時には、当該検体検査が行われた日時が設定される。データには、当該検体検査の計測値(例えば、尿酸(UA)、総タンパク(TP)等の計測値)が設定される。
For example, as shown in FIG. 14, the sample test table stores information in which a sample test ID, date and data are associated with each other. In the specimen test ID, identification information for uniquely identifying medical data related to the specimen test is set. At the time of day, the date and time when the sample test is performed is set. In the data, measurement values of the sample test (for example, measurement values of uric acid (UA), total protein (TP), etc.) are set.
図15は、第1の実施形態に係る検体検査サマリテーブルの一例を示す図である。ここで、検体検査サマリテーブルは、患者に対して複数の時点で行われた検体検査をまとめた検体検査サマリデータに関する診療データを記憶する。
FIG. 15 is a diagram showing an example of a sample test summary table according to the first embodiment. Here, the sample test summary table stores medical data related to sample test summary data that summarizes sample tests performed on a patient at a plurality of points in time.
例えば、図15に示すように、検体検査サマリテーブルは、検体検査サマリIDと、検体検査IDとを対応付けた情報を記憶する。検体検査サマリIDには、検体検査サマリデータを一意に識別する識別情報が設定される。検体検査IDには、当該検体検査サマリデータに含まれる各検体検査の検体検査IDが設定される。
For example, as shown in FIG. 15, the sample test summary table stores information in which a sample test summary ID is associated with a sample test ID. In the sample test summary ID, identification information for uniquely identifying the sample test summary data is set. In the sample test ID, a sample test ID of each sample test included in the sample test summary data is set.
図16は、第1の実施形態に係る検体検査レポートテーブルの一例を示す図である。ここで、検体検査レポートテーブルは、患者の検体検査に基づいて作成された検体検査レポートに関する診療データを記憶する。
FIG. 16 is a diagram showing an example of a specimen test report table according to the first embodiment. Here, the specimen test report table stores medical data related to the specimen test report created based on the patient specimen test.
例えば、図16に示すように、検体検査レポートテーブルは、検体検査レポートIDと、検体検査IDと、レポートとを対応付けた情報を記憶する。検体検査レポートIDには、検体検査レポートに関する診療データを一意に識別する識別情報が設定される。検体検査IDには、当該検体検査レポートの作成に用いられた検体検査を一意に識別する識別情報が設定される。レポートには、当該検体検査レポートの文書データが設定される。なお、ここでいう検体検査レポートの文書データは、doc形式以外の各種ドキュメント形式、又はテキスト形式であってもよい。
For example, as shown in FIG. 16, the sample test report table stores information in which a sample test report ID, a sample test ID, and a report are associated with each other. In the specimen test report ID, identification information for uniquely identifying medical data related to the specimen test report is set. In the sample test ID, identification information for uniquely identifying the sample test used to create the sample test report is set. In the report, document data of the sample test report is set. Note that the document data of the specimen test report here may be in various document formats other than the doc format or in a text format.
ここで、本実施形態では、上述した各診療データについて、それぞれの閲覧に適したデータ表示形式が定義される。具体的には、データ表示形式は、診療データと、当該診療データを表示する際の具体的な表示形式(例えば、表形式や時系列形式、画像表示形式、心電図表示形式、レポート表示形式等)を示すパネルとの組み合わせによって定義される。
Here, in this embodiment, a data display format suitable for each browsing is defined for each medical data described above. Specifically, the data display format includes medical data and a specific display format for displaying the medical data (for example, table format, time series format, image display format, electrocardiogram display format, report display format, etc.) It is defined by the combination with the panel showing.
そして、本実施形態では、診療データごとに定義される各データ表示形式は、臨床的な検討目的に応じた様々な観点で分類される。
And in this embodiment, each data display format defined for every medical data is classified from various viewpoints according to the clinical examination purpose.
図17は、第1の実施形態に係るデータ表示形式の分類の一例を示す図である。
FIG. 17 is a diagram illustrating an example of the classification of the data display format according to the first embodiment.
例えば、図17における上下方向に示すように、各データ表示形式は、介入に関するデータ表示形式と、レスポンスに関するデータ表示形式とに分類される。また、介入に関するデータ表示形式は、投薬に関するデータ表示形式にさらに分類され、投薬に関するデータ表示形式は、薬剤の種類ごとにさらに分類される。また、レスポンスに関するデータ表示形式は、画像に関するデータ表示形式と、心電図に関するデータ表示形式と、バイタルに関するデータ表示形式と、検体検査に関するデータ表示形式とにさらに分類される。
For example, as shown in the vertical direction in FIG. 17, each data display format is classified into a data display format related to intervention and a data display format related to response. The data display format related to intervention is further classified into a data display format related to medication, and the data display format related to medication is further classified according to the type of drug. Further, the data display format related to the response is further classified into a data display format related to the image, a data display format related to the electrocardiogram, a data display format related to the vitals, and a data display format related to the specimen examination.
また、別の観点で、例えば、図17における左右方向に示すように、各データ表示形式は、客観データに関するデータ表示形式と、主観データに関するデータ表示形式とに分類される。また、客観データに関するデータ表示形式は、生データに関するデータ表示形式と、加工データに関するデータ表示形式とにさらに分類され、主観データに関するデータ表示形式は、文字データに関するデータ表示形式にさらに分類される。
Further, from another viewpoint, for example, as shown in the horizontal direction in FIG. 17, each data display format is classified into a data display format related to objective data and a data display format related to subjective data. The data display format related to objective data is further classified into a data display format related to raw data and a data display format related to processed data, and the data display format related to subjective data is further classified into a data display format related to character data.
また、さらに別の観点で、例えば、図17における右上がりの斜めの方向に示すように、各データ表示形式は、時系列の時点ごとに分けられて分類される。
Further, from another point of view, for example, as shown in the diagonally upward direction in FIG. 17, each data display format is classified and classified for each time point in time series.
ここで、例えば、上述した投薬テーブルに記憶される診療データのデータ表示形式は、図17の上から1行目及び左から1列目に示すように、投薬及び生データに関するデータ表示形式として分類され、さらに、時系列の時点ごとに分けられて分類される。また、上述した投薬サマリテーブルに記憶される診療データのデータ表示形式は、図17の上から1行目及び左から2列目に示すように、投薬及び加工データに関するデータ表示形式として分類され、複数の時点の投薬をまとめたデータ形式として分類される。
Here, for example, the data display format of the medical data stored in the above-described medication table is classified as a data display format related to medication and raw data as shown in the first row from the top and the first column from the left in FIG. Furthermore, it is divided and classified for each time point in time series. Further, the data display format of the medical data stored in the above-mentioned medication summary table is classified as a data display format related to medication and processing data as shown in the first row from the top and the second column from the left in FIG. It is classified as a data format that summarizes medications from multiple time points.
また、上述した画像テーブルに記憶される診療データのデータ表示形式は、図17の上から2行目及び左から1列目に示すように、画像及び生データに関するデータ表示形式として分類され、さらに、時系列の時点ごとに分けられて分類される。また、上述した画像計測値テーブルに記憶される診療データのデータ表示形式は、図17の上から2行目及び左から2列目に示すように、画像及び加工データに関するデータ表示形式として分類され、時系列の時点ごとに分けられて分類される。また、上述した読影レポートテーブルに記憶される診療データのデータ表示形式は、図17の上から2行目及び左から3列目に示すように、画像及び文字データに関するデータ表示形式として分類され、時系列の時点ごとに分けられて分類される。
Further, the data display format of the medical data stored in the image table described above is classified as a data display format related to images and raw data, as shown in the second row from the top and the first column from the left in FIG. The time series is divided and classified. Further, the data display format of the medical data stored in the above-described image measurement value table is classified as a data display format related to images and processed data as shown in the second row from the top and the second column from the left in FIG. The time series is divided and classified. The data display format of the medical data stored in the above-described interpretation report table is classified as a data display format related to image and character data, as shown in the second row from the top and the third column from the left in FIG. They are classified by time points.
また、上述した心電図テーブルに記憶される診療データのデータ表示形式は、図17の上から3行目及び左から1列目に示すように、心電図及び生データに関するデータ表示形式として分類され、さらに、時系列の時点ごとに分けられて分類される。また、上述した心電図計測値テーブルに記憶される診療データのデータ表示形式は、図17の上から3行目及び左から2列目に示すように、心電図及び加工データに関するデータ表示形式として分類され、時系列の時点ごとに分けられて分類される。また、上述した心電図レポートテーブルに記憶される診療データのデータ表示形式は、図17の上から3行目及び左から3列目に示すように、心電図及び文字データに関するデータ表示形式として分類され、時系列の時点ごとに分けられて分類される。
The data display format of the medical data stored in the above-described ECG table is classified as a data display format related to the ECG and raw data, as shown in the third row from the top and the first column from the left in FIG. The time series is divided and classified. Further, the data display format of the medical data stored in the above-described electrocardiogram measurement value table is classified as a data display format relating to the electrocardiogram and the processed data as shown in the third row from the top and the second column from the left in FIG. The time series is divided and classified. Further, the data display format of the medical data stored in the above-described ECG report table is classified as a data display format related to the ECG and character data, as shown in the third row from the top and the third column from the left in FIG. They are classified by time points.
また、上述したバイタルテーブルに記憶される診療データのデータ表示形式は、図17の上から4行目及び左から1列目に示すように、バイタル及び生データに関するデータ表示形式として分類され、さらに、時系列の時点ごとに分けられて分類される。また、上述したバイタルサマリテーブルに記憶される診療データのデータ表示形式は、図17の上から4行目及び左から2列目に示すように、バイタル及び加工データに関するデータ表示形式として分類され、複数の時点のバイタルの計測値をまとめたデータ形式として分類される。また、上述した看護記録テーブルに記憶される診療データのデータ表示形式は、図17の上から4行目及び左から3列目に示すように、バイタル及び文字データに関するデータ表示形式として分類され、時系列の時点ごとに分けられて分類される。
Further, the data display format of the medical data stored in the vital table described above is classified as a data display format related to vital and raw data as shown in the fourth row from the top and the first column from the left in FIG. The time series is divided and classified. Moreover, the data display format of the medical data stored in the vital summary table described above is classified as a data display format related to vital and processed data, as shown in the fourth row from the top and the second column from the left in FIG. It is classified as a data format that summarizes the measured values of vitals at multiple points in time. Further, the data display format of the medical data stored in the above-described nursing record table is classified as a data display format related to vital and character data, as shown in the fourth row from the top and the third column from the left in FIG. They are classified by time points.
また、上述した検体検査テーブルに記憶される診療データのデータ表示形式は、図17の上から5行目及び左から1列目に示すように、検体検査及び生データに関するデータ表示形式として分類され、さらに、時系列の時点ごとに分けられて分類される。また、上述した検体検査サマリテーブルに記憶される診療データのデータ表示形式は、図17の上から5行目及び左から2列目に示すように、検体検査及び加工データに関するデータ表示形式として分類され、複数の時点の検体検査の計測値をまとめたデータ形式として分類される。また、上述した検体検査レポートテーブルに記憶される診療データのデータ表示形式は、図17の上から5行目及び左から3列目に示すように、検体検査及び文字データに関するデータ表示形式として分類され、時系列の時点ごとに分けられて分類される。
Further, the data display format of the medical data stored in the above-described sample test table is classified as the data display format related to the sample test and raw data as shown in the fifth row from the top and the first column from the left in FIG. Further, the time series are divided and classified. Further, the data display format of the medical data stored in the above-described sample test summary table is classified as a data display format related to sample test and processing data as shown in the fifth row from the top and the second column from the left in FIG. Then, it is classified as a data format in which the measurement values of the specimen tests at a plurality of time points are collected. The data display format of the medical data stored in the above-described sample test report table is classified as a data display format related to the sample test and character data as shown in the fifth row from the top and the third column from the left in FIG. And are divided and classified for each time point in time series.
そして、本実施形態では、記憶回路120が、上述したデータ表示形式の分類に応じて、各データ表示形式を診療データ空間上の座標に対応付けるためのマスタを記憶する。前述したように、本実施形態では、診療データ空間は、幅、深さ及び時間の三つの次元を有しており、それぞれの次元に対応する三つの座標軸で定義される。すなわち、診療データ空間は、座標軸として、データ種別、時間、データ解釈分類の3軸を有する空間である。
In this embodiment, the storage circuit 120 stores a master for associating each data display format with coordinates in the medical data space according to the above-described classification of the data display format. As described above, in this embodiment, the medical data space has three dimensions of width, depth, and time, and is defined by three coordinate axes corresponding to each dimension. That is, the medical data space is a space having three axes of data type, time, and data interpretation classification as coordinate axes.
例えば、記憶回路120は、データ表示形式マスタと、表示座標マスタとを記憶する。ここで、データ表示形式マスタは、統合診療DBに記憶されている診療データをどのような形式(以下、パネルと呼ぶ)で表示するかを示す情報を記憶する。例えば、データ表示形式マスタは、パネルマスタテーブルと、データ表示テーブルとを含む。また、表示座標マスタは、どのパネル及び診療データがどの座標に相当するかのマッピングを示す情報を記憶する。例えば、表示座標マスタは、表示座標マスタテーブルを含む。
For example, the storage circuit 120 stores a data display format master and a display coordinate master. Here, the data display format master stores information indicating in what format (hereinafter referred to as a panel) the medical data stored in the integrated medical DB. For example, the data display format master includes a panel master table and a data display table. Further, the display coordinate master stores information indicating mapping of which panel and medical data correspond to which coordinate. For example, the display coordinate master includes a display coordinate master table.
図18は、第1の実施形態に係るパネルマスタテーブルの一例を示す図である。ここで、パネルマスタテーブルは、診療データを表示するための各種のパネルに関する情報を記憶する。
FIG. 18 is a diagram illustrating an example of a panel master table according to the first embodiment. Here, the panel master table stores information on various panels for displaying medical data.
例えば、図18に示すように、パネルマスタテーブルは、パネルIDと、パネルとを対応付けた情報を記憶する。パネルIDには、パネルを一意に識別する識別情報が設定される。パネルには、パネルの具体的な形式が設定される。
For example, as shown in FIG. 18, the panel master table stores information in which a panel ID is associated with a panel. In the panel ID, identification information for uniquely identifying the panel is set. A specific form of the panel is set for the panel.
図19は、第1の実施形態に係るデータ表示テーブルの一例を示す図である。ここで、データ表示テーブルは、診療データとパネルとの組み合わせで定義されるデータ表示形式に関する情報を記憶する。
FIG. 19 is a diagram illustrating an example of a data display table according to the first embodiment. Here, the data display table stores information on the data display format defined by the combination of the medical data and the panel.
例えば、図19に示すように、データ表示テーブルは、データ表示IDと、パネルIDと、データIDとを対応付けた情報を記憶する。データ表示IDには、データ表示形式を一意に識別する識別情報が設定される。パネルIDには、当該データ表示形式で用いられるパネルのパネルIDが設定される。データIDには、当該データ表示形式で表示される診療データのデータIDが設定される。
For example, as shown in FIG. 19, the data display table stores information in which a data display ID, a panel ID, and a data ID are associated with each other. In the data display ID, identification information for uniquely identifying the data display format is set. In the panel ID, the panel ID of the panel used in the data display format is set. In the data ID, the data ID of medical data displayed in the data display format is set.
ここで、データIDには、前述した投薬ID(図3を参照)、投薬サマリID(図4を参照)、画像ID(図5を参照)、計測値ID(図6を参照)、読影レポートID(図7を参照)、心電図ID(図8を参照)、計測値ID(図9を参照)、心電図レポートID(図10を参照)、バイタルID(図11を参照)、バイタルサマリID(図12を参照)、看護記録ID(図13を参照)、検体検査ID(図14を参照)、検体検査サマリID(図15を参照)及び検体検査レポートID(図16を参照)のいずれかが設定される。これにより、統合診療DBが有する各テーブルに記憶されている診療データについて、それぞれをどのようなパネルで表示するかが定義される。
Here, the data ID includes the aforementioned medication ID (see FIG. 3), medication summary ID (see FIG. 4), image ID (see FIG. 5), measurement value ID (see FIG. 6), interpretation report. ID (see FIG. 7), electrocardiogram ID (see FIG. 8), measurement value ID (see FIG. 9), electrocardiogram report ID (see FIG. 10), vital ID (see FIG. 11), vital summary ID ( 12), nursing record ID (see FIG. 13), sample test ID (see FIG. 14), sample test summary ID (see FIG. 15), or sample test report ID (see FIG. 16) Is set. Thus, it is defined on which panel the medical data stored in each table of the integrated medical DB is displayed.
図20は、第1の実施形態に係る表示座標マスタテーブルの一例を示す図である。ここで、表示座標マスタテーブルは、診療データとパネルとの組み合わせで定義されるデータ表示形式ごとに診療データ空間上の座標を対応付けた情報を記憶する。これにより、診療データは、診療データ空間の座標軸に対応付けられたデータ構造を有するようになる。
FIG. 20 is a diagram illustrating an example of a display coordinate master table according to the first embodiment. Here, the display coordinate master table stores information in which coordinates in the medical data space are associated with each data display format defined by the combination of the medical data and the panel. Accordingly, the medical data has a data structure associated with the coordinate axes of the medical data space.
例えば、図20に示すように、表示座標マスタテーブルは、座標IDと、データ表示IDと、Width(幅)と、Time(時間)と、Depth(深さ)とを対応付けた情報を記憶する。座標IDには、診療データ空間上の座標を一意に識別する識別情報が設定される。データ表示IDには、当該座標に対応付けられたデータ表示形式のデータ表示IDが設定される。Width、Time及びDepthには、当該座標を示す座標値が設定される。
For example, as shown in FIG. 20, the display coordinate master table stores information in which a coordinate ID, a data display ID, a width (width), a time (time), and a depth (depth) are associated with each other. . In the coordinate ID, identification information for uniquely identifying coordinates in the medical data space is set. In the data display ID, a data display ID in a data display format associated with the coordinates is set. In Width, Time, and Depth, coordinate values indicating the coordinates are set.
ここで、例えば、図20に示す例において、座標ID「Coor0007」に対応付けられている座標値(1,(1,2,3),2)、及び、座標ID「Coor0008」に対応付けられている座標値(4,(2~6),2)は、それぞれ、診療データ空間上の時間方向に沿った線分を表している。また、座標ID「Coor0009」に対応付けられている座標値(5,*,2)は、診療データ空間上の時間方向に沿った線を表している。このように、Width、Time及びDepthのうちのいずれか一つの座標値に複数の座標値又は「*」を設定することで、診療データ空間上の線が示される。また、図20に示す他の情報に設定されている座標値のように、Width、Time及びDepthそれぞれに一つの数値を設定することで、診療データ空間上の点が示される。さらに、図20には例示していないが、Width、Time及びDepthのうちのいずれか二つの座標値に「*」を設定することで、診療データ空間上の面が示される。
Here, for example, in the example shown in FIG. 20, the coordinate value (1, (1, 2, 3), 2) associated with the coordinate ID “Coor0007” and the coordinate ID “Coor0008” are associated. Each coordinate value (4, (2-6), 2) represents a line segment along the time direction in the medical data space. Also, the coordinate values (5, *, 2) associated with the coordinate ID “Coor0009” represent lines along the time direction in the medical data space. As described above, by setting a plurality of coordinate values or “*” to any one coordinate value of Width, Time, and Depth, a line on the medical data space is indicated. Also, as in the coordinate values set in the other information shown in FIG. 20, by setting one numerical value for each of Width, Time, and Depth, a point on the medical data space is indicated. Furthermore, although not illustrated in FIG. 20, a plane in the medical data space is shown by setting “*” to any two coordinate values of Width, Time, and Depth.
図21は、第1の実施形態に係る表示座標マスタによるデータ表示形式と診療データ空間上の座標との対応付けの一例を示す図である。ここで、図21は、図17に示した各データ表示形式に対して診療データ空間上の座標を対応付けた場合の例を示している。
FIG. 21 is a diagram showing an example of the correspondence between the data display format by the display coordinate master according to the first embodiment and the coordinates in the medical data space. Here, FIG. 21 shows an example in which coordinates in the medical data space are associated with each data display format shown in FIG.
例えば、図21に示すように、表示座標マスタによって、診療データごとに定義された各データ表示形式に対して、それぞれの分類に応じて、診療データ空間上の座標(Width(幅),Time(時間),Depth(深さ))が対応付けられる。
For example, as shown in FIG. 21, the coordinates (Width (width), Time (in the medical data space) for each data display format defined for each medical data by the display coordinate master according to each classification. Time), Depth (depth)).
例えば、Width(幅)方向について、投薬、画像、心電図、バイタル、検体検査の順で座標値が大きくなるように、各データ表示形式に座標が対応付けられる。また、Depth(深さ)方向について、生データ、加工データ、文字データの順で座標値が大きくなるように、各データ表示形式に座標が対応付けられる。また、Time(時間)方向(図21における右上がりの斜めの方向)について、時系列の順に座標値が大きくなるように、各データ表示形式に座標が対応付けられる。
For example, in the Width direction, coordinates are associated with each data display format so that coordinate values increase in the order of medication, image, electrocardiogram, vital, and specimen test. In addition, in the Depth direction, coordinates are associated with each data display format so that coordinate values increase in the order of raw data, processed data, and character data. In addition, in the Time (time) direction (inclining direction toward the right in FIG. 21), the coordinates are associated with each data display format so that the coordinate values increase in order of time series.
なお、上述した例では、統合診療DBに保持される診療データが、生データ、加工データ、文字データごとにテーブルを有する場合の例を説明したが、実施形態はこれに限られない。例えば、統合診療DBは、これとは異なるテーブルの単位で、診療データを記憶してもよい。また、統合診療DBに保持される診療データは上述したものに限られず、他の各種の診療データが用いられてよい。
In the above-described example, the example in which the medical data held in the integrated medical DB has a table for each of the raw data, the processed data, and the character data has been described, but the embodiment is not limited thereto. For example, the integrated medical DB may store medical data in units of tables different from this. Further, the medical data held in the integrated medical DB is not limited to the above-described data, and other various medical data may be used.
図1に戻って、表示制御機能152及び変換機能153について説明する。
Referring back to FIG. 1, the display control function 152 and the conversion function 153 will be described.
表示制御機能152は、診療データごとに定義されたデータ表示形式に対応付けられた次元を有する診療データ空間に基づいて、診療データを表示する。また、変換機能153は、診療データ空間上で、指定された変換基準点を基準にして空間変換を行うことで、表示制御機能152によって表示される診療データの表示を切り替える。
The display control function 152 displays medical data based on a medical data space having a dimension associated with a data display format defined for each medical data. The conversion function 153 switches the display of the medical data displayed by the display control function 152 by performing spatial conversion on the basis of the designated conversion reference point in the medical data space.
図22は、第1の実施形態に係る表示制御機能152及び変換機能153によって行われる処理の流れを示すフローチャートである。ここで、図22は、表示制御機能152及び変換機能153によって行われる処理の全体的な流れを示している。
FIG. 22 is a flowchart showing a flow of processing performed by the display control function 152 and the conversion function 153 according to the first embodiment. Here, FIG. 22 shows an overall flow of processing performed by the display control function 152 and the conversion function 153.
例えば、図22に示すように、本実施形態では、表示制御機能152が、診療データの表示画面を表示する(ステップS11)。具体的には、表示制御機能152は、上述した診療データ空間に基づいて、診療データを表示するための表示画面を生成し、生成した表示画面をディスプレイ140に表示する。
For example, as shown in FIG. 22, in this embodiment, the display control function 152 displays a display screen of medical data (step S11). Specifically, the display control function 152 generates a display screen for displaying the medical data based on the above-described medical data space, and displays the generated display screen on the display 140.
また、変換機能153が、空間変換前の表示状態を取得する(ステップS12)。具体的には、変換機能153は、表示画面に表示中の情報、及び、操作者の画面操作に基づいて、空間変換前の表示状態(どの座標を表示しているのか、どの次元(点、線、面等)で表示しているのか)を取得する。ここで、空間変換前の表示状態は、診療データ空間上で、点、線又は平面で示される。なお、以下では、空間変換前の表示状態を「変換前状態」と呼ぶ。
Also, the conversion function 153 acquires the display state before the space conversion (step S12). Specifically, the conversion function 153 is based on the information being displayed on the display screen and the screen operation of the operator, and the display state before spatial conversion (which coordinate is displayed, which dimension (point, Is displayed in line, surface, etc.). Here, the display state before the space conversion is indicated by a point, a line, or a plane on the medical data space. Hereinafter, the display state before spatial conversion is referred to as “pre-conversion state”.
そして、変換機能153は、空間変換の基準点を取得する(ステップS13)。具体的には、変換機能153は、操作者の画面操作に基づいて、空間変換の基準点を取得する。ここで、空間変換の基準点は、診療データ空間上で、点、線又は面で示される。なお、以下では、空間変換の基準点を「変換基準点」と呼ぶ。
Then, the conversion function 153 acquires a reference point for spatial conversion (step S13). Specifically, the conversion function 153 acquires a reference point for spatial conversion based on the screen operation of the operator. Here, the reference point for space conversion is indicated by a point, a line, or a plane on the medical data space. Hereinafter, the reference point for spatial conversion is referred to as “conversion reference point”.
さらに、変換機能153は、空間変換の方向を取得する(ステップS14)。具体的には、変換機能153は、操作者の画面操作に基づいて、空間変換の方向を取得する。なお、以下では、空間変換の方向を「変換方向」と呼ぶ。
Furthermore, the conversion function 153 acquires the direction of spatial conversion (step S14). Specifically, the conversion function 153 acquires the direction of spatial conversion based on the screen operation of the operator. In the following, the direction of spatial conversion is referred to as “conversion direction”.
そして、変換機能153は、空間変換を行う(ステップS15)。具体的には、変換機能153は、取得した変換前状態、変換基準点及び変換方向と、表示座標マスタの情報とに基づいて、空間変換後の表示状態(どの座標を表示するか、どの次元(点、線、面等)で表示するか)を取得する。ここで、空間変換後の表示状態は、診療データ空間上で、点、線又は面で示される。なお、以下では、空間変換後の表示状態を「変換後状態」と呼ぶ。
And the conversion function 153 performs space conversion (step S15). Specifically, the conversion function 153 determines the display state (which coordinate is displayed, which dimension is to be displayed) based on the acquired pre-conversion state, conversion reference point and conversion direction, and display coordinate master information. (Do you want to display it as a point, line, surface, etc.)? Here, the display state after the space conversion is indicated by a point, a line, or a plane on the medical data space. In the following, the display state after spatial conversion is referred to as “post-conversion state”.
その後、表示制御機能152が、空間変換後の表示画面を表示する(ステップS16)。具体的には、表示制御機能152は、変換機能153による空間変換によって取得された変換後状態と、データ表示形式マスタ及び統合診療DBの情報とに基づいて、空間変換後の表示画面を生成し、生成した表示画面をディスプレイ140に表示する。
Thereafter, the display control function 152 displays the display screen after the space conversion (step S16). Specifically, the display control function 152 generates a display screen after spatial conversion based on the post-conversion state acquired by the spatial conversion by the conversion function 153 and the information of the data display format master and the integrated medical care DB. The generated display screen is displayed on the display 140.
なお、上述したステップS11及びS16の処理は、例えば、処理回路150が表示制御機能152に対応する所定のプログラムを記憶回路120から読み出して実行することにより実現される。また、上述したステップS12~S15の処理は、例えば、処理回路150が変換機能153に対応する所定のプログラムを記憶回路120から読み出して実行することにより実現される。
Note that the processing in steps S11 and S16 described above is realized, for example, by the processing circuit 150 reading and executing a predetermined program corresponding to the display control function 152 from the storage circuit 120. Further, the processing of steps S12 to S15 described above is realized, for example, when the processing circuit 150 reads a predetermined program corresponding to the conversion function 153 from the storage circuit 120 and executes it.
以下、上述した表示制御機能152及び変換機能153それぞれによって行われる処理について、より詳細に説明する。
Hereinafter, processing performed by each of the display control function 152 and the conversion function 153 described above will be described in more detail.
まず、表示制御機能152について説明する。表示制御機能152は、変換機能153によって取得される変換後状態と、データ表示形式マスタの情報とを用いて、変換後状態のデータ表示形式(レイアウト、診療データの種類等)を決定する。そして、表示制御機能152は、統合診療DBに保持されたデータを用いて表示画面を生成し、生成した表示画面をディスプレイ140に表示する。
First, the display control function 152 will be described. The display control function 152 uses the post-conversion state acquired by the conversion function 153 and data display format master information to determine the data display format (layout, type of medical data, etc.) of the post-conversion state. Then, the display control function 152 generates a display screen using the data held in the integrated medical care DB, and displays the generated display screen on the display 140.
図23は、第1の実施形態に係る表示制御機能152によって行われる処理の流れを示すフローチャートである。
FIG. 23 is a flowchart showing a flow of processing performed by the display control function 152 according to the first embodiment.
例えば、図23に示すように、表示制御機能152は、まず、変換機能153によって変換後状態として算出された座標に基づいて、表示座標マスタテーブルのデータ表示IDを探索する(ステップS21)。このとき、表示制御機能152は、変換機能153によって算出された座標が線又は面を表す場合には、複数のデータ表示IDを探索する。
For example, as shown in FIG. 23, the display control function 152 first searches for the data display ID of the display coordinate master table based on the coordinates calculated as the post-conversion state by the conversion function 153 (step S21). At this time, the display control function 152 searches for a plurality of data display IDs when the coordinates calculated by the conversion function 153 represent a line or a surface.
続いて、表示制御機能152は、探索したデータ表示IDに基づいて、データ表示形式マスタのデータ表示テーブルからパネルID及びデータIDを取得する(ステップS22)。このとき、表示制御機能152は、探索したデータ表示IDが複数存在する場合には、パネルIDとデータIDとの組み合わせを複数取得する。
Subsequently, the display control function 152 acquires a panel ID and a data ID from the data display table of the data display format master based on the searched data display ID (step S22). At this time, if there are a plurality of searched data display IDs, the display control function 152 acquires a plurality of combinations of panel IDs and data IDs.
その後、表示制御機能152は、取得したデータIDに基づいて、統合診療DBから該当するデータを取得し、さらに、取得したパネルIDに基づいて、データ表示形式マスタのパネルマスタテーブルから該当するパネルを取得し、当該パネルに取得したデータを当てはめて表示画面を生成する。そして、表示制御機能152は、生成した表示画面をディスプレイ140に表示する(ステップS23)。
Thereafter, the display control function 152 acquires the corresponding data from the integrated medical care DB based on the acquired data ID, and further selects the corresponding panel from the panel master table of the data display format master based on the acquired panel ID. Acquire and apply the acquired data to the panel to generate a display screen. Then, the display control function 152 displays the generated display screen on the display 140 (step S23).
図24~27は、表示制御機能152によって生成される表示画面の一例を示す図である。ここで、図24~27に示す例は、図17及び21に例示したデータ表示形式が表示される場合の例である。また、図24~27に示す例は、図5に例示した画像テーブル、図6に例示した画像計測値テーブル、図7に例示した読影レポートテーブル、図18に例示したパネルマスタテーブル、図19に例示したデータ表示テーブル、図20に例示した表示座標マスタテーブルに対応している。なお、以下の説明では、診療データ空間上の位置を示す座標(Width,Time,Depth)を(W,T,D)と簡潔に表す。
24 to 27 are diagrams showing examples of display screens generated by the display control function 152. FIG. Here, the examples shown in FIGS. 24 to 27 are examples when the data display format illustrated in FIGS. 17 and 21 is displayed. The examples shown in FIGS. 24 to 27 are the image table shown in FIG. 5, the image measurement value table shown in FIG. 6, the interpretation report table shown in FIG. 7, the panel master table shown in FIG. This corresponds to the data display table illustrated and the display coordinate master table illustrated in FIG. In the following description, coordinates (Width, Time, Depth) indicating positions in the medical data space are simply expressed as (W, T, D).
例えば、図24に示すように、表示制御機能152は、変換機能153によって算出された座標が(W,T,D)=(2,1,1)であった場合には、診療データ空間上で当該座標に対応付けられている、画像データのデータ表示形式1を配置した表示画面を生成する。
For example, as shown in FIG. 24, when the coordinates calculated by the conversion function 153 are (W, T, D) = (2, 1, 1), the display control function 152 A display screen in which the data display format 1 of the image data associated with the coordinates is arranged is generated.
具体的には、表示制御機能152は、変換機能153によって算出された座標(2,1,1)に基づいて、表示座標マスタテーブルから「DView0002」のデータ表示IDを取得する。続いて、表示制御機能152は、取得した「DView0002」のデータ表示IDに基づいて、データ表示テーブルから、「Panel0003」のパネルIDと、「Img0001」のデータIDとを取得する。その後、表示制御機能152は、取得した「Img0001」のデータIDに基づいて、統合診療DBの画像テーブルから「20170210_1020.dcm」のデータを取得し、さらに、取得した「Panel0003」のパネルIDに基づいて、パネルマスタテーブルから「画像表示パネル」を取得する。そして、表示制御機能152は、取得した「20170210_1020.dcm」のデータを「画像表示パネル」に当てはめて、画像データのデータ表示形式1を生成し、当該データ表示形式1を配置した表示画面を生成する。
Specifically, the display control function 152 acquires the data display ID of “DView0002” from the display coordinate master table based on the coordinates (2, 1, 1) calculated by the conversion function 153. Subsequently, the display control function 152 acquires the panel ID “Panel0003” and the data ID “Img0001” from the data display table based on the acquired data display ID “DView0002”. After that, the display control function 152 acquires “20170210 — 1020.dcm” data from the image table of the integrated medical care DB based on the acquired data ID of “Img0001”, and further, based on the acquired panel ID of “Panel0003”. Then, the “image display panel” is acquired from the panel master table. Then, the display control function 152 applies the acquired data “20110210 — 1020.dcm” to the “image display panel”, generates the data display format 1 of the image data, and generates the display screen on which the data display format 1 is arranged. To do.
また、例えば、図25に示すように、表示制御機能152は、変換機能153によって算出された座標が(W,T,D)=(2,1,2)であった場合には、診療データ空間上で当該座標に対応付けられている、画像の計測値のデータ表示形式2を配置した表示画面を生成する。
Also, for example, as shown in FIG. 25, the display control function 152, when the coordinates calculated by the conversion function 153 are (W, T, D) = (2, 1, 2), medical data A display screen in which the data display format 2 of the image measurement values associated with the coordinates in the space is arranged is generated.
具体的には、表示制御機能152は、変換機能153によって算出された座標(2,1,2)に基づいて、表示座標マスタテーブルから「DView0003」のデータ表示IDを取得する。続いて、表示制御機能152は、取得した「DView0003」のデータ表示IDに基づいて、データ表示テーブルから、「Panel0001」のパネルIDと、「ImgMes0001」,「ImgMes0002」,・・・のデータIDとを取得する。その後、表示制御機能152は、取得した「ImgMes0001」,「ImgMes0002」,・・・のデータIDに基づいて、統合診療DBの画像計測値テーブルから各データIDに対応する計測種及びデータを取得し、さらに、取得した「Panel0001」のパネルIDに基づいて、パネルマスタテーブルから「表形式パネル」を取得する。そして、表示制御機能152は、取得した各計測種及び各データを「表形式パネル」に当てはめて、画像の計測値のデータ表示形式2を生成し、当該データ表示形式2を配置した表示画面を生成する。
Specifically, the display control function 152 acquires the data display ID of “DView0003” from the display coordinate master table based on the coordinates (2, 1, 2) calculated by the conversion function 153. Subsequently, based on the acquired data display ID of “DView0003”, the display control function 152 uses the panel ID of “Panel0001” and the data IDs of “ImgMes0001”, “ImgMes0002”,. To get. After that, the display control function 152 acquires the measurement type and data corresponding to each data ID from the image measurement value table of the integrated medical care DB based on the acquired data IDs of “ImgMes0001”, “ImgMes0002”,. Further, based on the acquired panel ID of “Panel0001”, “table format panel” is acquired from the panel master table. Then, the display control function 152 applies each acquired measurement type and each data to the “table format panel”, generates the data display format 2 of the measured values of the image, and displays the display screen on which the data display format 2 is arranged. Generate.
また、例えば、図26に示すように、表示制御機能152は、変換機能153によって算出された座標が(W,T,D)=(2,1,3)であった場合には、診療データ空間上で当該座標に対応付けられている、読影レポートのデータ表示形式3を配置した表示画面を生成する。
Also, for example, as shown in FIG. 26, the display control function 152, when the coordinates calculated by the conversion function 153 are (W, T, D) = (2, 1, 3), A display screen is generated in which the interpretation report data display format 3 associated with the coordinates in space is arranged.
具体的には、表示制御機能152は、変換機能153によって算出された座標(2,1,3)に基づいて、表示座標マスタテーブルから「DView0010」のデータ表示IDを取得する。続いて、表示制御機能152は、取得した「DView0010」のデータ表示IDに基づいて、データ表示テーブルから、「Panel0005」のパネルIDと、「ImgRep0001」のデータIDとを取得する。その後、表示制御機能152は、取得した「ImgRep0001」のデータIDに基づいて、統合診療DBの読影レポートテーブルから「レポート0001.doc」のデータを取得し、さらに、取得した「Panel0005」のパネルIDに基づいて、パネルマスタテーブルから「レポート表示パネル」を取得する。そして、表示制御機能152は、取得した「レポート0001.doc」のデータを「レポート表示パネル」に当てはめて、読影レポートのデータ表示形式3を生成し、当該データ表示形式3を配置した表示画面を生成する。
Specifically, the display control function 152 acquires the data display ID of “DView0010” from the display coordinate master table based on the coordinates (2, 1, 3) calculated by the conversion function 153. Subsequently, the display control function 152 acquires the panel ID “Panel0005” and the data ID “ImgRep0001” from the data display table based on the acquired data display ID “DView0010”. Thereafter, the display control function 152 acquires the data of “Report 0001.doc” from the interpretation report table of the integrated medical care DB based on the acquired data ID of “ImgRep0001”, and further acquires the panel ID of the acquired “Panel0005”. Based on the above, a “report display panel” is acquired from the panel master table. Then, the display control function 152 applies the obtained data of “report 0001.doc” to the “report display panel”, generates the data display format 3 of the interpretation report, and displays the display screen on which the data display format 3 is arranged. Generate.
また、例えば、図27に示すように、表示制御機能152は、変換機能153によって算出された座標が(W,T,D)=(2,1,*)であった場合には、診療データ空間上で当該座標によって示される線に含まれる複数の点に対応する診療データを同時に表示するための複数のデータ表示形式1~3を配置した表示画面を生成する。
Further, for example, as shown in FIG. 27, the display control function 152, when the coordinates calculated by the conversion function 153 are (W, T, D) = (2, 1, *), medical data A display screen in which a plurality of data display formats 1 to 3 for simultaneously displaying medical data corresponding to a plurality of points included in a line indicated by the coordinates in space is generated.
具体的には、表示制御機能152は、変換機能153によって算出された座標(2,1,*)に基づいて、表示座標マスタテーブルから、座標(2,1,1)、(2,1,2)及び(2,1,3)に対応する「DView0002」、「DView0003」及び「DView0010」のデータ表示IDを取得する。続いて、表示制御機能152は、取得した各データ表示IDに基づいて、データ表示テーブルから、パネルIDとデータIDの組み合わせとして、「Panel0003」と「Img0001」との組み合わせ、「Panel0001」と「ImgMes0001」,「ImgMes0002」,・・・との組み合わせ、及び、「Panel0005」と「ImgRep0001」との組み合わせを取得する。
Specifically, the display control function 152 reads the coordinates (2, 1, 1), (2, 1, 1) from the display coordinate master table based on the coordinates (2, 1, *) calculated by the conversion function 153. The data display IDs of “DView0002”, “DView0003”, and “DView0010” corresponding to 2) and (2,1,3) are acquired. Subsequently, based on each acquired data display ID, the display control function 152 uses a combination of “Panel0003” and “Img0001”, “Panel0001” and “ImgMes0001” as a combination of the panel ID and the data ID from the data display table. , “ImgMes0002”,... And a combination of “Panel0005” and “ImgRep0001”.
その後、表示制御機能152は、取得した「Panel0003」と「Img0001」の組み合わせに基づいて、統合診療DBの画像テーブルから「20170210_1020.dcm」のデータを取得し、パネルマスタテーブルから「画像表示パネル」を取得し、取得した「20170210_1020.dcm」のデータを「画像表示パネル」に当てはめて、画像データのデータ表示形式1を生成する。また、表示制御機能152は、取得した「Panel0001」と「ImgMes0001」,「ImgMes0002」,・・・との組み合わせに基づいて、統合診療DBの画像計測値テーブルから各データIDに対応する計測種及びデータを取得し、パネルマスタテーブルから「表形式パネル」を取得し、取得した各計測種及び各データを「表形式パネル」に当てはめて、画像の計測値のデータ表示形式2を生成する。また、表示制御機能152は、取得した「Panel0005」と「ImgRep0001」との組み合わせに基づいて、統合診療DBの読影レポートテーブルから「レポート0001.doc」のデータを取得し、パネルマスタテーブルから「レポート表示パネル」を取得し、取得した「レポート0001.doc」のデータを「レポート表示パネル」に当てはめて、読影レポートのデータ表示形式3を生成する。
After that, the display control function 152 acquires data “20170210 — 1020.dcm” from the image table of the integrated medical care DB based on the acquired combination of “Panel0003” and “Img0001”, and “image display panel” from the panel master table. Is applied to the “image display panel” to generate the data display format 1 of the image data. In addition, the display control function 152 selects the measurement type corresponding to each data ID from the image measurement value table of the integrated medical treatment DB based on the acquired combination of “Panel0001”, “ImgMes0001”, “ImgMes0002”,. Data is acquired, a “table format panel” is acquired from the panel master table, and each acquired measurement type and each data is applied to the “table format panel” to generate a data display format 2 of image measurement values. In addition, the display control function 152 acquires “Report 0001.doc” data from the interpretation report table of the integrated medical care database based on the acquired combination of “Panel0005” and “ImgRep0001”, and “Report” from the panel master table. The “display panel” is acquired, and the acquired data of “report 0001.doc” is applied to the “report display panel” to generate the data display format 3 of the interpretation report.
そして、表示制御機能152は、生成したデータ表示形式1~3を並べて配置した表示画面を生成する。このとき、表示制御機能152は、データ表示形式マスタのデータ表示テーブルから取得したパネルIDとデータIDとの組み合わせが複数存在する場合には、複数のデータ表示形式を生成する。そして、表示制御機能152は、複数のデータ表示形式を生成した場合には、予め決められたルールに基づいて、表示画面のレイアウトを生成する。例えば、表示制御機能152は、左から生データ、加工データ、文字データの順で各データが並んで表示されるように、表示画面のレイアウトを生成する。または、例えば、表示制御機能152は、画像に関するデータが左側に大きく表示され、加工データ及び文字データが右側で上下に並んで表示されるように、表示画面のレイアウトを生成する。
The display control function 152 generates a display screen in which the generated data display formats 1 to 3 are arranged. At this time, the display control function 152 generates a plurality of data display formats when there are a plurality of combinations of panel IDs and data IDs acquired from the data display table of the data display format master. Then, when a plurality of data display formats are generated, the display control function 152 generates a display screen layout based on a predetermined rule. For example, the display control function 152 generates a display screen layout so that each data is displayed side by side in the order of raw data, processed data, and character data from the left. Alternatively, for example, the display control function 152 generates a display screen layout so that data relating to an image is displayed largely on the left side, and processed data and character data are displayed side by side on the right side.
さらに、本実施形態では、表示制御機能152は、表示画面を介して、変換前状態、変換基準点、及び変換方向の指定を操作者から受け付けるための受付手段を提供する。
Furthermore, in this embodiment, the display control function 152 provides an accepting unit for accepting designation of the pre-conversion state, the conversion reference point, and the conversion direction from the operator via the display screen.
図28は、第1の実施形態に係る表示制御機能152によって提供される受付手段の一例を示す図である。
FIG. 28 is a diagram illustrating an example of accepting means provided by the display control function 152 according to the first embodiment.
例えば、図28に示すように、表示制御機能152は、複数のデータ表示形式1~3を変換前状態の単位としてまとめて表示するデータ表示形式4を用いて、当該データ表示形式4の単位で、表示画面上に、変換前状態及び変換方向を指定する操作を受け付けるための操作受付部を配置する。
For example, as shown in FIG. 28, the display control function 152 uses a data display format 4 that displays a plurality of data display formats 1 to 3 as a unit of a state before conversion, and uses the data display format 4 as a unit. An operation accepting unit for accepting an operation for designating the pre-conversion state and the conversion direction is arranged on the display screen.
例えば、表示制御機能152は、当該操作受付部として、複数のデータ表示形式1~3をまとめたデータ表示形式4の上に、三つのアイコン5を左右方向に並べて配置する。そして、表示制御機能152は、三つのアイコン5のうちのいずれかのアイコンに対する操作を受け付けた場合に、当該アイコンが配置されたデータ表示形式が変換前状態として指定されたことを識別する。ここで、例えば、表示制御機能152は、左側のアイコンに対する操作が行われた場合には、変換方向として深さ方向が指定されたことを識別する。また、例えば、表示制御機能152は、中央のアイコンに対する操作が行われた場合には、変換方向として時間方向が指定されたことを識別する。ここで、例えば、表示制御機能152は、右側のアイコンに対する操作が行われた場合には、変換方向として幅方向が指定されたことを識別する。
For example, the display control function 152 arranges three icons 5 side by side in the left-right direction on the data display format 4 in which a plurality of data display formats 1 to 3 are collected as the operation receiving unit. When the display control function 152 receives an operation for any one of the three icons 5, the display control function 152 identifies that the data display format in which the icon is arranged is designated as the pre-conversion state. Here, for example, when the operation on the left icon is performed, the display control function 152 identifies that the depth direction is designated as the conversion direction. Further, for example, when an operation is performed on the center icon, the display control function 152 identifies that the time direction is designated as the conversion direction. Here, for example, when the operation on the right icon is performed, the display control function 152 identifies that the width direction is designated as the conversion direction.
さらに、表示制御機能152は、複数のデータ表示形式1~3をまとめたデータ表示形式4に含まれる個々のデータ表示形式の単位で、表示画面上に、変換基準点の指定を受け付けるための操作受付部を配置する。例えば、表示制御機能152は、個々のデータ表示形式について、それぞれのパネル内の領域を当該操作受付部とする。そして、表示制御機能152は、いずれかのデータ表示形式のパネル内の領域に対する操作を受け付けた場合に、当該データ表示形式が変換基準点として指定されたことを識別する。
Further, the display control function 152 is an operation for receiving designation of a conversion reference point on the display screen in units of individual data display formats included in the data display format 4 in which the plurality of data display formats 1 to 3 are collected. Arrange the reception part. For example, the display control function 152 sets an area in each panel as the operation receiving unit for each data display format. The display control function 152 identifies that the data display format is designated as the conversion reference point when an operation is performed on an area in the panel of any data display format.
なお、ここでは、点で示されるデータ表示形式をまとめた単位で、変換前状態の指定を受け付ける場合の例を説明したが、実施形態はこれに限られない。例えば、表示制御機能152は、複数の点をまとめた線で示されるデータ表示形式、及び、複数の線をまとめた面で示されるデータ表示形式を用いて、線のデータ表示形式ごと、又は、面のデータ表示形式ごとに、変換方向の指定を受け付けてもよい。
Note that, here, an example has been described in which the designation of the state before conversion is accepted in a unit in which the data display format indicated by dots is collected, but the embodiment is not limited thereto. For example, the display control function 152 uses a data display format indicated by a line summarizing a plurality of points and a data display format indicated by a plane summarizing a plurality of lines, for each data display format of lines, or You may receive designation | designated of a conversion direction for every data display format of a surface.
また、例えば、表示制御機能152は、予め表示画面上にアイコンを配置するのではなく、操作の種類(操作が行われた表示画面上の位置、マウスのクリックの方法等)に応じて、操作を受け付けてもよい。
Further, for example, the display control function 152 does not place an icon on the display screen in advance, but operates according to the type of operation (position on the display screen where the operation is performed, mouse click method, etc.). May be accepted.
図29は、第1の実施形態に係る表示制御機能152によって提供される受付手段の他の一例を示す図である。
FIG. 29 is a diagram illustrating another example of accepting means provided by the display control function 152 according to the first embodiment.
例えば、図29に示すように、表示制御機能152は、マウスの左クリックによって指定された位置にあるデータ表示形式を変換前状態として識別し、マウスの右クリックによって指定された位置にあるデータ表示形式を変換基準点として識別する。また、例えば、表示制御機能152は、マウスの右クリックが行われた場合に、深さ方向を指定するためのアイコン、時間方向を指定するためのアイコン、及び、幅方向を指定するためのアイコンを並べて配置したコンテクストメニュー6を表示することで、変換方向の指定を受け付ける。
For example, as shown in FIG. 29, the display control function 152 identifies the data display format at the position designated by the left mouse click as the pre-conversion state, and displays the data at the position designated by the right mouse click. Identifies the format as a transformation reference point. Further, for example, the display control function 152 displays an icon for designating the depth direction, an icon for designating the time direction, and an icon for designating the width direction when the right mouse click is performed. The conversion direction is accepted by displaying the context menu 6 arranged in a row.
なお、図29に示す例は、同じデータ表示形式の上で変換前状態及び変換基準点が指定されているため、診療データ空間上の点を指定する操作となる。このように、変換前状態と変換基準点とを同じにする場合には、例えば、左クリックの操作を省略してもよい。この場合には、表示制御機能152は、右クリックによって指定された位置にあるデータ表示形式を変換前状態及び変換基準点として識別する。
In the example shown in FIG. 29, since the pre-conversion state and the conversion reference point are designated on the same data display format, the operation designates a point on the medical data space. As described above, when the pre-conversion state and the conversion reference point are the same, for example, the left click operation may be omitted. In this case, the display control function 152 identifies the data display format at the position designated by the right click as the pre-conversion state and the conversion reference point.
また、例えば、表示制御機能152は、変換前状態及び変換基準点を指定する操作を受け付ける際に、診療データ空間上の時間方向の点又は線分を指定する操作を受け付けてもよい。
Further, for example, the display control function 152 may accept an operation for designating a point or a line in the time direction on the medical data space when accepting an operation for designating the pre-conversion state and the conversion reference point.
図30は、第1の実施形態に係る表示制御機能152によって提供される受付手段の他の一例を示す図である。
FIG. 30 is a diagram illustrating another example of the accepting means provided by the display control function 152 according to the first embodiment.
例えば、図30に示すように、表示制御機能152は、時間方向の成分を含むデータ表示形式の上に、時間時点又は時間範囲を指定するためのグラフィック7を表示する。そして、例えば、表示制御機能152は、マウスのクリックやドラッグ等の操作によって、当該グラフィック7の位置又は大きさを変更する操作を受け付けることで、時間方向の点又は線分を識別する。ここで、例えば、表示制御機能152は、表示画面上に時間方向の成分を含むデータ表示形式が複数表示されている場合には、各データ表示形式の上にグラフィック7を表示し、同じ時間時点又は時間範囲を示すように、各グラフィックを連動させる。
For example, as shown in FIG. 30, the display control function 152 displays a graphic 7 for designating a time point or a time range on a data display format including components in the time direction. Then, for example, the display control function 152 accepts an operation for changing the position or size of the graphic 7 by an operation such as mouse click or dragging, and thereby identifies a point or a line segment in the time direction. Here, for example, when a plurality of data display formats including components in the time direction are displayed on the display screen, the display control function 152 displays the graphic 7 on each data display format, and at the same time point. Alternatively, each graphic is linked so as to indicate a time range.
ここで、例えば、表示制御機能152は、表示中のデータ表示形式に対応する診療データ空間上の位置を示すガイド情報をさらに表示してもよい。
Here, for example, the display control function 152 may further display guide information indicating a position on the medical data space corresponding to the data display format being displayed.
図31は、第1の実施形態に係る表示制御機能152によって提供される受付手段の他の一例を示す図である。
FIG. 31 is a diagram showing another example of accepting means provided by the display control function 152 according to the first embodiment.
例えば、図31に示すように、表示制御機能152は、表示中のデータ表示形式の診療データ空間上の位置を把握できるようにするために、表示画面上に、診療データ空間に相当するガイド情報8を表示する。例えば、表示制御機能152は、ガイド情報8として、横軸を時系列とし、縦軸をデータ種別とした表示形式で、診療データの有無を示すアイコンを表示する。そして、表示制御機能152は、ガイド情報8の中で、現在の表示中の診療データに相当する位置を強調表示する。ここで、例えば、表示制御機能152は、2次元以上の軸を表示するために、色やアイコン等を用いて強調表示を行ってもよい。
For example, as shown in FIG. 31, the display control function 152 displays guide information corresponding to the medical data space on the display screen so that the position of the displayed data display format in the medical data space can be grasped. 8 is displayed. For example, the display control function 152 displays, as the guide information 8, an icon indicating the presence or absence of medical data in a display format in which the horizontal axis is time series and the vertical axis is a data type. Then, the display control function 152 highlights a position corresponding to the currently displayed medical data in the guide information 8. Here, for example, the display control function 152 may perform highlighting using a color, an icon, or the like in order to display a two-dimensional or higher axis.
また、例えば、表示制御機能152は、ガイド情報8として表示される軸を、表示中の診療データに応じて動的に切り替えてもよい。例えば、表示制御機能152は、画像に関する診療データについて、深さ方向及び時間方向の面を表示している場合には、縦軸は、データ種別の代わりに、深さの軸とする。
Further, for example, the display control function 152 may dynamically switch the axis displayed as the guide information 8 according to the medical data being displayed. For example, when the display control function 152 displays the depth direction and the time direction planes for the medical data related to the image, the vertical axis is the depth axis instead of the data type.
さらに、例えば、表示制御機能152は、ガイド情報8上で操作者が変換前状態、変換基準点及び変換方向を指定する操作を受け付けてもよい。この場合には、例えば、表示制御機能152は、ガイド情報8上で選択された位置に相当する表示中のデータ表示形式を強調表示する。これにより、操作者が、変換前状態及び変換基準点の選択を直感的に行うことができるようになる。
Furthermore, for example, the display control function 152 may accept an operation in which the operator designates a pre-conversion state, a conversion reference point, and a conversion direction on the guide information 8. In this case, for example, the display control function 152 highlights the displayed data display format corresponding to the position selected on the guide information 8. As a result, the operator can intuitively select the pre-conversion state and the conversion reference point.
次に、変換機能153について説明する。変換機能153は、操作者によって指定された変換前状態、変換基準点及び変換方向それぞれの座標を取得し、取得した各座標に基づいて空間変換を行うことで、変換後状態を示す座標を算出する。
Next, the conversion function 153 will be described. The conversion function 153 obtains the coordinates of the pre-conversion state, the conversion reference point, and the conversion direction specified by the operator, and calculates the coordinates indicating the post-conversion state by performing spatial conversion based on the acquired coordinates. To do.
図32は、第1の実施形態に係る変換機能153によって行われる処理の流れを示すフローチャートである。
FIG. 32 is a flowchart showing a flow of processing performed by the conversion function 153 according to the first embodiment.
例えば、図32に示すように、変換機能153は、まず、表示画面に表示中のデータ表示形式の座標を取得する(ステップS31)。このとき、変換機能153は、表示制御機能152によって提供された受付手段を用いて操作者が変換前状態として指定した全てのデータ表示形式について、表示座標マスタの表示座標マスタテーブルに基づいて、診療データ空間における座標を取得する。このとき、例えば、変換機能153は、複数のデータ表示形式をまとめたデータ表示形式が指定された場合には、当該データ表示形式に含まれる全てのデータ表示形式について、座標を取得する。または、変換機能153は、操作者からの指示に応じて、表示制御機能152によって表示画面に表示されている全てのデータ表示形式について、座標を取得してもよい。
For example, as shown in FIG. 32, the conversion function 153 first acquires the coordinates of the data display format being displayed on the display screen (step S31). At this time, the conversion function 153 uses the accepting means provided by the display control function 152 for all data display formats designated as the pre-conversion state by the operator based on the display coordinate master table of the display coordinate master. Get the coordinates in the data space. At this time, for example, when a data display format in which a plurality of data display formats are combined is designated, the conversion function 153 acquires coordinates for all data display formats included in the data display format. Alternatively, the conversion function 153 may acquire coordinates for all data display formats displayed on the display screen by the display control function 152 in accordance with an instruction from the operator.
そして、変換機能153は、変換前状態を判定する(ステップS32)。このとき、変換機能153は、取得した座標に基づいて、操作者によって選択されたデータ表示形式又は表示画面に表示されているデータ表示形式がどのような表示状態にあるのかを判定する。そして、変換機能153は、判定した表示状態を示す座標を、変換前状態を示す座標として設定する。
Then, the conversion function 153 determines the pre-conversion state (step S32). At this time, the conversion function 153 determines the display state of the data display format selected by the operator or the data display format displayed on the display screen based on the acquired coordinates. Then, the conversion function 153 sets the coordinates indicating the determined display state as coordinates indicating the pre-conversion state.
図33~37は、第1の実施形態に係る変換機能153による表示状態の判定の一例を示す図である。
33 to 37 are diagrams showing an example of display state determination by the conversion function 153 according to the first embodiment.
例えば、図33の左側に示すように、(W,T,D)=(2,1,1)であるデータ表示形式と、(W,T,D)=(2,1,2)であるデータ表示形式と、(W,T,D)=(2,1,3)であるデータ表示形式とが表示画面に表示されていたとする。この場合には、例えば、図33の右側に示すように、変換機能153は、これらのデータ表示形式の表示状態が、(W,T)=(2,1)を通り、D(深さ)方向に伸びる線であると判定する。そして、この場合には、変換機能153は、変換前状態を示す座標として、(W,T,D)=(2,1,*)を設定する。
For example, as shown on the left side of FIG. 33, the data display format (W, T, D) = (2, 1, 1) and (W, T, D) = (2, 1, 2). It is assumed that the data display format and the data display format (W, T, D) = (2, 1, 3) are displayed on the display screen. In this case, for example, as shown on the right side of FIG. 33, the conversion function 153 causes the display state of these data display formats to pass through (W, T) = (2, 1) and D (depth). It is determined that the line extends in the direction. In this case, the conversion function 153 sets (W, T, D) = (2, 1, *) as coordinates indicating the state before conversion.
また、例えば、図34の左側に示すように、(W,T,D)=(2,1,1)であるデータ表示形式と、(W,T,D)=(2,2,1)であるデータ表示形式とが表示画面に表示されていたとする。この場合には、例えば、図34の右側に示すように、変換機能153は、これらのデータ表示形式の表示状態が、(W,D)=(2,1)を通り、T(時間)方向に伸びる線であると判定する。そして、この場合には、変換機能153は、変換前状態を示す座標として、(W,T,D)=(2,*,1)を設定する。
For example, as shown on the left side of FIG. 34, the data display format (W, T, D) = (2, 1, 1) and (W, T, D) = (2, 2, 1) Suppose that the data display format is displayed on the display screen. In this case, for example, as shown on the right side of FIG. 34, the conversion function 153 causes the display state of these data display formats to pass through (W, D) = (2, 1), and in the T (time) direction. It is determined that the line extends in the direction. In this case, the conversion function 153 sets (W, T, D) = (2, *, 1) as coordinates indicating the state before conversion.
また、例えば、図35の左側に示すように、(W,T,D)=(5,(1~4),2)であるデータ表示形式が表示画面に表示されていたとする。この場合には、例えば、図35の右側に示すように、変換機能153は、当該データ表示形式の表示状態が、(W,D)=(5,2)を通り、T(時間)方向に伸びる線であると判定する。そして、この場合には、変換機能153は、変換前状態を示す座標として、(W,T,D)=(5,*,2)を設定する。
For example, as shown on the left side of FIG. 35, it is assumed that the data display format (W, T, D) = (5, (1 to 4), 2) is displayed on the display screen. In this case, for example, as shown on the right side of FIG. 35, the conversion function 153 causes the display state of the data display format to pass through (W, D) = (5, 2) in the T (time) direction. It is determined that the line extends. In this case, the conversion function 153 sets (W, T, D) = (5, *, 2) as coordinates indicating the state before conversion.
また、例えば、図36の左側に示すように、(W,T,D)=(1,(2,3),2)であるデータ表示形式と、(W,T,D)=(5,(1~4),2)であるデータ表示形式と、(W,T,D)=(4,(1~4),2)であるデータ表示形式とが表示画面に表示されていたとする。この場合には、例えば、図36の右側に示すように、変換機能153は、まず、一つ目のデータ表示形式が、(W,D)=(1,2)を通り、T(時間)方向に伸びる線であると判定し、二つ目のデータ表示形式が、(W,D)=(5,2)を通り、T(時間)方向に伸びる線であると判定し、三つ目のデータ表示形式が、(W,D)=(4,2)を通り、T(時間)方向に伸びる線であると判定する。その上で、変換機能153は、これらのデータ表示形式の表示状態が、D=2を通り、W(幅)及びT(時間)方向に伸びる面であると判定する。そして、この場合には、変換機能153は、変換前状態を示す座標として、(W,T,D)=(*,*,2)を設定する。
For example, as shown on the left side of FIG. 36, a data display format (W, T, D) = (1, (2, 3), 2) and (W, T, D) = (5, It is assumed that the data display format (1 to 4) and 2) and the data display format (W, T, D) = (4, (1 to 4), 2) are displayed on the display screen. In this case, for example, as shown on the right side of FIG. 36, the conversion function 153 first passes the first data display format through (W, D) = (1, 2) and T (time). It is determined that the line extends in the direction, the second data display format passes through (W, D) = (5, 2), and is determined to be a line extending in the T (time) direction. Is determined to be a line extending in the T (time) direction through (W, D) = (4, 2). In addition, the conversion function 153 determines that the display state of these data display formats is a surface that passes through D = 2 and extends in the W (width) and T (time) directions. In this case, the conversion function 153 sets (W, T, D) = (*, *, 2) as coordinates indicating the pre-conversion state.
また、例えば、図37の左側に示すように、(W,T,D)=(2,1,1)であるデータ表示形式と、(W,T,D)=(2,1,2)であるデータ表示形式と、(W,T,D)=(2,1,3)であるデータ表示形式と、(W,T,D)=(1,*,2)であるデータ表示形式と、(W,T,D)=(5,*,2)であるデータ表示形式と、(W,T,D)=(4,*,2)であるデータ表示形式とが表示画面に表示されていたとする。この場合には、例えば、図37の右側に示すように、変換機能153は、これらのデータ表示形式の表示状態が、(W,T)=(2,1)を通り、D(深さ)方向に伸びる線と、D=2を通り、W(幅)及びT(時間)方向に伸びる面の二つの状態であると判定する。そして、この場合には、変換機能153は、変換前状態を示す座標として、(W,T,D)=(2,1,*)と、(W,T,D)=(*,*,2)とを設定する。
Also, for example, as shown on the left side of FIG. 37, a data display format of (W, T, D) = (2, 1, 1) and (W, T, D) = (2, 1, 2) A data display format in which (W, T, D) = (2, 1, 3), a data display format in which (W, T, D) = (1, *, 2) , (W, T, D) = (5, *, 2) and a data display format (W, T, D) = (4, *, 2) are displayed on the display screen. Suppose that In this case, for example, as shown on the right side of FIG. 37, the conversion function 153 causes the display state of these data display formats to pass through (W, T) = (2, 1) and D (depth). It is determined that there are two states: a line extending in the direction and a surface passing through D = 2 and extending in the W (width) and T (time) directions. In this case, the conversion function 153 uses (W, T, D) = (2, 1, *) and (W, T, D) = (*, *, 2) is set.
図32に戻って、続いて、変換機能153は、変換基準点を取得する(ステップS33)。このとき、変換機能153は、表示制御機能152によって提供された受付手段を用いて操作者が変換基準点として指定したデータ表示形式について、表示座標マスタの表示座標マスタテーブルに基づいて、診療データ空間における座標を取得する。そして、変換機能153は、取得した座標を、変換基準点を示す座標として設定する。
32, subsequently, the conversion function 153 acquires a conversion reference point (step S33). At this time, the conversion function 153 uses the reception means provided by the display control function 152 to determine the data display format designated by the operator as the conversion reference point based on the display coordinate master table of the display coordinate master. Get the coordinates at. Then, the conversion function 153 sets the acquired coordinates as coordinates indicating the conversion reference point.
続いて、変換機能153は、変換方向を取得する(ステップS34)。このとき、変換機能153は、表示制御機能152によって提供された受付手段を用いて操作者が変換方向として指定した方向について、当該方向を示す座標を、変換方向を示す座標として設定する。
Subsequently, the conversion function 153 acquires the conversion direction (step S34). At this time, the conversion function 153 sets the coordinate indicating the conversion direction as the coordinate indicating the conversion direction with respect to the direction designated by the operator as the conversion direction using the receiving unit provided by the display control function 152.
図38は、第1の実施形態に係る変換機能153による変換基準点及び変換方向の取得の一例を示す図である。
FIG. 38 is a diagram illustrating an example of acquisition of a conversion reference point and a conversion direction by the conversion function 153 according to the first embodiment.
例えば、図38に示すように、操作者によって(W,T,D)=(2,1,1)であるデータ表示形式が変換基準点として指定されたとする。この場合には、変換機能153は、当該データ表示形式のデータ表示IDに基づいて、対応する座標(2,1,1)を表示座標マスタから取得する。また、変換機能153は、操作者によって時間方向が変換方向として指定された場合には、T(時間)方向に伸びる線を表すT=*を、変換方向を示す座標として設定する。
For example, as shown in FIG. 38, it is assumed that the data display format (W, T, D) = (2, 1, 1) is designated as the conversion reference point by the operator. In this case, the conversion function 153 acquires the corresponding coordinates (2, 1, 1) from the display coordinate master based on the data display ID of the data display format. In addition, when the time direction is designated as the conversion direction by the operator, the conversion function 153 sets T = * representing a line extending in the T (time) direction as coordinates indicating the conversion direction.
図32に戻って、続いて、変換機能153は、空間変換を行う(ステップS35)。このとき、変換機能153は、上述した処理で得られた変換前状態を示す座標、変換基準点を示す座標、及び、変換方向を示す座標に基づいて、変換後状態を示す座標を算出する。
32, subsequently, the conversion function 153 performs space conversion (step S35). At this time, the conversion function 153 calculates coordinates indicating the post-conversion state based on the coordinates indicating the pre-conversion state, the coordinates indicating the conversion reference point, and the coordinates indicating the conversion direction obtained by the above-described processing.
図39は、第1の実施形態に係る変換機能153による変換後状態を示す座標の算出の一例を示す図である。
FIG. 39 is a diagram illustrating an example of calculation of coordinates indicating a post-conversion state by the conversion function 153 according to the first embodiment.
例えば、図39の上側に示すように、変換前状態を示す座標が(W,T,D)=(2,1,*)であり、変換基準点を示す座標が(W,T,D)=(2,1,1)であり、変換方向を示す座標がT=*であったとする。この場合には、変換機能153は、変換後状態を示す座標として、(W,T,D)=(2,*,1)を算出する。
For example, as shown in the upper side of FIG. 39, the coordinates indicating the pre-conversion state are (W, T, D) = (2, 1, *), and the coordinates indicating the conversion reference point are (W, T, D). = (2,1,1), and the coordinate indicating the conversion direction is T = *. In this case, the conversion function 153 calculates (W, T, D) = (2, *, 1) as coordinates indicating the post-conversion state.
すなわち、図39に示す例では、(W,T)=(2,1)を通り、D(深さ)方向に伸びる線で示される変換前状態が、(W,T,D)=(2,1,1)の点で示される変換基準点を基準にして、T(時間)方向に伸びる線で示される変換方向に空間変換されることで、(W,D)=(2,1)を通り、T(時間)方向に伸びる線で示される変換後状態に変換される。
That is, in the example shown in FIG. 39, the state before conversion indicated by the line extending in the D (depth) direction through (W, T) = (2, 1) is (W, T, D) = (2 , 1, 1) on the basis of the conversion reference point indicated by the point (1, 1), spatial conversion is performed in the conversion direction indicated by the line extending in the T (time) direction, so that (W, D) = (2, 1) Is converted to a post-conversion state indicated by a line extending in the T (time) direction.
この結果、例えば、図39の下側に示すように、表示制御機能152によって、変換前は、一つの時点について、画像データ、画像の計測値、及び、読影レポートが表示されていた状態が、変換後は、複数の時点について、画像データが表示され、当該一つの時点について、画像の計測値と、読影レポートとが表示された状態に切り替えられることになる。
As a result, for example, as shown in the lower side of FIG. 39, the image data, the measured value of the image, and the interpretation report are displayed for one time point by the display control function 152 before conversion. After the conversion, the image data is displayed for a plurality of time points, and the measurement value of the image and the interpretation report are displayed for the one time point.
このように、変換機能153は、空間変換として、診療データ空間上で、点、線又は平面で示される変換前状態を、当該変換前状態で指定された変換基準点を基準にして、他の点、線又は平面で示される変換後状態に変換する。ここで、変換基準点も、診療データ空間上で、点、線又は平面で示される。
As described above, the conversion function 153 performs, as spatial conversion, the pre-conversion state indicated by a point, a line, or a plane on the medical data space with reference to the conversion reference point specified in the pre-conversion state. Convert to a post-conversion state indicated by a point, line or plane. Here, the conversion reference point is also indicated by a point, a line, or a plane in the medical data space.
具体的には、変換機能153は、空間変換として、診療データ空間における回転、平行移動、拡大又は縮小を行う。
Specifically, the conversion function 153 performs rotation, parallel movement, enlargement, or reduction in the medical data space as space conversion.
以下、第1の実施形態に係る変換機能153によって行われる空間変換について、具体的な例を挙げて説明する。
Hereinafter, the spatial conversion performed by the conversion function 153 according to the first embodiment will be described with a specific example.
図40は、第1の実施形態に係る変換機能153によって行われる拡大変換の一例を示す図である。ここで、図40は、点を拡大によって線の表示へ変換する場合の一例を示している。
FIG. 40 is a diagram illustrating an example of enlargement conversion performed by the conversion function 153 according to the first embodiment. Here, FIG. 40 shows an example of converting a point into a line display by enlarging.
例えば、図40の左側に示すように、操作者によって、変換前状態及び変換基準点として、(W,T,D)=(WA,TA,DA)であるデータ表示形式が指定され、変換方向として深さ方向(D=*)が指定されたとする。この場合には、例えば、図40の右側に示すように、変換機能153は、変換前状態を示す座標(WA,TA,DA)を、変換後状態を示す座標(WA,TA,*)に変換する。
For example, as shown on the left side of FIG. 40, the operator designates a data display format of (W, T, D) = (W A , T A , D A ) as the pre-conversion state and the conversion reference point. Assume that the depth direction (D = *) is designated as the conversion direction. In this case, for example, as shown on the right side of FIG. 40, conversion function 153, coordinates indicating the pre-conversion state (W A, T A, D A) , and coordinates representing the converted state (W A, T A , *).
このような空間変換は、点で示される変換前状態を、当該点で示される変換基準点を基準にして深さ方向に拡大することで、深さ方向に伸びる線で示される変換後状態に変換することに相当する。
Such a spatial transformation is performed by expanding the pre-conversion state indicated by a point in the depth direction with reference to the conversion reference point indicated by the point, to a post-conversion state indicated by a line extending in the depth direction. It corresponds to converting.
この結果、例えば、図40に示すように、表示制御機能152によって、変換前は、一つの時点について、画像データが表示されていた状態が、変換後は、同じ時点について、画像データと、画像の計測値と、読影レポートとが表示された状態に切り替えられることになる。
As a result, for example, as shown in FIG. 40, the display control function 152 has displayed the image data at one time point before the conversion, and the image data and the image at the same time point after the conversion. The measured value and the interpretation report are displayed.
図41は、第1の実施形態に係る変換機能153によって行われる拡大変換の他の一例を示す図である。ここで、図41は、線を拡大によって面の表示へ変換する場合の例を示している。
FIG. 41 is a diagram illustrating another example of the expansion conversion performed by the conversion function 153 according to the first embodiment. Here, FIG. 41 shows an example in which a line is converted into a surface display by enlargement.
例えば、図41の左側に示すように、操作者によって、変換前状態及び変換基準点として、(W,T,D)=(WB,*,DB)であるデータ表示形式が指定され、変換方向として幅方向(W=*)が指定されたとする。この場合には、例えば、図41の右側に示すように、変換機能153は、変換前状態を示す座標(WB,*,DB)を、変換後状態を示す座標(*,*,DB)に変換する。
For example, as shown on the left side of FIG. 41, a data display format (W, T, D) = (W B , *, D B ) is designated by the operator as the pre-conversion state and the conversion reference point, It is assumed that the width direction (W = *) is designated as the conversion direction. In this case, for example, as shown on the right side of FIG. 41, the conversion function 153 converts the coordinates (W B , *, D B ) indicating the state before conversion into the coordinates (*, *, D indicating the state after conversion. B ) to convert.
このような空間変換は、時間方向に伸びる線で示される変換前状態を、当該線で示される変換基準点を基準にして幅方向に拡大することで、幅方向及び時間方向に伸びる面で示される変換後状態に変換することに相当する。
Such spatial transformation is indicated by a plane extending in the width direction and the time direction by enlarging the pre-conversion state indicated by the line extending in the time direction in the width direction with reference to the conversion reference point indicated by the line. This corresponds to conversion to a post-conversion state.
この結果、例えば、図41に示すように、表示制御機能152によって、変換前は、複数の時点について、検体検査サマリデータが表示されていた状態が、変換後は、当該複数の時点について、投薬サマリデータと、検体検査サマリデータと、バイタルサマリデータが表示された状態に切り替えられることになる。
As a result, for example, as shown in FIG. 41, the display control function 152 shows that the sample test summary data is displayed for a plurality of time points before the conversion, but the conversion is performed for the plurality of time points after the conversion. The summary data, the specimen inspection summary data, and the vital summary data are switched to the displayed state.
図42は、第1の実施形態に係る変換機能153によって行われる縮小変換の一例を示す図である。ここで、図42は、線を縮小によって点の表示へ変換する場合の一例を示している。
FIG. 42 is a diagram illustrating an example of reduction conversion performed by the conversion function 153 according to the first embodiment. Here, FIG. 42 shows an example in which a line is converted into a point display by reduction.
なお、図42に示す例では、データ表示形式の上に、変換方向を指定するための三つのアイコンに加えて、指定された方向に縮小することを指定するためのアイコン9がさらに配置される。
In the example shown in FIG. 42, in addition to the three icons for designating the conversion direction, an icon 9 for designating reduction in the designated direction is further arranged on the data display format. .
そして、例えば、図42の左側に示すように、操作者によって、変換前状態として、(W,T,D)=(WC,*,DC)であるデータ表示形式が指定され、変換基準点として、(W,T,D)=(WC,TC,DC)である位置が指定され、変換方向として時間方向(T=*)が指定され、さらに、当該方向に縮小することを指定されたとする。この場合には、例えば、図42の右側に示すように、変換機能153は、変換前状態を示す座標(WC,*,DC)を、変換後状態を示す座標(WC,TC,DC)に変換する。
For example, as shown on the left side of FIG. 42, a data display format (W, T, D) = (W C , *, D C ) is designated by the operator as the pre-conversion state, and the conversion criteria As a point, a position where (W, T, D) = (W C , T C , D C ) is designated, a time direction (T = *) is designated as a conversion direction, and further reduction is made in that direction. Is specified. In this case, for example, as shown on the right side of FIG. 42, the conversion function 153 converts the coordinates (W C , *, D C ) indicating the pre-conversion state into coordinates (W C , T C ) indicating the post-conversion state. , D C ).
このような空間変換は、時間方向に伸びる線で示される変換前状態を、当該線に含まれる一つの点で示される変換基準点を基準にして時間方向に縮小することで、点で示される変換後状態に変換することに相当する。
Such spatial transformation is indicated by a point by reducing the pre-conversion state indicated by a line extending in the time direction in the time direction with reference to a conversion reference point indicated by one point included in the line. This corresponds to conversion to a post-conversion state.
この結果、例えば、図42に示すように、表示制御機能152によって、変換前は、複数の時点について、検体検査サマリデータが表示されていた状態が、変換後は、当該複数の時点のうちの一つの時点について、検体検査の計測値が表示された状態に切り替えられることになる。
As a result, for example, as shown in FIG. 42, the display control function 152 shows that the sample test summary data is displayed for a plurality of time points before the conversion. At one time point, the measurement value of the sample test is switched to the displayed state.
図43は、第1の実施形態に係る変換機能153によって行われる縮小変換の他の一例を示す図である。ここで、図43は、面を縮小によって線の表示へ変換する場合の一例を示している。
FIG. 43 is a diagram illustrating another example of the reduction conversion performed by the conversion function 153 according to the first embodiment. Here, FIG. 43 shows an example of converting the surface into a line display by reduction.
なお、図43に示す例でも、データ表示形式の上に、変換方向を指定するための三つのアイコンに加えて、指定された方向に縮小することを指定するためのアイコン9がさらに配置される。
43, in addition to the three icons for designating the conversion direction, an icon 9 for designating reduction in the designated direction is further arranged on the data display format. .
そして、例えば、図43の左側に示すように、操作者によって、変換前状態として、(W,T,D)=(*,*,DD)であるデータ表示形式が指定され、変換基準点として、(W,T,D)=(*,TD,DD)である位置が指定され、変換方向として時間方向(T=*)が指定され、さらに、当該方向に縮小することを指定されたとする。この場合には、例えば、図43の右側に示すように、変換機能153は、変換前状態を示す座標(*,*,DD)を、変換後状態を示す座標(*,TD,DD)に変換する。
For example, as shown on the left side of FIG. 43, a data display format (W, T, D) = (*, *, D D ) is designated by the operator as the pre-conversion state, and the conversion reference point , A position where (W, T, D) = (*, T D , D D ) is designated, a time direction (T = *) is designated as a conversion direction, and further reduction in that direction is designated. Suppose that In this case, for example, as shown on the right side of FIG. 43, the conversion function 153 converts the coordinates (*, *, D D ) indicating the state before conversion into the coordinates (*, T D , D indicating the state after conversion. D ) to convert.
このような空間変換は、幅方向及び時間方向に伸びる面で示される変換前状態を、当該面に含まれる幅方向に伸びる一つの線で示される変換基準点を基準にして時間方向に縮小することで、幅方向に伸びる線で示される変換後状態に変換することに相当する。
In such spatial transformation, the pre-conversion state indicated by the plane extending in the width direction and the time direction is reduced in the time direction with reference to the conversion reference point indicated by one line extending in the width direction included in the plane. This corresponds to the conversion into the post-conversion state indicated by the line extending in the width direction.
この結果、例えば、図43に示すように、表示制御機能152によって、変換前は、複数の時点について、投薬サマリデータと、検体検査サマリデータと、バイタルサマリデータとが表示されていた状態が、変換後は、当該複数の時点に含まれる一つの時点について、薬剤を示す情報と、検体検査の計測値と、バイタルの計測値とが表示された状態に切り替えられることになる。
As a result, for example, as shown in FIG. 43, the state in which the medication summary data, the specimen test summary data, and the vital summary data are displayed for a plurality of time points by the display control function 152 is as follows. After the conversion, for one time point included in the plurality of time points, the information indicating the medicine, the measurement value of the specimen test, and the measurement value of the vital are switched to a displayed state.
図44は、第1の実施形態に係る変換機能153によって行われる回転変換の一例を示す図である。ここで、図44は、線を回転変換する場合の一例を示している。
FIG. 44 is a diagram illustrating an example of rotation conversion performed by the conversion function 153 according to the first embodiment. Here, FIG. 44 shows an example in the case of rotationally converting a line.
例えば、図44の左側に示すように、操作者によって、変換前状態として、(W,T,D)=(WE1,*,DE1)であるデータ表示形式が指定され、変換基準点として、(W,T,D)=(WE1,TE1,DE1)である位置が指定され、変換方向として深さ方向(D=*)が指定されたとする。この場合には、例えば、図44の右側に示すように、変換機能153は、変換前状態を示す座標(WE1,*,DE1)を、変換後状態を示す座標(WE1,TE1,*)に変換する。
For example, as shown on the left side of FIG. 44, a data display format (W, T, D) = (W E1 , *, D E1 ) is designated by the operator as a pre-conversion state, and is used as a conversion reference point. , (W, T, D) = (W E1 , T E1 , D E1 ) is designated, and the depth direction (D = *) is designated as the conversion direction. In this case, for example, as shown on the right side of FIG. 44, the conversion function 153 converts the coordinates (W E1 , *, D E1 ) indicating the pre-conversion state into coordinates (W E1 , T E1 ) indicating the post-conversion state. , *).
このような空間変換は、時間方向に伸びる線で示される変換前状態を、当該線に含まれる一つの点で示される変換基準点を基準にして深さ方向に回転することで、深さ方向に伸びる線で示される変換後状態に変換することに相当する。
In such a spatial transformation, the pre-conversion state indicated by the line extending in the time direction is rotated in the depth direction with reference to the conversion reference point indicated by one point included in the line, thereby the depth direction. This corresponds to the conversion into a post-conversion state indicated by a line extending in a circle.
この結果、例えば、図44に示すように、表示制御機能152によって、変換前は、複数の時点について、画像データが表示されていた状態が、変換後は、当該複数の時点に含まれる一つの時点について、画像データと、画像の計測値と、読影レポートとが表示された状態に切り替えられることになる。
As a result, for example, as shown in FIG. 44, the state in which the image data is displayed at a plurality of time points before the conversion by the display control function 152 is converted into one of the plurality of time points after the conversion. At the time point, the image data, the measured value of the image, and the interpretation report are switched to the displayed state.
図45は、第1の実施形態に係る変換機能153によって行われる回転変換の他の一例を示す図である。ここで、図45は、線を回転変換する場合の他の一例を示している。
FIG. 45 is a diagram illustrating another example of the rotation conversion performed by the conversion function 153 according to the first embodiment. Here, FIG. 45 shows another example in the case of rotationally converting a line.
例えば、図45の左側に示すように、操作者によって、変換前状態として、(W,T,D)=(WE2,*,DE2)であるデータ表示形式が指定され、変換基準点として、(W,T,D)=(WE2,TE2,DE2)である位置が指定され、変換方向として幅方向(W=*)が指定されたとする。この場合には、例えば、図45の右側に示すように、変換機能153は、変換前状態を示す座標(WE2,*,DE2)を、変換後状態を示す座標(*,TE2,DE2)に変換する。
For example, as shown on the left side of FIG. 45, a data display format (W, T, D) = (W E2 , *, D E2 ) is designated by the operator as a pre-conversion state, and is used as a conversion reference point. , (W, T, D) = (W E2 , T E2 , D E2 ) is designated, and the width direction (W = *) is designated as the conversion direction. In this case, for example, as shown on the right side of FIG. 45, the conversion function 153 uses the coordinates (W E2 , *, D E2 ) indicating the pre-conversion state as coordinates (*, T E2 , D E2 ).
このような空間変換は、時間方向に伸びる線で示される変換前状態を、当該線に含まれる一つの点で示される変換基準点を基準にして幅方向に回転することで、幅方向に伸びる線で示される変換後状態に変換することに相当する。
Such spatial transformation extends in the width direction by rotating the pre-conversion state indicated by the line extending in the time direction with respect to the conversion reference point indicated by one point included in the line. This corresponds to conversion to a post-conversion state indicated by a line.
この結果、例えば、図45に示すように、表示制御機能152によって、変換前は、複数の時点について、検体検査サマリデータが表示されていた状態が、変換後は、当該複数の時点に含まれる一つの時点について、薬剤を示す情報と、検体検査の計測値と、バイタルの計測値とが表示された状態に切り替えられることになる。
As a result, for example, as shown in FIG. 45, by the display control function 152, the state in which the specimen test summary data is displayed for a plurality of time points before the conversion is included in the plurality of time points after the conversion. At one point in time, the information indicating the medicine, the measured value of the specimen test, and the measured value of the vital are switched to the displayed state.
図46は、第1の実施形態に係る変換機能153によって行われる回転変換の他の一例を示す図である。ここで、図46は、面を回転変換する場合の一例を示している。
FIG. 46 is a diagram illustrating another example of the rotation conversion performed by the conversion function 153 according to the first embodiment. Here, FIG. 46 shows an example of the case where the surface is rotationally converted.
例えば、図46の左側に示すように、操作者によって、変換前状態として、(W,T,D)=(*,*,DF1)であるデータ表示形式が指定され、変換基準点として、(W,T,D)=(WF1,*,DF1)である位置が指定され、変換方向として深さ方向(D=*)が指定されたとする。この場合には、例えば、図46の右側に示すように、変換機能153は、変換前状態を示す座標(*,*,DF1)を、変換後状態を示す座標(WF1,*,*)に変換する。
For example, as shown on the left side of FIG. 46, the operator specifies a data display format (W, T, D) = (*, *, D F1 ) as the pre-conversion state, and the conversion reference point is Assume that a position where (W, T, D) = (W F1 , *, D F1 ) is designated, and the depth direction (D = *) is designated as the conversion direction. In this case, for example, as shown on the right side of FIG. 46, the conversion function 153 converts the coordinates (*, *, D F1 ) indicating the state before conversion into the coordinates (W F1 , *, * indicating the state after conversion. ).
このような空間変換は、幅方向及び時間方向に伸びる面で示される変換前状態を、当該面に含まれる時間方向に伸びる一つの線で示される変換基準点を基準にして深さ方向に回転することで、時間方向及び深さ方向に伸びる面で示される変換後状態に変換することに相当する。
In such spatial conversion, the pre-conversion state indicated by the plane extending in the width direction and the time direction is rotated in the depth direction with reference to the conversion reference point indicated by one line extending in the time direction included in the plane. By doing so, it corresponds to the conversion to the post-conversion state indicated by the plane extending in the time direction and the depth direction.
この結果、例えば、図46に示すように、表示制御機能152によって、変換前は、複数の時点について、画像の計測値と、検体検査サマリデータと、バイタルサマリデータとが表示されていた状態が、変換後は、当該複数の時点について、画像の計測値と、画像データと、読影レポートとがそれぞれ表示された状態に切り替えられることになる。
As a result, for example, as shown in FIG. 46, the display control function 152 displays the state in which the image measurement values, the specimen inspection summary data, and the vital summary data are displayed for a plurality of time points before the conversion. After the conversion, the measured values of the image, the image data, and the interpretation report are switched to the displayed states for the plurality of time points.
図47は、第1の実施形態に係る変換機能153によって行われる回転変換の他の一例を示す図である。ここで、図47は、面を回転変換する場合の他の一例を示している。
47 is a diagram illustrating another example of the rotation conversion performed by the conversion function 153 according to the first embodiment. Here, FIG. 47 shows another example when the surface is rotationally converted.
例えば、図47の左側に示すように、操作者によって、変換前状態として、(W,T,D)=(*,*,DF2)であるデータ表示形式が指定され、変換基準点として、(W,T,D)=(*,TF2,DF2)である位置が指定され、変換方向として深さ方向(D=*)が指定されたとする。この場合には、例えば、図47の右側に示すように、変換機能153は、変換前状態を示す座標(*,*,DF2)を、変換後状態を示す座標(*,TF2,*)に変換する。
For example, as shown on the left side of FIG. 47, a data display format (W, T, D) = (*, *, D F2 ) is designated by the operator as the pre-conversion state, and the conversion reference point is It is assumed that a position where (W, T, D) = (*, T F2 , D F2 ) is designated and the depth direction (D = *) is designated as the conversion direction. In this case, for example, as shown on the right side of FIG. 47, the conversion function 153 converts the coordinates (*, *, D F2 ) indicating the pre-conversion state into coordinates (*, T F2 , * indicating the post-conversion state. ).
このような空間変換は、幅方向及び時間方向に伸びる面で示される変換前状態を、当該面に含まれる幅方向に伸びる一つの線で示される変換基準点を基準にして深さ方向に回転することで、幅方向及び深さ方向に伸びる面で示される変換後状態に変換することに相当する。
In such spatial transformation, the pre-conversion state indicated by the plane extending in the width direction and the time direction is rotated in the depth direction with reference to the conversion reference point indicated by one line extending in the width direction included in the plane. This corresponds to the conversion into a post-conversion state indicated by a surface extending in the width direction and the depth direction.
この結果、例えば、図47に示すように、表示制御機能152によって、変換前は、複数の時点について、画像の計測値と、心電図の計測値とが表示されていた状態が、変換後は、当該複数の時点に含まれる一つの時点について、画像データと、画像の計測値と、読影レポートと、心電図の画像データと、心電図の計測値と、心電図レポートとが表示された状態に切り替えられることになる。
As a result, for example, as shown in FIG. 47, by the display control function 152, the state in which the measured values of the image and the measured values of the electrocardiogram are displayed at a plurality of time points before the conversion is The image data, the image measurement value, the interpretation report, the electrocardiogram image data, the electrocardiogram measurement value, and the electrocardiogram report can be switched to one time point included in the plurality of time points. become.
図48は、第1の実施形態に係る変換機能153によって行われる平行移動変換の一例を示す図である。ここで、図48は、線を平行移動変換する場合の一例を示している。
FIG. 48 is a diagram illustrating an example of translational conversion performed by the conversion function 153 according to the first embodiment. Here, FIG. 48 shows an example in the case where the line is translated and converted.
なお、図48に示す例では、データ表示形式の上に、変換方向として時間方向の前方向又は後方向を指定するためのアイコン10が配置される。
In the example shown in FIG. 48, an icon 10 for designating the forward direction or the backward direction of the time direction as the conversion direction is arranged on the data display format.
そして、例えば、図48の左側に示すように、操作者によって、変換前状態及び変換基準点として、(W,T,D)=(*,TG,DG)であるデータ表示形式が指定され、変換方向として時間方向の前方向(-T)が指定されたとする。この場合には、例えば、図48の右側に示すように、変換機能153は、変換前状態を示す座標(*,TG,DG)を、変換後状態を示す座標(*,TG-T,DG)に変換する。
For example, as shown on the left side of FIG. 48, the operator designates a data display format (W, T, D) = (*, T G , D G ) as the pre-conversion state and the conversion reference point. Assume that the forward direction (-T) in the time direction is designated as the conversion direction. In this case, for example, as shown on the right side of FIG. 48, the conversion function 153 converts the coordinates (*, T G , D G ) indicating the pre-conversion state into coordinates (*, T G − T, D G ).
このような空間変換は、幅方向に伸びる線で示される変換前状態を、当該線で示される変換基準点を基準にして時間方向に平行移動することで、幅方向に伸びる他の線で示される変換後状態に変換することに相当する。
Such spatial conversion is indicated by another line extending in the width direction by translating the pre-conversion state indicated by the line extending in the width direction in the time direction with reference to the conversion reference point indicated by the line. This corresponds to conversion to a post-conversion state.
この結果、例えば、図48に示すように、表示制御機能152によって、変換前は、一つの時点について、薬剤を示す情報と、検体検査の計測値と、バイタルの計測値とが表示されていた状態が、変換後は、他の一つの時点について、薬剤を示す情報と、検体検査の計測値と、バイタルの計測値とが表示された状態に切り替えられることになる。
As a result, for example, as shown in FIG. 48, the information indicating the medicine, the measured value of the specimen test, and the measured value of the vital test were displayed at one time point by the display control function 152 before the conversion. After the state is converted, the information indicating the medicine, the measured value of the sample test, and the measured value of the vital are switched to a state in which the information is displayed at another time point.
図49は、第1の実施形態に係る変換機能153によって行われる平行移動変換の他の一例を示す図である。ここで、図49は、面を平行移動変換する場合の一例を示している。
FIG. 49 is a diagram illustrating another example of the translation conversion performed by the conversion function 153 according to the first embodiment. Here, FIG. 49 shows an example of a case where the surface is translated and converted.
なお、図49に示す例では、データ表示形式の上に、変換方向として深さ方向の前方向又は後方向を指定するためのアイコン11が配置される。
In the example shown in FIG. 49, an icon 11 for designating the forward direction or the backward direction in the depth direction as the conversion direction is arranged on the data display format.
そして、例えば、図49の左側に示すように、操作者によって、変換前状態及び変換基準点として、(W,T,D)=(*,*,DH)であるデータ表示形式が指定され、変換方向として深さ方向の後方向(+D)が指定されたとする。この場合には、例えば、図49の右側に示すように、変換機能153は、変換前状態を示す座標(*,*,DH)を、変換後状態を示す座標(*,*,DH+D)に変換する。
For example, as shown on the left side of FIG. 49, the operator designates a data display format (W, T, D) = (*, *, D H ) as the pre-conversion state and the conversion reference point. Suppose that the backward direction (+ D) in the depth direction is designated as the conversion direction. In this case, for example, as shown on the right side of FIG. 49, conversion function 153, coordinates indicating the pre-conversion state (*, *, D H) of the coordinates indicating the converted state (*, *, D H + D).
このような空間変換は、幅方向及び時間方向に伸びる面で示される変換前状態を、当該面で示される変換基準点を基準にして深さ方向に平行移動することで、幅方向及び時間方向に伸びる他の面で示される変換後状態に変換することに相当する。
Such spatial conversion is performed by translating the pre-conversion state indicated by the plane extending in the width direction and the time direction in the depth direction with reference to the conversion reference point indicated by the plane, so that the width direction and the time direction. This corresponds to the conversion to the post-conversion state indicated by the other surface extending in (1).
この結果、例えば、図49に示すように、表示制御機能152によって、変換前は、複数の時点について、画像の計測値と、心電図の計測値とが表示されていた状態が、変換後は、当該複数の時点について、画像データと、心電図の画像データとが表示された状態に切り替えられることになる。
As a result, for example, as shown in FIG. 49, the display control function 152 displays the image measurement values and the electrocardiogram measurement values for a plurality of time points before conversion. The image data and the electrocardiogram image data are switched to the displayed state for the plurality of time points.
以上、いくつかの例を説明したが、変換機能153によって行われる空間変換は、上述したような2次元の空間変換に限られない。例えば、変換機能153は、面から空間への拡大、空間の回転や平行移動、空間から面への縮小等のような三次元以上の空間変換を行ってもよい。
Although some examples have been described above, the spatial transformation performed by the transformation function 153 is not limited to the two-dimensional spatial transformation as described above. For example, the conversion function 153 may perform three-dimensional or more spatial conversion such as expansion from a surface to space, rotation or translation of the space, reduction from space to surface, and the like.
上述したように、第1の実施形態では、診療データごとに定義されたデータ表示形式に対応付けられた次元を有する診療データ空間上で、操作者によって指定された変換基準点を基準にして空間変換を行うことで、診療データの表示の切り替えが行われる。
As described above, in the first embodiment, in the medical data space having a dimension associated with the data display format defined for each medical data, the space is based on the conversion reference point designated by the operator. By performing the conversion, the display of the medical data is switched.
例えば、従来技術の中には、多角的に情報を把握するための手段として、2種類の属性(日付、データ項目)に分類された情報を表形式に表示し、3通りの選択方式に応じて3通りの表示形式で表示する技術がある。
For example, in the prior art, as a means for grasping information from various angles, information classified into two types of attributes (date, data item) is displayed in a table format, and according to three selection methods. There are technologies that display in three display formats.
ここで、一般的に、多角的に情報を把握する際には、現在表示されている情報を起点として、視点の切り替えが行われる。例えば、俯瞰的な検査結果の確認において、気になる検査結果があれば、その検査結果の詳細を確認する、又は、その検査結果の時間的な推移を確認する、等の視点に切り替えが行われる。また、詳細な検査結果の確認においても、気になる検査結果があれば、その直前の治療内容(投薬等)と比較する、または、他の患者の検査結果と比較する、等の視点に切り替えが行われる。
Here, generally, when grasping information from various angles, the viewpoint is switched from the currently displayed information as a starting point. For example, in the confirmation of a bird's eye inspection result, if there is an inspection result that you are interested in, check the details of the inspection result or check the temporal transition of the inspection result. Is called. Also, in the confirmation of detailed test results, if there is a test result that you are interested in, switch to the viewpoint such as comparing with the treatment content (medicine etc.) immediately before that, or comparing with the test results of other patients. Is done.
しかしながら、上述した従来技術では、表示形式の切り替え時に、現在表示されている情報や注目している情報は考慮されないため、切り替えの前後で表示内容の関連性や注目点の情報が失われてしまう。その結果、操作者にとって直観的かつ臨床的に意味のある切り替えにならず、操作者が患者状態や治療内容等を把握することを妨げてしまうことがあり得る。この他にも、上述した従来技術では、表形式の表示は2種類の属性に限定されるため、分析の視点が限られてしまうことがあり得る。例えば、異なる詳細度のデータを比較する場合や、同じデータの異なる患者間のデータで比較する場合等、表形式及びその選択方式では、これらを含めた切り替えは実現できない。
However, in the above-described prior art, when the display format is switched, currently displayed information or information of interest is not taken into consideration, and thus the relevance of the display contents and the information of the attention point are lost before and after the switching. . As a result, the switching is not intuitively and clinically meaningful for the operator, and the operator may be prevented from grasping the patient state, treatment content, and the like. In addition, in the above-described conventional technology, the tabular display is limited to two types of attributes, and thus the viewpoint of analysis may be limited. For example, when data of different levels of detail are compared, or when data is compared between different patients of the same data, switching including these cannot be realized in the tabular format and its selection method.
このような従来技術に対し、第1の実施形態では、指定された変換基準点を基準にして空間変換を行って診療データの表示を切り替えることで、現在表示されている情報を起点として診療データを多角的に閲覧することができる。したがって、本実施形態によれば、臨床的な検討目的に応じて、適切な表示形式で診療データを提示することができる。
In contrast to such conventional techniques, in the first embodiment, the medical data is started from the currently displayed information by performing spatial conversion on the basis of the designated conversion reference point and switching the display of the medical data. Can be viewed from various angles. Therefore, according to the present embodiment, medical data can be presented in an appropriate display format according to the clinical examination purpose.
(第2の実施形態)
なお、上述した実施形態では、変換機能153が、操作者によって指定された変換前状態、変換基準点及び変換方向に基づいて、空間変換を行う場合の例を説明したが、実施形態はこれに限られない。 (Second Embodiment)
In the above-described embodiment, the example in which theconversion function 153 performs the spatial conversion based on the pre-conversion state, the conversion reference point, and the conversion direction specified by the operator has been described. Not limited.
なお、上述した実施形態では、変換機能153が、操作者によって指定された変換前状態、変換基準点及び変換方向に基づいて、空間変換を行う場合の例を説明したが、実施形態はこれに限られない。 (Second Embodiment)
In the above-described embodiment, the example in which the
例えば、変換機能153は、さらに、指定された変換量に基づいて、空間変換を行ってもよい。以下では、このような例を第2の実施形態として説明する。なお、第2の実施形態では、上述した実施形態と異なる点を中心に説明することとし、上述した実施形態と重複する内容については説明を省略する。
For example, the conversion function 153 may further perform spatial conversion based on the specified conversion amount. Hereinafter, such an example will be described as a second embodiment. Note that in the second embodiment, the description will focus on the points that differ from the above-described embodiment, and the description of the contents that overlap with the above-described embodiment will be omitted.
本実施形態では、表示制御機能152は、表示画面を介して、空間変換の変換量を指定する操作を操作者から受け付けるための受付手段を提供する。
In the present embodiment, the display control function 152 provides an accepting unit for accepting an operation for designating the conversion amount of the spatial transformation from the operator via the display screen.
図50は、第2の実施形態に係る表示制御機能152によって提供される受付手段の一例を示す図である。
FIG. 50 is a diagram illustrating an example of a reception unit provided by the display control function 152 according to the second embodiment.
例えば、図50に示すように、表示制御機能152は、変換方向を指定するためのアイコンに対する操作が行われた場合に、変換量を指定するための操作受付部を表示画面上に表示する。例えば、表示制御機能152は、変換量を指定するための操作受付部として、診療データの分類を列挙したプルダウンメニュー12を表示する。
For example, as shown in FIG. 50, the display control function 152 displays, on the display screen, an operation reception unit for designating a conversion amount when an operation is performed on an icon for designating a conversion direction. For example, the display control function 152 displays a pull-down menu 12 listing medical data classifications as an operation receiving unit for designating the conversion amount.
図51は、第2の実施形態に係る表示制御機能152によって表示されるプルダウンメニュー12の一例を示す図である。
FIG. 51 is a diagram showing an example of the pull-down menu 12 displayed by the display control function 152 according to the second embodiment.
例えば、図51に示すように、表示制御機能152によって表示されるプルダウンメニュー12には、「介入」、「レスポンス」等の分類を示す情報が列挙される。
For example, as shown in FIG. 51, the pull-down menu 12 displayed by the display control function 152 lists information indicating classifications such as “intervention” and “response”.
この場合に、例えば、記憶回路120は、統合診療DBの一つとして、診療データの分類ごとに変換量を定義した粒度マッピングテーブルを記憶する。
In this case, for example, the storage circuit 120 stores a granularity mapping table in which a conversion amount is defined for each classification of medical data as one integrated medical DB.
図52は、第2の実施形態に係る粒度マッピングテーブルの一例を示す図である。
FIG. 52 is a diagram showing an example of a granularity mapping table according to the second embodiment.
例えば、図52に示すように、粒度マッピングテーブルは、マッピングIDと、名称と、テーブルとを対応付けた情報を記憶する。マッピングIDには、診療データの分類を一意に識別する識別情報が設定される。名称には、当該分類の名称が設定される。テーブルには、当該分類に対応する方向の変換量を示す情報として、表示対象とする診療データのテーブルを示す情報が設定される。
For example, as shown in FIG. 52, the granularity mapping table stores information in which a mapping ID, a name, and a table are associated with each other. In the mapping ID, identification information that uniquely identifies the classification of the medical data is set. In the name, the name of the classification is set. In the table, information indicating a table of medical data to be displayed is set as information indicating the conversion amount in the direction corresponding to the classification.
そして、本実施形態では、変換機能153は、操作者によって指定された変換前状態、変換基準点、変換方向及び変換量に基づいて、空間変換を行う。具体的には、変換機能153は、取得した変換前状態、変換基準点、変換方向と、表示座標マスタの情報と、粒度マッピングテーブルの情報とに基づいて、変換後状態の座標及び次元を取得する。
In this embodiment, the conversion function 153 performs spatial conversion based on the pre-conversion state, conversion reference point, conversion direction, and conversion amount specified by the operator. Specifically, the conversion function 153 acquires the coordinates and dimensions of the post-conversion state based on the acquired pre-conversion state, conversion reference point, conversion direction, display coordinate master information, and granularity mapping table information. To do.
図53は、第2の実施形態に係る変換機能153による変換後状態を示す座標の算出の一例を示す図である。
FIG. 53 is a diagram illustrating an example of calculation of coordinates indicating a post-conversion state by the conversion function 153 according to the second embodiment.
例えば、図53の左上から右側にかけて示すように、変換機能153は、変換前状態を示す座標が(W,T,D)=(5,*,2)であり、変換基準点を示す座標が(W,T,D)=(5,*,2)であり、変換方向を示す座標がW=*であり、変換量がW=+1であった場合には、変換後状態を示す座標として、(W,T,D)=((1,5),*,2)を算出する。ここで、変換量がW=+1であることは、(W,T,D)=(5,*,2)であるデータ表示形式に加えて、(W,T,D)=(1,*,2)であるデータ表示形式をさらに表示することを意味する。
For example, as shown from the upper left to the right side of FIG. 53, the conversion function 153 has coordinates (W, T, D) = (5, *, 2) indicating the state before conversion and coordinates indicating the conversion reference point. When (W, T, D) = (5, *, 2), the coordinate indicating the conversion direction is W = *, and the conversion amount is W = + 1, the coordinate indicating the post-conversion state is used. , (W, T, D) = ((1, 5), *, 2). Here, the conversion amount W = + 1 means that (W, T, D) = (1, *) in addition to the data display format (W, T, D) = (5, *, 2). , 2) means to further display the data display format.
この場合に、変換機能153は、操作者によって、プルダウンメニュー12に表示されている分類の中から指定された分類、及び、指定された変換方向に基づいて、粒度マッピングテーブルに記憶されているテーブルの情報を参照して、表示対象とする診療データを取得する。また、変換機能153は、取得した診療データと、変換前状態に含まれている診療データとを比較することで、表示対象として追加又は削除するデータ表示形式を特定する。
In this case, the conversion function 153 is a table stored in the granularity mapping table based on the classification specified by the operator from the classifications displayed in the pull-down menu 12 and the specified conversion direction. The medical data to be displayed is acquired with reference to the information. Moreover, the conversion function 153 identifies the data display format to be added or deleted as a display target by comparing the acquired medical data with the medical data included in the pre-conversion state.
この結果、例えば、図53の左上から右側にかけて示すように、表示制御機能152によって、変換前は、検体検査に関する診療データとして、複数の時点について、検体検査サマリデータが表示されていた状態が、変換後は、当該検体検査サマリデータに加えて、投薬に関する診療データとして、当該複数の時点について、投薬サマリデータが表示された状態に切り替えられることになる。
As a result, for example, as shown from the upper left to the right side of FIG. 53, the display control function 152 shows that the specimen test summary data is displayed for a plurality of time points as medical data related to the specimen test before the conversion. After the conversion, in addition to the sample test summary data, the medication summary data is switched to the state where the medication summary data is displayed for the plurality of time points as the medical data regarding the medication.
例えば、上述した第1の実施形態で説明したように、変換量を用いない場合には、変換機能153は、変換後状態を示す座標として、(W,T,D)=(*,*,2)を算出することになる。この場合には、表示画面に表示されるデータ表示形式の数が多くなる結果、表示される診療データの量が多くなり、表示画面の情報が見にくくなることがあり得る(図53の左下を参照)。これに対し、第2の実施形態では、変換量を用いて空間変換を行うことで、表示画面に表示される診療データの数を調整することができ、表示画面の情報を見やすくすることができる。
For example, as described in the first embodiment described above, when the conversion amount is not used, the conversion function 153 uses (W, T, D) = (*, *, 2) is calculated. In this case, as a result of an increase in the number of data display formats displayed on the display screen, the amount of medical data displayed may increase, and the information on the display screen may be difficult to see (see the lower left in FIG. 53). ). On the other hand, in the second embodiment, by performing spatial conversion using the conversion amount, the number of medical data displayed on the display screen can be adjusted, and the information on the display screen can be easily viewed. .
なお、上述した例では、粒度マッピングテーブルを用いた場合の例を説明したが、実施形態はこれに限られない。例えば、表示座標マスタの表示座標マスタテーブルに、変換量を示す情報を含めてもよい。
In the above-described example, the example in which the granularity mapping table is used has been described, but the embodiment is not limited thereto. For example, information indicating the conversion amount may be included in the display coordinate master table of the display coordinate master.
図54は、第2の実施形態に係る表示座標マスタテーブルの一例を示す図である。また、図55は、第2の実施形態に係る表示座標マスタテーブルに設定される幅方向の座標値の単位を示す図である。
FIG. 54 is a diagram showing an example of a display coordinate master table according to the second embodiment. FIG. 55 is a diagram showing a unit of coordinate values in the width direction set in the display coordinate master table according to the second embodiment.
例えば、図54に示すように、幅方向の座標値について、図20に示したWidthに替えて、異なる変換量を示す情報として、Width大及びWidth小の二つの座標値を記憶する。
For example, as shown in FIG. 54, with respect to the coordinate value in the width direction, instead of the Width shown in FIG. 20, two coordinate values of a large Width and a small Width are stored as information indicating different conversion amounts.
ここで、例えば、図55に示すように、Width大には、介入に関するデータ、及び、レスポンスに関するデータの単位で、座標値が設定される。また、Width小には、投薬に関するデータ、画像に関するデータ、心電図に関するデータ、バイタルに関するデータ、及び、検体検査に関するデータの単位で、座標値が設定される。これにより、Width大に設定される座標値は、Width小に設定される座標値と比べて、一つの座標値により多くのデータ表示IDが対応付けられるように設定されることになる。
Here, for example, as shown in FIG. 55, coordinate values are set in the Width size in units of data concerning intervention and data concerning response. In the Width small, coordinate values are set in units of data relating to medication, data relating to images, data relating to electrocardiograms, data relating to vitals, and data relating to specimen examinations. Thereby, the coordinate value set to large Width is set so that more data display IDs are associated with one coordinate value than the coordinate value set to small Width.
この場合には、例えば、表示制御機能152は、「大」を示す情報と「小」を示す情報とを含んだプルダウンメニュー12を表示する。そして、変換機能153は、操作者によって「大」が指定された場合には、表示座標マスタテーブルのWidth大に設定されている座標値に基づいて、空間変換を行う。また、変換機能153は、操作者によって「小」が指定された場合には、表示座標マスタテーブルのWidth小に設定されている座標値に基づいて、空間変換を行う。
In this case, for example, the display control function 152 displays the pull-down menu 12 including information indicating “large” and information indicating “small”. Then, when “large” is designated by the operator, the conversion function 153 performs spatial conversion based on the coordinate value set to the large Width of the display coordinate master table. In addition, when “small” is designated by the operator, the conversion function 153 performs space conversion based on the coordinate value set to the small Width of the display coordinate master table.
この結果、表示制御機能152によって、操作者によって「大」が指定された場合には、操作者によって「小」が指定された場合と比べて、より多くの診療データが表示画面上に表示されることになる。
As a result, the display control function 152 displays more medical data on the display screen when “large” is designated by the operator than when “small” is designated by the operator. Will be.
以下、第2の実施形態に係る変換機能153によって行われる空間変換について、具体的な例を挙げて説明する。
Hereinafter, the spatial conversion performed by the conversion function 153 according to the second embodiment will be described with a specific example.
図56は、第2の実施形態に係る変換機能153によって行われる拡大又は縮小変換の一例を示す図である。ここで、図56は、幅方向の拡大又は縮小範囲を指定する場合の一例を示している。
FIG. 56 is a diagram illustrating an example of enlargement or reduction conversion performed by the conversion function 153 according to the second embodiment. Here, FIG. 56 shows an example in the case of designating an expansion or reduction range in the width direction.
なお、図56に示す例では、データ表示形式の上に、変換量を指定するための操作受付部として、診療データの分類を指定するためのプルダウンメニュー12が表示される。例えば、図56に示すように、表示制御機能152によって表示されるプルダウンメニュー12には、「介入」、「レスポンス」等の分類を示す情報が列挙される。
In the example shown in FIG. 56, a pull-down menu 12 for designating the classification of medical data is displayed as an operation accepting unit for designating the conversion amount on the data display format. For example, as shown in FIG. 56, the pull-down menu 12 displayed by the display control function 152 lists information indicating classifications such as “intervention” and “response”.
そして、例えば、図56の左側に示すように、操作者によって、変換前状態及び変換基準点として、(W,T,D)=(5,*,2)であるデータ表示形式が指定され、変換方向として幅方向(W=*)が指定されたとする。
For example, as shown on the left side of FIG. 56, a data display format (W, T, D) = (5, *, 2) is designated by the operator as the pre-conversion state and the conversion reference point, It is assumed that the width direction (W = *) is designated as the conversion direction.
ここで、さらに、操作者によって、変換量として「介入」が指定された場合には、例えば、図56の右上に示すように、変換機能153は、変換前状態を示す座標(5,*,2)を、変換後状態を示す座標((1,5),*,2)に変換する。
Here, when “intervention” is further designated as the conversion amount by the operator, for example, as shown in the upper right of FIG. 56, the conversion function 153 displays coordinates (5, *, 2) is converted into coordinates ((1, 5), *, 2) indicating the state after conversion.
このような空間変換は、時間方向に伸びる線で示される変換前状態を、当該線で示される変換基準点を基準にして介入の範囲内で幅方向に拡大することで、幅方向及び時間方向に伸びる面で示される変換後状態に変換することに相当する。
Such spatial conversion is performed by expanding the pre-conversion state indicated by the line extending in the time direction in the width direction within the scope of the intervention with reference to the conversion reference point indicated by the line. This corresponds to the conversion to the post-conversion state indicated by the plane extending in the figure.
この結果、例えば、図56の左側から右上にかけて示すように、表示制御機能152によって、変換前は、複数の時点について、検体検査サマリデータが表示されていた状態が、変換後は、当該複数の時点について、投薬サマリデータと、検体検査サマリデータとが表示された状態に切り替えられることになる。
As a result, for example, as shown from the left side to the upper right side of FIG. 56, the display control function 152 shows that the specimen test summary data is displayed for a plurality of time points before the conversion. With respect to the time point, the medication summary data and the specimen test summary data are switched to the displayed state.
一方、操作者によって、変換量として「レスポンス」が指定された場合には、例えば、図56の右下に示すように、変換機能153は、変換前状態を示す座標(5,*,2)を、変換後状態を示す座標((2~5),*,2)に変換する。
On the other hand, when “response” is designated as the conversion amount by the operator, for example, as shown in the lower right of FIG. 56, the conversion function 153 has coordinates (5, *, 2) indicating the state before conversion. Is converted into coordinates ((2 to 5), *, 2) indicating the post-conversion state.
このような空間変換は、時間方向に伸びる線で示される変換前状態を、当該線で示される変換基準点を基準にしてレスポンスの範囲内で幅方向に拡大することで、幅方向及び時間方向に伸びる面で示される変換後状態に変換することに相当する。
Such spatial conversion is performed by expanding the pre-conversion state indicated by the line extending in the time direction in the width direction within the range of the response with reference to the conversion reference point indicated by the line. This corresponds to the conversion to the post-conversion state indicated by the plane extending in the figure.
この結果、例えば、図56の左側から右下にかけて示すように、表示制御機能152によって、変換前は、複数の時点について、検体検査サマリデータが表示されていた状態が、変換後は、当該複数の時点について、検体検査サマリデータと、バイタルサマリデータと、画像の計測値と、心電図の計測値とが表示された状態に切り替えられることになる。
As a result, for example, as shown from the left side to the lower right side of FIG. 56, the state in which the specimen test summary data is displayed for a plurality of time points by the display control function 152 before the conversion is displayed. At this point, the specimen test summary data, the vital summary data, the measured values of the image, and the measured values of the electrocardiogram are switched to the displayed state.
図57は、第2の実施形態に係る変換機能153によって行われる拡大又は縮小変換の他の一例を示す図である。ここで、図57は、時間方向の拡大又は縮小範囲を指定する場合の一例を示している。
FIG. 57 is a diagram illustrating another example of enlargement or reduction conversion performed by the conversion function 153 according to the second embodiment. Here, FIG. 57 shows an example in the case of designating an expansion or reduction range in the time direction.
なお、図57に示す例では、データ表示形式の上に、変換量を指定するための操作受付部として、時間方向の範囲を指定するためのプルダウンメニュー13が表示される。ここで、例えば、プルダウンメニュー13には、「選択範囲まで」、「イベント前後」、「全時間範囲」が列挙される。
In the example shown in FIG. 57, a pull-down menu 13 for designating a range in the time direction is displayed on the data display format as an operation accepting unit for designating the conversion amount. For example, the pull-down menu 13 lists “up to a selection range”, “before and after an event”, and “all time range”.
例えば、図57の左側に示すように、操作者によって、変換前状態及び変換基準点として、(W,T,D)=(2,1,1)であるデータ表示形式が指定され、変換方向として時間方向(T=*)が指定されたとする。
For example, as shown on the left side of FIG. 57, the operator designates the data display format (W, T, D) = (2, 1, 1) as the pre-conversion state and the conversion reference point, and the conversion direction. Suppose that the time direction (T = *) is designated.
ここで、さらに、操作者によって、変換量として「選択範囲まで」が指定された場合には、例えば、図57の右上に示すように、変換機能153は、変換前状態を示す座標(2,1,1)を、変換後状態を示す座標(2,(1,2),1)に変換する。
Here, when “up to the selection range” is designated as the conversion amount by the operator, for example, as shown in the upper right of FIG. 57, the conversion function 153 displays the coordinates (2, 1, 1) is converted into coordinates (2, (1, 2), 1) indicating the post-conversion state.
このような空間変換は、点で示される変換前状態を、当該点で示される変換基準点を基準にして選択範囲まで時間方向に拡大することで、時間方向に伸びる線で示される変換後状態に変換することに相当する。
Such a spatial transformation is a post-conversion state indicated by a line extending in the time direction by expanding the pre-conversion state indicated by the point in the time direction up to the selection range with reference to the conversion reference point indicated by the point. Is equivalent to
この結果、例えば、図57の左側から右上にかけて示すように、表示制御機能152によって、変換前は、一つの時点について、画像データが表示されていた状態が、変換後は、当該一つの時点から選択範囲までの複数の時点について、画像データが表示された状態に切り替えられることになる。
As a result, for example, as shown from the left side to the upper right side of FIG. 57, the display control function 152 shows that the image data is displayed for one time point before the conversion, but after the conversion, from the one time point. At a plurality of time points up to the selection range, the image data is switched to the displayed state.
一方、操作者によって、移動量として「イベント前後」が指定された場合には、例えば、図57の右下に示すように、変換機能153は、変換前状態を示す座標(2,1,1)を、変換後状態を示す座標(2,(1~3),1)に変換する。
On the other hand, when “before / after event” is designated as the movement amount by the operator, for example, as shown in the lower right of FIG. 57, the conversion function 153 displays coordinates (2, 1, 1) indicating the state before conversion. ) Is converted into coordinates (2, (1-3), 1) indicating the post-conversion state.
このような空間変換は、点で示される変換前状態を、当該点で示される変換基準点を基準にしてイベントを跨ぐまで時間方向に拡大することで、時間方向に伸びる線で示される変換後状態に変換することに相当する。
Such spatial conversion is performed after the conversion indicated by the line extending in the time direction by expanding the pre-conversion state indicated by the point in the time direction until crossing the event with reference to the conversion reference point indicated by the point. It corresponds to converting to a state.
この結果、例えば、図57の左側から右下にかけて示すように、表示制御機能152によって、変換前は、一つの時点について、画像データが表示されていた状態が、変換後は、当該一つの時点からイベントを跨ぐまでの複数の時点について、画像データが表示された状態に切り替えられることになる。
As a result, for example, as shown from the left side to the lower right side of FIG. 57, the state in which image data is displayed for one time point before conversion by the display control function 152 is one time point after conversion. To a state where image data is displayed at a plurality of time points from when the event is crossed over to the event.
図58は、第2の実施形態に係る変換機能153によって行われる平行移動変換の一例を示す図である。ここで、図58は、時間方向の移動量を指定する場合の一例を示している。
FIG. 58 is a diagram illustrating an example of translational conversion performed by the conversion function 153 according to the second embodiment. Here, FIG. 58 shows an example in which the amount of movement in the time direction is designated.
なお、図58に示す例では、データ表示形式の上に、変換量を指定するための操作受付部として、時間方向の移動量を指定するためのプルダウンメニュー14が表示される。例えば、図58に示す例では、プルダウンメニュー14には、「前回」、「1ヵ月前」、「1年前」、「イベント前」が列挙される。
In the example shown in FIG. 58, a pull-down menu 14 for specifying a movement amount in the time direction is displayed on the data display format as an operation reception unit for specifying the conversion amount. For example, in the example shown in FIG. 58, “Previous”, “One month ago”, “One year ago”, and “Before event” are listed in the pull-down menu 14.
例えば、図58の左側に示すように、変換機能153は、操作者によって、変換前状態及び変換基準点として、(W,T,D)=(2,2,*)であるデータ表示形式が指定され、変換方向として時間方向(T=*)が指定されたとする。
For example, as shown on the left side of FIG. 58, the conversion function 153 has a data display format (W, T, D) = (2, 2, *) as the pre-conversion state and the conversion reference point by the operator. Assume that the time direction (T = *) is specified as the conversion direction.
ここで、さらに、操作者によって、移動量として「前回」が指定された場合には、例えば、図58の右上に示すように、変換機能153は、変換前状態を示す座標(2,2,*)を、変換後状態を示す座標(2,1,*)に変換する。
Here, when “previous” is designated as the movement amount by the operator, for example, as shown in the upper right of FIG. 58, the conversion function 153 has coordinates (2, 2, 2) indicating the state before conversion. *) Is converted into coordinates (2, 1, *) indicating the state after conversion.
このような空間変換は、深さ方向に伸びる線で示される変換前状態を、当該線で示される変換基準点を基準にして前回まで時間方向に移動することで、深さ方向に伸びる他の線で示される変換後状態に変換することに相当する。
Such spatial conversion is achieved by moving the pre-conversion state indicated by the line extending in the depth direction in the time direction up to the previous time with reference to the conversion reference point indicated by the line, so as to extend in the depth direction. This corresponds to conversion to a post-conversion state indicated by a line.
この結果、例えば、図58の左側から右上にかけて示すように、表示制御機能152によって、変換前は、一つの時点について、画像データと、画像の計測値と、読影レポートとが表示されていた状態が、変換後は、当該一つの時点の前回の時点について、画像データと、画像の計測値と、読影レポートとが表示された状態に切り替えられることになる。
As a result, for example, as shown from the left side to the upper right side of FIG. 58, the display control function 152 displays the image data, the measured value of the image, and the interpretation report for one time point before the conversion. However, after the conversion, the image data, the measured value of the image, and the interpretation report are switched to the state displayed for the previous time point of the one time point.
一方、操作者によって、移動量として「イベント前」が指定された場合には、例えば、図58の右下に示すように、変換機能153は、変換前状態を示す座標(2,2,*)を、変換後状態を示す座標(2,5,*)に変換する。
On the other hand, when “before event” is designated as the movement amount by the operator, for example, as shown in the lower right of FIG. 58, the conversion function 153 displays coordinates (2, 2, * ) Is converted into coordinates (2, 5, *) indicating the state after conversion.
このような空間変換は、深さ方向に伸びる線で示される変換前状態を、当該線で示される変換基準点を基準にして所定のイベント前まで時間方向に移動することで、深さ方向に伸びる他の線で示される変換後状態に変換することに相当する。
Such spatial conversion is performed by moving the pre-conversion state indicated by the line extending in the depth direction in the depth direction by moving in the time direction until a predetermined event with reference to the conversion reference point indicated by the line. This corresponds to conversion to a post-conversion state indicated by another line that extends.
この結果、例えば、図58の左側から右下にかけて示すように、表示制御機能152によって、変換前は、一つの時点について、画像データと、画像の計測値と、読影レポートとが表示されていた状態が、変換後は、当該一つの時点とは異なるイベント前の時点について、画像データと、画像の計測値と、読影レポートとが表示された状態に切り替えられることになる。
As a result, for example, as shown from the left side to the lower right side of FIG. 58, the display control function 152 displayed the image data, the measured value of the image, and the interpretation report for one time point before the conversion. After the conversion, the state is switched to the state in which the image data, the measured value of the image, and the interpretation report are displayed at the time point before the event different from the one time point.
上述したように、第2の実施形態では、変換前状態、変換基準点及び変換方向に加えて、指定された変換量に基づいて、空間変換が行われる。したがって、第2の実施形態によれば、空間変換の変換量を取得することで、変換方向等だけでは特定できない変換後の表示範囲を任意に指定することができるようになる。
As described above, in the second embodiment, space conversion is performed based on the specified conversion amount in addition to the pre-conversion state, the conversion reference point, and the conversion direction. Therefore, according to the second embodiment, by acquiring the conversion amount of the spatial conversion, it is possible to arbitrarily specify the display range after conversion that cannot be specified only by the conversion direction or the like.
例えば、幅方向の拡大変換では、データの種類が増えた場合に診療データの表示量が多くなり、それにより診療データの視認性が低下することがあり得る。これに対し、第2の実施形態では、変換量を指定することによって、適切な拡大範囲に制限する(表示するデータ種を制限する)ことができ、診療データの視認性を高めることが可能になる。また、時間方向の平行移動変換では、移動量を指定することによって、所望の時点の診療データへの変換が容易になる。
For example, in the enlargement conversion in the width direction, when the number of types of data increases, the display amount of the medical data increases, which may reduce the visibility of the medical data. On the other hand, in the second embodiment, by specifying the conversion amount, it is possible to limit to an appropriate expansion range (limit the data types to be displayed), and to improve the visibility of medical data. Become. In parallel translation conversion in the time direction, the conversion to medical data at a desired time becomes easy by specifying the amount of movement.
(第3の実施形態)
なお、上述した実施形態では、診療データ空間において、データ表示形式が、幅方向、時間方向及び深さ方向に対応付けられる場合の例を説明したが、実施形態はこれに限られない。 (Third embodiment)
In the above-described embodiment, the example in which the data display format is associated with the width direction, the time direction, and the depth direction in the medical data space has been described, but the embodiment is not limited thereto.
例えば、診療データ空間は、患者に対応する次元をさらに有してもよい。以下では、このような例を第3の実施形態として説明する。なお、第3の実施形態では、上述した実施形態と異なる点を中心に説明することとし、上述した実施形態と重複する内容については説明を省略する。
For example, the medical data space may further have a dimension corresponding to the patient. Hereinafter, such an example will be described as a third embodiment. Note that, in the third embodiment, the description will be focused on differences from the above-described embodiment, and the description overlapping with the above-described embodiment will be omitted.
本実施形態では、表示制御機能152は、表示画面を介して、患者方向の位置を指定する操作を操作者から受け付けるための受付手段を提供する。
In the present embodiment, the display control function 152 provides an accepting means for accepting an operation for designating the position in the patient direction from the operator via the display screen.
図59は、第3の実施形態に係る表示制御機能152によって提供される受付手段の一例を示す図である。
FIG. 59 is a diagram showing an example of accepting means provided by the display control function 152 according to the third embodiment.
例えば、図59に示すように、表示制御機能152は、データ表示形式の上に、変換方向を指定するための三つのアイコンに加えて、患者方向への変換を指定するためのアイコン15をさらに配置する。
For example, as shown in FIG. 59, the display control function 152 further includes an icon 15 for designating conversion to the patient direction in addition to three icons for designating the conversion direction on the data display format. Deploy.
そして、本実施形態では、変換機能153は、操作者によって患者方向への変換が指定された場合に、変換前状態が指定された際に表示されていた該当患者の診療データと同じデータ表示形式で、他の患者の診療データを表示する。ここで、例えば、患者(P)方向をさらに含む診療データ空間の座標は、(W,T,D,P)で示される。
In this embodiment, the conversion function 153 has the same data display format as the medical data of the corresponding patient displayed when the pre-conversion state is specified when conversion to the patient direction is specified by the operator. Then, the medical data of other patients is displayed. Here, for example, the coordinates of the medical data space further including the patient (P) direction are represented by (W, T, D, P).
例えば、図59に示すように、変換機能153は、操作者によって、変換前状態及び変換基準点として、(W,T,D,P)=(W#,*,D#,P#)であるデータ表示形式が指定され、変換方向として患者方向(P=*)が指定された場合には、変換前状態を示す座標(W#,*,D#,P#)を、変換後状態を示す座標(W#,*,D#,*)に変換する。
For example, as shown in FIG. 59, the conversion function 153 is set by the operator as (W, T, D, P) = (W # , *, D # , P # ) as the pre-conversion state and the conversion reference point. When a certain data display format is specified and the patient direction (P = *) is specified as the conversion direction, the coordinates (W # , *, D # , P # ) indicating the pre-conversion state are displayed as the post-conversion state. Convert to the indicated coordinates (W # , *, D # , *).
このような空間変換は、時間方向に伸びる線で示される変換前状態を、当該線で示される変換基準点を基準にして患者方向に縮小することで、時間方向及び患者方向に伸びる面で示される変換後状態に変換することに相当する。
Such spatial conversion is indicated by a plane extending in the time direction and the patient direction by reducing the pre-conversion state indicated by the line extending in the time direction to the patient direction with reference to the conversion reference point indicated by the line. This corresponds to conversion to a post-conversion state.
この結果、例えば、図59に示すように、表示制御機能152によって、変換前は、該当患者について、投薬、検体検査及びバイタルに関する診療データとして、投薬サマリデータ、検体検査サマリデータ、及び、バイタルサマリデータが表示されていた状態が、変換後は、該当患者、患者A、患者B及び患者Cそれぞれについて、検体検査に関する診療データとして、検体検査サマリデータが表示された状態に切り替えられることになる。
As a result, for example, as shown in FIG. 59, by the display control function 152, before the conversion, as the medical data related to the medication, the specimen test, and the vital data, the medication summary data, the specimen test summary data, and the vital summary are converted. After conversion, the state in which the data is displayed is switched to the state in which the specimen test summary data is displayed as the medical data related to the specimen test for each patient, patient A, patient B, and patient C.
なお、ここでは、他の患者の診療データを患者ごとに表示する場合の例について説明したが、実施形態はこれに限られない。例えば、他の患者の診療データについては、平均値等でまとめて一つのデータ表示形式として表示してもよい。
In addition, although the example in the case of displaying the medical data of another patient for every patient was demonstrated here, embodiment is not restricted to this. For example, the medical data of other patients may be displayed together as an average value or the like as one data display format.
また、表示対象となる患者は、疾患や診療のフェーズ等で絞り込んでもよいし、操作者又はシステムが特定した患者に限定してもよい。また、第2の実施形態のように空間変換の変換量を指定することによって、表示対象となる患者を操作者が指定できるようにしてもよい。
In addition, the patients to be displayed may be narrowed down by disease or medical treatment phase, or may be limited to patients specified by the operator or the system. Further, by specifying the conversion amount of the spatial conversion as in the second embodiment, the operator may specify the patient to be displayed.
上述したように、第3の実施形態では、診療データ空間が、患者に対応する次元をさらに有する。したがって、第3の実施形態によれば、患者軸を含めた次元からなるデータ表示の切り替えが可能になる。これにより、任意のデータ表示形式において、患者を横断した診療データの比較が可能になる。
As described above, in the third embodiment, the medical data space further has a dimension corresponding to the patient. Therefore, according to the third embodiment, it is possible to switch data display including dimensions including the patient axis. This makes it possible to compare medical data across patients in any data display format.
(第4の実施形態)
なお、上述した実施形態では、診療データ空間と各種の診療データとの対応付けを固定した場合の例を説明したが、実施形態はこれに限られない。 (Fourth embodiment)
In the above-described embodiment, an example in which the association between the medical data space and various medical data is fixed has been described, but the embodiment is not limited thereto.
なお、上述した実施形態では、診療データ空間と各種の診療データとの対応付けを固定した場合の例を説明したが、実施形態はこれに限られない。 (Fourth embodiment)
In the above-described embodiment, an example in which the association between the medical data space and various medical data is fixed has been described, but the embodiment is not limited thereto.
例えば、診療データ及び診療データ空間は、変換機能153は、疾病、操作者又は診療フェーズに応じて動的に変更されてもよい。なお、ここでいう操作者は、医師、放射線科医、看護師等である。また、診療フェーズは、外来、診断、術前、術後等である。
For example, in the medical data and the medical data space, the conversion function 153 may be dynamically changed according to a disease, an operator, or a medical care phase. Here, the operator is a doctor, a radiologist, a nurse, or the like. The medical care phase is outpatient, diagnosis, preoperative, postoperative, etc.
例えば、表示制御機能152及び変換機能153は、疾病、操作者又は診療フェーズに応じて、診療データ空間に対応付けられる診療データの種類を変更する。または、例えば、表示制御機能152及び変換機能153は、疾病、操作者又は診療フェーズに応じて、診療データ空間上で各データ表示形式に対応付けられている座標を変更する。
For example, the display control function 152 and the conversion function 153 change the type of medical data associated with the medical data space according to the disease, the operator, or the medical service phase. Alternatively, for example, the display control function 152 and the conversion function 153 change the coordinates associated with each data display format in the medical data space according to the disease, the operator, or the medical care phase.
この場合には、例えば、記憶回路120が、必要な種類の診療データを記憶したテーブルを統合診療DBに保持しておき、各診療データのデータ表示形式をデータ表示形式マスタに記憶しておく。さらに、記憶回路120は、疾病、操作者又は診療フェーズごとに、データ表示形式マスタと表示座標マスタとの組み合わせを記憶しておく。そして、例えば、表示制御機能152及び変換機能153が、疾病、操作者の職種又は診療フェーズの指定を操作者から受け付け、受け付けた内容に応じて、各処理に用いるデータ表示形式マスタ及び表示座標マスタを切り替える。
In this case, for example, the storage circuit 120 holds a table storing necessary types of medical data in the integrated medical database, and stores the data display format of each medical data in the data display format master. Furthermore, the storage circuit 120 stores a combination of a data display format master and a display coordinate master for each disease, operator, or medical care phase. Then, for example, the display control function 152 and the conversion function 153 accept the designation of the disease, the operator's occupation type or the medical care phase from the operator, and the data display format master and the display coordinate master used for each process according to the received contents. Switch.
例えば、表示制御機能152及び変換機能153は、疾病が心不全の場合は、診療データとして食事データを用い、癌の場合は、診療データとして病理画像を用いるように、データ表示形式マスタ及び表示座標マスタを切り替える。
For example, the display control function 152 and the conversion function 153 use a data display format master and a display coordinate master so that meal data is used as medical data when the disease is heart failure, and pathological images are used as medical data when the disease is cancer. Switch.
また、例えば、表示制御機能152及び変換機能153は、操作者の職種が放射線科医である場合には、診療データとして、画像の読影レポートの代わりに臨床アプリケーションの画面データを用いるように、データ表示形式マスタ及び表示座標マスタを切り替える。また、例えば、表示制御機能152及び変換機能153は、操作者の職種が内科医の場合には、診療データとして、介入及びレスポンスに関するデータを用い、放射線科医である場合には、HIS300、RIS400及びPACS500から取得したデータを用いるように、データ表示形式マスタ及び表示座標マスタを切り替える。
In addition, for example, when the operator's occupation is a radiologist, the display control function 152 and the conversion function 153 are configured so that the clinical application screen data is used as the medical data instead of the image interpretation report. Switch between display format master and display coordinate master. In addition, for example, the display control function 152 and the conversion function 153 use data regarding intervention and response as medical data when the occupation of the operator is a physician, and HIS 300 and RIS 400 when the operator is a radiologist. And the data display format master and the display coordinate master are switched so that the data acquired from the PACS 500 is used.
また、例えば、表示制御機能152及び変換機能153は、診療フェーズが外来である場合には、診療データとして、バイタルや看護記録を含まないように、データ表示形式マスタ及び表示座標マスタを切り替える。
Also, for example, when the medical care phase is outpatient, the display control function 152 and the conversion function 153 switch the data display format master and the display coordinate master so as not to include vitals and nursing records as medical data.
上述したように、第4の実施形態では、疾病、操作者又は診療フェーズに応じて、診療データ及び診療データ空間が動的に変更される。したがって、第4の実施形態によれば、臨床的な検討目的に応じて、より適切に診療データの表示を切り替えることができる。
As described above, in the fourth embodiment, the medical data and the medical data space are dynamically changed according to the disease, the operator, or the medical care phase. Therefore, according to the fourth embodiment, it is possible to switch the display of medical data more appropriately according to the clinical examination purpose.
(第5の実施形態)
また、上述した第1の実施形態では、表示制御機能152が、表示中のデータ表示形式に対応する診療データ空間上の位置を示すガイド情報として、横軸を時系列とし、縦軸をデータ種別とした表示形式で、診療データの有無を示すアイコンを表示する場合の例を説明したが(例えば、図31に示したガイド情報8を参照)、ガイド情報の例はこれに限られない。 (Fifth embodiment)
In the first embodiment described above, thedisplay control function 152 uses the time series on the horizontal axis and the data type on the vertical axis as guide information indicating the position in the medical data space corresponding to the data display format being displayed. In the display format described above, an example in which an icon indicating the presence or absence of medical data is displayed has been described (see, for example, the guide information 8 illustrated in FIG. 31), but examples of guide information are not limited thereto.
また、上述した第1の実施形態では、表示制御機能152が、表示中のデータ表示形式に対応する診療データ空間上の位置を示すガイド情報として、横軸を時系列とし、縦軸をデータ種別とした表示形式で、診療データの有無を示すアイコンを表示する場合の例を説明したが(例えば、図31に示したガイド情報8を参照)、ガイド情報の例はこれに限られない。 (Fifth embodiment)
In the first embodiment described above, the
そこで、以下では、ガイド情報に関する他の例を第5の実施形態として説明する。なお、第5の実施形態では、上述した実施形態と異なる点を中心に説明することとし、上述した実施形態と重複する内容については説明を省略する。
Therefore, in the following, another example relating to guide information will be described as a fifth embodiment. In the fifth embodiment, description will be made mainly on points different from the above-described embodiment, and description of contents overlapping with the above-described embodiment will be omitted.
本実施形態では、表示制御機能152は、ガイド情報として、診療データ空間の次元を立体的に示すグラフィックを表示し、当該グラフィック上で、表示中のデータ表示形式に対応する位置を示す情報を表示する。
In the present embodiment, the display control function 152 displays, as guide information, a graphic that three-dimensionally shows the dimensions of the medical data space, and displays information that indicates the position corresponding to the data display format being displayed on the graphic. To do.
図60~62は、第5の実施形態に係る表示制御機能152によって表示されるガイド情報の一例を示す図である。
60 to 62 are diagrams showing examples of guide information displayed by the display control function 152 according to the fifth embodiment.
例えば、図60~62に示すように、表示制御機能152は、表示画面上に、幅方向、深さ方向、及び時間方向それぞれに沿った辺を有する立方体状のグラフィック81を表示する。ここで、表示制御機能152は、表示画面をディスプレイ140に表示している間、グラフィック81を常に表示してもよいし、初期表示では表示せず、操作者から要求があった場合に表示してもよい。また、例えば、表示制御機能152は、PIP(Picture In Picture)のように、診療データを表示する表示画面とは別のサブ画面にグラフィック81を表示してもよい。
For example, as shown in FIGS. 60 to 62, the display control function 152 displays a cubic graphic 81 having sides along the width direction, the depth direction, and the time direction on the display screen. Here, the display control function 152 may always display the graphic 81 while the display screen is displayed on the display 140, or may not be displayed in the initial display, but may be displayed when requested by the operator. May be. In addition, for example, the display control function 152 may display the graphic 81 on a sub-screen different from the display screen that displays medical data, such as PIP (Picture In Picture).
そして、表示制御機能152は、立方体状のグラフィック81上で、表示中のデータ表示形式に対応する位置を示す情報を表示する。
The display control function 152 displays information indicating a position corresponding to the data display format being displayed on the cubic graphic 81.
例えば、図60は、図27及び33に示した例と同様に、表示制御機能152が、診療データ空間上で(W,T,D)=(2,1,*)の線で表される複数のデータ表示形式を表示する場合の例を示している。この場合には、例えば、図60に示すように、表示制御機能152は、立方体形状のグラフィック81上で、(W,T)=(2,1)の位置を通り、深さ方向に延びる線状のグラフィック82を表示する。
For example, in FIG. 60, the display control function 152 is represented by a line of (W, T, D) = (2, 1, *) in the medical data space, as in the example shown in FIGS. An example of displaying a plurality of data display formats is shown. In this case, for example, as shown in FIG. 60, the display control function 152 is a line extending in the depth direction through the position of (W, T) = (2, 1) on the cube-shaped graphic 81. A graphic 82 is displayed.
また、例えば、図61は、図34に示した例と同様に、表示制御機能152が、診療データ空間上で(W,T,D)=(2,*,1)の線で表される複数のデータ表示形式を表示する場合の例を示している。この場合には、例えば、図61に示すように、表示制御機能152は、立方体形状のグラフィック81上で、(W,D)=(2,1)の位置を通り、時間方向に延びる線状のグラフィック83を表示する。
For example, in FIG. 61, the display control function 152 is represented by a line of (W, T, D) = (2, *, 1) in the medical data space, as in the example shown in FIG. An example of displaying a plurality of data display formats is shown. In this case, for example, as shown in FIG. 61, the display control function 152 passes through the position of (W, D) = (2, 1) on the cube-shaped graphic 81 and extends in the time direction. The graphic 83 is displayed.
また、例えば、図62は、図36に示した例と同様に、表示制御機能152が、診療データ空間上で(W,T,D)=(*,*,2)の面で表される複数のデータ表示形式を表示する場合の例を示している。この場合には、例えば、図62に示すように、表示制御機能152は、立方体形状のグラフィック81上で、D=2の位置を通り、幅方向及び時間方向に広がる面状のグラフィック84を表示する。
Also, for example, in FIG. 62, the display control function 152 is represented by the plane (W, T, D) = (*, *, 2) on the medical data space, as in the example shown in FIG. An example of displaying a plurality of data display formats is shown. In this case, for example, as shown in FIG. 62, the display control function 152 displays a planar graphic 84 that passes through the position of D = 2 on the cubic graphic 81 and expands in the width direction and the time direction. To do.
また、例えば、表示制御機能152は、図24~27に示した例ように、診療データ空間上で(W,T,D)=(2,1,1)、(2,1,2)、(2,1,3)等のように点で表される複数のデータ表示形式を表示する場合には、立方体形状のグラフィック81上で、各点に対応する位置に点状のグラフィックを表示する。
In addition, for example, the display control function 152 has (W, T, D) = (2, 1, 1), (2, 1, 2), When displaying a plurality of data display formats represented by dots such as (2, 1, 3), etc., a dotted graphic is displayed at a position corresponding to each point on the cubic graphic 81. .
また、例えば、表示制御機能152は、診療データ空間上で複数の点、線、又は面で表される複数のデータ表示形式を同時に表示する場合には、それぞれを表す複数の点状、線状、又は面状のグラフィックを、立方体形状のグラフィック81上に同時に表示する。
In addition, for example, when the display control function 152 simultaneously displays a plurality of data display formats represented by a plurality of points, lines, or planes in the medical data space, the display control function 152 has a plurality of points, lines, Or a planar graphic is simultaneously displayed on the cubic graphic 81.
例えば、表示制御機能152は、図37に示した例のように、診療データ空間上で(W,T,D)=(2,1,*)の線で表される複数のデータ表示形式と、診療データ空間上で(W,T,D)=(*,*,2)の面で表される複数のデータ表示形式とを同時に表示する場合には、立方体形状のグラフィック81上で、(W,T)=(2,1)の位置を通り、深さ方向に延びる線状のグラフィックと、D=2の位置を通り、幅方向及び時間方向に広がる面状のグラフィックとを、それぞれ表示する。
For example, the display control function 152 has a plurality of data display formats represented by lines (W, T, D) = (2, 1, *) in the medical data space, as in the example shown in FIG. In the case of simultaneously displaying a plurality of data display formats represented by (W, T, D) = (*, *, 2) in the medical data space, on the cubic graphic 81 ( A linear graphic extending in the depth direction through the position of (W, T) = (2, 1) and a planar graphic extending in the width direction and the time direction through the position of D = 2 are respectively displayed. To do.
なお、例えば、図60~62に示すように、表示制御機能152は、一例として、複数の立方体を3軸方向に並べて配置した形状のグラフィック81を表示する。この場合に、例えば、表示制御機能152は、表示中のデータ表示形式の分類に応じて、各立方体の表示態様を変えるようにしてもよい。例えば、幅方向に関する一例として、表示制御機能152は、介入に関するデータ表示形式に対応する立方体と、レスポンスに関するデータ表示形式に対応する立方体とを異なる色で表示する。
For example, as shown in FIGS. 60 to 62, the display control function 152 displays a graphic 81 having a shape in which a plurality of cubes are arranged in three axial directions. In this case, for example, the display control function 152 may change the display mode of each cube according to the classification of the data display format being displayed. For example, as an example regarding the width direction, the display control function 152 displays a cube corresponding to the data display format related to intervention and a cube corresponding to the data display format related to response in different colors.
このように、本実施形態では、表示制御機能152が、ガイド情報として、診療データ空間の次元を立体的に示すグラフィックを表示し、当該グラフィック上で、表示中のデータ表示形式に対応する位置を示す情報を表示することによって、操作者が、表示中のデータ表示形式の診療データ空間上の位置をより直感的に把握できるようになる。
As described above, in the present embodiment, the display control function 152 displays, as guide information, a graphic that three-dimensionally represents the dimension of the medical data space, and a position corresponding to the data display format being displayed on the graphic. By displaying the information to be displayed, the operator can more intuitively grasp the position of the data display format being displayed in the medical data space.
また、本実施形態では、例えば、表示制御機能152が、さらに、上述した診療データ空間の次元を立体的に示すグラフィック81上で、診療データの表示を切り替える指示を操作者から受け付けてもよい。
In this embodiment, for example, the display control function 152 may further receive an instruction to switch the display of the medical data on the graphic 81 that three-dimensionally shows the dimensions of the above-described medical data space from the operator.
例えば、表示制御機能152は、診療データ空間の次元を示すグラフィック81上に表示された点状のグラフィック、線状のグラフィック、又は面状のグラフィックを回転、平行移動、拡大又は縮小する操作を操作者から受け付ける。
For example, the display control function 152 operates an operation of rotating, translating, enlarging, or reducing a dot-like graphic, a line-like graphic, or a planar graphic displayed on the graphic 81 indicating the dimension of the medical data space. Accept from the person.
具体的には、表示制御機能152は、診療データ空間の次元を示すグラフィック81上に表示された点状のグラフィック、線状のグラフィック、又は面状のグラフィックに対する操作を受け付けることによって、操作者から変換前状態、変換基準点及び変換方向の指定を受け付ける。
Specifically, the display control function 152 receives an operation on a dotted graphic, a linear graphic, or a planar graphic displayed on the graphic 81 indicating the dimension of the medical data space, thereby receiving an operation from the operator. The specification of the state before conversion, the conversion reference point, and the conversion direction is accepted.
例えば、表示制御機能152は、診療データ空間の次元を示すグラフィック81上に表示されたいずれかのグラフィックを選択する操作を受け付けることによって、操作者から変換前状態の指定を受け付ける。また、表示制御機能152は、選択されたグラフィック上で点、線又は面を選択する操作を受け付けることによって、操作者から変換基準点の指定を受け付ける。また、診療データ空間の次元を示すグラフィック81上に表示されたいずれかのグラフィックを回転、平行移動、拡大又は縮小する操作を受け付けることによって、操作者から変換方向の指定を受け付ける。
For example, the display control function 152 accepts the designation of the pre-conversion state from the operator by accepting an operation of selecting any graphic displayed on the graphic 81 indicating the dimension of the medical data space. In addition, the display control function 152 receives an operation for selecting a point, a line, or a surface on the selected graphic, thereby receiving a designation of a conversion reference point from the operator. In addition, by accepting an operation for rotating, translating, enlarging or reducing any graphic displayed on the graphic 81 indicating the dimension of the medical data space, the designation of the conversion direction is accepted from the operator.
ここで、拡大の操作は、点状のグラフィックを線状のグラフィック又は面状のグラフィックに切り替える操作、或いは、線状のグラフィックを面状のグラフィックに切り替える操作である。また、縮小の操作は、面状のグラフィックを点状のグラフィック又は線状のグラフィックに切り替える操作、或いは、線状のグラフィックを点状のグラフィックに切り替える操作である。
Here, the enlargement operation is an operation of switching a dotted graphic to a linear graphic or a planar graphic, or an operation of switching a linear graphic to a planar graphic. The reduction operation is an operation for switching a planar graphic to a dot graphic or a line graphic, or an operation for switching a line graphic to a dot graphic.
そして、本実施形態では、変換機能153が、表示制御機能152によって受け付けられた変換前状態、変換基準点及び変換方向に基づいて、第1の実施形態と同様に回転変換、平行移動変換、拡大変換又は縮小変換を行うことで、診療データの表示を切り替える。
In the present embodiment, the conversion function 153 is based on the pre-conversion state, the conversion reference point, and the conversion direction received by the display control function 152, as in the first embodiment. The display of medical data is switched by performing conversion or reduction conversion.
このように、本実施形態では、表示制御機能152が、診療データ空間の次元を立体的に示すグラフィック81上で、診療データの表示を切り替える指示を操作者から受け付けることによって、操作者が、診療データの表示の切り替えをより直感的に行えるようになる。
As described above, in the present embodiment, the display control function 152 receives an instruction to switch the display of the medical data on the graphic 81 that three-dimensionally shows the dimensions of the medical data space, so that the operator The display of data can be switched more intuitively.
なお、上述した実施形態では、診療データ空間が三つの次元を有する場合の例を説明したが、実施形態はこれに限られない。診療データ空間の次元数は、三つ未満であってもよいし、四つ以上であってもよい。
In the above-described embodiment, an example in which the medical data space has three dimensions has been described, but the embodiment is not limited thereto. The number of dimensions of the medical data space may be less than three, or may be four or more.
また、上述した実施形態では、上述した各処理機能が単一の処理回路150によって実現される場合の例を説明したが、実施形態はこれに限られない。例えば、処理回路150は、複数の独立したプロセッサを組み合わせて構成され、各プロセッサが各プログラムを実行することにより各処理機能を実現するものとしても構わない。また、処理回路150が有する各処理機能は、単一又は複数の処理回路に適宜に分散又は統合されて実現されてもよい。
In the above-described embodiment, an example in which each processing function described above is realized by a single processing circuit 150 has been described, but the embodiment is not limited thereto. For example, the processing circuit 150 may be configured by combining a plurality of independent processors, and each processor may implement each processing function by executing each program. In addition, each processing function of the processing circuit 150 may be realized by being appropriately distributed or integrated into a single or a plurality of processing circuits.
また、上述した説明で用いた「プロセッサ」という文言は、例えば、CPU(Central Processing Unit)、GPU(Graphics Processing Unit)、或いは、特定用途向け集積回路(Application Specific Integrated Circuit:ASIC)、プログラマブル論理デバイス(例えば、単純プログラマブル論理デバイス(Simple Programmable Logic Device:SPLD)、複合プログラマブル論理デバイス(Complex Programmable Logic Device:CPLD)、及びフィールドプログラマブルゲートアレイ(Field Programmable Gate Array:FPGA))等の回路を意味する。プロセッサは、記憶回路120に保存されたプログラムを読み出して実行することで、機能を実現する。なお、記憶回路120にプログラムを保存する代わりに、プロセッサの回路内にプログラムを直接組み込むように構成しても構わない。この場合は、プロセッサは回路内に組み込まれたプログラムを読み出して実行することで機能を実現する。また、本実施形態の各プロセッサは、プロセッサごとに単一の回路として構成される場合に限らず、複数の独立した回路を組み合わせて一つのプロセッサとして構成され、その機能を実現するようにしてもよい。
The term “processor” used in the above description is, for example, a CPU (Central Processing Unit), a GPU (Graphics Processing Unit), an application-specific integrated circuit (ASIC), or a programmable logic device. It means a circuit such as a simple programmable logic device (SPLD), a complex programmable logic device (CPLD), or a field programmable gate array (FPGA). The processor implements a function by reading and executing the program stored in the storage circuit 120. Instead of storing the program in the storage circuit 120, the program may be directly incorporated in the processor circuit. In this case, the processor realizes the function by reading and executing the program incorporated in the circuit. In addition, each processor of the present embodiment is not limited to being configured as a single circuit for each processor, but may be configured as a single processor by combining a plurality of independent circuits to realize its function. Good.
ここで、プロセッサによって実行されるプログラムは、ROM(Read Only Memory)や記憶回路等に予め組み込まれて提供される。なお、このプログラムは、これらの装置にインストール可能な形式又は実行可能な形式のファイルでCD(Compact Disk)-ROM、FD(Flexible Disk)、CD-R(Recordable)、DVD(Digital Versatile Disk)等のコンピュータで読み取り可能な記憶媒体に記録されて提供されてもよい。また、このプログラムは、インターネット等のネットワークに接続されたコンピュータ上に格納され、ネットワーク経由でダウンロードされることにより提供又は配布されてもよい。例えば、このプログラムは、上述した各機能部を含むモジュールで構成される。実際のハードウェアとしては、CPUが、ROM等の記憶媒体からプログラムを読み出して実行することにより、各モジュールが主記憶装置上にロードされて、主記憶装置上に生成される。
Here, the program executed by the processor is provided by being incorporated in advance in a ROM (Read Only Memory) or a storage circuit. This program is a file in a format that can be installed or executed in these devices, such as CD (Compact Disk) -ROM, FD (Flexible Disk), CD-R (Recordable), DVD (Digital Versatile Disk), etc. It may be provided by being recorded on a computer-readable storage medium. The program may be provided or distributed by being stored on a computer connected to a network such as the Internet and downloaded via the network. For example, this program is composed of modules including the above-described functional units. As actual hardware, the CPU reads a program from a storage medium such as a ROM and executes it, whereby each module is loaded on the main storage device and generated on the main storage device.
以上説明した少なくとも一つの実施形態によれば、臨床的な検討目的に応じて、適切な表示形式で診療データを提示するための機能を有することができる。
According to at least one embodiment described above, it is possible to have a function for presenting medical data in an appropriate display format according to the purpose of clinical examination.
本発明のいくつかの実施形態を説明したが、これらの実施形態は、例として提示したものであり、発明の範囲を限定することは意図していない。これらの実施形態は、その他の様々な形態で実施されることが可能であり、発明の要旨を逸脱しない範囲で、種々の省略、置き換え、変更を行うことができる。これらの実施形態やその変形は、発明の範囲や要旨に含まれると同様に、請求の範囲に記載された発明とその均等の範囲に含まれるものである。
Although several embodiments of the present invention have been described, these embodiments are presented as examples and are not intended to limit the scope of the invention. These embodiments can be implemented in various other forms, and various omissions, replacements, and changes can be made without departing from the scope of the invention. These embodiments and modifications thereof are included in the invention described in the claims and equivalents thereof, as long as they are included in the scope and gist of the invention.
Claims (12)
- 診療データごとに定義されたデータ表示形式に対応付けられた次元を有する診療データ空間に基づいて、前記診療データを表示する表示制御部と、
前記診療データ空間上で、指定された変換基準点を基準にして空間変換を行うことで、前記表示制御部によって表示される前記診療データの表示を切り替える変換部と
を備える、医用情報処理装置。 A display control unit for displaying the medical data based on a medical data space having a dimension associated with a data display format defined for each medical data;
A medical information processing apparatus comprising: a conversion unit that switches display of the medical data displayed by the display control unit by performing spatial conversion on the medical data space with reference to a specified conversion reference point. - 前記診療データ空間は、座標軸として、データ種別、時間、データ解釈分類の3軸を有する空間である、
請求項1に記載の医用情報処理装置。 The medical data space is a space having three axes of data type, time, and data interpretation classification as coordinate axes.
The medical information processing apparatus according to claim 1. - 前記診療データは、前記診療データ空間の座標軸に対応付けられたデータ構造を有する、
請求項1又は2に記載の医用情報処理装置。 The medical data has a data structure associated with coordinate axes of the medical data space,
The medical information processing apparatus according to claim 1 or 2. - 前記変換部は、前記空間変換として、前記診療データ空間上で、点、線又は平面で示される第1の表示状態を、当該第1の表示状態で指定された変換基準点を基準にして、他の点、線又は平面で示される第2の表示状態に変換する、
請求項1又は2に記載の医用情報処理装置。 The conversion unit, as the space conversion, on the medical data space, the first display state indicated by a point, a line, or a plane, with the conversion reference point specified in the first display state as a reference, Convert to a second display state indicated by another point, line or plane,
The medical information processing apparatus according to claim 1 or 2. - 前記変換部は、前記空間変換として、前記診療データ空間における回転、平行移動、拡大又は縮小を行う、
請求項1又は2に記載の医用情報処理装置。 The conversion unit performs rotation, translation, enlargement or reduction in the medical data space as the space conversion.
The medical information processing apparatus according to claim 1 or 2. - 前記変換部は、さらに、指定された変換量に基づいて、前記空間変換を行う、
請求項1又は2に記載の医用情報処理装置。 The conversion unit further performs the spatial conversion based on a specified conversion amount.
The medical information processing apparatus according to claim 1 or 2. - 前記診療データ空間は、被検体に対応する次元をさらに有する、
請求項1又は2に記載の医用情報処理装置。 The medical data space further has a dimension corresponding to the subject;
The medical information processing apparatus according to claim 1 or 2. - 前記診療データ及び前記診療データ空間は、疾病、操作者又は診療フェーズに応じて動的に変更される、
請求項1又は2に記載の医用情報処理装置。 The medical data and the medical data space are dynamically changed according to a disease, an operator, or a medical care phase.
The medical information processing apparatus according to claim 1 or 2. - 前記表示制御部は、表示中のデータ表示形式に対応する前記診療データ空間上の位置を示すガイド情報をさらに表示する、
請求項1又は2に記載の医用情報処理装置。 The display control unit further displays guide information indicating a position on the medical data space corresponding to the data display format being displayed.
The medical information processing apparatus according to claim 1 or 2. - 前記表示制御部は、前記ガイド情報として、前記診療データ空間の次元を立体的に示すグラフィックを表示し、当該グラフィック上で、前記表示中のデータ表示形式に対応する位置を示す情報を表示する、
請求項9に記載の医用情報処理装置。 The display control unit displays, as the guide information, a graphic that three-dimensionally shows the dimensions of the medical data space, and displays information indicating a position corresponding to the data display format being displayed on the graphic.
The medical information processing apparatus according to claim 9. - 前記表示制御部は、さらに、前記グラフィック上で、前記診療データの表示を切り替える指示を操作者から受け付ける、
請求項10に記載の医用情報処理装置。 The display control unit further receives an instruction to switch the display of the medical data on the graphic from an operator.
The medical information processing apparatus according to claim 10. - 診療データごとに定義されたデータ表示形式に対応付けられた次元を有する診療データ空間に基づいて、前記診療データを表示し、
前記診療データ空間上で、指定された変換基準点を基準にして空間変換を行うことで、前記診療データの表示を切り替える、
ことを含む、医用情報処理方法。 Displaying the medical data based on a medical data space having a dimension associated with a data display format defined for each medical data;
On the medical data space, the display of the medical data is switched by performing spatial conversion on the basis of the designated conversion reference point.
A medical information processing method.
Priority Applications (1)
| Application Number | Priority Date | Filing Date | Title |
|---|---|---|---|
| US16/163,053 US11094417B2 (en) | 2017-03-31 | 2018-10-17 | Medical information processing apparatus and medical information processing method |
Applications Claiming Priority (2)
| Application Number | Priority Date | Filing Date | Title |
|---|---|---|---|
| JP2017-070998 | 2017-03-31 | ||
| JP2017070998A JP6853095B2 (en) | 2017-03-31 | 2017-03-31 | Medical information processing device and medical information processing method |
Related Child Applications (1)
| Application Number | Title | Priority Date | Filing Date |
|---|---|---|---|
| US16/163,053 Continuation US11094417B2 (en) | 2017-03-31 | 2018-10-17 | Medical information processing apparatus and medical information processing method |
Publications (1)
| Publication Number | Publication Date |
|---|---|
| WO2018182015A1 true WO2018182015A1 (en) | 2018-10-04 |
Family
ID=63678060
Family Applications (1)
| Application Number | Title | Priority Date | Filing Date |
|---|---|---|---|
| PCT/JP2018/013976 WO2018182015A1 (en) | 2017-03-31 | 2018-03-30 | Medical information processing device and medical information processing method |
Country Status (3)
| Country | Link |
|---|---|
| US (1) | US11094417B2 (en) |
| JP (1) | JP6853095B2 (en) |
| WO (1) | WO2018182015A1 (en) |
Families Citing this family (5)
| Publication number | Priority date | Publication date | Assignee | Title |
|---|---|---|---|---|
| JP6896145B2 (en) * | 2018-03-09 | 2021-06-30 | 富士フイルム株式会社 | Image processing equipment, image processing methods, and image processing programs |
| WO2020115635A1 (en) * | 2018-12-03 | 2020-06-11 | Secretary, Department Of Biotechnology | Systems, methods and computer program product for monitoring vascular perfusion in replanted tissue flaps |
| JP7346066B2 (en) * | 2019-04-19 | 2023-09-19 | キヤノンメディカルシステムズ株式会社 | Medical information processing device and medical information processing method |
| CN112307974B (en) * | 2020-10-31 | 2022-02-22 | 海南大学 | User behavior content coding and decoding method of cross-data information knowledge mode |
| CN113885770B (en) * | 2021-10-27 | 2024-02-02 | 北京字跳网络技术有限公司 | Table data display method and device, electronic equipment and storage medium |
Citations (3)
| Publication number | Priority date | Publication date | Assignee | Title |
|---|---|---|---|---|
| JP2004178435A (en) * | 2002-11-28 | 2004-06-24 | Shinkichi Himeno | Display method for electronic medical chart and device |
| JP2010205045A (en) * | 2009-03-04 | 2010-09-16 | Nec System Technologies Ltd | Electronic medical chart system, electronic medical chart server, client, and program |
| JP2017027266A (en) * | 2015-07-21 | 2017-02-02 | 富士フイルム株式会社 | Information analysis support device, operation method of the same, operation program of the same, and information analysis support system |
Family Cites Families (15)
| Publication number | Priority date | Publication date | Assignee | Title |
|---|---|---|---|---|
| US5724128A (en) * | 1995-12-28 | 1998-03-03 | Hunter Engineering Company | Apparatus and method for determining vehicle wheel alignment measurements from three dimensional wheel positions and orientations |
| ATE426357T1 (en) * | 2000-09-14 | 2009-04-15 | Univ Leland Stanford Junior | ASSESSING THE CONDITION OF A JOINT AND PLANNING TREATMENT |
| AU2003225508A1 (en) * | 2002-05-17 | 2003-12-02 | Pfizer Products Inc. | Apparatus and method for statistical image analysis |
| US7236900B2 (en) * | 2004-04-20 | 2007-06-26 | Tektronix, Inc. | Three dimensional correlated data display |
| US7561160B2 (en) * | 2004-07-15 | 2009-07-14 | Olympus Corporation | Data editing program, data editing method, data editing apparatus and storage medium |
| US20100121201A1 (en) * | 2008-10-13 | 2010-05-13 | George Yiorgos Papaioannou | Non-invasive wound prevention, detection, and analysis |
| WO2010109649A1 (en) * | 2009-03-27 | 2010-09-30 | 富士通株式会社 | Information display program, information display device, and information display method |
| US8929627B2 (en) * | 2010-03-31 | 2015-01-06 | Hitachi Medical Corporation | Examination information display device and method |
| JP2013097267A (en) * | 2011-11-02 | 2013-05-20 | Toshiba Corp | Design data correction method, storage medium including program of design data correction method, and photomask manufacturing method |
| US8682049B2 (en) * | 2012-02-14 | 2014-03-25 | Terarecon, Inc. | Cloud-based medical image processing system with access control |
| JP2013228968A (en) * | 2012-04-27 | 2013-11-07 | Ge Medical Systems Global Technology Co Llc | Display device and display control program for the same |
| JP5834042B2 (en) * | 2013-04-12 | 2015-12-16 | 富士フイルム株式会社 | Medical information display control device, medical information display control method, and medical information display control program |
| JP5815167B1 (en) * | 2014-04-09 | 2015-11-17 | パナソニック株式会社 | Information terminal control method and program |
| WO2016080066A1 (en) * | 2014-11-21 | 2016-05-26 | 富士フイルム株式会社 | Time series data display control device, method and program for operating same, and system |
| JP6608142B2 (en) * | 2015-01-28 | 2019-11-20 | 株式会社野村総合研究所 | Server device |
-
2017
- 2017-03-31 JP JP2017070998A patent/JP6853095B2/en active Active
-
2018
- 2018-03-30 WO PCT/JP2018/013976 patent/WO2018182015A1/en active Application Filing
- 2018-10-17 US US16/163,053 patent/US11094417B2/en active Active
Patent Citations (3)
| Publication number | Priority date | Publication date | Assignee | Title |
|---|---|---|---|---|
| JP2004178435A (en) * | 2002-11-28 | 2004-06-24 | Shinkichi Himeno | Display method for electronic medical chart and device |
| JP2010205045A (en) * | 2009-03-04 | 2010-09-16 | Nec System Technologies Ltd | Electronic medical chart system, electronic medical chart server, client, and program |
| JP2017027266A (en) * | 2015-07-21 | 2017-02-02 | 富士フイルム株式会社 | Information analysis support device, operation method of the same, operation program of the same, and information analysis support system |
Also Published As
| Publication number | Publication date |
|---|---|
| JP6853095B2 (en) | 2021-03-31 |
| US20190051412A1 (en) | 2019-02-14 |
| JP2018173776A (en) | 2018-11-08 |
| US11094417B2 (en) | 2021-08-17 |
Similar Documents
| Publication | Publication Date | Title |
|---|---|---|
| WO2018182015A1 (en) | Medical information processing device and medical information processing method | |
| EP2373218B1 (en) | Reparametrized bull's eye plots | |
| US10909168B2 (en) | Database systems and interactive user interfaces for dynamic interaction with, and review of, digital medical image data | |
| US11594002B2 (en) | Overlay and manipulation of medical images in a virtual environment | |
| US9904771B2 (en) | Automated report generation | |
| JP6081126B2 (en) | Medical image processing apparatus, diagnostic imaging apparatus, computer system, medical image processing program, and medical image processing method | |
| JP5572440B2 (en) | Diagnosis support system, diagnosis support program, and diagnosis support method | |
| US20170053404A1 (en) | Systems and methods for matching, naming, and displaying medical images | |
| US11195610B2 (en) | Priority alerts based on medical information | |
| JP2016057695A (en) | Support device for preparing image reading report and control method of the same | |
| JP2008003783A (en) | Medical image management system | |
| JP7246912B2 (en) | Medical information processing device and medical information processing system | |
| JP7346066B2 (en) | Medical information processing device and medical information processing method | |
| WO2021177156A1 (en) | Image processing device, image display system, and image processing method and program | |
| JP6645904B2 (en) | Medical image display device and display program | |
| JP2019008816A (en) | Support device for preparing image reading report and control method of the same | |
| JP2013229043A (en) | Medical image management system and image display device | |
| US11900513B2 (en) | Medical image display apparatus | |
| US20230154061A1 (en) | Medical image display apparatus and medical image display system | |
| US20200357525A1 (en) | Medical information-processing system | |
| WO2020105416A1 (en) | Medical information display device, method, and program, and graphical user interface for displaying medical information | |
| WO2020105415A1 (en) | Medical information display device, method, and program, and graphic user interface for displaying medical information | |
| JP2020181425A (en) | Medical image processing device, method, and system | |
| JP2022119020A (en) | Diagnosis support device and diagnosis support system |
Legal Events
| Date | Code | Title | Description |
|---|---|---|---|
| 121 | Ep: the epo has been informed by wipo that ep was designated in this application |
Ref document number: 18774754 Country of ref document: EP Kind code of ref document: A1 |
|
| NENP | Non-entry into the national phase |
Ref country code: DE |
|
| 122 | Ep: pct application non-entry in european phase |
Ref document number: 18774754 Country of ref document: EP Kind code of ref document: A1 |