WO2010109649A1 - Information display program, information display device, and information display method - Google Patents
Information display program, information display device, and information display method Download PDFInfo
- Publication number
- WO2010109649A1 WO2010109649A1 PCT/JP2009/056301 JP2009056301W WO2010109649A1 WO 2010109649 A1 WO2010109649 A1 WO 2010109649A1 JP 2009056301 W JP2009056301 W JP 2009056301W WO 2010109649 A1 WO2010109649 A1 WO 2010109649A1
- Authority
- WO
- WIPO (PCT)
- Prior art keywords
- display
- comparison
- target
- structure data
- display target
- Prior art date
Links
Images


Classifications
-
- G—PHYSICS
- G16—INFORMATION AND COMMUNICATION TECHNOLOGY [ICT] SPECIALLY ADAPTED FOR SPECIFIC APPLICATION FIELDS
- G16B—BIOINFORMATICS, i.e. INFORMATION AND COMMUNICATION TECHNOLOGY [ICT] SPECIALLY ADAPTED FOR GENETIC OR PROTEIN-RELATED DATA PROCESSING IN COMPUTATIONAL MOLECULAR BIOLOGY
- G16B45/00—ICT specially adapted for bioinformatics-related data visualisation, e.g. displaying of maps or networks
-
- G—PHYSICS
- G16—INFORMATION AND COMMUNICATION TECHNOLOGY [ICT] SPECIALLY ADAPTED FOR SPECIFIC APPLICATION FIELDS
- G16B—BIOINFORMATICS, i.e. INFORMATION AND COMMUNICATION TECHNOLOGY [ICT] SPECIALLY ADAPTED FOR GENETIC OR PROTEIN-RELATED DATA PROCESSING IN COMPUTATIONAL MOLECULAR BIOLOGY
- G16B15/00—ICT specially adapted for analysing two-dimensional or three-dimensional molecular structures, e.g. structural or functional relations or structure alignment
- G16B15/30—Drug targeting using structural data; Docking or binding prediction
-
- G—PHYSICS
- G16—INFORMATION AND COMMUNICATION TECHNOLOGY [ICT] SPECIALLY ADAPTED FOR SPECIFIC APPLICATION FIELDS
- G16B—BIOINFORMATICS, i.e. INFORMATION AND COMMUNICATION TECHNOLOGY [ICT] SPECIALLY ADAPTED FOR GENETIC OR PROTEIN-RELATED DATA PROCESSING IN COMPUTATIONAL MOLECULAR BIOLOGY
- G16B15/00—ICT specially adapted for analysing two-dimensional or three-dimensional molecular structures, e.g. structural or functional relations or structure alignment
Definitions
- the present disclosure technique relates to an information display program, an information display device, and an information display method for displaying information.
- binding site between constituent proteins (or subunits) of a protein complex.
- a drug candidate that inhibits the formation of the complex is based on the shape of the site that is strongly involved in the binding of the constituent proteins (referred to as the “binding site”). The design is done.
- a protein complex is generally considered to be formed by binding each constituent protein to another constituent protein by a weak non-covalent interaction that works at a relatively short distance.
- a binding site is also a site of a constituent protein associated with such an interaction. Therefore, it is often performed to search for geometric complementarity (engagement of irregularities, etc.) on the molecular surface of adjacent constituent proteins and electrical complementarity (positive / negative of electrostatic potential on the proximity surface). .
- a 3-D viewer that displays the three-dimensional structure of a protein on a computer display is known.
- the 3-D viewer based on the three-dimensional structure data of the protein obtained by X-ray structural analysis (typically, a file that stores the types of atoms constituting the protein and positions on the three-dimensional coordinates) The figure which looked at the three-dimensional structure from a certain direction is created and displayed on the computer display.
- the protein shape is expressed by the molecular surface obtained from the three-dimensional structure data, and the electrostatic potential at each point on the molecular surface is expressed by color (for example, positive charge is blue, negative charge is red) Model).
- eF-site which provides a database of protein functional site shapes and physical properties, provides a tool called PDBj Viewer with a function to display the three-dimensional structure of proteins based on this type of model.
- PDBj Viewer provides a tool called PDBj Viewer with a function to display the three-dimensional structure of proteins based on this type of model.
- the above-described conventional technique has a problem in that when a three-dimensional structure of a complex in which a plurality of proteins are bound is displayed, the molecular surface adjacent to the protein is hidden behind the surrounding molecular surface.
- FIG. 30 is an explanatory view showing a three-dimensional shape model of the protein complex displayed on the display screen.
- an XY plane composed of an X axis and a Y axis orthogonal to the X axis corresponds to the display screen D
- a Z axis represents the depth of the display screen D orthogonal to the XY plane.
- the protein complex 3D shape model 100 is an object in which an antibody 3D shape model 101 and an antigen 3D shape model 102 are combined.
- the three-dimensional shape model 100 of the protein complex is displayed with reference to a three-dimensional coordinate system composed of an X axis, a Y axis, and a Z axis.
- a three-dimensional coordinate system composed of an X axis, a Y axis, and a Z axis.
- the molecular surface where the three-dimensional shape model 101 of the antibody and the three-dimensional shape model 102 of the antigen are close is hidden behind the surrounding molecular surface and cannot be seen.
- FIG. 31 is an explanatory diagram showing a rotation state of the protein complex three-dimensional shape model 100 by a user operation.
- the antibody three-dimensional shape model 101 and the antigen three-dimensional shape model 102 are displayed on separate display screens D1 and D2.
- (A) shows a state before rotation
- (B) shows a state after rotation.
- the three-dimensional shape model 101 of the antibody is rotated by a rotation axis Ay1 parallel to the Y axis by a user operation.
- the antigen three-dimensional shape model 102 is rotated by a user operation with a rotation axis Ay2 parallel to the Y axis.
- each constituent protein had to be displayed separately as in the display screens D1 and D2. Also, as shown in (B), when rotating in the direction in which the electrical characteristics of the neighboring molecular surfaces can be visually recognized, the user has to specify the rotation direction as appropriate.
- the present disclosure technique has been made in view of the above, and is an information display that can easily display a characteristic portion of the surface of a display target that is likely to be related to the coupling between the display target and the comparison target. It is an object to provide a program, an information display device, and an information display method.
- the display screen is a three-dimensional display in which the display screen is an XY plane composed of an X axis and a Y axis, and the depth direction of the display screen is a Z axis orthogonal to the XY plane.
- the display screen is an XY plane composed of an X axis and a Y axis
- the depth direction of the display screen is a Z axis orthogonal to the XY plane.
- Display of the display target is a surface within a predetermined distance from the surface of the comparison target specified by the comparison target among the surfaces of the display target specified by the acquired display target by acquiring the dimensional structure data pair
- a reference point is selected from the group of vertices based on the feature value of each vertex that is extracted as a plane and that constitutes the extracted display surface of the display target.
- FIG. 1 is an explanatory diagram showing an outline of the present embodiment.
- FIG. 2 is a block diagram of a hardware configuration of the information display apparatus according to the embodiment.
- FIG. 3 is a block diagram of a functional configuration of the information display apparatus according to the first embodiment.
- FIG. 4 is an explanatory diagram showing the three-dimensional structure data of the protein complex.
- FIG. 5-1 is an explanatory diagram showing the three-dimensional structure data of an antibody.
- FIG. 5B is an explanatory diagram of the three-dimensional structure data of the antigen.
- FIG. 6 is an explanatory diagram showing the specification of the molecular surface.
- FIG. 7-1 is an explanatory diagram showing molecular surface structure data representing the molecular surface of the antibody to be compared.
- FIG. 1 is an explanatory diagram showing an outline of the present embodiment.
- FIG. 2 is a block diagram of a hardware configuration of the information display apparatus according to the embodiment.
- FIG. 3 is a block diagram of a functional configuration of the information
- FIG. 7-2 is an explanatory diagram of molecular surface structure data representing the molecular surface of the antigen to be displayed.
- FIG. 8 is an explanatory diagram showing the shortest distance data storing the shortest distance of the molecular surface structure data of the display target (antigen).
- FIG. 9 is an explanatory diagram showing display surface configuration data.
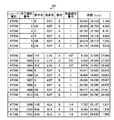
- FIG. 10 is a table showing the nearest residues sorted in descending order of electrostatic potential.
- FIG. 11 is a plan view showing a surface normal vector on the display surface near the reference point.
- FIG. 12 is a plan view showing vertex normal vectors on the display surface near the reference point.
- FIG. 13A is an explanatory diagram of a rotation axis and a rotation angle set as a display target.
- FIG. 13-2 is an explanatory diagram of an example of the three-dimensional shape model of the antigen after rotational display according to the first embodiment.
- FIG. 14 is a flowchart of an information display processing procedure performed by the information display apparatus according to the first embodiment.
- FIG. 15 is a flowchart showing a detailed processing procedure of the display surface extraction process (step S1403) shown in FIG.
- FIG. 16 is a flowchart showing a detailed processing procedure of the display surface rotation display process (step S1404) shown in FIG.
- FIG. 17 is a block diagram of a functional configuration of the information display apparatus according to the second embodiment.
- FIG. 18 is an explanatory diagram of an example of a three-dimensional shape model of a protein after rotational display according to the second embodiment.
- FIG. 19 is a flowchart of an information display processing procedure performed by the information display apparatus according to the second embodiment.
- FIG. 20 is an explanatory diagram of a display screen example of the rotation display state according to the third embodiment.
- FIG. 21 is a block diagram of a functional configuration of the information display apparatus according to the third embodiment.
- FIG. 22 is an explanatory diagram showing three-dimensional structure data of a comparative protein complex that is a pair of comparative three-dimensional structure data.
- FIG. 23A is an explanatory diagram of molecular surface structure data representing the molecular surface of an antibody that is a reference display target.
- FIG. 23-2 is an explanatory diagram illustrating reference point data representing a reference point on the molecular surface of an antibody that is a reference display target.
- FIG. 24-1 is an explanatory diagram showing molecular surface structure data representing the molecular surface of an antibody to be compared and displayed.
- FIG. 24-2 is an explanatory diagram showing reference point data representing a reference point on the molecular surface of an antibody to be compared and displayed.
- FIG. 25 is an explanatory diagram of an execution example of multiple sequence alignment.
- FIG. 26 is an explanatory diagram illustrating an example of a three-dimensional model in which a comparison display object is superimposed on a reference display object.
- FIG. 27A is an explanatory diagram of a three-dimensional model example after rotation display of a wild-type antibody that is a reference display target.
- FIG. 27B is an explanatory diagram of an example of a three-dimensional model after rotation display of the antibody to be compared and displayed.
- FIG. 28 is a flowchart of an information display processing procedure performed by the information display apparatus according to the third embodiment.
- FIG. 29 is a flowchart showing a detailed processing procedure of the display surface interlocking rotation display processing (step S2810) shown in FIG.
- FIG. 30 is an explanatory diagram showing a three-dimensional shape model of the protein complex displayed on the display screen.
- FIG. 31 is an explanatory diagram showing a rotation state by a user operation of a three-dimensional shape model of a protein complex.
- an object is displayed on the display screen D as a three-dimensional viewpoint coordinate system in which an XY plane including an X axis and a Y axis and an axis orthogonal to the XY plane is a Z axis.
- the depth direction of the Z axis is the line-of-sight direction viewed from the viewpoint coordinates, and the opposite direction is the anti-line-of-sight direction.
- the object is described as a three-dimensional shape model of protein.
- FIG. 1 is an explanatory diagram showing an outline of the present embodiment.
- A has shown the same content as the state shown in FIG.
- the three-dimensional shape model 102 of the antigen is the display target
- the three-dimensional shape model 101 of the antibody is the comparison target of the three-dimensional shape model 102 of the antigen.
- the three-dimensional shape model 102 of the antigen is colored according to an electrostatic potential that is an electrical characteristic.
- the antibody also has an electrostatic potential, but since the three-dimensional shape model 101 of the antibody is not a display target, it is not colored by the electrostatic potential. Therefore, in FIG. 1, the three-dimensional shape model 101 of the antibody displays only the outline.
- the display surface Sd is a partial molecular surface to be displayed at a distance that can be combined with the comparison target among the molecular surfaces to be displayed. Since the molecular surface is usually uneven, the display surface Sd also has unevenness. However, in FIG.
- (C) shows the rotation state of the three-dimensional shape model 102 of the antigen to be displayed.
- the rotation axis Ar is rotated as the rotation axis.
- the rotation axis Ar is an axis orthogonal to a plane including the normal vector n and the anti-gaze direction vector nz.
- the antigen three-dimensional shape model 102 changes the normal vector n of the display surface Sd around the rotation axis Ar in the anti-sight line direction. Thereby, the three-dimensional shape model 102 of the antigen is rotated in the three-dimensional viewpoint coordinate system.
- (D) shows the display state after rotation by (C).
- (D) only the display surface Sd is colored and displayed, and the molecular surface other than the display is not colored (although it may be applied, it is displayed so that it can be distinguished from the display surface Sd).
- the antigen display surface Sd at a distance capable of binding to the antibody in the state (A) can be displayed at a position that is easily visible to the user.
- the antigen is the display target here, the same applies to the case where the antibody is the display target.
- FIG. 2 is a block diagram showing a hardware configuration of the information display apparatus according to the embodiment (common to the first to third embodiments).
- the information display device includes a CPU (Central Processing Unit) 201, a ROM (Read-Only Memory) 202, a RAM (Random Access Memory) 203, a magnetic disk drive (Hard Disk Drive) 204, and a magnetic disk.
- a CPU Central Processing Unit
- ROM Read-Only Memory
- RAM Random Access Memory
- magnetic disk drive Hard Disk Drive
- 205 an optical disc drive 206, an optical disc 207, a display 208, an I / F (Interface) 209, a keyboard 210, a mouse 211, a scanner 212, and a printer 213.
- Each component is connected by a bus 200.
- the CPU 201 controls the entire information display device.
- the ROM 202 stores a program such as a boot program.
- the RAM 203 is used as a work area for the CPU 201.
- the magnetic disk drive 204 controls reading / writing of data with respect to the magnetic disk 205 according to the control of the CPU 201.
- the magnetic disk 205 stores data written under the control of the magnetic disk drive 204.
- the optical disc drive 206 controls reading / writing of data with respect to the optical disc 207 according to the control of the CPU 201.
- the optical disk 207 stores data written under the control of the optical disk drive 206, or causes the computer to read data stored on the optical disk 207.
- the display 208 displays data such as a document, an image, and function information as well as a cursor, an icon, or a tool box.
- a CRT a CRT
- a TFT liquid crystal display a plasma display, or the like can be adopted.
- I / F An interface 209 is connected to a network 214 such as a LAN (Local Area Network), a WAN (Wide Area Network), or the Internet through a communication line, and others are connected via this network 214. Connected to other devices.
- the I / F 209 controls an internal interface with the network 214 and controls data input / output from an external device.
- a modem or a LAN adapter may be employed as the I / F 209.
- the keyboard 210 includes keys for inputting characters, numbers, various instructions, and the like, and inputs data. Moreover, a touch panel type input pad or a numeric keypad may be used.
- the mouse 211 performs cursor movement, range selection, window movement, size change, and the like. A trackball or a joystick may be used as long as they have the same function as a pointing device.
- the scanner 212 optically reads an image and takes in the image data into the information display device.
- the scanner 212 may have an OCR (Optical Character Reader) function.
- OCR Optical Character Reader
- the printer 213 prints image data and document data.
- a laser printer or an ink jet printer can be employed as the printer 213, for example, a laser printer or an ink jet printer can be employed.
- Embodiments 1 to 3 of the disclosed technology will be sequentially described.
- a basic configuration of the disclosed technique shown in FIG. 1 is shown.
- one protein is to be displayed and the other protein is to be compared.
- the display surface Sd is cut out from the molecule surface S to be displayed, and the display surface Sd is rotated and displayed.
- a reference point is selected from the vertex group and displayed based on the feature value of each vertex constituting the display surface Sd.
- FIG. 3 is a block diagram of a functional configuration of the information display apparatus according to the first embodiment.
- the information display device 300 includes an acquisition unit 301, an extraction unit 302, a selection unit 303, a generation unit 304, a setting unit 305, a rotation angle calculation unit 306, a conversion unit 307, and a drawing unit 308. It is a configuration.
- the functions (acquisition unit 301 to drawing unit 308) that serve as the control unit are, for example, programs stored in a storage device such as the ROM 202, RAM 203, magnetic disk 205, and optical disk 207 shown in FIG.
- the function is realized by executing the function or by the I / F 209.
- the acquisition unit 301 has a function of acquiring a 3D structure data pair that is a combination of 3D structure data to be displayed and 3D structure data to be compared with the display object.
- the three-dimensional structure data pair is three-dimensional structure data to be compared with the display target for displaying the display surface Sd described above and the display target.
- the 3D shape models to be displayed and compared are generated based on the respective 3D structure data.
- the three-dimensional structure data pair will be described by taking three-dimensional structure data related to a protein complex as an example.
- One for example, antibody
- the other for example, an antigen
- FIG. 4 is an explanatory diagram showing the three-dimensional structure data of the protein complex.
- the three-dimensional structure data 400 of the protein complex includes a record type, an atom identification number, an atom name, a residue name, a chain name, a residue identification number, and coordinates for each component of the protein complex as field items. Recorded.
- the record type is a record type indicating a component.
- the record type since the record type is atom, it is “ATOM”. Therefore, a record whose record type is “ATOM” is a record having atoms as constituent elements.
- the atom identification number is an identification number unique to each record.
- the atom name is the name of the atom specified by the record.
- the residue name is the name of an amino acid residue containing an atom specified by the record.
- the chain name is a name for identifying a peptide chain (a polymer in which amino acids are linked in a chain form by peptide bonds) that is a basic structural unit of a protein.
- a peptide chain a polymer in which amino acids are linked in a chain form by peptide bonds
- a residue identification number is an identification number unique to an amino acid residue.
- the coordinates are atomic position information in a three-dimensional local coordinate system having a specific position (for example, the center of gravity of the protein complex or the center of gravity of one of the constituent proteins) as the origin. In the case of expressing in the viewpoint coordinate system, a known coordinate conversion may be performed.
- the three-dimensional structure data 400 of the protein complex shown in FIG. 4 When the three-dimensional structure data 400 of the protein complex shown in FIG. 4 is input as input data, the three-dimensional structure data of the antibody and the three-dimensional structure data of the antigen are separated by the chain name. As a result, a three-dimensional structure data pair is acquired. The antibody and the antigen are separated by the chain name in the three-dimensional structure data 400 of the protein complex.
- the A chain and B chain records are separated as an antibody (comparison object), and the C chain record is separated as an antigen (display object).
- FIG. 5-1 is an explanatory diagram showing the three-dimensional structure data of the antibody (comparison target), and FIG. 5-2 is an explanatory diagram showing the three-dimensional structure data of the antigen (display target).
- the three-dimensional structure data 501 of the antibody shown in FIG. 5A is data of the A chain and the B chain in the three-dimensional structure data 400 of the protein complex of FIG. 4, and the antigen 3 shown in FIG.
- the dimensional structure data 502 is C chain data in the three-dimensional structure data 400 of the protein complex in FIG.
- the three-dimensional structure data 400 of the protein complex is separated into the antibody and the antigen to obtain the three-dimensional structure data pair (501, 502) of the antibody and the antigen. It is good also as acquiring the three-dimensional structure data pair and positional relationship data of an antigen. Moreover, it is good also as acquiring not only a protein complex but the three-dimensional structure data pair and positional relationship data of arbitrary two proteins.
- the extraction unit 302 has a function of acquiring the display surface Sd of the display target (antigen) as shown in FIG. Specifically, among the surfaces of the display target specified by the display target acquired by the acquisition unit 301, a surface within a predetermined distance from the surface of the comparison target specified by the comparison target is used as the display surface Sd of the display target. Extract. This function is the function shown in FIG. 1B. For example, a surface within a predetermined distance from the molecular surface of the antibody to be compared among the molecular surfaces of the antigen to be displayed is displayed as the display target. Cut out as a display surface Sd of a certain antigen. Here, the molecular surface will be described.
- FIG. 6 is an explanatory diagram showing the specification of the molecular surface.
- the molecular surface S is defined as, for example, an inscribed surface that contacts a water molecule (usually a hard sphere with a radius of 1.4 [ ⁇ ]), assuming that the atoms in the protein are hard spheres with van der Waals radii.
- the van der Waals radius is a radius of a hard sphere determined for each atom, and indicates the spread of the electron cloud of each atom.
- the van der Waals radius is generally estimated from the bond length and contact distance between atoms obtained from X-ray crystallographic analysis of low molecules.
- the molecular surface S can be specified by a known calculation method, the description thereof is omitted (for example, it may be calculated by a calculation method described in Non-Patent Document 2 described later).
- the vertex coordinates of polygons constituting the molecular surface S are specified by the atoms and coordinates specified by the respective records of the three-dimensional structure data 501 and 502 shown in FIGS. Is done.
- FIG. 7-1 is an explanatory diagram showing molecular surface structure data representing the molecular surface S of the antibody to be compared
- FIG. 7-2 shows molecular surface structure data representing the molecular surface S of the antigen to be displayed. It is explanatory drawing shown.
- the molecular surface structure data 701 and 702 are recorded for each vertex of the polygon constituting the molecular surface S with the vertex coordinates and the electrostatic potential at the vertex as field items. Yes.
- the coordinate data of the vertexes of the polygons constituting the molecular surface S shown in these figures are the results calculated by the calculation method described in Non-Patent Document 2 below.
- Non-patent document 2 Sanner, M.M. F. Olson, A .; J. et al. , And Spehner, J .; C. “Reduced surface: an effective way to compute molecular surfaces.” Biopolymers, Vol. 38 (3): 305-320 (1996), P.M. 1-28
- the electrostatic potential is an electrical characteristic represented by the sum of Coulomb potentials between atoms having partial charges in the protein, and is calculated by the extraction unit 302. Since the calculation method of the electrostatic potential is also known, the description thereof is omitted. For example, the calculation may be performed according to the following two non-patent documents 3 and 4.
- the nearest atom is the identification number of the atom located closest to the corresponding vertex. By using the nearest atom as a key, the amino acid residue constituted by the atom can be specified from the records shown in FIGS. 5-1 and 5-2.
- the electrostatic potential on the molecular surface S to be displayed needs to be calculated.
- FIG. 7A the electrostatic potential on the molecular surface S to be compared used in the second embodiment is calculated. The calculation results are also shown for.
- Non-patent document 4 B. Z. Lu, Y .; C. Zhou, Michael J .; Holst, and J.H. A. McCammon. “Recent progress in numeric methods for the Poisson-Boltzmann equation in biophysical applications.” Commun. in Compute. Phys. , Vol. 3 (5): 973-109 (2008), P.M. 973-1009
- the extraction unit 302 determines the vertex coordinates of each record of the display target molecular surface structure data.
- the shortest distance from the molecular surface S to be compared is calculated. Specifically, for example, one vertex coordinate is selected from the molecular surface structure data 702 to be displayed, and the distance from each vertex coordinate of the polygon constituting the molecular surface S to be compared is calculated. Then, only the shortest distance among the calculated distances is stored. This process is executed for all records of the molecular surface structure data 702 to be displayed.
- FIG. 8 is an explanatory diagram showing the shortest distance data storing the shortest distance of the molecular surface structure data 702 of the display target (antigen).
- the shortest distance data 800 shown in FIG. 8 the shortest distance is added as a field item to the molecular surface structure data of the display target (antigen) shown in FIG. 7-2.
- the extraction unit 302 extracts, from the shortest distance data 800, a record whose shortest distance is equal to or less than a predetermined distance (eg, 1.2 [ ⁇ ]) that can be combined with the comparison target.
- the partial molecular surface S specified by the extracted record group is extracted as the display surface Sd.
- FIG. 9 is an explanatory diagram showing display surface configuration data.
- the display surface configuration data 900 illustrated in FIG. 9 is a set of records in which the shortest distance is equal to or less than a predetermined distance (for example, 1.2 [ ⁇ ]) in the shortest distance data 800 illustrated in FIG.
- a predetermined distance for example, 1.2 [ ⁇ ]
- the selection unit 303 selects a point having a feature to be noticed from among a group of vertices based on the feature amount of each vertex constituting the display surface Sd to be displayed extracted by the extraction unit 302. It has a function to select as a reference point.
- the feature amount of each vertex constituting the display surface Sd is feature information given to the vertex as in the electrostatic potential described above.
- the vertex having the maximum electrostatic potential absolute value is selected as a reference point.
- the vertex n having the largest electrostatic potential absolute value is extracted and displayed on the display screen D. And may be selected by user operation from the vertices having the top n sizes.
- candidates with the same residues for example, polar amino acid residues
- atoms for example, nitrogen and oxygen
- FIG. 10 is a table showing the nearest residues sorted in descending order of electrostatic potential.
- the display surface configuration data 900 shown in FIG. 9 is sorted in descending order of electrostatic potential.
- the selection unit 303 can select a reference point with reference to the table shown in FIG.
- the generation unit 304 has a function of generating a normal line of the reference point selected by the selection unit 303. Specifically, the vertex normal vector of the reference point is obtained. For example, first, a surface normal vector of each polygon having a reference point as a vertex is obtained. Each surface normal vector is added and normalized. Thereby, the vertex normal vector of the reference point is generated.
- FIG. 11 is a plan view showing a surface normal vector on the display surface Sd near the reference point.
- a triangular figure is a polygon constituting the display surface Sd
- a round figure is a vertex of the polygon.
- the black circle is the reference point.
- the arrow on the polygon is the surface normal vector of the polygon.
- FIG. 12 is a plan view showing a vertex normal vector on the display surface Sd in the vicinity of the reference point.
- the vertex normal vectors of the reference points are obtained by adding and normalizing the surface normal vectors shown in FIG.
- the dotted line arrow is the vertex normal vector of the reference point.
- the setting unit 305 has a function of setting a rotation axis that changes the normal of the reference point generated by the generation unit 304 in the anti-gaze direction. Specifically, a line parallel to the outer product vector of the vertex normal vector of the reference point and the vector in the anti-gaze direction is set as the rotation axis. More specifically, the rotation axis passes through the center of gravity or reference point of the protein or other specific point. Which point on the space is allowed to pass may be determined by initial setting.
- the rotation angle calculation unit 306 has a function of calculating a rotation angle that changes the normal of the reference point generated by the generation unit 304 in the anti-sight line direction. Specifically, by obtaining the inner product of the vertex normal vector of the reference point and the vector in the anti-gaze direction, the angle formed by the vertex normal vector and the vector in the anti-gaze direction can be obtained as the rotation angle.
- the conversion unit 307 converts the coordinate value of each vertex constituting the display surface Sd to be displayed into the coordinate when the normal of the reference point is changed in the anti-gaze direction by the rotation angle calculated by the rotation angle calculation unit 306. Has the function of converting to a value. Specifically, for example, coordinate conversion is performed on a coordinate value of each vertex of the polygon constituting the display surface Sd by a rotation matrix that rotates the rotation angle about the rotation axis. In this coordinate transformation, the coordinate values of the vertices of the polygon constituting the display surface Sd, the vertices constituting the polygon of the molecular surface S, and the nearest atom from the molecular surface S from which the molecular surface S is generated. May also be executed.
- the drawing unit 308 has a function of drawing the display surface Sd to be displayed from the line-of-sight direction after the conversion by the conversion unit 307 on the display screen D based on the feature amount. Specifically, for example, a polygon that forms the converted display surface Sd is drawn. A color corresponding to the electrostatic potential is drawn on the surface of the polygon. It is not necessary to color the molecular surface S other than the display surface Sd (or black / white). Further, the outline of the display target may be drawn.
- the structure data and coloring data of the display surface Sd are passed to a drawing device (not shown), and the drawing device writes the data to a VRAM (video RAM), whereby the display surface Sd after the rotation processing is displayed on the display screen D The electrostatic potential is displayed.
- VRAM video RAM
- FIG. 13-1 is an explanatory diagram showing a rotation angle and a rotation axis set as a display target.
- the display target is expressed as a sphere.
- a three-dimensional viewpoint coordinate system having the viewpoint coordinates as the origin O is used.
- the direction in which the display target is viewed from the viewpoint coordinates is the line-of-sight direction from the viewpoint coordinates, and the opposite direction is the counter-gaze direction.
- the display object is arranged with the center of gravity W as a point on the Z axis.
- the x axis is an axis parallel to the X axis
- the y axis is an axis parallel to the Y axis.
- the rotation angle between the vertex normal vector n from the reference point P on the display surface Sd and the vector nz in the anti-gaze direction is ⁇
- the vertex normal vector n and the vector nz in the anti-gaze direction are A line perpendicular to the plane to be included is defined as a rotation axis Ar.
- the rotation axis Ar1 is an axis that passes through the center of gravity W of the display target and is orthogonal to the plane.
- the rotation axis Ar2 is an axis that passes through the reference point P and is orthogonal to the plane.
- the display surface Sd from the sight line direction is displayed on the display screen D by rotating the display surface Sd by the rotation angle ⁇ around the rotation axis Ar so that the vertex normal vector n is oriented in the same direction as the vector nz in the anti-gaze direction. Is displayed.
- the vertices constituting the display surface Sd are drawn.
- the nearest atoms of the vertices constituting the display surface Sd may be drawn. .
- the nearest atom can be specified by the nearest atom item in the display surface configuration data 900 shown in FIG.
- the nearest amino acid residue can be drawn.
- FIG. 13-2 is an explanatory diagram of a display screen example after the rotation display according to the first embodiment.
- the three-dimensional demole 1302 related to the display surface configuration data 900 of the antigen that is one of the proteins is rotated and displayed by the processing shown in Embodiment 1, and the reference of candidate number 1 shown in FIG. Point P is also displayed.
- FIG. 14 is a flowchart of an information display processing procedure performed by the information display apparatus according to the first embodiment.
- the acquisition unit 301 acquires the three-dimensional structure data 400 of the protein complex that forms the three-dimensional structure data pair (step S1401).
- the acquired three-dimensional structure data 400 of the protein complex is separated into three-dimensional structure data to be displayed and three-dimensional structure data to be compared.
- step S1402 the molecular surface S is calculated for the separated 3D structure data to be displayed and 3D structure data to be compared.
- step S1403 the display surface extraction process
- step S1404 the display surface rotation display process
- FIG. 15 is a flowchart showing a detailed processing procedure of the display surface extraction process (step S1403) shown in FIG.
- the electrostatic potential is calculated for the molecular surface S to be displayed (step S1501), and it is determined whether or not there are unprocessed vertices among the vertex groups of the polygons constituting the molecular surface S to be displayed (step S1502). ).
- step S1502 If there is an unprocessed vertex (step S1502: Yes), one unprocessed vertex is selected (step S1503). Then, the distance from each vertex of the polygon constituting the molecular surface S to be compared to the selected vertex is calculated, and the shortest distance is set as the shortest distance (step S1504). Thereafter, it is determined whether or not the shortest distance is within a threshold value (step S1505).
- step S1505: Yes the selected vertex is stored as display surface configuration data (step S1506), and the process proceeds to step S1502.
- step S1505: No the process proceeds to step S1502. If there is no unprocessed vertex in step S1502 (step S1502: No), the process proceeds to display surface rotation display processing (step S1404).
- FIG. 16 is a flowchart showing a detailed processing procedure of the display surface rotation display process (step S1404) shown in FIG.
- the reference point P is selected by the selection unit 303 (step S1601), and the vertex normal vector of the selected reference point P is generated by the generation unit 304 (step S1602).
- the setting unit 305 sets a rotation axis (step S1603), and the rotation angle calculation unit 306 calculates a rotation angle for directing the vertex normal vector to a vector in the anti-gaze direction (step S1604).
- the conversion unit 307 converts the vertex coordinate value in the display surface configuration data into the coordinate value when the vertex normal vector is rotated by the rotation angle around the rotation axis (step S1605).
- the drawing unit 308 draws the converted display surface Sd and the color of the electrostatic potential (step S1606). As a result, the display surface Sd viewed from the direction in which the user can easily recognize is displayed.
- the molecular surface S (display surface Sd) that may be involved in binding is selectively displayed by cutting out (extracting) the display surface Sd. Therefore, it is possible to reduce the risk of erroneously recognizing a portion that has a strong electrostatic potential but has no possibility of interaction in the positional relationship with the binding destination as a binding site.
- the electrical characteristics of the portion of the molecular surface S having the electrical characteristics to be noted are automatically drawn in a direction facing the user's line of sight. Therefore, it is possible to easily observe the electrical characteristics of the portion of the molecular surface S that is highly likely to be strongly involved in protein binding.
- the distance between the selected reference points is calculated based on the feature amount of each vertex constituting the display surface Sd of each protein, and is displayed together with each display surface Sd after the rotation display.
- symbol is attached
- FIG. 17 is a block diagram of a functional configuration of the information display apparatus according to the second embodiment.
- a designation unit 1701 and a distance calculation unit 1702 are further added to the functions shown in the first embodiment.
- the specification unit 1701 and the distance calculation unit 1702 also have the CPU 201 execute a program stored in a storage device such as the ROM 202, the RAM 203, the magnetic disk 205, and the optical disk 207 shown in FIG.
- the function is realized by the I / F 209.
- the designation unit 1701 performs a first designation for designating one (for example, antigen) three-dimensional structure data as an object to be displayed and an other (for example, antibody) three-dimensional structure data as a comparison target in an arbitrary three-dimensional structure data pair. It has a function.
- the second designation that designates the three-dimensional structure data of the comparison target (antibody) in the first designation as the display target and the other (antigen) three-dimensional structure data as the comparison target. Has a function to perform.
- a series of processing from the extraction unit 302 to the drawing unit 308 is executed based on the first designation for displaying the antigen.
- a series of processes from the extraction unit 302 to the drawing unit 308 is executed based on the second designation for displaying the antibody.
- the extraction unit 302 determines / changes the display target and the comparison target according to the designation, and then executes the processing described in the first embodiment.
- the display surface Sd when one of the three-dimensional structure data is a display target can be drawn from a direction that is easily visible to the user, and the display surface Sd when the other three-dimensional structure data is the display target is displayed by the user. It is possible to draw from a direction that is easily visible.
- the distance calculation unit 1702 also calculates a distance between the reference points between the reference point P selected by the selection unit 303 for the first designation and the reference point P selected by the selection unit 303 for the second designation.
- the coordinate value of the reference point P obtained by the first designation for displaying the antigen is (x1, y1, z1) and obtained by the second designation for displaying the antibody. If the coordinate value of the reference point P is (x2, y2, z2), the distance d between reference points can be calculated by the following equation (1).
- the drawing unit 308 draws a line connecting the reference points P on the display surface Sd after the rotation display, and also draws the value of the distance d between the reference points.
- FIG. 18 is an explanatory diagram of an example of a three-dimensional shape model of a protein after rotation display according to the second embodiment.
- the three-dimensional shape model 1801 of one protein (antibody) and the three-dimensional shape model 1802 of the other protein (antigen) are rotated and displayed by the processing shown in the first embodiment, and the respective standards are displayed.
- a line connecting the points P1 and P2 and the distance d between the reference points are also displayed.
- FIG. 19 is a flowchart of an information display processing procedure performed by the information display apparatus according to the second embodiment.
- the acquisition unit 301 acquires a three-dimensional structure data pair (step S1901), and the specification unit 1701 executes a first specification process (step S1902).
- a first specification process for example, the three-dimensional structure data of the antigen is to be displayed, and the other (antibody) three-dimensional structure data is to be compared.
- step S1903 is the same as the display surface extraction process (step S1403) shown in FIGS. 14 and 15, and the display surface rotation display process (step S1904) is shown in FIGS. This is the same processing as the display surface rotation display processing (step S1404).
- step S1905 it is determined whether or not the second designation has been completed. If not completed (step S1905: No), the designation unit 1701 executes a second designation process for designating the display target / comparison target as opposed to the first designation (step S1906).
- the three-dimensional structure data of the antibody that was the comparison target in the first designation is the display target, and the other (antigen) three-dimensional structure data is the comparison target.
- display surface extraction processing step S1903
- display surface rotation display processing step S1904 are executed for the second designated display target and comparison target.
- step S1905 when the second designation is completed (step S1905: Yes), the distance calculation unit 1702 calculates the distance between the reference points (step S1907). Then, the drawing unit 308 displays distance information (the value of the distance d between the reference points and the arrow connecting the reference points P1 and P2) (step S1908).
- the parts of the molecular surface S that are highly likely to be involved in the interaction are opposed to each other, and the distance therebetween is set. Attached can be displayed. Therefore, the user can easily determine whether or not a non-covalent interaction is likely to be formed.
- a third embodiment a plurality of three-dimensional structure data pairs having a common display target are prepared, one being a reference three-dimensional structure data pair and the remaining being a comparison three-dimensional structure data pair.
- Sd is displayed in one place so as to be a perspective view from substantially the same direction. Further, the display object of the comparison three-dimensional structure data pair is rotated and displayed in conjunction with the display object of the reference three-dimensional structure data pair.
- This embodiment is useful, for example, for finding a mutant antigen that has a stronger binding property to an antibody with respect to a wild-type antigen that binds to the antibody. That is, in such a case, to which part of the antibody each antigen binds is a big clue to guess the strength of the action, but by applying this embodiment with the antibody as a display target, This makes it easy to change the binding site derived from the difference in antigen, and to identify an antigen that is highly likely to bind strongly to an important partial structure of an antibody.
- the embodiment will be described in more detail by taking this case as an example.
- the protein complex having the antibody protein and the mutant antigen protein of the same species with the three-dimensional structure data 400 of the protein complex having the antibody protein and the wild-type antigen protein as a “reference three-dimensional structure data pair”
- the three-dimensional structure data 400 will be described as an example of “comparative three-dimensional structure data pair”.
- the antibody proteins in these three-dimensional structure data pairs are basically the same protein, but in general, the amino acid sequences are not always completely matched even with the same type of protein. It is assumed that antibody proteins also partially differ in amino acid sequence. Specifically, a determination unit 2101 and a search unit 2102 described later obtain a common part (alignment partial chain) of the reference display target and the comparison display target amino acid sequences so that the partial structures corresponding to the common part overlap. It is based on this assumption that the arrangement position of the comparison display target is calculated.
- Embodiment 3 by displaying the display surface Sd and its electrical characteristics for the display target (here, antibody) of each three-dimensional structure data pair, the antibody when each antigen protein binds to the antibody protein
- the side binding site (the portion of the display surface Sd of the antibody that is considered highly likely to form a non-covalent interaction due to electrical characteristics) can be viewed at once from substantially the same direction. .
- the binding site or binding site on the antibody side It will be possible to list how the electrical characteristics of the surroundings are different and compare them efficiently. Therefore, it becomes possible to easily identify a change in the binding site on the antibody protein side due to a difference in the antigen protein, an antigen highly likely to bind strongly to an important partial structure of the antibody, or the like.
- FIG. 20 is an explanatory diagram of a display screen example of the rotation display state according to the third embodiment.
- a first display area 2001 on the left side displays a three-dimensional model to be displayed as a reference.
- a region colored other than black is the display surface Sd colored as an electrical characteristic.
- the character string WT on the left shoulder indicates that the antigen protein bound to the three-dimensional model to be displayed is a wild type (wild type).
- the character string (Lys96) on the left shoulder indicates the amino acid sequence of the portion to be mutated with the antigen protein bound to the three-dimensional model to be displayed.
- the display areas 2001 and 2002 in FIG. 20 use a three-dimensional viewpoint coordinate system in which the viewpoint coordinates shown in FIG.
- the center of gravity of the reference display target is set to a predetermined position on the Z axis.
- each comparison display target three-dimensional model indicates the name indicating the mutated amino acid sequence among the amino acid sequences of the antigen protein interacting with each display target (antibody).
- the comparison display object is arranged in the same viewpoint coordinate system as the reference display object, and is rotated and displayed at the rotation angle of the reference display object. Moreover, the rotation axis of the comparison display target may be used as it is, or may be obtained from the comparison display target.
- symbol is attached
- FIG. 21 is a block diagram of a functional configuration of the information display apparatus according to the third embodiment.
- a determination unit 2101 and a search unit 2102 are further added to the functions described in the first embodiment.
- the determination unit 2101 and the search unit 2102 also have the CPU 201 execute a program stored in a storage device such as the ROM 202, the RAM 203, the magnetic disk 205, and the optical disk 207 shown in FIG.
- the function is realized by the I / F 209.
- the functions of the acquisition unit 301 to the drawing unit 308 are the same as those in the first embodiment, but only different points will be described.
- the acquisition unit 301 performs the acquisition process described in Embodiment 1 for each of the reference three-dimensional structure data pair and the comparison three-dimensional structure data pair.
- the comparison three-dimensional structure data pair is a three-dimensional structure data pair whose display object is the same as the reference three-dimensional structure data pair and whose comparison object is different.
- FIG. 22 is an explanatory diagram showing three-dimensional structure data of a comparative protein complex that is a pair of comparative three-dimensional structure data.
- the field items are the same as those in FIG.
- the display target of the reference three-dimensional structure data pair is “reference display target”, and the display target of the comparison three-dimensional structure data pair is “comparison display target”.
- the comparison display object is the same type of antibody as the reference display object.
- the comparison target for comparison display is a mutant in which a part of the amino acids of the antigen to be compared in the reference three-dimensional structure data pair is replaced.
- the extraction unit 302, the selection unit 303, and the generation unit 304 perform the extraction process, the selection process, and the generation process described in the first embodiment for each of the reference display target and the comparison display target.
- the standard display target antibody and the comparative display target antibody are basically the same protein, but the amino acid sequence is partially (in a part other than the part related to the main function). It does not matter if they are different.
- FIG. 23-1 is an explanatory diagram showing molecular surface structure data representing the molecular surface S of an antibody that is a reference display target.
- the field items are the same as those in FIGS. 7-1 and 7-2.
- FIG. 23-2 is an explanatory diagram illustrating reference point data representing a reference point on the molecular surface S of an antibody that is a reference display target.
- the reference point data 2302 includes the coordinate value of the reference point on the molecular surface S of the antibody that is the reference display target and the value of the electrostatic potential.
- FIG. 24-1 is an explanatory diagram showing molecular surface structure data representing the molecular surface S of the antibody to be compared and displayed.
- the field items are the same as those in FIGS. 7-1 and 7-2.
- FIG. 24-2 is an explanatory diagram showing reference point data representing the reference point of the molecular surface S of the antibody to be compared and displayed.
- the reference point data 2402 includes the coordinate value of the reference point on the molecular surface S of the antibody to be compared and displayed and the value of the electrostatic potential.
- the setting process shown in the first embodiment is performed. Specifically, the reference display target rotation axis is obtained as in the first embodiment. On the other hand, the rotation display target rotation axis is not obtained here.
- the rotation angle calculation unit 306 performs the rotation angle calculation processing shown in the first embodiment only for the reference display target.
- the determination unit 2101 has a function of determining the commonality between the arrangement of the constituent elements constituting the reference display target and the arrangement of the constituent elements constituting the comparison display target. Specifically, multiple sequence alignment is executed for the amino acid sequence that is the reference display target and the amino acid sequence that is the comparative display target. Then, the amino acid sequence in which homology is recognized is used as a partial chain for alignment.
- the existing calculation method (for example, refer to the following nonpatent literature 5) is utilized about the calculation method of multiple sequence alignment about an amino acid sequence. This processing is necessary when the reference display target / comparison display target proteins (antibodies) are not completely the same, and when it is guaranteed that they are completely the same, the processing is omitted. Thus, the entire amino acid sequence may be a partial chain for alignment.
- Non-patent document 5 Larkin M.M. A. et al. “Clustal W and Clustal X version 2.0” Bioinformatics, Vol. 23: P.I. 2947-2948 (2007).
- FIG. 25 is an explanatory diagram showing an execution example of multiple sequence alignment.
- the line “reference” is the amino acid sequence of the antibody protein to be displayed as a reference
- “comparison” is the amino acid sequence of the antibody protein to be displayed as a comparison.
- “*” indicates that the same amino acid is present in the reference display object and the comparison display object at the same position on the sequence.
- the search unit 2102 has a function of searching the arrangement position of the comparison display target with respect to the reference display target so that the components determined to be common by the determination unit 2101 overlap each other.
- RMSD Root Mean Square Deviation
- FIG. 26 is an explanatory diagram showing an example of a three-dimensional model in which a comparison display object is superimposed on a reference display object.
- the portion expressed in white indicates that the reference display object and the comparison display object are at the same arrangement position.
- the portion expressed in black indicates that the reference display object and the comparison display object are different arrangement positions.
- the conversion unit 307 performs the conversion process shown in Embodiment 1 for each of the reference display object and the comparison display object. Specifically, when the coordinate value of each vertex constituting the display surface Sd of the reference display target is changed from the normal of the reference point P to the anti-gaze direction by the rotation angle calculated by the rotation angle calculation unit 306 Convert to the coordinate value of.
- the coordinate value of each vertex constituting the display surface Sd of the comparison display target is represented by the normal line of the reference point P by the rotation angle. It is converted into the coordinate value when the direction is changed in the anti-gaze direction.
- the rotation axis used for the comparison display object is the rotation axis obtained from the reference display object. Alternatively, the rotation axis obtained from the reference display target may be moved in parallel so as to pass through a predetermined point.
- the rotation axis of the reference display object is set to pass through the center of gravity of the reference display object
- the comparison display object is also set to pass through the center of gravity of the reference display object
- the rotation axis of the reference display object is When it is set to pass through the reference point P of the display surface Sd to be the reference display target, the rotation axis of the comparison display target may be set to pass through the reference point P of the display surface Sd of the comparison display target. Good.
- the drawing unit 308 performs the drawing process described in the first embodiment for each of the reference display target and the comparison display target.
- the reference display object is rotated and displayed as in the first embodiment, and the comparative display object is also rotated and displayed in conjunction with the rotation of the reference display object.
- the reference display object and the comparison display object are displayed in separate display areas.
- FIG. 27A is an explanatory diagram of a three-dimensional model example after rotation display of a wild-type antibody that is a reference display target.
- FIG. 27B is an explanatory diagram of an example of a three-dimensional model after rotation display of the antibody to be compared and displayed.
- the molecular surfaces other than the display surface Sd are colored black.
- FIG. 28 is a flowchart of an information display processing procedure performed by the information display apparatus according to the third embodiment.
- the acquisition unit 301 acquires a reference three-dimensional structure data pair and a comparison three-dimensional structure data pair (step S2801).
- the molecular surface S of each structural data is calculated (step S2802), and it is determined whether or not there is a display target whose display surface Sd has not been extracted (step S2803).
- step S2803 Yes
- one unextracted display target is selected (step S2804), the display surface extraction process similar to step S1403 is executed (step S2805), and step S2803 is performed.
- step S2803 determines whether there is a comparative display target for which the arrangement position has not been searched.
- step S2806 determines whether there is a comparative display target for which the arrangement position has not been searched.
- step S2806 determines whether there is a comparative display target for which the arrangement position has not been searched.
- step S2809 the search unit 2102 searches for the arrangement position of the comparison display object that minimizes the RMSD between the alignment partial chain structures of the reference display object and the comparison display object. Thereby, the arrangement position of the comparison display object is determined based on the center of gravity of the reference display object. Then, the process returns to step S2806.
- step S2806 when there is no unsearched comparison display target (step S2806: No), display surface interlocking rotation display processing is executed (step S2810), and a series of processing ends.
- FIG. 29 is a flowchart showing a detailed processing procedure of the display surface interlocking rotation display processing (step S2810) shown in FIG.
- step S2901 it is determined whether or not the reference display target is unprocessed for this processing. If not processed (step S2901: YES), the selection unit 303 selects a reference display object (step S2902), and selects the reference point P from the reference display objects as in the first embodiment (step S2902). S2903).
- step S2904 the generation unit 304 generates a vertex normal vector of the reference point P (step S2904), and the setting unit 305 sets the rotation axis (step S2905). Thereafter, the rotation angle calculation unit 306 calculates the rotation angle (step S2906), and the process returns to step S2901.
- step S2901 when the reference display target is not unprocessed (step S2901: No), the conversion unit 307 performs coordinate conversion of the reference display target in the same manner as in the first embodiment. Also, the coordinate conversion of the comparison display target is performed around the rotation axis calculated for the reference display object and by the rotation angle calculated for the reference display object in the same rotation direction as the reference display object ( Step S2907).
- the drawing process of the display surface Sd (including the molecular surface S, atoms, and amino acid residues) after the coordinate conversion is performed in each display area (step S2908).
- the reference display object and the comparative display object are colored on the display surface Sd according to the respective electrical characteristics.
- a specific color black or white
- the display surface interlocking rotation display process (step S2810) is terminated.
- the reference display object can be rotated and displayed in the designated rotation direction by designating (dragging) the rotation direction and the rotation angle using the pointing device.
- the comparison display object can be rotated and displayed in conjunction with the same rotation direction and rotation angle. Therefore, it can be seen from the direction that the user wants to view, and the degree of freedom can be improved.
- the electrical characteristics of the display surface Sd (binding site) of the antibody that binds to the antigen variant can be viewed at once from substantially the same direction as the antibody that binds to the antigen. Become. Therefore, it is possible to easily identify the binding site portion of the antibody whose electrical characteristics greatly change due to the amino acid mutation of the antigen.
- the molecular surface S having a remarkable electrical property (the molecular surface S in the vicinity of the reference point P) and its electrical property can be automatically drawn in a direction facing the user's line of sight. Therefore, it is possible to easily observe the electrical characteristics of the portion of the molecular surface S that is highly likely to be strongly involved in protein binding.
- the distance between the reference points between the constituent proteins in the state where the parts of the molecular surface S that are highly likely to be involved in the interaction can be displayed. Therefore, the user can easily determine whether or not a non-covalent interaction is likely to be formed.
- the comparison display object can be displayed in a single view so as to be a perspective view from substantially the same direction in conjunction with the reference display object, and further, can be rotated and displayed in conjunction with the reference display object. Therefore, the electrical characteristics of the display surface Sd of each comparison display target (the state of charge bias around the binding site on the antibody side when an antigen variant is bound) and the electrical characteristics of the display surface Sd of the reference display target ( It is possible to visually recognize from the same direction at the same time the state of charge bias around the binding site on the antibody side when a wild-type antigen is bound.
- the user can change the position of the binding site on the antibody protein side (part of the display surface Sd that suggests the formation of a non-covalent interaction due to a strong bias of charge, etc.) derived from the difference in antigen protein, It becomes possible to easily identify an antigen that is highly likely to bind strongly to an important partial structure of an antibody (for example, around the part of the antigen to which a wild-type antigen binds).
- the information display method described in the present embodiment can be realized by executing a program prepared in advance on a computer such as a personal computer or a workstation.
- This program is recorded on a computer-readable recording medium such as a hard disk, a flexible disk, a CD-ROM, an MO, and a DVD, and is executed by being read from the recording medium by the computer.
- This program may be distributed via a network such as the Internet.
Landscapes
- Life Sciences & Earth Sciences (AREA)
- Engineering & Computer Science (AREA)
- Physics & Mathematics (AREA)
- Bioinformatics & Cheminformatics (AREA)
- Spectroscopy & Molecular Physics (AREA)
- Health & Medical Sciences (AREA)
- Biotechnology (AREA)
- Bioinformatics & Computational Biology (AREA)
- Evolutionary Biology (AREA)
- General Health & Medical Sciences (AREA)
- Medical Informatics (AREA)
- Biophysics (AREA)
- Theoretical Computer Science (AREA)
- Chemical & Material Sciences (AREA)
- Data Mining & Analysis (AREA)
- Medicinal Chemistry (AREA)
- Pharmacology & Pharmacy (AREA)
- Crystallography & Structural Chemistry (AREA)
- Processing Or Creating Images (AREA)
Abstract
Fig. (A) shows a three-dimensional shape model (102) of an antigen which is a displayed object and a three-dimensional shape model (101) of an antibody which is a compared object. Fig. (B) shows that a display surface (Sd) is segmented. The display surface (Sd) is a part of the molecular surface (S) of the displayed object and is at a distance from the compared object at which the objects can be bonded to each other. Fig. (C) shows the rotated state of the three-dimensional shape model (102). The direction of the normal vector of the display surface (Sd) of the three-dimensional shape model (102) is changed to the direction opposite to that of the line of sight. Therefore, the three-dimensional shape model (102) is rotated in a three-dimensional view-point coordinate system. Fig. (D) shows the displayed state after the rotation shown in Fig. (C). In Fig. (D), only the display surface (Sd) is colored and displayed, and the other molecule surface (S) not displayed is not colored. With this, the surface (Sd) of the antigen at a distance at which the antigen can be bonded to the antibody as shown in Fig. (A) can be displayed in a position in which the user can easily view the display surface (Sd).
Description
本開示技術は、情報を表示する情報表示プログラム、情報表示装置、および情報表示方法に関する。
The present disclosure technique relates to an information display program, an information display device, and an information display method for displaying information.
従来、医薬品開発等において、タンパク質複合体の構成タンパク質(もしくはサブユニット)間の結合部位の決定は、ひとつの重要な課題である。たとえば、疾患の原因となるタンパク質複合体が知られている場合、その複合体の形成を阻害する医薬品候補を、構成タンパク質の結合に強く関与する部位(「結合部位」と称す)の形状に基づき設計することが行われている。
Conventionally, in drug development and the like, determination of a binding site between constituent proteins (or subunits) of a protein complex is one important issue. For example, when a protein complex that causes disease is known, a drug candidate that inhibits the formation of the complex is based on the shape of the site that is strongly involved in the binding of the constituent proteins (referred to as the “binding site”). The design is done.
タンパク質複合体は、一般に、構成タンパク質それぞれが、比較的近距離で働く非共有結合性の弱い相互作用によって、別の構成タンパク質と結合することで形成されていると考えられている。また、結合部位は、そのような相互作用に関連する構成タンパク質の部位である。したがって、近接する構成タンパク質の分子表面の幾何学的な相補性(凹凸のかみ合わせ等)や、電気的相補性(近接面における静電ポテンシャルの正負)を手がかりに探索することがよく行われている。
A protein complex is generally considered to be formed by binding each constituent protein to another constituent protein by a weak non-covalent interaction that works at a relatively short distance. A binding site is also a site of a constituent protein associated with such an interaction. Therefore, it is often performed to search for geometric complementarity (engagement of irregularities, etc.) on the molecular surface of adjacent constituent proteins and electrical complementarity (positive / negative of electrostatic potential on the proximity surface). .
結合部位の決定を支援する技術として、タンパク質の3次元構造を計算機ディスプレイ上に表示する3-Dビューアが知られている。3-Dビューアでは、X線構造解析等によって得られたタンパク質の3次元構造データ(典型的には、タンパク質を構成する原子の種類と3次元座標上の位置を格納したファイル)に基づき、タンパク質の3次元構造をある方向から見た図を作成し、計算機ディスプレイ上に表示する。
As a technique for supporting the determination of the binding site, a 3-D viewer that displays the three-dimensional structure of a protein on a computer display is known. In the 3-D viewer, based on the three-dimensional structure data of the protein obtained by X-ray structural analysis (typically, a file that stores the types of atoms constituting the protein and positions on the three-dimensional coordinates) The figure which looked at the three-dimensional structure from a certain direction is created and displayed on the computer display.
タンパク質の3次元構造の表現モデルとしては、いくつかの種類が知られている。たとえば、タンパク質の形状を、3次元構造データによって求めた分子表面によって表現し、分子表面上の各点における静電ポテンシャルを色などによって表現(たとえば、正の電荷を青、負の電荷を赤で表現)するモデルである。
Several types of expression models for the three-dimensional structure of proteins are known. For example, the protein shape is expressed by the molecular surface obtained from the three-dimensional structure data, and the electrostatic potential at each point on the molecular surface is expressed by color (for example, positive charge is blue, negative charge is red) Model).
また、タンパク質の機能部位の形状と物性をデータベース化して提供しているeF-siteでは、この種のモデルによるタンパク質の3次元構造を表示する機能を備えたPDBj Viewerと呼ばれるツールが提供されている(たとえば、非特許文献1を参照。)。
In addition, eF-site, which provides a database of protein functional site shapes and physical properties, provides a tool called PDBj Viewer with a function to display the three-dimensional structure of proteins based on this type of model. (For example, refer nonpatent literature 1.).
しかしながら、上述した従来技術では、複数のタンパク質が結合した複合体の3次元構造を表示した場合、タンパク質の近接する分子表面が、周囲の分子表面に隠れて見えなくなってしまうという問題があった。
However, the above-described conventional technique has a problem in that when a three-dimensional structure of a complex in which a plurality of proteins are bound is displayed, the molecular surface adjacent to the protein is hidden behind the surrounding molecular surface.
図30は、表示画面に表示されたタンパク質複合体の3次元形状モデルを示す説明図である。図30において、X軸およびX軸に直交するY軸からなるXY平面は表示画面Dに対応しており、Z軸はXY平面に直交して表示画面Dの奥行きを表現する。タンパク質複合体の3次元形状モデル100は、抗体の3次元形状モデル101と抗原の3次元形状モデル102とが複合されたオブジェクトである。
FIG. 30 is an explanatory view showing a three-dimensional shape model of the protein complex displayed on the display screen. In FIG. 30, an XY plane composed of an X axis and a Y axis orthogonal to the X axis corresponds to the display screen D, and a Z axis represents the depth of the display screen D orthogonal to the XY plane. The protein complex 3D shape model 100 is an object in which an antibody 3D shape model 101 and an antigen 3D shape model 102 are combined.
タンパク質複合体の3次元形状モデル100は、X軸、Y軸およびZ軸からなる3次元座標系を基準にして表示されている。図30では、抗体の3次元形状モデル101および抗原の3次元形状モデル102が近接する分子表面が、周囲の分子表面に隠れて見えなくなってしまっている。
The three-dimensional shape model 100 of the protein complex is displayed with reference to a three-dimensional coordinate system composed of an X axis, a Y axis, and a Z axis. In FIG. 30, the molecular surface where the three-dimensional shape model 101 of the antibody and the three-dimensional shape model 102 of the antigen are close is hidden behind the surrounding molecular surface and cannot be seen.
図31は、タンパク質複合体の3次元形状モデル100のユーザ操作による回転状態を示す説明図である。図31では、抗体の3次元形状モデル101と抗原の3次元形状モデル102を別々の表示画面D1,D2に表示している。図31において(A)が回転前、(B)が回転後の状態を示している。抗体の3次元形状モデル101は、ユーザ操作により、Y軸に平行な回転軸Ay1により回転させられる。抗原の3次元形状モデル102は、ユーザ操作により、Y軸に平行な回転軸Ay2により回転させられる。
FIG. 31 is an explanatory diagram showing a rotation state of the protein complex three-dimensional shape model 100 by a user operation. In FIG. 31, the antibody three-dimensional shape model 101 and the antigen three-dimensional shape model 102 are displayed on separate display screens D1 and D2. In FIG. 31, (A) shows a state before rotation, and (B) shows a state after rotation. The three-dimensional shape model 101 of the antibody is rotated by a rotation axis Ay1 parallel to the Y axis by a user operation. The antigen three-dimensional shape model 102 is rotated by a user operation with a rotation axis Ay2 parallel to the Y axis.
図31に示したように、分子表面の電気的特徴を視認できるようにするためには、表示画面D1,D2のようにそれぞれの構成タンパク質を別々に表示しなければならなかった。また、(B)に示したように、近接する分子表面の電気的特徴が視認できる方向に回転させる場合、ユーザが適宜回転方向を指定しなければならなかった。
As shown in FIG. 31, in order to make the electrical characteristics of the molecular surface visible, each constituent protein had to be displayed separately as in the display screens D1 and D2. Also, as shown in (B), when rotating in the direction in which the electrical characteristics of the neighboring molecular surfaces can be visually recognized, the user has to specify the rotation direction as appropriate.
本開示技術は、上記を鑑みてなされたもので、表示対象と比較対象との間の結合に関わる可能性の高い表示対象の表面の特徴的な部分を視認し易く表示することができる情報表示プログラム、情報表示装置、および情報表示方法を提供することを目的とする。
The present disclosure technique has been made in view of the above, and is an information display that can easily display a characteristic portion of the surface of a display target that is likely to be related to the coupling between the display target and the comparison target. It is an object to provide a program, an information display device, and an information display method.
上述した課題を解決し、目的を達成するため、本開示技術では、表示画面をX軸およびY軸からなるXY平面とし、表示画面の奥行き方向を前記XY平面に直交するZ軸とする3次元座標系として、前記表示画面にオブジェクトを表示する場合、表示対象となるオブジェクトの3次元構造データ、および、当該表示対象と近接または接触したオブジェクトである比較対象の3次元構造データの組み合わせとなる3次元構造データ対を取得し、取得された表示対象により特定される前記表示対象の表面のうち、前記比較対象により特定される前記比較対象の表面から所定距離以内となる表面を前記表示対象の表示面として抽出し、抽出された前記表示対象の表示面を構成する各頂点が有する特徴量に基づいて、前記頂点群の中から基準点を選択し、選択された基準点の法線を、当該基準点から前記表示画面に向かう方向に変換させる回転角を算出し、算出された回転角に応じて前記表示対象の表示面を構成する各頂点の座標を変換し、変換後における前記表示対象の表示面を、前記特徴量に基づいて前記表示画面に描画することを要件とする。
In order to solve the above-described problems and achieve the object, in the disclosed technology, the display screen is a three-dimensional display in which the display screen is an XY plane composed of an X axis and a Y axis, and the depth direction of the display screen is a Z axis orthogonal to the XY plane. When an object is displayed on the display screen as a coordinate system, it is a combination of the three-dimensional structure data of the object to be displayed and the comparison target three-dimensional structure data that is an object close to or in contact with the display target. Display of the display target is a surface within a predetermined distance from the surface of the comparison target specified by the comparison target among the surfaces of the display target specified by the acquired display target by acquiring the dimensional structure data pair A reference point is selected from the group of vertices based on the feature value of each vertex that is extracted as a plane and that constitutes the extracted display surface of the display target. And calculating a rotation angle for converting the normal line of the selected reference point in a direction from the reference point toward the display screen, and each vertex constituting the display surface of the display target according to the calculated rotation angle It is a requirement that the coordinates of the display are converted and the display surface of the display target after conversion is drawn on the display screen based on the feature amount.
本開示技術によれば、表示対象と比較対象との間の結合に関わる可能性の高い表示対象の表面の特徴的な部分を視認しやすく表示することができるという効果を奏する。
According to the present disclosure technique, it is possible to easily display a characteristic portion of the surface of the display target that is likely to be related to the connection between the display target and the comparison target.
Ar 回転軸
D 表示画面
P 基準点
S 分子表面
Sd 表示面
d 基準点間距離
n 頂点法線ベクトル
nz 反視線方向のベクトル
θ 回転角
300 情報表示装置
301 取得部
302 抽出部
303 選択部
304 生成部
305 設定部
306 回転角算出部
307 変換部
308 描画部
1701 指定部
1702 距離算出部
2101 判定部
2102 探索部
Ala アラニン
Cys システイン
Asp アスパラギン酸
Glu グルタミン酸
Phe フェニルアラニン
Gly グリシン
His ヒスチジン
Ile イソロイシン
Lys リジン
Leu ロイシン
Met メチオニン
Asn アスパラギン
Pro プロリン
Gln グルタミン
Arg アルギニン
Ser セリン
Thr トレオニン
Val バリン
Trp トリプトファン
Tyr チロシン Ar rotation axis D display screen P reference point S molecular surface Sd display surface d reference point distance n vertex normal vector nz anti-sight line direction vectorθ rotation angle 300 information display device 301 acquisition unit 302 extraction unit 303 selection unit 304 generation unit 305 setting unit 306 rotation angle calculation unit 307 conversion unit 308 drawing unit 1701 designation unit 1702 distance calculation unit 2101 determination unit 2102 search unit Ala alanine Cys cysteine Asp aspartic acid Glu glutamic acid Phe phenylalanine Gly glycine His histidine Ile isoleucine Lys lysine Leu leucine M Asn Asparagine Pro Proline Gln Glutamine Arg Arginine Ser Serine Thr Threonine Val Valine Trp Tryptophan Tyr Tyrosine
D 表示画面
P 基準点
S 分子表面
Sd 表示面
d 基準点間距離
n 頂点法線ベクトル
nz 反視線方向のベクトル
θ 回転角
300 情報表示装置
301 取得部
302 抽出部
303 選択部
304 生成部
305 設定部
306 回転角算出部
307 変換部
308 描画部
1701 指定部
1702 距離算出部
2101 判定部
2102 探索部
Ala アラニン
Cys システイン
Asp アスパラギン酸
Glu グルタミン酸
Phe フェニルアラニン
Gly グリシン
His ヒスチジン
Ile イソロイシン
Lys リジン
Leu ロイシン
Met メチオニン
Asn アスパラギン
Pro プロリン
Gln グルタミン
Arg アルギニン
Ser セリン
Thr トレオニン
Val バリン
Trp トリプトファン
Tyr チロシン Ar rotation axis D display screen P reference point S molecular surface Sd display surface d reference point distance n vertex normal vector nz anti-sight line direction vector
以下に添付図面を参照して、本開示技術の好適な実施の形態を詳細に説明する。本開示技術では、X軸およびY軸からなるXY平面としXY平面に直交する軸をZ軸とする3次元視点座標系として、表示画面Dにオブジェクトを表示する。Z軸の奥行き方向は視点座標からみた視線方向となり、その逆方向が反視線方向となる。本実施の形態では、オブジェクトをタンパク質の3次元形状モデルとして説明する。
Hereinafter, preferred embodiments of the disclosed technology will be described in detail with reference to the accompanying drawings. In the disclosed technique, an object is displayed on the display screen D as a three-dimensional viewpoint coordinate system in which an XY plane including an X axis and a Y axis and an axis orthogonal to the XY plane is a Z axis. The depth direction of the Z axis is the line-of-sight direction viewed from the viewpoint coordinates, and the opposite direction is the anti-line-of-sight direction. In the present embodiment, the object is described as a three-dimensional shape model of protein.
図1は、本実施の形態の概要を示す説明図である。(A)は図30に示した状態と同一内容を示している。ここでは、抗原の3次元形状モデル102を表示対象とし、抗体の3次元形状モデル101を抗原の3次元形状モデル102の比較対象とする。抗原の3次元形状モデル102には、電気的特性である静電ポテンシャルに応じた着色が施されている。一方、抗体についても静電ポテンシャルがあるが、抗体の3次元形状モデル101は表示対象ではないため、静電ポテンシャルによる着色は施さないものとする。したがって、図1では、抗体の3次元形状モデル101は、輪郭のみを表示している。
FIG. 1 is an explanatory diagram showing an outline of the present embodiment. (A) has shown the same content as the state shown in FIG. Here, the three-dimensional shape model 102 of the antigen is the display target, and the three-dimensional shape model 101 of the antibody is the comparison target of the three-dimensional shape model 102 of the antigen. The three-dimensional shape model 102 of the antigen is colored according to an electrostatic potential that is an electrical characteristic. On the other hand, the antibody also has an electrostatic potential, but since the three-dimensional shape model 101 of the antibody is not a display target, it is not colored by the electrostatic potential. Therefore, in FIG. 1, the three-dimensional shape model 101 of the antibody displays only the outline.
(B)は、表示面Sdの切り出しを示している。表示面Sdとは、表示対象の分子表面のうち比較対象と結合可能な距離にある表示対象の部分的な分子表面である。分子表面は通常凹凸があるため表示面Sdにも凹凸があるが、(B)では図面の簡略化のため凹凸までは表現していない。
(B) shows the cutout of the display surface Sd. The display surface Sd is a partial molecular surface to be displayed at a distance that can be combined with the comparison target among the molecular surfaces to be displayed. Since the molecular surface is usually uneven, the display surface Sd also has unevenness. However, in FIG.
(C)は、表示対象である抗原の3次元形状モデル102の回転状態を示している。ここでは、回転軸Arを回転軸として回転させている。回転軸Arは、法線ベクトルnと反視線方向のベクトルnzとを含む平面に直交する軸である。抗原の3次元形状モデル102は、回転軸Ar回りに表示面Sdの法線ベクトルnを反視線方向に方向転換させる。これにより、抗原の3次元形状モデル102が3次元視点座標系において回転させられる。
(C) shows the rotation state of the three-dimensional shape model 102 of the antigen to be displayed. Here, the rotation axis Ar is rotated as the rotation axis. The rotation axis Ar is an axis orthogonal to a plane including the normal vector n and the anti-gaze direction vector nz. The antigen three-dimensional shape model 102 changes the normal vector n of the display surface Sd around the rotation axis Ar in the anti-sight line direction. Thereby, the three-dimensional shape model 102 of the antigen is rotated in the three-dimensional viewpoint coordinate system.
(D)は、(C)による回転後の表示状態を示している。(D)では、表示面Sdのみを着色して表示し、表示以外の分子表面については、着色は施されていない(施してもよいが、表示面Sdとは区別できるように表示する)。これにより、(A)の状態で抗体と結合可能な距離にある抗原の表示面Sdがユーザに視認しやすい位置で表示することができる。ここでは抗原を表示対象としたが、抗体を表示対象とした場合も同様である。
(D) shows the display state after rotation by (C). In (D), only the display surface Sd is colored and displayed, and the molecular surface other than the display is not colored (although it may be applied, it is displayed so that it can be distinguished from the display surface Sd). As a result, the antigen display surface Sd at a distance capable of binding to the antibody in the state (A) can be displayed at a position that is easily visible to the user. Although the antigen is the display target here, the same applies to the case where the antibody is the display target.
(情報表示装置のハードウェア構成)
図2は、実施の形態(実施の形態1~3共通)にかかる情報表示装置のハードウェア構成を示すブロック図である。図2において、情報表示装置は、CPU(Central Processing Unit)201と、ROM(Read‐Only Memory)202と、RAM(Random Access Memory)203と、磁気ディスクドライブ(Hard Disk Drive)204と、磁気ディスク205と、光ディスクドライブ206と、光ディスク207と、ディスプレイ208と、I/F(Interface)209と、キーボード210と、マウス211と、スキャナ212と、プリンタ213と、を備えている。また、各構成部はバス200によってそれぞれ接続されている。 (Hardware configuration of information display device)
FIG. 2 is a block diagram showing a hardware configuration of the information display apparatus according to the embodiment (common to the first to third embodiments). In FIG. 2, the information display device includes a CPU (Central Processing Unit) 201, a ROM (Read-Only Memory) 202, a RAM (Random Access Memory) 203, a magnetic disk drive (Hard Disk Drive) 204, and a magnetic disk. 205, anoptical disc drive 206, an optical disc 207, a display 208, an I / F (Interface) 209, a keyboard 210, a mouse 211, a scanner 212, and a printer 213. Each component is connected by a bus 200.
図2は、実施の形態(実施の形態1~3共通)にかかる情報表示装置のハードウェア構成を示すブロック図である。図2において、情報表示装置は、CPU(Central Processing Unit)201と、ROM(Read‐Only Memory)202と、RAM(Random Access Memory)203と、磁気ディスクドライブ(Hard Disk Drive)204と、磁気ディスク205と、光ディスクドライブ206と、光ディスク207と、ディスプレイ208と、I/F(Interface)209と、キーボード210と、マウス211と、スキャナ212と、プリンタ213と、を備えている。また、各構成部はバス200によってそれぞれ接続されている。 (Hardware configuration of information display device)
FIG. 2 is a block diagram showing a hardware configuration of the information display apparatus according to the embodiment (common to the first to third embodiments). In FIG. 2, the information display device includes a CPU (Central Processing Unit) 201, a ROM (Read-Only Memory) 202, a RAM (Random Access Memory) 203, a magnetic disk drive (Hard Disk Drive) 204, and a magnetic disk. 205, an
ここで、CPU201は、情報表示装置の全体の制御を司る。ROM202は、ブートプログラムなどのプログラムを記憶している。RAM203は、CPU201のワークエリアとして使用される。磁気ディスクドライブ204は、CPU201の制御にしたがって磁気ディスク205に対するデータのリード/ライトを制御する。磁気ディスク205は、磁気ディスクドライブ204の制御で書き込まれたデータを記憶する。
Here, the CPU 201 controls the entire information display device. The ROM 202 stores a program such as a boot program. The RAM 203 is used as a work area for the CPU 201. The magnetic disk drive 204 controls reading / writing of data with respect to the magnetic disk 205 according to the control of the CPU 201. The magnetic disk 205 stores data written under the control of the magnetic disk drive 204.
光ディスクドライブ206は、CPU201の制御にしたがって光ディスク207に対するデータのリード/ライトを制御する。光ディスク207は、光ディスクドライブ206の制御で書き込まれたデータを記憶したり、光ディスク207に記憶されたデータをコンピュータに読み取らせたりする。
The optical disc drive 206 controls reading / writing of data with respect to the optical disc 207 according to the control of the CPU 201. The optical disk 207 stores data written under the control of the optical disk drive 206, or causes the computer to read data stored on the optical disk 207.
ディスプレイ208は、カーソル、アイコンあるいはツールボックスをはじめ、文書、画像、機能情報などのデータを表示する。このディスプレイ208は、たとえば、CRT、TFT液晶ディスプレイ、プラズマディスプレイなどを採用することができる。
The display 208 displays data such as a document, an image, and function information as well as a cursor, an icon, or a tool box. As the display 208, for example, a CRT, a TFT liquid crystal display, a plasma display, or the like can be adopted.
インターフェース(以下、「I/F」と略する。)209は、通信回線を通じてLAN(Local Area Network)、WAN(Wide Area Network)、インターネットなどのネットワーク214に接続され、このネットワーク214を介して他の装置に接続される。そして、I/F209は、ネットワーク214と内部のインターフェースを司り、外部装置からのデータの入出力を制御する。I/F209には、たとえばモデムやLANアダプタなどを採用することができる。
An interface (hereinafter abbreviated as “I / F”) 209 is connected to a network 214 such as a LAN (Local Area Network), a WAN (Wide Area Network), or the Internet through a communication line, and others are connected via this network 214. Connected to other devices. The I / F 209 controls an internal interface with the network 214 and controls data input / output from an external device. For example, a modem or a LAN adapter may be employed as the I / F 209.
キーボード210は、文字、数字、各種指示などの入力のためのキーを備え、データの入力をおこなう。また、タッチパネル式の入力パッドやテンキーなどであってもよい。マウス211は、カーソルの移動や範囲選択、あるいはウィンドウの移動やサイズの変更などをおこなう。ポインティングデバイスとして同様に機能を備えるものであれば、トラックボールやジョイスティックなどであってもよい。
The keyboard 210 includes keys for inputting characters, numbers, various instructions, and the like, and inputs data. Moreover, a touch panel type input pad or a numeric keypad may be used. The mouse 211 performs cursor movement, range selection, window movement, size change, and the like. A trackball or a joystick may be used as long as they have the same function as a pointing device.
スキャナ212は、画像を光学的に読み取り、情報表示装置内に画像データを取り込む。なお、スキャナ212は、OCR(Optical Character Reader)機能を持たせてもよい。また、プリンタ213は、画像データや文書データを印刷する。プリンタ213には、たとえば、レーザプリンタやインクジェットプリンタを採用することができる。
The scanner 212 optically reads an image and takes in the image data into the information display device. The scanner 212 may have an OCR (Optical Character Reader) function. The printer 213 prints image data and document data. As the printer 213, for example, a laser printer or an ink jet printer can be employed.
<実施の形態1>
以下、本開示技術の実施の形態1~3について順次説明する。実施の形態1では、図1に示した本開示技術の基本的構成を示す。実施の形態1では、複合体を形成している2つのタンパク質(抗原と抗体)について、一方のタンパク質を表示対象、他方のタンパク質を比較対象とする。そして、表示対象の分子表面Sから表示面Sdを切り出して、表示面Sdを回転表示させる。このあと、表示面Sdを構成する各頂点が有する特徴量に基づいて、頂点群の中から基準点を選択して表示させる。 <Embodiment 1>
Hereinafter,Embodiments 1 to 3 of the disclosed technology will be sequentially described. In the first embodiment, a basic configuration of the disclosed technique shown in FIG. 1 is shown. In Embodiment 1, for two proteins (antigen and antibody) forming a complex, one protein is to be displayed and the other protein is to be compared. Then, the display surface Sd is cut out from the molecule surface S to be displayed, and the display surface Sd is rotated and displayed. Thereafter, a reference point is selected from the vertex group and displayed based on the feature value of each vertex constituting the display surface Sd.
以下、本開示技術の実施の形態1~3について順次説明する。実施の形態1では、図1に示した本開示技術の基本的構成を示す。実施の形態1では、複合体を形成している2つのタンパク質(抗原と抗体)について、一方のタンパク質を表示対象、他方のタンパク質を比較対象とする。そして、表示対象の分子表面Sから表示面Sdを切り出して、表示面Sdを回転表示させる。このあと、表示面Sdを構成する各頂点が有する特徴量に基づいて、頂点群の中から基準点を選択して表示させる。 <
Hereinafter,
(情報表示装置の機能的構成)
図3は、実施の形態1にかかる情報表示装置の機能的構成を示すブロック図である。情報表示装置300は、取得部301と、抽出部302と、選択部303と、生成部304と、設定部305と、回転角算出部306と、変換部307と、描画部308と、を含む構成である。この制御部となる機能(取得部301~描画部308)は、具体的には、たとえば、図2に示したROM202、RAM203、磁気ディスク205、光ディスク207などの記憶装置に記憶されたプログラムをCPU201に実行させることにより、または、I/F209により、その機能を実現する。 (Functional configuration of information display device)
FIG. 3 is a block diagram of a functional configuration of the information display apparatus according to the first embodiment. Theinformation display device 300 includes an acquisition unit 301, an extraction unit 302, a selection unit 303, a generation unit 304, a setting unit 305, a rotation angle calculation unit 306, a conversion unit 307, and a drawing unit 308. It is a configuration. Specifically, the functions (acquisition unit 301 to drawing unit 308) that serve as the control unit are, for example, programs stored in a storage device such as the ROM 202, RAM 203, magnetic disk 205, and optical disk 207 shown in FIG. The function is realized by executing the function or by the I / F 209.
図3は、実施の形態1にかかる情報表示装置の機能的構成を示すブロック図である。情報表示装置300は、取得部301と、抽出部302と、選択部303と、生成部304と、設定部305と、回転角算出部306と、変換部307と、描画部308と、を含む構成である。この制御部となる機能(取得部301~描画部308)は、具体的には、たとえば、図2に示したROM202、RAM203、磁気ディスク205、光ディスク207などの記憶装置に記憶されたプログラムをCPU201に実行させることにより、または、I/F209により、その機能を実現する。 (Functional configuration of information display device)
FIG. 3 is a block diagram of a functional configuration of the information display apparatus according to the first embodiment. The
取得部301は、表示対象となる3次元構造データおよび当該表示対象と比較される比較対象となる3次元構造データの組み合わせとなる3次元構造データ対を取得する機能を有する。ここで、3次元構造データ対とは、上述した表示面Sdを表示させる表示対象と表示対象と比較される比較対象の3次元構造データである。
The acquisition unit 301 has a function of acquiring a 3D structure data pair that is a combination of 3D structure data to be displayed and 3D structure data to be compared with the display object. Here, the three-dimensional structure data pair is three-dimensional structure data to be compared with the display target for displaying the display surface Sd described above and the display target.
表示対象および比較対象の3次元形状モデルは、それぞれの3次元構造データを元にして生成される。実施の形態1では、3次元構造データ対として、タンパク質複合体に関する3次元構造データを例に挙げて説明する。タンパク質複合体の構成タンパク質群のうち一方(たとえば、抗体)を比較対象、他方(たとえば、抗原)を表示対象とする。
The 3D shape models to be displayed and compared are generated based on the respective 3D structure data. In the first embodiment, the three-dimensional structure data pair will be described by taking three-dimensional structure data related to a protein complex as an example. One (for example, antibody) is a comparison target and the other (for example, an antigen) is a display target among the protein groups constituting the protein complex.
図4は、タンパク質複合体の3次元構造データを示す説明図である。図4において、タンパク質複合体の3次元構造データ400は、レコード種別、原子識別番号、原子名、残基名、鎖名、残基識別番号、座標をフィールド項目としてタンパク質複合体の構成要素ごとにレコード化されている。
FIG. 4 is an explanatory diagram showing the three-dimensional structure data of the protein complex. In FIG. 4, the three-dimensional structure data 400 of the protein complex includes a record type, an atom identification number, an atom name, a residue name, a chain name, a residue identification number, and coordinates for each component of the protein complex as field items. Recorded.
レコード種別とは、構成要素を示すレコードの種別である。ここでは、レコード種別は原子であるため、「ATOM」となっている。したがって、レコード種別が「ATOM」であるレコードは、原子を構成要素とするレコードである。原子識別番号とは、レコードごとに固有の識別番号である。原子名とは、そのレコードにより特定される原子の名称である。残基名とは、そのレコードにより特定される原子を含むアミノ酸残基の名称である。
The record type is a record type indicating a component. Here, since the record type is atom, it is “ATOM”. Therefore, a record whose record type is “ATOM” is a record having atoms as constituent elements. The atom identification number is an identification number unique to each record. The atom name is the name of the atom specified by the record. The residue name is the name of an amino acid residue containing an atom specified by the record.
鎖名とは、タンパク質の基本構成単位であるペプチド鎖(アミノ酸がペプチド結合で鎖状に連結された高分子)を識別する名称であり、例えば、2つのペプチド鎖からなるタンパク質では、A鎖、B鎖のように命名される。残基識別番号とは、アミノ酸残基に固有な識別番号である。座標とは、特定の位置(たとえば、そのタンパク質複合体の重心やいずれか一方の構成タンパク質の重心など)を原点とする3次元のローカル座標系における原子の位置情報である。視点座標系で表現する場合は既知の座標変換をおこなえばよい。
The chain name is a name for identifying a peptide chain (a polymer in which amino acids are linked in a chain form by peptide bonds) that is a basic structural unit of a protein. For example, in a protein composed of two peptide chains, an A chain, Named as B chain. A residue identification number is an identification number unique to an amino acid residue. The coordinates are atomic position information in a three-dimensional local coordinate system having a specific position (for example, the center of gravity of the protein complex or the center of gravity of one of the constituent proteins) as the origin. In the case of expressing in the viewpoint coordinate system, a known coordinate conversion may be performed.
入力データとして、図4に示したタンパク質複合体の3次元構造データ400が入力されると、鎖名により、抗体の3次元構造データと抗原の3次元構造データとに分離する。これにより、3次元構造データ対が取得されることとなる。抗体と抗原の分離は、タンパク質複合体の3次元構造データ400中、鎖名により分離する。図4に示したタンパク質複合体の3次元構造データ400では、A鎖およびB鎖のレコードが抗体(比較対象)、C鎖のレコードが抗原(表示対象)として分離される。
When the three-dimensional structure data 400 of the protein complex shown in FIG. 4 is input as input data, the three-dimensional structure data of the antibody and the three-dimensional structure data of the antigen are separated by the chain name. As a result, a three-dimensional structure data pair is acquired. The antibody and the antigen are separated by the chain name in the three-dimensional structure data 400 of the protein complex. In the three-dimensional structure data 400 of the protein complex shown in FIG. 4, the A chain and B chain records are separated as an antibody (comparison object), and the C chain record is separated as an antigen (display object).
図5-1は、抗体(比較対象)の3次元構造データを示す説明図であり、図5-2は、抗原(表示対象)の3次元構造データを示す説明図である。図5-1に示した抗体の3次元構造データ501は、図4のタンパク質複合体の3次元構造データ400のうちA鎖およびB鎖のデータであり、図5-2に示した抗原の3次元構造データ502は、図4のタンパク質複合体の3次元構造データ400のうちC鎖のデータである。
FIG. 5-1 is an explanatory diagram showing the three-dimensional structure data of the antibody (comparison target), and FIG. 5-2 is an explanatory diagram showing the three-dimensional structure data of the antigen (display target). The three-dimensional structure data 501 of the antibody shown in FIG. 5A is data of the A chain and the B chain in the three-dimensional structure data 400 of the protein complex of FIG. 4, and the antigen 3 shown in FIG. The dimensional structure data 502 is C chain data in the three-dimensional structure data 400 of the protein complex in FIG.
ここでは、タンパク質複合体の3次元構造データ400を抗体と抗原に分離することで、抗体と抗原の3次元構造データ対(501,502)を取得することとしたが、すでに分離済みの抗体と抗原の3次元構造データ対と位置関係データを取得することとしてもよい。また、タンパク質複合体に限らず、任意の2つのタンパク質の3次元構造データ対と位置関係データを取得することとしてもよい。
Here, the three-dimensional structure data 400 of the protein complex is separated into the antibody and the antigen to obtain the three-dimensional structure data pair (501, 502) of the antibody and the antigen. It is good also as acquiring the three-dimensional structure data pair and positional relationship data of an antigen. Moreover, it is good also as acquiring not only a protein complex but the three-dimensional structure data pair and positional relationship data of arbitrary two proteins.
抽出部302は、図1に示したように、表示対象(抗原)の表示面Sdを取得する機能を有する。具体的には、取得部301によって取得された表示対象により特定される表示対象の表面のうち、比較対象により特定される比較対象の表面から所定距離以内となる表面を表示対象の表示面Sdとして抽出する。本機能は、図1の(B)に示した機能であり、たとえば、表示対象である抗原の分子表面のうち、比較対象である抗体の分子表面から所定距離以内となる表面を、表示対象である抗原の表示面Sdとして切り出す。ここで、分子表面について説明する。
The extraction unit 302 has a function of acquiring the display surface Sd of the display target (antigen) as shown in FIG. Specifically, among the surfaces of the display target specified by the display target acquired by the acquisition unit 301, a surface within a predetermined distance from the surface of the comparison target specified by the comparison target is used as the display surface Sd of the display target. Extract. This function is the function shown in FIG. 1B. For example, a surface within a predetermined distance from the molecular surface of the antibody to be compared among the molecular surfaces of the antigen to be displayed is displayed as the display target. Cut out as a display surface Sd of a certain antigen. Here, the molecular surface will be described.
図6は、分子表面の特定を示す説明図である。分子表面Sは、たとえば、タンパク質内の原子がファンデルワールス半径を持つ剛体球であるとして、その外側を水分子(通常半径1.4[Å]の剛体球)と接する内接面として定義される。また、ファンデルワールス半径とは、原子ごとに定められた剛体球の半径で、各原子の電子雲の広がりを示す。ファンデルワールス半径は、一般に、低分子のX線結晶解析から得られる原子間の結合長や接触距離から推計される。分子表面Sは、既知の計算手法により特定可能であるため、その説明を省略する(たとえば、後述の非特許文献2に記載された計算方法により計算すればよい)。実施の形態1では、図5-1、図5-2に示した各3次元構造データ501,502の各レコードにより特定される原子や座標により、分子表面Sを構成するポリゴンの頂点座標が特定される。
FIG. 6 is an explanatory diagram showing the specification of the molecular surface. The molecular surface S is defined as, for example, an inscribed surface that contacts a water molecule (usually a hard sphere with a radius of 1.4 [Å]), assuming that the atoms in the protein are hard spheres with van der Waals radii. The The van der Waals radius is a radius of a hard sphere determined for each atom, and indicates the spread of the electron cloud of each atom. The van der Waals radius is generally estimated from the bond length and contact distance between atoms obtained from X-ray crystallographic analysis of low molecules. Since the molecular surface S can be specified by a known calculation method, the description thereof is omitted (for example, it may be calculated by a calculation method described in Non-Patent Document 2 described later). In the first embodiment, the vertex coordinates of polygons constituting the molecular surface S are specified by the atoms and coordinates specified by the respective records of the three- dimensional structure data 501 and 502 shown in FIGS. Is done.
図7-1は、比較対象である抗体の分子表面Sをあらわす分子表面構造データを示す説明図であり、図7-2は、表示対象である抗原の分子表面Sをあらわす分子表面構造データを示す説明図である。図7-1および図7-2において、分子表面構造データ701,702は、分子表面Sを構成するポリゴンの頂点ごとに、その頂点座標とその頂点における静電ポテンシャルをフィールド項目としてレコード化されている。なお、これらの図に記載した分子表面Sを構成するポリゴンの頂点の座標データは、下記非特許文献2に記載された計算方法により計算した結果である。
FIG. 7-1 is an explanatory diagram showing molecular surface structure data representing the molecular surface S of the antibody to be compared, and FIG. 7-2 shows molecular surface structure data representing the molecular surface S of the antigen to be displayed. It is explanatory drawing shown. In FIGS. 7-1 and 7-2, the molecular surface structure data 701 and 702 are recorded for each vertex of the polygon constituting the molecular surface S with the vertex coordinates and the electrostatic potential at the vertex as field items. Yes. Note that the coordinate data of the vertexes of the polygons constituting the molecular surface S shown in these figures are the results calculated by the calculation method described in Non-Patent Document 2 below.
・非特許文献2
Sanner,M.F.,Olson,A.J.,and Spehner,J.C.“Reduced surface:an efficient way to compute molecular surfaces.” Biopolymers,Vol.38(3):305-320(1996),P.1-28 ・Non-patent document 2
Sanner, M.M. F. Olson, A .; J. et al. , And Spehner, J .; C. “Reduced surface: an effective way to compute molecular surfaces.” Biopolymers, Vol. 38 (3): 305-320 (1996), P.M. 1-28
Sanner,M.F.,Olson,A.J.,and Spehner,J.C.“Reduced surface:an efficient way to compute molecular surfaces.” Biopolymers,Vol.38(3):305-320(1996),P.1-28 ・
Sanner, M.M. F. Olson, A .; J. et al. , And Spehner, J .; C. “Reduced surface: an effective way to compute molecular surfaces.” Biopolymers, Vol. 38 (3): 305-320 (1996), P.M. 1-28
静電ポテンシャルとは、タンパク質中で部分電荷を持つ各原子間のクーロンポテンシャルの和で表される電気的特性であり、抽出部302により計算される。静電ポテンシャルの計算手法も既知であるため、その説明を省略するが、たとえば、下記の2つの非特許文献3,4により計算すればよい。最近傍原子は、対応する頂点からの最近傍に位置する原子の識別番号である。最近傍原子をキーにすることで、図5-1および図5-2に示したレコードからその原子により構成されるアミノ酸残基を特定することができる。なお、実施の形態1では、表示対象の分子表面S上の静電ポテンシャルのみ計算すればよいが、図7-1では、実施の形態2で使用する比較対象の分子表面S上の静電ポテンシャルについても計算した結果を示してある。
The electrostatic potential is an electrical characteristic represented by the sum of Coulomb potentials between atoms having partial charges in the protein, and is calculated by the extraction unit 302. Since the calculation method of the electrostatic potential is also known, the description thereof is omitted. For example, the calculation may be performed according to the following two non-patent documents 3 and 4. The nearest atom is the identification number of the atom located closest to the corresponding vertex. By using the nearest atom as a key, the amino acid residue constituted by the atom can be specified from the records shown in FIGS. 5-1 and 5-2. In the first embodiment, only the electrostatic potential on the molecular surface S to be displayed needs to be calculated. In FIG. 7A, the electrostatic potential on the molecular surface S to be compared used in the second embodiment is calculated. The calculation results are also shown for.
・非特許文献3
Rocchia,W.;Neshich,G.“Electrostatic potential calculation for biomolecules-creating a database of pre-calculated values reported on a per residue basis for all PDB protein structures.” Genet.Mol.Res.,6(4):923-936(2007),P.923-936 ・Non-patent document 3
Rocchia, W.M. Neschich, G .; “Electrostatic potentiation for biomolecules-creating a database of pre-calculated values reported on a per resurrection basis for PD in G. Mol. Res. , 6 (4): 923-936 (2007), p. 923-936
Rocchia,W.;Neshich,G.“Electrostatic potential calculation for biomolecules-creating a database of pre-calculated values reported on a per residue basis for all PDB protein structures.” Genet.Mol.Res.,6(4):923-936(2007),P.923-936 ・
Rocchia, W.M. Neschich, G .; “Electrostatic potentiation for biomolecules-creating a database of pre-calculated values reported on a per resurrection basis for PD in G. Mol. Res. , 6 (4): 923-936 (2007), p. 923-936
・非特許文献4
B.Z.Lu,Y.C.Zhou,Michael J.Holst, and J.A.McCammon.“Recent progress in numerical methods for the Poisson-Boltzmann equation in biophysical applications.” Commun. in Comput. Phys.,Vol.3(5):973-1009(2008),P.973-1009 ・Non-patent document 4
B. Z. Lu, Y .; C. Zhou, Michael J .; Holst, and J.H. A. McCammon. “Recent progress in numeric methods for the Poisson-Boltzmann equation in biophysical applications.” Commun. in Compute. Phys. , Vol. 3 (5): 973-109 (2008), P.M. 973-1009
B.Z.Lu,Y.C.Zhou,Michael J.Holst, and J.A.McCammon.“Recent progress in numerical methods for the Poisson-Boltzmann equation in biophysical applications.” Commun. in Comput. Phys.,Vol.3(5):973-1009(2008),P.973-1009 ・
B. Z. Lu, Y .; C. Zhou, Michael J .; Holst, and J.H. A. McCammon. “Recent progress in numeric methods for the Poisson-Boltzmann equation in biophysical applications.” Commun. in Compute. Phys. , Vol. 3 (5): 973-109 (2008), P.M. 973-1009
抽出部302は、比較対象(抗体)と表示対象(抗原)の分子表面Sが分子表面構造データ701,702として特定されると、表示対象の分子表面構造データの各レコードの頂点座標に対して、比較対象の分子表面Sとの最短距離を算出する。具体的には、たとえば、表示対象の分子表面構造データ702から頂点座標を1つ選択し、比較対象の分子表面Sを構成するポリゴンの各頂点座標との距離を算出する。そして、算出された距離のうち最短距離のみを保存する。この処理を表示対象の分子表面構造データ702の全レコードについて実行する。
When the molecular surface S of the comparison target (antibody) and the display target (antigen) is specified as the molecular surface structure data 701 and 702, the extraction unit 302 determines the vertex coordinates of each record of the display target molecular surface structure data. The shortest distance from the molecular surface S to be compared is calculated. Specifically, for example, one vertex coordinate is selected from the molecular surface structure data 702 to be displayed, and the distance from each vertex coordinate of the polygon constituting the molecular surface S to be compared is calculated. Then, only the shortest distance among the calculated distances is stored. This process is executed for all records of the molecular surface structure data 702 to be displayed.
図8は、表示対象(抗原)の分子表面構造データ702の最短距離を保存した最短距離データを示す説明図である。図8に示した最短距離データ800では、図7-2に示した表示対象(抗原)の分子表面構造データに最短距離がフィールド項目として追加されている。抽出部302は、最短距離データ800の中から、最短距離が比較対象と結合可能な所定距離(たとえば、1.2[Å])以下となるレコードを抽出する。抽出されたレコード群により特定される部分的な分子表面Sが表示面Sdとして抽出されることとなる。
FIG. 8 is an explanatory diagram showing the shortest distance data storing the shortest distance of the molecular surface structure data 702 of the display target (antigen). In the shortest distance data 800 shown in FIG. 8, the shortest distance is added as a field item to the molecular surface structure data of the display target (antigen) shown in FIG. 7-2. The extraction unit 302 extracts, from the shortest distance data 800, a record whose shortest distance is equal to or less than a predetermined distance (eg, 1.2 [Å]) that can be combined with the comparison target. The partial molecular surface S specified by the extracted record group is extracted as the display surface Sd.
図9は、表示面構成データを示す説明図である。図9に示した表示面構成データ900は、図8に示した最短距離データ800のうち最短距離が所定距離(たとえば、1.2[Å])以下となるレコードの集合である。
FIG. 9 is an explanatory diagram showing display surface configuration data. The display surface configuration data 900 illustrated in FIG. 9 is a set of records in which the shortest distance is equal to or less than a predetermined distance (for example, 1.2 [Å]) in the shortest distance data 800 illustrated in FIG.
図3において、選択部303は、抽出部302によって抽出された表示対象の表示面Sdを構成する各頂点が有する特徴量に基づいて、頂点群の中から、着目すべき特徴を持つ点を、基準点として選択する機能を有する。ここで、表示面Sdを構成する各頂点が有する特徴量とは、上述した静電ポテンシャルのように頂点に与えられた特徴情報である。
In FIG. 3, the selection unit 303 selects a point having a feature to be noticed from among a group of vertices based on the feature amount of each vertex constituting the display surface Sd to be displayed extracted by the extraction unit 302. It has a function to select as a reference point. Here, the feature amount of each vertex constituting the display surface Sd is feature information given to the vertex as in the electrostatic potential described above.
以降、静電ポテンシャルの絶対値が最大である頂点を基準点として選択する場合を例に説明するが、静電ポテンシャルの絶対値が上位n番目までの大きさの頂点を抽出して表示画面Dに表示させ、上位n番目までの大きさの頂点の中からユーザ操作により選択させることとしてもよい。また、選択された基準点候補の最近傍にある非共有結合の形成に関わる可能性のある残基(たとえば、極性のあるアミノ酸残基)または原子(たとえば、窒素や酸素)が同一の候補は、絶対値が最大のもののみを残して削除することとしてもよい。
Hereinafter, a case where the vertex having the maximum electrostatic potential absolute value is selected as a reference point will be described as an example. However, the vertex n having the largest electrostatic potential absolute value is extracted and displayed on the display screen D. And may be selected by user operation from the vertices having the top n sizes. In addition, candidates with the same residues (for example, polar amino acid residues) or atoms (for example, nitrogen and oxygen) that may be involved in the formation of non-covalent bonds in the vicinity of the selected reference point candidates are It is also possible to delete only the largest absolute value.
図10は、静電ポテンシャルの降順にソートした最近傍残基を示すテーブルである。図10では、図9に示した表示面構成データ900において、静電ポテンシャルの降順にソートしている。選択部303では、図10に示したテーブルを参照して基準点を選択することができる。
FIG. 10 is a table showing the nearest residues sorted in descending order of electrostatic potential. 10, the display surface configuration data 900 shown in FIG. 9 is sorted in descending order of electrostatic potential. The selection unit 303 can select a reference point with reference to the table shown in FIG.
生成部304は、選択部303によって選択された基準点の法線を生成する機能を有する。具体的には、基準点の頂点法線ベクトルを求める。たとえば、まず、基準点を頂点とする各ポリゴンの面法線ベクトルを求める。そして、各面法線ベクトルを足し合わせて正規化する。これにより、基準点の頂点法線ベクトルが生成されることとなる。
The generation unit 304 has a function of generating a normal line of the reference point selected by the selection unit 303. Specifically, the vertex normal vector of the reference point is obtained. For example, first, a surface normal vector of each polygon having a reference point as a vertex is obtained. Each surface normal vector is added and normalized. Thereby, the vertex normal vector of the reference point is generated.
図11は、基準点近傍の表示面Sdにおける面法線ベクトルを示す平面図である。図11中、3角形の図形は表示面Sdを構成するポリゴンであり、丸図形はポリゴンの頂点である。特に、黒丸が基準点である。ポリゴン上の矢印はポリゴンの面法線ベクトルである。
FIG. 11 is a plan view showing a surface normal vector on the display surface Sd near the reference point. In FIG. 11, a triangular figure is a polygon constituting the display surface Sd, and a round figure is a vertex of the polygon. In particular, the black circle is the reference point. The arrow on the polygon is the surface normal vector of the polygon.
図12は、基準点近傍の表示面Sdにおける頂点法線ベクトルを示す平面図である。図11に示した各面法線ベクトルを足し合わせて正規化することで、基準点の頂点法線ベクトルが得られる。図12中、点線矢印が基準点の頂点法線ベクトルである。
FIG. 12 is a plan view showing a vertex normal vector on the display surface Sd in the vicinity of the reference point. The vertex normal vectors of the reference points are obtained by adding and normalizing the surface normal vectors shown in FIG. In FIG. 12, the dotted line arrow is the vertex normal vector of the reference point.
設定部305は、生成部304によって生成された基準点の法線を反視線方向に方向転換させる回転軸を設定する機能を有する。具体的には、基準点の頂点法線ベクトルと反視線方向のベクトルとの外積ベクトルに並行な線を回転軸に設定する。より具体的には、回転軸は、タンパク質の重心または基準点、その他特定の点を通過することとする。空間上のいずれの点を通過させるかは、初期設定によりおこなえばよい。
The setting unit 305 has a function of setting a rotation axis that changes the normal of the reference point generated by the generation unit 304 in the anti-gaze direction. Specifically, a line parallel to the outer product vector of the vertex normal vector of the reference point and the vector in the anti-gaze direction is set as the rotation axis. More specifically, the rotation axis passes through the center of gravity or reference point of the protein or other specific point. Which point on the space is allowed to pass may be determined by initial setting.
回転角算出部306は、生成部304によって生成された基準点の法線を反視線方向に方向転換させる回転角を算出する機能を有する。具体的には、基準点の頂点法線ベクトルと反視線方向のベクトルとの内積を求めることにより、頂点法線ベクトルと反視線方向のベクトルとのなす角を回転角として求めることができる。
The rotation angle calculation unit 306 has a function of calculating a rotation angle that changes the normal of the reference point generated by the generation unit 304 in the anti-sight line direction. Specifically, by obtaining the inner product of the vertex normal vector of the reference point and the vector in the anti-gaze direction, the angle formed by the vertex normal vector and the vector in the anti-gaze direction can be obtained as the rotation angle.
変換部307は、表示対象の表示面Sdを構成する各頂点の座標値を、回転角算出部306によって算出された回転角により基準点の法線が反視線方向に方向転換されたときの座標値に変換する機能を有する。具体的には、たとえば、表示面Sdを構成するポリゴンの各頂点の座標値を、回転軸回りに回転角分回転させる回転行列により、座標変換する。この座標変換は、表示面Sdを構成するポリゴンの各頂点のほか、分子表面Sのポリゴンを構成する各頂点や、分子表面Sの生成元となる分子表面Sからの最近傍の原子の座標値についても実行してもよい。
The conversion unit 307 converts the coordinate value of each vertex constituting the display surface Sd to be displayed into the coordinate when the normal of the reference point is changed in the anti-gaze direction by the rotation angle calculated by the rotation angle calculation unit 306. Has the function of converting to a value. Specifically, for example, coordinate conversion is performed on a coordinate value of each vertex of the polygon constituting the display surface Sd by a rotation matrix that rotates the rotation angle about the rotation axis. In this coordinate transformation, the coordinate values of the vertices of the polygon constituting the display surface Sd, the vertices constituting the polygon of the molecular surface S, and the nearest atom from the molecular surface S from which the molecular surface S is generated. May also be executed.
描画部308は、変換部307による変換後における視線方向からの表示対象の表示面Sdを、特徴量に基づいて表示画面Dに描画する機能を有する。具体的には、たとえば、変換後における表示面Sdを構成するポリゴンを描画する。ポリゴンの面には、静電ポテンシャルに応じた色を描画する。表示面Sd以外の分子表面Sには着色をする必要はない(または、黒/白一色とする)。また、表示対象の輪郭は描画してもよい。描画部308では、たとえば、表示面Sdの構造データおよび着色データを不図示の描画デバイスに渡し、描画デバイスがVRAM(ビデオRAM)に書き込むことで、表示画面Dに回転処理後の表示面Sdおよびその静電ポテンシャルを表示することとなる。
The drawing unit 308 has a function of drawing the display surface Sd to be displayed from the line-of-sight direction after the conversion by the conversion unit 307 on the display screen D based on the feature amount. Specifically, for example, a polygon that forms the converted display surface Sd is drawn. A color corresponding to the electrostatic potential is drawn on the surface of the polygon. It is not necessary to color the molecular surface S other than the display surface Sd (or black / white). Further, the outline of the display target may be drawn. In the drawing unit 308, for example, the structure data and coloring data of the display surface Sd are passed to a drawing device (not shown), and the drawing device writes the data to a VRAM (video RAM), whereby the display surface Sd after the rotation processing is displayed on the display screen D The electrostatic potential is displayed.
図13-1は、表示対象に設定された回転角および回転軸を示す説明図である。図13-1では、便宜上、表示対象を球体として表現している。図13-1では、視点座標を原点Oとする3次元の視点座標系を用いている。X軸およびY軸に直交するZ軸について、視点座標から表示対象を見た方向は、視点座標からの視線方向となり、その逆方向は反視線方向となる。また、表示対象はZ軸上の点を重心Wとして配置されている。なお、x軸はX軸に平行な軸であり、y軸はY軸に平行な軸である。
FIG. 13-1 is an explanatory diagram showing a rotation angle and a rotation axis set as a display target. In FIG. 13A, for the sake of convenience, the display target is expressed as a sphere. In FIG. 13A, a three-dimensional viewpoint coordinate system having the viewpoint coordinates as the origin O is used. With respect to the Z axis orthogonal to the X axis and the Y axis, the direction in which the display target is viewed from the viewpoint coordinates is the line-of-sight direction from the viewpoint coordinates, and the opposite direction is the counter-gaze direction. Further, the display object is arranged with the center of gravity W as a point on the Z axis. The x axis is an axis parallel to the X axis, and the y axis is an axis parallel to the Y axis.
図13-1中、表示面Sd上の基準点Pからの頂点法線ベクトルnと反視線方向のベクトルnzとのなす回転角をθとし、頂点法線ベクトルnと反視線方向のベクトルnzを含む平面に直交する線を回転軸Arとする。回転軸Ar1は表示対象の重心Wを通り平面に直交する軸となる。また、回転軸Ar2は基準点Pを通り平面に直交する軸となる。回転軸Arまわりに回転角θ分表示面Sdを、頂点法線ベクトルnが反視線方向のベクトルnzと同方向に向くように回転させることで、視線方向からの表示面Sdが表示画面Dに表示される。
In FIG. 13A, the rotation angle between the vertex normal vector n from the reference point P on the display surface Sd and the vector nz in the anti-gaze direction is θ, and the vertex normal vector n and the vector nz in the anti-gaze direction are A line perpendicular to the plane to be included is defined as a rotation axis Ar. The rotation axis Ar1 is an axis that passes through the center of gravity W of the display target and is orthogonal to the plane. The rotation axis Ar2 is an axis that passes through the reference point P and is orthogonal to the plane. The display surface Sd from the sight line direction is displayed on the display screen D by rotating the display surface Sd by the rotation angle θ around the rotation axis Ar so that the vertex normal vector n is oriented in the same direction as the vector nz in the anti-gaze direction. Is displayed.
また、描画部308では、上述したように表示面Sdを構成する頂点について描画しているが、表示面Sdに代えて、表示面Sdを構成する頂点の最近傍原子を描画することとしてもよい。具体的には、たとえば、最近傍の原子は、図9に示した表示面構成データ900の最近傍原子項目により特定できる。これにより、最近傍原子により構成されるアミノ酸残基も特定できるため、最近傍アミノ酸残基を描画することができる。
In the drawing unit 308, as described above, the vertices constituting the display surface Sd are drawn. However, instead of the display surface Sd, the nearest atoms of the vertices constituting the display surface Sd may be drawn. . Specifically, for example, the nearest atom can be specified by the nearest atom item in the display surface configuration data 900 shown in FIG. Thereby, since the amino acid residue comprised by the nearest atom can also be specified, the nearest amino acid residue can be drawn.
図13-2は、実施の形態1にかかる回転表示後の表示画面例を示す説明図である。図13-2においては、一方のタンパク質である抗原の表示面構成データ900に関する3次元デモル1302が実施の形態1で示した処理により回転表示されており、図10に示した候補番号1の基準点Pも表示されている。
FIG. 13-2 is an explanatory diagram of a display screen example after the rotation display according to the first embodiment. In FIG. 13-2, the three-dimensional demole 1302 related to the display surface configuration data 900 of the antigen that is one of the proteins is rotated and displayed by the processing shown in Embodiment 1, and the reference of candidate number 1 shown in FIG. Point P is also displayed.
(情報表示装置による情報表示処理手順)
図14は、実施の形態1にかかる情報表示装置による情報表示処理手順を示すフローチャートである。まず、取得部301により、3次元構造データ対となるタンパク質複合体の3次元構造データ400を取得する(ステップS1401)。取得されたタンパク質複合体の3次元構造データ400は表示対象の3次元構造データと比較対象の3次元構造データとに分離される。 (Information display processing procedure by the information display device)
FIG. 14 is a flowchart of an information display processing procedure performed by the information display apparatus according to the first embodiment. First, theacquisition unit 301 acquires the three-dimensional structure data 400 of the protein complex that forms the three-dimensional structure data pair (step S1401). The acquired three-dimensional structure data 400 of the protein complex is separated into three-dimensional structure data to be displayed and three-dimensional structure data to be compared.
図14は、実施の形態1にかかる情報表示装置による情報表示処理手順を示すフローチャートである。まず、取得部301により、3次元構造データ対となるタンパク質複合体の3次元構造データ400を取得する(ステップS1401)。取得されたタンパク質複合体の3次元構造データ400は表示対象の3次元構造データと比較対象の3次元構造データとに分離される。 (Information display processing procedure by the information display device)
FIG. 14 is a flowchart of an information display processing procedure performed by the information display apparatus according to the first embodiment. First, the
そして、分離された表示対象の3次元構造データと比較対象の3次元構造データについて、分子表面Sを算出する(ステップS1402)。分子表面Sを算出すると、表示対象の分子表面Sと比較対象の分子表面Sについて、表示面抽出処理(ステップS1403)を実行する。これにより、表示対象の分子表面Sから表示面Sdが切り出されることとなる。このあと、切り出された表示面Sdについて、表示面回転表示処理(ステップS1404)を実行する。これにより、ユーザが視認し易い方向から見た表示面Sdを表示することができる。
Then, the molecular surface S is calculated for the separated 3D structure data to be displayed and 3D structure data to be compared (step S1402). When the molecular surface S is calculated, the display surface extraction process (step S1403) is executed for the molecular surface S to be displayed and the molecular surface S to be compared. As a result, the display surface Sd is cut out from the molecular surface S to be displayed. Thereafter, the display surface rotation display process (step S1404) is executed for the cut out display surface Sd. Thereby, it is possible to display the display surface Sd viewed from a direction that is easy for the user to visually recognize.
図15は、図14に示した表示面抽出処理(ステップS1403)の詳細な処理手順を示すフローチャートである。まず、表示対象の分子表面Sについて静電ポテンシャルを計算し(ステップS1501)、表示対象の分子表面Sを構成するポリゴンの頂点群のうち未処理の頂点があるか否かを判断する(ステップS1502)。
FIG. 15 is a flowchart showing a detailed processing procedure of the display surface extraction process (step S1403) shown in FIG. First, the electrostatic potential is calculated for the molecular surface S to be displayed (step S1501), and it is determined whether or not there are unprocessed vertices among the vertex groups of the polygons constituting the molecular surface S to be displayed (step S1502). ).
未処理の頂点がある場合(ステップS1502:Yes)、未処理の頂点を1つ選択する(ステップS1503)。そして、比較対象の分子表面Sを構成するポリゴンの各頂点から選択頂点までの距離を計算し、そのうち最も短い距離を最短距離とする(ステップS1504)。このあと、最短距離がしきい値以内か否かを判断する(ステップS1505)。
If there is an unprocessed vertex (step S1502: Yes), one unprocessed vertex is selected (step S1503). Then, the distance from each vertex of the polygon constituting the molecular surface S to be compared to the selected vertex is calculated, and the shortest distance is set as the shortest distance (step S1504). Thereafter, it is determined whether or not the shortest distance is within a threshold value (step S1505).
しきい値以内である場合(ステップS1505:Yes)、選択頂点を表示面構成データとして保存して(ステップS1506)、ステップS1502に移行する。一方、しきい値以内でない場合(ステップS1505:No)、ステップS1502に移行する。ステップS1502において、未処理の頂点がない場合(ステップS1502:No)、表示面回転表示処理(ステップS1404)に移行する。
If it is within the threshold (step S1505: Yes), the selected vertex is stored as display surface configuration data (step S1506), and the process proceeds to step S1502. On the other hand, when it is not within the threshold value (step S1505: No), the process proceeds to step S1502. If there is no unprocessed vertex in step S1502 (step S1502: No), the process proceeds to display surface rotation display processing (step S1404).
図16は、図14に示した表示面回転表示処理(ステップS1404)の詳細な処理手順を示すフローチャートである。まず、選択部303により基準点Pを選択し(ステップS1601)、選択された基準点Pの頂点法線ベクトルを生成部304により生成する(ステップS1602)。そして、設定部305により回転軸を設定し(ステップS1603)、回転角算出部306により、頂点法線ベクトルを反視線方向のベクトルに向けさせるための回転角を算出する(ステップS1604)。
FIG. 16 is a flowchart showing a detailed processing procedure of the display surface rotation display process (step S1404) shown in FIG. First, the reference point P is selected by the selection unit 303 (step S1601), and the vertex normal vector of the selected reference point P is generated by the generation unit 304 (step S1602). Then, the setting unit 305 sets a rotation axis (step S1603), and the rotation angle calculation unit 306 calculates a rotation angle for directing the vertex normal vector to a vector in the anti-gaze direction (step S1604).
このあと、変換部307により、表示面構成データ内の頂点の座標値を、回転軸回りに回転角分頂点法線ベクトルを回転させた場合の座標値に変換する(ステップS1605)。そして、描画部308により変換後の表示面Sdおよびその静電ポテンシャルの色を描画する(ステップS1606)。これにより、ユーザが視認し易い方向から見た表示面Sdが表示されることとなる。
Thereafter, the conversion unit 307 converts the vertex coordinate value in the display surface configuration data into the coordinate value when the vertex normal vector is rotated by the rotation angle around the rotation axis (step S1605). The drawing unit 308 draws the converted display surface Sd and the color of the electrostatic potential (step S1606). As a result, the display surface Sd viewed from the direction in which the user can easily recognize is displayed.
このように、実施の形態1では、表示面Sdの切り出し(抽出)により、結合に関与する可能性のある分子表面S(表示面Sd)のみが選択的に表示される。したがって、強い静電ポテンシャルを帯びているが、結合先との位置関係で相互作用に関わる可能性のない部分を、結合部位と誤認識する危険性を低減することができる。
Thus, in the first embodiment, only the molecular surface S (display surface Sd) that may be involved in binding is selectively displayed by cutting out (extracting) the display surface Sd. Therefore, it is possible to reduce the risk of erroneously recognizing a portion that has a strong electrostatic potential but has no possibility of interaction in the positional relationship with the binding destination as a binding site.
また、着目すべき電気特性を持つ分子表面Sの部分(基準点Pの近傍の表示面Sd)の電気的特性が、自動的にユーザの視線に正対する向きで描画される。したがって、タンパク質結合に強く関わる可能性が高い分子表面Sの部分の電気的特性を容易に観察することができる。
Further, the electrical characteristics of the portion of the molecular surface S having the electrical characteristics to be noted (display surface Sd in the vicinity of the reference point P) are automatically drawn in a direction facing the user's line of sight. Therefore, it is possible to easily observe the electrical characteristics of the portion of the molecular surface S that is highly likely to be strongly involved in protein binding.
<実施の形態2>
つぎに、実施の形態2について説明する。実施の形態1では、一方のタンパク質を表示対象、他方のタンパク質を比較対象とし、表示対象の分子表面Sから表示面Sdを切り出して、表示面Sdを回転表示させる構成について説明した。これに対し、実施の形態2では、さらに、実施の形態1の他方のタンパク質を表示対象、実施の形態1の一方のタンパク質を比較対象とし、表示対象の分子表面Sから表示面Sdを切り出して、表示面Sdを回転表示させる。そして、それぞれのタンパク質の表示面Sdを構成する各頂点の特徴量に基づいて選択した基準点の間の距離を計算して、回転表示後の各表示面Sdとともに表示させる。なお、実施の形態1と同一箇所には同一符号を付し、その説明を省略する。 <Embodiment 2>
Next, a second embodiment will be described. In the first embodiment, the configuration in which one protein is a display target and the other protein is a comparison target, the display surface Sd is cut out from the molecular surface S to be displayed, and the display surface Sd is rotated and displayed has been described. On the other hand, in the second embodiment, the display surface Sd is cut out from the molecular surface S to be displayed with the other protein of the first embodiment as a display target and the one protein of the first embodiment as a comparison target. The display surface Sd is rotated and displayed. Then, the distance between the selected reference points is calculated based on the feature amount of each vertex constituting the display surface Sd of each protein, and is displayed together with each display surface Sd after the rotation display. In addition, the same code | symbol is attached | subjected to the same location asEmbodiment 1, and the description is abbreviate | omitted.
つぎに、実施の形態2について説明する。実施の形態1では、一方のタンパク質を表示対象、他方のタンパク質を比較対象とし、表示対象の分子表面Sから表示面Sdを切り出して、表示面Sdを回転表示させる構成について説明した。これに対し、実施の形態2では、さらに、実施の形態1の他方のタンパク質を表示対象、実施の形態1の一方のタンパク質を比較対象とし、表示対象の分子表面Sから表示面Sdを切り出して、表示面Sdを回転表示させる。そして、それぞれのタンパク質の表示面Sdを構成する各頂点の特徴量に基づいて選択した基準点の間の距離を計算して、回転表示後の各表示面Sdとともに表示させる。なお、実施の形態1と同一箇所には同一符号を付し、その説明を省略する。 <
Next, a second embodiment will be described. In the first embodiment, the configuration in which one protein is a display target and the other protein is a comparison target, the display surface Sd is cut out from the molecular surface S to be displayed, and the display surface Sd is rotated and displayed has been described. On the other hand, in the second embodiment, the display surface Sd is cut out from the molecular surface S to be displayed with the other protein of the first embodiment as a display target and the one protein of the first embodiment as a comparison target. The display surface Sd is rotated and displayed. Then, the distance between the selected reference points is calculated based on the feature amount of each vertex constituting the display surface Sd of each protein, and is displayed together with each display surface Sd after the rotation display. In addition, the same code | symbol is attached | subjected to the same location as
(情報表示装置の機能的構成)
図17は、実施の形態2にかかる情報表示装置の機能的構成を示すブロック図である。実施の形態2では、実施の形態1で示した機能に、さらに指定部1701と距離算出部1702とを追加した構成である。指定部1701および距離算出部1702も、具体的には、たとえば、図2に示したROM202、RAM203、磁気ディスク205、光ディスク207などの記憶装置に記憶されたプログラムをCPU201に実行させることにより、または、I/F209により、その機能を実現する。 (Functional configuration of information display device)
FIG. 17 is a block diagram of a functional configuration of the information display apparatus according to the second embodiment. In the second embodiment, adesignation unit 1701 and a distance calculation unit 1702 are further added to the functions shown in the first embodiment. Specifically, the specification unit 1701 and the distance calculation unit 1702 also have the CPU 201 execute a program stored in a storage device such as the ROM 202, the RAM 203, the magnetic disk 205, and the optical disk 207 shown in FIG. The function is realized by the I / F 209.
図17は、実施の形態2にかかる情報表示装置の機能的構成を示すブロック図である。実施の形態2では、実施の形態1で示した機能に、さらに指定部1701と距離算出部1702とを追加した構成である。指定部1701および距離算出部1702も、具体的には、たとえば、図2に示したROM202、RAM203、磁気ディスク205、光ディスク207などの記憶装置に記憶されたプログラムをCPU201に実行させることにより、または、I/F209により、その機能を実現する。 (Functional configuration of information display device)
FIG. 17 is a block diagram of a functional configuration of the information display apparatus according to the second embodiment. In the second embodiment, a
指定部1701は、任意の3次元構造データ対のうち一方(たとえば抗原)の3次元構造データを表示対象、他方(たとえば抗体)の3次元構造データを比較対象に指定する第1の指定をおこなう機能を有する。また、第1の指定とは逆に、第1の指定における比較対象(抗体)の3次元構造データを表示対象、他方(抗原)の3次元構造データを比較対象に指定する第2の指定をおこなう機能を有する。
The designation unit 1701 performs a first designation for designating one (for example, antigen) three-dimensional structure data as an object to be displayed and an other (for example, antibody) three-dimensional structure data as a comparison target in an arbitrary three-dimensional structure data pair. It has a function. In contrast to the first designation, the second designation that designates the three-dimensional structure data of the comparison target (antibody) in the first designation as the display target and the other (antigen) three-dimensional structure data as the comparison target. Has a function to perform.
具体的には、たとえば、取得部301で取得した3次元構造データ対について、抗原を表示対象とする第1の指定に基づいて、抽出部302から描画部308までの一連の処理を実行するとともに、抗体を表示対象とする第2の指定に基づいて、抽出部302から描画部308までの一連の処理を実行する。
Specifically, for example, for the three-dimensional structure data pair acquired by the acquisition unit 301, a series of processing from the extraction unit 302 to the drawing unit 308 is executed based on the first designation for displaying the antigen. A series of processes from the extraction unit 302 to the drawing unit 308 is executed based on the second designation for displaying the antibody.
ここで、抽出部302は、第1の指定または第2の指定がなされると、指定により表示対象と比較対象を決定/変更してから、実施の形態1で説明した処理を実行する。これにより、一方の3次元構造データを表示対象とした場合の表示面Sdをユーザの視認し易い方向から描画できるとともに、他方の3次元構造データを表示対象とした場合の表示面Sdをユーザの視認し易い方向から描画できる。
Here, when the first designation or the second designation is made, the extraction unit 302 determines / changes the display target and the comparison target according to the designation, and then executes the processing described in the first embodiment. As a result, the display surface Sd when one of the three-dimensional structure data is a display target can be drawn from a direction that is easily visible to the user, and the display surface Sd when the other three-dimensional structure data is the display target is displayed by the user. It is possible to draw from a direction that is easily visible.
また、距離算出部1702は、第1の指定について選択部303によって選択された基準点Pと、第2の指定について選択部303によって選択された基準点Pとの基準点間距離を算出する機能を有する。具体的には、たとえば、抗原を表示対象とする第1の指定で得られた基準点Pの座標値を(x1,y1,z1)とし、抗体を表示対象とする第2の指定で得られた基準点Pの座標値を(x2,y2,z2)とすると、下記式(1)により基準点間距離dを算出することができる。
The distance calculation unit 1702 also calculates a distance between the reference points between the reference point P selected by the selection unit 303 for the first designation and the reference point P selected by the selection unit 303 for the second designation. Have Specifically, for example, the coordinate value of the reference point P obtained by the first designation for displaying the antigen is (x1, y1, z1) and obtained by the second designation for displaying the antibody. If the coordinate value of the reference point P is (x2, y2, z2), the distance d between reference points can be calculated by the following equation (1).
d=√{(x2-x1)2+(y2-y1)2+(z2-z1)2}・・・(1)
D = √ {(x2−x1) 2+ (y2−y1) 2+ (z2−z1) 2} (1)
描画部308では、回転表示後の表示面Sdについて、基準点Pどうしを結ぶ線を描画するとともに、基準点間距離dの値も描画する。
The drawing unit 308 draws a line connecting the reference points P on the display surface Sd after the rotation display, and also draws the value of the distance d between the reference points.
図18は、実施の形態2にかかる回転表示後のタンパク質の3次元形状モデル例を示す説明図である。図18においては、一方のタンパク質(抗体)の3次元形状モデル1801と他方のタンパク質(抗原)の3次元形状モデル1802とが実施の形態1で示した処理により回転表示されており、それぞれの基準点P1,P2を結ぶ線と基準点間距離dも表示されている。
FIG. 18 is an explanatory diagram of an example of a three-dimensional shape model of a protein after rotation display according to the second embodiment. In FIG. 18, the three-dimensional shape model 1801 of one protein (antibody) and the three-dimensional shape model 1802 of the other protein (antigen) are rotated and displayed by the processing shown in the first embodiment, and the respective standards are displayed. A line connecting the points P1 and P2 and the distance d between the reference points are also displayed.
(情報表示装置による情報表示処理手順)
図19は、実施の形態2にかかる情報表示装置による情報表示処理手順を示すフローチャートである。 (Information display processing procedure by the information display device)
FIG. 19 is a flowchart of an information display processing procedure performed by the information display apparatus according to the second embodiment.
図19は、実施の形態2にかかる情報表示装置による情報表示処理手順を示すフローチャートである。 (Information display processing procedure by the information display device)
FIG. 19 is a flowchart of an information display processing procedure performed by the information display apparatus according to the second embodiment.
まず、取得部301により3次元構造データ対を取得して(ステップS1901)、指定部1701により第1の指定処理を実行する(ステップS1902)。ここでは、たとえば、抗原の3次元構造データを表示対象、他方(抗体)の3次元構造データを比較対象とする。このあと、第1の指定の表示対象および比較対象について、表示面抽出処理(ステップS1903)および表示面回転表示処理(ステップS1904)を実行する。
First, the acquisition unit 301 acquires a three-dimensional structure data pair (step S1901), and the specification unit 1701 executes a first specification process (step S1902). Here, for example, the three-dimensional structure data of the antigen is to be displayed, and the other (antibody) three-dimensional structure data is to be compared. Thereafter, display surface extraction processing (step S1903) and display surface rotation display processing (step S1904) are executed for the first designated display target and comparison target.
表示面抽出処理(ステップS1903)は、図14および図15に示した表示面抽出処理(ステップS1403)と同じ処理であり、表示面回転表示処理(ステップS1904)は、図14および図16に示した表示面回転表示処理(ステップS1404)と同じ処理である。
The display surface extraction process (step S1903) is the same as the display surface extraction process (step S1403) shown in FIGS. 14 and 15, and the display surface rotation display process (step S1904) is shown in FIGS. This is the same processing as the display surface rotation display processing (step S1404).
そして、第2の指定が終了しているか否かを判断する(ステップS1905)。終了していない場合(ステップS1905:No)、指定部1701により、表示対象・比較対象を第1の指定とは逆に指定する第2の指定処理を実行する(ステップS1906)。ここでは、たとえば、第1の指定で比較対象であった抗体の3次元構造データを表示対象、もう一方(抗原)の3次元構造データを比較対象とする。このあと、第2の指定の表示対象および比較対象について、表示面抽出処理(ステップS1903)および表示面回転表示処理(ステップS1904)を実行する。
Then, it is determined whether or not the second designation has been completed (step S1905). If not completed (step S1905: No), the designation unit 1701 executes a second designation process for designating the display target / comparison target as opposed to the first designation (step S1906). Here, for example, the three-dimensional structure data of the antibody that was the comparison target in the first designation is the display target, and the other (antigen) three-dimensional structure data is the comparison target. Thereafter, display surface extraction processing (step S1903) and display surface rotation display processing (step S1904) are executed for the second designated display target and comparison target.
ステップS1905において、第2の指定が終了した場合(ステップS1905:Yes)、距離算出部1702により基準点間距離を算出する(ステップS1907)。そして、描画部308により距離情報(基準点間距離dの値や基準点P1,P2を結ぶ矢印)を表示する(ステップS1908)。
In step S1905, when the second designation is completed (step S1905: Yes), the distance calculation unit 1702 calculates the distance between the reference points (step S1907). Then, the drawing unit 308 displays distance information (the value of the distance d between the reference points and the arrow connecting the reference points P1 and P2) (step S1908).
このように、実施の形態2によれば、近接する構成タンパク質について、相互作用に関わる可能性が高い分子表面Sの部分(それぞれの基準点Pの近傍)を対置し、かつ、その間の距離を添えて表示することができる。したがって、ユーザは、非共有結合性の相互作用が形成されている可能性が高いかを容易に判断することができる。
As described above, according to the second embodiment, with respect to adjacent constituent proteins, the parts of the molecular surface S that are highly likely to be involved in the interaction (near the respective reference points P) are opposed to each other, and the distance therebetween is set. Attached can be displayed. Therefore, the user can easily determine whether or not a non-covalent interaction is likely to be formed.
<実施の形態3>
つぎに、実施の形態3について説明する。実施の形態3では、表示対象が共通する複数の3次元構造データ対を用意し、1つを基準3次元構造データ対とし、残余を比較3次元構造データ対とする。そして、基準3次元構造データ対の表示対象(以下、「基準表示対象」)および比較3次元構造データ対の表示対象(以下、「比較表示対象」)の電気的特性が施された各表示面Sdを、ほぼ同方向からの透視図となるように一堂に表示させる。さらに、基準3次元構造データ対の表示対象に連動して比較3次元構造データ対の表示対象を回転表示させる。 <Embodiment 3>
Next, a third embodiment will be described. In the third embodiment, a plurality of three-dimensional structure data pairs having a common display target are prepared, one being a reference three-dimensional structure data pair and the remaining being a comparison three-dimensional structure data pair. Each display surface on which the electrical characteristics of the display object of the reference 3D structure data pair (hereinafter referred to as “reference display object”) and the display object of the comparison 3D structure data pair (hereinafter referred to as “comparison display object”) are applied. Sd is displayed in one place so as to be a perspective view from substantially the same direction. Further, the display object of the comparison three-dimensional structure data pair is rotated and displayed in conjunction with the display object of the reference three-dimensional structure data pair.
つぎに、実施の形態3について説明する。実施の形態3では、表示対象が共通する複数の3次元構造データ対を用意し、1つを基準3次元構造データ対とし、残余を比較3次元構造データ対とする。そして、基準3次元構造データ対の表示対象(以下、「基準表示対象」)および比較3次元構造データ対の表示対象(以下、「比較表示対象」)の電気的特性が施された各表示面Sdを、ほぼ同方向からの透視図となるように一堂に表示させる。さらに、基準3次元構造データ対の表示対象に連動して比較3次元構造データ対の表示対象を回転表示させる。 <
Next, a third embodiment will be described. In the third embodiment, a plurality of three-dimensional structure data pairs having a common display target are prepared, one being a reference three-dimensional structure data pair and the remaining being a comparison three-dimensional structure data pair. Each display surface on which the electrical characteristics of the display object of the reference 3D structure data pair (hereinafter referred to as “reference display object”) and the display object of the comparison 3D structure data pair (hereinafter referred to as “comparison display object”) are applied. Sd is displayed in one place so as to be a perspective view from substantially the same direction. Further, the display object of the comparison three-dimensional structure data pair is rotated and displayed in conjunction with the display object of the reference three-dimensional structure data pair.
この実施の形態は、たとえば、ある抗体に結合する野生種の抗原に関し、その抗体との結合性がさらに強い変異体抗原を見出す場合に、有用である。すなわち、このような場合、それぞれの抗原が抗体のどの部位に結合するかが、作用の強さを推測する大きな手がかりとなるが、抗体を表示対象として、本実施の形態を適用することで、抗原の違いに由来する結合部位の変化や、抗体の重要な部分構造に強く結合する可能性の高い抗原の特定などが容易になる。
This embodiment is useful, for example, for finding a mutant antigen that has a stronger binding property to an antibody with respect to a wild-type antigen that binds to the antibody. That is, in such a case, to which part of the antibody each antigen binds is a big clue to guess the strength of the action, but by applying this embodiment with the antibody as a display target, This makes it easy to change the binding site derived from the difference in antigen, and to identify an antigen that is highly likely to bind strongly to an important partial structure of an antibody.
以下、この場合を例に、実施の形態をより詳細に説明する。具体的には、抗体タンパク質および野生種の抗原タンパク質を有するタンパク質複合体の3次元構造データ400を「基準3次元構造データ対」とし、同一種の抗体タンパク質および変異体抗原タンパク質を有するタンパク質複合体の3次元構造データ400を、「比較3次元構造データ対」とする例で説明する。
Hereinafter, the embodiment will be described in more detail by taking this case as an example. Specifically, the protein complex having the antibody protein and the mutant antigen protein of the same species, with the three-dimensional structure data 400 of the protein complex having the antibody protein and the wild-type antigen protein as a “reference three-dimensional structure data pair” The three-dimensional structure data 400 will be described as an example of “comparative three-dimensional structure data pair”.
なお、これらの3次元構造データ対における抗体タンパク質は、基本的に同一のタンパク質であるが、一般に、同一種のタンパク質でも完全にアミノ酸配列が一致するとは限らないことから、以降の説明では、各抗体タンパク質も、部分的にアミノ酸配列が異なっていることを想定している。具体的には、後述の判定部2101と探索部2102で、基準表示対象と比較表示対象のアミノ酸配列の共通部(位置合わせ用部分鎖)を求め、共通部に対応する部分構造が重なるように比較表示対象の配置位置を計算していることが、この想定に由来する。
The antibody proteins in these three-dimensional structure data pairs are basically the same protein, but in general, the amino acid sequences are not always completely matched even with the same type of protein. It is assumed that antibody proteins also partially differ in amino acid sequence. Specifically, a determination unit 2101 and a search unit 2102 described later obtain a common part (alignment partial chain) of the reference display target and the comparison display target amino acid sequences so that the partial structures corresponding to the common part overlap. It is based on this assumption that the arrangement position of the comparison display target is calculated.
実施の形態3では、各3次元構造データ対の表示対象(ここでは、抗体)について表示面Sdとその電気的特性を表示させることにより、それぞれの抗原タンパク質が抗体タンパク質に結合した場合の、抗体側の結合部位(電気的特性により非共有結合性の相互作用が形成されている可能性の高いと判断される抗体の表示面Sdの部分)を、ほぼ同じ方向から一度に視認できるようになる。
In Embodiment 3, by displaying the display surface Sd and its electrical characteristics for the display target (here, antibody) of each three-dimensional structure data pair, the antibody when each antigen protein binds to the antibody protein The side binding site (the portion of the display surface Sd of the antibody that is considered highly likely to form a non-covalent interaction due to electrical characteristics) can be viewed at once from substantially the same direction. .
すなわち、例えば、野生種の抗原が結合した場合(基準3次元構造データの場合)と、変異体抗原が結合した場合(比較3次元構造データの場合)で、抗体側の結合部位や、結合部位の周辺の電気特性がどのように異なるかを一覧し、効率的に比較できるようになる。したがって、抗原タンパク質の違いに由来する、抗体タンパク質側の結合部位の変化や、抗体の重要な部分構造に強く結合する可能性の高い抗原などを容易に特定できるようになる。
That is, for example, when a wild-type antigen is bound (in the case of reference three-dimensional structure data) and when a mutant antigen is bound (in the case of comparative three-dimensional structure data), the binding site or binding site on the antibody side It will be possible to list how the electrical characteristics of the surroundings are different and compare them efficiently. Therefore, it becomes possible to easily identify a change in the binding site on the antibody protein side due to a difference in the antigen protein, an antigen highly likely to bind strongly to an important partial structure of the antibody, or the like.
図20は、実施の形態3にかかる回転表示状態の表示画面例を示す説明図である。図20中、左側の第1表示領域2001には、基準表示対象の3次元モデルを表示している。黒以外の着色が施されている領域が電気的特性として着色された表示面Sdである。左肩の文字列WTは、表示対象の3次元モデルに結合している抗原タンパク質が野生種(ワイルドタイプ)であることを示している。また、左肩の文字列(Lys96)は、表示対象の3次元モデルに結合している抗原タンパク質で変異を入れる部分のアミノ酸配列を示している。
FIG. 20 is an explanatory diagram of a display screen example of the rotation display state according to the third embodiment. In FIG. 20, a first display area 2001 on the left side displays a three-dimensional model to be displayed as a reference. A region colored other than black is the display surface Sd colored as an electrical characteristic. The character string WT on the left shoulder indicates that the antigen protein bound to the three-dimensional model to be displayed is a wild type (wild type). Further, the character string (Lys96) on the left shoulder indicates the amino acid sequence of the portion to be mutated with the antigen protein bound to the three-dimensional model to be displayed.
なお、図20の表示領域2001,2002は、図13-1に示した視点座標を原点Oとする3次元の視点座標系を用いている。そして、基準表示対象の重心をZ軸上の所定の位置としている。
Note that the display areas 2001 and 2002 in FIG. 20 use a three-dimensional viewpoint coordinate system in which the viewpoint coordinates shown in FIG. The center of gravity of the reference display target is set to a predetermined position on the Z axis.
一方、右側の第2表示領域2002には、比較表示対象の3次元モデルを表示している。黒以外の着色が施されている領域が電気的特性として着色された表示面Sdである。各比較表示対象の3次元モデルの左肩の文字列は、各表示対象(抗体)に相互作用している抗原タンパク質のアミノ酸配列の内、変異したアミノ酸配列を示す名称を示している。比較表示対象は、基準表示対象と同一の視点座標系に配置されており、基準表示対象の回転角により回転表示される。また、比較表示対象の回転軸は、基準表示対象の回転軸をそのまま流用してもよく、比較表示対象から求めてもよい。なお、実施の形態1と同一箇所には同一符号を付し、その説明を省略する。
On the other hand, in the second display area 2002 on the right side, a three-dimensional model to be compared and displayed is displayed. A region colored other than black is the display surface Sd colored as an electrical characteristic. The character string on the left shoulder of each comparison display target three-dimensional model indicates the name indicating the mutated amino acid sequence among the amino acid sequences of the antigen protein interacting with each display target (antibody). The comparison display object is arranged in the same viewpoint coordinate system as the reference display object, and is rotated and displayed at the rotation angle of the reference display object. Moreover, the rotation axis of the comparison display target may be used as it is, or may be obtained from the comparison display target. In addition, the same code | symbol is attached | subjected to the same location as Embodiment 1, and the description is abbreviate | omitted.
(情報表示装置の機能的構成)
図21は、実施の形態3にかかる情報表示装置の機能的構成を示すブロック図である。実施の形態3では、実施の形態1で示した機能に、さらに判定部2101と探索部2102とを追加した構成である。判定部2101および探索部2102も、具体的には、たとえば、図2に示したROM202、RAM203、磁気ディスク205、光ディスク207などの記憶装置に記憶されたプログラムをCPU201に実行させることにより、または、I/F209により、その機能を実現する。また、取得部301~描画部308の機能は実施の形態1と同様であるが、異なる点のみ説明する。 (Functional configuration of information display device)
FIG. 21 is a block diagram of a functional configuration of the information display apparatus according to the third embodiment. In the third embodiment, adetermination unit 2101 and a search unit 2102 are further added to the functions described in the first embodiment. Specifically, the determination unit 2101 and the search unit 2102 also have the CPU 201 execute a program stored in a storage device such as the ROM 202, the RAM 203, the magnetic disk 205, and the optical disk 207 shown in FIG. The function is realized by the I / F 209. The functions of the acquisition unit 301 to the drawing unit 308 are the same as those in the first embodiment, but only different points will be described.
図21は、実施の形態3にかかる情報表示装置の機能的構成を示すブロック図である。実施の形態3では、実施の形態1で示した機能に、さらに判定部2101と探索部2102とを追加した構成である。判定部2101および探索部2102も、具体的には、たとえば、図2に示したROM202、RAM203、磁気ディスク205、光ディスク207などの記憶装置に記憶されたプログラムをCPU201に実行させることにより、または、I/F209により、その機能を実現する。また、取得部301~描画部308の機能は実施の形態1と同様であるが、異なる点のみ説明する。 (Functional configuration of information display device)
FIG. 21 is a block diagram of a functional configuration of the information display apparatus according to the third embodiment. In the third embodiment, a
取得部301は、実施の形態1で示した取得処理を、基準3次元構造データ対と比較3次元構造データ対それぞれについておこなう。比較3次元構造データ対とは、表示対象が基準3次元構造データ対と同一であり比較対象が異なる3次元構造データ対である。
The acquisition unit 301 performs the acquisition process described in Embodiment 1 for each of the reference three-dimensional structure data pair and the comparison three-dimensional structure data pair. The comparison three-dimensional structure data pair is a three-dimensional structure data pair whose display object is the same as the reference three-dimensional structure data pair and whose comparison object is different.
図22は、比較3次元構造データ対となる比較タンパク質複合体の3次元構造データを示す説明図である。比較タンパク質複合体の3次元構造データ2200では、フィールド項目については図4と同一である。なお、基準3次元構造データ対の表示対象を「基準表示対象」とし、比較3次元構造データ対の表示対象を「比較表示対象」とする。
FIG. 22 is an explanatory diagram showing three-dimensional structure data of a comparative protein complex that is a pair of comparative three-dimensional structure data. In the three-dimensional structure data 2200 of the comparative protein complex, the field items are the same as those in FIG. The display target of the reference three-dimensional structure data pair is “reference display target”, and the display target of the comparison three-dimensional structure data pair is “comparison display target”.
たとえば、基準表示対象を抗体、その比較対象を抗原とすると、比較表示対象も基準表示対象と同一種の抗体となる。一方、比較表示対象の比較対象は、基準3次元構造データ対の比較対象である抗原の一部のアミノ酸が置き換わった変異体である。また、抽出部302、選択部303および生成部304は、実施の形態1で示した抽出処理、選択処理および生成処理を、基準表示対象と比較表示対象それぞれについておこなう。なお、前述のように、基準表示対象の抗体と比較表示対象の抗体は、基本的には、同一のタンパク質であるが、アミノ酸配列としては(主要な機能に関わる部分以外の部分で)部分的に異なっていても構わない。
For example, if the reference display object is an antibody and the comparison object is an antigen, the comparison display object is the same type of antibody as the reference display object. On the other hand, the comparison target for comparison display is a mutant in which a part of the amino acids of the antigen to be compared in the reference three-dimensional structure data pair is replaced. The extraction unit 302, the selection unit 303, and the generation unit 304 perform the extraction process, the selection process, and the generation process described in the first embodiment for each of the reference display target and the comparison display target. As described above, the standard display target antibody and the comparative display target antibody are basically the same protein, but the amino acid sequence is partially (in a part other than the part related to the main function). It does not matter if they are different.
図23-1は、基準表示対象である抗体の分子表面Sをあらわす分子表面構造データを示す説明図である。分子表面構造データ2301において、フィールド項目については図7-1および図7-2と同一である。図23-2は、基準表示対象である抗体の分子表面Sの基準点をあらわす基準点データを示す説明図である。基準点データ2302は、基準表示対象である抗体の分子表面Sの基準点の座標値と静電ポテンシャルの値を有する。
FIG. 23-1 is an explanatory diagram showing molecular surface structure data representing the molecular surface S of an antibody that is a reference display target. In the molecular surface structure data 2301, the field items are the same as those in FIGS. 7-1 and 7-2. FIG. 23-2 is an explanatory diagram illustrating reference point data representing a reference point on the molecular surface S of an antibody that is a reference display target. The reference point data 2302 includes the coordinate value of the reference point on the molecular surface S of the antibody that is the reference display target and the value of the electrostatic potential.
図24-1は、比較表示対象である抗体の分子表面Sをあらわす分子表面構造データを示す説明図である。分子表面構造データ2401において、フィールド項目については図7-1および図7-2と同一である。図24-2は、比較表示対象である抗体の分子表面Sの基準点をあらわす基準点データを示す説明図である。基準点データ2402は、比較表示対象である抗体の分子表面Sの基準点の座標値と静電ポテンシャルの値を有する。
FIG. 24-1 is an explanatory diagram showing molecular surface structure data representing the molecular surface S of the antibody to be compared and displayed. In the molecular surface structure data 2401, the field items are the same as those in FIGS. 7-1 and 7-2. FIG. 24-2 is an explanatory diagram showing reference point data representing the reference point of the molecular surface S of the antibody to be compared and displayed. The reference point data 2402 includes the coordinate value of the reference point on the molecular surface S of the antibody to be compared and displayed and the value of the electrostatic potential.
設定部305については、実施の形態1で示した設定処理をおこなう。具体的には、基準表示対象の回転軸については実施の形態1のとおりに求める。一方、比較表示対象の回転軸は、ここでは求めない。また、回転角算出部306は、実施の形態1で示した回転角算出処理を、基準表示対象についてのみおこなう。
For the setting unit 305, the setting process shown in the first embodiment is performed. Specifically, the reference display target rotation axis is obtained as in the first embodiment. On the other hand, the rotation display target rotation axis is not obtained here. In addition, the rotation angle calculation unit 306 performs the rotation angle calculation processing shown in the first embodiment only for the reference display target.
判定部2101は、基準表示対象を構成する構成要素の配列と、比較表示対象を構成する構成要素の配列との共通性を判定する機能を有する。具体的には、基準表示対象のアミノ酸配列と比較表示対象のアミノ酸配列とについて多重配列アライメントを実行する。そして、相同性が認められたアミノ酸配列を位置合わせ用部分鎖とする。アミノ酸配列について多重配列アライメントの計算方法については既存の計算手法(たとえば、下記非特許文献5を参照)を利用する。なお、この処理が必要なのは、基準表示対象・比較表示対象のタンパク質(抗体)が、完全には同一でない場合であり、完全に同一であることが保障されている場合には、処理を省略して、アミノ酸配列全体を位置合わせ用部分鎖としてもよい。
The determination unit 2101 has a function of determining the commonality between the arrangement of the constituent elements constituting the reference display target and the arrangement of the constituent elements constituting the comparison display target. Specifically, multiple sequence alignment is executed for the amino acid sequence that is the reference display target and the amino acid sequence that is the comparative display target. Then, the amino acid sequence in which homology is recognized is used as a partial chain for alignment. The existing calculation method (for example, refer to the following nonpatent literature 5) is utilized about the calculation method of multiple sequence alignment about an amino acid sequence. This processing is necessary when the reference display target / comparison display target proteins (antibodies) are not completely the same, and when it is guaranteed that they are completely the same, the processing is omitted. Thus, the entire amino acid sequence may be a partial chain for alignment.
・非特許文献5
Larkin M.A. et al.“Clustal W and Clustal X version 2.0” Bioinformatics,Vol.23:P.2947-2948(2007). ・Non-patent document 5
Larkin M.M. A. et al. “Clustal W and Clustal X version 2.0” Bioinformatics, Vol. 23: P.I. 2947-2948 (2007).
Larkin M.A. et al.“Clustal W and Clustal X version 2.0” Bioinformatics,Vol.23:P.2947-2948(2007). ・
Larkin M.M. A. et al. “Clustal W and Clustal X version 2.0” Bioinformatics, Vol. 23: P.I. 2947-2948 (2007).
図25は、多重配列アライメントの実行例を示す説明図である。図25中、「基準」とある行は、基準表示対象の抗体タンパク質のアミノ酸配列であり、「比較」とあるのは、比較表示対象の抗体タンパク質のアミノ酸配列である。また、図25中、「*」は、配列上の同じ位置で、基準表示対象と比較表示対象とで同一のアミノ酸であることを示している。
FIG. 25 is an explanatory diagram showing an execution example of multiple sequence alignment. In FIG. 25, the line “reference” is the amino acid sequence of the antibody protein to be displayed as a reference, and “comparison” is the amino acid sequence of the antibody protein to be displayed as a comparison. In FIG. 25, “*” indicates that the same amino acid is present in the reference display object and the comparison display object at the same position on the sequence.
探索部2102は、判定部2101によって共通性ありと判定された構成要素どうしが重なるように、基準表示対象に対する比較表示対象の配置位置を探索する機能を有する。具体的には、たとえば、基準表示対象の重心を原点として基準表示対象を配置した3次元空間に、基準表示対象と各比較表示対象の位置合わせ用部分鎖構造間のRMSD(Root Mean Square Deviation)が最小となるように重ね合わせて、比較基準対象の配置位置を探索する。RMSD計算に用いる原子の選択はいくつか知られているが、ここでは、部分鎖を構成するアミノ酸配列の主鎖の重原子(-N-(C)-CO-)によって行うものとする。
The search unit 2102 has a function of searching the arrangement position of the comparison display target with respect to the reference display target so that the components determined to be common by the determination unit 2101 overlap each other. Specifically, for example, in a three-dimensional space in which the reference display object is arranged with the center of gravity of the reference display object as the origin, RMSD (Root Mean Square Deviation) between the reference display object and the partial chain structure for alignment of each comparison display object Are arranged so as to be minimized, and the arrangement position of the comparison reference object is searched. Several selections of atoms used for the RMSD calculation are known. Here, it is assumed that the selection is performed by the heavy atom (—N— (C) —CO—) of the main chain of the amino acid sequence constituting the partial chain.
図26は、基準表示対象に比較表示対象を重ね合わせた3次元モデル例を示す説明図である。図26の3次元モデル2600において、白で表現した部分が基準表示対象および比較表示対象が同一配置位置であることを示している。一方、黒で表現した部分は、基準表示対象および比較表示対象が異なる配置位置であることを示している。
FIG. 26 is an explanatory diagram showing an example of a three-dimensional model in which a comparison display object is superimposed on a reference display object. In the three-dimensional model 2600 of FIG. 26, the portion expressed in white indicates that the reference display object and the comparison display object are at the same arrangement position. On the other hand, the portion expressed in black indicates that the reference display object and the comparison display object are different arrangement positions.
また、変換部307は、実施の形態1で示した変換処理を、基準表示対象と比較表示対象それぞれについておこなう。具体的には、基準表示対象の表示面Sdを構成する各頂点の座標値を、回転角算出部306によって算出された回転角により基準点Pの法線が反視線方向に方向転換されたときの座標値に変換する。
Also, the conversion unit 307 performs the conversion process shown in Embodiment 1 for each of the reference display object and the comparison display object. Specifically, when the coordinate value of each vertex constituting the display surface Sd of the reference display target is changed from the normal of the reference point P to the anti-gaze direction by the rotation angle calculated by the rotation angle calculation unit 306 Convert to the coordinate value of.
また、比較表示対象の配置位置を探索部2102によって探索された配置位置とした場合に、比較表示対象の表示面Sdを構成する各頂点の座標値を、回転角により基準点Pの法線が反視線方向に方向転換されたときの座標値に変換する。比較表示対象に用いられる回転軸は、基準表示対象から得られた回転軸を用いる。あるいは、基準表示対象から得られた回転軸を、所定の点を通るように並行移動してもよい。たとえば、基準表示対象の回転軸が基準表示対象の重心を通るように設定されている場合には、比較表示対象についても基準表示対象の重心を通るように設定し、基準表示対象の回転軸が基準表示対象の表示面Sdの基準点Pを通るように設定されている場合には、比較表示対象の回転軸についても比較表示対象の表示面Sdの基準点Pを通るように設定してもよい。
Further, when the arrangement position of the comparison display target is set to the arrangement position searched by the search unit 2102, the coordinate value of each vertex constituting the display surface Sd of the comparison display target is represented by the normal line of the reference point P by the rotation angle. It is converted into the coordinate value when the direction is changed in the anti-gaze direction. The rotation axis used for the comparison display object is the rotation axis obtained from the reference display object. Alternatively, the rotation axis obtained from the reference display target may be moved in parallel so as to pass through a predetermined point. For example, if the rotation axis of the reference display object is set to pass through the center of gravity of the reference display object, the comparison display object is also set to pass through the center of gravity of the reference display object, and the rotation axis of the reference display object is When it is set to pass through the reference point P of the display surface Sd to be the reference display target, the rotation axis of the comparison display target may be set to pass through the reference point P of the display surface Sd of the comparison display target. Good.
描画部308は、実施の形態1で示した描画処理を、基準表示対象と比較表示対象それぞれについておこなう。これにより、実施の形態1と同様に基準表示対象が回転表示されるとともに、基準表示対象の回転に連動して比較表示対象も回転表示される。図20に示したように、基準表示対象と比較表示対象は別々の表示領域で表示される。
The drawing unit 308 performs the drawing process described in the first embodiment for each of the reference display target and the comparison display target. As a result, the reference display object is rotated and displayed as in the first embodiment, and the comparative display object is also rotated and displayed in conjunction with the rotation of the reference display object. As shown in FIG. 20, the reference display object and the comparison display object are displayed in separate display areas.
図27-1は、基準表示対象である野生種の抗体の回転表示後の3次元モデル例を示す説明図である。図27-2は、比較表示対象である抗体の回転表示後の3次元モデル例を示す説明図である。図27-1,図27-2において、表示面Sd以外の分子表面は黒で着色している。
FIG. 27A is an explanatory diagram of a three-dimensional model example after rotation display of a wild-type antibody that is a reference display target. FIG. 27B is an explanatory diagram of an example of a three-dimensional model after rotation display of the antibody to be compared and displayed. In FIGS. 27A and 27B, the molecular surfaces other than the display surface Sd are colored black.
(情報表示装置による情報表示処理手順)
図28は、実施の形態3にかかる情報表示装置による情報表示処理手順を示すフローチャートである。まず、取得部301により、基準3次元構造データ対および比較3次元構造データ対を取得する(ステップS2801)。つぎに、各構造データの分子表面Sを算出し(ステップS2802)、表示面Sd未抽出の表示対象があるか否かを判断する(ステップS2803)。未抽出の表示対象がある場合(ステップS2803:Yes)、未抽出の表示対象を1つ選択し(ステップS2804)、ステップS1403と同様の表示面抽出処理を実行して(ステップS2805)、ステップS2803に戻る。 (Information display processing procedure by the information display device)
FIG. 28 is a flowchart of an information display processing procedure performed by the information display apparatus according to the third embodiment. First, theacquisition unit 301 acquires a reference three-dimensional structure data pair and a comparison three-dimensional structure data pair (step S2801). Next, the molecular surface S of each structural data is calculated (step S2802), and it is determined whether or not there is a display target whose display surface Sd has not been extracted (step S2803). When there is an unextracted display target (step S2803: Yes), one unextracted display target is selected (step S2804), the display surface extraction process similar to step S1403 is executed (step S2805), and step S2803 is performed. Return to.
図28は、実施の形態3にかかる情報表示装置による情報表示処理手順を示すフローチャートである。まず、取得部301により、基準3次元構造データ対および比較3次元構造データ対を取得する(ステップS2801)。つぎに、各構造データの分子表面Sを算出し(ステップS2802)、表示面Sd未抽出の表示対象があるか否かを判断する(ステップS2803)。未抽出の表示対象がある場合(ステップS2803:Yes)、未抽出の表示対象を1つ選択し(ステップS2804)、ステップS1403と同様の表示面抽出処理を実行して(ステップS2805)、ステップS2803に戻る。 (Information display processing procedure by the information display device)
FIG. 28 is a flowchart of an information display processing procedure performed by the information display apparatus according to the third embodiment. First, the
一方、ステップS2803において、未抽出の表示対象がない場合(ステップS2803:No)、配置位置未探索の比較表示対象があるか否かを判断する(ステップS2806)。未探索の比較表示対象がある場合(ステップS2806:Yes)、未探索の比較表示対象を1つ選択し(ステップS2807)、判定部2101により判定処理(多重配列アライメント)を実行する(ステップS2808)。
On the other hand, if there is no unextracted display target in step S2803 (step S2803: No), it is determined whether there is a comparative display target for which the arrangement position has not been searched (step S2806). When there is an unsearched comparison display target (step S2806: Yes), one unsearched comparison display target is selected (step S2807), and the determination unit 2101 performs determination processing (multi-sequence alignment) (step S2808). .
そして、探索部2102により、基準表示対象と比較表示対象の位置合わせ用部分鎖構造間のRMSDが最小となる比較表示対象の配置位置を探索する(ステップS2809)。これにより、基準表示対象の重心を基準にして比較表示対象の配置位置が決定する。そして、ステップS2806に戻る。ステップS2806において、未探索の比較表示対象がない場合(ステップS2806:No)、表示面連動回転表示処理を実行して(ステップS2810)、一連の処理を終了する。
Then, the search unit 2102 searches for the arrangement position of the comparison display object that minimizes the RMSD between the alignment partial chain structures of the reference display object and the comparison display object (step S2809). Thereby, the arrangement position of the comparison display object is determined based on the center of gravity of the reference display object. Then, the process returns to step S2806. In step S2806, when there is no unsearched comparison display target (step S2806: No), display surface interlocking rotation display processing is executed (step S2810), and a series of processing ends.
図29は、図28に示した表示面連動回転表示処理(ステップS2810)の詳細な処理手順を示すフローチャートである。まず、基準表示対象が本処理について未処理か否かを判断する(ステップS2901)。未処理である場合(ステップS2901:Yes)、選択部303により、基準表示対象を選択して(ステップS2902)、実施の形態1と同様、基準表示対象の中から基準点Pを選択する(ステップS2903)。
FIG. 29 is a flowchart showing a detailed processing procedure of the display surface interlocking rotation display processing (step S2810) shown in FIG. First, it is determined whether or not the reference display target is unprocessed for this processing (step S2901). If not processed (step S2901: YES), the selection unit 303 selects a reference display object (step S2902), and selects the reference point P from the reference display objects as in the first embodiment (step S2902). S2903).
そして、生成部304により、基準点Pの頂点法線ベクトルを生成し(ステップS2904)、設定部305により回転軸を設定する(ステップS2905)。このあと、回転角算出部306により回転角を算出して(ステップS2906)、ステップS2901に戻る。ステップS2901において、基準表示対象が未処理でない場合(ステップS2901:No)、変換部307により、基準表示対象の座標変換を実施の形態1と同様におこなう。また、比較表示対象の座標変換も、基準表示対象について算出された回転軸まわりに、および、基準表示対象について算出された回転角分、基準表示対象と同一回転方向に回転する座標変換をおこなう(ステップS2907)。
Then, the generation unit 304 generates a vertex normal vector of the reference point P (step S2904), and the setting unit 305 sets the rotation axis (step S2905). Thereafter, the rotation angle calculation unit 306 calculates the rotation angle (step S2906), and the process returns to step S2901. In step S2901, when the reference display target is not unprocessed (step S2901: No), the conversion unit 307 performs coordinate conversion of the reference display target in the same manner as in the first embodiment. Also, the coordinate conversion of the comparison display target is performed around the rotation axis calculated for the reference display object and by the rotation angle calculated for the reference display object in the same rotation direction as the reference display object ( Step S2907).
そして、基準表示対象および比較表示対象について、座標変換後の表示面Sd(を含む分子表面Sや原子、アミノ酸残基)の描画処理をそれぞれの表示領域でおこなう(ステップS2908)。この場合、基準表示対象および比較表示対象について、それぞれの電気的特性に応じた着色を表示面Sdに施す。そして、それ以外の分子表面Sについては、電気的特性の着色が強調できるように、特定の一色(黒や白)を施す。これにより、表示面連動回転表示処理(ステップS2810)を終了する。
Then, with respect to the reference display object and the comparison display object, the drawing process of the display surface Sd (including the molecular surface S, atoms, and amino acid residues) after the coordinate conversion is performed in each display area (step S2908). In this case, the reference display object and the comparative display object are colored on the display surface Sd according to the respective electrical characteristics. For other molecular surfaces S, a specific color (black or white) is applied so that coloring of electrical characteristics can be emphasized. Thus, the display surface interlocking rotation display process (step S2810) is terminated.
このあと、基準表示対象について、ポインティングデバイスを用いて回転方向および回転角を指定(ドラッグ)することにより、基準表示対象を指定された回転方向に回転表示させることができる。この場合、変換部307に回転軸と回転角を与えることで、比較表示対象を、同じ回転方向および回転角で連動して回転表示させることができる。したがって、ユーザが視認したい方向から見ることができ、自由度の向上を図ることができる。
Thereafter, the reference display object can be rotated and displayed in the designated rotation direction by designating (dragging) the rotation direction and the rotation angle using the pointing device. In this case, by giving the conversion unit 307 a rotation axis and a rotation angle, the comparison display object can be rotated and displayed in conjunction with the same rotation direction and rotation angle. Therefore, it can be seen from the direction that the user wants to view, and the degree of freedom can be improved.
このように、実施の形態3によれば、抗原の変異体に結合する抗体の表示面Sd(結合部位)の電気的特性を、抗原に結合する抗体とほぼ同じ方向から一度に視認できるようになる。したがって、抗原のアミノ酸変異により電気的特性が大きく変化する抗体の結合部位の部分などを容易に特定できるようになる。
As described above, according to the third embodiment, the electrical characteristics of the display surface Sd (binding site) of the antibody that binds to the antigen variant can be viewed at once from substantially the same direction as the antibody that binds to the antigen. Become. Therefore, it is possible to easily identify the binding site portion of the antibody whose electrical characteristics greatly change due to the amino acid mutation of the antigen.
以上説明したように、従来では、タンパク質の結合に関わる分子表面Sの電気特性を観察するには、個々の構成タンパク質を分離した上で、ユーザが、結合に関わると考えられる部位を試行錯誤により見つける必要があった。そして、当該部位を見つけたとしても、見やすく表示されるように、表示方向を調節する必要があった。
As described above, conventionally, in order to observe the electrical characteristics of the molecular surface S related to protein binding, after separating individual constituent proteins, the user can identify a site considered to be related by trial and error. I had to find it. And even if the said site | part was found, it was necessary to adjust a display direction so that it might be displayed easily.
本実施の形態では、表示対象と比較対象との間の結合に関わる可能性の高い表示対象の表面の特徴的な部分を視認しやすく表示することができる。特に、実施の形態1により、結合に関与する可能性のある分子表面S(表示面Sd)のみを選択的に表示することができる。したがって、強い静電ポテンシャルを帯びているが、結合先との位置関係で相互作用に関わる可能性のない部分を、結合部位と誤認識する危険性を低減することができる。
In this embodiment, it is possible to easily display a characteristic part of the surface of the display target that is likely to be related to the coupling between the display target and the comparison target. In particular, according to the first embodiment, only the molecular surface S (display surface Sd) that may be involved in the binding can be selectively displayed. Therefore, it is possible to reduce the risk of erroneously recognizing a portion that has a strong electrostatic potential but has no possibility of interaction in the positional relationship with the binding destination as a binding site.
また、着目すべき電気特性を持つ分子表面S(基準点Pの近傍の分子表面S)およびその電気的特性を、自動的にユーザの視線に正対する向きで描画することができる。したがって、タンパク質結合に強く関わる可能性が高い分子表面Sの部分の電気的特性を容易に観察することができる。
Also, the molecular surface S having a remarkable electrical property (the molecular surface S in the vicinity of the reference point P) and its electrical property can be automatically drawn in a direction facing the user's line of sight. Therefore, it is possible to easily observe the electrical characteristics of the portion of the molecular surface S that is highly likely to be strongly involved in protein binding.
さらに、実施の形態2により、近接する構成タンパク質について、相互作用に関わる可能性が高い分子表面Sの部分(それぞれの基準点Pの近傍)を対置した状態で、構成タンパク質間の基準点間距離dを表示することができる。したがって、ユーザは、非共有結合性の相互作用が形成されている可能性が高いかを容易に判断することができる。
Further, according to the second embodiment, the distance between the reference points between the constituent proteins in the state where the parts of the molecular surface S that are highly likely to be involved in the interaction (near each reference point P) are placed facing each other. d can be displayed. Therefore, the user can easily determine whether or not a non-covalent interaction is likely to be formed.
また、実施の形態3により、基準表示対象に連動して比較表示対象をほぼ同方向からの透視図となるように一堂に表示させることができ、さらに、連動して回転表示させることができる。したがって、各比較表示対象の表示面Sdの電気的特性(抗原の変異体が結合した場合の抗体側の結合部位周辺の電荷の偏り状況)と、基準表示対象の表示面Sdの電気的特性(野生種の抗原が結合した場合の抗体側の結合部位周辺の電荷の偏り状況)とを、ほぼ同じ方向から一度に視認できるようになる。
Further, according to the third embodiment, the comparison display object can be displayed in a single view so as to be a perspective view from substantially the same direction in conjunction with the reference display object, and further, can be rotated and displayed in conjunction with the reference display object. Therefore, the electrical characteristics of the display surface Sd of each comparison display target (the state of charge bias around the binding site on the antibody side when an antigen variant is bound) and the electrical characteristics of the display surface Sd of the reference display target ( It is possible to visually recognize from the same direction at the same time the state of charge bias around the binding site on the antibody side when a wild-type antigen is bound.
したがって、ユーザは、抗原タンパク質の違いに由来する、抗体タンパク質側の結合部位(電荷の強い偏り等によって、非共有結合性相互作用の形成が示唆される表示面Sdの部分)の位置変化や、抗体の重要な部分構造(たとえば、野生種の抗原が結合する抗原の部分の周辺)に強く結合する可能性の高い抗原などを容易に特定できるようになる。
Therefore, the user can change the position of the binding site on the antibody protein side (part of the display surface Sd that suggests the formation of a non-covalent interaction due to a strong bias of charge, etc.) derived from the difference in antigen protein, It becomes possible to easily identify an antigen that is highly likely to bind strongly to an important partial structure of an antibody (for example, around the part of the antigen to which a wild-type antigen binds).
なお、本実施の形態で説明した情報表示方法は、予め用意されたプログラムをパーソナル・コンピュータやワークステーション等のコンピュータで実行することにより実現することができる。このプログラムは、ハードディスク、フレキシブルディスク、CD-ROM、MO、DVD等のコンピュータで読み取り可能な記録媒体に記録され、コンピュータによって記録媒体から読み出されることによって実行される。またこのプログラムは、インターネット等のネットワークを介して配布することとしてもよい。
The information display method described in the present embodiment can be realized by executing a program prepared in advance on a computer such as a personal computer or a workstation. This program is recorded on a computer-readable recording medium such as a hard disk, a flexible disk, a CD-ROM, an MO, and a DVD, and is executed by being read from the recording medium by the computer. This program may be distributed via a network such as the Internet.
Claims (9)
- コンピュータを、
表示対象となる3次元構造データおよび当該表示対象と比較される比較対象となる3次元構造データの組み合わせとなる3次元構造データ対を取得する取得手段と、
前記取得手段によって取得された表示対象により特定される前記表示対象の表面のうち、前記比較対象により特定される前記比較対象の表面から所定距離以内となる表面を前記表示対象の表示面として抽出する抽出手段と、
前記抽出手段によって抽出された前記表示対象の表示面を構成する各頂点が有する特徴量に基づいて、前記頂点群の中から基準点を選択する選択手段と、
前記選択手段によって選択された基準点の法線を生成する生成手段と、
前記生成手段によって生成された前記基準点の法線を反視線方向に方向転換させる回転軸を設定する設定手段と、
前記設定手段によって設定された前記回転軸を用いて、前記基準点の法線を反視線方向に方向転換させる回転角を算出する回転角算出手段と、
前記表示対象の表示面を構成する各頂点の座標値を、前記回転角算出手段によって算出された回転角により前記基準点の法線が前記反視線方向に方向転換されたときの座標値に変換する変換手段と、
前記変換手段による変換後における視線方向からの前記表示対象の表示面を、前記特徴量に基づいて表示画面に描画する描画手段、
として機能させることを特徴とする情報表示プログラム。 Computer
An acquisition means for acquiring a 3D structure data pair that is a combination of 3D structure data to be displayed and 3D structure data to be compared with the display object;
Among the surfaces of the display target specified by the display target acquired by the acquisition unit, a surface within a predetermined distance from the surface of the comparison target specified by the comparison target is extracted as the display surface of the display target. Extraction means;
Selection means for selecting a reference point from the vertex group based on the feature quantity of each vertex constituting the display surface of the display target extracted by the extraction means;
Generating means for generating a normal of the reference point selected by the selecting means;
Setting means for setting a rotation axis for turning the normal of the reference point generated by the generating means in a direction opposite to the line of sight;
Using the rotation axis set by the setting means, a rotation angle calculation means for calculating a rotation angle for turning the normal of the reference point in the anti-sight line direction;
The coordinate value of each vertex constituting the display surface of the display target is converted into the coordinate value when the normal of the reference point is changed in the anti-sight line direction by the rotation angle calculated by the rotation angle calculation means. Conversion means to
Drawing means for drawing the display surface of the display target from the line-of-sight direction after conversion by the conversion means on a display screen based on the feature amount;
An information display program characterized by functioning as - 前記コンピュータを、
任意の3次元構造データ対のうち一方の3次元構造データを前記表示対象、他方の3次元構造データを前記比較対象に指定する第1の指定と、前記一方の3次元構造データを前記比較対象、前記他方の3次元構造データを前記表示対象に指定する第2の指定をおこなう指定手段と、
前記第1の指定について前記選択手段によって選択された基準点と前記第2の指定について前記選択手段によって選択された基準点との基準点間距離を算出する距離算出手段として機能させ、
前記描画手段は、
前記距離算出手段によって算出された基準点間距離を、前記第1の指定について前記描画手段によって描画された前記表示対象の表示面および前記第2の指定について前記描画手段によって描画された前記表示対象の表示面に関連付けて描画することを特徴とする請求項1に記載の情報表示プログラム。 The computer,
A first designation that designates one of the three-dimensional structure data pairs as the display object, and the other three-dimensional structure data as the comparison object, and the one three-dimensional structure data as the comparison object Specifying means for performing a second specification for specifying the other three-dimensional structure data as the display object;
Functioning as a distance calculation means for calculating a distance between reference points selected by the selection means for the first designation and a reference point selected by the selection means for the second designation;
The drawing means includes
The distance between the reference points calculated by the distance calculation means is the display surface of the display target drawn by the drawing means for the first designation and the display target drawn by the drawing means for the second designation. The information display program according to claim 1, wherein the information display program is drawn in association with the display surface. - コンピュータを、
前記表示対象および前記比較対象の組み合わせとなる基準3次元構造データ対と、前記表示対象および前記比較対象とは異なる他の比較対象の組み合わせとなる比較3次元構造データ対とを取得する取得手段と、
前記取得手段によって取得された3次元構造データ対ごとに、前記表示対象により特定される前記表示対象の表面のうち、前記比較対象により特定される前記比較対象の表面から所定距離以内となる表面を、前記表示対象の表示面として抽出する抽出手段と、
前記基準3次元構造データ対の表示対象(以下、「基準表示対象」)を構成する構成要素の配列と、前記比較3次元構造データ対の表示対象(以下、「比較表示対象」)を構成する構成要素の配列との共通性を判定する判定手段と、
前記判定手段によって共通性ありと判定された構成要素どうしが重なるように、前記基準表示対象に対する前記比較表示対象の配置位置を探索する探索手段と、
前記抽出手段によって抽出された前記基準表示対象の表示面を構成する各頂点が有する特徴量に基づいて、前記基準表示対象の表示面を構成する頂点群の中から基準点を選択する選択手段と、
前記選択手段によって選択された前記基準表示対象の基準点の法線を生成する生成手段と、
前記基準表示対象について、前記生成手段によって生成された前記基準表示対象の基準点の法線を反視線方向に方向転換させる回転軸を設定する設定手段と、
前記基準表示対象について、前記設定手段によって設定された前記回転軸を用いて、前記基準表示対象の基準点の法線を反視線方向に方向転換させる回転角を算出する回転角算出手段と、
前記基準表示対象の表示面を構成する各頂点の座標値を、前記回転角算出手段によって算出された回転角により前記基準点の法線が前記反視線方向に方向転換されたときの座標値に変換するとともに、前記比較表示対象の配置位置を前記探索手段によって探索された配置位置とした場合に、前記比較表示対象の表示面を構成する各頂点の座標値を、前記回転角により前記基準点の法線が前記反視線方向に方向転換されたときの座標値に変換する変換手段と、
前記変換手段による変換後における前記基準表示対象および前記比較表示対象の表示面を、前記各特徴量に基づいて前記表示画面に描画する描画手段、
として機能させることを特徴とする情報表示プログラム。 Computer
An acquisition means for acquiring a reference three-dimensional structure data pair that is a combination of the display object and the comparison object, and a comparison three-dimensional structure data pair that is a combination of another comparison object different from the display object and the comparison object; ,
For each three-dimensional structure data pair acquired by the acquisition unit, a surface that is within a predetermined distance from the surface of the comparison target specified by the comparison target among the surfaces of the display target specified by the display target. Extracting means for extracting the display surface of the display object;
An array of components constituting a display target of the reference three-dimensional structure data pair (hereinafter referred to as “reference display target”) and a display target of the comparison three-dimensional structure data pair (hereinafter referred to as “comparison display target”) are configured. A determination means for determining the commonality with the arrangement of components;
Search means for searching for an arrangement position of the comparison display object with respect to the reference display object so that the components determined to be common by the determination means overlap;
Selection means for selecting a reference point from among a group of vertices constituting the display surface of the reference display target, based on a feature quantity of each vertex constituting the display surface of the reference display target extracted by the extraction means; ,
Generating means for generating a normal of the reference point of the reference display object selected by the selecting means;
For the reference display object, setting means for setting a rotation axis for changing the direction of the normal of the reference point of the reference display object generated by the generating means in the anti-sight line direction;
With respect to the reference display object, using the rotation axis set by the setting means, a rotation angle calculation means for calculating a rotation angle that changes the normal of the reference point of the reference display object in the anti-sight line direction;
The coordinate value of each vertex constituting the display surface of the reference display target is changed to the coordinate value when the normal of the reference point is changed in the anti-sight line direction by the rotation angle calculated by the rotation angle calculation means. In addition, when the arrangement position of the comparison display target is the arrangement position searched by the search means, the coordinate value of each vertex constituting the display surface of the comparison display target is converted to the reference point by the rotation angle. A conversion means for converting the normal line to a coordinate value when the direction of the normal is changed in the anti-sight line direction;
Drawing means for drawing the display surface of the reference display object and the comparison display object after conversion by the conversion means on the display screen based on the feature amounts;
An information display program characterized by functioning as - 表示対象となる3次元構造データおよび当該表示対象と比較される比較対象となる3次元構造データの組み合わせとなる3次元構造データ対を取得する取得手段と、
前記取得手段によって取得された表示対象により特定される前記表示対象の表面のうち、前記比較対象により特定される前記比較対象の表面から所定距離以内となる表面を前記表示対象の表示面として抽出する抽出手段と、
前記抽出手段によって抽出された前記表示対象の表示面を構成する各頂点が有する特徴量に基づいて、前記頂点群の中から基準点を選択する選択手段と、
前記選択手段によって選択された基準点の法線を生成する生成手段と、
前記生成手段によって生成された前記基準点の法線を反視線方向に方向転換させる回転軸を設定する設定手段と、
前記設定手段によって設定された前記回転軸を用いて、前記基準点の法線を反視線方向に方向転換させる回転角を算出する回転角算出手段と、
前記表示対象の表示面を構成する各頂点の座標値を、前記回転角算出手段によって算出された回転角により前記基準点の法線が前記反視線方向に方向転換されたときの座標値に変換する変換手段と、
前記変換手段による変換後における視線方向からの前記表示対象の表示面を、前記特徴量に基づいて前記表示画面に描画する描画手段と、
を備えることを特徴とする情報表示装置。 An acquisition means for acquiring a 3D structure data pair that is a combination of 3D structure data to be displayed and 3D structure data to be compared with the display object;
Among the surfaces of the display target specified by the display target acquired by the acquisition unit, a surface within a predetermined distance from the surface of the comparison target specified by the comparison target is extracted as the display surface of the display target. Extraction means;
Selection means for selecting a reference point from the vertex group based on the feature quantity of each vertex constituting the display surface of the display target extracted by the extraction means;
Generating means for generating a normal of the reference point selected by the selecting means;
Setting means for setting a rotation axis for turning the normal of the reference point generated by the generating means in a direction opposite to the line of sight;
Using the rotation axis set by the setting means, a rotation angle calculation means for calculating a rotation angle for turning the normal of the reference point in the anti-sight line direction;
The coordinate value of each vertex constituting the display surface of the display target is converted into the coordinate value when the normal of the reference point is changed in the anti-sight line direction by the rotation angle calculated by the rotation angle calculation means. Conversion means to
Drawing means for drawing the display surface of the display target from the line-of-sight direction after conversion by the conversion means on the display screen based on the feature amount;
An information display device comprising: - 任意の3次元構造データ対のうち一方の3次元構造データを前記表示対象、他方の3次元構造データを前記比較対象に指定する第1の指定と、前記一方の3次元構造データを前記比較対象、前記他方の3次元構造データを前記表示対象に指定する第2の指定をおこなう指定手段と、
前記第1の指定について前記選択手段によって選択された基準点と前記第2の指定について前記選択手段によって選択された基準点との基準点間距離を算出する距離算出手段とを備え、
前記描画手段は、
前記距離算出手段によって算出された基準点間距離を、前記第1の指定について前記描画手段によって描画された前記表示対象の表示面および前記第2の指定について前記描画手段によって描画された前記表示対象の表示面に関連付けて描画することを特徴とする請求項4に記載の情報表示装置。 A first designation that designates one of the three-dimensional structure data pairs as the display object, and the other three-dimensional structure data as the comparison object, and the one three-dimensional structure data as the comparison object Specifying means for performing a second specification for specifying the other three-dimensional structure data as the display object;
Distance calculating means for calculating a distance between the reference points selected by the selecting means for the first designation and the reference points selected by the selecting means for the second designation;
The drawing means includes
The distance between the reference points calculated by the distance calculation means is the display surface of the display target drawn by the drawing means for the first designation and the display target drawn by the drawing means for the second designation. The information display device according to claim 4, wherein the information display device draws the image in association with the display surface. - 前記表示対象および前記比較対象の組み合わせとなる基準3次元構造データ対と、前記表示対象および前記比較対象とは異なる他の比較対象の組み合わせとなる比較3次元構造データ対とを取得する取得手段と、
前記取得手段によって取得された3次元構造データ対ごとに、前記表示対象により特定される前記表示対象の表面のうち、前記比較対象により特定される前記比較対象の表面から所定距離以内となる表面を、前記表示対象の表示面として抽出する抽出手段と、
前記基準3次元構造データ対の表示対象(以下、「基準表示対象」)を構成する構成要素の配列と、前記比較3次元構造データ対の表示対象(以下、「比較表示対象」)を構成する構成要素の配列との共通性を判定する判定手段と、
前記判定手段によって共通性ありと判定された構成要素どうしが重なるように、前記基準表示対象に対する前記比較表示対象の配置位置を探索する探索手段と、
前記抽出手段によって抽出された前記基準表示対象の表示面を構成する各頂点が有する特徴量に基づいて、前記基準表示対象の表示面を構成する頂点群の中から基準点を選択する選択手段と、
前記選択手段によって選択された前記基準表示対象の基準点の法線を生成する生成手段と、
前記基準表示対象について、前記生成手段によって生成された前記基準表示対象の基準点の法線を反視線方向に方向転換させる回転軸を設定する設定手段と、
前記基準表示対象について、前記設定手段によって設定された前記回転軸を用いて、前記基準表示対象の基準点の法線を反視線方向に方向転換させる回転角を算出する回転角算出手段と、
前記基準表示対象の表示面を構成する各頂点の座標値を、前記回転角算出手段によって算出された回転角により前記基準点の法線が前記反視線方向に方向転換されたときの座標値に変換するとともに、前記比較表示対象の配置位置を前記探索手段によって探索された配置位置とした場合に、前記比較表示対象の表示面を構成する各頂点の座標値を、前記回転角により前記基準点の法線が前記反視線方向に方向転換されたときの座標値に変換する変換手段と、
前記変換手段による変換後における前記基準表示対象および前記比較表示対象の表示面を、前記各特徴量に基づいて前記表示画面に描画する描画手段と、
を備えることを特徴とする情報表示装置。 An acquisition means for acquiring a reference three-dimensional structure data pair that is a combination of the display object and the comparison object, and a comparison three-dimensional structure data pair that is a combination of another comparison object different from the display object and the comparison object; ,
For each three-dimensional structure data pair acquired by the acquisition unit, a surface that is within a predetermined distance from the surface of the comparison target specified by the comparison target among the surfaces of the display target specified by the display target. Extracting means for extracting the display surface of the display object;
An array of components constituting a display target of the reference three-dimensional structure data pair (hereinafter referred to as “reference display target”) and a display target of the comparison three-dimensional structure data pair (hereinafter referred to as “comparison display target”) are configured. A determination means for determining the commonality with the arrangement of components;
Search means for searching for an arrangement position of the comparison display object with respect to the reference display object so that the components determined to be common by the determination means overlap;
Selection means for selecting a reference point from among a group of vertices constituting the display surface of the reference display target, based on a feature quantity of each vertex constituting the display surface of the reference display target extracted by the extraction means; ,
Generating means for generating a normal of the reference point of the reference display object selected by the selecting means;
For the reference display object, setting means for setting a rotation axis for changing the direction of the normal of the reference point of the reference display object generated by the generating means in the anti-sight line direction;
With respect to the reference display object, using the rotation axis set by the setting means, a rotation angle calculation means for calculating a rotation angle that changes the normal of the reference point of the reference display object in the anti-sight line direction;
The coordinate value of each vertex constituting the display surface of the reference display target is changed to the coordinate value when the normal of the reference point is changed in the anti-sight line direction by the rotation angle calculated by the rotation angle calculation means. In addition, when the arrangement position of the comparison display target is the arrangement position searched by the search means, the coordinate value of each vertex constituting the display surface of the comparison display target is converted to the reference point by the rotation angle. A conversion means for converting the normal line to a coordinate value when the direction of the normal is changed in the anti-sight line direction;
Drawing means for drawing the display surface of the reference display object and the comparison display object after conversion by the conversion means on the display screen based on the feature quantities;
An information display device comprising: - コンピュータが、
表示対象となる3次元構造データおよび当該表示対象と比較される比較対象となる3次元構造データの組み合わせとなる3次元構造データ対を取得する取得工程と、
前記取得工程によって取得された表示対象により特定される前記表示対象の表面のうち、前記比較対象により特定される前記比較対象の表面から所定距離以内となる表面を前記表示対象の表示面として抽出する抽出工程と、
前記抽出工程によって抽出された前記表示対象の表示面を構成する各頂点が有する特徴量に基づいて、前記頂点群の中から基準点を選択する選択工程と、
前記選択工程によって選択された基準点の法線を生成する生成工程と、
前記生成工程によって生成された前記基準点の法線を反視線方向に方向転換させる回転軸を設定する設定工程と、
前記設定手段によって設定された前記回転軸を用いて、前記基準点の法線を反視線方向に方向転換させる回転角を算出する回転角算出工程と、
前記表示対象の表示面を構成する各頂点の座標値を、前記回転角算出工程によって算出された回転角により前記基準点の法線が前記反視線方向に方向転換されたときの座標値に変換する変換工程と、
前記変換工程による変換後における視線方向からの前記表示対象の表示面を、前記特徴量に基づいて前記表示画面に描画する描画工程と、
を実行することを特徴とする情報表示方法。 Computer
An acquisition step of acquiring a 3D structure data pair that is a combination of 3D structure data to be displayed and 3D structure data to be compared with the display object;
Of the surfaces of the display target specified by the display target acquired by the acquisition step, a surface within a predetermined distance from the surface of the comparison target specified by the comparison target is extracted as the display surface of the display target. An extraction process;
A selection step of selecting a reference point from the vertex group based on the feature amount of each vertex constituting the display surface of the display target extracted by the extraction step;
Generating a normal line of the reference point selected by the selection step;
A setting step for setting a rotation axis for turning the normal of the reference point generated by the generation step in a direction opposite to the line of sight;
A rotation angle calculating step of calculating a rotation angle for turning the normal of the reference point in the anti-sight line direction using the rotation axis set by the setting means;
The coordinate value of each vertex constituting the display surface of the display object is converted into the coordinate value when the normal of the reference point is changed in the anti-sight line direction by the rotation angle calculated by the rotation angle calculation step. Conversion process to
A drawing step of drawing the display surface of the display target from the line-of-sight direction after conversion by the conversion step on the display screen based on the feature amount;
The information display method characterized by performing. - 前記コンピュータが、
任意の3次元構造データ対のうち一方の3次元構造データを前記表示対象、他方の3次元構造データを前記比較対象に指定する第1の指定と、前記一方の3次元構造データを前記比較対象、前記他方の3次元構造データを前記表示対象に指定する第2の指定をおこなう指定工程と、
前記第1の指定について前記選択工程によって選択された基準点と前記第2の指定について前記選択工程によって選択された基準点との基準点間距離を算出する距離算出工程とを実行し、
前記描画工程は、
前記距離算出工程によって算出された基準点間距離を、前記第1の指定について前記描画工程によって描画された前記表示対象の表示面および前記第2の指定について前記描画工程によって描画された前記表示対象の表示面に関連付けて描画することを特徴とする請求項7に記載の情報表示方法。 The computer is
A first designation that designates one of the three-dimensional structure data pairs as the display object, and the other three-dimensional structure data as the comparison object, and the one three-dimensional structure data as the comparison object A designation step for performing a second designation for designating the other three-dimensional structure data as the display object;
A distance calculating step of calculating a distance between the reference points selected by the selection step for the first designation and the reference point selected by the selection step for the second designation;
The drawing step includes
The reference point distance calculated by the distance calculation step is the display surface of the display target drawn by the drawing step for the first designation and the display target drawn by the drawing step for the second designation. The information display method according to claim 7, wherein the information is drawn in association with the display surface. - コンピュータが、
前記表示対象および前記比較対象の組み合わせとなる基準3次元構造データ対と、前記表示対象および前記比較対象とは異なる他の比較対象の組み合わせとなる比較3次元構造データ対とを取得する取得工程と、
前記取得工程によって取得された3次元構造データ対ごとに、前記表示対象により特定される前記表示対象の表面のうち、前記比較対象により特定される前記比較対象の表面から所定距離以内となる表面を、前記表示対象の表示面として抽出する抽出工程と、
前記基準3次元構造データ対の表示対象(以下、「基準表示対象」)を構成する構成要素の配列と、前記比較3次元構造データ対の表示対象(以下、「比較表示対象」)を構成する構成要素の配列との共通性を判定する判定工程と、
前記判定工程によって共通性ありと判定された構成要素どうしが重なるように、前記基準表示対象に対する前記比較表示対象の配置位置を探索する探索工程と、
前記抽出工程によって抽出された前記基準表示対象の表示面を構成する各頂点が有する特徴量に基づいて、前記基準表示対象の表示面を構成する頂点群の中から基準点を選択する選択工程と、
前記選択工程によって選択された前記基準表示対象の基準点の法線を生成する生成工程と、
前記基準表示対象について、前記生成工程によって生成された前記基準表示対象の基準点の法線を反視線方向に方向転換させる回転軸を設定する設定工程と、
前記基準表示対象について、前記設定工程によって設定された前記回転軸を用いて、前記基準表示対象の基準点の法線を反視線方向に方向転換させる回転角を算出する回転角算出工程と、
前記基準表示対象の表示面を構成する各頂点の座標値を、前記回転角算出工程によって算出された回転角により前記基準点の法線が前記反視線方向に方向転換されたときの座標値に変換するとともに、前記比較表示対象の配置位置を前記探索工程によって探索された配置位置とした場合に、前記比較表示対象の表示面を構成する各頂点の座標値を、前記回転角により前記基準点の法線が前記反視線方向に方向転換されたときの座標値に変換する変換工程と、
前記変換工程による変換後における前記基準表示対象および前記比較表示対象の表示面を、前記各特徴量に基づいて前記表示画面に描画する描画工程と、
を実行することを特徴とする情報表示方法。 Computer
An acquisition step of acquiring a reference three-dimensional structure data pair that is a combination of the display object and the comparison object, and a comparison three-dimensional structure data pair that is a combination of another comparison object that is different from the display object and the comparison object; ,
For each three-dimensional structure data pair acquired by the acquisition step, a surface that is within a predetermined distance from the surface of the comparison target specified by the comparison target among the surfaces of the display target specified by the display target. , An extraction step of extracting as the display surface of the display object;
An array of components constituting a display target of the reference three-dimensional structure data pair (hereinafter referred to as “reference display target”) and a display target of the comparison three-dimensional structure data pair (hereinafter referred to as “comparison display target”) are configured. A determination step of determining commonality with the arrangement of the components;
A search step of searching for an arrangement position of the comparison display target with respect to the reference display target so that the components determined to have commonality by the determination step overlap;
A selection step of selecting a reference point from among a group of vertices constituting the display surface of the reference display target, based on the feature amount of each vertex constituting the display surface of the reference display target extracted by the extraction step; ,
Generating a normal line of the reference point of the reference display target selected by the selection step;
For the reference display object, a setting process for setting a rotation axis that changes the direction of the normal of the reference point of the reference display object generated by the generation process in the anti-sight line direction;
About the reference display object, using the rotation axis set by the setting step, a rotation angle calculation step for calculating a rotation angle that changes the normal of the reference point of the reference display object in the anti-sight line direction;
The coordinate value of each vertex constituting the display surface of the reference display target is set to the coordinate value when the normal of the reference point is changed in the anti-sight line direction by the rotation angle calculated by the rotation angle calculation step. In addition, the coordinate value of each vertex constituting the display surface of the comparison display target is converted into the reference point based on the rotation angle when the arrangement position of the comparison display target is set as the placement position searched by the search step. A conversion step of converting the normal line into a coordinate value when the direction of the line of sight is changed in the anti-sight line direction;
A drawing step of drawing the display surface of the reference display target and the comparison display target after conversion by the conversion step on the display screen based on the feature amounts;
The information display method characterized by performing.
Priority Applications (4)
| Application Number | Priority Date | Filing Date | Title |
|---|---|---|---|
| PCT/JP2009/056301 WO2010109649A1 (en) | 2009-03-27 | 2009-03-27 | Information display program, information display device, and information display method |
| JP2011506035A JP5136684B2 (en) | 2009-03-27 | 2010-03-19 | Information display program, information display device, and information display method |
| PCT/JP2010/054891 WO2010110228A1 (en) | 2009-03-27 | 2010-03-19 | Information display program, information display device, and information display method |
| US13/137,757 US8427470B2 (en) | 2009-03-27 | 2011-09-09 | Computer product, information display apparatus, and information display method |
Applications Claiming Priority (1)
| Application Number | Priority Date | Filing Date | Title |
|---|---|---|---|
| PCT/JP2009/056301 WO2010109649A1 (en) | 2009-03-27 | 2009-03-27 | Information display program, information display device, and information display method |
Publications (1)
| Publication Number | Publication Date |
|---|---|
| WO2010109649A1 true WO2010109649A1 (en) | 2010-09-30 |
Family
ID=42780358
Family Applications (2)
| Application Number | Title | Priority Date | Filing Date |
|---|---|---|---|
| PCT/JP2009/056301 WO2010109649A1 (en) | 2009-03-27 | 2009-03-27 | Information display program, information display device, and information display method |
| PCT/JP2010/054891 WO2010110228A1 (en) | 2009-03-27 | 2010-03-19 | Information display program, information display device, and information display method |
Family Applications After (1)
| Application Number | Title | Priority Date | Filing Date |
|---|---|---|---|
| PCT/JP2010/054891 WO2010110228A1 (en) | 2009-03-27 | 2010-03-19 | Information display program, information display device, and information display method |
Country Status (2)
| Country | Link |
|---|---|
| US (1) | US8427470B2 (en) |
| WO (2) | WO2010109649A1 (en) |
Cited By (1)
| Publication number | Priority date | Publication date | Assignee | Title |
|---|---|---|---|---|
| US8427470B2 (en) | 2009-03-27 | 2013-04-23 | Fujitsu Limited | Computer product, information display apparatus, and information display method |
Families Citing this family (2)
| Publication number | Priority date | Publication date | Assignee | Title |
|---|---|---|---|---|
| KR20180065135A (en) * | 2016-12-07 | 2018-06-18 | 삼성전자주식회사 | Methods and devices of reducing structure noises through self-structure analysis |
| JP6853095B2 (en) * | 2017-03-31 | 2021-03-31 | キヤノンメディカルシステムズ株式会社 | Medical information processing device and medical information processing method |
Citations (3)
| Publication number | Priority date | Publication date | Assignee | Title |
|---|---|---|---|---|
| JP2002507882A (en) * | 1996-10-18 | 2002-03-12 | スノール・モレキュラー・コーポレーション | Binding molecules and computer-based methods for increasing their binding affinity |
| JP2002259395A (en) * | 2001-03-01 | 2002-09-13 | Chugai Pharmaceut Co Ltd | Method for estimating interacting part of protein or nucleic acid molecule |
| JP2005507096A (en) * | 2001-01-05 | 2005-03-10 | ライオン バイオサイエンス アクチェンゲゼルシャフト | How to organize and describe biological elements |
Family Cites Families (4)
| Publication number | Priority date | Publication date | Assignee | Title |
|---|---|---|---|---|
| JP3751770B2 (en) | 1999-07-08 | 2006-03-01 | 富士通株式会社 | 3D shape generator |
| US7589720B2 (en) * | 2004-08-04 | 2009-09-15 | Microsoft Corporation | Mesh editing with gradient field manipulation and user interactive tools for object merging |
| US20090006059A1 (en) | 2007-06-27 | 2009-01-01 | Nidhi Arora | Systems and methods for mapping binding site volumes in macromolecules |
| WO2010109649A1 (en) | 2009-03-27 | 2010-09-30 | 富士通株式会社 | Information display program, information display device, and information display method |
-
2009
- 2009-03-27 WO PCT/JP2009/056301 patent/WO2010109649A1/en active Application Filing
-
2010
- 2010-03-19 WO PCT/JP2010/054891 patent/WO2010110228A1/en active Application Filing
-
2011
- 2011-09-09 US US13/137,757 patent/US8427470B2/en active Active
Patent Citations (3)
| Publication number | Priority date | Publication date | Assignee | Title |
|---|---|---|---|---|
| JP2002507882A (en) * | 1996-10-18 | 2002-03-12 | スノール・モレキュラー・コーポレーション | Binding molecules and computer-based methods for increasing their binding affinity |
| JP2005507096A (en) * | 2001-01-05 | 2005-03-10 | ライオン バイオサイエンス アクチェンゲゼルシャフト | How to organize and describe biological elements |
| JP2002259395A (en) * | 2001-03-01 | 2002-09-13 | Chugai Pharmaceut Co Ltd | Method for estimating interacting part of protein or nucleic acid molecule |
Non-Patent Citations (1)
| Title |
|---|
| SVERUD, O.: "Towards optimal views of proteins", BIOINFORMATICS, vol. 19, no. 7, 2003, pages 882 - 888 * |
Cited By (1)
| Publication number | Priority date | Publication date | Assignee | Title |
|---|---|---|---|---|
| US8427470B2 (en) | 2009-03-27 | 2013-04-23 | Fujitsu Limited | Computer product, information display apparatus, and information display method |
Also Published As
| Publication number | Publication date |
|---|---|
| US8427470B2 (en) | 2013-04-23 |
| US20120002844A1 (en) | 2012-01-05 |
| WO2010110228A1 (en) | 2010-09-30 |
Similar Documents
| Publication | Publication Date | Title |
|---|---|---|
| Papaioannou et al. | On the automatic assemblage of arbitrary broken solid artefacts | |
| Biasini et al. | OpenStructure: an integrated software framework for computational structural biology | |
| Heymann et al. | Bsoft: image processing and molecular modeling for electron microscopy | |
| Birmanns et al. | Using Sculptor and Situs for simultaneous assembly of atomic components into low-resolution shapes | |
| KR20210102348A (en) | Method of merging point clouds to identify and maintain preferred points | |
| JP4444893B2 (en) | Extended portfolio chart drawing device | |
| JP6880618B2 (en) | Image processing program, image processing device, and image processing method | |
| WO2010109649A1 (en) | Information display program, information display device, and information display method | |
| Al Nasr et al. | Intensity-based skeletonization of CryoEM gray-scale images using a true segmentation-free algorithm | |
| Dou et al. | Flexible fitting of atomic models into cryo-EM density maps guided by helix correspondences | |
| Dasgupta et al. | Reconstruction of three-dimensional conformations of bacterial ClpB from high-speed atomic-force-microscopy images | |
| Briggs et al. | Classification and three-dimensional reconstruction of unevenly distributed or symmetry mismatched features of icosahedral particles | |
| Terashi et al. | MAINMASTseg: automated map segmentation method for cryo-EM density maps with symmetry | |
| JP2017168081A (en) | 3d object localization with descriptor | |
| Xu et al. | Protein depth calculation and the use for improving accuracy of protein fold recognition | |
| JP5136684B2 (en) | Information display program, information display device, and information display method | |
| JP2017162447A (en) | Localization of 3d object with quantization | |
| Higa et al. | STING Millennium Suite: integrated software for extensive analyses of 3d structures of proteins and their complexes | |
| US20230205820A1 (en) | Geometry-based design data search tool | |
| JP7265143B2 (en) | Display control method, display control program and information processing device | |
| Collins et al. | Computer-assisted reconstruction of virtual fragmented cuneiform tablets | |
| Douguet et al. | sensaas: Shape‐based Alignment by Registration of Colored Point‐based Surfaces | |
| Syrlybaeva et al. | One-sided design of protein-protein interaction motifs using deep learning | |
| Madan et al. | Principles and aspects of molecular docking: A bird’s eye view | |
| JP4935009B2 (en) | Protein surface shape search device, protein surface shape search method, and protein surface shape search program |
Legal Events
| Date | Code | Title | Description |
|---|---|---|---|
| 121 | Ep: the epo has been informed by wipo that ep was designated in this application |
Ref document number: 09842263 Country of ref document: EP Kind code of ref document: A1 |
|
| NENP | Non-entry into the national phase |
Ref country code: DE |
|
| 122 | Ep: pct application non-entry in european phase |
Ref document number: 09842263 Country of ref document: EP Kind code of ref document: A1 |
|
| NENP | Non-entry into the national phase |
Ref country code: JP |