DESCRIPTION
EARLY DETECTION OF TUBERCULOSIS TREATMENT RESPONSE
CROSS-REFERENCE TO RELATED APPLICATIONS
[0001] This application claims priority to, and incorporates by reference in its entirety, provisional patent application serial no. 61/610,121 filed March 13, 2012, and which is also titled "Early Detection of Tuberculosis Treatment Response."
TECHNICAL FIELD OF THE INVENTION
[0002] The present invention relates in general to the field of Mycobacterium tuberculosis infection, and more particularly, to methods for monitoring treatment response and determining treatment effectiveness.
STATEMENT OF FEDERALLY FUNDED RESEARCH
[0003] None.
BACKGROUND OF THE INVENTION
[0004] Without limiting the scope of the invention, its background is described in connection with the treatment of Mycobacterium tuberculosis infection.
[0005] United States Patent Application Publication No. 2009/0104602, entitled "Diagnosis of Tuberculosis," filed by Fernandez-Reyes et al. describes methods of diagnosing tuberculosis comprising: (i) providing expression data of two or more markers in a subject, wherein at least two of said markers are selected from transthyretin, neopterin, C- reactive protein (CRP), serum amyloid A (SAA), serum albumin, apoliopoprotein-Al (Apo- Al), apolipoprotein-A2 (Apo-A2), hemoglobin beta, haptoglobin protein, DEP domain protein, leucine-rich alpha-2-glycoprotein (A2GL) and hypothetical protein DFKZp667I032; and (ii) comparing said expression data to expression data of said marker from a group of control subjects, wherein said control subjects comprise patients suffering from inflammatory conditions other than tuberculosis (TB), thereby determining whether or not said test subject has TB.
[0006] United States Patent Application Publication No. 2003/0138813, entitled "Method of diagnosis and disease risk assessment," filed by Engstrand et al., relates to methods of determining information about the likely clinical outcome of a microbiological infection in a patient and also to methods of selecting a suitable therapeutic regimen for a patient with a
microbiological infection. The application describes analyzing the virulence gene of Mycobacterium tuberculosis to determine the likely clinical outcome.
[0007] Nahid et ai, CDC/NIH Workshop Report, "Tuberculosis biomarker and surrogate endpoint research roadmap," Am J Respir Crit Care Med. 201 1 Oct 15; 184(8):972-9, states that Centers for Disease Control and Prevention and National Institutes of Health convened a multidisciplinary meeting to discuss surrogate markers of treatment response in tuberculosis. It is said that, at a minimum, a biomarker of treatment response most useful for drug development would need to: 1) correspond closely with treatment outcomes; 2) have a wide dynamic range that would allow analysis as a continuous variable; and 3) provide this information from a limited number of early time points.
[0008] Wallis et ah, "Biomarkers and diagnostics for tuberculosis: progress, needs, and translation into practice," Lancet 2010 May 29;375(9729): 1920-37. Epub 2010 May 18, states that host or pathogen-specific tuberculosis biomarkers provide prognostic information, either for individual patients or study cohorts. It is said that detection of volatile organic compounds in the breath of patients with pulmonary tuberculosis has been reported, but no study has reported changes during treatment. It is stated that studies have examined levels of M. tuberculosis antigen 85 and 85B RNA in sputum during treatment, and the magnitude and duration of increases in this protein during the first week of treatment predicted relapse or failure in four of 42 patients. [0009] Berry et ai, "An interferon-inducible neutrophil-driven blood transcriptional signature in human tuberculosis," Nature 2010 Aug 19;466(7309):973-7, reports identification of a whole-blood 393 transcript signature for active tuberculosis in intermediate and high-burden settings, which is missing in the majority of individuals with latent tuberculosis, and missing from healthy controls. The signature correlated with radiological extent of disease and diminished after two months of treatment and reverted to that of healthy controls after completion of treatment. An 86-transcript signature discriminated between active TB and other inflammatory and infectious diseases, and this signature was also diminished after two months of treatment. The tuberculosis signature was dominated by a neutrophil-driven interferon (IFN)-inducible gene profile, consisting of both IFN-gamma and type I IFN-alpha beta signaling.
[0010] Marchant et al., "Serological markers of disease activity in tuberculosis and HIV infection," Clin Exp Immunol. 2000 Oct; 122(1): 10-2, states that markers of disease activity
are needed to evaluate disease progression and to monitor response to therapy. It is suggested that e.g., soluble tumour necrosis factor receptor type 1 (sTNF-RI) and beta 2- macroglobulin, could be used as independent markers of disease activity in TB and HIV infection, respectively. [001 1] Frahm et ah, "Discriminating between latent and active tuberculosis with multiple biomarker responses," Tuberculosis (Edinb). 2011 May;91(3):250-6. Epub 201 1 Mar 10, states that twenty-five biomarkers were evaluated and it was found that IL-15 and MCP-1 identified 83% of active and 88% of latent infections. The combination of IL-15 and MCP-1 responses was accurate in distinguishing persons with active tuberculosis from persons with latent tuberculosis in this study.
SUMMARY OF THE INVENTION
[0012] Part of the inventive subject matter that the present invention provides includes methods for early detection of a treatment response in a patient suspected of being infected with Mycobacterium tuberculosis. In some embodiments, changes in the blood transcriptome are detectable within two weeks or less of the initiation of antituberculosis therapy.
[0013] In one aspect, a method is provided for evaluating tuberculosis treatment response in a patient, the method comprising: measuring expression levels of genes in a biological sample from the patient to generate a first gene expression profile, wherein the biological sample is obtained at a first time point that is before or concurrent with commencement of tuberculosis treatment; measuring expression levels of genes in a second biological sample from the patient to generate a second gene expression profile, wherein the second biological sample is obtained after commencement of the treatment but at two weeks or less after commencement; and calculating a temporal molecular response value by comparing the first and second gene expression profiles. In a related aspect, a method is provided for evaluating effectiveness of tuberculosis treatment, the method comprising: measuring expression levels of genes in a biological sample from a tuberculosis patient to generate a first gene expression profile, wherein the biological sample is obtained at a first time point that is before or concurrent with commencement of tuberculosis treatment; administering the treatment to the patient; measuring expression levels of genes in a second biological sample from the patient to generate a second gene expression profile, wherein the second biological sample is obtained after commencement of the treatment but at two weeks or less after commencement; and calculating a temporal molecular response value by comparing the first and second gene
expression profiles. In some embodiments, a significant temporal molecular response value is a biomarker for an effective treatment.
[0014] In a further related aspect, a method is provided for treating a patient with Mycobacterium tuberculosis infection, the method comprising: measuring expression levels of genes in a biological sample from the patient to generate a first gene expression profile, wherein the biological sample is obtained at a first time point that is before or concurrent with commencement of treatment for the infection; administering a treatment for the infection to the patient; measuring expression levels of genes in a second biological sample from the patient to generate a second gene expression profile, wherein the second biological sample is obtained after commencement of the treatment but at two weeks or less after commencement; and calculating a temporal molecular response value by comparing the first and second gene expression profiles. In an associated method, the treatment is continued if the temporal molecular response value is significant. In a further associated method, the treatment is discontinued if the temporal molecular response value is not significant. [0015] In some embodiments, the biological sample is blood. In addition, a gene expression profile may comprise RNA transcriptome expression data. Genes of a gene expression profile may comprise 2, 3, 4, 5, 6, 7, 8, 9, or 10 genes, between 11 and 20 genes, between 21 and 30 genes, between 31 and 50 genes, between 51 and 75 genes, between 76 and 100 genes, between 101 and 200 genes, between 201 and 300 genes, between 301 and 500 genes, between 501 and 750 genes, or more than 751 genes. In addition, genes of a gene expression profile may comprise genes selected from Table 1, 3, 4, 5, 6, 7, 8, 9, 10, 11 , or 12 dislcosed herein.
[0016] In related embodiments of these methods, the second time point is 13, 12, 1 1, 10, 9, 8, 7, 6, 5, 4, 3, or 2 days or less, or 1 day or less, after commencement of treatment. In other related embodiments, genes of the gene expression profile comprise 1 , 2, 3, 4, 5, 6 or more different genes selected from the group consisting of IFI35, IFIT1, IFIT3, IFITM1, IRF1 , JAK2, SOCS1 , STAT1, TAP1, CD40LG, CD79A, CD79B, FAS, FCER1G, IL15, IL1B, IL1RN, SLAMF1, TLR2, TLR5, TNFSF13B, C2, C1 QB, C1QC, C4BPA, CD59, CR1, SERPING1, C5, CASP1, IFIH1 , IL1B, IRF7, NLRC4, NOD2, MAPK14, OSM, SOCS3, CD86, CXCL10, FCER1G, TLR8, CD86, CREB5, FCGR1A, FCGR1B, IL15, IL23A, STAT2, CASP5, ITGAX, PLCG1 , F2RL1, IL18R1, IL18RAP, IRAK3, NFAT5, PDGFA, PLCG1, TRAF5, CD3E, FCGR1C, FCGR2C, FCGR3B, and LCK.
[0017] In one embodiment, the present invention includes a method to determine effectiveness of a treatment for tuberculosis in a patient suspected of being infected with Mycobacterium tuberculosis, the method comprising: obtaining a first gene expression dataset from a sample of the patient at a first time point, wherein the first time point is before or simultaneous with a commencement of the treatment for tuberculosis; obtaining a second gene expression dataset from the sample of the patient at a second time point, wherein the second time point is less than 2 months after the commencement of the treatment for tuberculosis, wherein the first gene expression dataset and the second gene expression dataset comprises one or more genes; comparing the first gene expression dataset with the second gene expression dataset; determining that treatment is effective if a significant change between the first gene expression dataset and the second gene expression dataset is detected; or determining that treatment is ineffective if no change or less than a significant change between the first gene expression dataset and the second gene expression dataset is detected. In one aspect, the gene expression data set comprises 2, 3, 4, 5, 6, 7, 8, 9, or 10 genes, between 10 and 19 genes, between 20 and 99 genes or 100 or more genes of genes listed in table 1, 3, 4, 5, 6, 7, 8, 9, 10, 11, or 12. In another aspect, the gene expression data set comprises one or more genes selected from the group consisting of genes related to IFN Signaling selected from the group consisting of IFI35, IFIT1, IFIT3, IFITM1, OAS1, IRF1, JAK2, SOCS1, STAT1, STAT2, and TAP1, significantly changed upon two weeks after initiation of anti-TB drug treatment. In another aspect, the gene expression data set comprises one or more genes selected from the group consisting of genes related to T and B cell signaling selected from the group consisting of CD40LG, CD79A, CD79A, CD79B, FAS, FCER1G, IL15, IL23A, IL1B, IL1RN, SLAMF1, TLR2, TLR5, TLR8, TNFSF13B, TNFRSF13B, and CD86. In another aspect, the gene expression data set comprises one or more genes selected from the group consisting of genes related to a complement system selected from the group consisting of C2, C1QB, C1QC, C4BPA, CD59, CR1 , and SERPING1. In another aspect, the gene expression data set comprises one or more genes selected from the group consisting of genes having a role in pattern recognition selected from the group consisting of C5, C1 QB, C1QC, CASP1 , IFIH1 , IL1B, IRF7, NLRC4, OAS1 , OAS2, OAS3, NOD2, TLR2, TLR5, TLR8, and C3AR1. In another aspect, the gene expression data set comprises one or more genes selected from the group consisting of genes related to JAK family kinases in IL-6 type cytokine signaling selected from the group consisting of MAPK14, OSM, SOCS1, SOCS3, and STAT1. In another aspect, the gene expression data set comprises one or more genes selected from the group consisting of genes
having a role in communication between innate and adaptive immune cells selected from the group consisting of CD86, CD40LG, CXCL10, FCER1 G, IL15, IL1 B, IL1RN, TLR2, TLR5, TLR8, TNFRSF13B, and TNFSF13B. In another aspect, the gene expression data set comprises one or more genes selected from the group consisting of genes related to dendritic cell maturation selected from the group consisting of CD86, CD40LG, CREB5, FCER1G, FCGR1A, FCGR1B, IL15, IL1B, IL1RN, IL23A, JAK2, MAPK14, STAT1, STAT2, and TLR2. In another aspect, the gene expression data set comprises one or more genes selected from the group consisting of genes related to TREM signaling selected from the group consisting of CASP1 , CASP5, IL1B, ITGAX, JAK2, NOD2, PLCG1 , TLR2, and TLR5. In another aspect, the gene expression data set comprises one or more genes selected from the group consisting of genes related to a role of macrophages, fibroblasts, and endothelial cells in rheumatoid arthritis selected from the group consisting of C5, CREB5, F2RL1, FCGR1A, IL15, IL18R1, IL18RAP, IL1B, IL1RN, IRAK3, JAK2, MAPK14, NFAT5, OSM, PDGFA, PLCG1, SOCS1, SOCS3, TLR2, TLR5, TNFSF13B, and TRAF5. In another aspect, the gene expression data set comprises one or more genes selected from the group consisting of genes related to systemic lupus erythematous signaling selected from the group consisting of C5, CD3E, CD40LG, CD79A, CD79B, FCER1G, FCGR1A, FCGR1B, FCGR1C, FCGR2C, FCGR3B, IL1B, ILIRN, LCK, NFAT5, PLCG1 , and TNFSF13B. In another aspect, the gene expression data set comprises one or more genes selected from the group consisting of IFI35, IFIT1, IFIT3, IFITM1, OAS1, IRF1, JAK2, SOCS1 , STAT1, STAT2, TAP1, CD40LG, CD79A, CD79A, CD79B, FAS, FCER1G, IL15, IL23A, IL1 B, ILIRN, SLAMF1 , TLR2, TLR5, TLR8, TNFSF13B, TNFRSF13B, CD86, C2, C1QB, C1QC, C4BPA, CD59, CR1 , SERPING1, C5, CASP1 , IFIH1, IRF7, NLRC4, OAS2, OAS3, NOD2, TLR2, TLR5, TLR8, C3AR1, MAPK14, OSM, SOCS3, STAT1 , CD86, CD40LG, CXCL10, FCER1G, IL15, ILIRN, TLR2, TLR5, TLR8, TNFRSF13B, TNFSF13B, CD86, CD40LG, CREB5, FCER1G, FCGR1A, FCGR1B, IL15, ILIRN, IL23A, JAK2, MAPK14, CASP5, ITGAX, JAK2, NOD2, PLCG1, TLR2, TLR5, CREB5, F2RL1 , FCGR1A, IL15, IL18R1 , IL18RAP, ILIRN, IRAK3, JAK2, MAPK14, NFAT5, OSM, PDGFA, PLCG1 , SOCS3, TLR2, TLR5, TNFSF13B, TRAF5, CD3E, CD40LG, CD79A, FCER1G, FCGR1A, FCGR1B, FCGR1C, FCGR2C, FCGR3B, ILIRN, LCK, NFAT5, PLCG1 , TNFSF13B.
[0018] In another aspect, the second time point is between the start of treatment and two weeks after commencement of treatment. In another aspect, the significant change between the first gene expression dataset and the second gene expression dataset comprises the sum of
transcripts that are greater than 2-fold different between the first and second time points, expressed as a percentage of the total number of transcripts in each of the gene signatures (Temporal Molecular Response Algorithm derived for this study). In another aspect the second time point is between 2 weeks and 2 months, showing a significant change after the commencement of treatment. In another aspect, 2 months and 6 months after the commencement of treatment. In another aspect, the change between the first gene expression dataset and the second gene expression dataset comprises is at least twofold change of expression most significant as described by the Temporal Molecular Response from initiation of treatment to after 2 weeks. In another aspect, the change between the first gene expression dataset and the second gene expression is observed in between 10 and 100 percent of genes. In another aspect, the treatment comprises treatment with rifampin, pyrazinamide, isoniazid ethambutol, or combinations thereof. In certain aspects, the treatment comprises treatment with anti-mycobacterial drugs against drug-sensitive Mtb, including the addition or substitution of other anti-mycobacterial agents such as levofloxacin, moxifloxacin, prothioniamide, ethionamide, cycloserine, amikacin, streptomycin, kanamycin, para-amino salicylic acid, capreomycin, linezolid, TMC-205, or other similar drugs. In addition it could be applied to the monitoring of new drugs being tested for greater efficacy, and also new drugs tested against MDR- and XDR-TB.
[0019] Another embodiment is a method of performing a clinical trial to evaluate the effectiveness of a candidate drug believed to be useful in treating Mycobacterium tuberculosis, the method comprising: (a) obtaining a biological sample from a patient with a Mycobacterium tuberculosis infection; (b) from the patient sample determining a first gene expression dataset from the sample of the patient at a first time point, wherein the first time point is before or simultaneous with a commencement of the treatment for Mycobacterium tuberculosis in one or more biological sample of the patient; (b) administering a candidate drug to the patient, and obtaining a second gene expression dataset from a second sample obtained from the patient at a second time point, wherein the second time point is less than 2 months after commencement of the treatment for Mycobacterium tuberculosis, wherein the first gene expression dataset and the second gene expression comprises one or more genes; comparing the first gene expression dataset with the second gene expression dataset following the treatment with the candidate drug; and determining that treatment is effective if a significant change between the first gene expression dataset and the second gene expression
dataset is detected or determining that treatment is ineffective if less than a significant change between the first gene expression dataset and the second gene expression dataset is detected.
BRIEF DESCRIPTION OF THE DRAWINGS
[0020] The patent or application file contains at least one drawing executed in color. Copies of this patent or patent application publication with color drawing(s) will be provided by the Office upon request and payment of the necessary fee.
[0021] For a more complete understanding of the features and advantages of the present invention, reference is now made to the detailed description of the invention along with the accompanying figures and in which: Figures 1A through Figure 10E are further detailed in Example 1 herein; Figures 1 1A through 18C are further detailed in Example 2 herein; and Figures 19 through 21 are detailed in Example 3 herein.
[0022] Figures 1A-1B illustrate numbers enrolled, assigned to cohorts, and included in the analysis of 201 1 cohorts. As shown in Figure 1 A, a total of 67 active (29) and latent (38) TB patients were enrolled into an Untreated South Africa 2011 Cohort. A total of 20 active TB patients were included in an Treated South Africa 201 1 Cohort. Eleven were randomised into an Active TB Training Set and nine into an Active TB Test Set. As shown in Figure IB, a total of eight active TB patients were enrolled into a Treated UK 2011 Cohort.
[0023] Figures 2A-2F illustrate that a blood gene expression treatment response is readily detectable after only two weeks of treatment and independent of the pre-treatment signature. For Figure 2A, a profile plot of all detectable transcripts (16835) obtained without any filtering, in the treated active TB patients in the South Africa 201 1 cohort, including patients with missing time points, is presented. It can be seen that gene expression changes after just two weeks of treatment. For Figure 2B, 664 differentially expressed transcripts between untreated active and latent TB patients in the Untreated South Africa 2011 cohort were obtained by twofold change from the median and stringent statistical filtering (Mann Whitney, Bonferroni p<0.01). The heatmap shows dynamic change of gene expression in response to treatment in the Treated South Africa 201 1 cohort normalized to the median of all transcripts. Figure 2C illustrates Ingenuity Pathway Analysis (IP A) of the 664 transcripts and shows the top significant pathways. Figure 2D illustrates Interferon signaling pathway from the 664 list in IPA. Figure 2E illustrates that weighted molecular distance to health (MDTH) of the Treated South Africa 201 1 cohort significantly diminishes over treatment time (Friedman, Dunns, bars represent median & IQR, *** = pO.001 , ** = p<0.01 , * = p<0.05).
Figure 2F documents that temporal molecular response further shows significant and early changes in response to anti-TB treatment (ANOVA repeated measures, Tukeys, bars represent mean & SD).
[0024] Figures 3A-3F illustrate that a specific treatment response signature significantly diminishes at two weeks and two months after initiation of treatment and after completion of treatment. A specific TB treatment response signature was derived from significantly differentially expressed genes between untreated samples in the South Africa Active TB Training Set and their corresponding six month samples using 391 transcripts. Figure 3 A shows a heatmap of South Africa 2011 Active TB Training Set, normalised to the median of all transcripts, shows transcripts differentiating over time in response to treatment. Figure 3B illustrates that a temporal molecular response further shows significant and early changes in response to TB treatment in the Active TB Training Set (Repeated measures, Tukeys, bars represent mean & SD, *** = pO.001 , ** = pO.01, * = p<0.05). Figure 3C displays a heatmap of South Africa 201 1 Active TB Test Set, normalized to the median of all transcripts, and shows transcripts differentiating over time in response to treatment. Figure 3D illustrates that a temporal molecular response also shows in the Active TB Test Set significant and early changes, significantly after two weeks of initiation of treatment, in response to TB treatment. The present inventors have developed this Temporal Molecular Response Algorithm for quantifying an active TB patient's individual response to treatment; it facilitates, enables, and is of advantage for use in the clinical setting and in drug development clinical trials. Figure 3E shows the IPA of the 391 transcripts showing the most significant pathways. Figure 3F illustrates a Venn diagram that shows many overlapping genes between the active TB 664-transcript signature and the treatment-specific 391- transcript signature. [0025] Figures 4A-4B illustrate that each individual patient's transcriptional response (391 gene list) occurred at a variable rate for the 391 gene list, which represents differentially expressed genes derived from comparing the untreated expression profiles and their corresponding end-of-treatment (six months) expression profiles in the South Africa 201 1 Active TB Training Set. Figure 4A displays a heatmap of South Africa 201 1 cohort Active TB Training Set, normalized to the median of all transcripts, and shows hierarchical clustered transcripts differentiating over time per individual. Figure 4B illustrates that each patient's temporal molecular response diminishes in the Active TB Training Set cohort but at different rates.
[0026] Figures 5A-5C illustrate that change in treatment specific signature (391 gene list) is validated in an independent UK cohort. The 391 gene list is derived from the differentially expressed genes between the untreated and six month treated samples in the Treated South Africa 201 1 cohort. Figure 5 A displays a heatmap of the Treated UK 2011 Cohort, normalized to the median of all transcripts, and shows diminution of the treatment specific transcriptional signature in the UK cohort in response to successful anti-TB treatment. In Figure 5B, a temporal molecular response shows significant changes in response at two weeks in the UK cohort (linear mixed models, bars represent mean & SD, *** = pO.001, ** = pO.01, * = p<0.05). Figure 5C illustrates that a diminished response can be seen in each patient by his or her temporal molecular response with apparent different patient response rates.
[0027] Figure 6 illustrates that the changing transcriptional response is independent of the magnitude of the untreated transcriptional response. Weighted molecular distance to health (MDTH) during treatment has been shown to correlate with radiological extent of active TB disease (Berry et al, Nature 2010; 466:973-977). Figure 6 shows that MDTH of the 664- transcript signature does not significantly correlate with the temporal molecular treatment response at two weeks or two months compared to pre-treatment (Pearson's correlation, p<0.05), but does at six months and 12 months (Pearson's correlation, p<0.05). While the treatment response in Figure 5 correlates with cure by MDTH and Temporal Molecular Response, the treatment response rate cannot be predicted by the magnitude of the transcriptional response as measured by the MDTH before treatment.
[0028] Figures 7A-7B illustrate that individual patient's transcriptional responses occurred at a variable rate in an independently validated test set - the 391 gene list, differentially expressed genes derived from comparing the untreated expression profiles and their corresponding end-of-treatment (six months) expression profiles in the South Africa 201 1 Active TB Training Set. Figure 7A displays a heatmap of South Africa 201 1 cohort Active TB Test Set and shows hierarchical clustered transcripts normalised to the median of all transcripts, differentiating over time per individual. Figure 7B illustrates each patient's temporal molecular response in the South Africa 2011 cohort Active TB Test Set. [0029] Figures 8A-8C show that the Berry et al. (2010) 393 -transcript and 86-transcript TB signatures significantly diminish in response to successful treatment in the South Africa 201 1 Cohort. The 393 -transcript and 86-transcript signatures were defined as described (Berry et al., Nature 2010; 466:973-977) as differentiating active TB patients from latent TB
patients/healthy controls (393 signature), and differentiating active TB patients from patients with other inflammatory and infectious diseases (86 signature). Both signatures diminished in response to anti-TB treatment in the Treated South Africa 2011 cohort. Figure 8 A displays a heatmap that shows hierarchical clustering of the transcripts, normalized to the median of all transcripts, with samples grouped into time points. Figure 8B displays a heatmap that shows hierarchical clustering of the transcripts, normalized to the median of all transcripts, with samples grouped per individual. Figure 8C illustrates that temporal molecular response further shows significant and early changes in response to anti-TB treatment as early as two weeks after treatment initiation (ANOVA repeated measures, Tukeys, bars represent mean & SD, *** = p<0.001 , ** = p<0.01 , * = p<0.05).
[0030] Figure 9 illustrates the numbers enrolled, assigned to cohorts, and included in the analysis of a South Africa 2009 cohort. A total of 51 active and latent TB patients were enrolled into the South Africa 2009 Berry et al cohort {Nature 2010; 466:973-977). Forty- four of these patients were included in the Untreated South Africa 201 1 cohort, where they were additionally sampled and monitored post-treatment.
[0031] Figures 10A-10E illustrate that a change in active TB transcriptional signatures derived by identical analysis from the different cohorts is still observed and is significant after two weeks. The active TB transcriptional signatures were shown for each cohort as unsupervised hierarchical clustering between the untreated active and latent TB samples, then by Ingenuity Pathway Analysis (IP A), then by forced grouping of the samples showing diminishing of the transcriptional signature in response to treatment in a Treated South Africa 201 1 Cohort and lastly by the temporal molecular response. 2011 cohorts were processed on different Illumina HT12 BeadChip versions: V3 and V4. To compensate for this, the V3 probes were translated into V4 format; there are slightly fewer probes in V4 than V3. Transcripts were obtained by the same approach and unsupervised clustering showed distinct clustering of the active and latent TB samples in all three of the 2009 cohorts. IPA of the transcripts shows the most highly significant pathways contains IFN-signaling in all three cohorts. Figure 10A shows that for UK training set 2009, 565 transcripts in Illumina HT-12 V3 BeadChip, translates to 540 transcripts in Illumina HT-12 V4. Figure 10B shows that for UK test set 2009, 224 transcripts in Illumina HT-12 V3 BeadChip, translates to 214 transcripts in Illumina HT-12 V4 BeadChip. Figure IOC shows that for South Africa cohort 2009, 71 1 transcripts in Illumina HT-12 V3 BeadChip, translates to 684 transcripts in Illumina HT-12 V4 BeadChip. Figure 10D displays a Venn diagram comparing the active
TB transcriptional signatures from each 2009 cohort. Figure 10E displays a Venn diagram comparing: 1) all overlapping transcripts in > 2 segments of the Venn diagram in Figure 10D (344 transcripts in Illumina HT-12 V3 BeadChip, translates to 332 transcripts in Illumina HT- 12 V4); 2) the South Africa 201 1 active TB 664-transcript signature; and 3) the South Africa 201 1 treatment specific 391 -transcript signature. Regardless of how this host blood transcriptional signature was derived it was significantly changed after two weeks post initiation of successful drug treatment.
[0032] Figures 1 1 A-l IB. South Africa: As illustrated in Figure 1 1A, a total of 67 active and latent TB patients were enrolled into an untreated South Africa 2011 Cohort. A total of 29 active TB patients were included in a treated South Africa 2011 Cohort. Fifteen were randomised into an Active TB Training Set and fourteen into an Active TB Test Set. UK: As illustrated in Figure 1 IB, a total of eight active TB patients were enrolled into the treated UK 2011 Cohort. See also Figure 1 at doi:10.1371/journal.pone.0046191.g001 (Bloom et al. 2012 "Detectable changes in the blood transcriptome are present after two weeks of antituberculosis therapy," PLOS ONE 7( 10) : e46191 ).
[0033] Figures 12A-12C. Active TB signatures of Berry et al (2010) also significantly diminish in response to successful treatment. 393 -transcript and 86-transcript signatures were defined as described (Reis-Filho and Pusztai 201 1 ; Lancet 378: 1812-1823) differentiating active TB patients from latent TB patients/healthy controls (393 signature), and differentiating active TB patients from patients with other inflammatory and infectious diseases (86 signature). Both signatures diminished in response to anti-TB treatment in the treated South Africa 201 1 cohort. Heatmap of Figure 12A displays hierarchical clustering of the transcripts, normalised to the median of all transcripts, with samples grouped into time points. Heatmap of Figure 12B displays hierarchical clustering of the transcripts, normalised to the median of all transcripts, with samples grouped per individual. In Figure 12C, temporal molecular response further shows significant and early changes in response to anti- TB treatment (linear mixed models, bars represent mean & 95% confidence intervals, *** = pO.001 , ** = p<0.01, * = p<0.05). Summary of demographics and clinical data include, as in Figure 1 1A, for a South Africa 201 1 cohort: Of the 29 untreated active TB patients, 16 were also included in the previous Berry et al (2010) study, and, of the 38 untreated latent TB patients, 17 were also included in the previous Berry et al. (2010) study. For the study results of Figure 12A-12C, all untreated samples were processed again alongside all the other
samples. The UK 201 1 cohort is as described in Figure 1 IB. See also Supporting Figure 3 at doi:10.1371/journal.pone.0046191.g001 (Bloom et al. 2012).
[0034] Figures 13A-13E. A blood transcriptional response is detectable after two weeks of treatment. In Figure 13 A, a profile plot of a set of all detectable transcripts (15837), obtained without any filtering, in the treated active TB patients in the South Africa 201 1 cohort is displayed. It can be seen that gene expression changes after just two weeks of treatment. In the heatmap of Figure 13B, 664 differentially expressed transcripts, between untreated active and latent TB patients in the untreated South Africa 2011 cohort, were obtained by twofold change from the median and stringent statistical filtering (Mann Whitney, Bonferroni p<0.01). The heatmap shows the dynamic change of gene expression in response to treatment in the treated South Africa 201 1 cohort normalised to the median of all transcripts. In previously presented Figure 2C, Ingenuity Pathway Analysis (IP A) of the 664 transcripts shows the top significant pathways. In Figure 2D, an Interferon signaling pathway from the 664 list in IP A is shown. In Figure 13C, weighted molecular distance to health (MDTH) of a treated South Africa 2011 cohort shows the signature significantly diminishes over time (linear mixed models, bars represent median & IQR, *** = pO.001, ** = pO.01, * = p<0.05). As shown in Figure 13D, temporal molecular response further shows significant and early changes in response to anti-TB treatment (linear mixed models, bars represent mean & 95% confidence intervals). See also Figure 2 at doi: 10.1371/journal.pone.0046191.g002 (Bloom et al. 2012).
[0035] Figures 14A-14B. Individual patient's transcriptional response occurred at a variable rate. For 320 gene list, differentially expressed genes derived from comparing the untreated expression profiles and their corresponding end-of-treatment (six months) expression profiles in the South Africa 201 1 Active TB Training Set are evidenced. Heatmap of Figure 14A is of South Africa 2011 cohort Active TB Test Set and shows hierarchical clustered transcripts normalised to the median of all transcripts, differentiating over time per individual. Diagrams of Figure 14B illustrate each patient's temporal molecular response in the South Africa 201 1 cohort Active TB Test Set. See also Supporting Figure 2 at doi: 10.1371/journal.pone.0046191.g001 (Bloom et al. 2012). [0036] Figure 15. The changing transcriptional response is independent of the magnitude of the untreated transcriptional signature. MDTH has been shown to correlate with radiological extent of active TB disease (see ref. [11] of Example 2). The magnitude of the patient's temporal molecular response during treatment, at both two weeks and two months,
did not correlate with the magnitude of their untreated transcriptional signature, as evidenced measured by MDTH (linear regression r <0.25, p>0.01). However, the patient's temporal molecular response after treatment, at six months and 12 months, did significantly correlate
2 2
with his or her untreated MDTH (linear regression r =0.32, p=0.003 and r =0.38, p=0.0004, respectively). See also Supporting Figure 1 at doi: 10.1371/journal.pone.0046191.g001 (Bloom et al. 2012).
[0037] Figures 16A-16F. Specific treatment response signature significantly diminishes at two weeks and onwards. A specific TB treatment response signature of 320 transcripts was derived from significantly differentially expressed genes between untreated samples in the South Africa Active TB Training Set and their corresponding six month samples. Heatmap of Figure 16A represents South Africa 2011 Active TB Training Set, normalised to the median of all transcripts, and shows transcripts differentiating over time in response to treatment. Figure 16B displays corresponding temporal molecular response that further shows significant and early changes in response to TB treatment in the Active TB Training Set (linear mixed models, bars represent mean & 95% confidence intervals, *** = pO.001, ** = pO.01, * = p<0.05). Heatmap of Figure 16C represents South Africa 201 1 Active TB Test Set, normalised to the median of all transcripts, and shows transcripts differentiating over time in response to treatment. Figure 16D displays corresponding temporal molecular response that also shows in the Active TB Test Set significant and early changes in response to TB treatment. Figure 16E summarizes IPA of the 320 transcripts showing the most significant pathways. Figure 16F is a Venn diagram showing many overlapping genes between the active TB 664-transcript signature and the treatment specific 320-signature. See also Figure 3 at doi:10.1371/journal.pone.0046191.g003 (Bloom et al. 2012).
[0038] Figures 17A-17B. Individual patient's transcriptional response occurred at a variable rate. Figures 17-17B concerns the 320 gene list and differentially expressed genes derived from comparing the untreated expression profiles and their corresponding end-of- treatment (six months) expression profiles in a South Africa 201 1 Active TB Training Set.
Heatmap of Figure 17A is of South Africa 2011 cohort Active TB Training Set, normalised to the median of all transcripts, and shows hierarchical clustered transcripts differentiating over time per individual. For Figure 17B, each patient's temporal molecular response diminishes in the Active TB Training Set cohort. See also Figure 4 at doi: 10.1371/journal.pone.0046191.g004 (Bloom et al. 2012).
[0039] Figures 18A-18C. Change in treatment specific signature is validated in an independent UK cohort. Figures 18A-18C concern the 320 gene list and differentially expressed genes between the untreated and six-month treated samples in the treated South Africa 201 1 cohort. Heatmap of Figure 18A is of the treated UK 201 1 Cohort, normalised to the median of all transcripts, and shows diminution of the treatment specific transcriptional signature in the UK cohort in response to successful anti-TB treatment. For Figure 18B, the temporal molecular response shows significant changes at two weeks in the UK cohort (linear mixed models, bars represent mean & 95% confidence intervals, *** = pO.001, ** = p<0.01, * = p<0.05). In Figure 18C, a diminished response can be seen in each patient by their temporal molecular response. See also Figure 5 at doi:10.1371/journal.pone.0046191. g005 (Bloom et al. 2012).
[0040] Figures 19, 20, and 21 provide heatmaps and corresponding temporal molecular response data for Patient ID 2208, Patient ID 2220, and Patient ID 2232, respectively, for 320, 86, and 393 transcript lists. Figures 19, 20, and 21 also provide summaries of clinical symptoms for Patient ID 2208, Patient ID 2220, and Patient ID 2232, respectively.
[0041] Table 1 lists genes present in the top significantly represented canonical pathways of Ingenuity Pathway Analysis in the 664 transcript list from an Untreated South Africa 201 1 Cohort.
[0042] Summaries of demographics and clinical data are provided in Table 2A, a South African 2011 cohort, and Table 2B, a UK 201 1 cohort.
[0043] Table 3 lists genes present in the top significantly represented canonical pathways of Ingenuity Pathway Analysis in active TB transcriptional signatures of 2009 UK and South Africa cohorts.
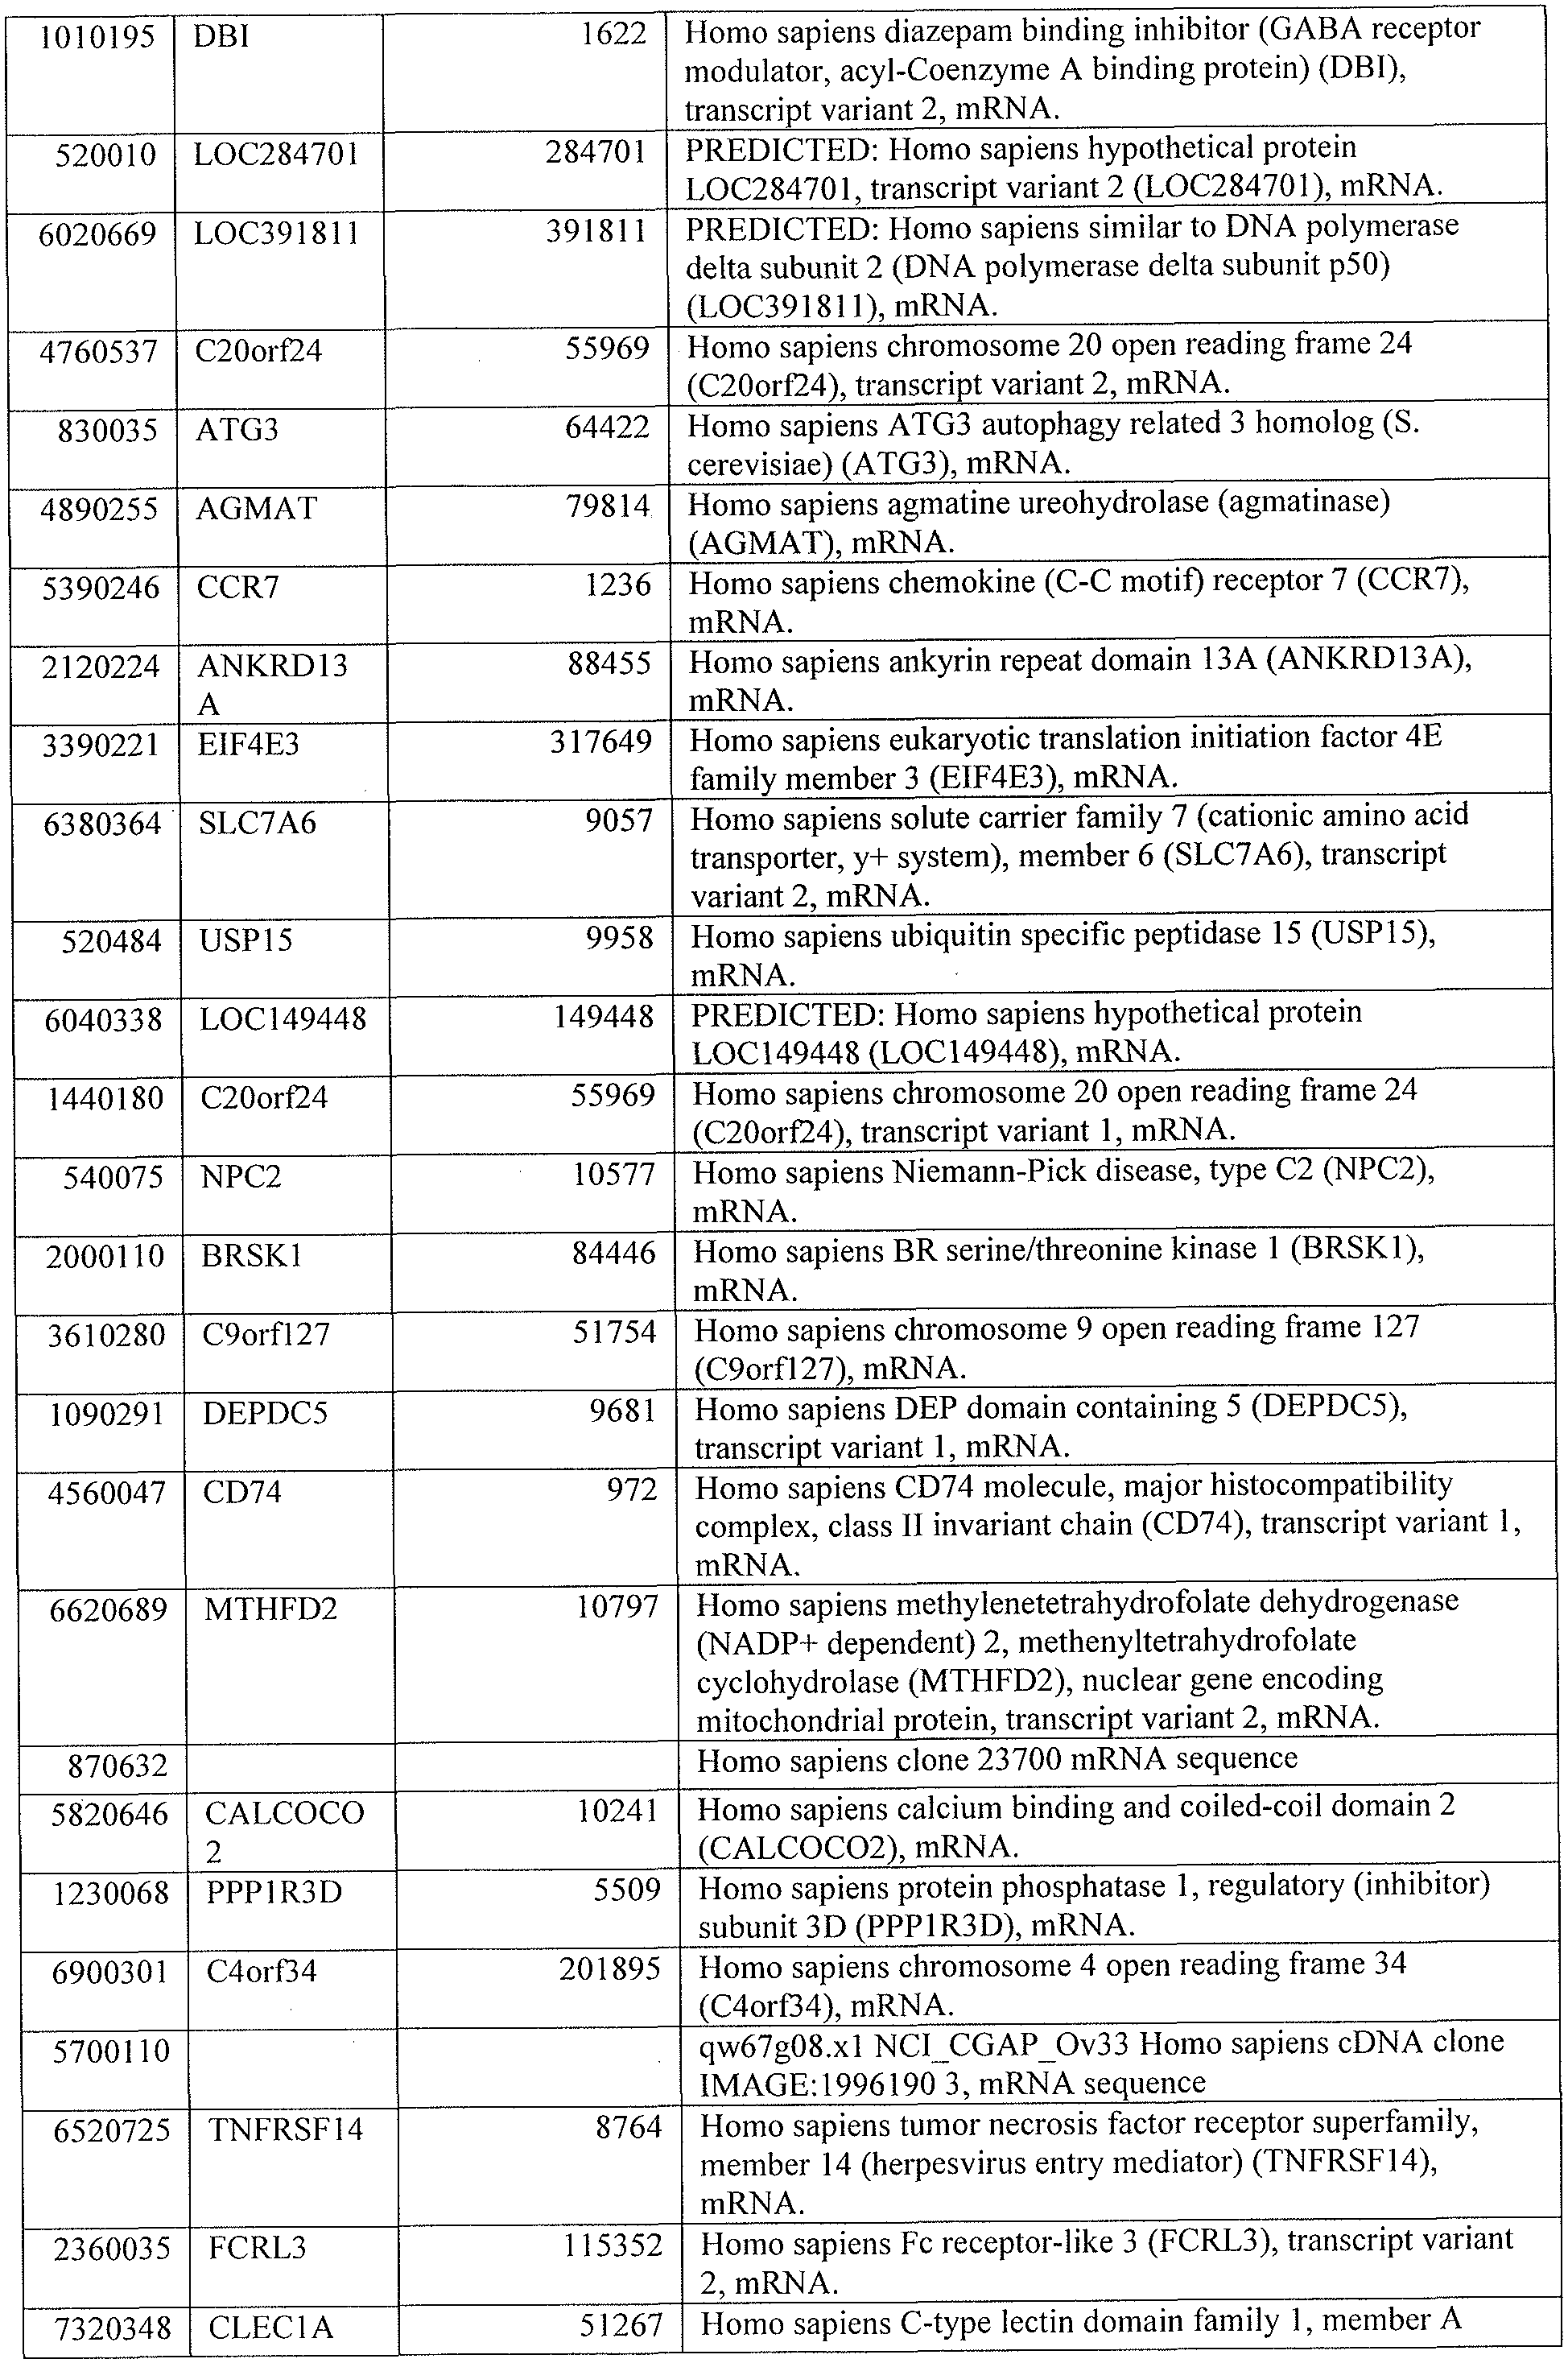
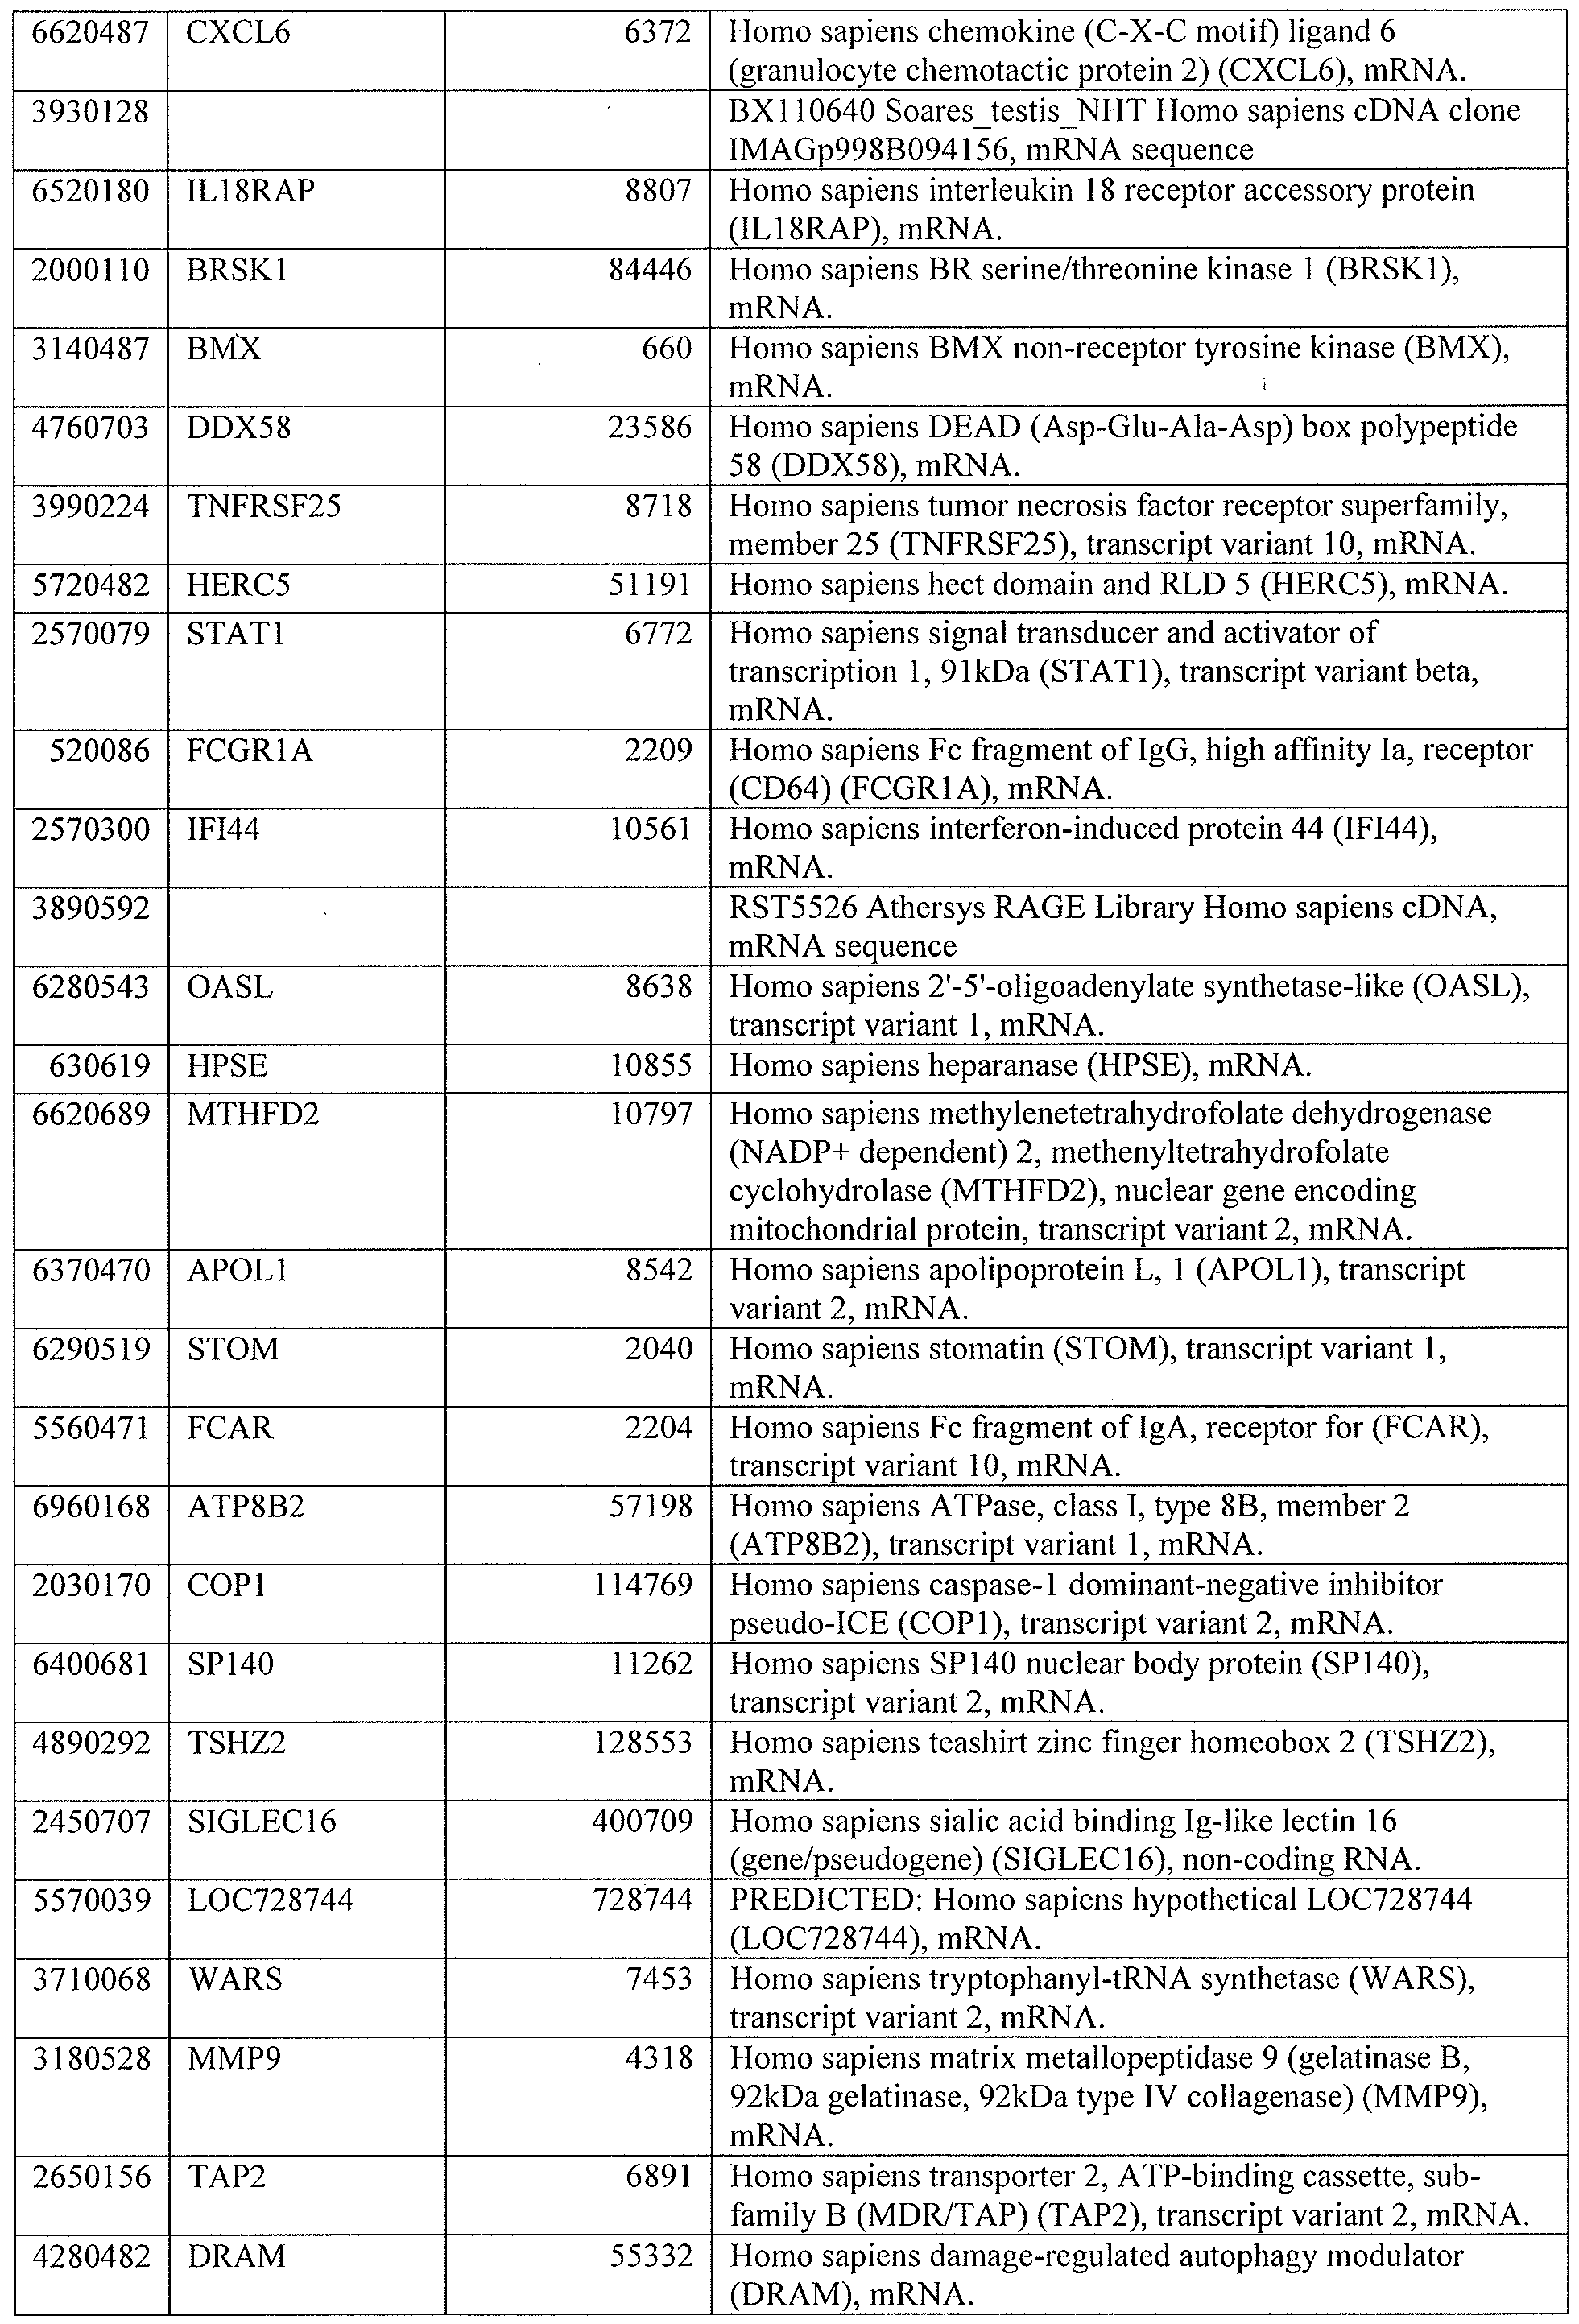
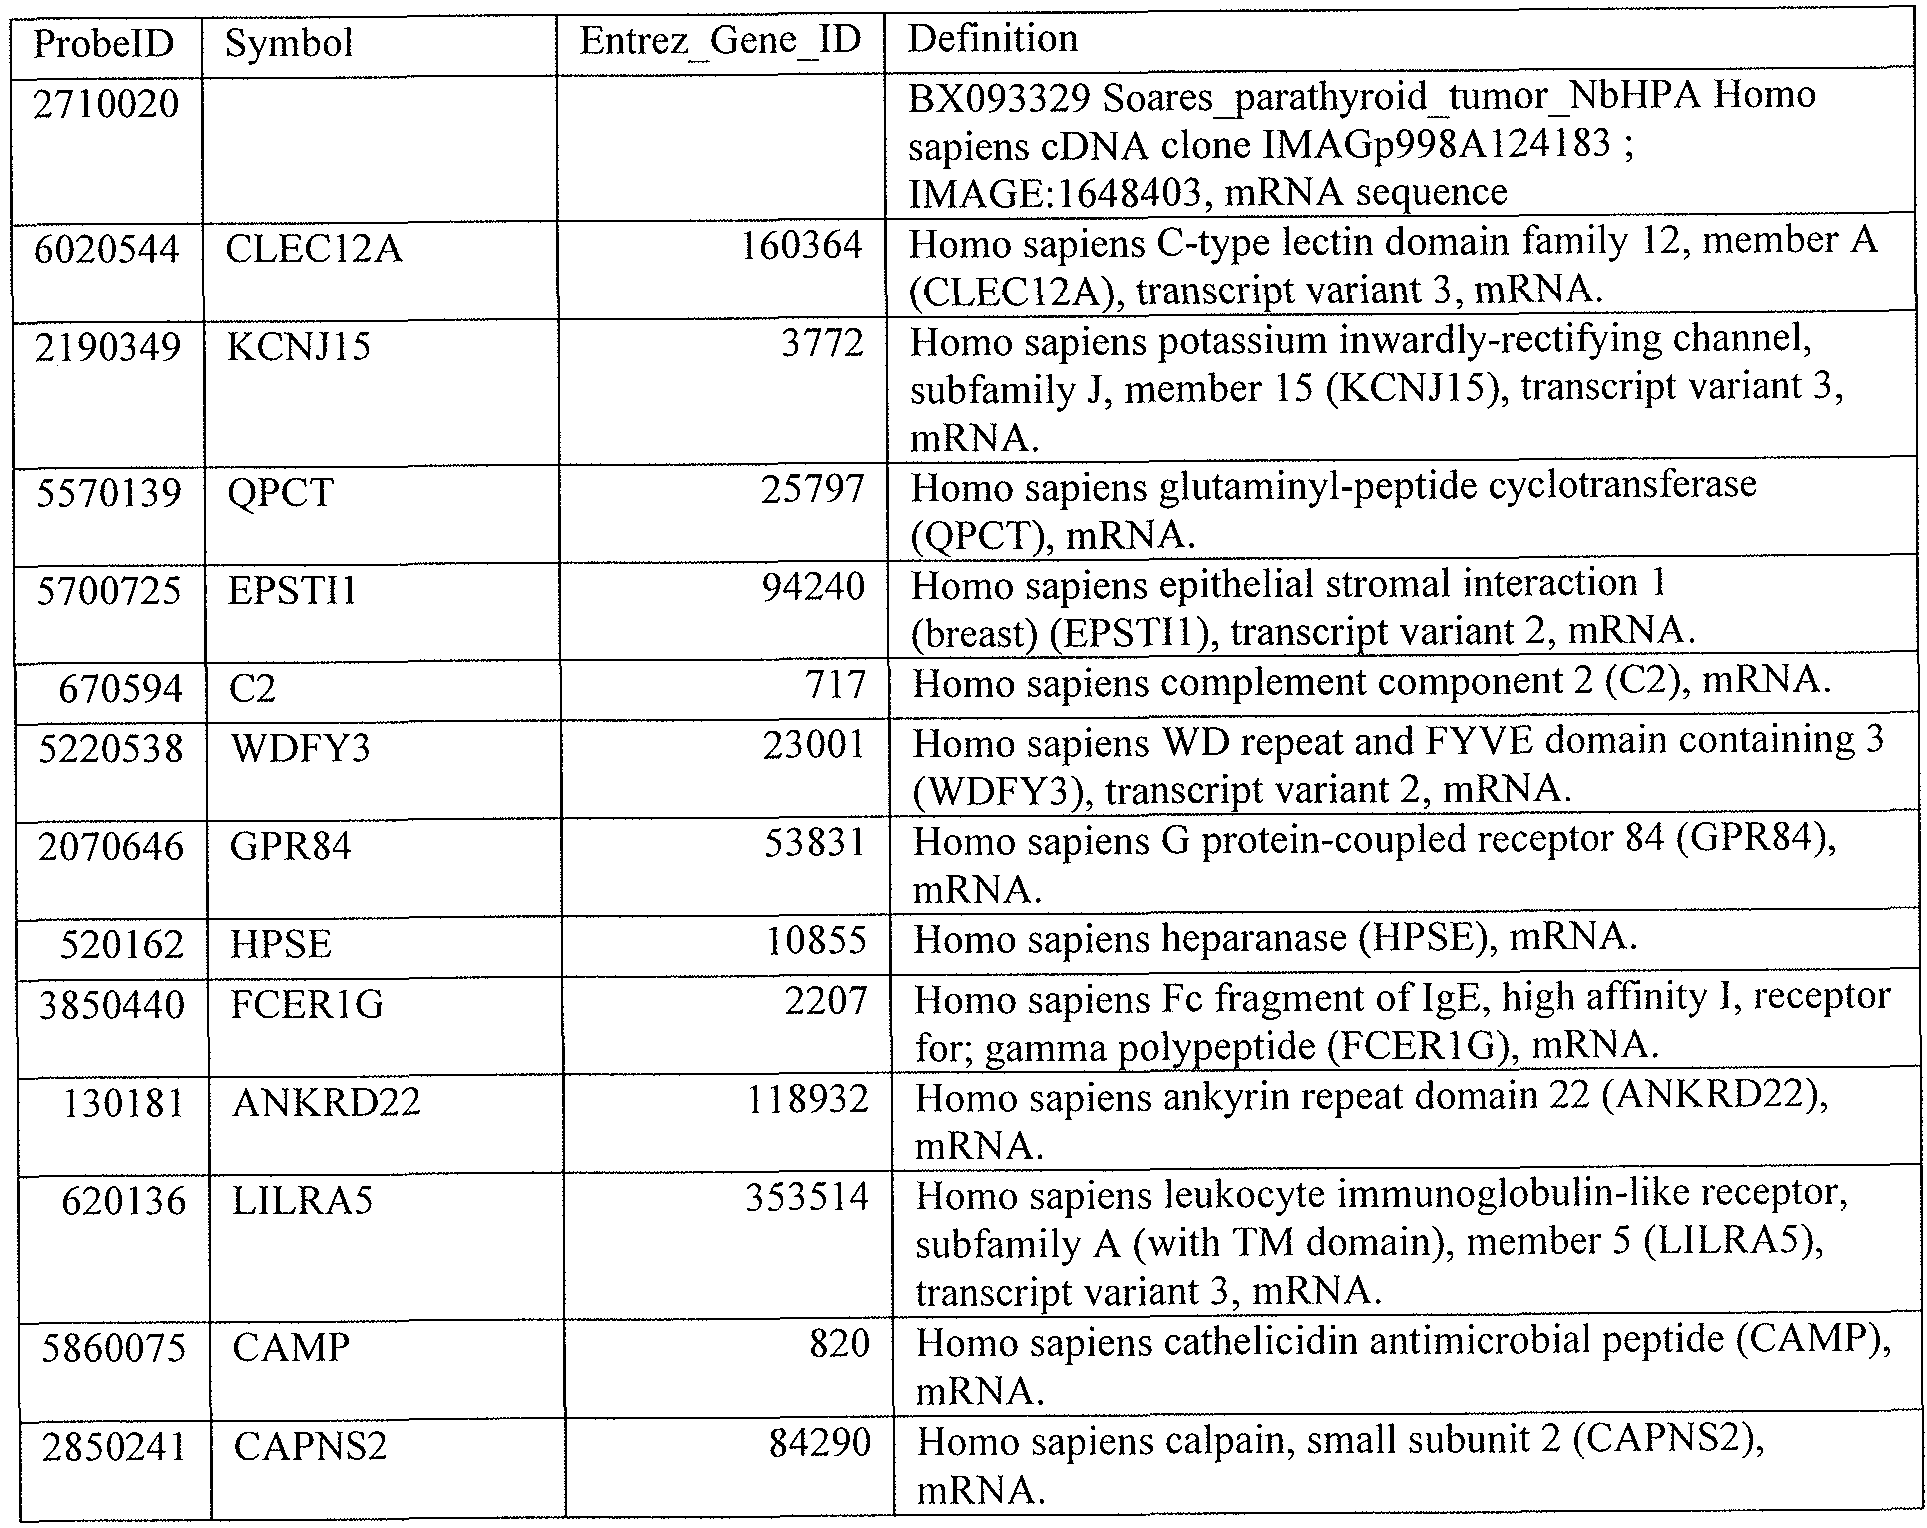
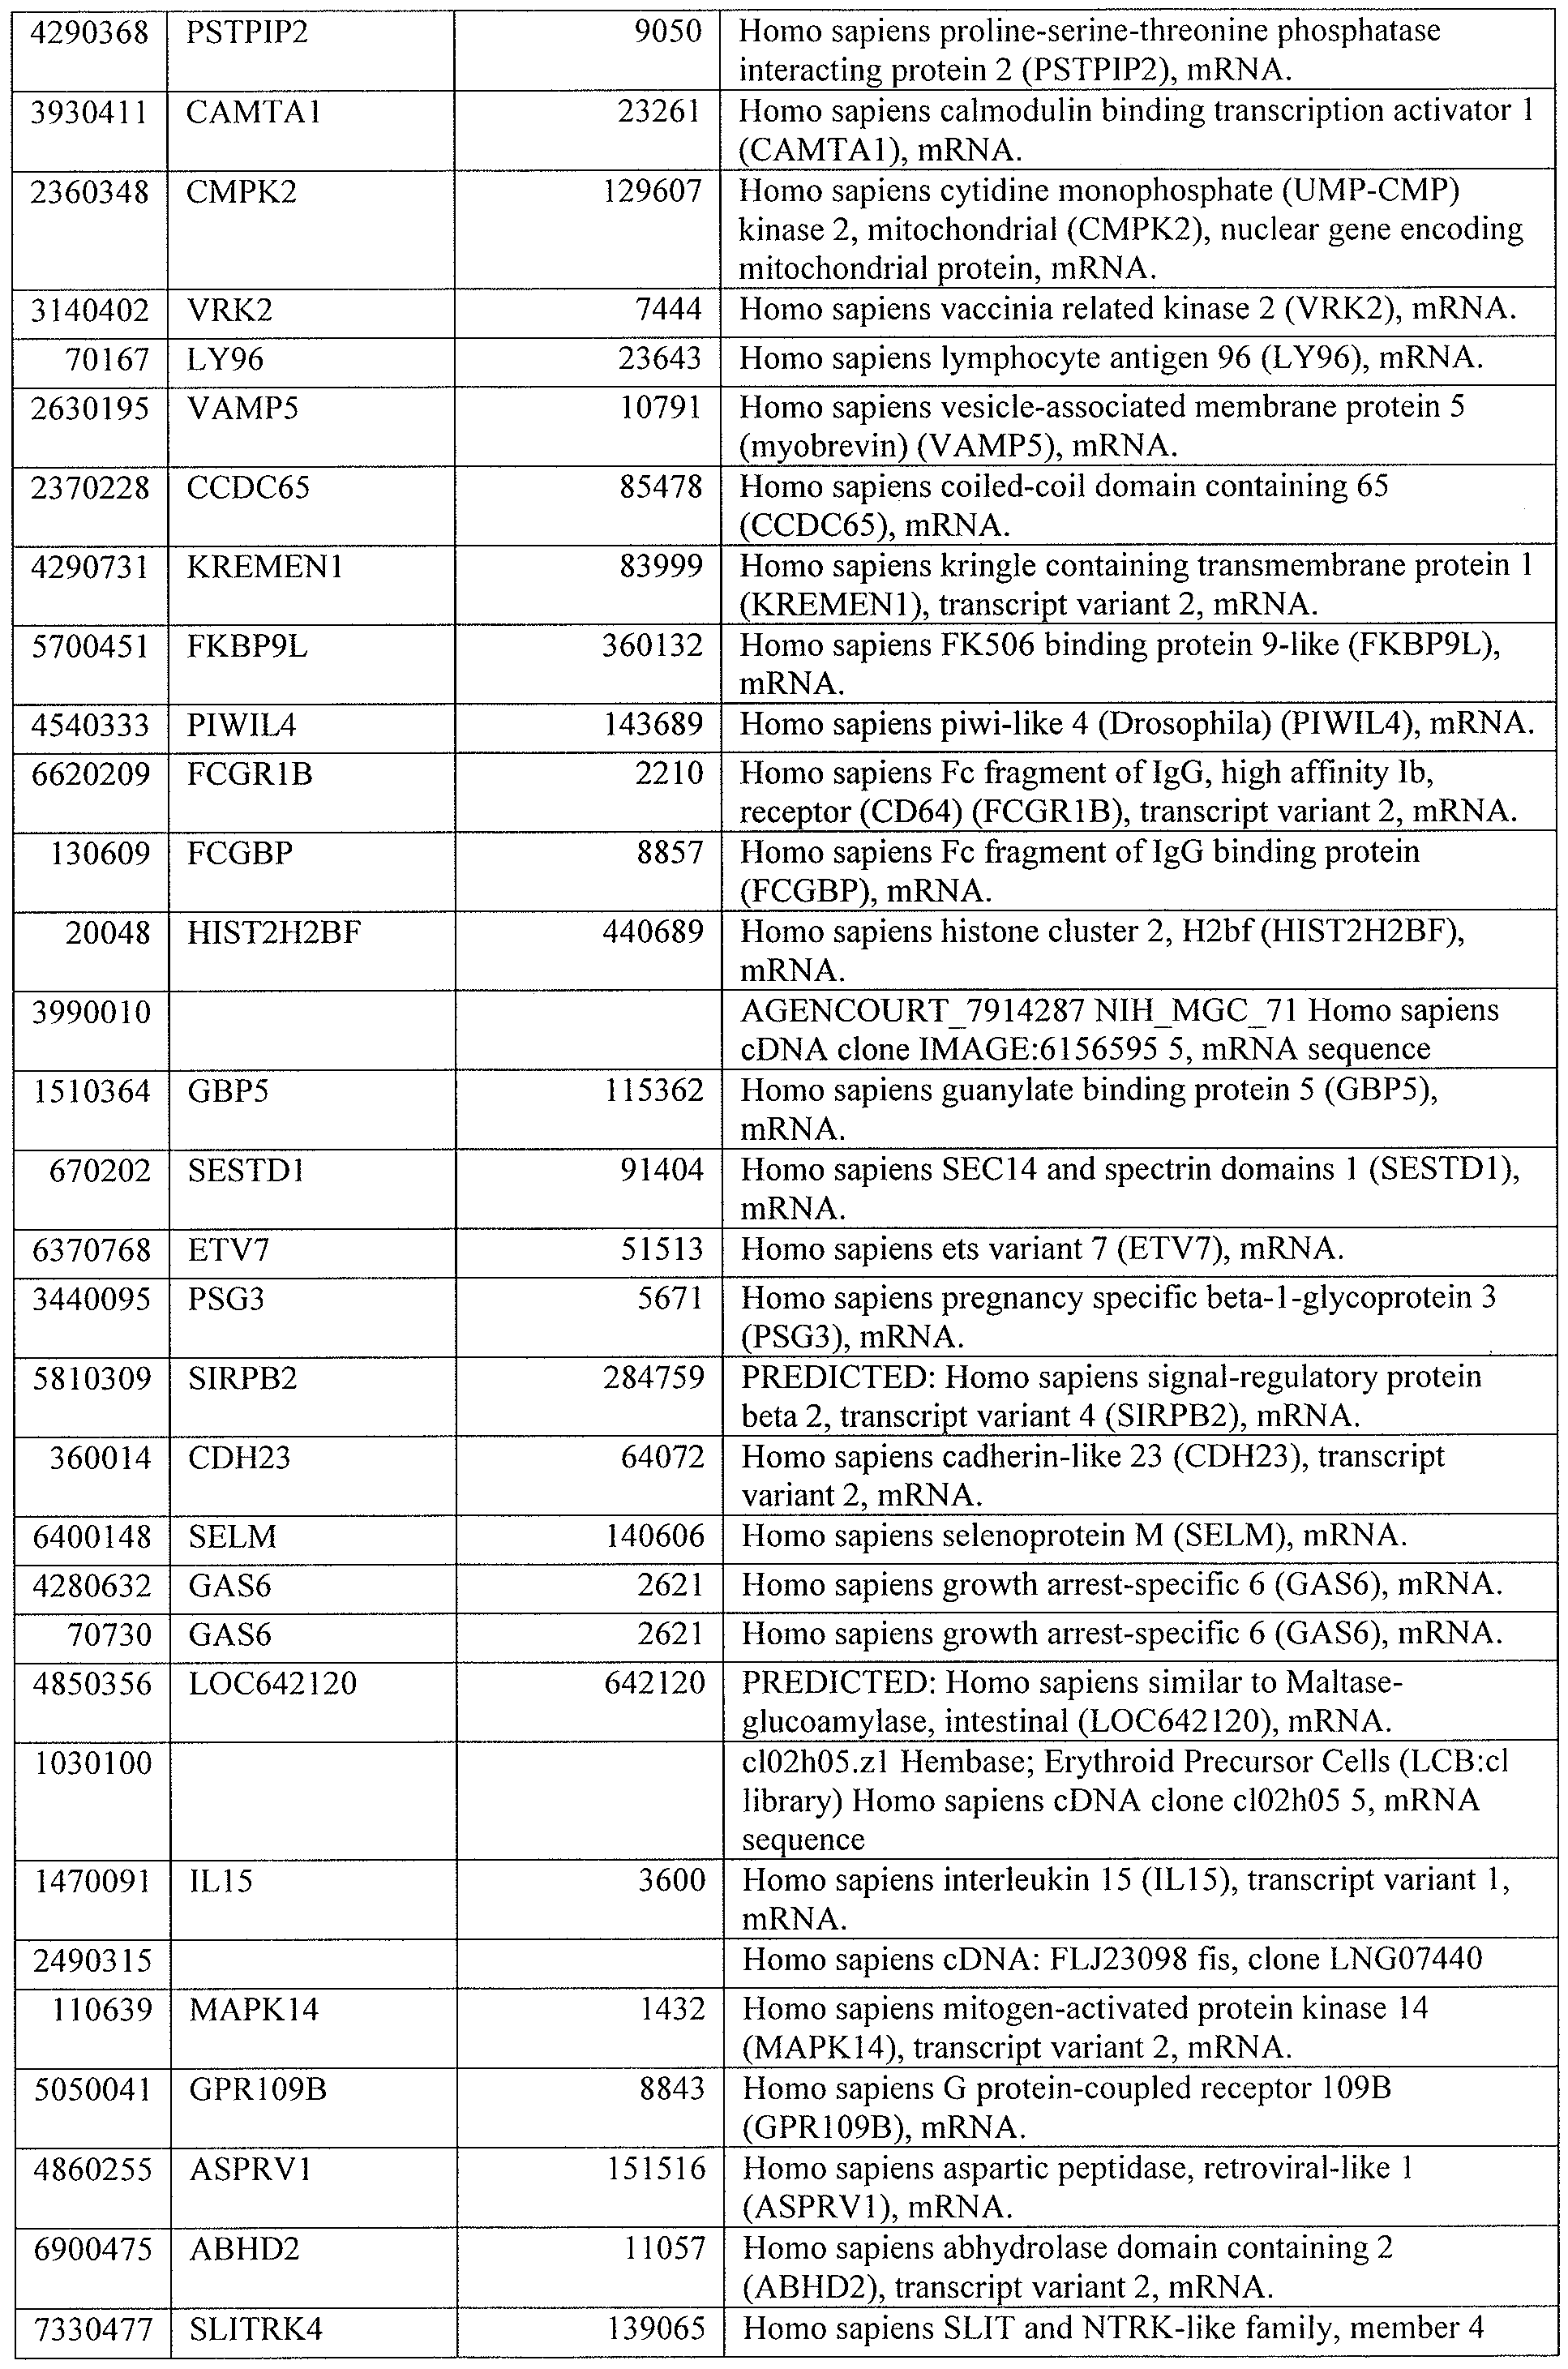
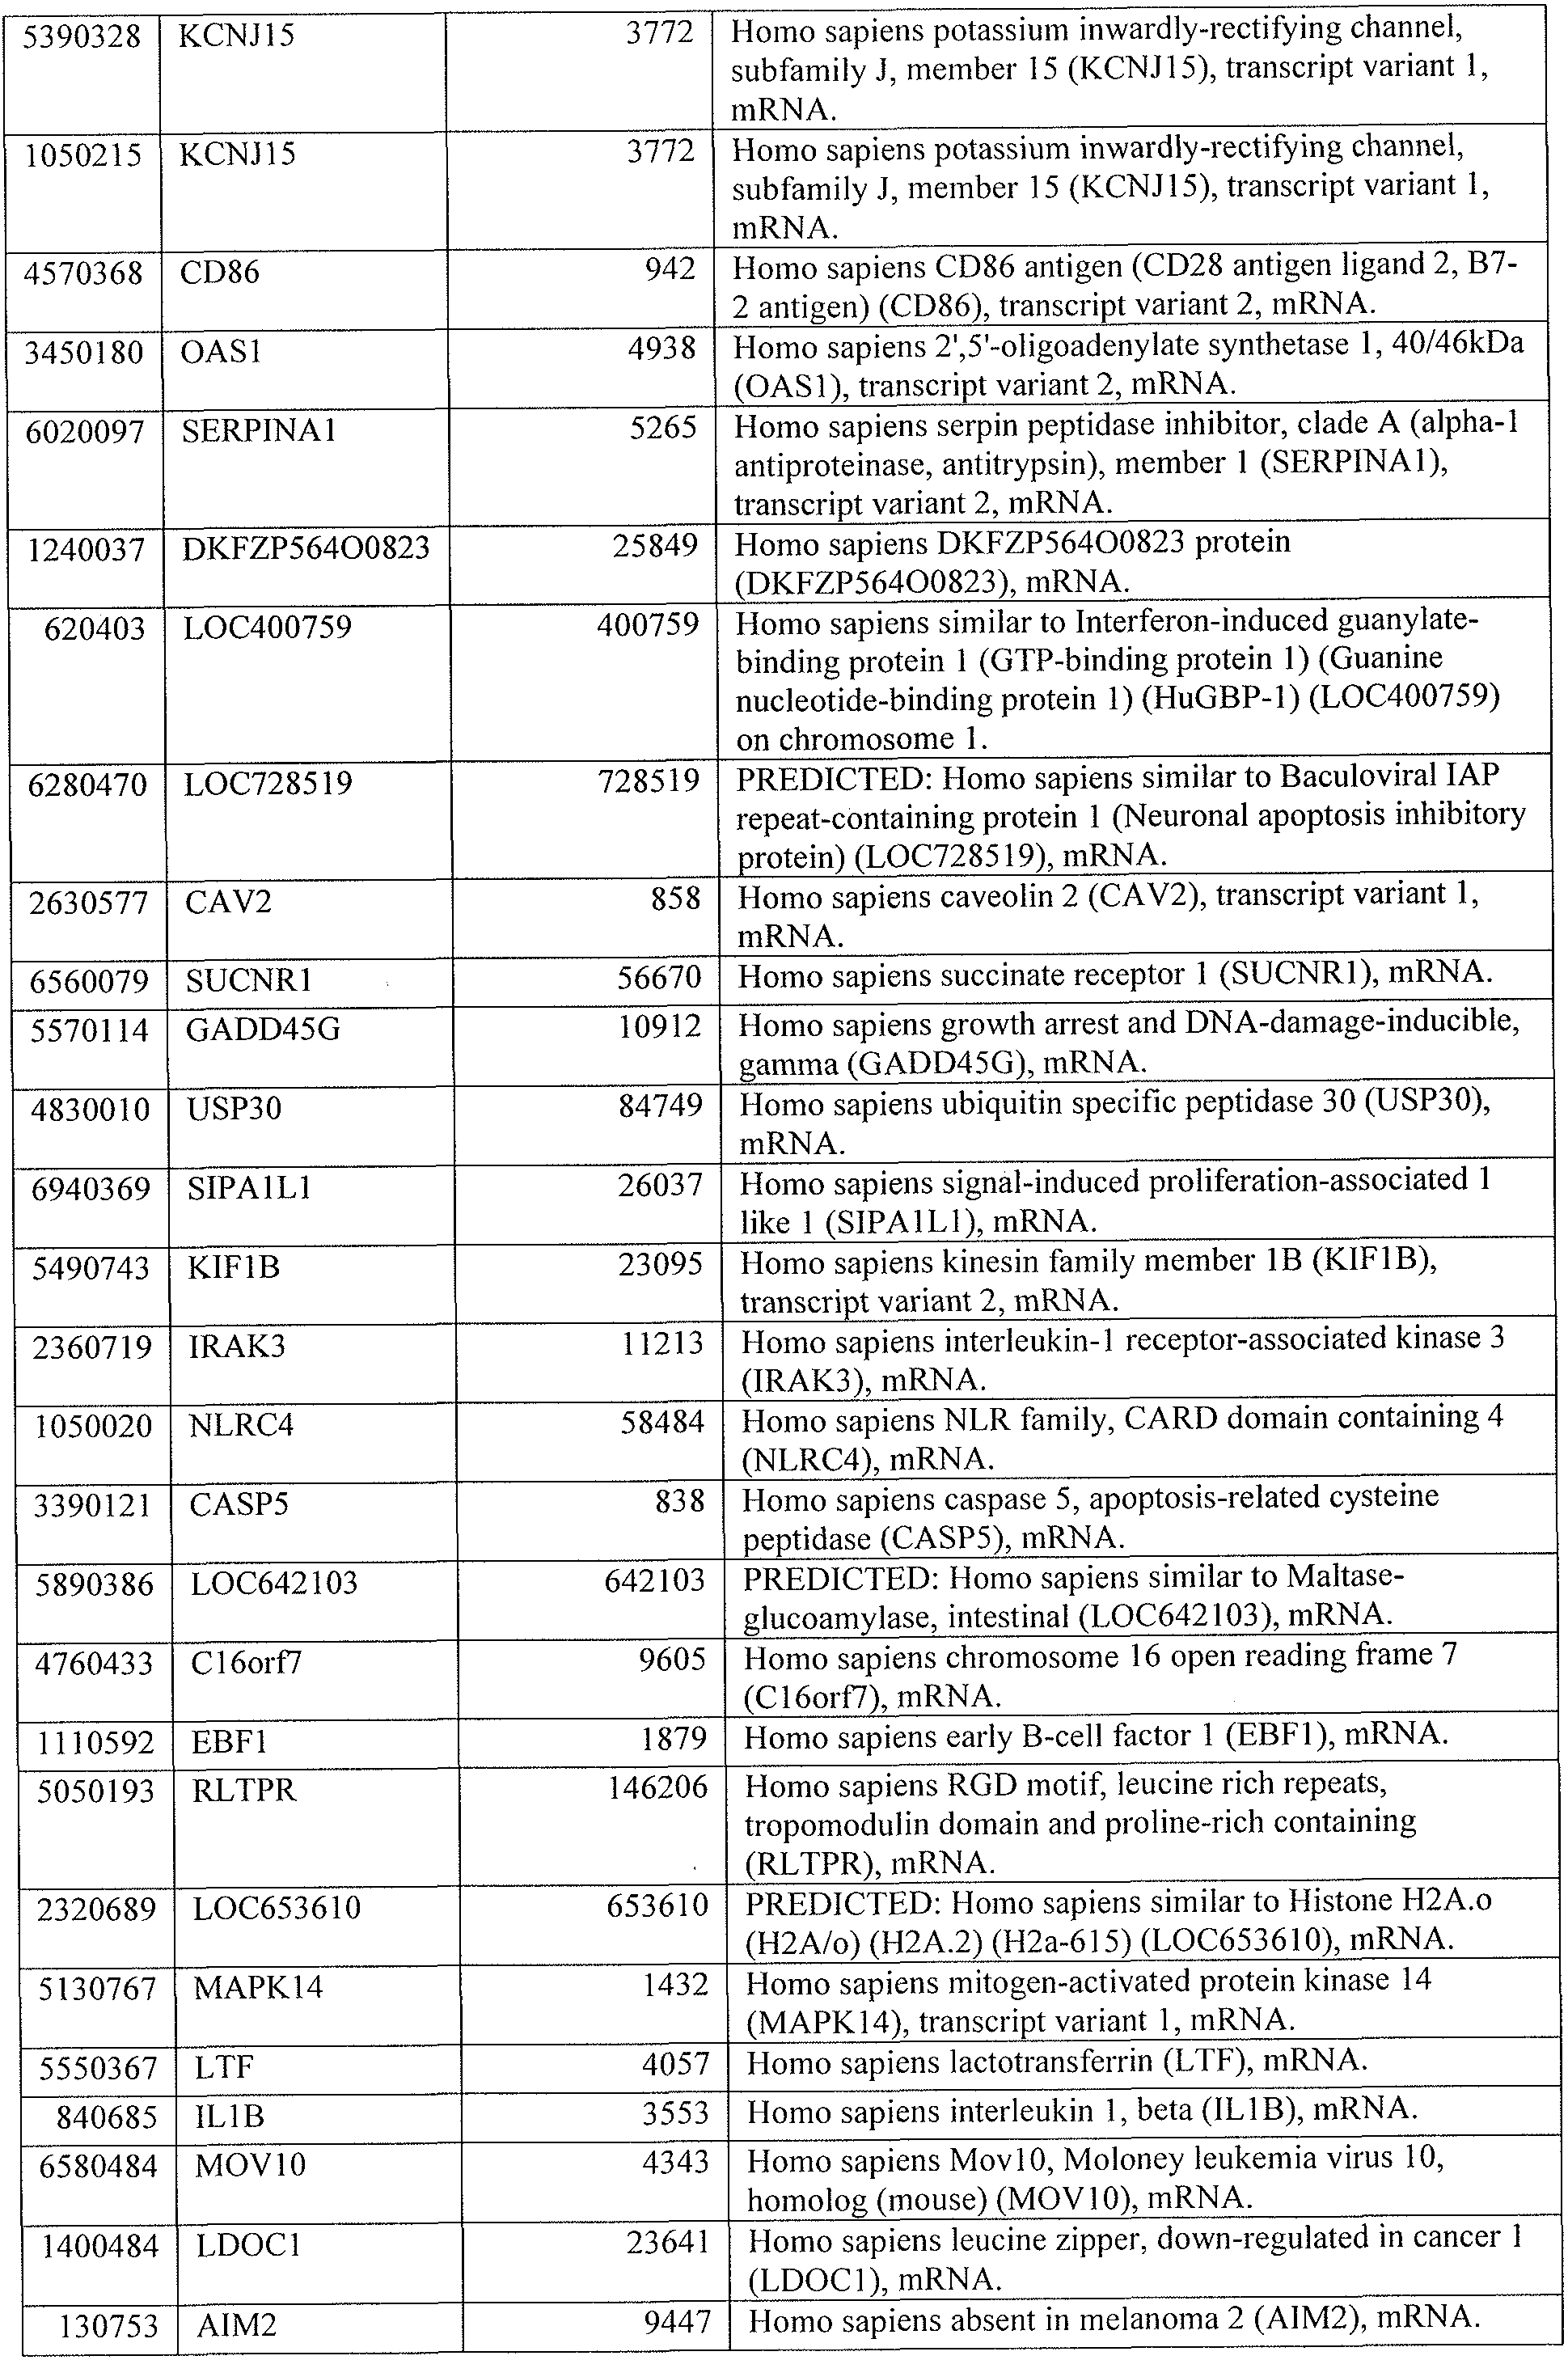
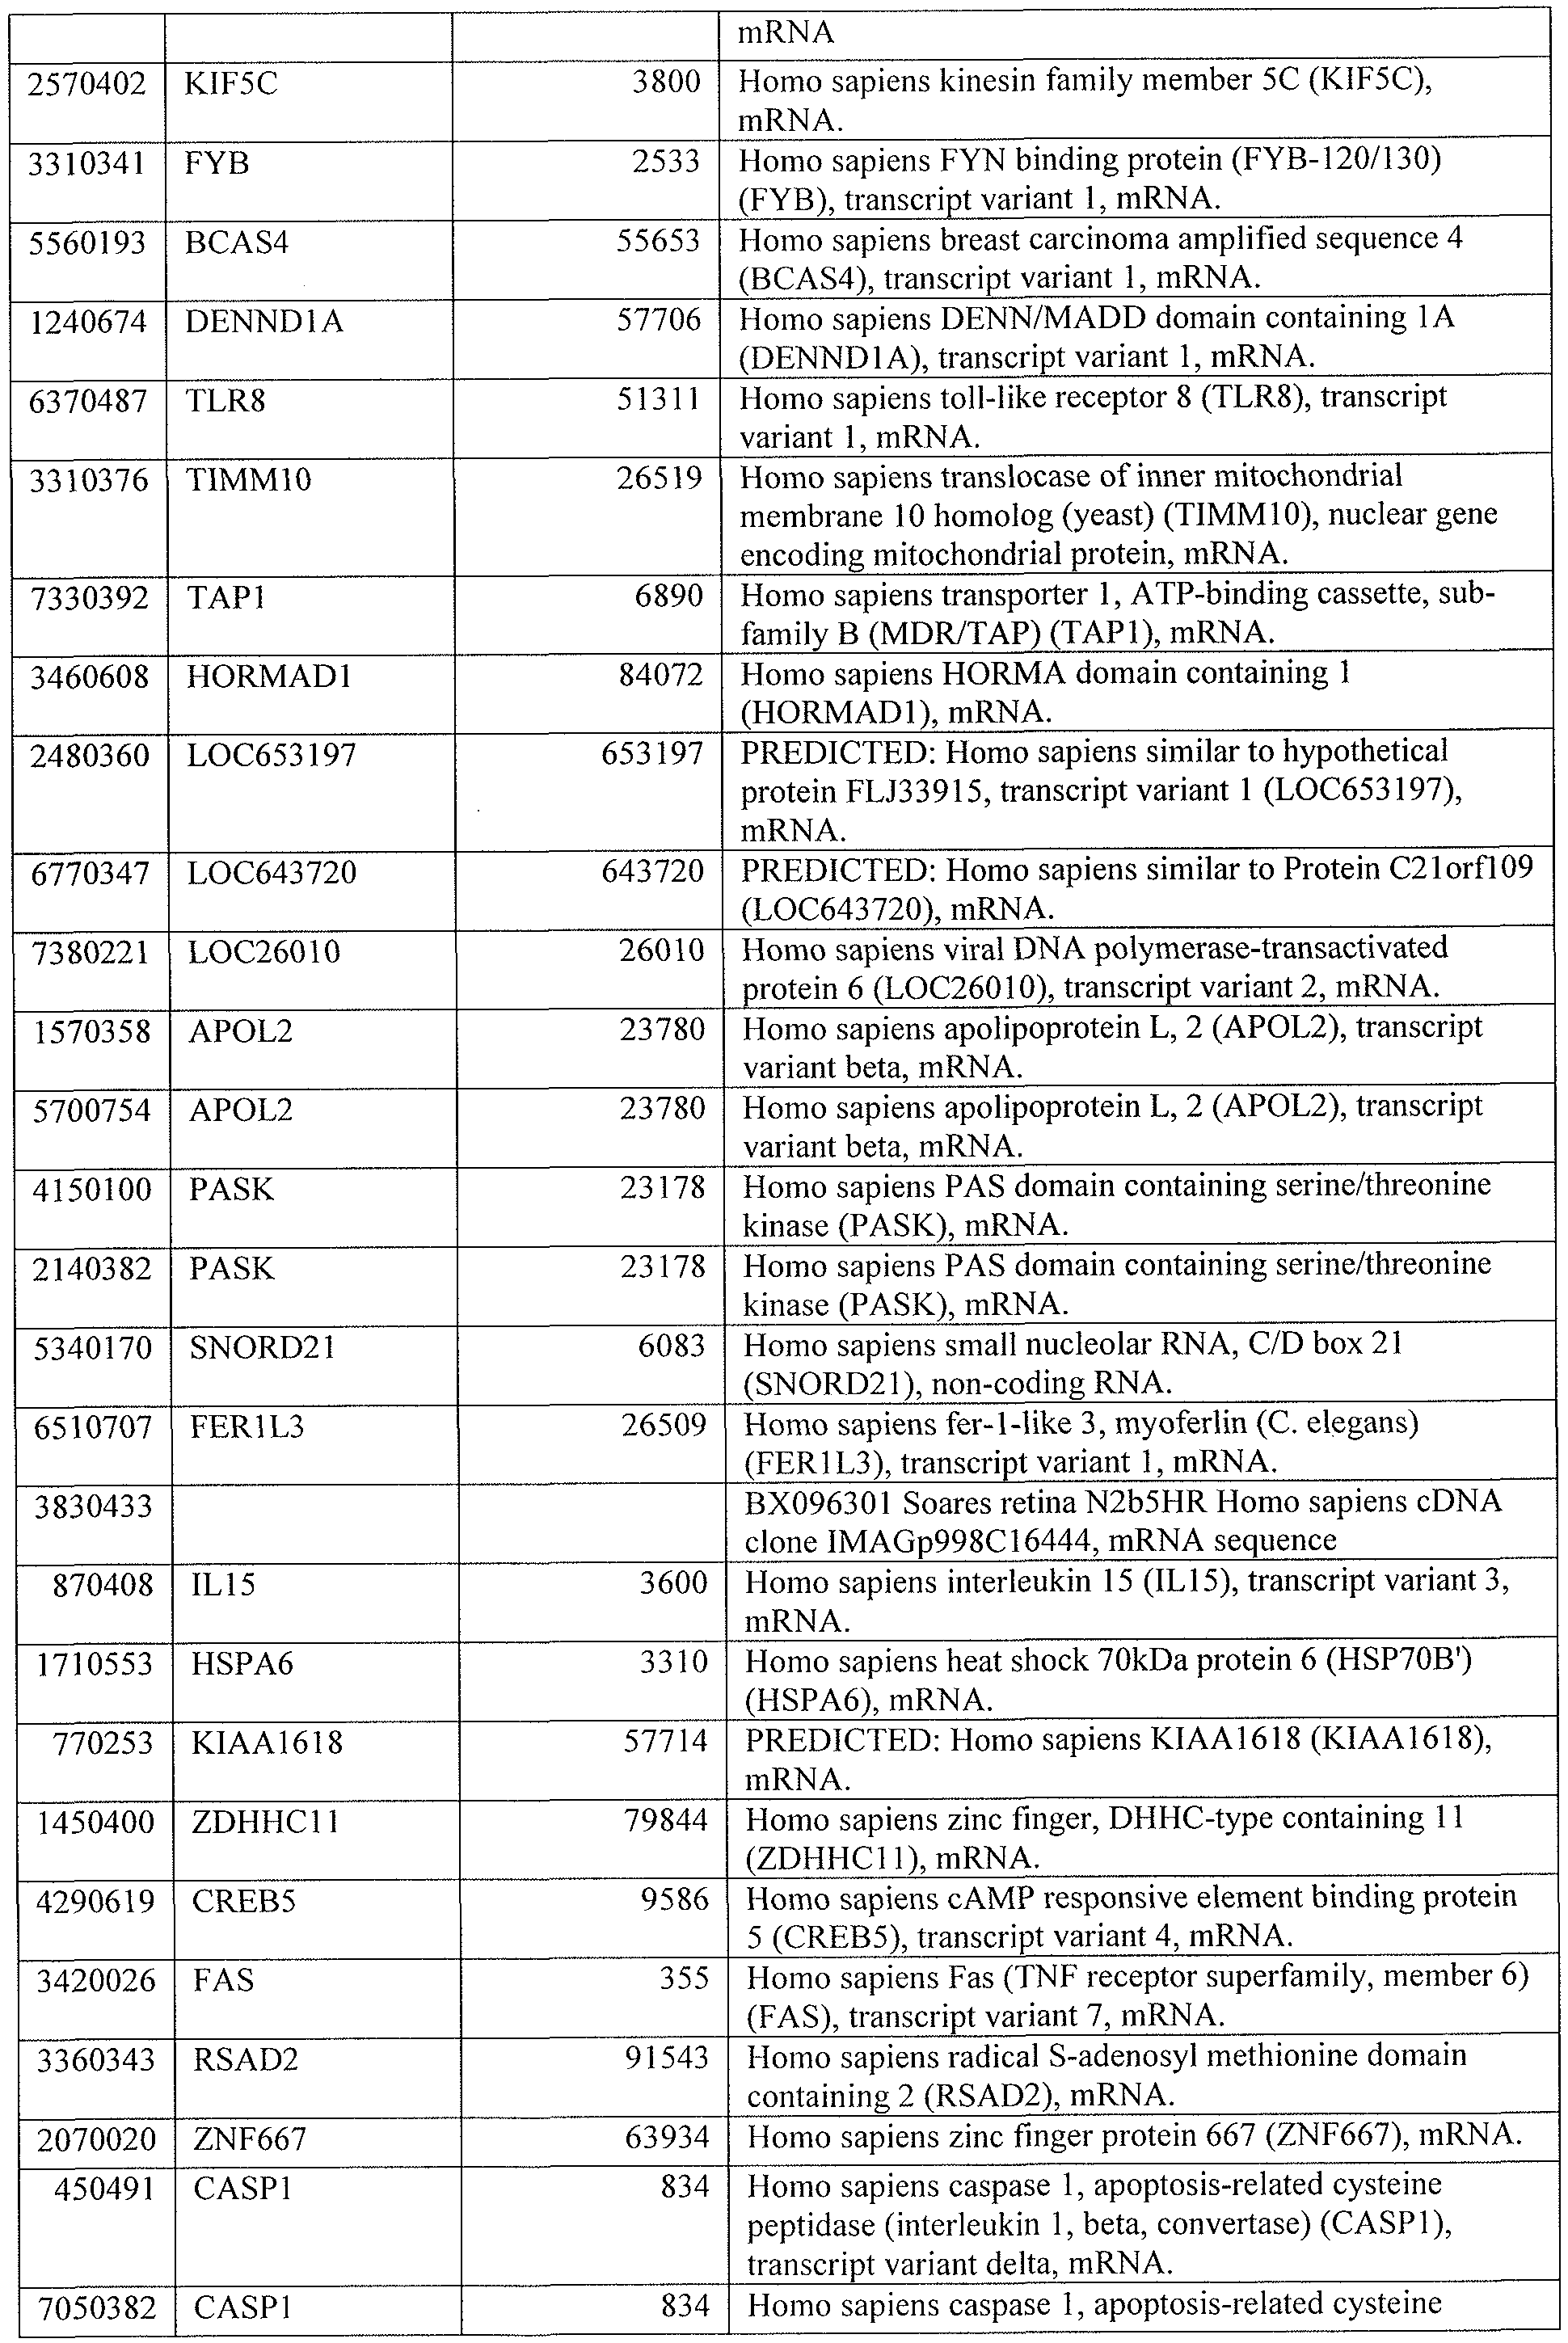
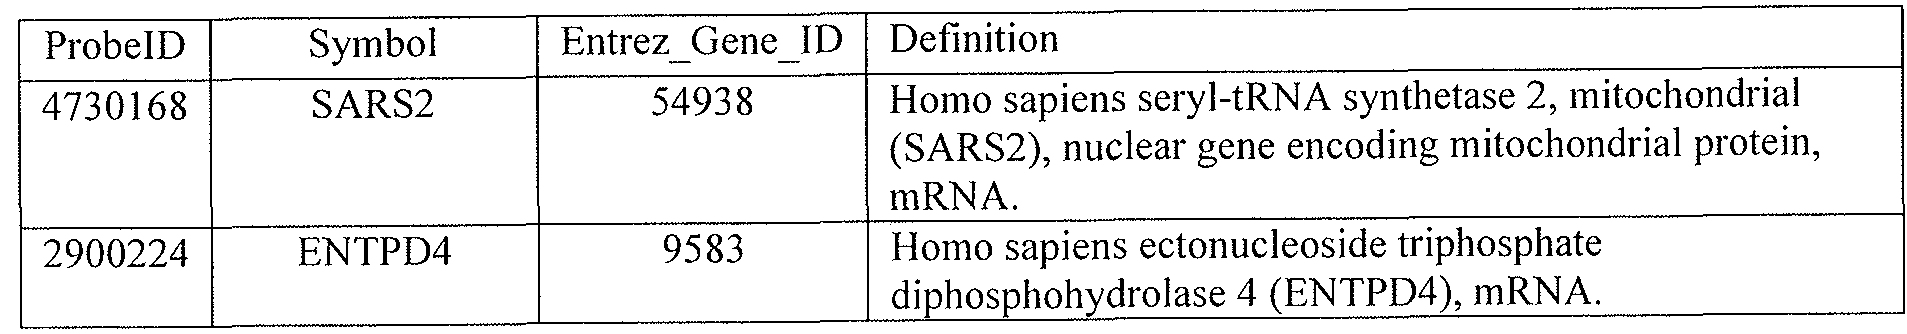
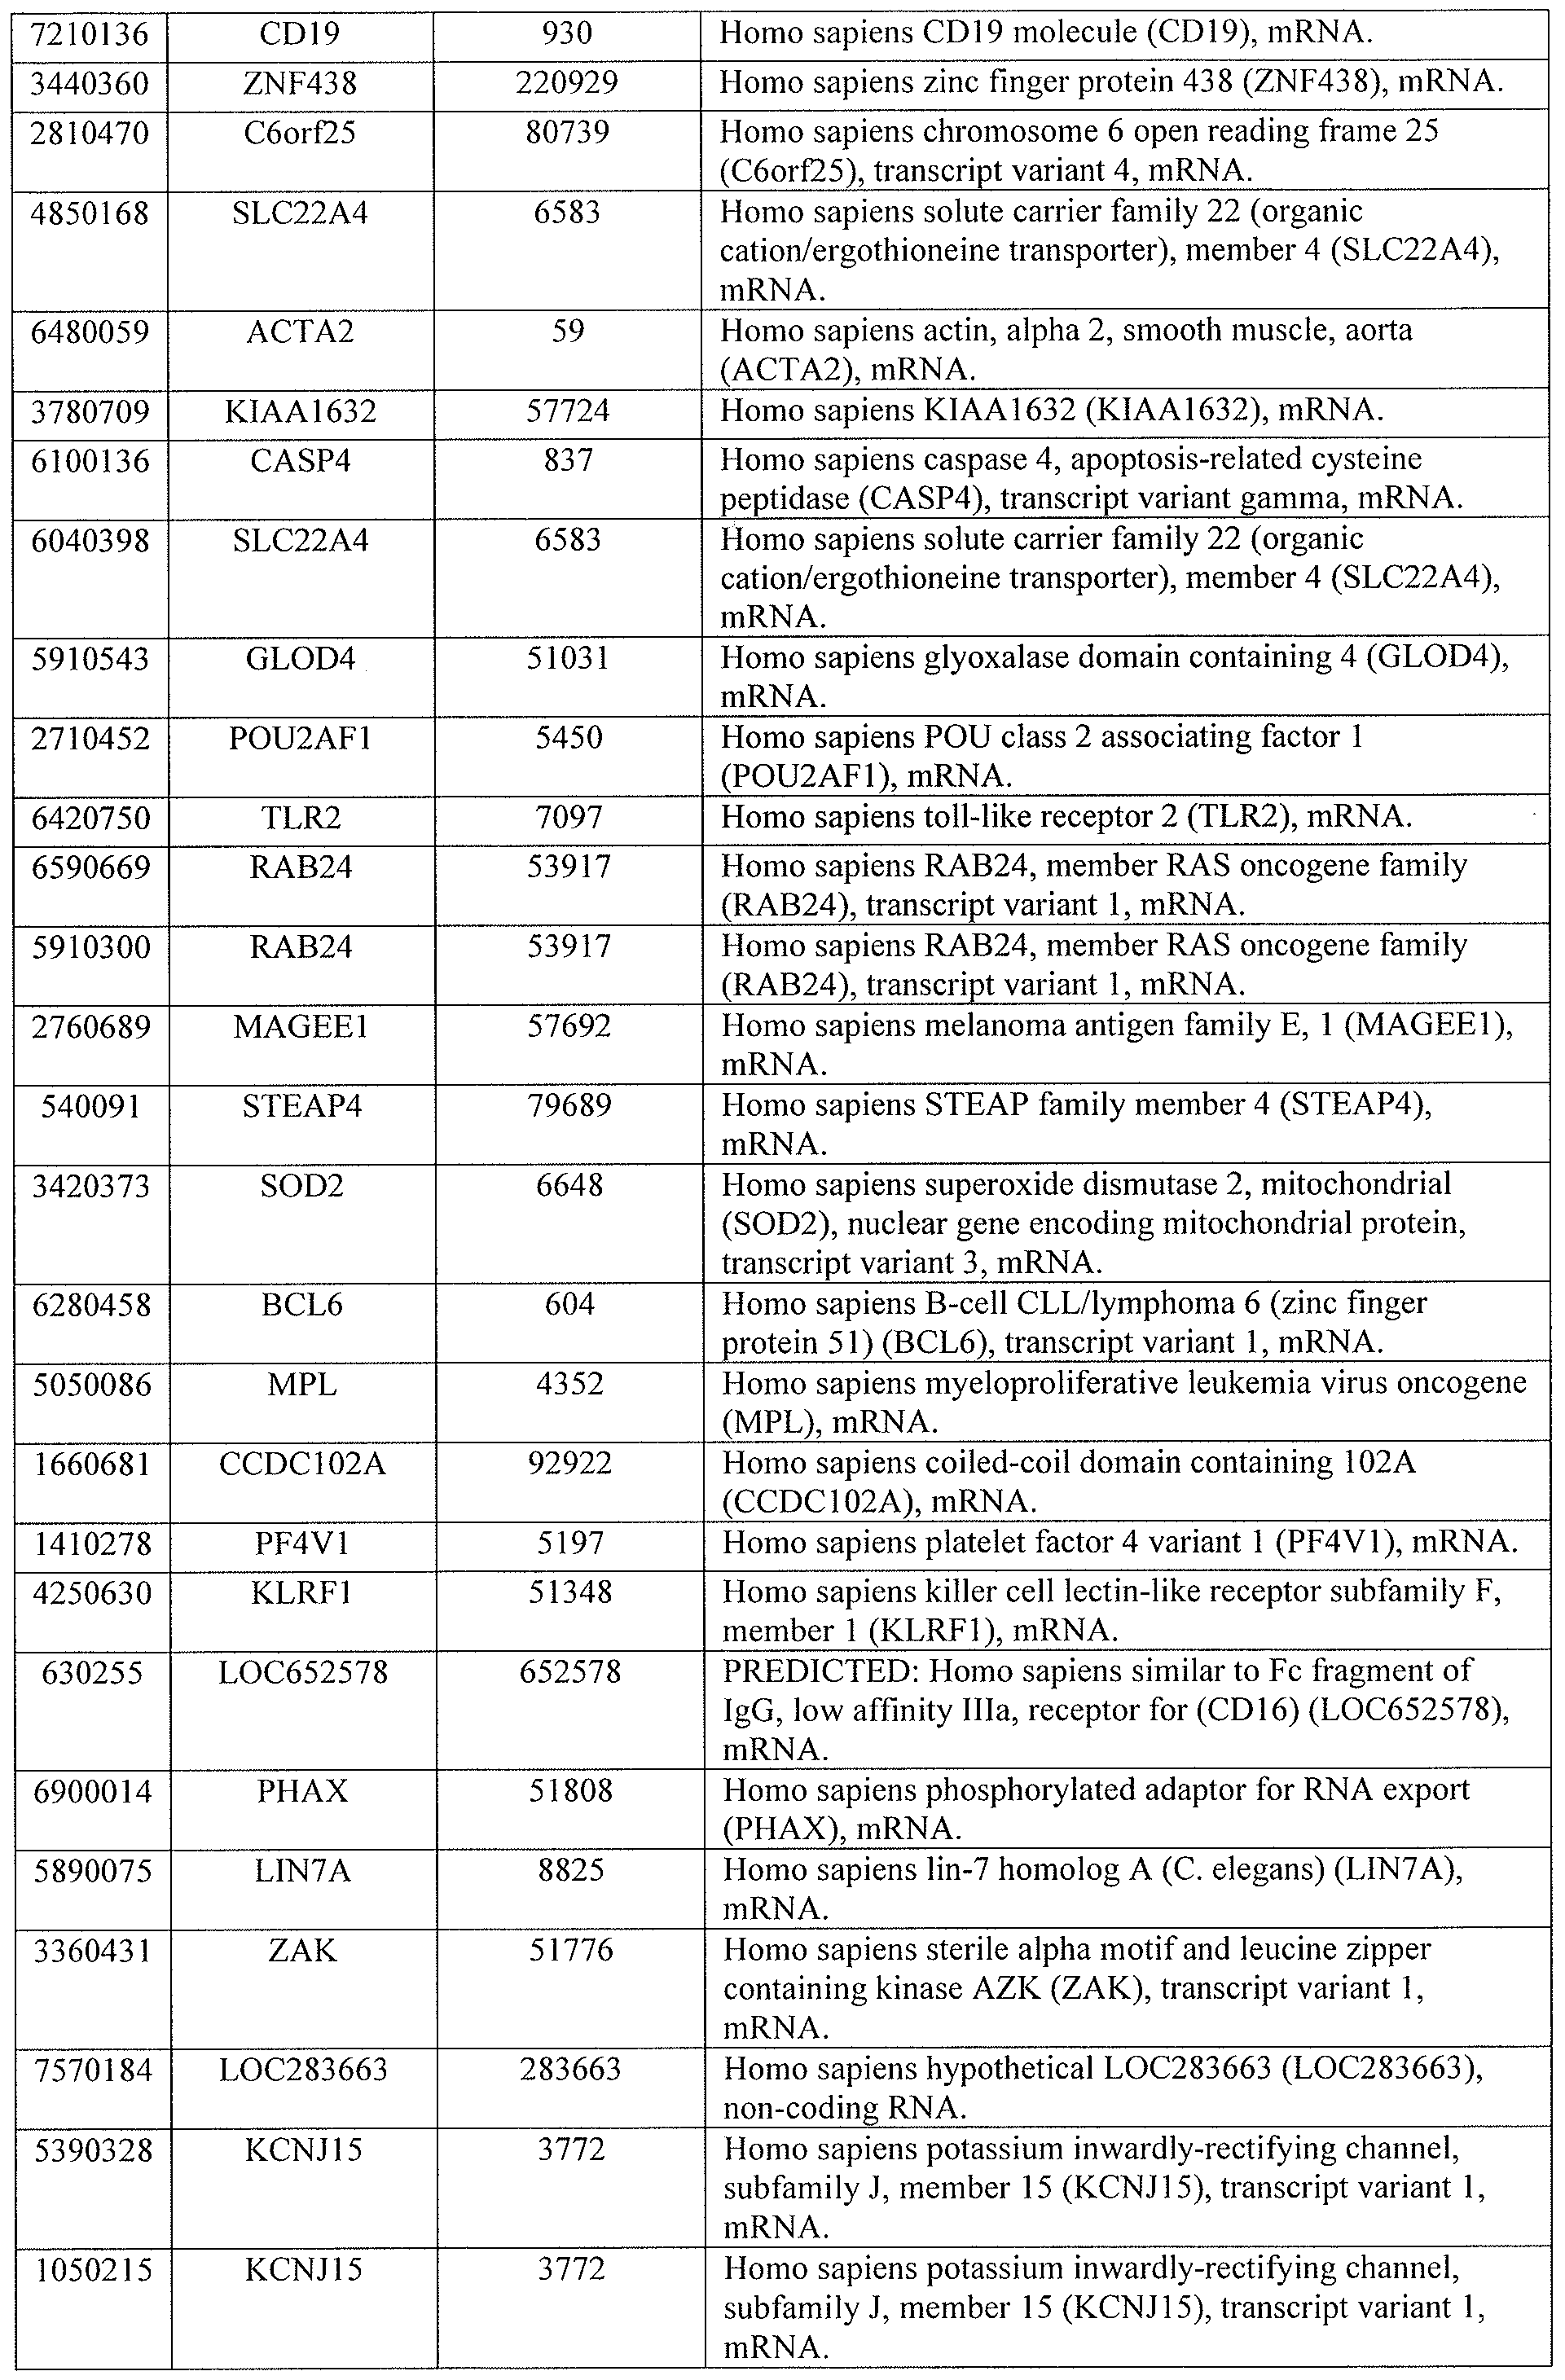
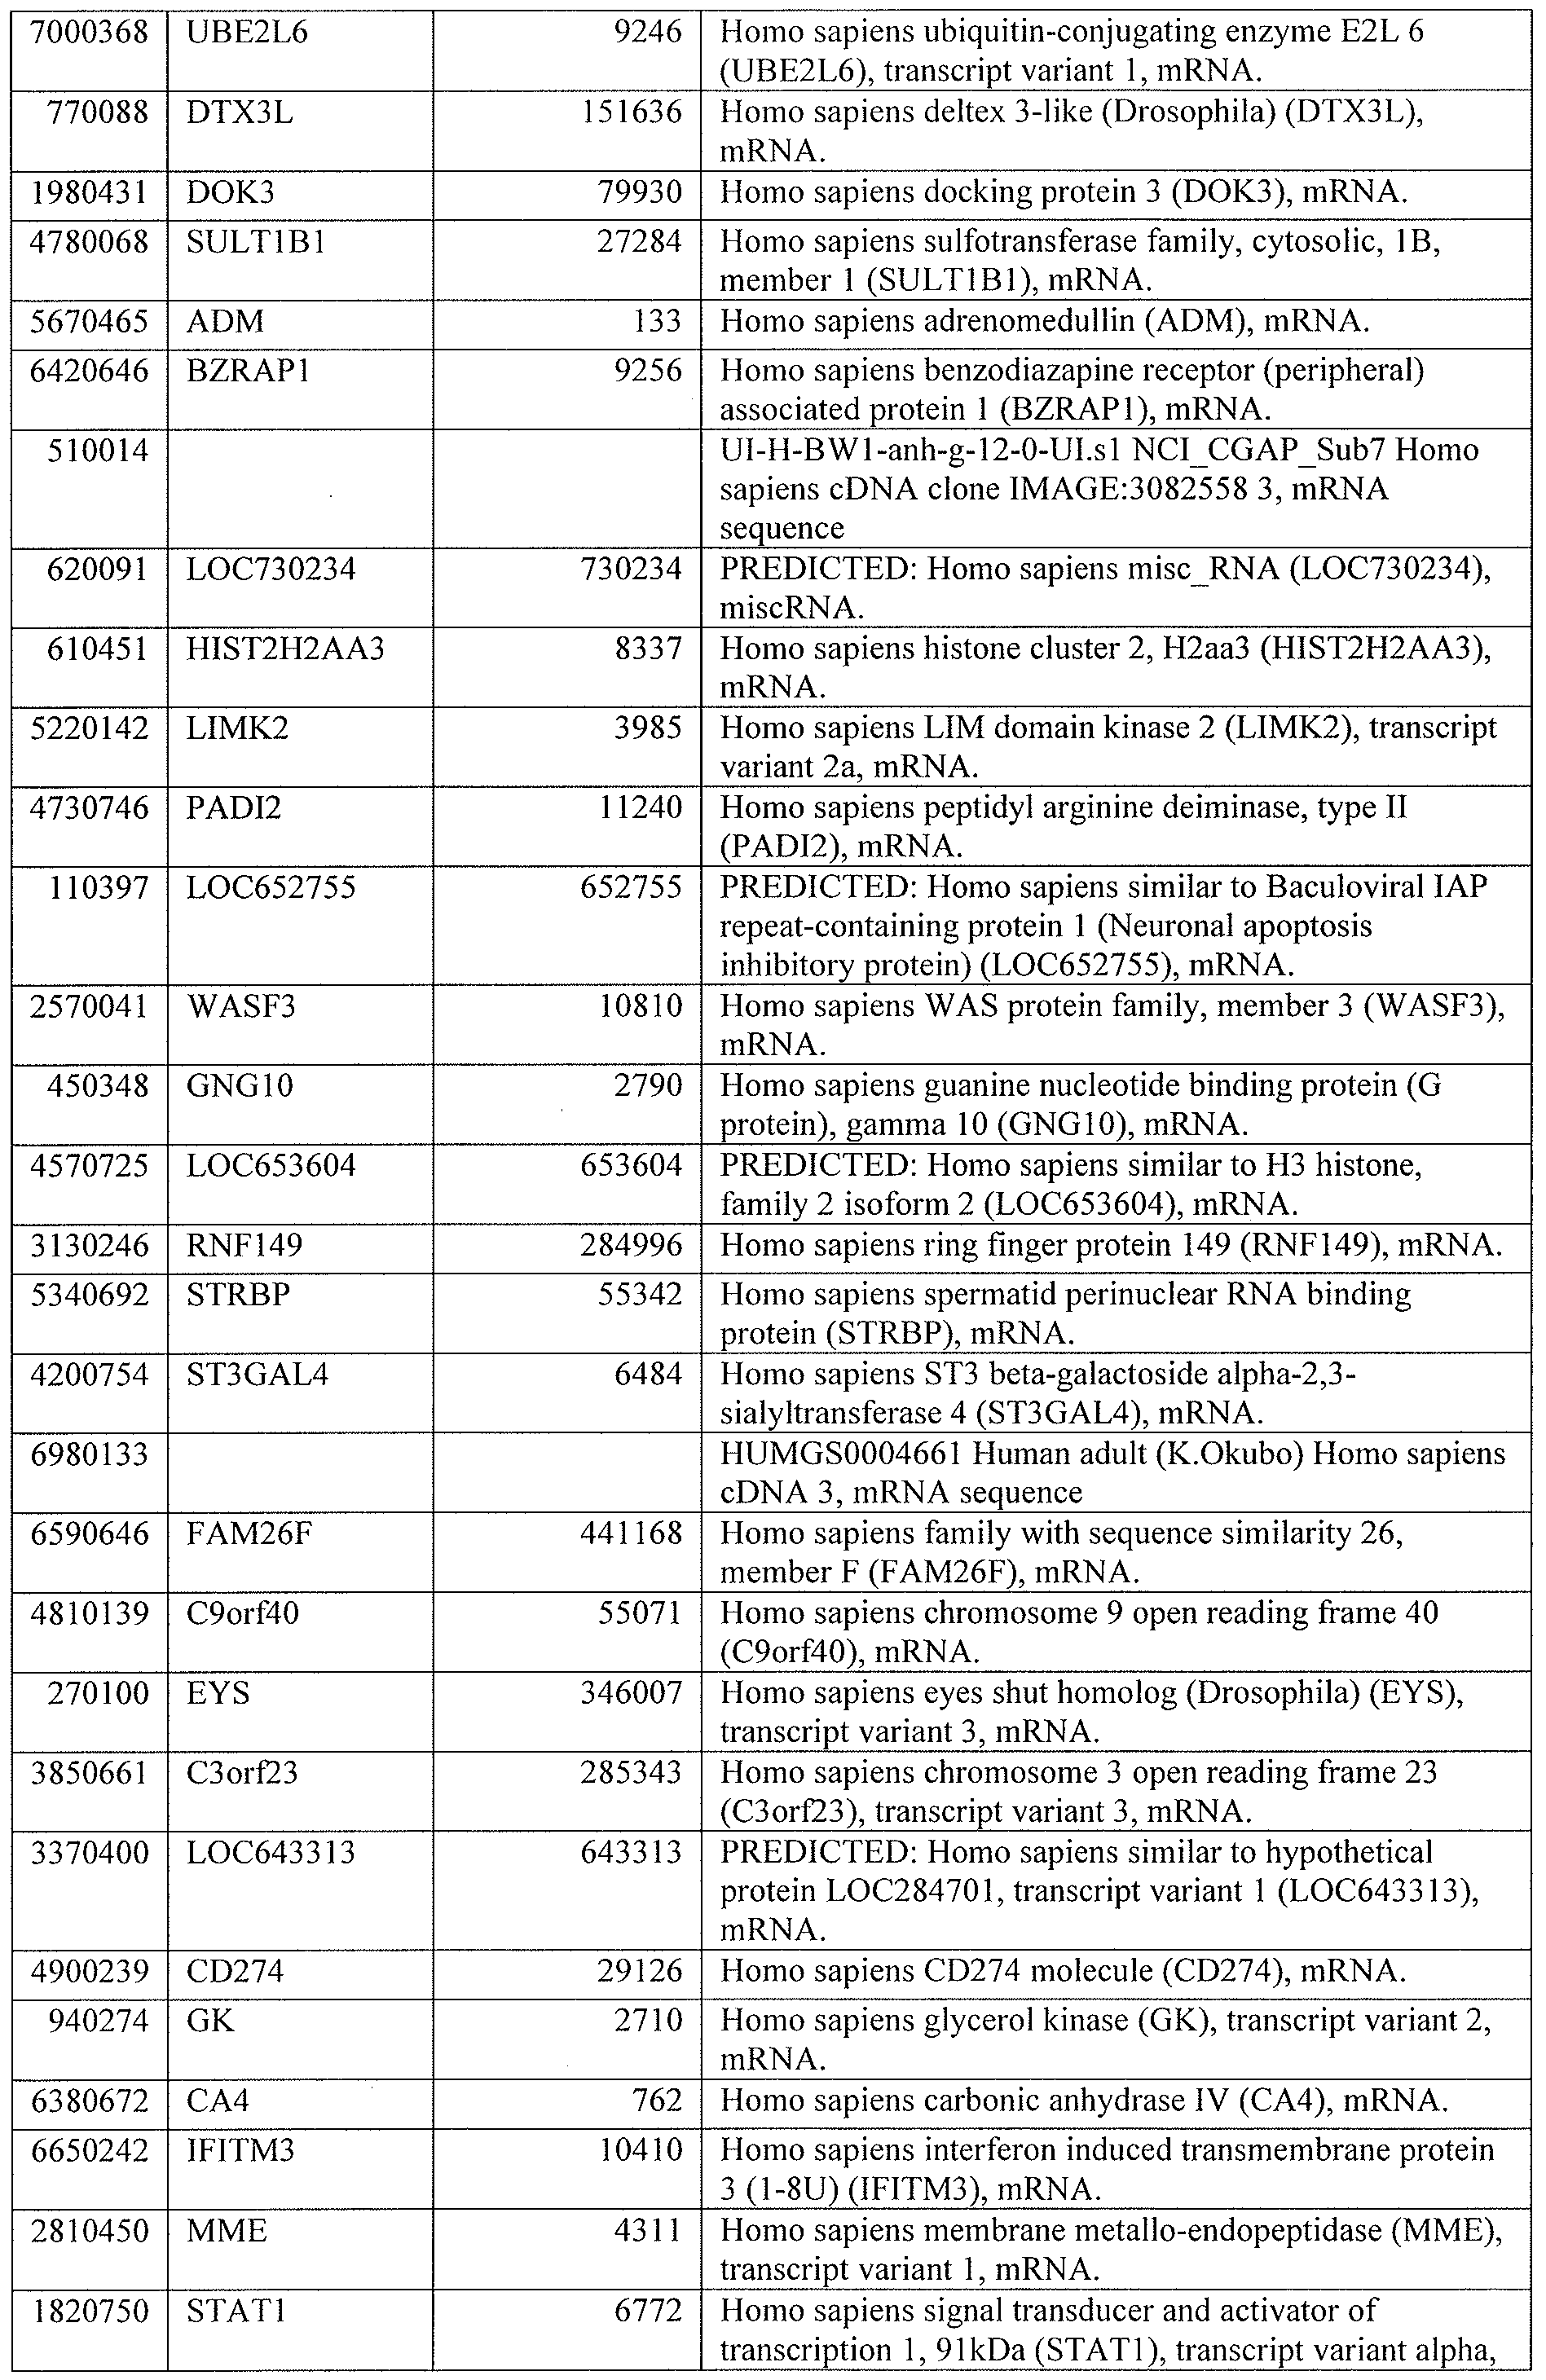
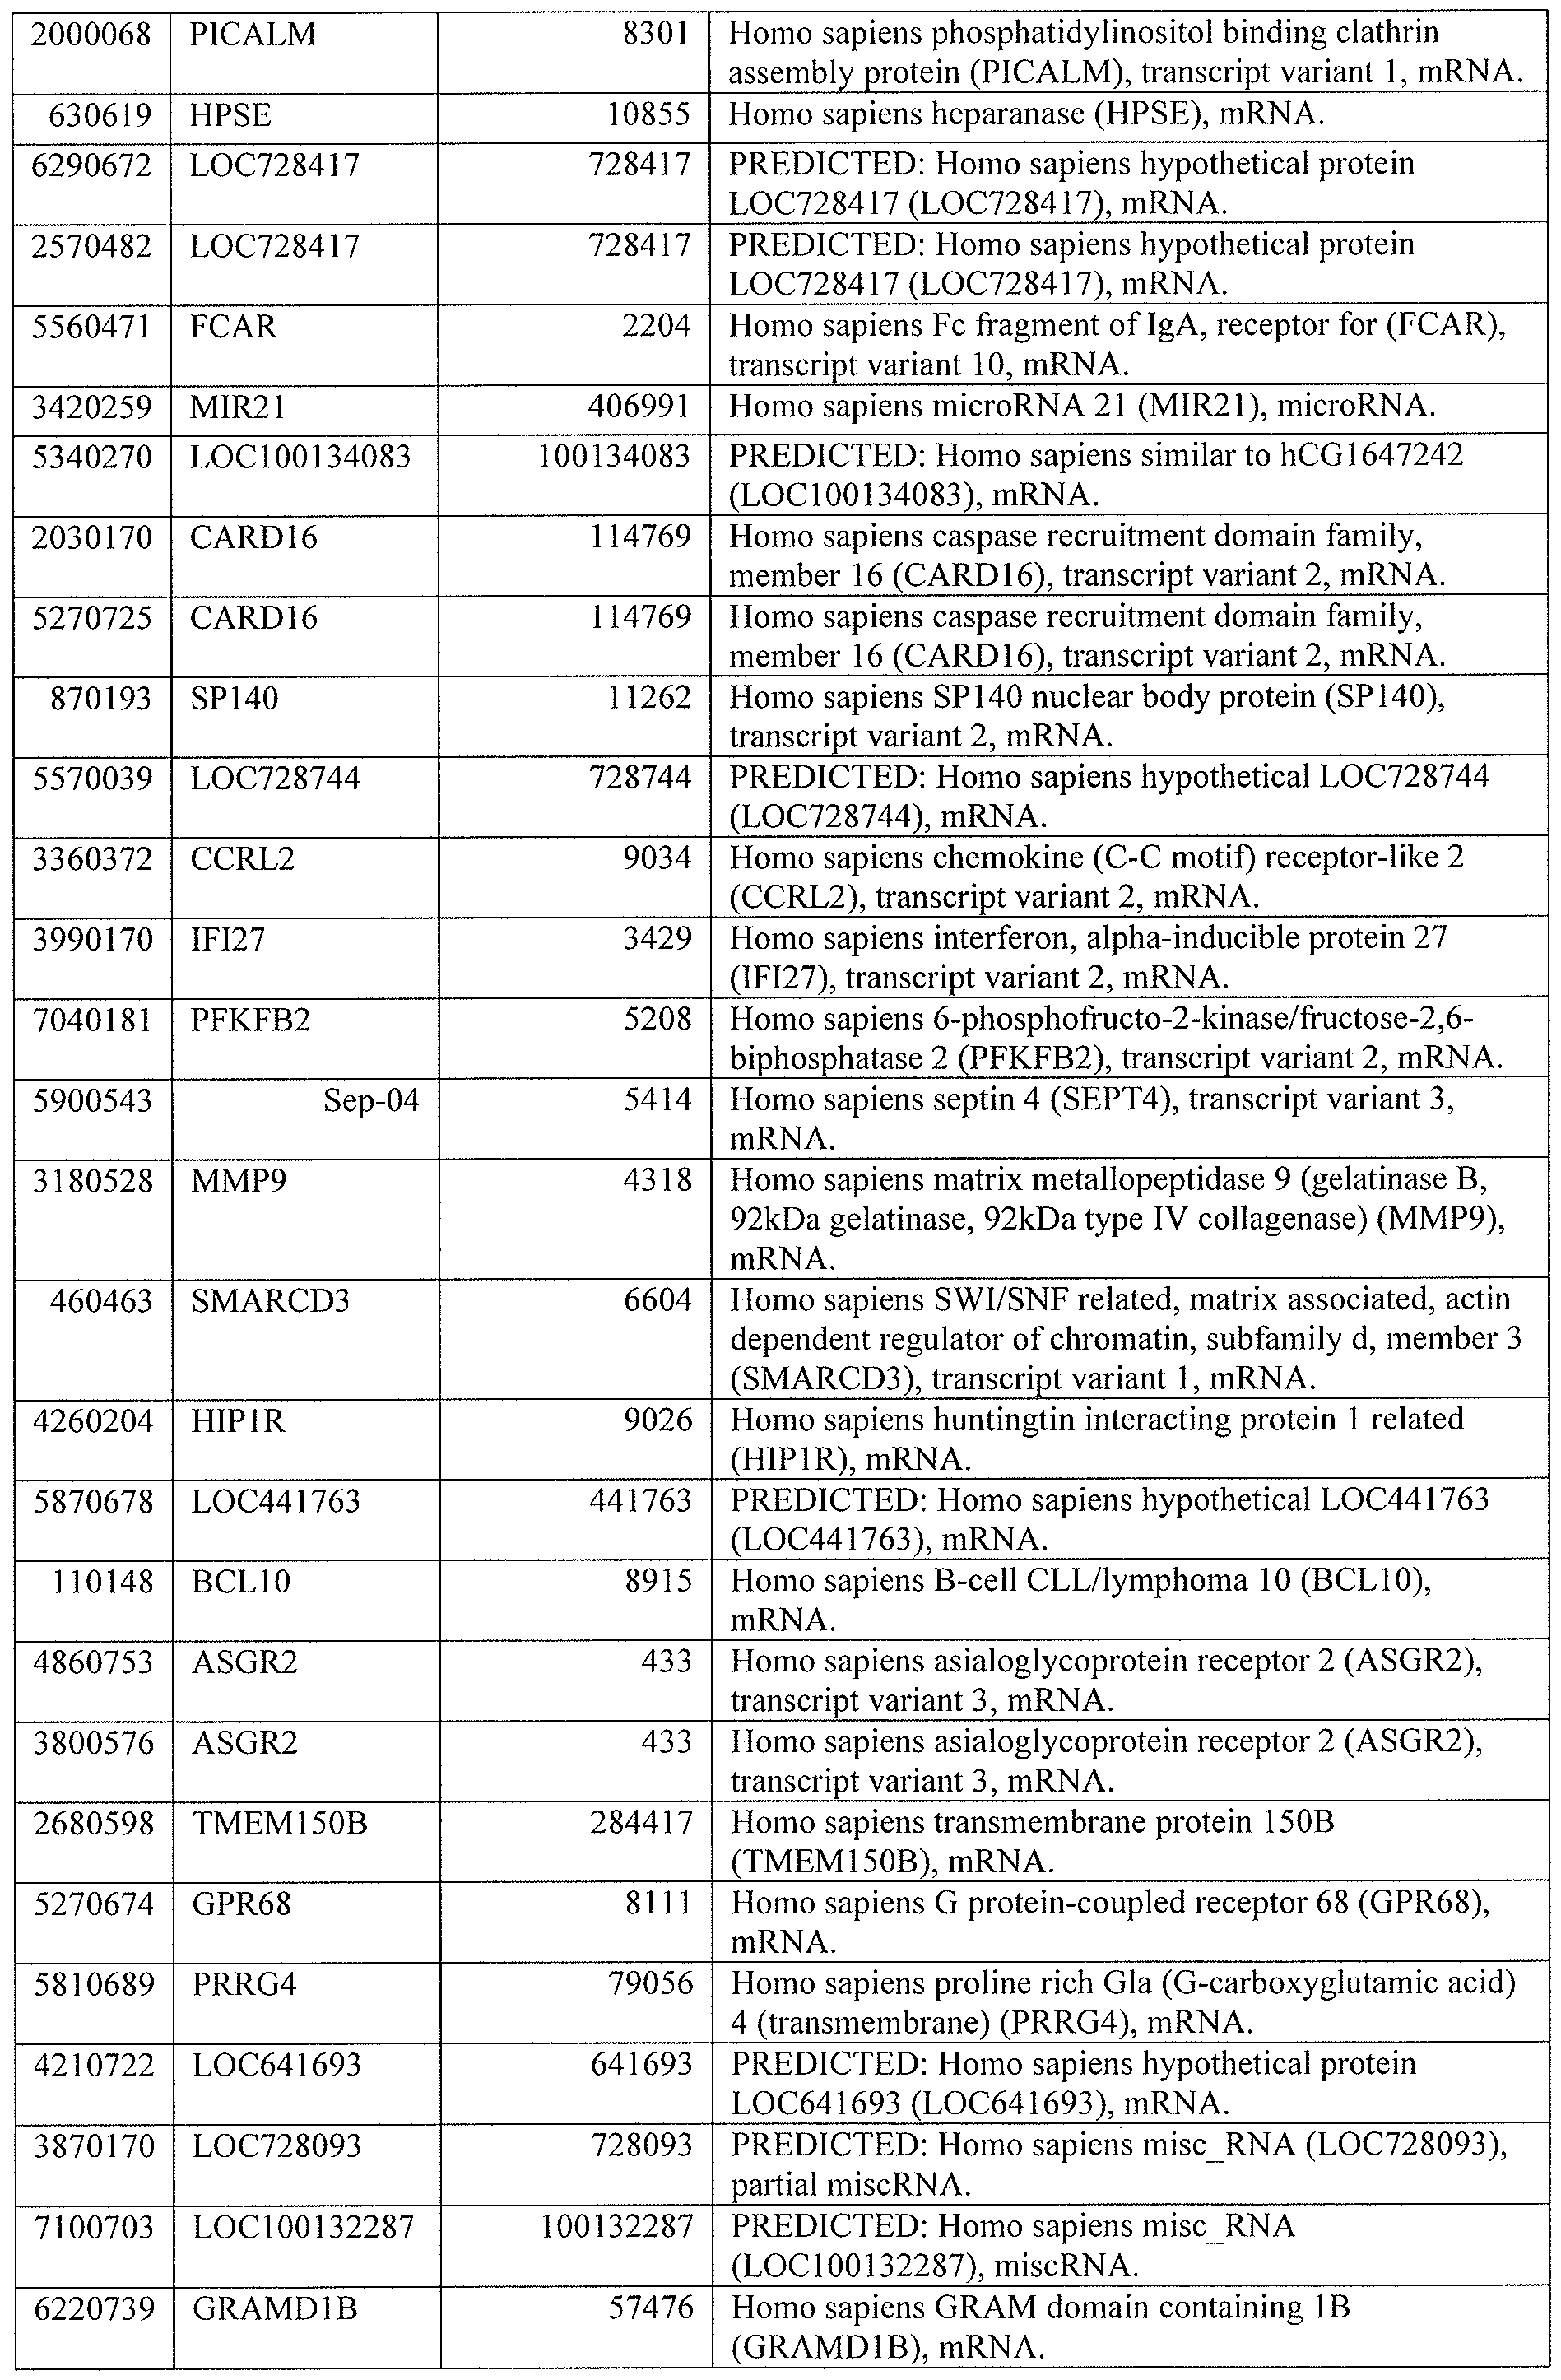
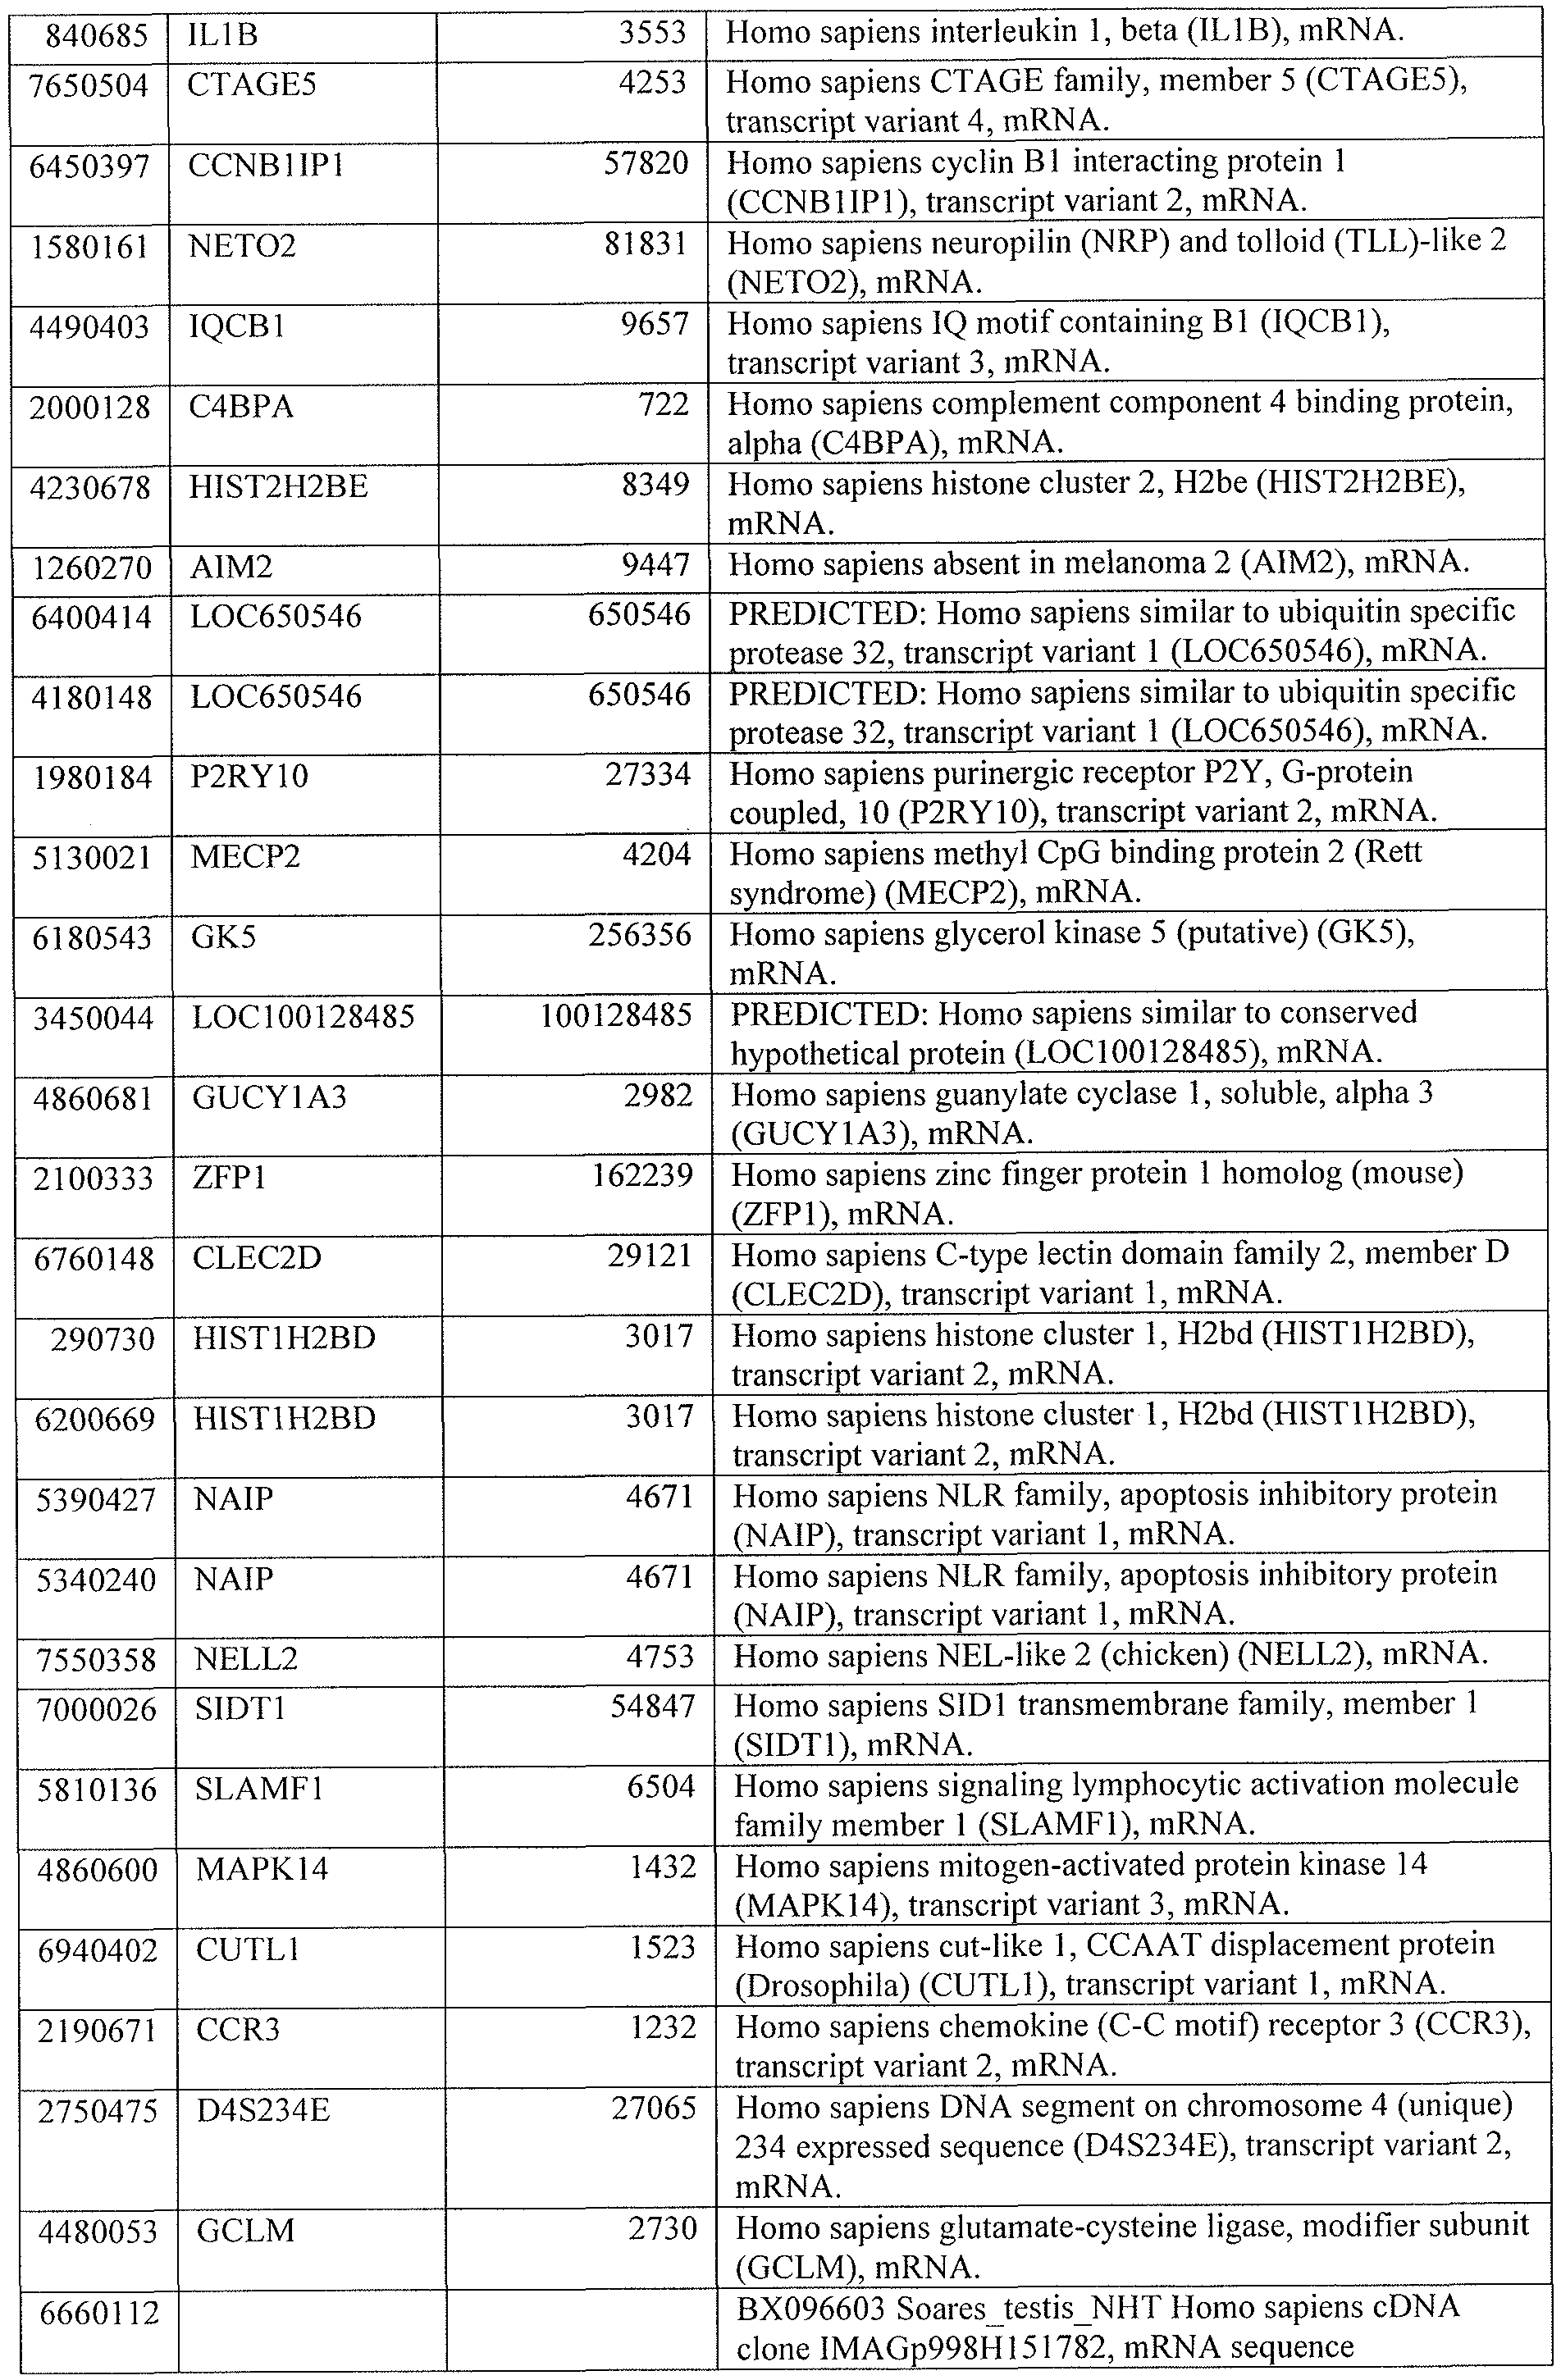
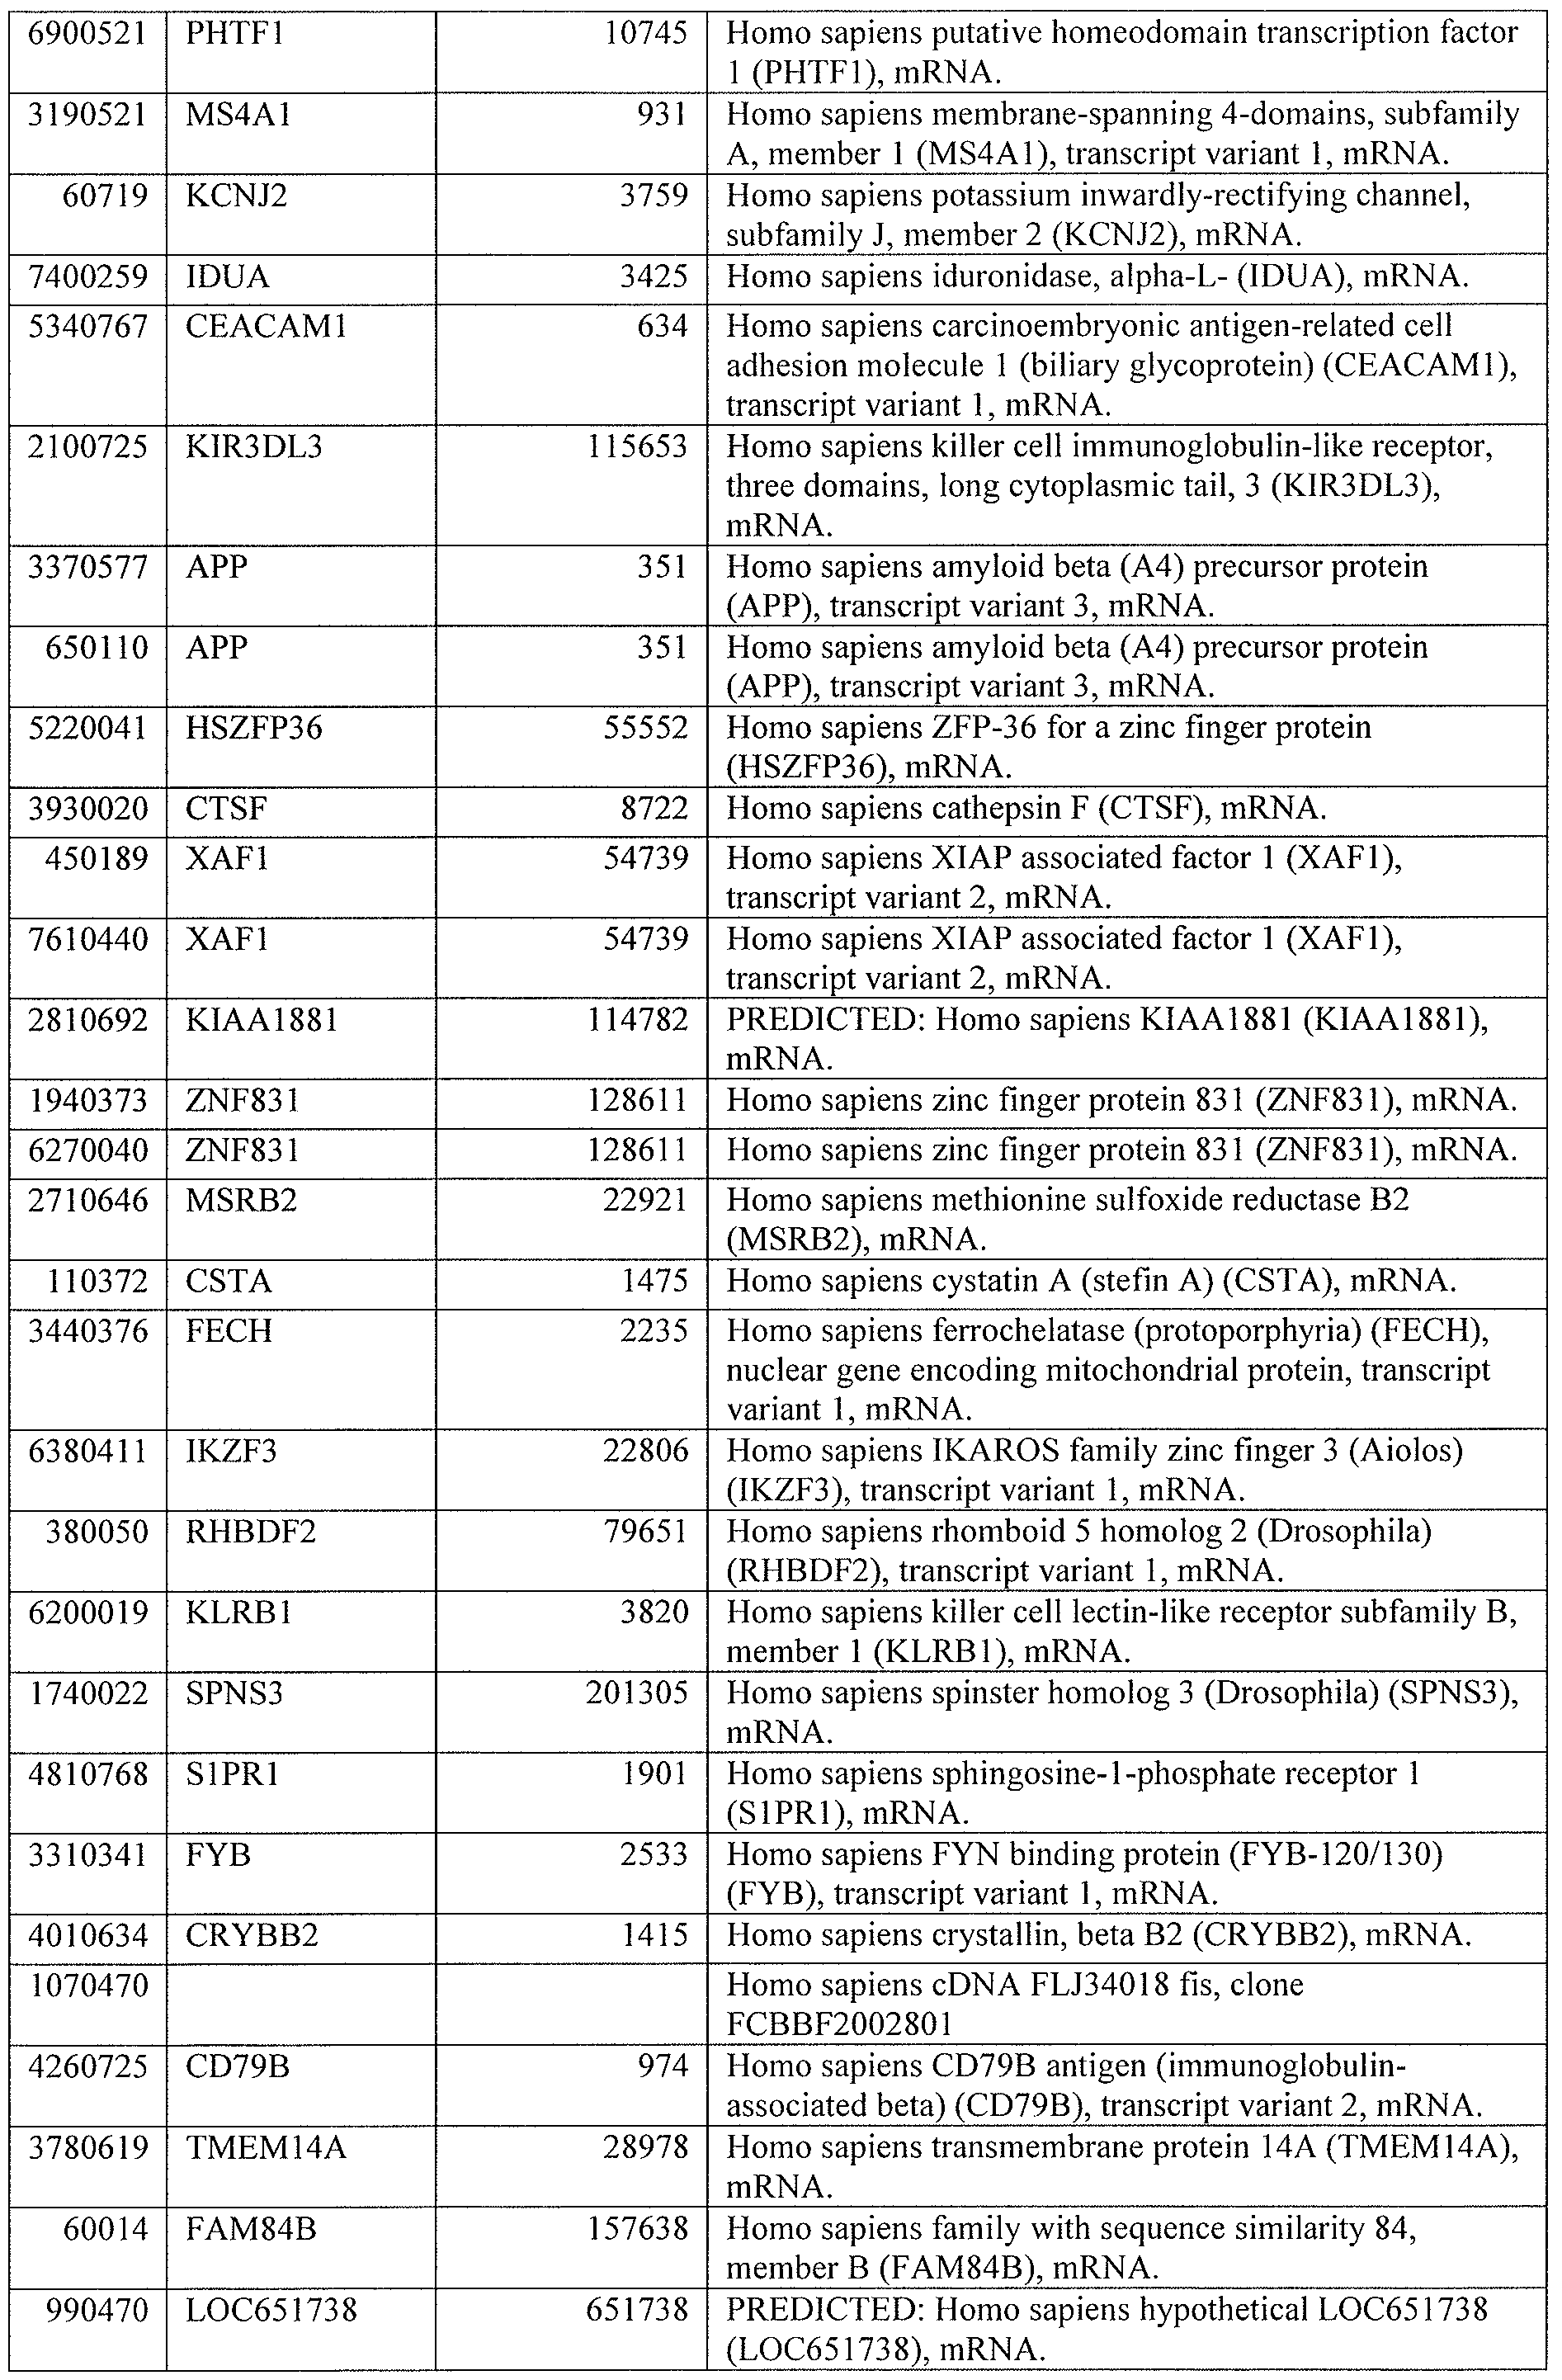
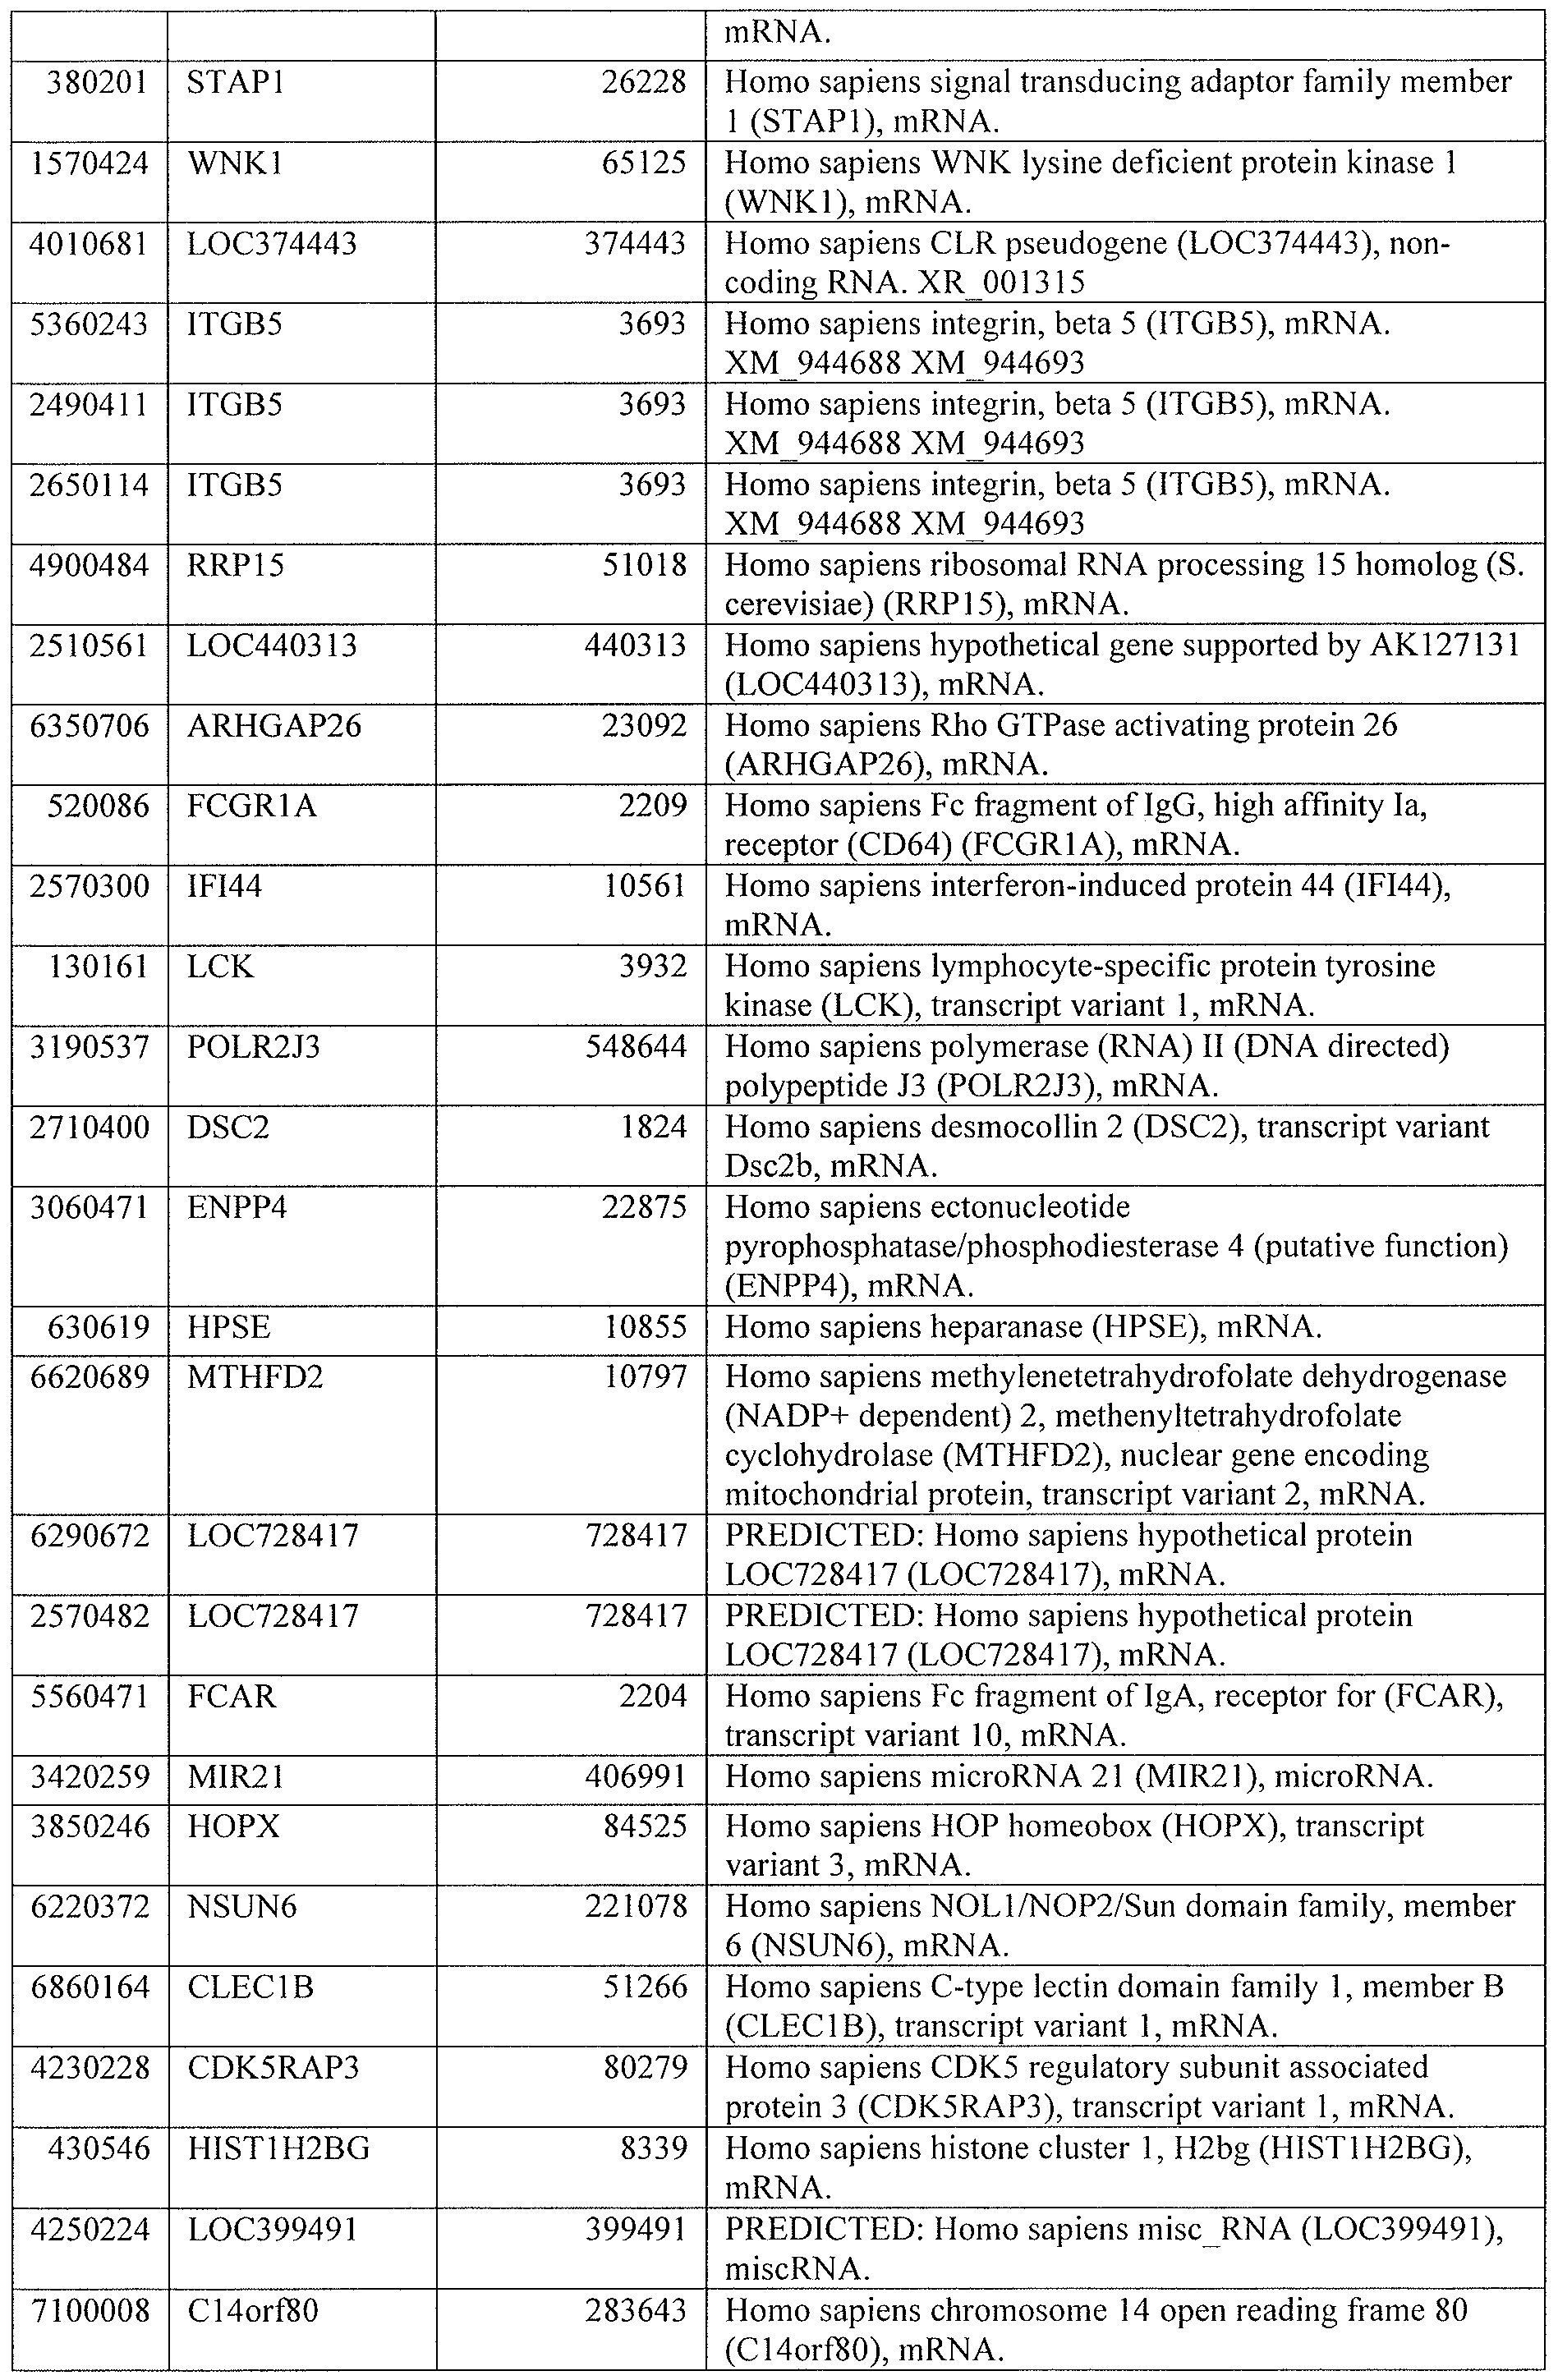
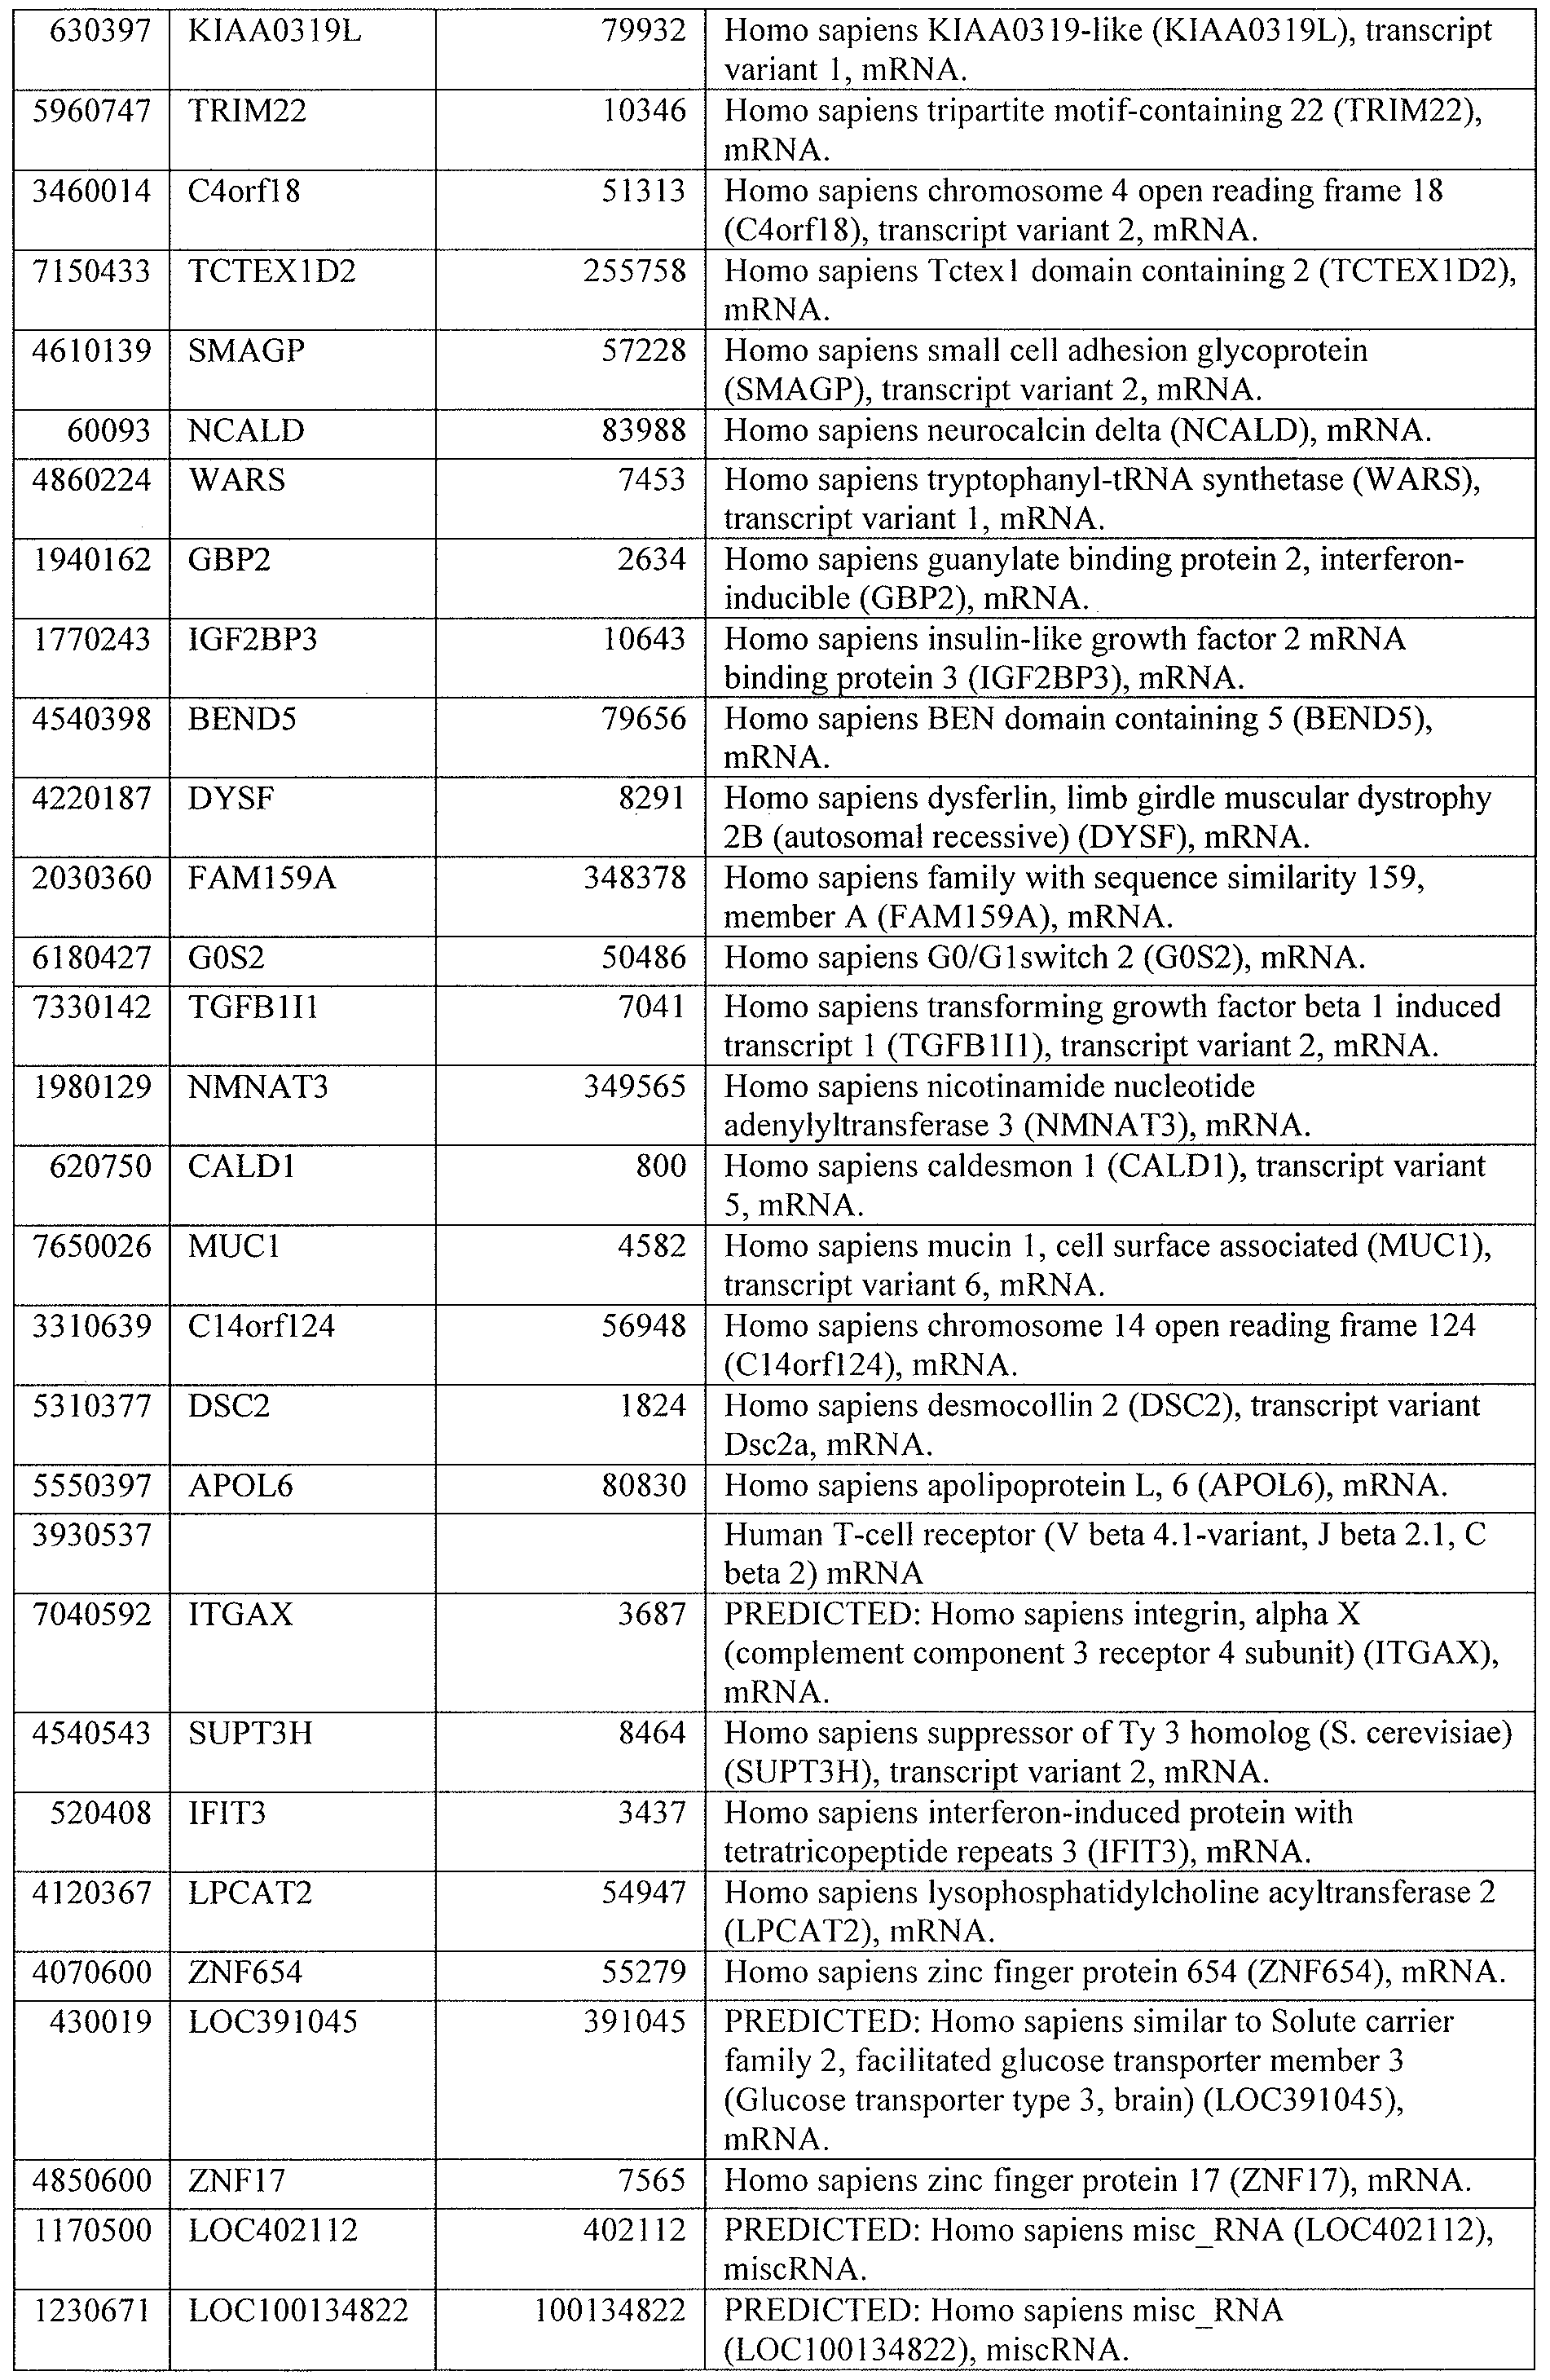
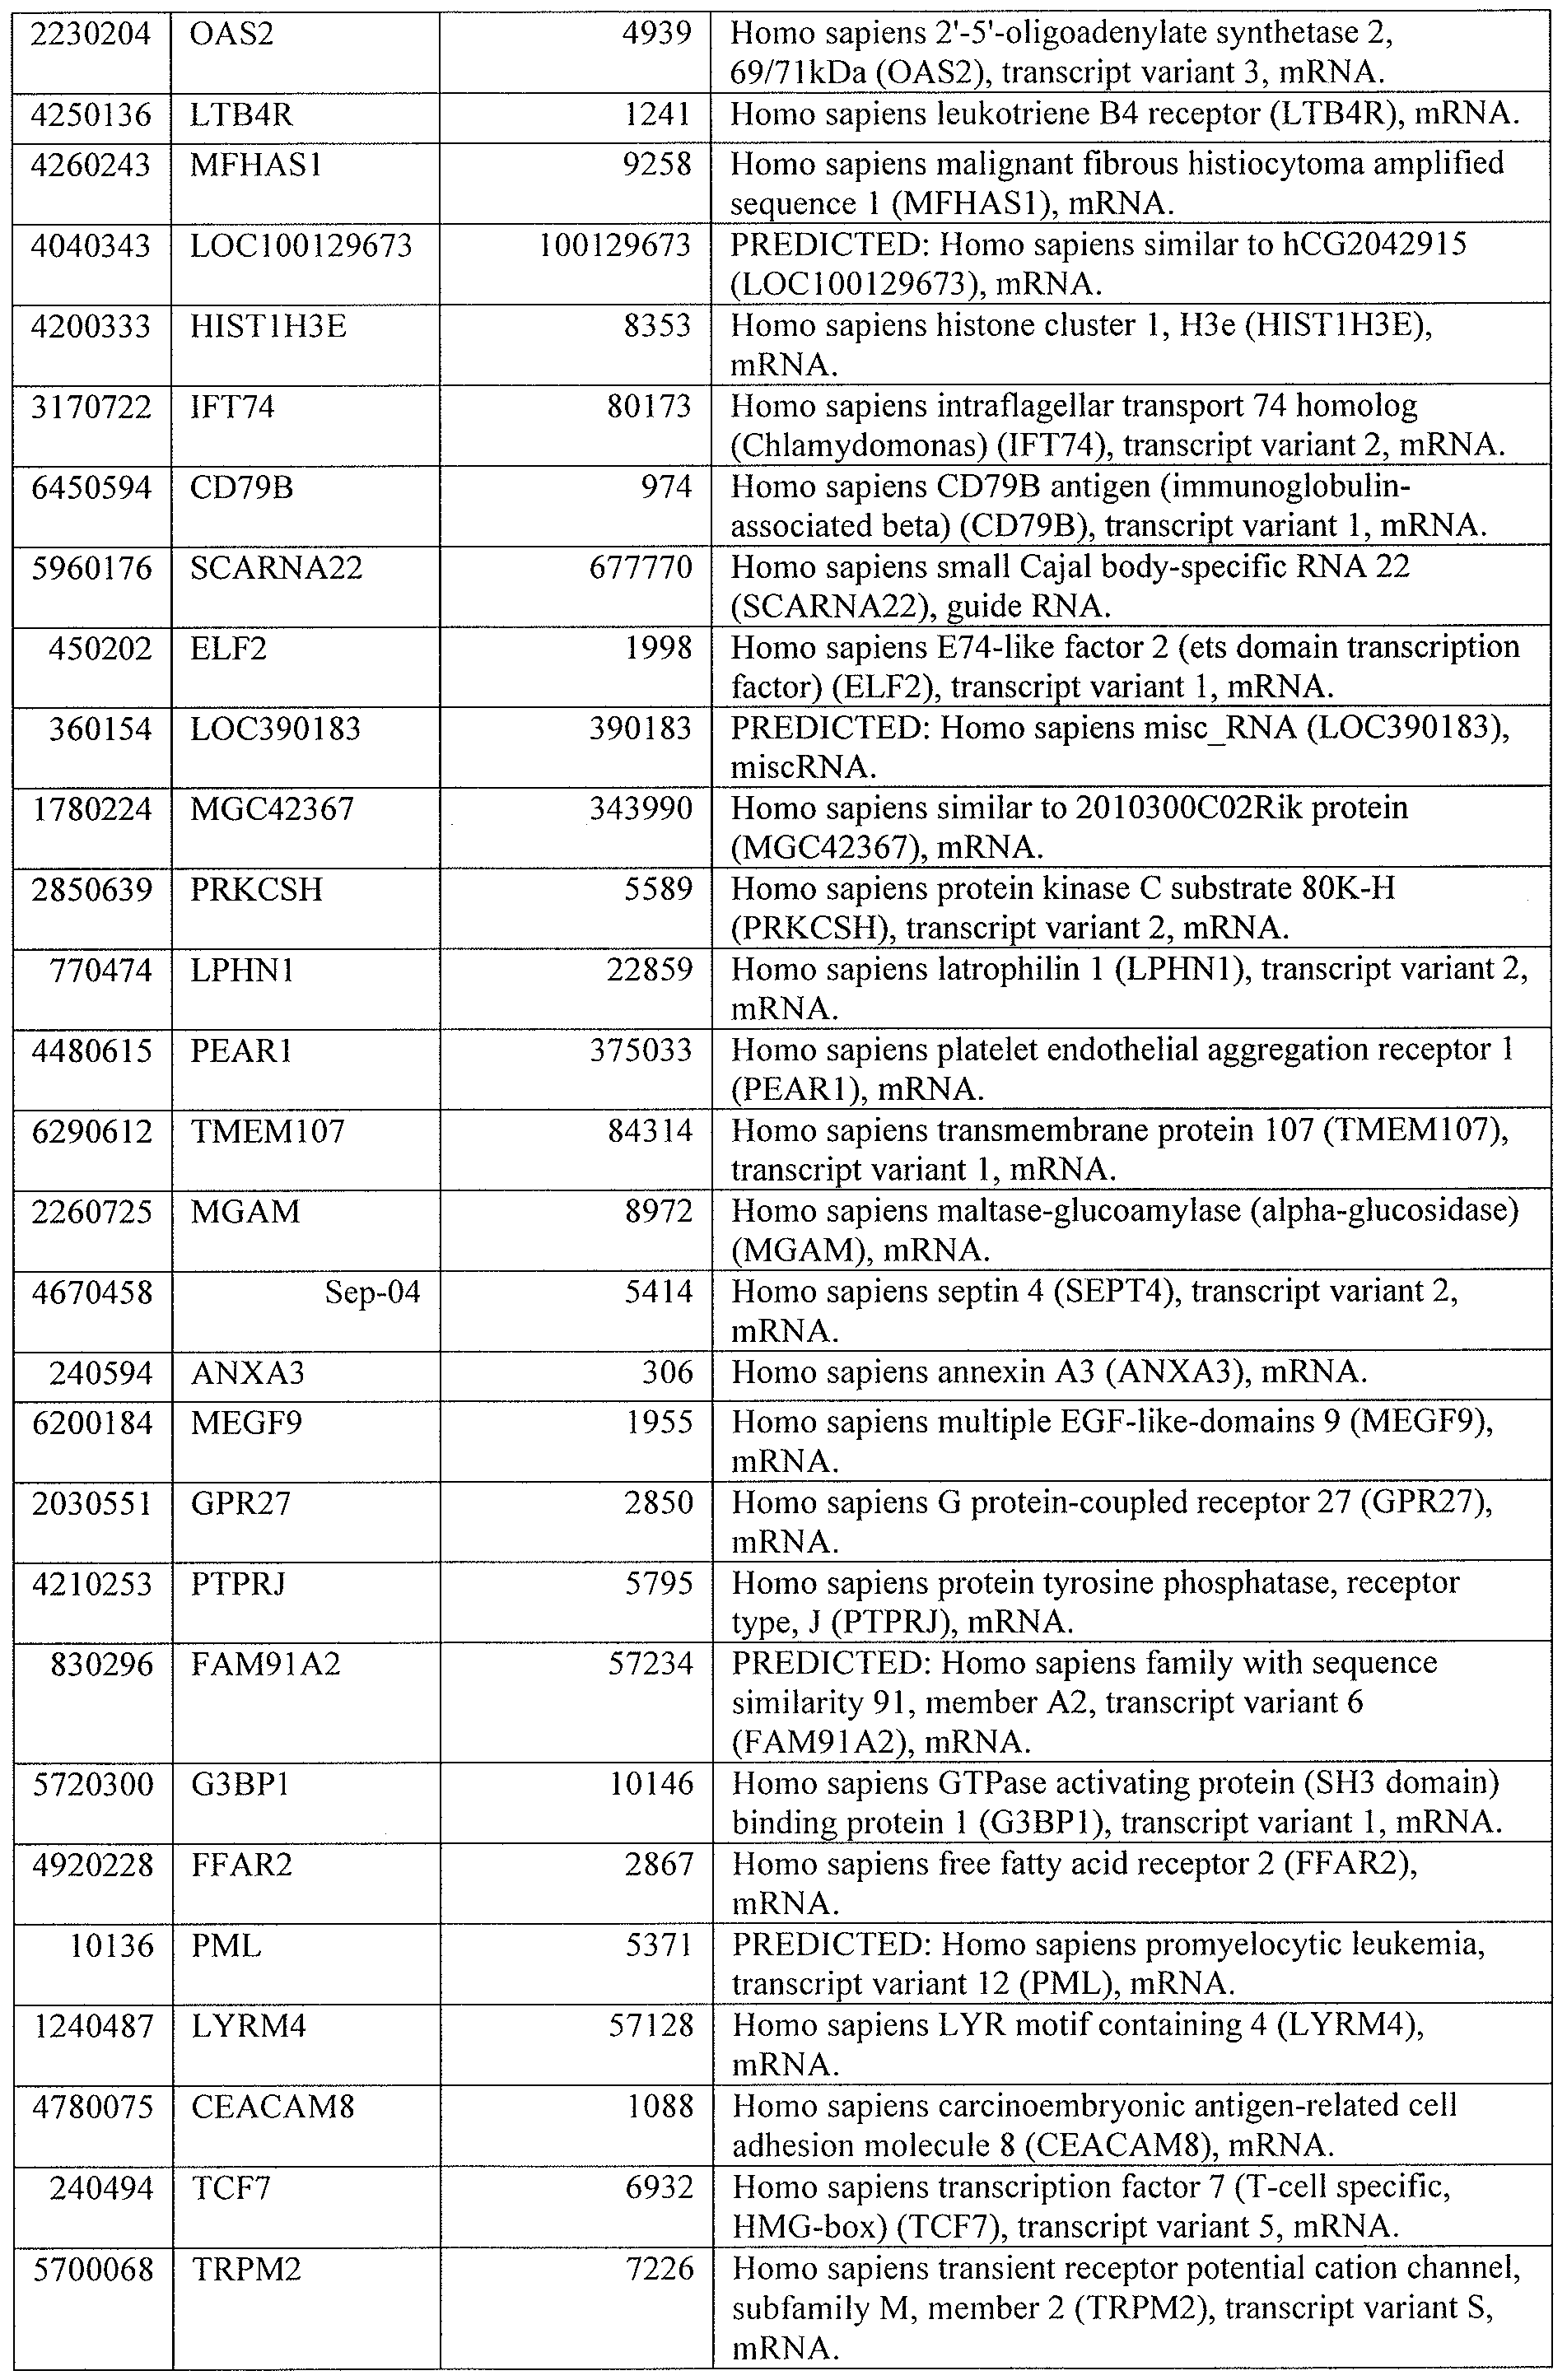
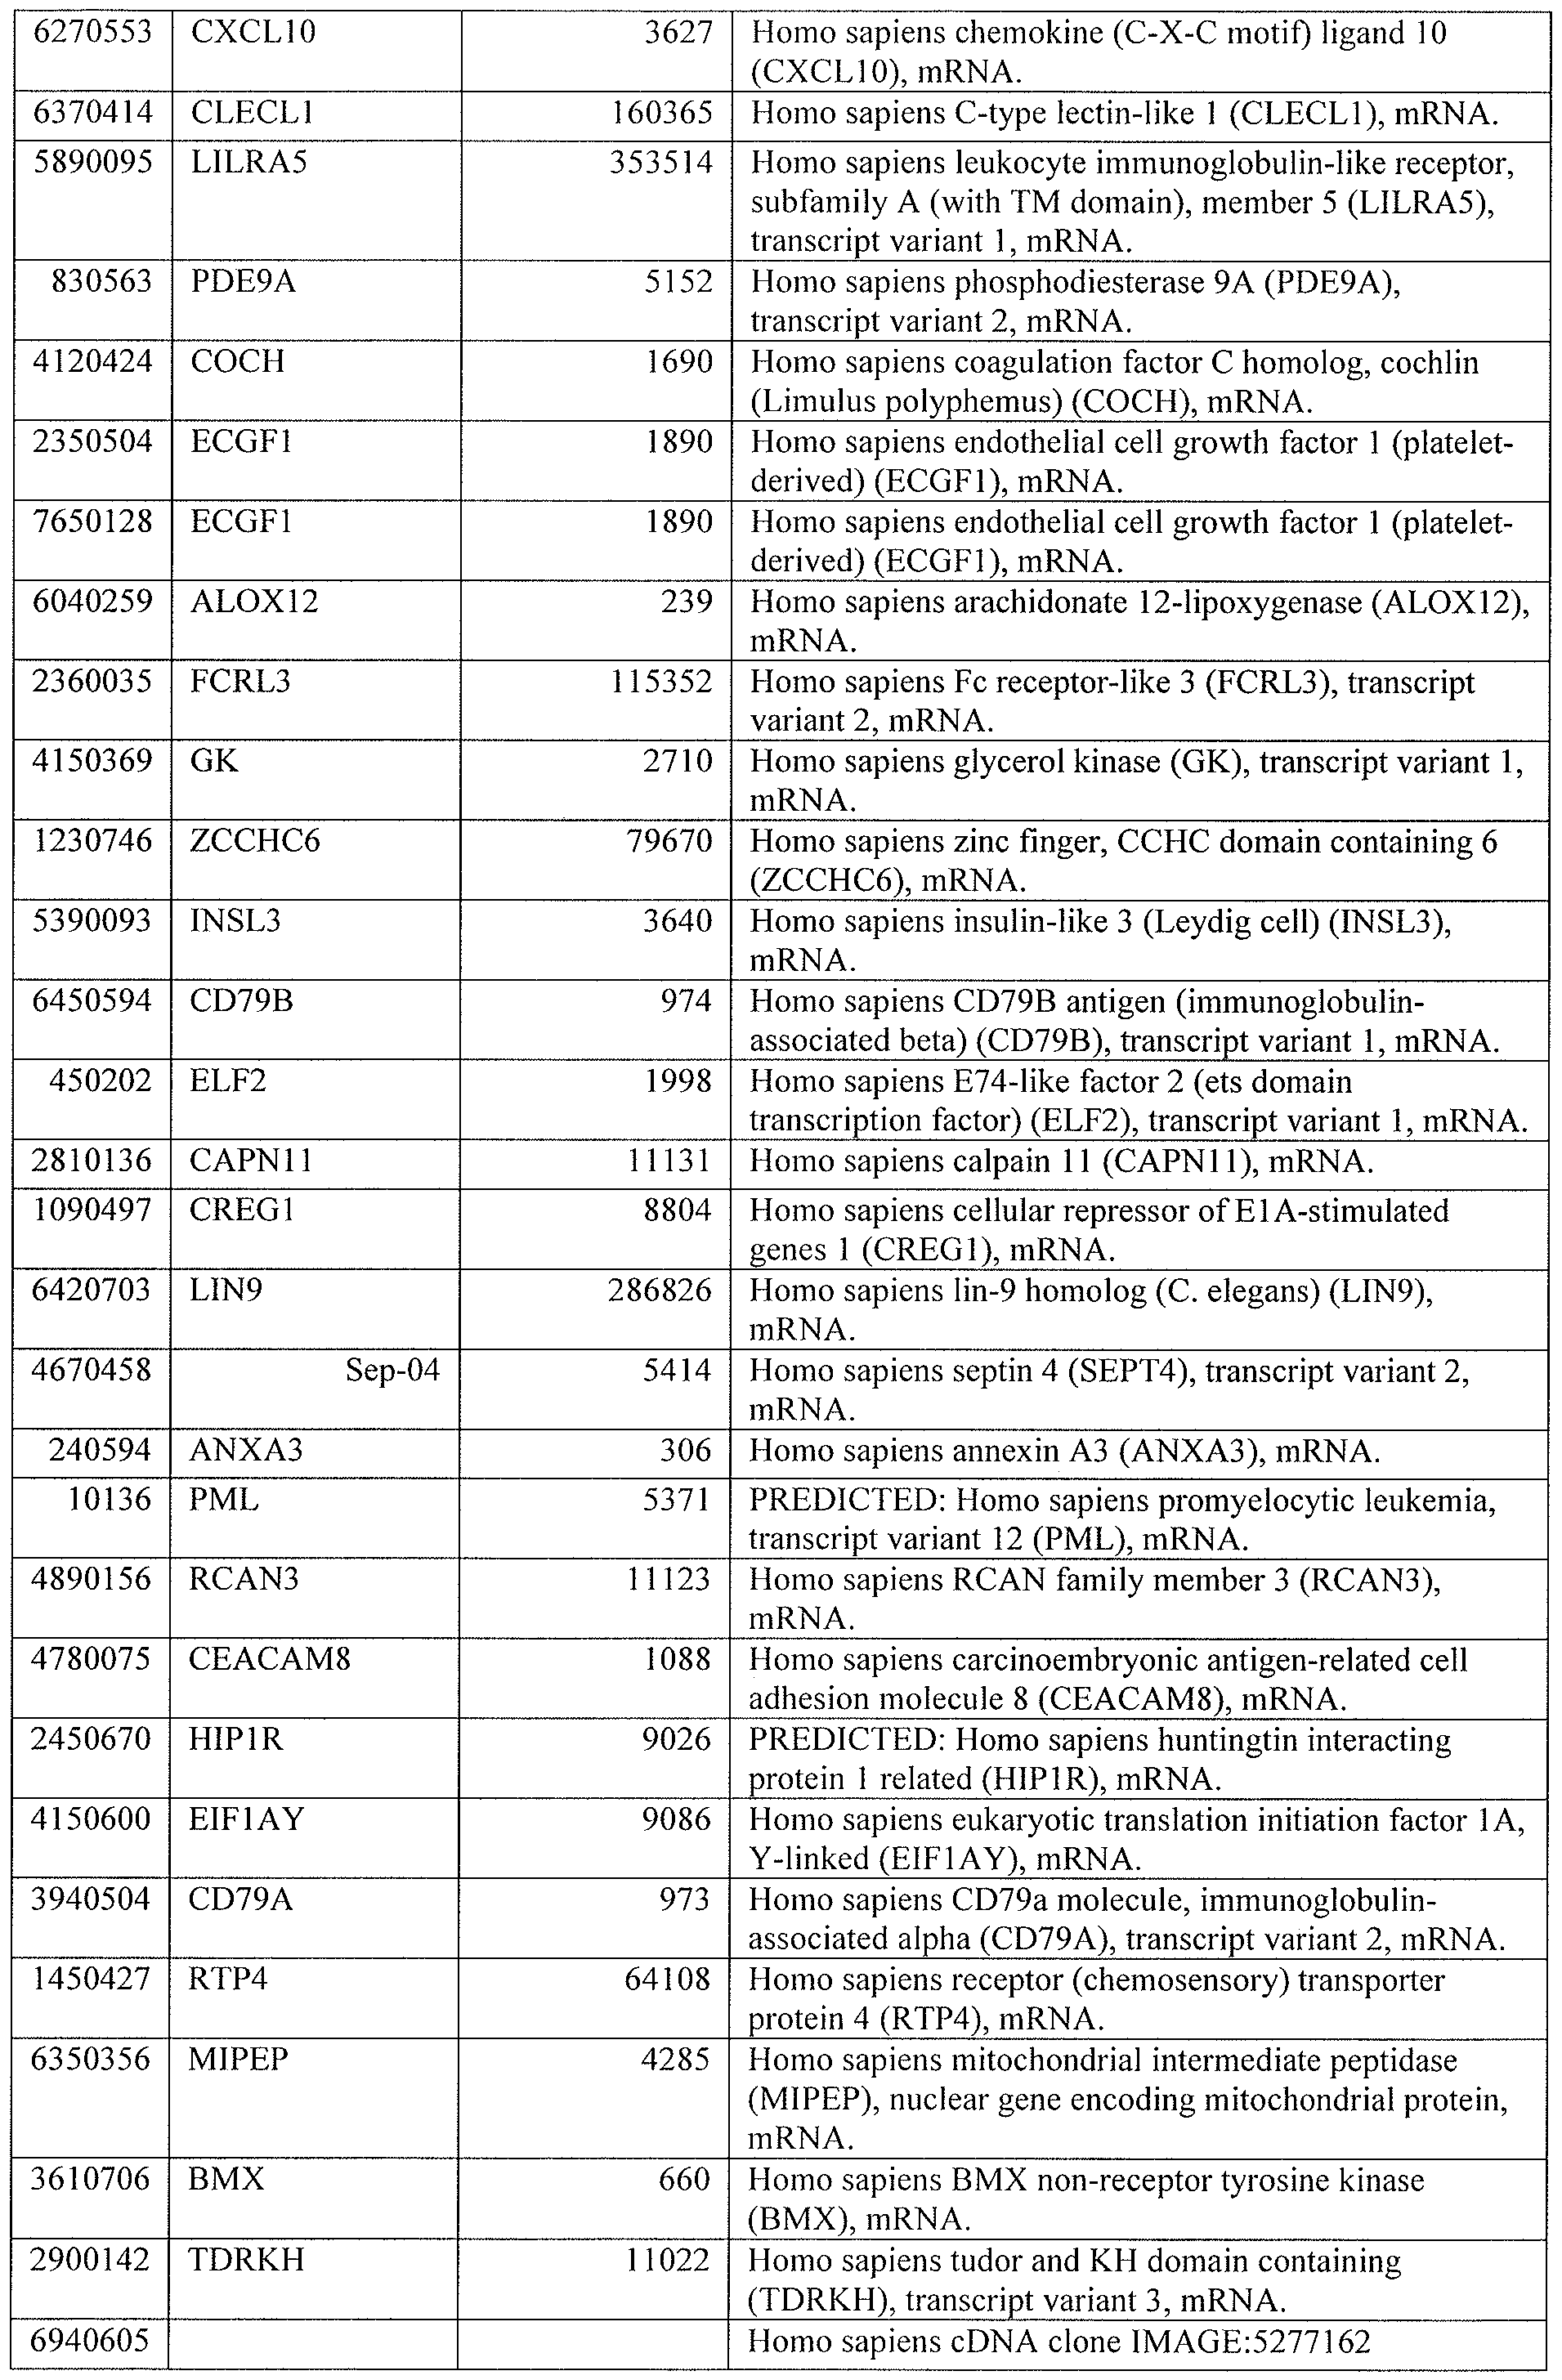
[0044] Tables 4 through 12 provide gene transcript lists for 224, 86, 393, 565, 664, 391, 1 129, 71 1, and 320 genes, respectively.
[0045] Related summaries of demographics and clinical data are provided in Table 13 A, a South African 201 1 cohort, and Table 13B, a UK 2011 cohort.
DETAILED DESCRIPTION OF THE INVENTION
[0046] While the making and using of various embodiments of the present invention are discussed in detail below, it should be appreciated that the present invention provides many applicable inventive concepts that can be embodied in a wide variety of specific contexts.
The specific embodiments discussed herein are merely illustrative of specific ways to make and use the invention and do not delimit the scope of the invention.
[0047] To facilitate understanding of this invention, a number of terms are defined below. Terms defined herein have meanings as commonly understood by a person of ordinary skill in the areas relevant to the present invention. Terms such as "a", "an," and "the" are not intended to refer to only a singular entity but include the general class of which a specific example may be used for illustration. The terminology herein is used to describe specific embodiments of the invention, but their usage does not delimit the invention, except as outlined in the claims.
[0048] Globally there are approximately nine million new active tuberculosis (TB) cases and 1.7 million deaths annually. Effective anti-TB treatment monitoring is difficult as determining a treatment response by currently used methods takes at least two months. Inadequate treatment leads to worsening disease, disease transmission, and drug resistance. Currently, the best accepted method to predict treatment success in pulmonary tuberculosis is the two-month sputum culture conversion. However, this method is of low sensitivity for prediction of individual treatment response and is difficult to implement since many patients cannot produce sputum. In the United States 30% of TB patients are treated empirically and in South Africa 50% are treated with confirmation of diagnosis by culture. Currently, no recognized biomarkers of poor adherence or inadequate treatment earlier than two months exist.
[0049] The present inventors determined if blood transcriptional signatures change in response to anti-TB treatment and could act as biomarkers of a successful response.
[0050] Surprisingly, transcriptional blood gene signatures {e.g.: a 664- (Table 8) (Figure 2B); a 391 - (Table 9) (e.g., Figures 3 A, 4A & 7A); an 86- (Table 5) (Figures 8A & 8B); a 393- (Table 6) (Figures 8A & 8B); a 565- (Table 7) (Figure 10A); a 224- (Table 4) (Figure 10B); a 71 1- (Table 1 1) (Figure IOC); or a 1129-transcript signature (Table 10)} diminish within two weeks after commencement of tuberculosis treatment; genes significantly altered in transcription include, e.g., interferon-signaling genes including type I and type II IFN, genes related to the innate immune pathways, genes related to complement, toll like receptors, a NOD like receptor gene, and interleukin-lB.
[0051] As demonstrated herein, a change in whole blood host transcriptional signatures is significantly detectable as early as two weeks or sooner after commencement of treatment for tuberculosis; this provides early biomarkers for treatment monitoring.
[0052] In short, blood transcriptional profiles of untreated active and latent TB patients in South Africa were analyzed, before, during (at two weeks and at two months), at the end of (six months) and after (12 months) anti-TB treatment. The signature in active TB patients as compared to latent individuals (664 transcripts) was significantly diminished by two weeks after initiation of treatment and this significant response was measured using a novel algorithm (termed "Temporal Molecular Responses") developed for this study. A specific treatment response-transcriptional signature (391 transcripts) was derived and validated in two independent cohorts, to which two quantitative scoring algorithms were applied to score the changes in the transcriptional response. The most significantly represented pathways were determined using Ingenuity Pathway Analysis. The South African active TB- transcriptional signature revealed more differentially expressed genes than previously reported in UK cohorts. Interferon inducible genes were highly significantly elevated in all cohorts. The active TB-transcriptional signatures and the treatment specific transcriptional- signature significantly diminished after two weeks of treatment and continued to diminish significantly until six months. Significant changes in the transcriptional signatures measured by blood tests were readily detectable just two weeks after treatment initiation. Therefore transcriptional responses provide a clinical tool for monitoring an individual TB patient's response to treatment.
[0053] As used herein, a "significant change" between gene expression datasets is indicative that treatment is effective; in contrast, treatment is ineffective if less than a significant change between the first gene expression dataset and the second gene expression dataset is detected. A significant change can be determined by a person of ordinary skill in the art upon viewing a clearly visible change in transcriptional response using a heatmap or time-scaled profile plot of normalized intensity values or a simple time-scaled line graph of the transcriptional signature between the first and second time point. In some embodiments, the significant change can be determined upon generating a simple time-scaled line graph (also called a profile plot) of normalized signal intensity values. See, for example, Figure 2A. Further embodiments determine a significant change by employing heatmaps. This is shown in Figures 2B, 3 A, 3C, 4A, 5A, 7A, 8A, 8B, and lOA-C. The heatmaps are ordered either by time point or by each participant and may also show normalized intensity values. In
yet further embodiments, the significant change is determined by line graphs showing molecular distance to health (MDTH), as shown in Figure 2E. In addition the significant change can be determined and described via a temporal molecular response algorithm, as provided for in Figures 2F, 3B, 3D, 4B, 5B, 5C, 7B, 8C, lOA-C. To statistically demonstrate and describe a significant change, a conventional level of significance of 5% (only a 5% chance this change would occur by chance = p<0.05) may be employed. As non-limiting example upon testing more than three patients, a statistical significance value of p<0.05 between the first and second time point's temporal molecular response can be employed. In other examples, the number of patients examined may, for example, be eight and the p value <0.001. When applying the temporal molecular response algorithm to all participants at all the time points, the present inventors demonstrated that the participants' temporal molecular response at two weeks was statistically significant compared to their pre-treatment temporal molecular response. In addition, at all time points after two weeks, all participants' response continued to improve and the actual results showed that there was merely a 0.1% chance that this change occurred by chance. In some embodiments a significant change is determined for a single individual (independently from results from other individuals). In certain aspects, a percentage using the temporal molecular response is determined. The percentage reflects the percentage of genes that are changing over time relative to the transcriptional signature being tested. This enhances the ability to monitor individual patients in hospitals/clinics. In certain aspects, 19% or more correlates with a good treatment response and constitutes a significant change. In other aspects, any value above 10% correlates with a good treatment response and constitutes a significant change. In some embodiment, an individual's temporal molecular response value of greater than 15 > difference between the first and second time point constitutes a significant change. [0054] As used herein, the term "array" refers to a solid support or substrate with one or more peptides or nucleic acid probes attached to the support. Arrays typically have one or more different nucleic acid or peptide probes that are coupled to a surface of a substrate in different, known locations. These arrays, also described as "microarrays" or "gene-chips" that may have 10,000; 20,000, 30,000; or 40,000 different identifiable genes based on the known genome, e.g., the human genome. These pan-arrays are used to detect the entire "transcriptome" or transcriptional pool of genes that are expressed or found in a sample, e.g., nucleic acids that are expressed as RNA, mRNA and the like that may be subjected to RT and/or RT-PCR to made a complementary set of DNA replicons. Arrays may be produced
using mechanical synthesis methods, light directed synthesis methods and the like that incorporate a combination of non-lithographic and/or photolithographic methods and solid phase synthesis methods.
[0055] Various techniques for the synthesis of these nucleic acid arrays have been described, e.g., fabricated on a surface of virtually any shape or even a multiplicity of surfaces. Arrays may be peptides or nucleic acids on beads, gels, polymeric surfaces, fibers such as fiber optics, glass or any other appropriate substrate. Arrays may be packaged in such a manner as to allow for diagnostics or other manipulation of an all-inclusive device, see for example, U.S. Pat. No. 6,955,788, which is incorporated herein by reference in its entirety.
[0056] As used herein, the term "disease" refers to a physiological state of an organism with any abnormal biological state of a cell. Disease includes, but is not limited to, an interruption, cessation or disorder of cells, tissues, body functions, systems or organs that may be inherent, inherited, caused by an infection, caused by abnormal cell function, abnormal cell division and the like. A disease that leads to a "disease state" is generally detrimental to the biological system, that is, the host of the disease. With respect to the present invention, any biological state, such as an infection (e.g., viral, bacterial, fungal, helminthic, etc.), inflammation, autoinfiammation, autoimmunity, anaphylaxis, allergies, premalignancy, malignancy, surgical, transplantation, physiological, and the like that is associated with a disease or disorder is considered to be a disease state. A pathological state is generally the equivalent of a disease state.
[0057] Disease states may also be categorized into different levels of disease state. As used herein, the level of a disease or disease state is a measure reflecting the progression of a disease or disease state as well as the physiological response upon, during and after treatment. Generally, a disease or disease state will progress through levels or stages, wherein the effects of the disease become increasingly severe. The level of a disease state may be impacted by the physiological state of cells in the sample.
[0058] As used herein, the terms "therapy" or "therapeutic regimen" refer to those medical steps taken to alleviate or alter a disease state, e.g., a course of treatment intended to reduce or eliminate the affects or symptoms of a disease using pharmacological, surgical, dietary and/or other techniques. A therapeutic regimen may include a prescribed dosage of one or more drugs or surgery. Therapies will most often be beneficial and reduce the disease
state but in many instances the effect of a therapy will have non-desirable or side-effects. The effect of therapy will also be impacted by the physiological state of the host, e.g., age, gender, genetics, weight, other disease conditions, etc.
[0059] As used herein, the term "pharmacological state" or "pharmacological status" refers to those samples from diseased individuals that will be, are and/or were treated with one or more drugs, surgery and the like that may affect the pharmacological state of one or more nucleic acids in a sample, e.g., newly transcribed, stabilized and/or destabilized as a result of the pharmacological intervention. The pharmacological state of a sample relates to changes in the biological status before, during and/or after drug treatment and may serve as a diagnostic or prognostic function, as taught herein. Some changes following drug treatment or surgery may be relevant to the disease state and/or may be unrelated side-effects of the therapy. Changes in the pharmacological state are the likely results of the duration of therapy, types and doses of drugs prescribed, degree of compliance with a given course of therapy, and/or un-prescribed drugs ingested. [0060] As used herein, the term "biological state" refers to the state of the transcriptome (that is the entire collection of RNA transcripts) of the cellular sample isolated and purified for the analysis of changes in expression. The biological state reflects the physiological state of the cells in the blood sample by measuring the abundance and/or activity of cellular constituents, characterizing according to morphological phenotype or a combination of the methods for the detection of transcripts.
[0061] As used herein, the term "expression profile" refers to the relative abundance of RNA, DNA abundances or activity levels. The expression profile can be a measurement for example of the transcriptional state or the translational state by any number of methods and using any of a number of gene-chips, gene arrays, beads, multiplex PCR, quantitative PCR, run-on assays, Northern blot analysis, or using RNA-seq, nanostring, nanopore RNA sequencing etc. Apparatus and system for the determination and/or analysis of gene expression that are readily commercially available.
[0062] As used herein, the term "transcriptional state" of a sample includes the identities and relative abundances of the RNA species, especially mRNAs present in the sample. The entire transcriptional state of a sample, that is the combination of identity and abundance of RNA, is also referred to herein as the transcriptome. Generally, a substantial fraction of all the relative constituents of the entire set of RNA species in the sample are measured.
[0063] Regarding the "expression level," the group comparison for a given disease provides the list of differentially expressed transcripts. It was found that different diseases yield different subsets of gene transcripts.
[0064] Using the present invention it is possible to determine the effectiveness of a treatment for tuberculosis at the gene-level; i.e., two diseases can have the same vector (identical proportion of differentially expressed transcripts, identical "polarity"), but the gene composition of the vector can still be disease-specific. Gene-level expression provides the distinct advantage of greatly increasing the resolution of the analysis. Furthermore, the present invention takes advantage of composite transcriptional markers. [0065] As used herein, the term "composite transcriptional markers" refers to the average expression values of multiple genes (composite of transcripts) as compared to using individual genes as markers (and the composition of these markers can be disease-specific). The composite transcriptional markers approach is unique because the user can develop multivariate microarray scores to assess disease severity in patients with, e.g., tuberculosis (TB) or systemic lupus erythematosus (SLE), or to derive expression vectors disclosed herein. It has been found that using the composite transcriptional markers of the present invention the results found herein are reproducible across microarray platform, thereby providing greater reliability for regulatory approval.
[0066] Gene expression monitoring systems for use with the present invention may include customized gene arrays with a limited and/or basic number of genes that are specific and/or customized for the one or more target diseases. Unlike the general, pan-genome arrays that are in customary use, the present invention provides for not only the use of these general pan-arrays for retrospective gene and genome analysis without the need to use a specific platform, but more importantly, it provides for the development of customized arrays that provide an optimal gene set for analysis without the need for the thousands of other, non- relevant genes. One distinct advantage of the optimized arrays and gene sets of the present invention over the existing art is a reduction in the financial costs (e.g., cost per assay, materials, equipment, time, personnel, training, etc.), and more importantly, the environmental cost of manufacturing pan-arrays where the vast majority of the data is irrelevant. By reducing the total number of genes for analysis, or eliminating genes for analysis, it is possible to, e.g., eliminate the need to manufacture thousands of expensive platinum masks for photolithography during the manufacture of pan-genetic chips that provide vast amounts of irrelevant data. Using the present invention it is possible to
completely avoid the need for microarrays if the limited probe set(s) of the present invention are used with, e.g., digital optical chemistry arrays, ball bead arrays, multiplex PCR, quantitative PCR, "RNA-seq" for measuring mRNA levels using next-generation sequencing technologies, nanostring-type technologies or any other method, apparatus and system for the determination and/or analysis of gene expression that are readily commercially available.
[0067] The "molecular fingerprinting system" of the present invention may be used to facilitate and conduct a comparative analysis of expression in different cells or tissues, different subpopulations of the same cells or tissues, different physiological states of the same cells or tissue, different developmental stages of the same cells or tissue, or different cell populations of the same tissue against other diseases and/or normal cell controls. In some cases, the normal or wild-type expression data may be from samples analyzed at or about the same time or it may be expression data obtained or culled from existing gene array expression databases, e.g., public databases such as the NCBI Gene Expression Omnibus database. [0068] As used herein, the term "differentially expressed" refers to the measurement of a cellular constituent (e.g., nucleic acid, protein, enzymatic activity and the like) that varies in two or more samples, e.g., between a disease sample and a normal sample. The cellular constituent may be on or off (present or absent), upregulated relative to a reference or downregulated relative to the reference. For use with gene-chips or gene-arrays, differential gene expression of nucleic acids, e.g., mRNA or other RNAs (miRNA, siRNA, hnRNA, rRNA, tRNA, etc.) may be used to distinguish between cell types or nucleic acids. Most commonly, the measurement of the transcriptional state of a cell is accomplished by quantitative reverse transcriptase (RT) and/or quantitative reverse transcriptase-polymerase chain reaction (RT-PCR), genomic expression analysis, post-translational analysis, modifications to genomic DNA, translocations, in situ hybridization and the like.
[0069] The skilled artisan will appreciate readily that samples may be obtained from a variety of sources including, e.g., single cells, a collection of cells, tissue, cell culture and the like. In certain cases, it may even be possible to isolate sufficient RNA from cells found in, e.g., urine, blood, saliva, tissue or biopsy samples and the like. In certain circumstances, enough cells and/or RNA may be obtained from: mucosal secretion, feces, tears, blood plasma, peritoneal fluid, interstitial fluid, intradural, cerebrospinal fluid, sweat or other bodily fluids. The nucleic acid source, e.g., from tissue or cell sources, may include a tissue biopsy sample, one or more sorted cell populations, cell culture, cell clones, transformed cells,
biopsies or a single cell. The tissue source may include, e.g., brain, liver, heart, kidney, lung, spleen, retina, bone, neural, lymph node, endocrine gland, reproductive organ, blood, nerve, vascular tissue, and olfactory epithelium.
[0070] The present invention includes the following basic components, which may be used alone or in combination, namely, one or more data mining algorithms, one a novel algorithm specifically developed for this TB treatment monitoring, the Temporal Molecular Response; the characterization of blood leukocyte transcriptional gene sets; the use of aggregated gene transcripts in multivariate analyses for the molecular diagnostic/prognostic of human diseases; and/or visualization of transcriptional gene set-level data and results. Using the present invention it is also possible to develop and analyze composite transcriptional markers. The composite transcriptional markers for individual patients in the absence of control sample analysis may be further aggregated into a reduced multivariate score.
[0071] An explosion in data acquisition rates has spurred the development of mining tools and algorithms for the exploitation of microarray data and biomedical knowledge. Approaches aimed at uncovering the function of transcriptional systems constitute promising methods for the identification of robust molecular signatures of disease. Indeed, such analyses can transform the perception of large-scale transcriptional studies by taking the conceptualization of microarray data past the level of individual genes or lists of genes. [0072] The present inventors have recognized that current microarray-based research is facing significant challenges with the analysis of data that are notoriously "noisy," that is, data that are difficult to interpret and do not compare well across laboratories and platforms. A widely accepted approach for the analysis of microarray data begins with the identification of subsets of genes differentially expressed between study groups. Users may try subsequently to "make sense" out of resulting gene lists using standard algorithms and existing scientific knowledge and by validating in independent sample sets and in different microarray analyses.
Example 1
[0073] Pulmonary tuberculosis (PTB) is a major and increasing cause of morbidity and mortality worldwide caused by Mycobacterium tuberculosis (M. tuberculosis). However, the majority of individuals infected with M. tuberculosis remain asymptomatic, retaining the infection in a latent form, and it is thought that this latent state is maintained by an active
immune response. Blood is the pipeline of the immune system, and as such it is the ideal biologic material from which the health and immune status of an individual can be established.
[0074] Blood represents a reservoir and a migration compartment for cells of the innate and the adaptive immune systems, including either neutrophils, dendritic cells and monocytes, or B and T lymphocytes, respectively, which during infection will have been exposed to infectious agents in the tissue. For this reason whole blood from infected individuals provides an accessible source of clinically relevant material where an unbiased molecular phenotype can be obtained using gene expression microarrays as previously described for the study of cancer in tissues (Alizadeh AA., 2000; Golub, TR., 1999; Bittner, 2000), and autoimmunity (Bennet, 2003; Baechler, EC, 2003; Burczynski, ME, 2005; Chaussabel, D., 2005; Cobb, JP., 2005; Kaizer, EC, 2007; Allantaz, 2005; Allantaz, 2007), and inflammation (Thach, DC, 2005) and infectious disease (Ramillo, Blood, 2007) in blood or tissue (Bleharski, JR et ah, 2003). Microarray analyses of gene expression in blood leucocytes have identified diagnostic and prognostic gene expression signatures, which have led to a better understanding of mechanisms of disease onset and responses to treatment (Bennet, L 2003; Rubins, KH., 2004; Baechler, EC, 2003; Pascual, V., 2005; Allantaz, F., 2007; Allantaz, F., 2007). These microarray approaches have been attempted for the study of active and latent TB but as yet have yielded small numbers of differentially expressed genes only (Jacobsen, M., Kaufmann, SH., 2006; Mistry, R, Lukey, PT, 2007), and in relatively small numbers of patients (Mistry, R., 2007), which may not be robust enough to distinguish between other inflammatory and infectious diseases. The present inventors recognize that a neutrophil driven blood transcriptional signature in active TB patients was missing in the majority of latent TB individuals and in healthy controls. See, also (9). This signature of active TB was reflective of lung radiographic disease and was diminished after two months of treatment. The signature was dominated by interferon-inducible genes, and at a modular level the active TB signature was distinct from other infectious or autoimmune diseases.
[0075] To define an immune signature in TB, the blood of TB patients before and after commencement of treatment and controls were analyzed; patients were selected using very stringent clinical criteria.
[0076] Approximately one third of the world is infected with the pathogen Mycobacterium tuberculosis (Mtb), the cause of TB. While most remain asymptomatic, termed latent, approximately 10% develop active TB during their lifetime (1). Over nine
million new cases of active TB and 1.7 million deaths annually have been reported (2). Improved diagnostics, more effective and shorter treatments than the current minimum of six months, and improvements in treatment monitoring are badly needed.
[0077] Active pulmonary TB diagnosis requires culture of Mtb, which may take up to six weeks (3). Conventional determination of antibiotic sensitivities demands several more weeks of culture. Mtb is isolated from sputum, which is often difficult to obtain, or from lung washings using invasive and expensive methods, which are prohibitive in developing countries. Due to insufficient samples and poor availability of culture, approximately 30% of patients in the USA and 50% of South African patients are treated empirically (2, 4). Although the World Health Organization (WHO) endorsed Xpert MTB/RIF automated molecular test for Mtb results in rapid diagnosis, this test still requires sputum (5). After diagnosis there are no available early biomarkers correlating with treatment success, resulting in significant delay in assessing treatment response. In poor responders this delay can result in worsening disease and spread of drug resistant bacteria. Currently sputum conversion to negative culture after two months of treatment is the only accepted biomarker (6). However a systematic review and meta-analysis to assess its accuracy to predict an individual's treatment failure revealed low sensitivity and modest specificity (7). Chest X-rays are commonly used to assess response but are not universally available and assessment is difficult to standardize (8). Lack of practicable treatment monitoring is concerning due to the development of multidrug resistant (MDR) and extensively drug resistant (XDR) TB, mainly caused by non-adherence or inappropriate drug regimens, resulting in a detrimental impact on global TB treatment programs.
[0078] A whole blood transcriptional signature can distinguish active TB from latent TB and other diseases, and be correlated with radiographic extent of disease (9). This active TB blood signature diminished after two months of successful treatment and reverted to that of healthy individuals after completing treatment (9). Early blood biomarkers correlating with treatment response will allow monitoring of patients without sputum, expedite knowledge of an individual's treatment response and may permit stratification of patients requiring differing treatment regimens. Furthermore early biomarkers can be instrumental in drug development.
[0079] Certain embodiments of the present invention are designed to establish that early changes in a blood transcriptional response can be observed during anti-TB treatment.
Furthermore, it adds to previous results by examining the transcriptional treatment response directly in a larger cohort from a high-burden TB country, South Africa (2).
[0080] METHODS: Study Population: Blood was collected between May 2008 - November 201 1 in Ubuntu TB/HIV clinic, South Africa and Royal Free Hospital NFIS Trust, London from patients (age >17 years) with Mtb culture positive active pulmonary TB (Figure 1A; Table 2A,B). Latent TB patients were asymptomatic with a positive QuantiFERON-TB Gold In-Tube assay (Cellestis). South African active TB patients were sampled before treatment and at two weeks and two, six, and 12 months after treatment initiation. Response was assessed clinically. The UK 201 1 TB patients were sampled before treatment and at two weeks and two, four and six months after treatment initiation. Chest X-rays were performed before and during treatment. The 2009 cohorts were as previously described (9).
[0081] Expression Profiling: The following were performed according to the manufacturer's instructions. Blood was collected into Tempus tubes (Applied Biosystems/Ambion). 201 1 sample's RNA was isolated using MagMAX-96 Blood RNA Isolation Kit (Applied Biosystems/Ambion), globin reduced using GLOBINclear 96- well format kit (Applied Biosystems/Ambion), biotinylated, amplified antisense complementary RNA (cRNA) targets were prepared using lllumina CustomPrep RNA amplification kit (Applied Biosystems/Ambion). RNA integrity and yield were assessed using Agilent 2100 Bioanalyzer (Agilent Technologies) and NanoDrop 800 spectrophotometer (NanoDrop Products, Thermo Fisher Scientific), respectively. Labeled cRNA was hybridized to lllumina Human HT-12 V4 BeadChip arrays (lllumina) and scanned on an lllumina iScan. GenomeStudio (lllumina) was used for quality control and to generate signal intensity values. 2009 sample's RNA was processed as previously described (9). Using GeneSpring GX version 1 1.5 (Agilent Technologies) raw data were analyzed by the following: background subtraction, filtering by detection significance (pO.01), threshold set, log2 transformed, per- chip normalised (75th percentile shift algorithm) and per-gene normalised to median of latent TB samples.
[0082] Statistical Analysis: GeneSpring 1 1.5 was used to select transcripts with an expression fold change (active TB-signature: twofold expression from latent TB samples; treatment specific signature: threefold expression in 8/1 1 training set matched untreated and six-month treated samples). Statistical filtering was then applied using non-parametric tests and multiple testing corrections (Benjamini Hochberg or Bonferroni) (10, 1 1). The Treated South Africa 201 1 cohort was randomised into a training and test set (12). Derived
signatures were then applied to the: Treated South Africa 201 1 cohort, Treated UK 201 1 Cohort, and cohorts from the earlier Berry et al. (2010) study. Data was displayed in heatmaps generated by hierarchical clustering (distance metric: Pearson's uncentered with average linkage (13)) showing either clustering of transcripts and samples, or just clustering of transcripts.
[0083] Molecular distance to health (MDTH) was determined as previously described (14). In one embodiment, the Temporal Molecular Response was calculated from the sum of transcripts that were greater than twofold different between one time point and the baseline values, then expressed as a percentage of the total number of transcripts in that signature. MDTH and temporal molecular response were calculated in Microsoft Excel 2010. Graphs, p-values and linear regression were generated in GraphPad Prism version 5 for Windows except linear mixed models was performed in SASTM software (SAS Institute Inc., USA). Ingenuity Pathway Analysis (Ingenuity Systems, Inc., Redwood, CA), identified significant canonical pathways (Fisher's exact Benjamini Hochberg p<0.05). [0084] Study Population and Inclusion Criteria: All participants in South Africa were recruited from the Ubuntu TB/HIV clinic in Khayelitsha, a large peri-urban African township in Cape Town which has over 1000 TB notifications annually. During the period May 2008 - August 2010 whole blood was collected from adult patients (age >\1 years) with drug sensitive Mtb culture proven active pulmonary TB (Figure 1A). Due to the population's high Mtb exposure, controls were considered as asymptomatic individuals with previous exposure to Mtb (latent TB patients); exposure was evidenced by a positive QuantiFERON-TB Gold In-Tube (QFT). Participants with latent TB were recruited from individuals self-referring to the voluntary testing clinic. All participants had negative HIV status.
[0085] All participants in the 2009 UK Training and Test cohorts were selected as previously described (9). The UK 201 1 Active TB Validation Cohort were all Mtb culture proven adults (>17 years) recruited between August 2009 - November 201 1 from the Royal Free Hospital, London (Figure IB). Clinical and demographic data was recorded for all participants and stored in a database.
[0086] Follow Up Period: All 20 Treated 201 1 South Africa active TB patients completed a full six months of treatment. Each patient was sampled for venous blood at every time point: two weeks, two months, six months and 12 months after initiation of treatment (Figure
1A). Patient's response to anti-TB treatment was assessed clinically during the 12-month period. All patients were discharged from the program as cured.
[0087] Eight Treated 201 1 UK Active TB patients completed a full six months of treatment, one patient completed nine months of treatment due to radiographic uncertainty of treatment success. Each patient was sampled for venous blood at two weeks, two months, four months and six months after initiation of treatment (Figure IB). Four patients had a sample at every time point, three patients had samples at two, four and six months, and four patients had samples at two weeks and six months. As part of their routine medical care all patients had chest X-rays minimally at the beginning and end of their treatment and were discharged from the program as cured.
[0088] IFNy Release Assay Testing: The QFT Assay (Cellestis) was performed according to the manufacturer's instructions.
[0089] Gene Expression Profiling: 3ml of whole blood were collected into Tempus tubes (Applied Biosystems/Ambion) by standard phlebotomy, vigorously mixed immediately after collection, and stored between -20 and -80 °C before RNA extraction. South Africa and UK 2011 sample's RNA was isolated using 1.5ml whole blood and the MagMAX-96 Blood RNA Isolation Kit (Applied Biosystems/Ambion) according to the manufacturer's instructions. 250μg of isolated total RNA was globin reduced using the GLOBINclear 96-well format kit (Applied Biosystems/Ambion) according to the manufacturer's instructions. Total and globin-reduced RNA integrity was assessed using an Agilent 2100 Bioanalyzer (Agilent Technologies). RNA yield was assessed using a NanoDrop 800 spectrophotometer (NanoDrop Products, Thermo Fisher Scientific). Biotinylated, amplified antisense complementary RNA (cRNA) targets were then prepared from 200 - 250ng of the globin- reduced RNA using the Illumina CustomPrep RNA amplification kit (Applied Biosystems/Ambion). 750ng of labeled cRNA was hybridized overnight to Illumina Human HT-12 V4 BeadChip arrays (Illumina), which contained more than 47,000 probes. The arrays were washed, blocked, stained and scanned on an Illumina iScan, as per manufacturer's instructions. GenomeStudio (Illumina) was then used to perform quality control and generate signal intensity values. [0090] South African and UK 2009 sample's RNA was isolated as previously described and hybridized to Illumina Human HT-12 V3 BeadChip arrays (Illumina) (9). Probes were translated from the HT-12 V3 BeadChip arrays to HT-12 V4 BeadChip arrays using
GeneSpring GX version 1 1.5 (Agilent Technologies) and translated to slightly fewer probes in V4.
[0091] Raw data were processed using GeneSpring GX version 1 1.5 (Agilent Technologies), and the following was applied to all analysis. After background subtraction each probe was attributed a flag to denote its signal intensity detection p-value. Flags were used to filter out probe sets that did not result in a 'present' call in at least 10% of the samples, where the 'present' lower cut off = 0.99. Signal values were then set to a threshold level of 1 , log2 transformed, and per-chip normalised using 75th percentile shift algorithm. Next per-gene normalisation was applied by dividing each messenger RNA transcript by the median intensity of the latent TB samples. All statistical analysis was performed after this stage.
[0092] All data collected and analyzed in the experiments adhere to the Minimal Information About a Microarray Experiment (MIAME) guidelines.
[0093] Statistical Analysis: GeneSpring 1 1.5 was used to select transcripts that displayed a degree of expression variability. A filter was set to include only transcripts that had at least twofold changes from the median intensity of all latent TB samples and present in at least 10% of the samples. This approach was used to determine all the 'active TB-transcriptional signatures'. To divide the South Africa 201 1 cohort into a training and test set, a computer algorithm was used for randomization (12). For the specific treatment response signature transcripts had to satisfy a threefold expression filter in eight of the 1 1 training set matched untreated and six month treated samples. Selected transcripts were then filtered by different levels of statistical stringency in GeneSpring 1 1.5. Non-parametric tests with multiple testing corrections were applied to all analyses (10, 1 1). The active TB-transcriptional signatures were generated by Mann Whitney unpaired Benjamini Hochberg p<0.01 or Bonferroni p<0.01 (Figure 2B). The statistical filter used to generate the specific TB treatment response- transcriptional signature was Mann Whitney paired Benjamini Hochberg p<0.05. The 393 and 86 active TB signatures were obtained as described previously (Figure 8) (9). The transcript lists for each signature were then applied to the cohorts they were derived from and/or to the following cohorts: South Africa 201 1 active TB Training and Test Set, UK 201 1 Cohort and the three cohorts from an earlier study. Visualization of the data was performed by heatmaps using hierarchical clustering where the correlation distance metric employed for the clustering was Pearson's uncentered with average linkage (13). Heatmaps displayed either hierarchical clustering of both transcripts and samples or hierarchical clustering of transcripts
with forced grouping of samples. Visualization of common and different transcripts by Venn diagrams was performed in GeneSpring 1 1.5. Translation of probes/transcripts between V3 HT12 and V4 HT12 chip was performed using the probe ID and Illumina specific probe_id. Slightly fewer probes were translated from V3 to V4. [0094] Molecular distance to health (MDTH) was determined for each time point, as previously described (14). Temporal Molecular Response was determined per individual, for each transcriptional signature, by calculating the sum of the transcripts that were greater than twofold up or down at a specific time point, e.g. two weeks, compared to the raw pre- treatment intensity values. For intensity values of zero a value of 10 to the power of -20 (10~ 20) was introduced. The calculated number of altered transcripts was then expressed as a percentage of the total number of transcripts in the transcriptional signature. This calculation was then repeated for the rest of the time points. MDTH and temporal molecular response were calculated in Microsoft Excel 2010. GraphPad Prism version 5 for Windows was used to generate graphs, determine linear regression, and determine associated p-values using either Friedman and Dunn's multiple comparison test for MDTH data or ANOVA repeated measures and Tukey's multiple comparison test for temporal molecular response data. Linear mixed models, fixed effects, was performed in SAS/STAT® software (SAS Institute Inc., USA). Statistical tests applied were dependent on the distribution of the data as determined by D'Agostino and Pearson omnibus normality test. Pathway analyses were performed using Ingenuity Pathway Analysis (Ingenuity Systems, Inc., Redwood, CA). Canonical pathways analysis identified the most significantly represented pathways in the datasets (Fisher's exact Benjamini Hochberg p<0.05).
[0095] Results: Participants Demographics and Characteristics: Participant numbers in the South Africa 201 1 cohort are described in Figure 1 ; 29 active TB patients were recruited and sampled for transcriptomic analysis; all active TB patients were treated for six months with quadruple antitubercular therapy (rifampin, pyrazinamide, isoniazid and ethambutol) for two months followed by rifampin and isoniazid for four months. Of these, 20 were resampled after two weeks, and after two, six and 12 months after initiation of treatment; blood from 38 latent individuals was sampled as asymptomatic controls. Demographics and clinical characteristics of the South Africa 201 1 and UK 201 1 cohorts are reported in Tables 2A and 2B. Patient demographics and clinical characteristics of the 2009 South Africa cohort and UK cohorts have been previously described (9). All treated active TB patients included in the study had drug sensitive treatment, took all treatment prescribed, showed successful
clinical/radiological response to treatment, did not relapse within one year and were discharged from the program as cured.
[0096] A Change in Transcriptional Response is Readily Detectable after Two Weeks of Treatment: To determine whether an active TB transcriptional signature in the blood of the 201 1 South Africa cohort was perturbed upon treatment, gene expression profiles of only significantly detectable genes without further filtering (detected p<0.01 from background, 16,856 transcripts), were examined in the 20 active TB patients before, during (two weeks and two months), at the end (six months), and after treatment (12 months). By plotting the expression profiles of the 16856 transcripts along a time scaled x-axis, a marked change was readily observed after two weeks of anti-TB treatment (Figure 2A).
[0097] An active TB 664-transcript signature was derived from differentially expressed genes in the active TB patients compared to the latent TB patients in the Untreated South Africa 2011 cohort (Figure 2B). First, all transcripts were normalized to the median of the latent TB patients, then only transcripts with an equal or greater than twofold change from the median were selected, before finally applying a stringent statistical filter (Bonferroni; Figure 2B; 664 transcripts). When these signatures were applied to the Treated South Africa 201 1 Cohort, a marked and rapid change in the transcriptional response was observed as early as two weeks, which then continued through two and six months after treatment initiation (Figure 2B). As previously reported, Ingenuity Pathway Analysis (IP A) of these blood transcriptional signatures demonstrated a highly significant over-representation of Interferon (IFN)-signaling genes including Type I and Type II IFN (Figures 2C and D, pO.001).
[0098] The Transcriptional Response Changes Significantly at Two Weeks, Two Months & Six Months after Treatment Initiation: Since the South Africa untreated active TB signatures diminished in response to treatment, the present inventors determined that there was a significant change in the transcriptional signature during treatment. For this determination, the molecular distance to health (MDTH) algorithm was determined as this generates a quantitative score for the degree of transcriptional perturbation in a disease cohort relative to the controls (14). The present inventors recognized that MDTH positively correlates with the severity of active pulmonary TB, as defined by the radiological extent of disease (9). The present inventors found that the median MDTH associated with the 664 South African untreated active TB-transcriptional signature altered significantly at two, six, and twelve months, compared to the median pre-treatment MDTH (Figure 2E).
[0099] To expand on the treatment induced transcriptional response, a metric was developed that allowed us to evaluate each individual's change in gene expression relative to their own expression profile, rather than relative to a control group. This 'temporal molecular response' offers a potential advantage in the clinical setting to allow separate assessment of each patient's outcome. For a given signature, the temporal molecular response was determined by measuring the transcriptional perturbation between two time points, and expressing this value as a percentage of the total number of transcripts constituting the signature. The mean temporal molecular response associated with the South Africa untreated active TB 664 transcript signature altered rapidly and significantly as early as two weeks, and continued to alter significantly at two months and six months (Figure 2F). This finding demonstrates that the transcriptional signature not only changes rapidly and as early as two weeks, but also continues to significantly change between two weeks and two months.
[00100] The changing transcriptional response is independent of the magnitude of the untreated transcriptional signature: It may be predicted that individuals with more extensive disease would respond to treatment differently from those with minimal disease. However the magnitude of the patient's temporal molecular response during treatment, at both two weeks and two months, did not correlate with the magnitude of their pre-treatment transcriptional signature, as evidenced by MDTH (r2<0.1 , non-significant) (Figure 6). However, the patient's temporal molecular response after treatment, at six months and 12 months did significantly correlate with their pre-treatment MDTH (r2=0.25, p=0.02 and r2=0.57, p=0.001 respectively) (Figure 6). This finding, that the magnitude of the pre- treatment signature does not appear to be able to predict the patient's response, further underscores the benefit of the temporal molecular response in offering continuous monitoring throughout treatment. [00101] A specific 'TB treatment response signature' significantly diminishes at two weeks, two months and after completion of treatment: The 664-transcript active TB signature significantly and rapidly changed in response to treatment (Figure 2B, E and F). This signature was derived by identification of differentially expressed genes between untreated active TB and latent TB patients. [00102] In addition, a transcriptional signature that specifically reflected the response of patients to clinically successful anti-TB treatment (comparing time points 0 and 6 months) was determined. To determine the treatment specific signature, a computer algorithm was used to randomize the South Africa 201 1 cohort into two groups of patients (12) (Figure 1).
This allowed us to derive the signature from one group of patients (Active TB Training Set) and then validate findings in another independent group of patients (Active TB Test Set). Upon analysis, 391 transcripts were found to be significantly differentially expressed between the untreated Active TB Training Set samples and their matched six-month treated samples. The 391 -transcript treatment specific signature was shown to rapidly and significantly change at two weeks, two and six months after treatment initiation in the Active TB Training set. This was validated in the Active TB Test Set (Figure 3A-E). In both cohorts the change in the temporal molecular response was significant at two weeks post-treatment (Figure 3B and D). Analysis of the 391 transcripts by IPA indicated the most significantly represented pathways were related to the innate immune pathways, encompassing genes related to complement, Toll-like receptors, a NOD like receptor gene and interleukin-lB, which were all significantly altered with treatment (Figure 3E). Of the 391 -transcript treatment signature genes, 68% were also present in the 664-transcript active TB signature (Figure 3F).
[00103] Measuring an individual patient's transcriptional response to anti-TB treatment: Each patient's discrete treatment response is shown in the heatmaps and by graphical form using the temporal molecular response in Figure 4 and Figure 7. All 20 patients in the active TB treated cohort had a rapid and early positive temporal response after two weeks of treatment. Interestingly, not all the individual transcriptional responses were identical (Figure 4A, Figure 7A) as demonstrated by the quantitative scoring provided by the temporal molecular responses (Figure 4B, Figure 7B).
[00104] By both the MDTH and temporal molecular response, it was observed that none of the transcriptional signatures revealed significant differences between two months and six months post treatment initiation (Figure 2E and F; Figure 3B and D; and Figure 8C). This could suggest that the transcriptional response reaches a plateau at two months and would therefore be no different from latent TB patients. Therefore, each of the time points was compared: two, six, and 12 months to the latent TB expression profiles. It was determined that 151 transcripts were differentially expressed between two months and latent TB (Mann Whitney paired Benjamini Hochberg pO.01). However no genes were significantly differentially expressed between six & 12 months, six months & latent TB, and 12 months & latent TB (Mann Whitney paired Benjamini Hochberg p>0.01).
[00105] Validation of early anti-TB treatment blood transcriptional response: To determine whether the significant change in the 391 -transcript treatment specific signature that had been demonstrated in a South Africa cohort was also generalizable to patients in an
intermediate burden setting, the signature was tested in UK. As observed in the South Africa cohort the signature was rapidly and significantly diminished at two weeks onwards post commencing treatment (Figure 5A and B). The changes in the blood transcriptional response could be clearly quantified in individual patients as shown by the temporal molecular response (Figure 5C). The significant transcriptional blood change correlated with successful treatment of patients as assessed after six months by radiographic and clinical parameters.
[00106] The significant change in transcriptional response at two weeks occurs when applying active TB signatures derived from other cohorts: thus far it was demonstrated that the 664-transcript active TB signature (Figure 2), and the treatment specific 391 -transcript signature (Figure 3) diminished rapidly and significantly with treatment at two weeks. Then it was sought to determine if active TB transcriptional signatures derived from other cohorts would also diminish in response to treatment. Therefore active TB transcriptional signatures derived from cohorts used in the earlier Berry et al. (2010) study (9) were applied to all the time points of the Treated South Africa 201 1 samples. [00107] The established 393- and 86-transcript active TB signatures from the earlier Berry et al. (2010) study (9) obtained by comparing active TB patients to latent TB patients and healthy controls were applied first. The present inventors demonstrate that the 393 and 86- transcript active TB signatures significantly and rapidly diminished in the South Africa 2011 cohort, and this occurred as early again as two weeks (Figure 8A-C). Additionally active TB signatures from the Berry et al (2010) cohorts were derived, only comparing active TB patients to latent TB patients (removing healthy controls), using the same analysis approach as was used to determine the 664- active TB signature in the Untreated South Africa 2011 cohort (Figure 2A-C and Figure 2E-F). The active TB transcriptional signatures thus obtained from the different cohorts (named 2009 UK Training set, 2009 UK Test set and 2009 South Africa set, Figure 9) showed significant changes in the transcriptional response in the Treated South Africa 201 1 Cohort at two weeks, two months and at the end of treatment (Figure lOA-C).
[00108] A core set of genes (344 transcripts) were found to be overlapping between these 2009 derived active TB transcriptional signatures (Figure 10D). The overlapping genes had many genes in common with both the South Africa 201 1 derived active TB 664-transcript signature and the 201 1 treatment specific 391 -transcript signature (Figure 10E).
[00109] The whole blood active TB-transcriptional signatures derived from a South African cohort, dominated by IFN signaling and innate immune response genes, showed a readily detectable change in response to clinically successful anti-TB treatment. Importantly the treatment-associated changes in the active TB-transcriptional signature and a specific TB treatment response-transcriptional signature were rapid and highly significant as early as two weeks after the initiation of therapy. The transcriptional response to treatment could be individually measured in each patient and was independent of the magnitude of their pre- treatment transcriptional signature. The significant and early change in the treatment specific transcriptional signature was then validated in a UK cohort. These findings demonstrate that blood transcriptional signatures can be pragmatic as early surrogate markers of a successful treatment response, and can be used as biomarkers in both the clinical setting and in drug development. In certain embodiments, the method is useful for improving stratification and monitoring of clinical treatment of active TB patients, testing novel therapies in to enhance efficacy in treatment of drug-sensitive Mtb infection in clinical trials, and in the testing of novel drugs for use in the potential treatment of MDR- and XDR-TB.
[001 10] An active TB transcriptional signature, originally derived from a UK cohort, which distinguished active TB patients from patients with other inflammatory and infectious diseases and which correlated with the radiographic extent of disease, was demonstrated (9). The transcriptional response in the high-burden TB country of South Africa was evaluated before, during, and after anti-TB treatment. The study of TB patients in both the UK and South Africa provided gene expression profiles across diverse host populations, exposed to different local environments and likely different Mtb strains. The South African cohort contained participants from Khayelitsha, a large peri-urban African township in Cape Town, where 1.5% of the population develops active TB annually. It was found that South Africa active TB patients (all HIV uninfected) had more differentially expressed genes that those from the UK. This may be explained by a higher incidence of co-infection with other microorganisms and viruses, besides HIV, or a higher burden of Mtb infection due to delayed diagnosis relative to countries like the UK, present in South Africa. For example, although the exact helminth prevalence in adults is unknown, data from surveys suggest between 70- 100% of children are infected (15). Although the number of genes differed between the South Africa and UK cohorts, the most significantly represented pathways, IFN signaling and innate immune response pathways, were the same. Notably many of the genes contained within the innate immune response pathways in all the cohorts, were also interferon inducible
genes (Table 1), including the complement genes, Toll-like receptor genes, and familiar IFN inducible genes such as CXCL10 and OAS genes (16-20).
[001 1 1] Studies in TB. Maertzdorf et al examined whole blood gene expression of active TB and latent TB patients in cohorts from both South Africa and The Gambia (21 , 22). Although some IFN inducible and innate response genes were significantly over expressed in the active TB patients, different microarray chips and analysis strategy were employed.
[001 12] While it is widely appreciated that the diagnosis of TB has many difficulties, the present inventors recognize that TB treatment monitoring is a difficult challenge in trying to eradicate Mtb infection. So much so that in April 2010 the Centers for Disease Control and National Institutes of Health brought together experts in the field and research scientists with the sole purpose of addressing this problem (23). The consequences of poor treatment monitoring, and therefore impending inadequate treatment, includes worsening of a patient's disease, increasing potential for disease spread and most worryingly an escalation in drug resistant mycobacteria. Currently the two-month sputum culture conversion rate, used to measure anti-TB treatment response, is the only biomarker of successful TB treatment (6). However sputum culture conversion is a time consuming test, since it takes several weeks to grow the bacilli and results can be compromised by contamination. In fact, often the patients who have improved are unable to expectorate sputum at two months but then are wrongly labeled as having a negative result (24). Furthermore although sputum conversion has efficacy as a surrogate end point of treatment response in clinical trials evaluating new drugs, a systematic review and meta-analysis to assess its accuracy to predict an individual's treatment failure revealed low sensitivity and modest specificity (7, 25). While other biomarkers have also been trialed, including C-reactive protein, IFN-γ and neopterin, all have shown poor sensitivity and specificity (26). Chest X-rays are commonly used in the clinical setting as a marker of treatment response but they generally improve more slowly than the clinical response and lack specificity as interpretation can be confounded by previous lung damage (24). Moreover, interpretation of chest X-ray changes in response to treatment has not yet been standardised, and the facilities are not always available in developing countries (8). Therefore there is clearly a need for early and easily detectable biomarkers for treatment monitoring, capable of detecting drug resistance or poor treatment adherence and available for patients unable to produce sputum. In addition, such blood biomarkers of early anti-TB treatment response would be vital in clinical trials to aid the evaluation and development of more effective new and shorter treatment regimens.
[00113] In UK patients, active TB signatures, 393 and 86 transcripts, diminished at two months of treatment (9). The present inventors now show a significant blood transcriptional response to treatment occurs rapidly and as early as two weeks (Figures 2A, 2B, 2E, 2F, 3A- D, 4A-B, 5A-C, 7A-B. 8A-C, l OA-C) or sooner. This significant change in transcriptional response continued between two weeks and two months and again between two months and six months. It was demonstrated that this significant change occurred in all active TB- transcriptional signatures derived from both South Africa and UK cohorts. The use of this approach as an early biomarker correlating with treatment response strengthens its use as an adjunct diagnostic tool as well as an early treatment biomarker. A significant response in the treatment specific-transcriptional signature, derived from a clinically successfully treated active TB cohort, and validated in two other treated active TB cohorts, was demonstrated (Figure 3C-D and 5A-C). This treatment specific transcriptional signature also had many genes in common with the active TB transcriptional signatures. Therefore, this study will help guide future exploration for a highly specific subset of genes that explicitly correlates with a patient's mycobacterial response to anti-TB treatment, therefore acting as a surrogate marker of treatment failure or success.
[001 14] Although no other studies have looked directly at the transcriptional response to TB treatment, two other studies have observed some transcriptional changes, but only measured at two months or after treatment completion. Mistry et al. studied whole blood gene expression in patients from South Africa, comparing patients with active TB, recurrent reactivation of TB, cured TB and latent TB (28). These study methods were different from the methods employed herein because Mistry et al. did not measure the transcriptional profile during treatment but only after completion of treatment. Mistry et al. showed that those who were cured from TB displayed similar expression profiles to those with latent infection. There was a small but non-significant increase in gene expression six months after stopping the anti-TB treatment in a small number of active TB patients (e.g., Figure 4B). This may be explained by the continuous high exposure to infections in South Africa, as anti-TB treatment consists of antibiotics capable of treating a broad-spectrum of bacteria. Joosten et al. showed in a small cohort from The Gambia that their active TB gene set, distinguishing active from latent TB, also diminished at two months of treatment (29). Embodiments of the present invention, however, demonstrate the accomplishment of a novel, inexpensive, fast automated molecular method to measure blood gene expression profiles. Techniques such as this can be applied to early treatment blood transcriptomic of TB treatment response. Therefore early
treatment blood transcriptome analysis of TB treatment response at two weeks (or sooner) has great potential for development as a pragmatic blood biomarker for clinical use.
[001 15] A further problem in the management of TB is the extended length of treatment, requiring a minimum of six months, which has a negative impact on patient adherence and treatment completion. Therefore the ability to stratify patients into groups that may require shorter lengths of treatment, particularly in resource limited settings, could be of value in improving patient compliance and reducing treatment related side effects. It is shown herein that transcriptional response of some patients appeared to plateau before six months (Figures 4B, 5C and 7B), suggesting a tailored treatment response for individual patients may be possible, and that blood transcriptional signatures could help with this stratification.
Example 2
[001 16] This example provides further advances by the present inventors in methods for monitoring changes in blood transcriptional signatures in response to antituberculosis treatment and details use of these changes as early biomarkers of a successful response. In particular, significant changes in the transcriptional signatures measured by blood tests were readily detectable just two weeks after treatment initiation, and transcriptional response to treatment is shown as being readily measured in individual patients. These findings further support that blood transcriptional signatures are useful as early surrogate biomarkers of successful treatment response. Unlike Example 1 , use of a 320 gene (Table 12) transcriptional signature is prominently disclosed in Example 2.
[001 17] More specifically, blood transcriptional profiles of untreated active tuberculosis patients in South Africa were analysed before, during (two weeks and two months), at the end of (six months) and after (12 months) antituberculosis treatment, and compared to individuals with latent tuberculosis. An active-tuberculosis transcriptional signature and a specific treatment-response transcriptional signature were derived. The specific treatment response transcriptional signature was tested in two independent cohorts. Two quantitative scoring algorithms were applied to measure the changes in the transcriptional response. The most significantly represented pathways were again determined using Ingenuity Pathway Analysis. An active tuberculosis 664-transcript signature and a treatment specific 320-transcript signature significantly diminished after two weeks of treatment in all cohorts, and these continued to diminish until six months. The transcriptional response to treatment could be individually measured in each patient.
[001 18] Active pulmonary TB diagnosis requires culture of Mtb, which may take up to six weeks [3]. Although the World Health Organization (WHO) endorsed GeneXpert MTB/RIF automated molecular test for Mtb results in rapid diagnosis [4], this test still requires sputum which may be difficult to obtain. Difficulties in obtaining sputum lead to approximately 30% of patients in the USA and 50% of South African patients to be treated empirically [2], [5]. After diagnosis there are no available early biomarkers correlating with treatment success, resulting in significant delay in assessing treatment response. Currently conversion to negative culture after two months of treatment is the only accepted biomarker [6]. However a systematic review and meta-analysis of sputum conversion revealed low sensitivity and modest specificity for the prediction of treatment failure [7]. Chest X-rays are commonly used to assess response but are not universally available and assessment is difficult to standardise [8]. This lack of effective treatment monitoring can lead to the development and spread of multidrug resistant (MDR) and extensively drug resistant (XDR) TB, which are mainly caused by non-adherence or inappropriate drug regimens, with a detrimental impact on global TB control.
[00119] To date transcriptional profiling has been used successfully in cancer classification, to identify prognostic biomarkers [9], 'and to distinguish between inflammatory and infectious diseases [10]. Moreover, a whole blood transcriptional signature may be used to distinguish active TB from latent TB and other diseases, and it is correlated with radiographic extent of disease [1 1 ]. This active TB blood signature diminished in seven patients after two months of successful treatment and reverted to that of healthy individuals after completing treatment [1 1]. Earlier blood biomarkers correlating with treatment response would improve monitoring of individual patient treatment responses without the need for sputum production, which may permit stratification of patients requiring differing treatment regimens. Additionally, early biomarkers may aid in anti-TB drug development.
[00120] The study detailed in this example was designed to establish if early changes in blood transcriptional responses can be observed during standard anti-TB treatment. It adds to previous studies in part by examining the transcriptional treatment response directly in a larger cohort from a high-burden TB country, South Africa [2]. [00121] Materials and Methods. All participants in South Africa were recruited from the Ubuntu TB/HIV clinic in Khayelitsha, a large peri-urban African township in Cape Town which has over 1000 TB notifications annually. During the period May 2008-August 2010 whole blood was collected from adult patients (age >17 years) with drug sensitive Mtb
culture proven active pulmonary TB (Figure 1 1 A). Due to the population's high Mtb exposure, controls were considered as asymptomatic individuals with previous exposure to Mtb (latent TB patients); exposure was evidenced by a positive QuantiFERON-TB Gold In- Tube (QFT) (Cellestis). Participants with latent TB were recruited from individuals self- referring to the voluntary testing clinic. All participants had negative HIV status.
[00122] The UK 201 1 Active TB Validation Cohort were all Mtb culture proven adults (>17 years) recruited between August 2009 - November 201 1 from the Royal Free Hospital, London (Figure 1 1B). All participants in an earlier 2009 study were selected as previously described [1 1]. Clinical and demographic data was recorded for all participants and stored in a database.
[00123] Ethics Statement. This study was approved by the University of Cape Town Faculty of Flealth Sciences Human Research Ethics Committee, Cape Town, South Africa (FHS HREC 012/2007), and the Central London 3 Research Ethics Committee (09/H0716/41). All participants gave informed written consent. [00124] Follow Up Period. All 29 treated 2011 South Africa active TB patients completed a full 6 months of treatment. Patients were sampled for venous blood at time points: pre- treatment (29/29 patients), 2 weeks (25/29 patients), 2 months (24/29 patients), 6 months (25/29 patients) and 12 months (29/29 patients) after initiation of treatment (Figure 1 1A). Patient's response to anti-TB treatment was assessed clinically during the 12 month period. All patients were discharged from the program as cured.
[00125] Eight treated 2011 UK Active TB patients completed a full six months of treatment, one patient completed nine months of treatment due to radiographic uncertainty of treatment success. Each patient was sampled for venous blood at two weeks, two months, four months and six months after initiation of treatment (Figure 1 IB). Four patients had a sample at every time point, three patients had samples at two, four and six months, and four patients had samples at two weeks and six months. As part of their routine medical care all patients had chest X-rays at the beginning and end of their treatment.
[00126] IFNy Release Assay Testing. The QFT Assay (Cellestis) was performed according to the manufacturer's instructions. [00127] Gene Expression Profiling. 3 ml of whole blood were collected into Tempus tubes (Applied Biosystems/Ambion) by standard phlebotomy, vigorously mixed immediately after collection, and stored between -20 and -80°C before RNA extraction. South Africa and UK
201 1 sample's RNA was isolated using 1.5 ml whole blood and the MagMAX-96 Blood RNA Isolation Kit (Applied Biosystems/Ambion) according to the manufacturer's instructions. 250μg of isolated total RNA was globin reduced using the GLOBINclear 96- well format kit (Applied Biosystems/Ambion) according to the manufacturer's instructions. Total and globin-reduced RNA integrity was assessed using an Agilent 2100 Bioanalyzer (Agilent Technologies). RNA yield was assessed using a NanoDrop800 spectrophotometer (NanoDrop Products, Thermo Fisher Scientific). Biotinylated, amplified antisense complementary RNA (cRNA) targets were then prepared from 200-250 ng of the globin- reduced RNA using the Illumina CustomPrep RNA amplification kit (Applied Biosystems/Ambion). 750 ng of labeled cRNA was hybridized overnight to Illumina Human HT-12 V4 BeadChip arrays (Illumina), which contained more than 47,000 probes. The arrays were washed, blocked, stained and scanned on an Illumina iScan, as per manufacturer's instructions. GenomeStudio (Illumina) was then used to perform quality control and generate signal intensity values. [00128] The 393- and 86-transcript signatures were translated from the HT-12 V3 BeadChip arrays to HT-12 V4 BeadChip arrays using GeneSpring GX version 1 1.5 (Agilent Technologies) and translated to slightly fewer probes in V4 (Figure 12A-12C).
[00129] Raw data were processed using GeneSpring GX version 1 1.5 (Agilent Technologies) and the following was applied to all analyses. After background subtraction each probe was attributed a flag to denote its signal intensity detection -value. Flags were used to filter out probe sets that did not result in a 'present' call in at least 10% of the samples, where the 'present' lower cut off = 0.99. Signal values were then set to a threshold level of 1 , log2 transformed, and per-chip normalised using 75lh percentile shift algorithm. Next per-gene normalisation was applied by dividing each messenger RNA transcript by the median intensity of the latent TB samples. All statistical analysis was performed after this stage.
[00130] The raw and normalised microarray data has been deposited with the GEO (GSE40553). All data collected and analysed in the experiments adhere to the Minimal Information About a Microarray Experiment (MIAME) guidelines. [00131] Data Analysis. GeneSpring 1 1.5 was used to select transcripts that displayed a degree of expression variability. A filter was set to include only transcripts that had at least twofold changes from the median and present in at least 10% of the samples. To divide the
South Africa 201 1 cohort into a training and test set, a computer algorithm was used for randomisation [12]. For the specific treatment response signature transcripts had to satisfy a threefold expression filter in 12 of the 15 training set matched untreated and six month treated samples. [00132] Selected transcripts were then filtered by different levels of statistical stringency in GeneSpring 1 1.5. Non-parametric tests with multiple testing corrections were applied to all analyses [13], [14]. The active TB-transcriptional signatures was generated by Mann Whitney unpaired Bonferroni p<0.01. Figure 13 A. The statistical filter used to generate the specific TB treatment response-transcriptional signature was Mann Whitney paired Benjamini Hochberg p<0.01. The 393 and 86 active TB signatures were obtained as described previously [1 1] (see also Figure 14A-14B). Visualisation of the data was performed by heatmaps using hierarchical clustering where the correlation distance metric employed for the clustering was Pearson's uncentered with average linkage [15]. Heatmaps displayed either hierarchical clustering of both transcripts and samples or hierarchical clustering of transcripts with forced grouping of samples. Visualisation of common and different transcripts by Venn diagrams was performed in GeneSpring 11.5.
[00133] Molecular distance to health (MDTH) was determined for each time point, as previously described [16]. The temporal molecular response was calculated for a particular gene list for each individual patient. The raw intensity transcript values in the gene list were consecutively compared at each time point to the baseline (pre-treatment). The numbers of transcripts that were at least two-fold up or two-fold down from the baseline were added together for each time point. This sum was then divided by the total number of transcripts in the gene list to calculate a percentage score for each time point. This generated a percentage score of change at each time point compared to the baseline, where the baseline always remains zero (no change from itself). To allow for two-fold changes from zero any baseline raw transcript intensity values of zero were converted to 10 (ten raised to the power of minus twenty). MDTH and temporal molecular response were calculated in Microsoft Excel 2010. GraphPad Prism version 5 for Windows was used to generate graphs and determine simple linear regression. Linear mixed models, fixed effects, were used to determine /rvalues associated with MDTH and temporal molecular response graphs, using S^S/STATOsoftware (SAS Institute Inc., USA). Pathway analyses were performed using Ingenuity Pathway Analysis (Ingenuity Systems, Inc., Redwood, CA). Canonical pathways analysis identified
the most significantly represented pathways in the datasets (Fisher's exact Benjamini Hochberg p<0.05).
[00134] Results. Participants Demographics and Characteristics. Participant numbers in the 201 1 cohorts are described in Figure 1 1A-1 1B; 29 South African and 8 UK active TB patients were recruited and sampled for transcriptomic analysis. All treated active TB patients had fully sensitive Mtb, took all treatment prescribed, showed successful clinical/radiological response to standard therapy (rifampin, pyrazinamide, isoniazid and ethambutol for two months followed by rifampin and isoniazid for four months), did not relapse within one year and were discharged from the program as cured. The 29 South African patients were sampled at: pre-treatment (29/29 patients), two weeks (25/29 patients), two months (24/29 patients), six months (25/29 patients) and 12 months (29/29 patients) after initiation of treatment. Thirty-eight South African latent individuals were sampled as asymptomatic controls. Only five latent individuals were aware of prolonged contact with another individual with active TB. Participant characteristics are reported in Table 13 A and Table 13B. [00135] A Change in Transcriptional Response is Readily Detectable after Two Weeks of Treatment. To determine whether an active TB blood transcriptional signature was perturbed upon treatment, gene expression profiles of significantly detectable genes without further filtering (detected p<0.01 from background, 15,837 transcripts) were examined in the 29 active TB patients before, during (two weeks and two months), at the end of (six months), and after treatment (12 months). By plotting the expression profiles of the 15,837 transcripts along a time scaled x-axis, a marked change was readily observed after two weeks of anti-TB treatment (Figure 13 A).
[00136] Next an active TB 664-transcript signature (as in Table 8; see also Table S2 at at doi:10.1371/journal.pone.0046191.g001 by Bloom et al. 2012) was derived from differentially expressed genes in the pre-treatment active TB patients compared to the latent TB patients in the South Africa 201 1 cohort. First, all transcripts were normalised to the median of the latent TB patients, then only transcripts with > twofold change from the median were selected, before applying a statistical filter. When this signature was applied to the South Africa 201 1 Cohort, during and after treatment, a marked and rapid change in the transcriptional response was observed as early as two weeks, which then continued through two and six months, after treatment initiation (Figure 13B). In agreement with the previous study, Ingenuity Pathway Analysis (IPA) of the active TB 664-transcript signature demonstrated a highly significant over-representation of Interferon (IFN)-signaling genes
including Type I and Type II IFN (Figure 13C-D), pO.OOl , Table 1 ; See also Table 1 at doi: 10.1371/journal.pone.0046191.t001 (Bloom et al. 2012).
[00137] The Transcriptional Response Changes Significantly at Two Weeks after Treatment Initiation. Since it was observed that the South Africa active TB 664-transcript signature diminished in response to treatment, determining if this was a statistically significant change was desirable. To assess this, the previously described weighted molecular distance to health (MDTH) algorithm was employed as this generates a quantitative score for the degree of transcriptional perturbation in a disease cohort relative to the controls [16]. Moreover, as already has been demonstrated, MDTH positively correlates with the severity of active pulmonary TB, as defined by the radiological extent of disease [11]. The median MDTH of the South African untreated active TB 664-transcript signature was found to have decreased significantly at two weeks onwards, compared to the median pre-treatment MDTH (Figure 13E).
[00138] The present inventors then developed a novel metric that provides a quantitative measure of an individual's temporal change in gene expression. This 'temporal molecular response' offers a potential advantage in the clinical setting, allowing assessment of each patient's expression change without reference to a control group. For a given signature the temporal molecular response was determined by measuring the transcriptional perturbation between two time points, and expressing this value as a percentage of the total number of transcripts constituting the signature. The mean temporal molecular response calculated for the active TB 664-transcript signature revealed a statistically significant change in the transcriptional response at two weeks after treatment initiation (Figure 13F). This continued to change between two weeks and two months, and between two weeks and six months, after treatment initiation (Figure 13F). The magnitude of the patient's temporal molecular response during treatment (at two weeks and two months) did not correlate with the magnitude of their untreated transcriptional signature, as measured by MDTH (pO.01) (Figure 15). This suggests a patient's untreated transcriptional signature is not predictive of the patient's treatment response.
[00139] As a result, this active TB 664-transcript signature (derived from untreated active and latent TB patients) significantly and rapidly changed after two weeks of initiating treatment (Figures 13B, 13E, and 13F).
[00140] A Specific TB Treatment Response Signature Also Significantly Diminishes at Two Weeks Post Treatment. Defining transcriptional signature that specifically reflected the patients' response to clinically successful anti-TB treatment (comparing time points zero and six months) was next sought. To determine this treatment specific signature, a computer algorithm was first used to randomise the South Africa 201 1 cohort into two groups of patients [12] (Figure 1 1 A). This allowed the signature from one group of patients (active TB Training Set) to be derived and then the findings in another independent group of patients (active TB Test Set) to be validated. 320 transcripts (Table 12) were found to be significantly differentially expressed between the pre-treatment active TB Training Set samples and their paired six-month treated samples (Figure 16A). The treatment specific 320-transcript signature was shown to rapidly and significantly change at two weeks onwards after treatment initiation, in the active TB Training set (Figures 16A and 16B). This was validated in the active TB Test Set (Figures 16C and 16D). In both cohorts the change in the temporal molecular response was significant at two weeks post-treatment (Figures 16B and 16D). Analysis of the 320 transcripts by IPA indicated the most significantly represented pathways were related to the innate immune pathways, encompassing genes related to complement and Toll-like receptors (Figure 16E). 74% of genes present in the treatment specific 320- transcript signature were also contained the active TB 664-transcript signature (Figure 16F).
[00141] Although by applying the temporal molecular response it was observed that the treatment specific 320-transcript signature changed significantly between two weeks and six months post treatment initiation, this was no longer apparent between two months and six months post treatment initiation (Figure 3B and D). This could suggest that the transcriptional response reaches a plateau at two months and therefore the two month gene expression profiles would not be significantly different from the latent TB expression profiles. To establish whether any significant changes occurred between two months and the latent TB patients, each of the time points was compared: two, six and 12 months to the latent TB profiles. It was determined that 96 transcripts were significantly differentially expressed between two months and latent TB (Mann Whitney paired Benjamini Hochberg p<0.01 , data not shown). Ingenuity Pathway Analysis demonstrated the top three significant pathways associated with the 96 transcripts were 'role of NFAT in regulation of the immune response', 'integrin signaling' and 'primary immunodeficiency signaling' (data not shown). However no genes were significantly differentially expressed between six & 12 months, six months & latent TB, and 12 months & latent TB (Mann Whitney paired Benjamini Hochberg p>0.01).
[00142] Measuring an Individual Patient's Transcriptional Response to Anti-TB Treatment. Each patient's discrete treatment specific response (320 transcripts) is shown in the heatmaps of Figures 14A & 17A and using the temporal molecular responses in Figures 14B & 17B. All 29 patients in the active TB treated cohort had a rapid and early positive temporal response after two weeks of treatment. Interestingly, not all the individual transcriptional responses were identical (Figures 14A & 17 A) as demonstrated by the quantitative scoring provided by the temporal molecular responses (Figures 14B & 17B).
[00143] To determine whether the significant change in the treatment specific 320- transcript signature that had been demonstrated in a South African cohort was also applicable to patients in an intermediate burden setting, the 320-transcript signature was tested in a UK cohort. As observed in the South African cohort, the signature was rapidly and significantly diminished from two weeks post-treatment initiation (Figures 18A and 18B). The changes in the blood transcriptional response could be clearly quantified in individual patients as shown by the temporal molecular response (Figure 18C). The significant transcriptional blood change correlated with successful treatment of patients as assessed after six months by radiographic and clinical parameters (data not shown).
[00144] For additional validation that active- TB transcriptional signatures show significant changes as early as two weeks after treatment initiation, it was demonstrated that the active TB signatures (393- and 86-transcript signatures) from an earlier study [1 1], also significantly diminished after two weeks treatment, in the South Africa 201 1 treated cohort (Figure 12A- 12C).
[00145] Discussion. As disclosed herein, a whole blood active-TB transcriptional signature was derived consisting of 664 transcripts capable of distinguishing untreated South African active TB patients from South African latent TB patients. It was demonstrated that this active-TB transcriptional signature significantly diminishes in active TB patients after just two weeks of initiation of clinically successful anti-TB treatment. In addition, it was demonstrated that a treatment-specific transcriptional signature, consisting of 320 transcripts, derived from comparing a cohort of South African untreated active TB samples to their paired six-month end-of-treatment samples, also significantly diminishes after just two weeks of anti-TB treatment. Furthermore the significant change in the treatment-specific signature was validated in two more clinically successfully treated cohorts, from the high TB-burden setting of South Africa and from the intermediate TB-burden setting of London, UK. Both the active-TB and treatment-specific transcriptional signatures were dominated by IFN signaling
and innate immune response genes. The transcriptional response to anti-TB treatment could also be individually quantified for each patient. Together, these findings suggest that blood transcriptional signatures could be used as early surrogate biomarkers of a successful treatment response, in both the clinical setting and in drug development. [00146] TB treatment monitoring is a major challenge for attempts to eradicate Mtb infection. In April 2010 the Centers for Disease Control and National Institutes of Health brought together experts in the field and research scientists with the sole purpose of addressing this problem [17]. Poor treatment monitoring, and hence inadequate treatment, leads to worsening of a patient's disease, increasing the potential for disease spread and the risk of developing drug resistant mycobacteria. Currently the two-month sputum culture conversion is the only biomarker of successful TB treatment [6]. However it is time consuming, taking several weeks to grow the bacilli and results can be compromised by contamination. Moreover patients who have clinically improved may be unable to expectorate sputum at two months and potentially incorrectly labeled as having a negative culture [18]. Furthermore, although sputum conversion is commonly used as a surrogate end point for treatment response in clinical trials evaluating new drugs, a systematic review and meta-analysis to assess its accuracy in predicting an individual's treatment failure revealed low sensitivity and only modest specificity [7], [19]. While other biomarkers have also been trialed, including C-reactive protein, IFN-γ and neopterin, all have similarly shown poor sensitivity and specificity [20]. Chest X-rays are commonly used in the clinical setting as a marker of treatment response but they generally improve slower than the clinical response and lack specificity as interpretation can be confounded by previous lung damage [18]. Moreover interpretation of radiographic changes in response to treatment has not yet been standardised, and the facilities are not always available in developing countries [8]. Therefore there is clearly a need for early and easily detectable biomarkers for treatment monitoring, capable of potentially identifying poor responses due to drug resistance or lack of treatment adherence, and available for patients unable to produce sputum.
[00147] In an earlier study, it was demonstrated in a small number of patients that blood transcriptional signatures in UK active TB patients diminished after two months of anti-TB treatment [1 1]. In study disclosed herein, a significant blood transcriptional response to anti- TB treatment has been shown to occur rapidly, as early as two weeks (Figures 12 A, 12B, 12C, 13A, 13B, 13E, 13F, 14A, 14B, 16A, 16B, 16C, 16D, 17A, 17B, 18A, 18B, and 18C). This early transcriptional response could be as a consequence of the observed rapid and high
killing capacity of antimycobacterial antibiotics leading to a substantial reduction in mycobacterial load [21], [22], [23]. Although the signatures derived may not be completely specific for active TB, since clinically similar diseases such as sarcoidosis show common transcripts [24], demonstration of a response to antimycobacterial therapy as shown herein, could help resolve this overlap and so improve diagnostic specificity.
[00148] With the disclosure of this Example, it is shown that the whole blood active-TB transcriptional signature is dominated by IFN signaling and innate immune response genes. These findings are in agreement with previous work [11], and with other gene expression studies in TB [25], [26]. This robust correlation occurring between different host populations, likely different Mtb strains, diverse environments and microarray analysis strategies indicates that blood transcriptomics may be developed into robust novel diagnostic tools. Furthermore, as demonstrated herein, the derived treatment specific 320-transcript signature also had many genes in common with the active TB 664-transcript signature (Figure 3F). This overlap of genes may help in future development of gene subsets that correlate with a patient's response to anti-TB treatment, acting as a surrogate marker of treatment failure or success.
[00149] Due to the ethical design of this study, active TB patients who did not respond to TB treatment are not presented. But this study has demonstrated a very important proof-of- principle that active TB patients who are successfully treated have a dramatic measurable change in their blood gene expression profiles as early as two weeks. The use of a commercially available whole genome microarray platform together with broadly available bioinformatics analyses programmes should easily allow rapid validation in subsequent TB treatment studies, including a comparison with patients with MDR-TB and HIV/TB co- infected cohorts. This study focused on TB patients who are not co-infected with HIV, as they represent the majority of patients infected with Mtb. WHO 2010 reports that of the 1.4 million deaths, three-quarters were not known to be co-infected with HIV [2].
[00150] No other studies appear to have specifically derived transcriptional signatures of response to TB treatment. However, two other studies have described relevant treatment related transcriptional differences. Mistry et al. found that patients who had completed a course of anti-TB treatment displayed similar expression profiles to a latent TB group, but Mistry et al. did not examine any patients during their anti-TB treatment course, and Mistry et al. used custom arrays [27], making it therefore more difficult for others to validate. Joosten et al. showed in a small number of samples that their active TB gene set diminished after two months of anti-TB treatment; however they did not examine any patients at earlier
timepoints [28]. The early TB treatment blood transcriptional signature disclosed herein has great potential for development in blood biomarkers for clinical use and could be measured in the field using a polymerase chain reaction assay, similar to the WHO endorsed GeneXpert MTB/RIF test already in use for TB diagnostics in both developing and developed countries. However a blood host biomarker, based on the transcriptional signature of the study disclosed herein, would have advantages over the GeneXpert test since it would not require sputum.
[00151] A further problem in the management of TB is the extended length of treatment, requiring a minimum duration of six months. However the treatment duration required for maximum efficacy and preventing resistance, has not been fully established. The ability therefore to stratify patients into groups requiring shorter or longer treatment durations, particularly in resource limited settings, could be of value in improving patient compliance and reducing treatment related side effects. We demonstrate here that some patient's transcriptional response appeared to plateau before six months (Figures 14A, 14B, 17A & 17B) suggesting blood transcriptional signatures may help develop personalized treatment regimes.
Example 3
[00152] Use of a 320 gene transcriptional signature, as prominently disclosed in Example 2, was also prominently used for tests disclosed in this Example 3. In particular, data from preliminary studies demonstrate that blood-derived transcriptional signatures are diminished between three to six days after initiation of anti-TB treatment.
[00153] Materials and Methods. Recruitment methodology (i.e., inclusion and exclusion criteria) as detailed in the above Examples was not changed. For a small sample of six patients having symptoms of TB, blood was sampled every day for the first two weeks (depending on patient availability; i.e., missing data points for various days are due to patient unavailability). Three of these patients were later confirmed as having TB and as unambiguously meeting the previously-noted inclusion and exclusion criteria: Patient ID 2208; Patient ID 2220; and Patient ID 2232.
[00154] For RNA isolation and analysis, a few small methodology modifications were made to the methodologies of Example 2. First, sample RNA was isolated using 1 ml whole blood and the PerfectPure RNA Blood Kit (Invitrogen/Applied Biosystems/Ambion) according to the manufacturer's instructions. Second, 0.7-2.2 μg isolated total RNA was globin reduced using the GLOBINclear Human Kit (Invitrogen/Applied Biosystems/Ambion)
according to the manufacturer's instructions. Third, raw data were processed using GeneSpring GX version 12 (Agilent Technologies).
[00155] In addition to generating heatmaps and temporal molecular response data from 320-transcript signatures for Patient ID 2208, Patient ID 2220, and Patient ID 2232, heatmaps and temporal molecular response data were generated for 393- and 86-transcript signatures for each of these patients using the methodologies of Example 2. In detail, 393- and 86- transcript signatures were translated from the HT-12 V3 BeadChip arrays to HT-12 V4 BeadChip arrays using GeneSpring GX version 1 1.5 (Agilent Technologies) and translated to slightly fewer probes in V4' due to slight differences in probe sets between Illumina Human HT-12 V3 and V4 BeadChip versions. That is, data were also obtained for 380 list (i.e., Illumina Human HT-12 V4 BeadChip translation of Illumina Human HT-12 V3 BeadChip 393 list) and 83 list (i.e., Illumina Human HT-12 V4 BeadChip translation of Illumina Human HT-12 V3 BeadChip 86 list) treatment response profiles..
[00156] Results. Heatmaps and corresponding temporal molecular response data for Patient ID 2208, Patient ID 2220, and Patient 2232 are provided in Figures 19, 20, and 21, respectively, for 320, 86, and 393 transcript lists. For each of the three patients, less temporal molecular response is shown for either the 86 or the 393 transcript lists than for the 320 transcript list. This is consistent with the 393 and 86 transcript lists not being derived for treatment response. In contrast, temporal molecular response for the 320 transcript list is more pronounced. For example, the "Day 3" temporal molecular response data points for Patient ID 2220 and Patient ID 2232, i.e., the data point differences from the "0" baseline at "Day 3" for these patients, is more pronounced for the 320-transcript list than for either the 86- or 393 -transcript lists.
[00157] In summary, transcriptional signatures, measured in easily accessible whole blood, showed a detectable response to anti-TB treatment, and this response was rapid and could be measured as early as two weeks (or, as preliminary data from Example 3 show, very much sooner) after initiation of treatment - far more quickly, and more consistently, than in currently available tests. In addition, this early response to anti-TB treatment was demonstrated in both high- and intermediate-burden settings. Transcriptional response could be measured for each individual TB patient, thus providing a potential clinical tool for single patient treatment monitoring. Furthermore, this monitoring promises to aid in patient stratification for treatment(s) with differing regimen lengths. These findings provide compelling evidence for a biomarker successful in assessing early anti-TB treatment
response. This biomarker of early treatment response would allow rapid detection of both inadequate treatment regimens and poor treatment compliance, and therefore shows particular usefulness for reducing the spread of TB as brought about through the generation and spread of drug resistant Mtb. [00158] It is contemplated that any embodiment discussed in this specification can be implemented with respect to any method, kit, reagent, or composition of the invention, and vice versa. Furthermore, compositions of the invention can be used to achieve methods of the invention.
[00159] It will be understood that particular embodiments described herein are shown by way of illustration and not as limitations of the invention. The principal features of this invention can be employed in various embodiments without departing from the scope of the invention. Those skilled in the art will recognize, or be able to ascertain using no more than routine experimentation, numerous equivalents to the specific procedures described herein. Such equivalents are considered to be within the scope of this invention and are covered by the claims.
[00160] All publications and patent applications mentioned in the specification are indicative of the level of skill of those skilled in the art to which this invention pertains. All publications and patent applications are herein incorporated by reference in the entirety of each to the same extent as if each individual publication or patent application was specifically and individually indicated to be incorporated by reference in its entirety.
[00161 ] The use of the word "a" or "an" when used in conjunction with the term "comprising" in the claims and/or the specification may mean "one," but it is also consistent with the meaning of "one or more," "at least one," and "one or more than one." The use of the term "or" in the claims is used to mean "and/or" unless explicitly indicated to refer to alternatives only or the alternatives are mutually exclusive, although the disclosure supports a definition that refers to only alternatives and "and/or." Throughout this application, the term "about" is used to indicate that a value includes the inherent variation of error for the device, the method being employed to determine the value, or the variation that exists among the study subjects. [00162] As used in this specification and claim(s), the words "comprising" (and any form of comprising, such as "comprise" and "comprises"), "having" (and any form of having, such as "have" and "has"), "including" (and any form of including, such as "includes" and
"include") or "containing" (and any form of containing, such as "contains" and "contain") are inclusive or open-ended and do not exclude additional, unrecited elements or method steps. As used herein, the phrase "consisting essentially of limits the scope of a claim to the specified materials or steps and those that do not materially affect the basic and novel characteristic(s) of the claimed invention. As used herein, the phrase "consisting of excludes any element, step, or ingredient not specified in the claim except for, e.g., impurities ordinarily associated with the element or limitation.
[00163] The term "or combinations thereof as used herein refers to all permutations and combinations of the listed items preceding the term. For example, "A, B, C, or combinations thereof is intended to include at least one of: A, B, C, AB, AC, BC, or ABC, and if order is important in a particular context, also BA, CA, CB, CBA, BCA, ACB, BAC, or CAB. Continuing with this example, expressly included are combinations that contain repeats of one or more item or term, such as BB, AAA, MB, BBC, AAABCCCC, CBBAAA, CABABB, and so forth. The skilled artisan will understand that typically there is no limit on the number of items or terms in any combination, unless otherwise apparent from the context.
[00164] As used herein, words of approximation such as, without limitation, "about", "substantial" or "substantially" refers to a condition that when so modified is understood to not necessarily be absolute or perfect but would be considered close enough to those of ordinary skill in the art to warrant designating the condition as being present. The extent to which the description may vary will depend on how great a change can be instituted and still have one of ordinary skilled in the art recognize the modified feature as still having the required characteristics and capabilities of the unmodified feature. In general, but subject to the preceding discussion, a numerical value herein that is modified by a word of approximation such as "about" may vary from the stated value by at least ±1, 2, 3, 4, 5, 6, 7, 10, 12 or 15%.
[00165] All of the compositions and/or methods disclosed and claimed herein can be made and executed without undue experimentation in light of the present disclosure. While the compositions and methods of this invention have been described in terms of preferred embodiments, it will be apparent to those of skill in the art that variations may be applied to the compositions and/or methods and in the steps or in the sequence of steps of the method described herein without departing from the concept, spirit and scope of the invention. All such similar substitutes and modifications apparent to those skilled in the art are deemed to be within the spirit, scope and concept of the invention as defined by the appended claims.
[00166] TABLES
Table 1 : Genes Present in the Top Significantly Represented Ingenuity Pathways
(Untreated South Africa 201 1 Cohort)(Ingenuity Pathway Analysis of 664 Transcripts)
Table 2A: South Africa Cohort
performed (total no.)
Table 3: Genes Present in the Top Significantly Represented Ingenuity Pathway (UK & South Africa 2009 Cohorts).
IFN Signaling Complement System
Symbol Fold Change Symbol Fold Change
IFI35 2.685
IFIT1 3.071
IFIT3 5.317
IFITM1 2.014
JAK2 2.424
0AS1 3.454
SOCS1 2.960
STAT1 2.900
STAT2 2.079
TAP1 2.291
Altered T & B Cell Signaling in Rheumatoid Role of Pattern Recognition Receptors in Arthritis Recognition of Bacteria and Viruses
Symbol Fold Change Symbol Fold Change
CD86 -2.077 C1QB 9.514
CD40LG -2.021 C3AR1 2.065
CD79A -2.051 CAS PI 2.146
FAS 2.185 IFIH1 2.027
FCER1G 2.002 IL1B 2.037
IL15 2.599 IRF7 2.438
IL1B 2.037 NLRC4 2.276
IL1RN 2.297 OAS1 3.454
IL23A -2.964 OAS2 3.335
TLR2 2.005 OAS3 3.246
TLR5 2.346 TLR2 2.005
TLR8 2.189 TLR5 2.346
TNFRSF13B -2.714 TLR8 2.189
TNFSF13B 2.025
Role of JAK Family Kinases in IL-6 Type Communication Between Innate & Adaptive Cytokine Signaling Immune Cells
Symbol Fold Change Symbol Fold Change
CD86 -2.077
CD40LG -2.021
CXCL10 3.407
FCER1G 2.002
IL15 2.599
IL1B 2.037
IL1RN 2.297
TLR2 2.005
TLR5 2.346
TLR8 2.189
TNFRSF13B -2.714
TNFSF13B 2.025
Dendritic Cell Maturation
Symbol Fold Change
CD86 -2.077
CD40LG -2.021
CREB5 2.530
FCER1G 2.002
FCGR1A 6.840
FCGR1B 7.042
IL15 2.599
IL1B 2.037
IL1RN 2.297
IL23A -2.964
JAK2 2.424
MAPK14 3.174
STAT1 2.900
STAT2 2.079
TLR2 2.005
UK TEST 2009 (224)
IFN Signaling Complement System
Symbol Fold Change Symbol Fold Change
IFIT3 2.899 C2 2.419
OAS1 2.257 C1QB 5.045
SOCS1 2.296 C1QC 3.630
STAT1 2.185 SERPING1 5.462
Table 4: List of the 224 genes
protein 6 (TNFAIP6), mRNA.
Table 5: List of the 86 genes
member 9 (DHRS9), transcript variant 1 , mRNA.
Table 6: List of the 393 genes
Table 7: List of the 565 genes
2640025 HP 3240 Homo sapiens haptoglobin (HP), mRNA.
Table 8: List of the 664 genes
(Knops blood group) (CR1 ), transcript variant S, mRNA.
3940356 CR1 1378 Homo sapiens complement component (3b/4b) receptor 1
(Knops blood group) (CR1 ), transcript variant S, mRNA.
7560039 TAPBP 6892 Homo sapiens TAP binding protein (tapasin) (TAPBP), transcript variant 3, mRNA.
5080468 MBOAT2 129642 PREDICTED: Homo sapiens membrane bound O- acyltransferase domain containing 2 (MBOAT2), mRNA.
2030309 SERPING 1 710 Homo sapiens serpin peptidase inhibitor, clade G (C I inhibitor), member 1 (SERPING 1), transcript variant 2, mRNA.
940369 LOCI 00129637 100129637 Homo sapiens hypothetical LOCI 00129637
(LOCI 00129637), non-coding RNA. XR 039552 XR 039796
5960731 SOD2 6648 Homo sapiens superoxide dismutase 2, mitochondrial
(SOD2), nuclear gene encoding mitochondrial protein, transcript variant 1 , mRNA.
7570196 TSPAN9 10867 Homo sapiens tetraspanin 9 (TSPAN9), mRNA.
3170273 FER1L3 26509 Homo sapiens fer-l -like 3, myoferlin (C. elegans)
(FER1L3), transcript variant 2, mRNA.
6940164 LBH 81606 PREDICTED: Homo sapiens hypothetical protein
DKFZp566J091 (LBH), mRNA.
4730349 PN D 25953 Homo sapiens paroxysmal nonkinesiogenic dyskinesia
(PNKD), transcript variant 2, mRNA.
4780044 LOC389386 389386 PREDICTED: Homo sapiens misc RNA (LOC389386), partial miscRNA.
580343 ZNF540 163255 Homo sapiens zinc finger protein 540 (ZNF540), mRNA.
5360064 GNLY 10578 Homo sapiens granulysin (GNLY), transcript variant 519, mRNA.
6650100 WDR36 134430 Homo sapiens WD repeat domain 36 (WDR36), mRNA.
4810468 SELP 6403 Homo sapiens selectin P (granule membrane protein
140kDa, antigen CD62) (SELP), mRNA.
610598 CHI3L2 1 1 17 Homo sapiens chitinase 3-like 2 (CHI3L2), transcript variant 1 , mRNA.
5130025 LOCI 00134703 100134703 PREDICTED: Homo sapiens misc RNA
(LOCI 00134703), partial miscRNA.
4250082 CHD6 84181 Homo sapiens chromodomain helicase DNA binding protein 6 (CHD6), mRNA.
4120561 LIMK2 3985 Homo sapiens LIM domain kinase 2 (LIMK2), transcript variant 1 , mRNA.
7050370 ANKRD9 122416 Homo sapiens ankyrin repeat domain 9 (ANKRD9), mRNA.
940220 NOD2 64127 Homo sapiens nucleotide-binding oligomerization domain containing 2 (NOD2), mRNA.
3360491 MCTP1 79772 Homo sapiens multiple C2 domains, transmembrane 1
(MCTP1 ), transcript variant L, mRNA.
4010139 BANK1 55024 Homo sapiens B-cell scaffold protein with ankyrin repeats
1 (BANK1 ), transcript variant 2, mRNA.
2230678 ACACB 32 Homo sapiens acetyl-Coenzyme A carboxylase beta
(ACACB), mRNA.
3610719 SAMD3 154075 Homo sapiens sterile alpha motif domain containing 3
(SAMD3), transcript variant 1 , mRNA.
1030167 SAMD3 154075 Homo sapiens sterile alpha motif domain containing 3
(SAMD3), transcript variant 1 , mRNA.
4670592 MYOF 26509 Homo sapiens myoferlin (MYOF), transcript variant 1 , mRNA.
2650093 NFAT5 10725 Homo sapiens nuclear factor of activated T-cells 5,
tonicity-responsive (NFAT5), transcript variant 2, mRNA.
2680050 S1RPG 55423 Homo sapiens signal-regulatory protein gamma (SIRPG),
2/delta subunit 3 (CACNA2D3), mRNA.
Table 9: List of the 391 genes
Table 10: List of the 1 129 genes
4150270 ANKRD22 1 18932 Homo sapiens ankyrin repeat domain 22 (ANKRD22), mRNA.
6420008 PROS 1 5627 Homo sapiens protein S (alpha) (PROS 1 ), mRNA.
4230328 CALD1 800 Homo sapiens caldesmon 1 (CALD1 ), transcript variant
3, mRNA.
50706 CD40LG 959 Homo sapiens CD40 ligand (CD40LG), mRNA.
4780253 POLR3B 55703 Homo sapiens polymerase (RNA) 111 (DNA directed) polypeptide B (POLR3B), mRNA.
3990673 AFF1 4299 Homo sapiens AF4/FMR2 family, member 1 (AFF1 ), mRNA.
2140524 HIST1 H3D 8351 Homo sapiens histone cluster 1 , H3d (HIST1H3D), mRNA.
76101 13 SLC26A8 1 16369 Homo sapiens solute carrier family 26, member 8
(SLC26A8), transcript variant 2, mRNA.
5360626 SLC26A8 1 16369 Homo sapiens solute carrier family 26, member 8
(SLC26A8), transcript variant 2, mRNA.
240400 PMEPA1 56937 Homo sapiens prostate transmembrane protein, androgen induced 1 (PMEPA1), transcript variant 2, mRNA.
2070170 UBE2L6 9246 Homo sapiens ubiquitin-conjugating enzyme E2L 6
(UBE2L6), transcript variant 1 , mRNA.
7000368 UBE2L6 9246 Homo sapiens ubiquitin-conjugating enzyme E2L 6
(UBE2L6), transcript variant 1, mRNA.
3460086 SSHl 54434 Homo sapiens slingshot homolog 1 (Drosophila) (SSHl), mRNA.
6280092 SLC25A23 79085 Homo sapiens solute carrier family 25 (mitochondrial carrier; phosphate carrier), member 23 (SLC25A23), nuclear gene encoding mitochondrial protein, mRNA.
770088 DTX3L 151636 Homo sapiens deltex 3-like (Drosophila) (DTX3L), mRNA.
1980431 DOK3 79930 Homo sapiens docking protein 3 (DOK3), mRNA.
531071 1 FAM 160B 1 57700 Homo sapiens family with sequence similarity 160, member B l (FAM160B1), transcript variant 2, mRNA.
4780068 SULT1B 1 27284 Homo sapiens sulfotransferase family, cytosolic, I B, member 1 (SULT1B 1), mRNA.
990044 IAA1 147 57189 PREDICTED: Homo sapiens KIAA1 147 (KIAA1 147), mRNA.
5670465 ADM 133 Homo sapiens adrenomedullin (ADM), mRNA.
6420646 BZRAP1 9256 Homo sapiens benzodiazapine receptor (peripheral) associated protein 1 (BZRAP1), mRNA.
620091 LOC730234 730234 PREDICTED: Homo sapiens misc RNA (LOC730234), miscRNA.
1820592 HIST2H2AA3 8337 Homo sapiens histone cluster 2, H2aa3 (HIST2H2AA3), mRNA.
610451 H1ST2H2AA3 8337 Homo sapiens histone cluster 2, H2aa3 (HIST2H2AA3), mRNA.
5220142 LIMK2 3985 Homo sapiens LIM domain kinase 2 (LIMK2), transcript variant 2a, mRNA.
1050008 MMRN 1 22915 Homo sapiens multimerin 1 (MMRN 1 ), mRNA.
670528 GYG 1 2992 Homo sapiens glycogenin 1 (GYG 1 ), mRNA.
6250168 CR740207 NCI CGAP GCB 1 Homo sapiens cDN A clone !MAGp971 G2055 ; IMAGE:824852 5, mRNA sequence
3420075 SPIN4 139886 Homo sapiens spindlin family, member 4 (SPIN4), mRNA.
4540239 DEFA 1 1667 Homo sapiens defensin, alpha 1 (DEFA1 ), mRNA.
6960397 EPHX2 2053 Homo sapiens epoxide hydrolase 2, cytoplasmic
(EPHX2), mRNA.
(ABHD14A), mRNA.
2640671 LOC642342 642342 PREDICTED: Homo sapiens similar to Contactin- associated protein-like 3 precursor (Cell recognition molecule Caspr3) (LOC642342), mRNA.
2650605 C4orfl 8 51313 Homo sapiens chromosome 4 open reading frame 18
(C4orf 18), transcript variant 2, mRNA.
2570438 KIFC3 3801 Homo sapiens kinesin family member C3 (KIFC3), mRNA.
4040176 LAMA5 391 1 Homo sapiens laminin, alpha 5 (LAMA5), mRNA.
7400102 ASPHD2 57168 Homo sapiens aspartate beta-hydroxylase domain containing 2 (ASPHD2), mRNA.
7160468 DHRS9 10170 Homo sapiens dehydrogenase/reductase (SDR family) member 9 (DHRS9), transcript variant 1, mRNA.
10451 BEND7 222389 Homo sapiens BEN domain containing 7 (BEND7), transcript variant 2, mRNA.
2120026 LOC100134300 100134300 PREDICTED: Homo sapiens misc RNA
(LOC 100134300), miscRNA.
1500674 HIST2H3C 126961 Homo sapiens histone cluster 2, H3c (HIST2H3C), mRNA.
2140242 TNFA1P6 7130 Homo sapiens tumor necrosis factor, alpha-induced protein 6 (TNFAIP6), mRNA.
580739 FBLN 1 2192 Homo sapiens fibulin 1 (FBLN1), transcript variant C, mRNA.
Table 1 1 : List of the 71 1 genes
(ADAM28), transcript variant 3, mRNA.
E l , beta polypeptide (maple syrup urine disease)
(BCKDHB), nuclear gene encoding mitochondrial protein, transcript variant 2, mRNA.
3520349 LOC653980 653980 PREDICTED: Homo sapiens similar to BTB and CNC homology 1 , basic leucine zipper transcription factor 2, transcript variant 1 (LOC653980), mRNA.
5870575 BX 108101 NCI CGAP Kid l l Homo sapiens cDNA clone IMAGp998J 155335, mRNA sequence
290739 DNASE1 L3 1776 Homo sapiens deoxyribonuclease 1-like 3 (DNASE1 L3), mRNA.
3420523 RHBDF2 79651 Homo sapiens rhomboid 5 homolog 2 (Drosophila)
(RHBDF2), transcript variant 2, mRNA.
650750 RHBDF2 79651 Homo sapiens rhomboid 5 homolog 2 (Drosophila)
(RHBDF2), transcript variant 2, mRNA.
2320132 MSI2 124540 Homo sapiens musashi homolog 2 (Drosophila) (MSI2), transcript variant 1 , mRNA.
840369 LBH 81606 Homo sapiens limb bud and heart development homolog
(mouse) (LBH), mRNA.
5340692 STRBP 55342 Homo sapiens spermatid perinuclear RNA binding
protein (STRBP), mRNA.
4200754 ST3GAL4 6484 Homo sapiens ST3 beta-galactoside alpha-2,3- sialyltransferase 4 (ST3GAL4), mRNA.
5050274 DHRS12 79758 Homo sapiens dehydrogenase/reductase (SDR family) member 12 (DHRS12), transcript variant 2, mRNA.
6980133 HUMGS0004661 Human adult (K.Okubo) Homo
sapiens cDNA 3, mRNA sequence
7320291 IQCK 124152 Homo sapiens 1Q motif containing K (IQCK), mRNA.
6590646 FAM26F 441 168 Homo sapiens family with sequence similarity 26, member F (FAM26F), mRNA.
3780193 FCRLA 84824 Homo sapiens Fc receptor-like A (FCRLA), mRNA.
6480040 PODN 127435 Homo sapiens podocan (PODN), mRNA.
3940196 PCSK6 5046 Homo sapiens proprotein convertase subtilisin/kexin type 6 (PCSK6), transcript variant 6, mRNA.
830615 ZDHHC19 131540 Homo sapiens zinc finger, DHHC-type containing 19
(ZDHHC19), mRNA.
1230091 PML 5371 Homo sapiens promyelocytic leukemia (PML), transcript variant 1 , mRNA.
3850021 CASP4 837 Homo sapiens caspase 4, apoptosis-related cysteine peptidase (CASP4), transcript variant alpha, mRNA.
6620161 SPIB 6689 Homo sapiens Spi-B transcription factor (Spi-l/PU. l related) (SPIB), mRNA.
1410201 CD59 966 Homo sapiens CD59 molecule, complement regulatory protein (CD59), transcript variant 2, mRNA.
3370400 LOC643313 643313 PREDICTED: Homo sapiens similar to hypothetical protein LOC284701 , transcript variant 1 (LOC643313), mRNA.
4900239 CD274 29126 Homo sapiens CD274 molecule (CD274), mRNA.
940274 GK 2710 Homo sapiens glycerol kinase (GK), transcript variant 2, mRNA.
3850630 HOMER2 9455 Homo sapiens homer homolog 2 (Drosophila)
(HOMER2), transcript variant 3, mRNA.
6650242 IFITM3 10410 Homo sapiens interferon induced transmembrane protein
3 (1 -8U) (IFITM3), mRNA.
1740661 KBTBD3 143879 Homo sapiens kelch repeat and BTB (POZ) domain containing 3 (KBTBD3), transcript variant 2, mRNA.
1820750 STAT1 6772 Homo sapiens signal transducer and activator of
transcription 1 , 91 kDa (STAT1 ), transcript variant alpha, mRNA.
(acrosin-trypsin inhibitor) (SPINK2), mRNA.
Table 12: List of the 320 genes (Treatment Specific 320-Transcript Signature)
4200669 CR1 1378 7570575 LOC642788 642788
3940356 CR1 1378 4150270 ANKRD22 118932
7560039 TAPBP 6892 4230328 CALD1 800
6620725 PPAP2C 8612 2140524 HIST1H3D 8351
2030309 SERP1NG1 710 5360626 SLC26A8 116369
5960731 S0D2 6648 770088 DTX3L 151636
3170273 FER1L3 26509 1980431 D0K3 79930
4780044 LOC389386 389386 5670465 ADM 133
LOC10013470
5130025 3 100134703 620091 LOC730234 730234
4120561 LIMK2 3985 1820592 HIST2H2AA3 8337
1510255 LOC648164 648164 610451 HIST2H2AA3 8337
730008 5220142 LIMK2 3985
5420646 CETP 1071 2570041 WASF3 10810
450424 CXCR7 57007 6060053 LILRA6 79168
3830228 GPR109A 338442 3870193 TMEM180 79847
1470382 IRF7 3665 4200754 ST3GAL4 6484
5310445 KREMEN1 83999 3710086 DHRS12 79758
3390301 KREMEN1 83999 6980133
5310754 VNN1 8876 2490463 MXI1 4601
7320767 LOC645822 645822 3370400 LOC643313 643313
6840035 GBP1 2633 4010564 TRPM6 140803
2190148 GBP1 2633 4900239 CD274 29126
4260368 UBE2C 11065 940274 GK 2710
3800398 FBX06 26270 3850630 H0MER2 9455
5900524 LACTB 114294 6380672 CA4 762
6220332 SLC6A12 6539 6650242 IFITM3 10410
LOC10013231
510072 7 100132317 1820750 STAT1 6772
1400373 SLA 6503 2970482 RNU1-5 26863
2360091 RNU1G2 26864 1260066
6200577 CREB5 9586 6250615 PGLYRP1 8993
4730059 BATF2 116071 5870608 PPP1R3B 79660
460242 LOC391859 391859 3870338 IFI44L 10964
2600735 TLR6 10333 6660162 LRG1 116844
3420241 SLC2A14 144195 990349 MCTP2 55784
7050519 CLEC4D 338339 7510537 SC02 9997
7510647 CACNA1E 777 2510551 STK3 6788
2450392 LOC642780 642780 3190050
4150014 CEACAM1 634 1410192 TDRD9 122402
5700753 CEACAM1 634 380082 LOC646144 646144
1820725 LRRK2 120892 1470470 GPR97 222487
6200193 TncRNA 283131 5260424 GPR97 222487
3460053 SIPA1L2 57568 4230441 GPR97 222487
LOC10013285
1580435 TGM2 7052 2370743 8 100132858
3420593 L NBl 4001 6550259 CD151 977
4780128 ATF3 467 3140487 BMX 660
1690162 520086 FCGR1A 2209
6590131 HP 3240 2570300 IFI44 10561
6330471 BLK 640 2710400 DSC2 1824
3440360 ZNF438 220929 630619 HPSE 10855
2100458 LOC729010 729010 6290672 LOC728417 728417
6100136 CASP4 837 2570482 LOC728417 728417
6040398 SLC22A4 6583 5560471 FCAR 2204
6420750 TLR2 7097 3420259 MIR21 406991
2450364 VNN3 55350 2030170 CARD16 114769
2690477 LOC648710 648710 870193 SP140 11262
630255 LOC652578 652578 5570039 LOC728744 728744
3360431 ZAK 51776 3360372 CCRL2 9034
5390328 KCNJ15 3772 5390204 SCARF1 8578
1050215 KCNJ15 3772 3990170 IFI27 3429
6020097 SERPINA1 5265 7040181 PFKFB2 5208
620403 LOC400759 400759 5900543 Sep-04 5414
6280470 LOC728519 728519 3180528 MMP9 4318
5570114 GADD45G 10912 360377 TGFA 7039
2710091 FCGR2C 9103 460463 SMARCD3 6604
6110634 ERLIN1 10613 1260133 LOC642334 642334
LOC10013466
7610750 0 100134660 5870678 LOC441763 441763
4880537 LIMA1 51474 6420102 GPR109B 8843
1050020 NLRC4 58484 1980524 GBP4 115361
3390121 CASP5 838 20075 NDUFAF3 25915
2900524 CCR2 1231 5810689 PRRG4 79056
4760433 C16orf7 9605 4210722 LOC641693 641693
3290458 FEZ1 9638 3870170 LOC728093 728093
LOC10013228
2320689 LOC653610 653610 7100703 7 100132287
5130767 MAPK14 1432 6220739 GRAMD1B 57476
840685 IL1B 3553 1030376 PLCG1 5335
1090333 CDKN2D 1032 4560746 FCAR 2204
1260270 AIM2 9447 1440341 C1QC 714
4180148 LOC650546 650546 270240 SLC26A8 116369
5390427 NAIP 4671 4860746 LOC642684 642684
5340240 NAIP 4671 610270 ELL2 22936
4860600 MAPK14 1432 1770243 IGF2BP3 10643
1010360 GCH1 2643 4220187 DYSF 8291
5270377 LOC728790 728790 6180427 G0S2 50486
DNAJC25-
1510735 NTN3 4917 540161 GNG10 552891
4010270 LOC440731 440731 7650026 MUC1 4582
1580360 LOC651612 651612 5310377 DSC2 1824
5910019 C1QB 713 5550397 AP0L6 80830
6620630 XK 7504 7040592 ITGAX 3687
6580717 ZMYND15 84225 520408 IFIT3 3437
LOC10013482
2710709 FCGR1B 2210 1230671 2 100134822
5670152 RNU1-3 26869 1820689
3800050 ADCY3 109 1410221 S100A12 6283
830440 TLR5 7100 6270553 CXCL10 3627
5560270 CARD17 440068 5890095 LILRA5 353514
3930368 CARD17 440068 5310451 BCL6 604
360132 LHFPL2 10184 4150369 GK 2710
LOC10013356
1780564 CDC42 998 5340279 5 100133565
1050025 CR1 1378 5390093 INSL3 3640
4220592 CACNA2D3 55799 5960176 SCARNA22 677770
6290754 LOC652234 652234 450202 ELF2 1998
6420594 TIFA 92610 4670458 Sep-04 5414
1070367 C19orf59 199675 240594 ANXA3 306
4260017 CDK5RAP2 55755 2030551 GPR27 2850
3890609 PLSCR1 5359 4920228 FFAR2 2867
DKFZp761E19
3780382 8 91056 4780075 CEACAM8 1088
3140707 PARP9 83666 2320750 MRVI1 10335
6650064 SIGLEC5 8778 7330441 RNF13 11342
4640270 SIGLEC5 8778 1430068 USF1 7391
1030431 ACSL1 2180 3060435 LOC652750 652750
3360132 SNX20 124460 3450521 ECM1 1893
540025 IL4R 3566 1450427 RTP4 64108
2470601 IL1RN 3557 3610706 BMX 660
60719 KCNJ2 3759 3850441 MAZ 4150
LOC10012934
5340767 CEACAM1 634 360360 3 100129343
2100725 KIR3DL3 115653 7560593 OSM 5008
7610440 XAF1 54739 3170241 LOC651524 651524
2710646 MSRB2 22921 6100379 LOC648984 648984
LOC10013211
3310341 FYB 2533 5420678 9 100132119
4640601 2970019 HIST1H4H 8365
3310376 TIMM10 26519 3780047 GBP6 163351
6280301 LOC643313 643313 4230102 S0CS3 9021
6510707 FER1L3 26509 3060524 LOC153561 153561
3800019 NCR3 259197 7400102 ASPHD2 57168
3830433 7160468 DHRS9 10170
LOC10013430
1710553 HSPA6 3310 2120026 0 100134300
2940685 C1QA 712 2140242 TNFAIP6 7130
Table Table 13 A: South Africa 201 1 Cohort
Productive cough (total no.) 29 0
Smear +ve(total no.) 28 N/A
Night sweats (total no.) 25 0
Weight loss (total no.) 28 0
Chest x-ray perfrm'd (total no) 1 (1/1 abnormal) Not done
Of the 29 untreated active TB patients, 16 were also included in the previous Berry et al study, and of the 38 untreated latent TB patients, 17 were also included in the previous Berry et al study [1 1]. For study reported in Example 2 herein, all untreated samples were processed again alongside all the other samples.
Table 13B: UK 2011 Cohort
REFERENCES
References of Example 1
(1) Young DB, Perkins MD, Duncan K, Barry CE, 3rd. Confronting the scientific obstacles to global control of tuberculosis. J Clin Invest 2008;1 18: 1255-1265.
(2) WHO. Global tuberculosis control. World health organisation. 2010.
(3) Pfyffer GE, Cieslak C, Welscher HM, Kissling P, Rusch-Gerdes S. Rapid detection of mycobacteria in clinical specimens by using the automated bactec 9000 mb system and comparison with radiometric and solid-culture systems. J Clin Microbiol 1997;35:2229-2234. (4) CCDC. Center for communicable disease control and prevention. Reported tuberculosis in the United States, 2007. C. U.S. Department of health and human services. Atlanta, ga. 2007.
(5) Boehme CC, Nabeta P, Hillemann D, Nicol MP, Shenai S, Krapp F, Allen J, Tahirli R, Blakemore R, Rustomjee R, Milovic A, Jones M, O'Brien SM, Persing DH, Ruesch-Gerdes S, Gotuzzo E, Rodrigues C, Alland D, Perkins MD. Rapid molecular detection of tuberculosis and rifampin resistance. N Engl J Med 2010;363: 1005-1015.
(6) Mitchison DA. Assessment of new sterilizing drugs for treating pulmonary tuberculosis by culture at 2 months. Am Rev Respir Dis 1993;147: 1062-1063.
(7) Home DJ, Royce SE, Gooze L, Narita M, Hopewell PC, Nahid P, Steingart KR. Sputum monitoring during tuberculosis treatment for predicting outcome: Systematic review and meta-analysis. Lancet Infect Dis 2010;10:387-394.
(8) Walzl G, Ronacher K, Hanekom W, Scriba TJ, Zumla A. Immunological biomarkers of tuberculosis. Nat Rev Immunol 2011 ; 11 :343-354.
(9) Berry MP, Graham CM, McNab FW, Xu Z, Bloch SA, Oni T, Wilkinson KA, Banchereau R, Skinner J, Wilkinson RJ, Quinn C, Blankenship D, Dhawan R, Cush JJ, Mejias A, Ramilo O, on OM, Pascual V, Banchereau J, Chaussabel D, O'Garra A. An interferon-inducible neutrophil-driven blood transcriptional signature in human tuberculosis. Nature 2010;466:973-977.
(10) Benjamini Y, Hochberg Y. Controlling the false discovery rate: A practical and powerful approach to multiple testing. JR Stat Soc Ser A Stat Soc 1995;57:289-300.
(1 1) Bland JM, Altaian DG. Multiple significance tests: The bonferroni method. BMJ 1995;310: 170.
(12) Haahr M. Random. Org. School of Computer Science and Statistics, Trinity College, Dublin 1998.
(13) Quackenbush J. Computational analysis of microarray data. Nat Rev Genet 2001 ;2:418- 427.
(14) Pankla R, Buddhisa S, Berry M, Blankenship DM, Bancroft GJ, Banchereau J, Lertmemongkolchai G, Chaussabel D. Genomic transcriptional profiling identifies a candidate blood biomarker signature for the diagnosis of septicemic melioidosis. Genome £zo/ 2009;10:R127.
(15) Mkhize-Kwitshana ZL, Taylor M, Jooste P, Mabaso ML, Walzl G. The influence of different helminth infection phenotypes on immune responses against hiv in co-infected adults in south africa. BMC Infect Dis 2011 ; 1 1 :273.
(16) Luo C, Chen M, Xu H. Complement gene expression and regulation in mouse retina and retinal pigment epithelium/choroid. Mol Vis 2011 ;17: 1588-1597.
(17) Walker DG, Kim SU, McGeer PL. Complement and cytokine gene expression in cultured microglial derived from postmortem human brains. J Neurosci Res 1995;40:478- 493.
(18) Khoo JJ, Forster S, Mansell A. Toll-like receptors as interferon-regulated genes and their role in disease. J Interferon Cytokine Res 201 1 ;31 : 13-25.
(19) Moran LB, Duke DC, Graeber MB. The microglial gene regulatory network activated by interferon-gamma. J Neuroimmunol 2007; 183:1-6.
(20) Bennett L, Palucka AK, Arce E, Cantrell V, Borvak J, Banchereau J, Pascual V. Interferon and granulopoiesis signatures in systemic lupus erythematosus blood. J Exp Med
2003;197:71 1 -723.
(21) Maertzdorf J, Repsilber D, Parida SK, Stanley K, Roberts T, Black G, Walzl G, Kaufmann SH. Human gene expression profiles of susceptibility and resistance in tuberculosis. Genes Immun 2011 ;12:15-22.
(22) Maertzdorf J, Ota M, Repsilber D, Mollenkopf HJ, Weiner J, Hill PC, Kaufmann SH. Functional correlations of pathogenesis-driven gene expression signatures in tuberculosis. PLoS One 201 1 ;6:e26938.
(23) Nahid P, Saukkonen J, Mac Kenzie W, Johnson JL, Phillips PJ, Andersen J, Bliven E, Belisle J, Boom H, Luetkemeyer A, Campbell T, Eisenach K, Hafner R, Lennox J, Makhene M, Swindells S, Villarino E, Weiner M, Benson C, Burman W. Tuberculosis biomarker and surrogate endpoint research roadmap. Am J Respir Crit Care Med 201 1 ;184:972-979.
(24) Perrin FM, Lipman MC, McHugh TD, Gillespie SH. Biomarkers of treatment response in clinical trials of novel antituberculosis agents. Lancet Infect Dis 2007;7:481 -490.
(25) Wallis RS, Pai M, Menzies D, Doherty TM, Walzl G, Perkins MD, Zumla A. Biomarkers and diagnostics for tuberculosis: Progress, needs, and translation into practice. Lancet 2010;375: 1920-1937.
(26) Walzl G, Ronacher K, Djoba Siawaya JF, Dockrell HM. Biomarkers for tb treatment response: Challenges and future strategies. J Infect 2008;57: 103-109.
(27) Koth LL, Solberg OD, Peng JC, Bhakta NR, Nguyen CP, Woodruff PG. Sarcoidosis blood transcriptome reflects lung inflammation and overlaps with tuberculosis. Am J Respir Crit Care Med 2011 ; 184: 1 153- 1 163.
(28) Mistry R, Cliff JM, Clayton CL, Beyers N, Mohamed YS, Wilson PA, Dockrell HM, Wallace DM, van Helden PD, Duncan , Lukey PT. Gene-expression patterns in whole blood identify subjects at risk for recurrent tuberculosis. J Infect Dis 2007;195:357-365.
(29) Joosten SA, Goeman JJ, Sutherland JS, Opmeer L, de Boer KG, Jacobsen M, Kaufmann SH, Finos L, Magis-Escurra C, Ota MO, Ottenhoff TH, Haks MC. Identification of biomarkers for tuberculosis disease using a novel dual-color rt-mlpa assay. Genes Immun 2012;13:71-82.
References of Example 2
[1] Young DB, Perkins MD, Duncan K, Barry CE 3rd (2008) Confronting the scientific obstacles to global control of tuberculosis. J Clin Invest 1 18: 1255-1265.
[2] WHO (2010) Global tuberculosis control. World Health Organisation.
[3] Pfyffer GE, Cieslak C, Welscher HM, Kissling P, Rusch-Gerdes S (1997) Rapid detection of mycobacteria in clinical specimens by using the automated BACTEC 9000 MB system and comparison with radiometric and solid-culture systems. J Clin Microbiol 35: 2229-2234.
[4] Boehme CC, Nabeta P, Hillemann D, Nicol MP, Shenai S, et al. (2010) Rapid molecular detection of tuberculosis and rifampin resistance. N Engl J Med 363: 1005-1015.
[5] CCDC (2007) Center for Communicable Disease Control and Prevention. Reported Tuberculosis in the United States, 2007. C. U.S. Department of Health and Human Services. Atlanta, GA.
[6] Mitchison DA (1993) Assessment of new sterilizing drugs for treating pulmonary tuberculosis by culture at 2 months. Am Rev Respir Dis 147: 1062-1063.
[7] Home DJ, Royce SE, Gooze L, Narita M, Hopewell PC, et al. (2010) Sputum monitoring during tuberculosis treatment for predicting outcome: systematic review and meta-analysis. Lancet Infect Dis 10: 387-394.
[8] Walzl G, Ronacher K, Hanekom W, Scriba TJ, Zumla A (201 1) Immunological biomarkers of tuberculosis. Nat Rev Immunol 1 1 : 343-354.
[9] Reis-Filho JS, Pusztai L (201 1) Gene expression profiling in breast cancer: classification, prognostication, and prediction. Lancet 378: 1812-1823.
[10] Pascual V, Chaussabel D, Banchereau J (2010) A genomic approach to human autoimmune diseases. Annu Rev Immunol 28: 535-571.
[1 1] Berry MP, Graham CM, McNab FW, Xu Z, Bloch SA, et al. (2010) An interferon- inducible neutrophil-driven blood transcriptional signature in human tuberculosis. Nature 466: 973-977.
[12] Haahr M (1998) random.org. School of Computer Science and Statistics, Trinity College, Dublin.
[13] Benjamini Y, Hochberg Y (1995) Controlling the false discovery rate: a practical and powerful approach to multiple testing. J R Stat Soc Ser A Stat Soc 57: 289-300.
[14] Bland JM, Altman DG (1995) Multiple significance tests: the Bonferroni method. BMJ 310: 170.
[15] Quackenbush J (2001) Computational analysis of microarray data. Nat Rev Genet 2: 418-427.
[16] Pankla R, Buddhisa S, Berry M, Blankenship DM, Bancroft GJ, et al. (2009) Genomic transcriptional profiling identifies a candidate blood biomarker signature for the diagnosis of septicemic melioidosis. Genome Biol 10: R127.
[17] Nahid P, Saukkonen J, Mac Kenzie W, Johnson JL, Phillips PJ, et al. (201 1) Tuberculosis Biomarker and Surrogate Endpoint Research Roadmap. Am J Respir Crit Care Med l U: 972-979.
[18] Perrin FM, Lipman MC, McHugh TD, Gillespie SH (2007) Biomarkers of treatment response in clinical trials of novel antituberculosis agents. Lancet Infect Dis 7: 481^190.
[19] Wallis RS, Pai M, Menzies D, Doherty TM, Walzl G, et al. (2010) Biomarkers and diagnostics for tuberculosis: progress, needs, and translation into practice. Lancet 375: 1920— 1937.
[20] Walzl G, Ronacher K, Djoba Siawaya JF, Dockrell HM (2008) Biomarkers for TB treatment response: challenges and future strategies. J Infect 57: 103-109.
[21] Gumbo T, Louie A, Liu W, Brown D, Ambrose PG, et al. (2007) Isoniazid bactericidal activity and resistance emergence: integrating pharmacodynamics and pharmacogenomics to predict efficacy in different ethnic populations. Antimicrob Agents Chemother 51 : 2329- 2336.
[22] Jindani A, Aber VR, Edwards EA, Mitchison DA (1980) The early bactericidal activity of drugs in patients with pulmonary tuberculosis. Am Rev Respir Dis 121 : 939-949.
[23] de Steenwinkel JE, de Knegt GJ, ten Kate MT, van Belkum A, Verbrugh HA, et al. (2010) Time-kill kinetics of anti-tuberculosis drugs, and emergence of resistance, in relation to metabolic activity of Mycobacterium tuberculosis. J Antimicrob Chemother 65: 2582- 2589.
[24] Koth LL, Solberg OD, Peng JC, Bhakta NR, Nguyen CP, et al. (201 1) Sarcoidosis Blood Transcriptome Reflects Lung Inflammation and Overlaps with Tuberculosis. Am J Respir Crit Care Med 184: 1 153-1 163.
[25] Maertzdorf J, Repsilber D, Parida SK, Stanley K, Roberts T, et al. (201 1) Human gene expression profiles of susceptibility and resistance in tuberculosis. Genes Immun 12: 15-22.
[26] Maertzdorf J, Ota M, Repsilber D, Mollenkopf HJ, Weiner J, et al. (201 1) Functional correlations of pathogenesis-driven gene expression signatures in tuberculosis. PLoS One 6: e26938.
[27] Mistry R, Cliff JM, Clayton CL, Beyers N, Mohamed YS, et al. (2007) Gene-expression patterns in whole blood identify subjects at risk for recurrent tuberculosis. J Infect Dis 195: 357-365.
[28] Joosten SA, Goeman JJ, Sutherland JS, Opmeer L, de Boer KG, et al. (2012) Identification of biomarkers for tuberculosis disease using a novel dual-color RT-MLPA assay. Genes Immun 13: 71-82.