WO2010035811A1 - Blood sugar information processor, blood sugar information processing method, and blood sugar information processing program - Google Patents
Blood sugar information processor, blood sugar information processing method, and blood sugar information processing program Download PDFInfo
- Publication number
- WO2010035811A1 WO2010035811A1 PCT/JP2009/066707 JP2009066707W WO2010035811A1 WO 2010035811 A1 WO2010035811 A1 WO 2010035811A1 JP 2009066707 W JP2009066707 W JP 2009066707W WO 2010035811 A1 WO2010035811 A1 WO 2010035811A1
- Authority
- WO
- WIPO (PCT)
- Prior art keywords
- blood glucose
- glucose level
- graph
- time
- time zone
- Prior art date
Links
Images


Classifications
-
- A—HUMAN NECESSITIES
- A61—MEDICAL OR VETERINARY SCIENCE; HYGIENE
- A61B—DIAGNOSIS; SURGERY; IDENTIFICATION
- A61B5/00—Measuring for diagnostic purposes; Identification of persons
- A61B5/145—Measuring characteristics of blood in vivo, e.g. gas concentration, pH value; Measuring characteristics of body fluids or tissues, e.g. interstitial fluid, cerebral tissue
- A61B5/14532—Measuring characteristics of blood in vivo, e.g. gas concentration, pH value; Measuring characteristics of body fluids or tissues, e.g. interstitial fluid, cerebral tissue for measuring glucose, e.g. by tissue impedance measurement
-
- A—HUMAN NECESSITIES
- A61—MEDICAL OR VETERINARY SCIENCE; HYGIENE
- A61B—DIAGNOSIS; SURGERY; IDENTIFICATION
- A61B2562/00—Details of sensors; Constructional details of sensor housings or probes; Accessories for sensors
- A61B2562/02—Details of sensors specially adapted for in-vivo measurements
- A61B2562/028—Microscale sensors, e.g. electromechanical sensors [MEMS]
-
- A—HUMAN NECESSITIES
- A61—MEDICAL OR VETERINARY SCIENCE; HYGIENE
- A61B—DIAGNOSIS; SURGERY; IDENTIFICATION
- A61B5/00—Measuring for diagnostic purposes; Identification of persons
- A61B5/145—Measuring characteristics of blood in vivo, e.g. gas concentration, pH value; Measuring characteristics of body fluids or tissues, e.g. interstitial fluid, cerebral tissue
- A61B5/1455—Measuring characteristics of blood in vivo, e.g. gas concentration, pH value; Measuring characteristics of body fluids or tissues, e.g. interstitial fluid, cerebral tissue using optical sensors, e.g. spectral photometrical oximeters
-
- A—HUMAN NECESSITIES
- A61—MEDICAL OR VETERINARY SCIENCE; HYGIENE
- A61B—DIAGNOSIS; SURGERY; IDENTIFICATION
- A61B5/00—Measuring for diagnostic purposes; Identification of persons
- A61B5/74—Details of notification to user or communication with user or patient ; user input means
- A61B5/742—Details of notification to user or communication with user or patient ; user input means using visual displays
- A61B5/743—Displaying an image simultaneously with additional graphical information, e.g. symbols, charts, function plots
-
- G—PHYSICS
- G01—MEASURING; TESTING
- G01N—INVESTIGATING OR ANALYSING MATERIALS BY DETERMINING THEIR CHEMICAL OR PHYSICAL PROPERTIES
- G01N21/00—Investigating or analysing materials by the use of optical means, i.e. using sub-millimetre waves, infrared, visible or ultraviolet light
- G01N21/75—Systems in which material is subjected to a chemical reaction, the progress or the result of the reaction being investigated
- G01N21/77—Systems in which material is subjected to a chemical reaction, the progress or the result of the reaction being investigated by observing the effect on a chemical indicator
- G01N21/78—Systems in which material is subjected to a chemical reaction, the progress or the result of the reaction being investigated by observing the effect on a chemical indicator producing a change of colour
Definitions
- the present invention relates to a blood glucose level information processing apparatus, a blood glucose level information processing method, and a blood glucose level information processing program, and is applied to, for example, a case where a transition of a blood glucose level periodically measured by an external blood glucose level measuring device is provided as a graph. Therefore, it is suitable.
- a blood glucose level measured by a blood glucose level measuring instrument and a measurement date / time when the blood glucose level was measured are acquired, and based on the measurement date / time, “before breakfast”, “after breakfast” ”,“ Before lunch ”,“ after lunch ”,“ before dinner ”,“ after dinner ”,“ before going to bed ”,“ late night ”, etc. (For example, refer to Patent Document 1).
- the blood glucose level information processing apparatus can statistically provide the blood glucose level and blood glucose level information based on the blood glucose level to a doctor or the like for each time zone, and the blood glucose level and blood glucose level based on the blood glucose level. By displaying the value information in a graph along the time series based on the measurement date and time, the tendency can be easily grasped.
- the conventional blood glucose level information processing apparatus when displaying the blood glucose level and blood glucose level information in a graph along the time series based on the measurement date and time, the time axis cannot be easily changed, and thus the period desired by the user Alternatively, there is a problem in that a complicated operation is forced when the blood glucose level and blood glucose level information of the range are easily provided.
- one or a plurality of blood glucose levels measured by an external blood glucose level measuring device and a measurement date and time when the one or more blood glucose levels are measured are acquired and corresponded to a predetermined period.
- a blood glucose level graph in which blood glucose levels are plotted along the time series based on the measurement date and time, and a slide bar that translates along the time series is displayed on the display unit, and the slide bar is translated
- the blood glucose level graph corresponding to the previous period corresponding to the amount of movement of the slide bar is displayed with the period range fixed. According to the present invention, it is possible to display a blood glucose level graph in which the blood glucose level corresponding to the previous period corresponding to the amount of movement of the slide bar can be displayed only by moving the slide bar, and thus complicated for the user.
- the blood glucose level and blood glucose level information in a period or range desired by the user can be easily provided without forcing a simple operation.
- the blood glucose level is classified into any time zone, the blood glucose level is classified based on the measurement date and time. Therefore, there is a problem that accurate blood glucose level and blood glucose level information for each time zone cannot be provided.
- one or more blood glucose levels measured by an external blood glucose level measuring device and the measurement date and time when the one or more blood glucose levels are measured are acquired, and the blood glucose level is measured.
- the blood glucose level is displayed in a list based on the measurement date based on the measurement date and time zone and the multiple time zone segments, and a specific blood glucose level is selected from the list.
- a pop-up menu provided with a front button and a rear button for moving the specific blood glucose level time zone forward and backward is displayed on the display unit, and when the front button is selected, The blood glucose level is changed to the adjacent time zone classification, and when the rear button is selected, the specific blood glucose level is changed to the adjacent later time zone classification.
- a pop-up menu is displayed, and a time zone classification of an arbitrary blood glucose level is performed simply by selecting the front button or the rear button of the pop-up menu
- FIG. 1 is a schematic diagram illustrating a configuration of a blood glucose level information processing system.
- FIG. 2 is a schematic diagram illustrating a circuit configuration of the blood glucose level information processing apparatus.
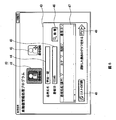
- FIG. 3 is a schematic diagram showing the configuration of the start screen.
- FIG. 4 is a schematic diagram illustrating the configuration of the login screen.
- FIG. 5 is a schematic diagram showing the configuration (1) of the patient search screen.
- FIG. 6 is a schematic diagram illustrating the configuration (2) of the patient search screen.
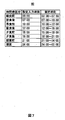
- FIG. 7 is a schematic diagram showing the configuration of the time zone division table.
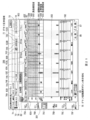
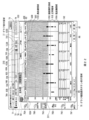
- FIG. 8 is a schematic diagram showing a configuration (1) of a graph display screen displaying a line graph of all time.
- FIG. 9 is a schematic diagram showing a configuration (2) of the graph display screen displaying a line graph of all time.
- FIG. 10 is a schematic diagram illustrating a configuration of a graph display screen displaying a line graph of all time when the comparison button is selected.
- FIG. 11 is a schematic diagram showing a configuration of a graph display screen displaying a line graph for each time zone.
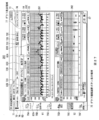
- FIG. 12 is a schematic diagram illustrating a configuration of a graph display screen displaying an average graph of monthly averages.
- FIG. 13 is a schematic diagram illustrating a configuration of a graph display screen displaying a monthly average average graph and a standard deviation line graph.
- FIG. 14 is a schematic diagram illustrating a configuration of a graph display screen displaying an average graph of weekly averages.
- FIG. 15 is a schematic diagram illustrating a configuration of a graph display screen displaying a weekly averaged average graph and a standard deviation line graph.
- FIG. 16 is a schematic diagram illustrating a configuration of a graph display screen that displays an average graph for each hour.
- FIG. 17 is a schematic diagram illustrating a configuration of a graph display screen displaying an average graph and a standard deviation line graph for each hour.
- FIG. 18 is a schematic diagram illustrating a configuration of a graph display screen displaying a plot graph every hour.
- FIG. 19 is a schematic diagram illustrating a configuration of a graph display screen displaying a plot graph and a standard deviation line graph for each hour.
- FIG. 20 is a schematic diagram illustrating a configuration of a graph display screen that displays an average graph for each time zone section.
- FIG. 21 is a schematic diagram illustrating a configuration of a graph display screen displaying an average graph and a standard deviation line graph for each time zone.
- FIG. 22 is a schematic diagram illustrating a configuration of a graph display screen displaying a plot graph for each time zone section.
- FIG. 23 is a schematic diagram illustrating a configuration of a graph display screen displaying a plot graph and a standard deviation line graph for each time zone.
- FIG. 24 is a schematic diagram illustrating a configuration of a graph display screen displaying a pie chart.
- FIG. 25 is a schematic diagram illustrating a configuration of a graph display screen displaying a stacked bar graph for each month.
- FIG. 26 is a schematic diagram illustrating a configuration of a graph display screen displaying a stacked bar graph for each week.
- FIG. 27 is a schematic diagram illustrating a configuration of a graph display screen when the My graph button is selected.
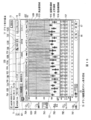
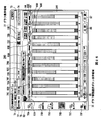
- FIG. 28 is a schematic diagram illustrating a configuration of a blood sugar level note display screen.
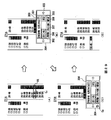
- FIG. 29 is a schematic diagram showing a state of changing the time zone division.
- reference numeral 1 denotes a blood glucose level information processing system as an embodiment of the present invention as a whole, and includes a blood glucose level information processing device 2, a printer 3, and a blood glucose level measurement unit 4.
- the blood glucose level information processing apparatus 2 is, for example, a personal computer, and is connected to the printer 3 via, for example, a USB (Universal Serial Bus) cable and connected to the printer 3 via an optical communication module (not shown) connected via an RS232C cable.
- Optical communication with the value measuring unit 4 is possible.
- the blood sugar level measuring unit 4 is provided with a blood sugar level measuring device 5 that measures blood sugar levels by a patient, and a communication module 6 that communicates with the blood sugar level information processing apparatus 2 and the printer 3.
- the blood glucose level measuring device 5 collects the blood of the patient with a replaceable measuring chip 7 provided at the tip thereof, reacts the collected blood with the reagent enclosed in the measuring chip 7, and causes the reaction.
- the concentration of glucose contained in the blood is measured by optically reading the color of the blood, and as a result, the blood glucose level is obtained.
- the blood glucose level measuring device 5 has a clock function inside, for example, is configured to count time based on the date and time input by the user at the time of initial setting, and the measured blood glucose level together with the measurement date and time.
- the measurement data is stored in, for example, a non-volatile memory provided therein.
- the blood glucose level changes depending on the time before and after the meal, the time zone and lifestyle, etc.
- the patient for example, before breakfast, after breakfast, before lunch, after lunch, before dinner, after dinner
- the blood glucose level measuring device 5 is used to measure blood glucose level several times before going to bed and at midnight and 1 day. Therefore, since the blood glucose level measuring device 5 can store, for example, 150 measurement data, for example, when the patient measures four times a day, the measurement data for about 36 days can be stored. Has been made.
- the blood glucose level measuring device 5 is provided with an optical communication transmission / reception unit (not shown) at a position facing the optical communication transmission / reception unit 9A of the communication module 6 so that it can optically communicate with the communication module 6. Yes.
- the communication module 6 transmits the measurement data stored in the memory of the blood glucose level measuring device 5 to the optical communication transmitting / receiving unit. Via the optical communication transmitting / receiving unit 9A and receiving the measurement data by optical communication. Then, the communication module 6 transmits the measurement data received from the blood sugar level measuring device 5 to the blood sugar level information processing device 2 via the optical communication transmitting / receiving unit 9B.
- the communication module 6 is the same as when the optical communication button 8A is pressed down. Receive measurement data from. Then, the communication module 6 transmits the measurement data to the printer 3 connected via a predetermined cable (not shown), so that the printer 3 prints the blood glucose level and the measurement date / time of the measurement data in the order from the oldest measurement date / time. It is made to be able to do.
- the blood glucose level information processing apparatus 2 includes a CPU (Central Processing Unit) 11, a ROM (Read Only Memory) 12, a RAM (Random Access Memory) 13, a hard disk drive 14, an LCD (Liquid Crystal Display), and the like.
- a display unit 15, an operation unit 16 including a mouse and a keyboard, an external connection interface unit 17, and a clock unit 18 for counting time are connected via a bus 19.
- the CPU 11 reads out a basic program stored in the ROM 12, develops it in the RAM 13, performs overall control according to the basic program, and executes various application programs stored in the ROM 12 or the hard disk drive 14. The data is expanded in the RAM 13 and various processes are executed according to the various application programs.
- the blood glucose level information processing apparatus 2 is connected to an optical communication module (not shown) via an RS232C cable connected to the external connection interface unit 17 and via a USB cable connected to the external connection interface unit 17. It is connected to the printer 3 (FIG. 1). Therefore, when the optical communication button 8A of the communication module 6 is pressed by the user and the measurement data is transmitted from the blood glucose level measuring device 5 via the communication module 6, the blood glucose level information processing apparatus 2 causes the external connection interface unit 17 to be connected. And stored in the hard disk drive 14. At this time, since it is assumed that the blood glucose level information processing apparatus 2 receives measurement data from a large number of blood glucose level measuring devices 5, for example, measurement is performed in folders respectively associated with patient names provided in the hard disk drive 14. It is designed to store data.
- the CPU 11 reads the blood glucose level information processing program from the hard disk drive 14 and expands it in the RAM 13. Blood glucose level information processing is executed according to the blood glucose level information processing program.
- the CPU 11 displays a start screen 20 on the display unit 15 as shown in FIG.
- the start screen 20 displays, for example, blood glucose level meter transmission guide illustrations 21 and 22 for guiding a transmission method for transmitting measurement data from two different types of blood glucose level measuring devices 5 and a log-in button 23 for logging into a doctor. Has been.
- the CPU 11 logs in the login screen 30 that requests the doctor to log in as shown in FIG. Is displayed on the display unit 15.
- the login screen 30 displays a user name input field 31 and a password input field 32 for inputting a user name and a password, a login button 33 for performing login, and a cancel button 34 for canceling login.
- the CPU 11 uses the registered use.
- the patient search screen 40 includes, for example, a patient search button 41 for selecting a mode for searching a specific patient from a patient database registered in advance in the hard disk drive 14 (hereinafter referred to as a search mode), and a new patient in the patient database.
- a patient registration button 42 for selecting a mode for registering (hereinafter referred to as a registration mode) and a mode-specific display area 43 are provided.
- a registration mode a mode for registering
- a mode-specific display area 43 are provided in this patient database.
- a patient's name, kana, sex, patient ID, and the like are associated and registered.
- the patient search button 41 When the CPU 11 displays the patient search screen 40 on the display unit 15, the patient search button 41 is selected as a default, and a patient name input field 44 and a patient ID input field 45 for inputting a patient name and a patient ID, and a search A search button 46 for executing the above, a patient list display field 47 for displaying a list of search results, a print button 48, and a graph display button 49 are displayed in the display area 43 for each mode. Then, the CPU 11 inputs at least one of the patient name and the patient ID in the patient name input field 44 and the patient ID input field 45 by the operation of the doctor on the operation unit 16, and selects the search button 46.
- the CPU 11 searches the patient name and patient ID input in the patient name input field 44 and the patient ID input field 45 from the patient database stored in the hard disk drive 14, and detects a matching patient name or patient ID. As shown in FIG. 6, the matched patient name, kana, sex and patient ID are read from the patient database and displayed in the patient list display column 47 as patient items 47a.
- the print button 48 is selected in response to an operation on the operation unit 16 by the doctor while the patient item 47a is displayed in the patient list display column 47, the CPU 11 displays the patient list display column 47 in the external connection interface unit.
- the printer 3 (FIG. 1) is made to print via the printer 17.
- the CPU 11 can execute a registration mode to newly register a patient.
- the CPU 11 stores it in the folder corresponding to the patient name of the selected patient item 47a.
- the measured data is read from the hard disk drive 14. Then, the CPU 11 compares the blood glucose level of the read measurement data with the measurement date / time of the blood glucose level and the time zone division table 60 as shown in FIG.
- the time zone classification table 60 divide into here, in the time zone classification table 60, for example, the time zone classification is “before breakfast”, “after breakfast”, “before lunch”, “after lunch”, “before dinner”, “after dinner”, “before bedtime”, and “ It is divided into eight “midnight”.
- the time zone classification table 60 allows the time zone division “before breakfast” to correspond to the measurement time “03:00 to 07:00” by inputting the set input time via the operation unit 16.
- the category “after breakfast” corresponds to the measurement time “7:00 to 10:00”
- the time zone category “before lunch” corresponds to the measurement time “10:00 to 12:00”
- the time zone category “after lunch” ” Corresponds to the measurement time“ 12:00 to 15:00
- the time zone classification“ before dinner ” corresponds to the measurement time“ 15:00 to 18:00
- the time zone division“ after dinner ” is the measurement time.
- the time zone classification “before going to bed” corresponds to the measurement time “21:00 to 24:00”
- the time zone classification “midnight” is the measurement time “24:00 to 03:00 ”.
- the CPU 11 classifies the blood glucose level of the measurement data into the time zone classification “before breakfast” For example, when the measurement time of the measurement data is “14:20”, the blood glucose level of the measurement data is classified into the time zone classification “after lunch”. In this way, when the CPU 11 reads out the measurement data stored in the folder corresponding to the patient name of the patient item 47a from the hard disk drive 14, the blood glucose level of all of the read out measurement data is divided into any time zone. .
- the CPU 11 generates a blood glucose level database that associates the blood glucose level of the measurement data and the time zone segmented with the measurement date and time, and stores the blood glucose level database in a folder corresponding to the patient name of the hard disk drive 14, for example.
- a graph display screen 70 as shown in FIG. 8 is displayed on the display unit 15.
- the graph display screen 70 includes a menu bar 71 on which menu items that can be executed are displayed, a patient information column 72 for displaying patient information, a standby button 73 for shifting to a standby mode, a logoff button 74 for logging off, and a graph type.
- the name and patient ID of the selected patient are displayed in the patient name display column 72A and the patient ID display column 72B, respectively.
- a patient detail button 72C and a new button are displayed on the right side of the patient ID display column 72B.
- 72D and a search button 72E are provided.
- the CPU 11 displays the patient detailed information.
- the CPU 11 can register a new patient when the new button 72D in the patient information column 72 is selected via the operation unit 16.
- the graph type selection button display area 75 is provided with a trend button 75A, a period average button 75B, a 24h trend button 75C, a ratio button 75D, a My graph button 75E, and a blood glucose level note button 75F, and any one of them is selected.
- the trend button 75A is selected by default.
- the graph type selection button display area 76 a graph type corresponding to each of the trend button 75A, the period average button 75B, the 24h trend button 75C, the ratio button 75D, and the My graph button 75E of the graph type selection button display area 75 is selected.
- buttons are displayed, and when the trend button 75A is selected, an all time button 76A and a time zone button 76B are displayed. Incidentally, the all time button 76A is selected by default.
- the graph display area 77 includes buttons selected in the graph type selection button display area 75 (a trend button 75A, a period average button 75B, a 24h trend button 75C, a ratio button 75D, a My graph button 75E, and a blood glucose level note button 75F). ) And a graph corresponding to the button selected in the graph type selection button display area 76 (in this case, the all time button 76A or the time zone button 76B) and various information related to the graph are displayed. Has been made.
- a line graph 81 is displayed, a period information display area 82, a blood glucose level information display area 83, a time zone classification selection check.
- a box 84, a legend display area 85, a comparison button 86, and a print button 87 are provided.
- “before morning” corresponds to the time zone category “before breakfast”
- “after morning” corresponds to the time zone category “after breakfast”
- “before noon” is the time zone category.
- the CPU 11 displays the date corresponding to the range of “1 month” displayed in the range selection menu 82A of the period information display area 82 with the current date acquired from the clock unit 18 as a reference, and a start date display field 82B and an end date display. Displayed in the column 82C.
- This range selection menu 82A is a pull-down menu so that a doctor can select a range, and for example, “1 month”, “2 months”, “3 months”, and “6 months” can be selected. As a default, “1 month” is selected and displayed.
- the CPU 11 reads the blood glucose level database corresponding to the patient name displayed in the patient name display field 72A from the hard disk drive 14, and starts the start date displayed in the start date display field 82B and the end date display field 82C based on the measurement date and time. Blood glucose level in the range from the date to the end date, and the time zone division (in this case, “before breakfast”, “after breakfast”, “after dinner”, and “late night”) checked in the time zone selection checkbox 84 Only extract from the blood glucose database.
- the CPU 11 plots the extracted blood glucose level with the symbols for each time zone along the time series, and generates a line graph 81 by connecting the symbols that precede and follow each other with a straight line.
- the horizontal axis is the date
- the vertical axis is the blood glucose level (mg / dl).
- the line graph 81 is divided into a plurality of regions according to the blood glucose level. For example, a region in which the blood glucose level is 0 to 59 [mg / dl] that is hypoglycemic is a green hypoglycemic region 81A, a blood glucose level, and the like.
- a normal region having a value of 60 to 109 [mg / dl] is, for example, a white normal region 81B, and a region between normal and hyperglycemia having a blood glucose level of 110 to 125 [mg / dl] is, for example, a yellow false positive
- the region 81C and the region considered to be hyperglycemia with a blood glucose level of 126 to 400 [mg / dl] are defined as, for example, a pink hyperglycemia region 81D.
- the line graph 81 has a so-called gradation display in which the color scheme near the boundaries of the hypoglycemia region 81A, normal region 81B, false positive region 81C, and hyperglycemia region 81D is gradually changed from one color to the other. . Furthermore, in the line graph 81, when the plotted blood glucose level is 0 to 59 [mg / dl] and 126 [mg / dl] or more as shown in the legend display area 85, the plotted blood glucose level is By highlighting the symbol, it is possible for the doctor to easily visually check.
- the CPU 11 calculates the average value, standard deviation value, maximum value, minimum value, and number of data of the blood sugar level extracted from the blood sugar level database, and calculates the average value, standard deviation value, maximum value, minimum value, and number of data, respectively.
- the line graph 81 is provided with a slide bar 88 for moving a reference (in this case, a reference date) below the line graph 81. As shown in FIG.
- the CPU 11 is configured to go back the reference date according to the amount of movement of the slide bar 88, and the reference date that goes back. Only the blood glucose level for the previous month is extracted from the blood glucose level database again, and the blood glucose level is plotted again on the line graph 81 with symbols for each time zone along the time series. At this time, the CPU 11 displays the retroactive reference date in the end date display column 82C, and displays the date one month before the reference date in the start date display column 82B. The CPU 11 again calculates the average value, standard deviation value, maximum value, minimum value, and number of data of the blood glucose level extracted again from the blood glucose level database, and calculates the average value, standard deviation value, maximum value, minimum value, and data.
- the numbers are displayed in the average value display field 83A, the standard deviation value display field 83B, the maximum value display field 83C, the minimum value display field 83D, and the measurement frequency display field 83E of the blood sugar level information display area 83, respectively.
- the CPU 11 changes the horizontal axis of the line graph 81 from one month to three months when, for example, “three months” of the range selection menu 82A in the period information display area 82 is selected via the operation unit 16. Blood glucose levels for three months are plotted on a line graph 81 with symbols for each time zone along a time series.
- the CPU 11 adds period information to the graph display area 77 as shown in FIG. Display area 82, blood glucose level information display area 83, time zone classification selection check box 84, legend display area 85, line graph 91 obtained by reducing the line graph 81 in the vertical direction, line graph 92, comparison period information display area 93, comparative blood glucose
- a graph display screen 90 provided with a value information display area 94, a comparison release button 95 and a print button 87 is displayed on the display unit 15.
- the CPU 11 displays “1 month” which is the same as the range selection menu 82A in the period selection menu 93A of the comparison period information display area 93, and immediately before the start date displayed in the start date display field 82B.
- the comparison start date and the comparison end date corresponding to the range of “1 month” are displayed in the comparison start date display column 93B and the comparison end date display column 93C, respectively.
- the CPU 11 extracts the blood glucose level from the comparison start date displayed in the comparison start date display column 93B and the comparison end date display column 93C from the blood glucose level database read from the hard disk drive 14 to the comparison end date based on the measurement date.
- a line graph 92 is generated by plotting the symbols for each time zone segment and connecting the symbols that precede and follow each other with a straight line.
- the CPU 11 displays the line graphs 91 and 92 in the graph display area 77 so as to be arranged vertically. Further, the CPU 11 calculates the average value, standard deviation value, maximum value, minimum value, and number of data of blood glucose values plotted on the line graph 92, and calculates the average value, standard deviation value, maximum value, minimum value, and number of data, respectively.
- the average value display field 94A, the standard deviation value display field 94B, the maximum value display field 94C, the minimum value display field 94D, and the measurement frequency display field 94E are displayed.
- the CPU 11 goes back the reference date according to the amount of movement of the slide bar 96. Only the blood glucose level for one month until the reference date is re-plotted on the line graph 91 with the symbols for each time zone along the time series, and the line graph 92 is also the same number of days as the all-time line graph 91. It is designed to re-plot only going back.
- the CPU 11 is configured to go back the reference date according to the amount of movement of the slide bar 97. Re-plot only the blood glucose level for one month until the reference date going back to the line graph 92 with the symbols for each time zone along the time series, and the line graph 91 is also the same number of days as the line graph 92. It is made to re-plot as going back. Further, when the comparison cancel button 95 on the graph display screen 90 is selected and operated via the operation unit 16, the CPU 11 displays the graph display screen 70 (FIG. 8) on the display unit 15 again.
- the CPU 11 assigns the same reference numerals to the corresponding parts in FIG. As shown in FIG. 11, a graph display screen 100 in which a line graph 101 is displayed in the graph display area 77 is displayed on the display unit 15. At this time, the CPU 11 extracts the blood glucose level from the start date to the end date displayed in the start date display column 82B and the end date display column 82C from the blood glucose level database read from the hard disk drive 14, and further.
- the graph display screen 100 is generated by plotting as shown in FIG. Further, when the slide bar 88 provided below the line graph 101 is moved and operated via the operation unit 16 of the doctor, the CPU 11 goes back the reference date according to the moving amount of the slide bar 88. Only the blood glucose level for one month until the reference date that goes back is re-plotted on the line graph 101 so as to be connected by a straight line for each symbol of the time zone.
- the CPU 11 displays the graph display screen 90 when the comparison button 86 on the graph display screen 70 described above is selected and operated.
- the line graph 101 is reduced in the vertical direction on the upper side of the graph display area 77, and a line graph (not shown) in the same range as the line graph 101 and the previous period is displayed in the graph display area 77. Display on the bottom.
- the CPU 11 attaches the same reference numerals to the corresponding parts in FIG. As shown in FIG.
- the graph display screen 110 is displayed on the display unit 15.
- a monthly average button 76C and a weekly average button 76D are displayed in the graph type selection button display area 76
- a period information display area 82, a blood glucose level information display area 83, and a time zone classification selection are displayed in the graph display area 77.
- a check box 84, a legend display area 85, an average graph 111, a blood glucose level information table 112, and an additional check box column 113 are provided.
- the range selection menu 82A is configured to select, for example, “12 months”, “24 months”, and “36 months”, and “12 months” is selected and displayed as a default.
- the CPU 11 displays the graph display screen 110 on the display unit 15, it is the period displayed in the start date display field 82 ⁇ / b> B and the end date display field 82 ⁇ / b> C and the time period classification checked in the time period classification selection check box 84 (this In this case, blood glucose levels of “before breakfast”, “after breakfast”, “after dinner”, and “midnight”) are extracted from the blood glucose beta base on a monthly basis based on the measurement date and time. Then, the CPU 11 calculates the average value, standard deviation value, maximum value, minimum value, number of data, and number of times of hypoglycemia (0 to 59 [mg / dl]) for each extracted blood glucose level.
- the CPU 11 displays an average graph 111 in which the calculated average value and standard deviation value for twelve months are indicated by a horizontal line and a vertical bar, respectively, in the graph display area 77, and calculates the average value of the calculated blood glucose level for each month,
- the standard deviation value (SD), the maximum value, the minimum value, the number of data (N number), and the number of hypoglycemia are displayed in the blood glucose level information table 112.
- the CPU 11 displays the graph display screen 90 when the comparison button 86 on the graph display screen 70 described above is selected and operated.
- the average graph 111 is vertically reduced and displayed on the upper side of the graph display area 77, and an average graph (not shown) in the same period and the previous period is displayed in the graph display area 77. Display on the bottom.
- the CPU 11 adds the same reference numerals to the corresponding parts in FIG.
- a graph display screen 120 on which a standard deviation line graph 122 in which standard deviation values for each month are connected with a straight line is displayed between the average graph 121 obtained by reducing the average graph 111 in the vertical direction and the blood glucose level information table 112 is displayed. To do.
- the CPU 11 selects, for example, the monthly HbA1c value registered in the patient database or the like in advance. It can be displayed as a line graph.
- the comparison button 86 on the graph display screen 120 is selected and operated through the operation unit 16
- the CPU 11 displays the graph display screen 90 when the comparison button 86 on the graph display screen 70 described above is selected and operated.
- the average graph 111 and the standard deviation line graph 122 are vertically reduced on the upper side of the graph display area 77, and the average graph of the immediately preceding period is within the same range as the average graph 111 and the standard deviation line graph 122.
- a standard deviation line graph (not shown) is displayed below the graph display area 77.
- the weekly average button 76D of the graph type selection button display area 76 on the graph display screen 110 (FIG. 12) is selected and operated via the operation unit 16
- the CPU 11 attaches the same reference numeral to the corresponding part to FIG.
- the graph display screen 130 as shown in FIG. 14 is displayed on the display unit 15.
- the range selection menu 82A can select, for example, “12 weeks”, “24 weeks”, and “36 weeks”, and “12 weeks” is selected and displayed as a default. Yes.
- the CPU 11 When displaying the graph display screen 130 on the display unit 15, the CPU 11 is a period displayed in the start date display field 82 ⁇ / b> B and the end date display field 82 ⁇ / b> C and the time period class checked in the time period class selection check box 84 (this In this case, blood glucose levels of “before breakfast”, “after breakfast”, “after dinner”, and “late night”) are extracted from the blood glucose beta base on a weekly basis based on the measurement date and time. Then, the CPU 11 calculates the average value, standard deviation value, maximum value, minimum value, number of data, and number of times of hypoglycemia (0 to 59 [mg / dl]) for each extracted blood glucose level.
- the CPU 11 displays an average graph 131 in which the calculated average value and standard deviation value for 12 weeks are indicated by a horizontal line and a vertical bar in the graph display area 77, and the calculated average value and standard value of the blood glucose level for each week.
- the deviation value, the maximum value, the minimum value, the number of data, and the number of hypoglycemia are displayed in the blood glucose level information table 132.
- the CPU 11 displays the graph display screen 90 when the comparison button 86 on the graph display screen 70 described above is selected and operated.
- the average graph 131 is vertically reduced and displayed on the upper side of the graph display area 77, and an average graph (not shown) in the same period and the previous period is displayed in the graph display area 77. Display on the bottom.
- the CPU 11 adds the same reference numerals to the corresponding parts in FIG.
- a graph display screen 140 on which a standard deviation line graph 142 in which standard deviation values for each week are connected with a straight line between the average graph 141 obtained by reducing the average graph 131 in the vertical direction and the blood glucose level information table 132 is displayed. To do.
- the CPU 11 displays the graph display screen 90 when the comparison button 86 on the graph display screen 70 described above is selected and operated.
- the average graph 141 and the standard deviation line graph 142 are vertically reduced on the upper side of the graph display area 77, and the same graph as the average graph 141 and the standard deviation line graph 142 and the average graph of the immediately preceding period are displayed.
- a standard deviation line graph (not shown) is displayed below the graph display area 77.
- the graph display screen 150 is displayed on the display unit 15.
- an all time button 76A and a time zone button 76B are displayed in the graph type selection button display area 76, and a period information display area 82, a blood glucose level information display area 83, and a legend display area are displayed in the graph display area 77.
- a comparison button 86, a print button 87, an average graph 151, a blood glucose level information table 152, and a check box field 153 are provided.
- the range selection menu 82A can select, for example, “1 month”, “2 months”, “3 months”, and “6 months”, and selects “1 month” as a default. it's shown.
- the check box column 153 an SD bar display check box 153A, an average value check box 153B, and a plot check box 153C are provided, and the average value check box 153B is checked as a default.
- the CPU 11 displays the graph display screen 150 on the display unit 15 on the display unit 15, the blood glucose level of the period displayed in the start date display field 82 ⁇ / b> B and the end date display field 82 ⁇ / b> C is measured every hour based on the measurement date and time from the blood sugar level beta base.
- the average graph 151 is vertically reduced and displayed on the upper side of the graph display region 77, and an average graph (not shown) in the same period and the previous period is displayed in the graph display region 77. Display on the bottom.
- the CPU 11 shows the corresponding parts in FIG.
- the graph display screen 160 in which the bar graph 162 showing the standard deviation value for each hour in a bar shape is displayed between the average graph 161 obtained by reducing the average graph 151 in the vertical direction and the blood glucose level information table 152. .
- the CPU 11 displays the graph display screen 90 when the comparison button 86 on the graph display screen 70 described above is selected and operated.
- the average graph 161 and the bar graph 162 are vertically reduced and displayed on the upper side of the graph display area 77, and the same range as the average graph 161 and the bar graph 162 and the average graph and bar graph of the immediately preceding period (not shown). ) Is displayed below the graph display area 77.
- the CPU 11 adds the same reference numerals to the corresponding parts in FIG.
- a graph display screen 170 as shown is displayed.
- the CPU 11 checks the plot check box 153C in the check box column 153 and unchecks the average value check box 153B.
- the blood glucose levels used in FIGS. 16 and 18 are actually the same, for convenience of explanation, different blood glucose levels are used in FIGS. 16 and 18, and the average graph 151 in FIG. 16 and the plot graph in FIG.
- the values of 171 and the blood glucose level information table 152 are only examples.
- the CPU 11 displays a plot graph 171 in which all the extracted blood glucose levels for one month are divided and plotted every hour in the graph display area 77 of the graph display screen 170.
- the plotted blood glucose level is plotted when the blood glucose level is 0 to 59 [mg / dl] and 126 [mg / dl] or more as shown in the legend display area 85.
- the doctor can easily make a visual check.
- the comparison button 86 on the graph display screen 170 is selected and operated through the operation unit 16
- the CPU 11 displays the graph display screen 90 when the comparison button 86 on the graph display screen 70 described above is selected and operated.
- the plot graph 171 is vertically reduced and displayed on the upper side of the graph display region 77, and a plot graph (not shown) in the same range as the plot graph 171 and the previous period is displayed in the graph display region 77. Display on the bottom.
- the CPU 11 is a diagram in which the same reference numerals are assigned to the corresponding parts in FIGS.
- a graph display screen 180 in which a bar graph 162 showing a standard deviation value for each hour in a bar shape is displayed between a plot graph 181 obtained by reducing the plot graph 171 in the vertical direction and the blood glucose level information table 152. Is displayed.
- the CPU 11 displays the graph display screen 90 when the comparison button 86 on the graph display screen 70 described above is selected and operated.
- the plot graph 181 and the bar graph 162 are vertically reduced and displayed on the upper side of the graph display area 77, and the plot graph and the bar graph (not shown) in the same range as the plot graph 181 and the bar graph 162 in the immediately preceding period are not shown.
- the CPU 11 assigns the same reference numerals to those corresponding to FIG. A graph display screen 190 as shown in FIG. 20 is displayed on the display unit 15.
- the CPU 11 displays the graph display screen 190 on the display unit 15, the period displayed in the start date display field 82B and the end date display field 82C corresponding to “one month” displayed by default in the range selection menu 82A.
- the blood glucose level is extracted from the blood glucose level beta base for each time zone based on the measurement date and time.
- the CPU 11 calculates the average value, the standard deviation value, the maximum value, the minimum value, the number of data, and the number of hypoglycemia for each extracted time zone segment.
- the CPU 11 displays an average graph 191 in which the calculated average value and standard deviation value for each time zone segment are indicated by a horizontal line and a vertical bar in the graph display area 77, and the average blood glucose level for each calculated time zone segment.
- the value, the standard deviation value, the maximum value, the minimum value, the number of data, and the number of hypoglycemia are displayed in the blood glucose level information table 192.
- the CPU 11 displays the graph display screen 90 when the comparison button 86 on the graph display screen 70 described above is selected and operated.
- the average graph 191 is reduced in the vertical direction on the upper side of the graph display area 77, and an average graph (not shown) in the previous period within the same range as the average graph 191 is displayed in the graph display area 77. Display on the bottom.
- the CPU 11 assigns the same reference numerals to the corresponding parts in FIG.
- a graph display screen 200 on which a bar graph 202 showing the standard deviation values for each time zone in a bar shape is displayed between the average graph 201 obtained by reducing the average graph 191 in the vertical direction and the blood glucose level information table 192.
- the CPU 11 displays the graph display screen 90 when the comparison button 86 on the graph display screen 70 described above is selected and operated.
- the average graph 201 and the bar graph 202 are vertically reduced and displayed on the upper side of the graph display area 77, and the average graph and the bar graph (not shown) in the same range as the average graph 201 and the bar graph 202 in the immediately preceding period are shown.
- the CPU 11 displays a plot graph 211 in which the extracted blood glucose level for one month is divided and plotted for each time zone in the graph display area 77 of the graph display screen 210.
- the plotted blood glucose level is plotted when the blood glucose level is 0 to 59 [mg / dl] and 126 [mg / dl] or more as shown in the legend display area 85.
- the doctor can easily visually check.
- the comparison button 86 on the graph display screen 210 is selected and operated through the operation unit 16
- the CPU 11 displays the graph display screen 90 when the comparison button 86 on the graph display screen 70 described above is selected and operated.
- the plot graph 211 is vertically reduced and displayed on the upper side of the graph display area 77, and a plot graph (not shown) in the same range as the plot graph 211 and in the immediately preceding period is displayed in the graph display area 77. Display on the bottom.
- the CPU 11 adds the same reference numerals to the corresponding parts in FIG. 21 and FIG.
- a graph display screen 220 in which a bar graph 202 showing a standard deviation value for each time zone section in a bar shape is displayed between a plot graph 221 obtained by reducing the plot graph 211 in the vertical direction and the blood glucose level information table 192. indicate.
- the CPU 11 displays the graph display screen 90 when the comparison button 86 on the graph display screen 70 described above is selected and operated.
- the plot graph 221 and the bar graph 202 are vertically reduced on the upper side of the graph display area 77, and the plot graph and bar graph (not shown) in the same range as the plot graph 221 and the bar graph 202 in the immediately preceding period are shown.
- a graph display screen 230 is displayed on the display unit 15.
- a pie chart button by time zone 76E, a stacked bar graph month button 76F and a stacked bar graph week button 76G are displayed in the graph type selection button display area 76, and the pie chart button by time zone 76E is selected and displayed as a default. Has been.
- the graph display screen 230 two pie graphs 231 and 232 are displayed side by side in the graph display area 77. Further, the range selection menu 82A is configured to select, for example, “1 month”, “2 months”, “3 months”, and “6 months”, and “1 month” is selected and displayed as a default.
- the CPU 11 displays the graph display screen 230 on the display unit 15, the time period segment (this period displayed in the start date display field 82 B and the end date display field 82 C and the time period classification check box 233 is checked) In this case, blood glucose levels of “before breakfast”, “before lunch”, “before dinner”, and “before bedtime”) are extracted from the blood glucose level beta base based on the measurement date and time zone classification.
- the CPU 11 calculates the average value, standard deviation value, maximum value, minimum value, and number of data of the extracted blood glucose levels, and the blood glucose level with respect to the data number of the extracted blood glucose levels is 0 to 59, 60 to 109, 110. Calculate the ratio of the number of data to be ⁇ 125 and 126 or more. Further, the CPU 11 displays the average value, standard deviation value, maximum value, minimum value, and number of data of the blood glucose level for each calculated time zone section in the blood glucose level information table 234, and shows the calculated blood glucose level ratio in the pie chart 231. Display as.
- the CPU 11 determines the time zone classification (in this case, “after breakfast”, “after lunch”, which is the period displayed in the start date display column 82B and the end date display column 82C and checked in the time zone category selection check box 235.
- the blood glucose level of “after dinner” and “late night”) is extracted from the blood glucose level beta base based on the measurement date and time zone classification.
- the CPU 11 calculates the average value, standard deviation value, maximum value, minimum value, and number of data of the extracted blood glucose levels, and the blood glucose level with respect to the data number of the extracted blood glucose levels is 0 to 59, 60 to 109, 110. Calculate the ratio of the number of data to be ⁇ 125 and 126 or more.
- the CPU 11 displays the average value, standard deviation value, maximum value, minimum value, and number of data of the blood glucose level for each calculated time zone section in the blood glucose level information table 236 and the calculated blood glucose level ratio in the pie chart 232. Display as. Incidentally, when the comparison button 85 on the graph display screen 230 is selected and operated through the operation unit 16, the CPU 11 displays the graph display screen 90 when the comparison button 86 on the graph display screen 70 described above is selected and operated. Similarly, the pie chart 231 and the pie chart 232 are reduced on the upper side of the graph display area 77, and the same range as the pie chart 231 and the pie chart 232 reduced on the lower side of the graph display area 77 A period pie chart (not shown) is displayed.
- the CPU 11 corresponds to FIG. A graph display screen 240 as shown in FIG.
- the CPU 11 is a period displayed in the start date display field 82 ⁇ / b> B and the end date display field 82 ⁇ / b> C and the time period class checked in the time period class selection check box 84 (this In this case, blood glucose levels of “before breakfast”, “after breakfast”, “after dinner”, and “late night”) are extracted from the blood glucose beta base based on the measurement date and time zone classification.
- the CPU 11 calculates the average value, standard deviation value, maximum value, minimum value, and number of data of the extracted blood sugar levels, respectively, and the blood sugar level relative to the number of monthly data of the extracted blood sugar levels is 0 to 59, 60 to The ratios of the data numbers 109, 110 to 125, and 126 or more are calculated. Then, the CPU 11 displays the average value, standard deviation value, maximum value, minimum value, and number of data of the calculated blood glucose level in the blood glucose level information display area 83, and displays the calculated ratio of the blood glucose level for each month as a bar graph 241. To do.
- the CPU 11 displays the graph display screen 90 when the comparison button 86 on the graph display screen 70 described above is selected and operated.
- the bar graph 241 is vertically reduced and displayed on the upper side of the graph display area 77, and a bar graph (not shown) in the same range as the bar graph 241 and the immediately preceding period is displayed on the lower side of the graph display area 77. indicate.
- the CPU 11 assigns the same reference numerals to the corresponding parts in FIG.
- the attached graph display screen 250 as shown in FIG. 26 is displayed on the display unit 15.
- the CPU 11 displays the graph display screen 250 on the display unit 15, the period displayed in the start date display column 82B and the end date display column 82C corresponding to “12 weeks” displayed by default in the range selection menu 82A.
- the time zone classification checked in the time zone category selection check box 84 (in this case, “before breakfast”, “after breakfast”, “after dinner”, and “late night”) Extract based on time zone classification.
- the CPU 11 calculates the average value, standard deviation value, maximum value, minimum value, and number of data of the extracted blood sugar levels, respectively, and the blood sugar level with respect to the number of weekly data of the extracted blood sugar level is 0 to 59, 60 to The ratios of the data numbers 109, 110 to 125, and 126 or more are calculated. Then, the CPU 11 displays the average value, standard deviation value, maximum value, minimum value, and number of data of the calculated blood glucose level in the blood glucose level information display area 83, and displays the calculated ratio of the blood glucose level for each week as a bar graph 251. To do.
- the CPU 11 displays the graph display screen 90 when the comparison button 86 on the graph display screen 70 described above is selected and operated.
- the bar graph 251 is reduced in the vertical direction above the graph display area 77, and a bar graph (not shown) in the same range as the bar graph 251 and the immediately preceding period is displayed below the graph display area 77. indicate.
- the CPU 11 attaches the same reference numerals to the corresponding parts in FIG. As shown in FIG.
- a graph display screen 260 is displayed on the display unit 15.
- the graph display screen 260 can display an arbitrary graph.
- a line graph 261 corresponding to the line graph 81 in FIG. 8 and an average graph 262 corresponding to the average graph 111 in FIG. 12 are displayed. Displayed in the graph display area 77.
- the CPU 11 attaches the same reference numerals to the corresponding parts in FIG. As shown in FIG.
- a blood glucose level list 271 in which the blood glucose levels recorded in the blood glucose level beta base are listed together with the measurement time is displayed on the blood glucose level note display screen 270. That is, in the blood sugar level list 271, blood sugar levels are arranged in a matrix with measurement times, with the vertical axis representing the date and the horizontal axis representing the time zone. In this blood glucose level list 271, when the blood glucose level is 0 to 59 [mg / dl] and when it is 126 [mg / dl] or more, the blood glucose level is highlighted. By the way, the blood glucose level is measured by the patient himself / herself before and after a meal, for example, at home or at the office by using the blood glucose level measuring device 5 (FIG. 1).
- a patient does not necessarily have a meal according to the set time zone division. Therefore, when the CPU 11 divides the blood glucose level into the corresponding time zone segments based on the measurement time of the measurement data measured by the blood glucose level measuring device 5, the CPU 11 divides the blood glucose level into a different time zone segment and generates a blood glucose level database. It is possible that Moreover, since the date and time are set by the patient at the time of initial setting, for example, the blood glucose level measuring device 5 may be set to an incorrect date and time. Therefore, in the blood sugar level information processing apparatus 2, the blood sugar level database generated by the CPU 11 can be corrected by the judgment of the doctor. Specifically, as shown in FIG. 29A in which the blood glucose level list portion 271A which is a part of FIG.
- the CPU 11 selects (clicks) any blood glucose level in the blood glucose level list 271 with the cursor Cu. ), The blood glucose level and the corresponding measurement time are surrounded by a selection frame FR, and a doctor is visually confirmed that an arbitrary blood glucose level has been selected.
- the CPU 11 recognizes that the blood sugar level enclosed by the selection frame FR is selected and is determined by double-clicking the mouse of the operation unit 16, for example, as shown in FIG.
- a value and measurement time are displayed in reverse video, and a time zone classification change pop-up menu 300 is displayed on the blood glucose level list 271 directly below the blood glucose level.
- the time zone classification change pop-up menu 300 includes a measurement date display field 301 that displays the measurement date of the determined blood sugar level, a measurement time display field 302 that displays the measurement time of the blood sugar level, and a blood glucose that displays the blood sugar level.
- a button 305, a delete button 306, a cancel button 307, and a confirm button 308 are provided.
- the CPU 11 recognizes that the left button 304 of the time zone division change pop-up menu 300 is selected via the cursor Cu as shown in FIG. 29C, the CPU 11 selects as shown in FIG. 29D.
- the displayed blood glucose level is moved to the left time zone, that is, the previous time zone.
- the CPU 11 allows the doctor to easily find the blood glucose level with the changed time zone segment by setting the blood glucose level to which the time zone segment has been moved in the selection state surrounded by the selection frame FR. .
- the CPU 11 recognizes that the right button 305 of the time zone change pop-up menu 300 is selected via the cursor Cu, the CPU 11 sets the selected blood glucose level to the right time zone, that is, the next time zone. Move to display.
- the CPU 11 recognizes that the confirmation button 308 has been selected via the cursor Cu after the measurement date display field 301 formed by the pull-down menu of the time zone classification change pop-up menu 300 has been changed via the operation unit 16.
- the selected blood glucose level is moved and displayed to the changed measurement date. Further, when the CPU 11 recognizes that the confirmation button 308 has been selected via the cursor Cu after the measurement time display field 302 of the time zone classification change pop-up menu 300 has been input, for example, via the keyboard of the operation unit 16. Then, based on the inputted measurement time, the time zone section is re-divided, and the blood glucose level is moved and displayed to the re-divided time zone section. In this way, in the blood glucose level information processing apparatus 2, the time zone classification, the measurement date, and the measurement time of the blood glucose level measured by the blood glucose level measuring device 5 are caused to perform a predetermined operation on the time zone classification change pop-up menu 300. Can be changed. When the save button 272 (FIG.
- the blood glucose level information processing apparatus 2 is changed to reflect the changed time zone classification, measurement date, and measurement time of the blood glucose level.
- the blood glucose level beta base is updated with the time zone classification, measurement date, and measurement time of the blood glucose level.
- the blood glucose level information processing apparatus 2 can easily change the blood glucose level to a suitable time zone, measurement date, and measurement time based on, for example, a doctor's judgment.
- the above-described various graph displays can be performed using the date and measurement time, and more appropriate judgment materials can be provided to the doctor.
- the blood glucose level information processing device 2 acquires measurement data including the blood glucose level measured by the blood glucose level measuring device 5 and the measurement date and time when the blood glucose level was measured via the external connection interface unit 17, Measurement data is stored in the hard disk drive 14 for each patient. Further, the blood glucose level information processing device 2 classifies the blood glucose level of the measurement data into one of a plurality of time zone categories based on the measurement date and time and the time zone classification table 60 (FIG. 7) when the blood glucose level was measured. A blood glucose level database in which the blood glucose level of the measurement data and the measurement date / time are associated with the classified time zone is generated.
- the blood glucose level information processing apparatus 2 changes to the blood glucose level beta base.
- a blood glucose level list 271 in which the recorded blood glucose levels are displayed together with the measurement time is displayed on the blood glucose level note display screen 270 (FIG. 28).
- the blood sugar level information processing apparatus 2 recognizes that any blood sugar level in the blood sugar level list 271 has been selected and determined, the blood sugar level is highlighted and the time zone classification change pop-up is displayed directly below the blood sugar level.
- the blood glucose level information processing apparatus 2 can easily change the blood glucose level to a time zone segment that is considered appropriate, for example, based on the judgment of a doctor. Therefore, the various graph displays described above using the changed time zone segment. Can be performed, and more appropriate judgment materials can be provided to the doctor.
- the blood glucose level information processing apparatus 2 does not change the measurement time of the blood glucose level when changing the time zone classification of any blood glucose level, for example, the graph display screen 150 using the blood glucose level for every hour. , 160, 170, and 180 (FIGS. 16 to 19), a graph that accurately reflects the measurement time can be displayed. Furthermore, the blood glucose level information processing apparatus 2 changes the measurement date and time of any blood glucose level according to the operation on the time zone change pop-up menu 300, so that the blood glucose level measuring device 5 is set to an incorrect time. Even if it is a case, the various graph display mentioned above can be performed using the changed measurement date and measurement time.
- the blood glucose level information processing apparatus 2 also provides a slide bar 88 below a line graph 81 in which, for example, a blood glucose level for one month is plotted in time series on the graph display screen 70, and the slide bar 88 moves in parallel. Then, only the blood glucose level for one month going back according to the amount of movement was plotted on the line graph 81 along the time series. Therefore, the blood glucose level information processing apparatus 2 plots the blood glucose level on the line graph 81 by changing only the period according to the movement amount of the slide bar 88 without changing the range of the blood glucose level plotted on the line graph 81. The period of blood sugar level can be easily changed.
- the blood glucose level information processing apparatus 2 changes the blood glucose level period to be plotted at any time according to the movement of the slide bar 88 simply by moving the slide bar 88 in parallel. Visual confirmation can be made more continuously and in the long term.
- the blood glucose level information processing apparatus 2 averages, standard deviation value, maximum value, minimum value, and number of data of blood glucose values plotted on a line graph 81 traced back according to the amount of movement. Are calculated again, and the average value, standard deviation value, maximum value, minimum value, and number of data are respectively calculated in the average value display field 83A, the standard deviation value display field 83B, the maximum value display field 83C, and the minimum value in the blood glucose level information display area 83.
- the value is displayed in the value display field 83D and the measurement number display field 83E.
- the blood glucose level information processing apparatus 2 displays the average value, the standard deviation value, the maximum value, the minimum value, and the number of data of only the blood glucose level currently plotted in the line graph 81 according to the movement of the slide bar 88. be able to.
- the blood glucose level information processing apparatus 2 displays the line graph 81 on the upper side of the graph display area 77 in a reduced size in the vertical direction and is the same as the line graph 81.
- the line graph 92 of the range and immediately before is displayed below the graph display area 77.
- the blood glucose level information processing apparatus 2 can provide, for example, a line graph including two consecutive periods within the same range by simply causing the doctor to perform an easy operation of selecting the comparison button 86. Moreover, the blood glucose level information processing apparatus 2 can compare the transition of the blood glucose level in two consecutive periods by displaying, for example, a line graph including two consecutive periods in the same range. According to the above configuration, the blood glucose level information processing device 2 acquires the blood glucose level measured by the blood glucose level measuring device 5 and the measurement date / time when the blood glucose level was measured, and based on the measurement date / time, a plurality of blood glucose levels are obtained.
- the time zone classification change pop-up menu 300 is displayed and the left button When 304 or the right button 305 is selected, by moving the selected blood glucose level to the previous or next time zone, the blood glucose level of the more accurate time zone and Blood glucose level information can be provided. Further, the blood glucose level information processing apparatus 2 acquires the blood glucose level measured by the blood glucose level measuring device 5 and the measurement date and time when the blood glucose level was measured, and for example, displays the blood glucose level for one month on the graph display screen 70, for example. A slide bar 88 is provided below the line graph 81 plotted along the series.
- the blood glucose level information processing device 2 and the blood glucose level measuring device 5 are described as being wirelessly connected via the communication module 6 and the optical communication unit. However, the blood glucose level information processing device 2 and the blood glucose level measuring device 5 may be connected by wireless communication, or may be connected by wire via a predetermined cable or the like.
- the present invention is not limited to this.
- a plurality of blood glucose level information processing devices 2 connected via an intranet or the like may store and manage measurement data supplied by the blood glucose level measuring device 5, or a plurality of blood glucose level information processing units.
- One of the devices 2 stores and manages measurement data as a master, and the remaining blood glucose level information processing device 2 accesses the blood glucose level information processing device 2 as a master to temporarily use the measurement data.
- the case where the measurement data supplied by the blood glucose level measuring device 5 is stored in the folder for each patient has been described.
- the present invention is not limited to this, for example, a plurality of blood glucose levels.
- the measurement data may be stored for each identification number of the blood glucose level measuring device 5.
- the blood glucose level information processing apparatus 2 associates the identification number of the blood glucose level measuring device 5 and the patient name in advance, when the patient name is selected on the patient search screen 40 (FIG. 6),
- the blood glucose level information processing described above can be executed by reading the measurement data from the folder of the identification number associated with the patient name.
- the CPU 11 performs the above-described blood glucose level information processing according to the blood glucose level information processing program stored in the hard disk drive 14 in advance has been described.
- the blood sugar level information processing program installed from the storage medium, the blood sugar level information processing program downloaded from the Internet, and the blood sugar level information processing program installed by various other routes may be used. good. Further, in the above-described embodiment, the case where the information processing apparatus 2 as the blood glucose level information processing apparatus of the present invention is configured by the external connection interface unit 17 as the acquisition unit and the CPU 11 as the display control unit has been described. The present invention is not limited to this, and the blood glucose level information processing apparatus may be configured by an acquisition unit and a display control unit having various configurations.
- the blood glucose level information processing apparatus as the blood glucose level information processing apparatus of the present invention includes the external connection interface unit 17 as the acquisition unit, the CPU 11 as the sorting unit, the CPU 11 as the display control unit, and the CPU 11 as the changing unit.
- the case where 2 is configured has been described.
- the present invention is not limited to this, and the blood glucose level information processing apparatus may be configured by an acquisition unit, a sorting unit, a display control unit, and a changing unit having various configurations.
- the blood glucose level information processing apparatus of the present invention can be applied to various other electronic devices such as a PDA (Personal Digital Assistant) and a mobile phone in addition to a personal computer, for example.
- PDA Personal Digital Assistant
- mobile phone in addition to a personal computer, for example.
- SYMBOLS 1 Blood glucose level information processing system, 2 ... Blood glucose level information processing apparatus, 3 ... Printer, 4 ... Blood glucose level measuring unit, 5 ... Blood glucose level measuring device, 6 ... Communication module, 11 ... CPU, DESCRIPTION OF SYMBOLS 12 ... ROM, 13 ... RAM, 14 ... Hard disk drive, 15 ... Display part, 16 ... Operation part, 17 ... External connection interface part, 18 ... Timepiece part, 60 ... Time zone division table, 70 ... ... Graph display screen, 86 ... Comparison button, 88 ... Slide bar, 300 ... Time zone change pop-up menu, 304 ... Left button, 305 ... Right button
Abstract
The blood sugar level of a subject and information about the blood sugar level during the period or in the range desired by the user are easily provided without requiring the user making troublesome operations.
A blood sugar level measured by a blood sugar measuring device (5) and the measurement date/time when the blood sugar level is measured are obtained. For example, a line graph (81) on which blood sugar levels during a predetermined period are plotted in time series and a slide bar (88) are displayed on a graph display screen (70). When the slide bar (88) is moved horizontally, only the blood sugar levels corresponding to the period earlier by the time corresponding to the amount of movement are plotted in time series on the line graph (81). Thus, the blood sugar level and information about the blood sugar level during the period or in the range desired by the user are easily provided without requiring the user making troublesome operations.
Description
本発明は、血糖値情報処理装置、血糖値情報処理方法及び血糖値情報処理プログラムに関し、例えば外部の血糖値測定器で定期的に測定された血糖値の推移をグラフ化して提供する場合に適用して好適なものである。
The present invention relates to a blood glucose level information processing apparatus, a blood glucose level information processing method, and a blood glucose level information processing program, and is applied to, for example, a case where a transition of a blood glucose level periodically measured by an external blood glucose level measuring device is provided as a graph. Therefore, it is suitable.
現在、糖尿病患者は全国で約600万人ともいわれ、その内、通院患者は約200万人であり、残りは潜在患者であると報告されている。このような糖尿病患者に対する療法としては、食事療法、運動療法、薬物療法、インスリン療法等があり、どの療法が施される場合においても、患者ごとの日々の血糖値管理が極めて重要である。
しかしながら患者は、血糖値測定器を使用して自身の血糖値を定期的に測定している場合であっても、血糖値の時間的な推移や、血糖値の最大値、最小値、平均値等の血糖値情報を把握するのは容易ではない。特に多くの患者は、測定された血糖値の変化に一喜一憂するのみで、それが自分の生活習慣、食事量や時間帯等とどのように関連しているかを正確に理解できているとは限らない。
また、糖尿病専門の医師が全国に約1万人いるのに対し、糖尿病患者は上述したように約600万人であり、一人の医者が600人の患者を診なければならず、更に今後、糖尿病患者が増える傾向であることを考えると、患者自身が定期的に測定している血糖値を容易に管理し、またその血糖値の時間的な推移や血糖値情報を医師が容易に扱え、かつ適切に診断できるような血糖値情報処理装置が望まれている。
このような血糖値情報処理装置のなかには、血糖値測定器により測定された血糖値と当該血糖値が測定された測定日時とを取得し、当該測定日時に基づいて「朝食前」、「朝食後」、「昼食前」、「昼食後」、「夕食前」、「夕食後」、「就寝前」及び「深夜」等の時間帯区分のいずれかに当該血糖値を区分するようになされたものがある(例えば、特許文献1参照)。
これにより、この血糖値情報処理装置は、血糖値及び当該血糖値に基づく血糖値情報を時間帯区分ごとに統計的に医師等に提供することができると共に、血糖値及び当該血糖値に基づく血糖値情報を測定日時に基づく時系列に沿ってグラフ表示することにより、その傾向を容易に把握させることができる。 Currently, it is said that there are about 6 million diabetic patients nationwide, of which about 2 million outpatients are reported and the rest are potential patients. As a therapy for such a diabetic patient, there are diet therapy, exercise therapy, drug therapy, insulin therapy, and the like. Regardless of which therapy is performed, daily blood glucose level management for each patient is extremely important.
However, even if the patient regularly measures his / her blood glucose level using a blood glucose meter, the blood glucose level changes over time and the maximum / minimum / average blood glucose level It is not easy to grasp blood glucose level information such as. Many patients, in particular, are only glad about changes in measured blood glucose levels, and may not be able to accurately understand how they relate to their lifestyle, diet, time of day, etc. Absent.
In addition, there are about 10,000 doctors specializing in diabetes nationwide, whereas there are about 6 million diabetic patients as described above, and one doctor must examine 600 patients. Considering that the number of diabetic patients tends to increase, it is easy to manage the blood glucose level that the patient regularly measures, and the doctor can easily handle the temporal transition of the blood glucose level and blood glucose level information, In addition, a blood glucose level information processing apparatus that can be appropriately diagnosed is desired.
In such a blood glucose level information processing apparatus, a blood glucose level measured by a blood glucose level measuring instrument and a measurement date / time when the blood glucose level was measured are acquired, and based on the measurement date / time, “before breakfast”, “after breakfast” ”,“ Before lunch ”,“ after lunch ”,“ before dinner ”,“ after dinner ”,“ before going to bed ”,“ late night ”, etc. (For example, refer to Patent Document 1).
Thus, the blood glucose level information processing apparatus can statistically provide the blood glucose level and blood glucose level information based on the blood glucose level to a doctor or the like for each time zone, and the blood glucose level and blood glucose level based on the blood glucose level. By displaying the value information in a graph along the time series based on the measurement date and time, the tendency can be easily grasped.
従来の血糖値情報処理装置においては、血糖値及び血糖値情報を測定日時に基づく時系列に沿ってグラフ表示する際、その時間軸を容易に変更させることができず、かくしてユーザが所望する期間又は範囲の血糖値及び血糖値情報を容易に提供する際に煩雑な操作を強いるという問題があった。
かかる課題を解決するため本発明においては、外部の血糖値測定装置により測定された単数又は複数の血糖値及び当該単数又は複数の血糖値が測定された測定日時を取得し、所定の期間に対応する血糖値を上記測定日時に基づいて時系列に沿ってプロットさせた血糖値グラフ、及び時系列に沿って平行移動するスライドバーを表示部に対して表示させ、スライドバーが平行移動されると、期間の範囲を固定させたまま、当該スライドバーの移動量に応じた先の期間に対応した血糖値の血糖値グラフを表示させるようにした。
本発明によれば、スライドバーを移動させるだけで当該スライドバーの移動量に応じた先の期間に対応する血糖値がプロットされた血糖値グラフを表示することができ、かくしてユーザに対して煩雑な操作を強いることなく、ユーザが所望する期間又は範囲の血糖値及び血糖値情報を容易に提供することができる。
また従来の血糖値情報処理装置においては、いずれかの時間帯区分に血糖値を区分する際、測定日時に基づいて区分するので、実際の食事時間が設定された時間と異なる場合、その血糖値を適切に区分することができず、従って時間帯区分ごとの正確な血糖値及び血糖値情報を提供することができないという問題があった。
かかる課題を解決するため本発明においては、外部の血糖値測定装置により測定された単数又は複数の血糖値及び当該単数又は複数の血糖値が測定された測定日時を取得し、血糖値を測定日時に基づいて所定時間帯幅を持つ複数の時間帯区分に区分し、測定日時に基づく測定日付と複数の時間帯区分とを軸として血糖値を一覧表示し、そのなかから特定の血糖値が選択されると、当該特定の血糖値の時間帯区分を前後に移動させるための前ボタン及び後ボタンが設けられたポップアップメニューを表示部に対して表示させ、前ボタンが選択されると、特定の血糖値を隣接する前の時間帯区分に変更し、後ボタンが選択されると、特定の血糖値を隣接する後の時間帯区分に変更するようにした。
本発明によれば、一覧表示した血糖値の中から任意の血糖値を選択させるとポップアップメニューを表示し、当該ポップアップメニューの前ボタン又は後ボタンを選択させるだけで任意の血糖値の時間帯区分を変更することができ、かくして従来と比してより正確な血糖値及び血糖値情報を提供することができる。 In the conventional blood glucose level information processing apparatus, when displaying the blood glucose level and blood glucose level information in a graph along the time series based on the measurement date and time, the time axis cannot be easily changed, and thus the period desired by the user Alternatively, there is a problem in that a complicated operation is forced when the blood glucose level and blood glucose level information of the range are easily provided.
In order to solve such a problem, in the present invention, one or a plurality of blood glucose levels measured by an external blood glucose level measuring device and a measurement date and time when the one or more blood glucose levels are measured are acquired and corresponded to a predetermined period. A blood glucose level graph in which blood glucose levels are plotted along the time series based on the measurement date and time, and a slide bar that translates along the time series is displayed on the display unit, and the slide bar is translated The blood glucose level graph corresponding to the previous period corresponding to the amount of movement of the slide bar is displayed with the period range fixed.
According to the present invention, it is possible to display a blood glucose level graph in which the blood glucose level corresponding to the previous period corresponding to the amount of movement of the slide bar can be displayed only by moving the slide bar, and thus complicated for the user. The blood glucose level and blood glucose level information in a period or range desired by the user can be easily provided without forcing a simple operation.
Further, in the conventional blood glucose level information processing apparatus, when the blood glucose level is classified into any time zone, the blood glucose level is classified based on the measurement date and time. Therefore, there is a problem that accurate blood glucose level and blood glucose level information for each time zone cannot be provided.
In order to solve such a problem, in the present invention, one or more blood glucose levels measured by an external blood glucose level measuring device and the measurement date and time when the one or more blood glucose levels are measured are acquired, and the blood glucose level is measured. The blood glucose level is displayed in a list based on the measurement date based on the measurement date and time zone and the multiple time zone segments, and a specific blood glucose level is selected from the list. Then, a pop-up menu provided with a front button and a rear button for moving the specific blood glucose level time zone forward and backward is displayed on the display unit, and when the front button is selected, The blood glucose level is changed to the adjacent time zone classification, and when the rear button is selected, the specific blood glucose level is changed to the adjacent later time zone classification.
According to the present invention, when an arbitrary blood glucose level is selected from the displayed blood glucose levels, a pop-up menu is displayed, and a time zone classification of an arbitrary blood glucose level is performed simply by selecting the front button or the rear button of the pop-up menu Thus, more accurate blood sugar level and blood sugar level information can be provided as compared with the conventional art.
図1は、血糖値情報処理システムの構成を示す略線図である。
図2は、血糖値情報処理装置の回路構成を示す略線図である。
図3は、スタート画面の構成を示す略線図である。
図4は、ログイン画面の構成を示す略線図である。
図5は、患者検索画面の構成(1)を示す略線図である。
図6は、患者検索画面の構成(2)を示す略線図である。
図7は、時間帯区分テーブルの構成を示す略線図である。
図8は、全時間の折れ線グラフを表示したグラフ表示画面の構成(1)を示す略線図である。
図9は、全時間の折れ線グラフを表示したグラフ表示画面の構成(2)を示す略線図である。
図10は、比較ボタンが選択された場合における全時間の折れ線グラフを表示したグラフ表示画面の構成を示す略線図である。
図11は、時間帯別の折れ線グラフを表示したグラフ表示画面の構成を示す略線図である。
図12は、月平均の平均グラフを表示したグラフ表示画面の構成を示す略線図である。
図13は、月平均の平均グラフ及び標準偏差折れ線グラフを表示したグラフ表示画面の構成を示す略線図である。
図14は、週平均の平均グラフを表示したグラフ表示画面の構成を示す略線図である。
図15は、週平均の平均グラフ及び標準偏差折れ線グラフを表示したグラフ表示画面の構成を示す略線図である。
図16は、1時間ごとの平均グラフを表示したグラフ表示画面の構成を示す略線図である。
図17は、1時間ごとの平均グラフ及び標準偏差折れ線グラフを表示したグラフ表示画面の構成を示す略線図である。
図18は、1時間ごとのプロットグラフを表示したグラフ表示画面の構成を示す略線図である。
図19は、1時間ごとのプロットグラフ及び標準偏差折れ線グラフを表示したグラフ表示画面の構成を示す略線図である。
図20は、時間帯区分ごとの平均グラフを表示したグラフ表示画面の構成を示す略線図である。
図21は、時間帯区分ごとの平均グラフ及び標準偏差折れ線グラフを表示したグラフ表示画面の構成を示す略線図である。
図22は、時間帯区分ごとのプロットグラフを表示したグラフ表示画面の構成を示す略線図である。
図23は、時間帯区分ごとのプロットグラフ及び標準偏差折れ線グラフを表示したグラフ表示画面の構成を示す略線図である。
図24は、円グラフを表示したグラフ表示画面の構成を示す略線図である。
図25は、月ごとの積上げ棒グラフを表示したグラフ表示画面の構成を示す略線図である。
図26は、週ごとの積上げ棒グラフを表示したグラフ表示画面の構成を示す略線図である。
図27は、Myグラフボタンが選択された場合のグラフ表示画面の構成を示す略線図である。
図28は、血糖値ノート表示画面の構成を示す略線図である。
図29は、時間帯区分の変更の様子を示す略線図である。 FIG. 1 is a schematic diagram illustrating a configuration of a blood glucose level information processing system.
FIG. 2 is a schematic diagram illustrating a circuit configuration of the blood glucose level information processing apparatus.
FIG. 3 is a schematic diagram showing the configuration of the start screen.
FIG. 4 is a schematic diagram illustrating the configuration of the login screen.
FIG. 5 is a schematic diagram showing the configuration (1) of the patient search screen.
FIG. 6 is a schematic diagram illustrating the configuration (2) of the patient search screen.
FIG. 7 is a schematic diagram showing the configuration of the time zone division table.
FIG. 8 is a schematic diagram showing a configuration (1) of a graph display screen displaying a line graph of all time.
FIG. 9 is a schematic diagram showing a configuration (2) of the graph display screen displaying a line graph of all time.
FIG. 10 is a schematic diagram illustrating a configuration of a graph display screen displaying a line graph of all time when the comparison button is selected.
FIG. 11 is a schematic diagram showing a configuration of a graph display screen displaying a line graph for each time zone.
FIG. 12 is a schematic diagram illustrating a configuration of a graph display screen displaying an average graph of monthly averages.
FIG. 13 is a schematic diagram illustrating a configuration of a graph display screen displaying a monthly average average graph and a standard deviation line graph.
FIG. 14 is a schematic diagram illustrating a configuration of a graph display screen displaying an average graph of weekly averages.
FIG. 15 is a schematic diagram illustrating a configuration of a graph display screen displaying a weekly averaged average graph and a standard deviation line graph.
FIG. 16 is a schematic diagram illustrating a configuration of a graph display screen that displays an average graph for each hour.
FIG. 17 is a schematic diagram illustrating a configuration of a graph display screen displaying an average graph and a standard deviation line graph for each hour.
FIG. 18 is a schematic diagram illustrating a configuration of a graph display screen displaying a plot graph every hour.
FIG. 19 is a schematic diagram illustrating a configuration of a graph display screen displaying a plot graph and a standard deviation line graph for each hour.
FIG. 20 is a schematic diagram illustrating a configuration of a graph display screen that displays an average graph for each time zone section.
FIG. 21 is a schematic diagram illustrating a configuration of a graph display screen displaying an average graph and a standard deviation line graph for each time zone.
FIG. 22 is a schematic diagram illustrating a configuration of a graph display screen displaying a plot graph for each time zone section.
FIG. 23 is a schematic diagram illustrating a configuration of a graph display screen displaying a plot graph and a standard deviation line graph for each time zone.
FIG. 24 is a schematic diagram illustrating a configuration of a graph display screen displaying a pie chart.
FIG. 25 is a schematic diagram illustrating a configuration of a graph display screen displaying a stacked bar graph for each month.
FIG. 26 is a schematic diagram illustrating a configuration of a graph display screen displaying a stacked bar graph for each week.
FIG. 27 is a schematic diagram illustrating a configuration of a graph display screen when the My graph button is selected.
FIG. 28 is a schematic diagram illustrating a configuration of a blood sugar level note display screen.
FIG. 29 is a schematic diagram showing a state of changing the time zone division.
以下に、図面について、本発明の一実施の形態を詳述する。
(1)血糖値情報処理システムの構成
図1に示すように、1は全体として本発明の一実施の形態としての血糖値情報処理システムを示し、血糖値情報処理装置2、プリンタ3、及び血糖値測定ユニット4が設けられている。
血糖値情報処理装置2は、例えばパーソナルコンピュータでなり、例えばUSB(Universal Serial Bus)ケーブルを介してプリンタ3と接続され、またRS232Cケーブルにより接続された光通信モジュール(図示せず)を介して血糖値測定ユニット4と光通信し得るようになされている。
血糖値測定ユニット4は、患者により血糖値を測定させる血糖値測定器5と、血糖値情報処理装置2及びプリンタ3と通信する通信モジュール6とが設けられている。
血糖値測定器5は、その先端に設けられた取り替え式の測定用チップ7により患者の血液を採取し、当該採取した血液と測定用チップ7に封入された試薬とを反応させ、その反応させた血液の色を光学的に読み取ることにより血液に含まれるグルコース濃度を測定し、その結果として血糖値を得る。
また血糖値測定器5は、その内部に時計機能を有し、例えば初期設定時にユーザにより入力された日付及び時刻を基に時間をカウントするようになされており、測定した血糖値を測定日時と共に測定データとして自身の内部に設けられた例えば不揮発性メモリに記憶する。
ここで血糖値は、食事の前後、時間帯及び生活習慣などにより変化するので、その変化を把握するために、患者は、例えば朝食前、朝食後、昼食前、昼食後、夕食前、夕食後、就寝前及び深夜と1日に複数回の血糖値測定を血糖値測定器5を用いて行う。
そこで血糖値測定器5は、例えば150件分の測定データを記憶し得るようになされているため、例えば患者が1日4回測定する場合、約36日分の測定データを記憶し得るようになされている。
ところで血糖値測定器5は、通信モジュール6の光通信送受信部9Aと対向する位置に光通信送受信部(図示せず)が設けられており、当該通信モジュール6と光通信し得るようになされている。
通信モジュール6は、血糖値測定器5が載置された状態で、光通信ボタン8Aがユーザによって押下操作されると、血糖値測定器5のメモリに記憶された測定データを光通信送受信部を介して当該血糖値測定器5に送信させ、光通信送受信部9Aを介して測定データを光通信により受信するようになされている。
そして通信モジュール6は、血糖値測定器5から受信した測定データを光通信送受信部9Bを介して血糖値情報処理装置2へ送信する。
また通信モジュール6は、血糖値測定器5が載置された状態で、印刷ボタン8Bがユーザによって押下操作されると、光通信ボタン8Aが押下操作された場合と同様に、血糖値測定器5から測定データを受信する。
そして通信モジュール6は、所定のケーブル(図示せず)を介して接続されたプリンタ3に測定データを送信することにより、プリンタ3によって測定データの血糖値及び測定日時をその測定日時が古い順に印刷し得るようになされている。
(2)血糖値情報処理装置の回路構成
血糖値情報処理装置2は、図2に示すように、CPU(Central Processing Unit)11、ROM(Read Only Memory)12、RAM(Random Access Memory)13、ハードディスクドライブ14、LCD(Liquid Crystal Display)等でなる表示部15、マウス及びキーボード等でなる操作部16、外部接続インターフェース部17及び時間をカウントする時計部18がバス19を介して接続されている。
この血糖値情報処理装置2は、CPU11がROM12に格納された基本プログラムを読み出してRAM13に展開し、当該基本プログラムに従って全体を統括制御すると共に、ROM12又はハードディスクドライブ14に格納された各種アプリケーションプログラムをRAM13に展開し、当該各種アプリケーションプログラムに従って各種処理を実行するようになされている。
血糖値情報処理装置2は、外部接続インターフェース部17に接続されたRS232Cケーブルを介して光通信モジュール(図示せず)と接続され、また当該外部接続インターフェース部17に接続されたUSBケーブルを介してプリンタ3(図1)と接続されている。
従って血糖値情報処理装置2は、通信モジュール6の光通信ボタン8Aがユーザによって押下操作され、血糖値測定器5から測定データが通信モジュール6を介して送信されると、外部接続インターフェース部17を介して受信し、ハードディスクドライブ14に保存するようになされている。
このとき血糖値情報処理装置2は、多数の血糖値測定器5から測定データを受信することが想定されているため、例えばハードディスクドライブ14に設けられた患者名にそれぞれ対応付けられたフォルダに測定データを記憶するようになされている。
(3)血糖値情報処理
CPU11は、ユーザ(この場合、例えば医師)の操作部16に対する操作に応じて、血糖値情報処理プログラムが選択されると、当該血糖値情報処理プログラムをハードディスクドライブ14から読み出してRAM13に展開し、血糖値情報処理プログラムに従って血糖値情報処理を実行する。
CPU11は、血糖値情報処理を実行すると、図3に示すように、スタート画面20を表示部15に表示する。スタート画面20は、例えば2種類の異なるタイプの血糖値測定器5から測定データを送信させる送信方法を案内する血糖値測定器送信案内イラスト21及び22と、医師にログインさせるログインボタン23とが表示されている。
CPU11は、医師の操作部16に対する操作によりスタート画面20のログインボタン23が例えばカーソル(図示せず)によって選択されると、図4に示すように、医師に対してログインを要求するログイン画面30を表示部15に表示する。このログイン画面30は、利用者名及びパスワードを入力させる利用者名入力欄31及びパスワード入力欄32と、ログインを行わせるログインボタン33と、ログインを中止させるキャンセルボタン34とが表示されている。
CPU11は、医師の操作部16に対する操作によりログイン画面30の利用者名入力欄31及びパスワード入力欄32に利用者名及びパスワードが入力されてログインボタン33が選択されると、予め登録された利用者名及びパスワードと一致するか否かを判断し、一致した場合、図5に示すように、患者検索画面40を表示部15に表示する。
患者検索画面40は、例えばハードディスクドライブ14に予め登録された患者データベースから特定の患者を検索させるモード(以下、これを検索モードと呼ぶ)を選択させる患者検索ボタン41と、患者データベースに新規の患者を登録させるモード(以下、これを登録モードと呼ぶ)を選択させる患者登録ボタン42と、モード別表示領域43とが設けられている。この患者データベースには、患者の氏名、カナ、性別及び患者ID等がそれぞれ関連付けられて登録されている。
CPU11は、患者検索画面40を表示部15に表示する際、デフォルトとして患者検索ボタン41が選択されており、患者氏名及び患者IDを入力させる患者氏名入力欄44及び患者ID入力欄45と、検索を実行する検索ボタン46と、検索結果をリスト表示する患者リスト表示欄47と、印刷ボタン48と、グラフ表示ボタン49とをモード別表示領域43に表示する。
そしてCPU11は、医師の操作部16に対する操作により患者氏名入力欄44及び患者ID入力欄45に患者氏名及び患者IDの少なくとも一方が入力されて検索ボタン46が選択される。
このときCPU11は、ハードディスクドライブ14に保存された患者データベースから患者氏名入力欄44及び患者ID入力欄45に入力された患者氏名及び患者IDを検索し、一致した患者氏名又は患者IDを検出した場合、図6に示すように、患者データベースから一致した患者の氏名、カナ、性別及び患者IDを読み出して患者項目47aとして患者リスト表示欄47に表示する。
CPU11は、患者リスト表示欄47に患者項目47aを表示している状態で、印刷ボタン48が医師の操作部16に対する操作に応じて選択されると、当該患者リスト表示欄47を外部接続インターフェース部17を介してプリンタ3(図1)に印刷させるようになされている。
因みにCPU11は、患者検索画面40の患者登録ボタン42が操作部16を介して選択されると、登録モードを実行し、患者を新規に登録させ得るようになされている。
ところでCPU11は、患者リスト表示欄47の患者項目47aが操作部16を介して選択された後、グラフ表示ボタン49が選択されると、選択された患者項目47aの患者名に対応するフォルダに記憶された測定データをハードディスクドライブ14から読み出す。
そしてCPU11は、読み出した測定データの血糖値を、当該血糖値の測定日時と図7に示すような時間帯区分テーブル60とを比較することにより、時間帯区分テーブル60における時間帯区分のいずれかに区分する。
ここで時間帯区分テーブル60では、例えば時間帯区分が「朝食前」、「朝食後」、「昼食前」、「昼食後」、「夕食前」、「夕食後」、「就寝前」及び「深夜」の8つに区分されている。
また時間帯区分テーブル60は、設定入力時刻を操作部16を介して入力させておくことにより、時間帯区分「朝食前」が測定時刻「03:00~07:00」に対応し、時間帯区分「朝食後」が測定時刻「7:00~10:00」に対応し、時間帯区分「昼食前」が測定時刻「10:00~12:00」に対応し、時間帯区分「昼食後」が測定時刻「12:00~15:00」に対応し、時間帯区分「夕食前」が測定時刻「15:00~18:00」に対応し、時間帯区分「夕食後」が測定時刻「18:00~21:00」に対応し、時間帯区分「就寝前」が測定時刻「21:00~24:00」に対応し、時間帯区分「深夜」が測定時刻「24:00~03:00」に対応する。
従ってCPU11は、ハードディスクドライブ14から読み出した測定データの測定日時に基づく測定時刻が例えば「06:30」であった場合には当該測定データの血糖値を時間帯区分「朝食前」に区分し、測定データの測定時刻が例えば「14:20」であった場合には当該測定データの血糖値を時間帯区分「昼食後」に区分するようになされている。
このようにしてCPU11は、患者項目47aの患者名に対応するフォルダに記憶された測定データをハードディスクドライブ14から読み出すと、読み出した全ての測定データの血糖値をいずれかの時間帯区分に区分する。
そしてCPU11は、測定データの血糖値及び測定日時と区分した時間帯区分とを関連付けた血糖値データベースを生成し、当該血糖値データベースを例えばハードディスクドライブ14の患者名に対応するフォルダに記憶した後、図8に示すようなグラフ表示画面70を表示部15に表示する。
このグラフ表示画面70は、実行できるメニュー項目が表示されたメニューバー71、患者情報等を表示する患者情報欄72、スタンバイモードに移行するスタンバイボタン73、ログオフするためのログオフボタン74、グラフの種類を選択する複数のボタンを表示するグラフ種類選択ボタン表示領域75、グラフタイプ選択ボタン表示領域76、及びグラフを表示するグラフ表示領域77とが設けられている。
患者情報欄72には、選択されている患者の氏名及び患者IDが患者氏名表示欄72A及び患者ID表示欄72Bにそれぞれ表示され、当該患者ID表示欄72Bの右側に患者詳細ボタン72C、新規ボタン72D及び検索ボタン72Eが設けられている。
CPU11は、患者情報欄72の患者詳細ボタン72Cが操作部16を介して選択されると、患者の詳細情報を表示する。
またCPU11は、患者情報欄72の新規ボタン72Dが操作部16を介して選択されると、新規の患者を登録させ得るようになされている。
さらにCPU11は、患者情報欄72の患者検索ボタン72Eが操作部16を介して選択されると、患者検索画面(図5)を表示し、再び患者を検索させ得るようになされている。
グラフ種類選択ボタン表示領域75には、トレンドボタン75A、期間平均ボタン75B、24hトレンドボタン75C、割合ボタン75D、Myグラフボタン75E及び血糖値ノートボタン75Fが設けられ、いずれか1つが選択されるようになされており、デフォルトではトレンドボタン75Aが選択されている。
グラフタイプ選択ボタン表示領域76には、グラフ種類選択ボタン表示領域75のトレンドボタン75A、期間平均ボタン75B、24hトレンドボタン75C、割合ボタン75D及びMyグラフボタン75Eにそれぞれ対応するグラフタイプを選択させるためのボタンが複数個表示されるようになされており、トレンドボタン75Aが選択されている場合には全時間ボタン76A及び時間帯別ボタン76Bが表示される。因みにデフォルトでは全時間ボタン76Aが選択されている。
グラフ表示領域77には、グラフ種類選択ボタン表示領域75で選択されたボタン(トレンドボタン75A、期間平均ボタン75B、24hトレンドボタン75C、割合ボタン75D、Myグラフボタン75E及び血糖値ノートボタン75Fのいずれか)、及びグラフタイプ選択ボタン表示領域76で選択されたボタン(この場合、全時間ボタン76A又は時間帯別ボタン76B)に対応したグラフ及びそのグラフに関連した各種情報等が表示されるようになされている。
このグラフ表示領域77には、トレンドボタン75A及び全時間ボタン76Aが選択されているとき、折れ線グラフ81が表示されると共に、期間情報表示領域82、血糖値情報表示領域83、時間帯区分選択チェックボックス84、凡例表示領域85、比較ボタン86及び印刷ボタン87が設けられている。
ここで時間帯区分選択チェックボックス84では、「朝前」が時間帯区分「朝食前」に対応し、「朝後」が時間帯区分「朝食後」に対応し、「昼前」が時間帯区分「昼食前」に対応し、「昼後」が時間帯区分「昼食後」に対応し、「夜前」が時間帯区分「夕食前」に対応し、「夜後」が時間帯区分「夕食後」に対応し、「寝前」が時間帯区分「就寝前」に対応し、「深夜」が時間帯区分「深夜」に対応する。
CPU11は、時計部18から取得した現在の日付を基準として、期間情報表示領域82の範囲選択メニュー82Aに表示された「1ヶ月」の範囲に対応する日付を開始日付表示欄82B及び終了日付表示欄82Cに表示する。この範囲選択メニュー82Aは、範囲を医師に選択させ得るようにプルダウンメニューでなり、例えば「1ヶ月」、「2ヶ月」、「3ヶ月」及び「6ヶ月」を選択させ得るようになされており、デフォルトとして「1ヶ月」を選択表示している。
これと共にCPU11は、ハードディスクドライブ14から患者氏名表示欄72Aに表示された患者氏名に対応する血糖値データベースを読み出し、測定日時に基づいて開始日付表示欄82B及び終了日付表示欄82Cに表示された開始日付から終了日付までの範囲で、かつ時間帯区分選択チェックボックス84にチェックされた時間帯区分(この場合、「朝食前」、「朝食後」、[夕食後]及び「深夜」)の血糖値だけを血糖値データベースから抽出する。
そしてCPU11は、抽出した血糖値を時系列に沿って時間帯区分ごとのシンボルでプロットし、互いに前後するシンボル同士を直線で結ぶようにして折れ線グラフ81を生成する。
ここで折れ線グラフ81は、横軸が日付とされ、縦軸が血糖値(mg/dl)とされる。また折れ線グラフ81は、血糖値に応じて複数の領域に分割されており、例えば、血糖値が0~59[mg/dl]の低血糖とされる領域を例えば緑色の低血糖領域81A、血糖値が60~109[mg/dl]の正常とされる領域を例えば白色の正常領域81B、血糖値が110~125[mg/dl]の正常と高血糖との間の領域を例えば黄色の擬陽性領域81C、及び血糖値が126~400[mg/dl]の高血糖とされる領域を例えばピンク色の高血糖領域81Dとする。
また折れ線グラフ81では、低血糖領域81A、正常領域81B、擬陽性領域81C及び高血糖領域81Dのそれぞれの境界付近の配色を一方の色から他方の色へ徐々に変化させる所謂グラデーション表示になされている。
さらに折れ線グラフ81では、プロットされた血糖値が凡例表示領域85に示されているように0~59[mg/dl]及び126[mg/dl]以上であった場合、そのプロットされた血糖値のシンボルを強調表示させることにより、医師に容易に目視確認させ得るようになされている。
またCPU11は、血糖値データベースから抽出した血糖値の平均値、標準偏差値、最大値、最小値及びデータ個数を算出し、当該平均値、標準偏差値、最大値、最小値及びデータ個数をそれぞれ血糖値情報表示領域83の平均値表示欄83A、標準偏差値表示欄83B、最大値表示欄83C、最小値表示欄83D及び測定回数表示欄83Eに表示する。
ところで折れ線グラフ81には、その下方に基準(この場合、基準日)を移動させるためのスライドバー88が設けられている。
CPU11は、図9に示すように、スライドバー88が操作部16を介して移動操作された場合、基準日をスライドバー88の移動量に応じて遡るようになされており、その遡った基準日までの1か月分の血糖値だけを再び血糖値データベースから抽出し、その血糖値を時系列に沿って時間帯区分ごとのシンボルで折れ線グラフ81にプロットし直すようになされている。
このときCPU11は、遡った基準日を終了日付表示欄82Cに表示すると共に、開始日付表示欄82Bに基準日より1ヶ月前の日付を表示する。またCPU11は、血糖値データベースから抽出し直した血糖値の平均値、標準偏差値、最大値、最小値及びデータ個数を再度算出し、当該平均値、標準偏差値、最大値、最小値及びデータ個数をそれぞれ血糖値情報表示領域83の平均値表示欄83A、標準偏差値表示欄83B、最大値表示欄83C、最小値表示欄83D及び測定回数表示欄83Eに表示する。
このようにして血糖値情報処理装置2は、スライドバー88が移動操作されると、折れ線グラフ81にプロットされる範囲を固定したまま、日付だけを変更し得るようになされている。
因みにCPU11は、期間情報表示領域82における範囲選択メニュー82Aの例えば「3ヶ月」が操作部16を介して選択されると、折れ線グラフ81の横軸を1か月分から3か月分に変更し、3か月分の血糖値を時系列に沿って時間帯区分ごとのシンボルで折れ線グラフ81にプロットする。
ところでCPU11は、グラフ表示画面70の比較ボタン86が操作部16を介して選択されると、図8との対応部分に同一符号を付した図10に示すように、グラフ表示領域77に期間情報表示領域82、血糖値情報表示領域83、時間帯区分選択チェックボックス84、凡例表示領域85、折れ線グラフ81を縦方向に縮小した折れ線グラフ91、折れ線グラフ92、比較期間情報表示領域93、比較血糖値情報表示領域94、比較解除ボタン95及び印刷ボタン87が設けられたグラフ表示画面90を表示部15に表示するようになされている。
具体的には、CPU11は、比較期間情報表示領域93の期間選択メニュー93Aに範囲選択メニュー82Aと同一である「1ヶ月」を表示し、開始日付表示欄82Bに表示された開始日付の直前の「1ヶ月」の範囲に相当する比較開始日付及び比較終了日付をそれぞれ比較開始日付表示欄93B及び比較終了日付表示欄93Cに表示する。
またCPU11は、ハードディスクドライブ14から読み出した血糖値データベースから、測定日時に基づいて比較開始日付表示欄93B及び比較終了日付表示欄93Cに表示された比較開始日付から比較終了日付までの血糖値を抽出し、さらに時間帯区分選択チェックボックス84にチェックされた時間帯区分(この場合、「朝食前」、「朝食後」、[夕食後]及び「深夜」)の血糖値だけを時系列に沿って時間帯区分ごとのシンボルでプロットし、互いに前後するシンボル同士を直線で結ぶようにして折れ線グラフ92を生成する。
そしてCPU11は、折れ線グラフ91及び92を上下に並べるようにしてグラフ表示領域77に表示するようになされている。
またCPU11は、折れ線グラフ92にプロットした血糖値の平均値、標準偏差値、最大値、最小値及びデータ個数を算出し、当該平均値、標準偏差値、最大値、最小値及びデータ個数をそれぞれ比較血糖値情報表示領域94の平均値表示欄94A、標準偏差値表示欄94B、最大値表示欄94C、最小値表示欄94D及び測定回数表示欄94Eに表示する。
またCPU11は、折れ線グラフ91の下方に設けられたスライドバー96が操作部16を介して移動操作された場合、基準日をスライドバー96の移動量に応じて遡るようになされており、その遡った基準日までの1か月分の血糖値だけを時系列に沿って時間帯区分ごとのシンボルで折れ線グラフ91にプロットし直すと共に、折れ線グラフ92についても全時間折れ線グラフ91と同様の日数分だけ遡るようにしてプロットし直すようになされている。
さらにCPU11は、折れ線グラフ92の下方に設けられたスライドバー97が操作部16を介して移動操作された場合でも、基準日をスライドバー97の移動量に応じて遡るようになされており、その遡った基準日までの1か月分の血糖値だけを時系列に沿って時間帯区分ごとのシンボルで折れ線グラフ92にプロットし直すと共に、折れ線グラフ91についても折れ線グラフ92と同様の日数分だけ遡るようにしてプロットし直すようになされている。
またCPU11は、グラフ表示画面90の比較解除ボタン95が操作部16を介して選択操作されると、グラフ表示画面70(図8)を再び表示部15に表示するようになされている。
ところでCPU11は、例えばグラフ表示画面70(図8)におけるグラフタイプ選択ボタン表示領域76の時間帯別ボタン76Bが操作部16を介して選択操作されると、図8との対応部分に同一符号を付した図11に示すように、グラフ表示領域77に折れ線グラフ101が表示されたグラフ表示画面100を表示部15に表示する。
このときCPU11は、ハードディスクドライブ14から読み出した血糖値データベースから、測定日時に基づいて開始日付表示欄82B及び終了日付表示欄82Cに表示された開始日付から終了日付までの血糖値を抽出し、さらに時間帯区分選択チェックボックス84にチェックされた時間帯区分(この場合、「朝食前」、「朝食後」、「夕食後」及び「深夜」)の血糖値だけを時間帯区分のシンボル毎に直線で結ぶようにしてプロットしてグラフ表示画面100を生成する。
またCPU11は、折れ線グラフ101の下方に設けられたスライドバー88が医師の操作部16を介して移動操作された場合、基準日をスライドバー88の移動量に応じて遡るようになされており、その遡った基準日までの1か月分の血糖値だけを時間帯区分のシンボル毎に直線で結ぶようにして折れ線グラフ101上にプロットし直すようになされている。
さらにCPU11は、グラフ表示画面100の比較ボタン86が操作部16を介して選択操作されると、上述したグラフ表示画面70の比較ボタン86が選択操作された際にグラフ表示画面90を表示する場合と同様に、グラフ表示領域77の上側に折れ線グラフ101を縦方向に縮小表示すると共に、折れ線グラフ101と同一の範囲でかつ直前の期間の折れ線グラフ(図示せず)を当該グラフ表示領域77の下側に表示する。
ところでCPU11は、例えばグラフ表示画面70(図8)におけるグラフ種類選択ボタン表示領域75の期間平均ボタン75Bが操作部16を介して選択操作されると、図8との対応部分に同一符号を付した図12に示すように、グラフ表示画面110を表示部15に表示する。
このグラフ表示画面110では、グラフタイプ選択ボタン表示領域76に月平均ボタン76C及び週平均ボタン76Dが表示され、グラフ表示領域77に期間情報表示領域82、血糖値情報表示領域83、時間帯区分選択チェックボックス84、凡例表示領域85、平均グラフ111、血糖値情報テーブル112及び付加チェックボックス欄113が設けられている。この場合、範囲選択メニュー82Aは、例えば「12ヶ月」、「24ヶ月」及び「36ヶ月」を選択させるようになされており、デフォルトとして「12ヶ月」を選択表示している。
CPU11は、グラフ表示画面110を表示部15に表示する際、開始日付表示欄82B及び終了日付表示欄82Cに表示された期間でかつ時間帯区分選択チェックボックス84にチェックされた時間帯区分(この場合、「朝食前」、「朝食後」、「夕食後」及び「深夜」)の血糖値を血糖値ベータベースから測定日時を基に月ごとに抽出する。
そしてCPU11は、抽出した月ごとの血糖値の平均値、標準偏差値、最大値、最小値、データ数、低血糖(0~59[mg/dl])の回数をそれぞれ算出する。
またCPU11は、算出した12か月分の平均値及び標準偏差値をそれぞれ横線及び縦バーにより示した平均グラフ111をグラフ表示領域77に表示すると共に、算出した月ごとの血糖値の平均値、標準偏差値(SD)、最大値、最小値、データ数(N数)、低血糖の回数を血糖値情報テーブル112に表示する。
因みにCPU11は、グラフ表示画面110の比較ボタン86が操作部16を介して選択操作されると、上述したグラフ表示画面70の比較ボタン86が選択操作された際にグラフ表示画面90を表示する場合と同様に、グラフ表示領域77の上側に平均グラフ111を縦方向に縮小表示すると共に、平均グラフ111と同一の範囲でかつ直前の期間の平均グラフ(図示せず)を当該グラフ表示領域77の下側に表示する。
CPU11は、グラフ表示画面110における付加チェックボックス欄113のSD折れ線表示チェックボックスAが操作部16を介して選択操作されると、図12との対応部分に同一符号を付した図13に示すように、平均グラフ111を縦方向に縮小した平均グラフ121と血糖値情報テーブル112との間に月ごとの標準偏差値を直線で結んだ標準偏差折れ線グラフ122が表示されたグラフ表示画面120を表示する。
またCPU11は、グラフ表示画面110における付加チェックボックス欄113の参考検査値チェックボックス113Bが操作部16を介して選択操作されると、例えば予め患者データベース等に登録された月ごとのHbA1c値などを折れ線グラフとして表示し得るようになされている。
因みにCPU11は、グラフ表示画面120の比較ボタン86が操作部16を介して選択操作されると、上述したグラフ表示画面70の比較ボタン86が選択操作された際にグラフ表示画面90を表示する場合と同様に、グラフ表示領域77の上側に平均グラフ111及び標準偏差折れ線グラフ122を縦方向に縮小表示すると共に、平均グラフ111及び標準偏差折れ線グラフ122と同一の範囲でかつ直前の期間の平均グラフ及び標準偏差折れ線グラフ(図示せず)を当該グラフ表示領域77の下側に表示する。
一方、CPU11は、グラフ表示画面110(図12)におけるグラフタイプ選択ボタン表示領域76の週平均ボタン76Dが操作部16を介して選択操作されると、図12との対応部分に同一符号を付した図14に示すようなグラフ表示画面130を表示部15に表示する。
この場合、グラフ表示画面130では、範囲選択メニュー82Aが例えば「12週間」、「24週間」及び「36週間」を選択させ得るようになされており、デフォルトとして「12週間」を選択表示している。
CPU11は、グラフ表示画面130を表示部15に表示する際、開始日付表示欄82B及び終了日付表示欄82Cに表示された期間でかつ時間帯区分選択チェックボックス84にチェックされた時間帯区分(この場合、「朝食前」、「朝食後」、「夕食後」及び「深夜」)の血糖値を血糖値ベータベースから測定日時を基に週ごとに抽出する。
そしてCPU11は、抽出した週ごとの血糖値の平均値、標準偏差値、最大値、最小値、データ数、低血糖(0~59[mg/dl])の回数をそれぞれ算出する。
またCPU11は、算出した12週間分の平均値及び標準偏差値をそれぞれ横線及び縦バーにより示した平均グラフ131をグラフ表示領域77に表示すると共に、算出した週ごとの血糖値の平均値、標準偏差値、最大値、最小値、データ数、低血糖の回数を血糖値情報テーブル132に表示する。
因みにCPU11は、グラフ表示画面130の比較ボタン86が操作部16を介して選択操作されると、上述したグラフ表示画面70の比較ボタン86が選択操作された際にグラフ表示画面90を表示する場合と同様に、グラフ表示領域77の上側に平均グラフ131を縦方向に縮小表示すると共に、平均グラフ131と同一の範囲でかつ直前の期間の平均グラフ(図示せず)を当該グラフ表示領域77の下側に表示する。
CPU11は、グラフ表示画面130における付加チェックボックス欄113のSD折れ線表示チェックボックス113Aが操作部16を介して選択操作されると、図14との対応部分に同一符号を付した図15に示すように、平均グラフ131を縦方向に縮小した平均グラフ141と血糖値情報テーブル132との間に週ごとの標準偏差値を直線で結んだ標準偏差折れ線グラフ142が表示されたグラフ表示画面140を表示する。
因みにCPU11は、グラフ表示画面140の比較ボタン86が操作部16を介して選択操作されると、上述したグラフ表示画面70の比較ボタン86が選択操作された際にグラフ表示画面90を表示する場合と同様に、グラフ表示領域77の上側に平均グラフ141及び標準偏差折れ線グラフ142を縦方向に縮小表示すると共に、平均グラフ141及び標準偏差折れ線グラフ142と同一の範囲でかつ直前の期間の平均グラフ及び標準偏差折れ線グラフ(図示せず)を当該グラフ表示領域77の下側に表示する。
ところでCPU11は、例えばグラフ表示画面70(図8)におけるグラフ種類選択ボタン表示領域75の24hトレンドボタン75Cが操作部16を介して選択操作されると、図8との対応部分に同一符号を付した図16に示すように、グラフ表示画面150を表示部15に表示する。
このグラフ表示画面150では、グラフタイプ選択ボタン表示領域76に全時間ボタン76A及び時間帯別ボタン76Bが表示され、グラフ表示領域77に期間情報表示領域82、血糖値情報表示領域83、凡例表示領域85、比較ボタン86、印刷ボタン87、平均グラフ151、血糖値情報テーブル152、チェックボックス欄153が設けられている。
このグラフ表示画面150では、範囲選択メニュー82Aが例えば「1ヶ月」、「2ヶ月」、「3ヶ月」及び「6ヶ月」を選択させ得るようになされており、デフォルトとして「1ヶ月」を選択表示している。
またチェックボックス欄153には、SD棒表示チェックボックス153A、平均値チェックボックス153B及びプロットチェックボックス153Cが設けられており、デフォルトとして平均値チェックボックス153Bがチェックされている。
CPU11は、グラフ表示画面150を表示部15に表示する際、開始日付表示欄82B及び終了日付表示欄82Cに表示された期間の血糖値を血糖値ベータベースから測定日時を基に1時間ごとに抽出し、当該抽出した1時間ごとの血糖値の平均値、標準偏差値、最大値、最小値、データ数、低血糖の回数をそれぞれ算出する。
そしてCPU11は、算出した1時間ごとの平均値及び標準偏差値をそれぞれ横線及び縦バーにより示した平均グラフ151をグラフ表示領域77に表示すると共に、算出した1時間ごとの血糖値の平均値、標準偏差値、最大値、最小値、データ数、低血糖の回数を血糖値情報テーブル152に表示する。
因みにCPU11は、グラフ表示画面150の比較ボタン86が操作部16を介して選択操作されると、上述したグラフ表示画面70の比較ボタン86が選択操作された際にグラフ表示画面90を表示する場合と同様に、グラフ表示領域77の上側に平均グラフ151を縦方向に縮小表示すると共に、平均グラフ151と同一の範囲でかつ直前の期間の平均グラフ(図示せず)を当該グラフ表示領域77の下側に表示する。
一方、CPU11は、グラフ表示画面150におけるチェックボックス欄153のSD棒表示チェックボックス153Aが操作部16を介して選択操作されると、図16との対応部分に同一符号を付した図17に示すように、平均グラフ151を縦方向に縮小した平均グラフ161と血糖値情報テーブル152との間に1時間ごとの標準偏差値を棒状に示した棒グラフ162が表示されたグラフ表示画面160を表示する。
因みにCPU11は、グラフ表示画面160の比較ボタン86が操作部16を介して選択操作されると、上述したグラフ表示画面70の比較ボタン86が選択操作された際にグラフ表示画面90を表示する場合と同様に、グラフ表示領域77の上側に平均グラフ161及び棒グラフ162を縦方向に縮小表示すると共に、平均グラフ161及び棒グラフ162と同一の範囲でかつ直前の期間の平均グラフ及び棒グラフ(図示せず)を当該グラフ表示領域77の下側に表示する。
ところでCPU11は、グラフ表示画面150(図16)におけるチェックボックス欄153のプロットチェックボックス153Cが操作部16を介して選択操作されると、図16との対応部分に同一符号を付した図18に示すようなグラフ表示画面170を表示する。このときCPU11は、チェックボックス欄153のプロットチェックボックス153Cにチェックを入れると共に、平均値チェックボックス153Bのチェックを外す。なお図16及び図18で用いられる血糖値が実際上は同一であるが、説明の便宜上、図16及び図18では異なる血糖値を用いており、図16の平均グラフ151、図18のプロットグラフ171、及び血糖値情報テーブル152の値はその一例に過ぎない。
またCPU11は、グラフ表示画面170のグラフ表示領域77に、抽出した1ヶ月分の全ての血糖値を1時間ごとに区分してプロットしたプロットグラフ171を表示する。
プロットグラフ171では、プロットされた血糖値が凡例表示領域85に示されているように血糖値が0~59[mg/dl]及び126[mg/dl]以上であった場合、そのプロットされた血糖値のプロット点を強調表示することにより、医師に容易に目視確認させ得る。
因みにCPU11は、グラフ表示画面170の比較ボタン86が操作部16を介して選択操作されると、上述したグラフ表示画面70の比較ボタン86が選択操作された際にグラフ表示画面90を表示する場合と同様に、グラフ表示領域77の上側にプロットグラフ171を縦方向に縮小表示すると共に、プロットグラフ171と同一の範囲でかつ直前の期間のプロットグラフ(図示せず)を当該グラフ表示領域77の下側に表示する。
一方、CPU11は、グラフ表示画面170におけるチェックボックス欄153のSD棒表示チェックボックス153Aが操作部16を介して選択操作されると、図17及び図18との対応部分に同一符号を付した図19に示すように、プロットグラフ171を縦方向に縮小したプロットグラフ181と血糖値情報テーブル152との間に1時間ごとの標準偏差値を棒状に示した棒グラフ162が表示されたグラフ表示画面180を表示する。
因みにCPU11は、グラフ表示画面180の比較ボタン86が操作部16を介して選択操作されると、上述したグラフ表示画面70の比較ボタン86が選択操作された際にグラフ表示画面90を表示する場合と同様に、グラフ表示領域77の上側にプロットグラフ181及び棒グラフ162を縦方向に縮小表示すると共に、プロットグラフ181及び棒グラフ162と同一の範囲でかつ直前の期間のプロットグラフ及び棒グラフ(図示せず)を当該グラフ表示領域77の下側に表示する。
ところでCPU11は、例えばグラフ表示画面150(図16)におけるグラフタイプ選択ボタン表示領域76の時間帯別ボタン76Bが操作部16を介して選択操作されると、図16との対応部分に同一符号を付した図20に示すようなグラフ表示画面190を表示部15に表示する。
CPU11は、グラフ表示画面190を表示部15に表示する際、範囲選択メニュー82Aにデフォルトで表示された「1ヶ月」分に対応する開始日付表示欄82B及び終了日付表示欄82Cに表示された期間の血糖値を測定日時を基に時間帯区分ごとに血糖値ベータベースから抽出する。
そしてCPU11は、抽出した時間帯区分ごとの血糖値の平均値、標準偏差値、最大値、最小値、データ数、低血糖の回数をそれぞれ算出する。
またCPU11は、算出した時間帯区分ごとの平均値及び標準偏差値をそれぞれ横線及び縦バーにより示した平均グラフ191をグラフ表示領域77に表示すると共に、算出した時間帯区分ごとの血糖値の平均値、標準偏差値、最大値、最小値、データ数、低血糖の回数を血糖値情報テーブル192に表示する。
因みにCPU11は、グラフ表示画面190の比較ボタン86が操作部16を介して選択操作されると、上述したグラフ表示画面70の比較ボタン86が選択操作された際にグラフ表示画面90を表示する場合と同様に、グラフ表示領域77の上側に平均グラフ191を縦方向に縮小表示すると共に、平均グラフ191と同一の範囲でかつ直前の期間の平均グラフ(図示せず)を当該グラフ表示領域77の下側に表示する。
CPU11は、グラフ表示画面190におけるチェックボックス欄153のSD棒表示チェックボックス153Aが操作部16を介して選択操作されると、図20との対応部分に同一符号を付した図21に示すように、平均グラフ191を縦方向に縮小した平均グラフ201と血糖値情報テーブル192との間に時間帯区分ごとの標準偏差値を棒状に示した棒グラフ202が表示されたグラフ表示画面200を表示する。
因みにCPU11は、グラフ表示画面200の比較ボタン86が操作部16を介して選択操作されると、上述したグラフ表示画面70の比較ボタン86が選択操作された際にグラフ表示画面90を表示する場合と同様に、グラフ表示領域77の上側に平均グラフ201及び棒グラフ202を縦方向に縮小表示すると共に、平均グラフ201及び棒グラフ202と同一の範囲でかつ直前の期間の平均グラフ及び棒グラフ(図示せず)を当該グラフ表示領域77の下側に表示する。
一方、CPU11は、グラフ表示画面190(図20)におけるチェックボックス欄153のプロットチェックボックス153Cが操作部16を介して選択操作されると、図20との対応部分に同一符号を付した図22に示すようなグラフ表示画面210を表示する。このときCPU11は、チェックボックス欄153のプロットチェックボックス153Cにチェックを入れると共に、平均値チェックボックス153Bのチェックを外す。なお図20及び図22で用いられる血糖値が実際上は同一であるが、説明の便宜上、図20及び図22では異なる血糖値を用いており、図20の平均グラフ191、図22のプロットグラフ211、及び血糖値情報テーブル192の値はその一例に過ぎない。
またCPU11は、グラフ表示画面210のグラフ表示領域77に、抽出した1ヶ月分の血糖値を時間帯区分ごとに区分してプロットしたプロットグラフ211を表示する。
プロットグラフ211では、プロットされた血糖値が凡例表示領域85に示されているように血糖値が0~59[mg/dl]及び126[mg/dl]以上であった場合、そのプロットされた血糖値のプ/ロット点を強調表示させることにより、医師に容易に目視確認させ得る。
因みにCPU11は、グラフ表示画面210の比較ボタン86が操作部16を介して選択操作されると、上述したグラフ表示画面70の比較ボタン86が選択操作された際にグラフ表示画面90を表示する場合と同様に、グラフ表示領域77の上側にプロットグラフ211を縦方向に縮小表示すると共に、プロットグラフ211と同一の範囲でかつ直前の期間のプロットグラフ(図示せず)を当該グラフ表示領域77の下側に表示する。
CPU11は、グラフ表示画面210におけるチェックボックス欄153のSD棒表示チェックボックス153Aが操作部16を介して選択操作されると、図21及び図22との対応部分に同一符号を付した図23に示すように、プロットグラフ211を縦方向に縮小したプロットグラフ221と血糖値情報テーブル192との間に時間帯区分ごとの標準偏差値を棒状に示した棒グラフ202が表示されたグラフ表示画面220を表示する。
因みにCPU11は、グラフ表示画面220の比較ボタン86が操作部16を介して選択操作されると、上述したグラフ表示画面70の比較ボタン86が選択操作された際にグラフ表示画面90を表示する場合と同様に、グラフ表示領域77の上側にプロットグラフ221及び棒グラフ202を縦方向に縮小表示すると共に、プロットグラフ221及び棒グラフ202と同一の範囲でかつ直前の期間のプロットグラフ及び棒グラフ(図示せず)を当該グラフ表示領域77の下側に表示する。
ところでCPU11は、例えばグラフ表示画面70(図8)におけるグラフ種類選択ボタン表示領域75の割合ボタン75Dが操作部16を介して選択操作されると、図8との対応部分に同一符号を付した図24に示すように、グラフ表示画面230を表示部15に表示する。
このグラフ表示画面230では、グラフタイプ選択ボタン表示領域76に時間帯別円グラフボタン76E、積上げ棒グラフ月ボタン76F及び積上げ棒グラフ週ボタン76Gが表示され、デフォルトとして時間帯別円グラフボタン76Eが選択表示されている。この場合、グラフ表示画面230では、グラフ表示領域77に2つの円グラフ231及び232が左右に並べられて表示される。
また範囲選択メニュー82Aは、例えば「1ヶ月」、「2ヶ月」、「3ヶ月」及び「6ヶ月」を選択させるようになされており、デフォルトとして「1ヶ月」を選択表示している。
CPU11は、グラフ表示画面230を表示部15に表示する際、開始日付表示欄82B及び終了日付表示欄82Cに表示された期間でかつ時間帯区分選択チェックボックス233にチェックされた時間帯区分(この場合、「朝食前」、「昼食前」、「夕食前」及び「就寝前」)の血糖値を血糖値ベータベースから測定日時及び時間帯区分を基に抽出する。
そしてCPU11は、抽出した血糖値の平均値、標準偏差値、最大値、最小値及びデータ数をそれぞれ算出すると共に、抽出した血糖値のデータ数に対する血糖値が0~59、60~109、110~125及び126以上となるデータ数の割合を算出する。
またCPU11は、算出した時間帯区分ごとの血糖値の平均値、標準偏差値、最大値、最小値、データ数を血糖値情報テーブル234に表示すると共に、算出した血糖値の割合を円グラフ231として表示する。
またCPU11は、開始日付表示欄82B及び終了日付表示欄82Cに表示された期間でかつ時間帯区分選択チェックボックス235にチェックされた時間帯区分(この場合、「朝食後」、「昼食後」、「夕食後」及び「深夜」)の血糖値を血糖値ベータベースから測定日時及び時間帯区分を基に抽出する。
そしてCPU11は、抽出した血糖値の平均値、標準偏差値、最大値、最小値及びデータ数をそれぞれ算出すると共に、抽出した血糖値のデータ数に対する血糖値が0~59、60~109、110~125及び126以上となるデータ数の割合を算出する。
またCPU11は、算出した時間帯区分ごとの血糖値の平均値、標準偏差値、最大値、最小値、データ数を血糖値情報テーブル236に表示すると共に、算出した血糖値の割合を円グラフ232として表示する。
因みにCPU11は、グラフ表示画面230の比較ボタン85が操作部16を介して選択操作されると、上述したグラフ表示画面70の比較ボタン86が選択操作された際にグラフ表示画面90を表示する場合と同様に、グラフ表示領域77の上側に円グラフ231及び円グラフ232を縮小表示すると共に、当該グラフ表示領域77の下側に縮小した円グラフ231及び円グラフ232と同一の範囲でかつ直前の期間の円グラフ(図示せず)をそれぞれ表示する。
一方、CPU11は、グラフ表示画面230におけるグラフタイプ選択ボタン表示領域76の積上げ棒グラフ月ボタン76Fが操作部16を介して選択操作されると、図24との対応部分に同一符号を付した図25に示すようなグラフ表示画面240を表示部15に表示する。
CPU11は、グラフ表示画面240を表示部15に表示する際、開始日付表示欄82B及び終了日付表示欄82Cに表示された期間でかつ時間帯区分選択チェックボックス84にチェックされた時間帯区分(この場合、「朝食前」、「朝食後」、「夕食後」及び「深夜」)の血糖値を血糖値ベータベースから測定日時及び時間帯区分を基に抽出する。
そしてCPU11は、抽出した血糖値の平均値、標準偏差値、最大値、最小値及びデータ数をそれぞれ算出すると共に、抽出した血糖値の月ごとのデータ数に対する血糖値が0~59、60~109、110~125及び126以上となるデータ数の割合をそれぞれ算出する。
そしてCPU11は、算出した血糖値の平均値、標準偏差値、最大値、最小値、データ数を血糖値情報表示領域83に表示すると共に、算出した月ごとの血糖値の割合を棒グラフ241として表示する。
因みにCPU11は、グラフ表示画面240の比較ボタン86が操作部16を介して選択操作されると、上述したグラフ表示画面70の比較ボタン86が選択操作された際にグラフ表示画面90を表示する場合と同様に、グラフ表示領域77の上側に棒グラフ241を縦方向に縮小表示すると共に、棒グラフ241と同一の範囲でかつ直前の期間の棒グラフ(図示せず)を当該グラフ表示領域77の下側に表示する。
一方、CPU11は、グラフ表示画面230(図24)におけるグラフタイプ選択ボタン表示領域76の積上げ棒グラフ週ボタン76Gが操作部16を介して選択操作されると、図24との対応部分に同一符号を付した図26に示すようなグラフ表示画面250を表示部15に表示する。
CPU11は、グラフ表示画面250を表示部15に表示する際、範囲選択メニュー82Aにデフォルトで表示された「12週間」分に対応する開始日付表示欄82B及び終了日付表示欄82Cに表示された期間でかつ時間帯区分選択チェックボックス84にチェックされた時間帯区分(この場合、「朝食前」、「朝食後」、「夕食後」及び「深夜」)の血糖値を血糖値データベースから測定日時及び時間帯区分を基に抽出する。
そしてCPU11は、抽出した血糖値の平均値、標準偏差値、最大値、最小値及びデータ数をそれぞれ算出すると共に、抽出した血糖値の週ごとのデータ数に対する血糖値が0~59、60~109、110~125及び126以上となるデータ数の割合をそれぞれ算出する。
そしてCPU11は、算出した血糖値の平均値、標準偏差値、最大値、最小値、データ数を血糖値情報表示領域83に表示すると共に、算出した週ごとの血糖値の割合を棒グラフ251として表示する。
因みにCPU11は、グラフ表示画面250の比較ボタン86が操作部16を介して選択操作されると、上述したグラフ表示画面70の比較ボタン86が選択操作された際にグラフ表示画面90を表示する場合と同様に、グラフ表示領域77の上側に棒グラフ251を縦方向に縮小表示すると共に、棒グラフ251と同一の範囲でかつ直前の期間の棒グラフ(図示せず)を当該グラフ表示領域77の下側に表示する。
ところでCPU11は、例えばグラフ表示画面70(図8)におけるグラフ種類選択ボタン表示領域75のMyグラフボタン75Eが操作部16を介して選択操作されると、図8との対応部分に同一符号を付した図27に示すように、グラフ表示画面260を表示部15に表示する。
ここでグラフ表示画面260は、任意のグラフを表示し得るようになされており、例えば、図8における折れ線グラフ81に相当する折れ線グラフ261、及び図12における平均グラフ111に相当する平均グラフ262をグラフ表示領域77に表示する。
CPU11は、例えばグラフ表示画面70(図8)におけるグラフ種類選択ボタン表示領域75の血糖値ノートボタン75Fが操作部16を介して選択操作されると、図8との対応部分に同一符号を付した図28に示すように、血糖値ベータベースに記録された血糖値が測定時刻と共に一覧表示された血糖値一覧表271を血糖値ノート表示画面270に表示する。
すなわち血糖値一覧表271は、縦軸を日付とし、横軸を時間帯区分として血糖値が測定時刻と共にマトリクス状に配置されている。この血糖値一覧表271では、血糖値が0~59[mg/dl]であった場合、及び126[mg/dl]以上であった場合、当該血糖値を反転表示するようになされている。
ところで血糖値は、血糖値測定器5(図1)によって患者自らが食前及び食後等に例えば自宅や会社等で測定する。また患者は、必ずしも設定された時間帯区分に従って食事を取れるとは限らない。そのためCPU11は、血糖値測定器5によって測定された測定データの測定時刻に基づいて血糖値を該当する時間帯区分に区分する際、実際とは異なる時間帯区分に区分して血糖値データベースを生成してしまうことが考えられる。また血糖値測定器5は、例えば初期設定時に患者によって日付及び時刻が設定されているため、誤った日付及び時刻に設定されている場合も考えられる。
そこで血糖値情報処理装置2では、CPU11によって生成された血糖値データベースを医師の判断により修正させ得るようになされている。
具体的には、図28の一部である血糖値一覧部分271Aを表示した図29(A)に示すように、CPU11は、血糖値一覧表271の任意の血糖値がカーソルCuによって選択(クリック)されると、当該血糖値及び対応する測定時刻を選択枠FRで囲み、任意の血糖値を選択したことを医師に目視確認させる。
そしてCPU11は、選択枠FRで囲んだ血糖値が選択された状態で、操作部16の例えばマウスがダブルクリックされて決定されたことを認識すると、図29(B)に示すように、その血糖値及び測定時刻を反転表示すると共に、その血糖値の直下に時間帯区分変更ポップアップメニュー300を血糖値一覧表271に重ねて表示する。
この時間帯区分変更ポップアップメニュー300には、決定された血糖値の測定日付を表示する測定日付表示欄301、当該血糖値の測定時刻を表示する測定時刻表示欄302、当該血糖値を表示する血糖値表示欄303、当該血糖値の時間帯区分を1つ前の時間帯区分に移動させるための左ボタン304、当該血糖値の時間帯区分を1つ後の時間帯区分に移動させるための右ボタン305、削除ボタン306、キャンセルボタン307及び確定ボタン308が設けられている。
CPU11は、図29(C)に示すように、時間帯区分変更ポップアップメニュー300の左ボタン304がカーソルCuを介して選択されたことを認識すると、図29(D)に示すように、選択している血糖値を左側の時間帯区分、すなわち1つ前の時間帯区分へ移動表示する。このときCPU11は、時間帯区分を移動させた血糖値を選択枠FRで囲んだ選択状態にしておくことにより、医師に時間帯区分を変更した血糖値を容易に発見させ得るようになされている。
またCPU11は、時間帯区分変更ポップアップメニュー300の右ボタン305がカーソルCuを介して選択されたことを認識すると、選択している血糖値を右側の時間帯区分、すなわち1つ後の時間帯区分へ移動表示する。
さらにCPU11は、時間帯区分変更ポップアップメニュー300のプルダウンメニューでなる測定日付表示欄301が操作部16を介して変更された後、確定ボタン308が当該カーソルCuを介して選択されたことを認識すると、変更された測定日付へ選択されている血糖値を移動表示する。
さらにCPU11は、時間帯区分変更ポップアップメニュー300の測定時刻表示欄302が例えば操作部16のキーボードを介して入力操作された後、確定ボタン308が当該カーソルCuを介して選択されたことを認識すると、当該入力された測定時刻を基に時間帯区分を再区分し、その再区分された時間帯区分へ当該血糖値を移動表示する。
このようにして血糖値情報処理装置2では、血糖値測定器5によって測定された血糖値の時間帯区分、測定日付及び測定時刻を、時間帯区分変更ポップアップメニュー300に対する所定の操作を行わせることにより、変更させ得るようになされている。
そして血糖値情報処理装置2は、保存ボタン272(図28)が操作部16を介して選択されると、変更された血糖値の時間帯区分、測定日付及び測定時刻を反映させるべく、変更された血糖値の時間帯区分、測定日付及び測定時刻に血糖値ベータベースを更新する。
これにより血糖値情報処理装置2は、例えば医師の判断により血糖値を適切であると思われる時間帯区分、測定日付、測定時刻に容易に変更させられるので、当該変更された時間帯区分、測定日付、測定時刻を用いて上述した種々のグラフ表示を行うことができ、より適切な判断材料を医師に提供することができる。
(4)動作及び効果
以上の構成において血糖値情報処理装置2は、血糖値測定器5により測定された血糖値及び当該血糖値が測定された測定日時からなる測定データを外部接続インターフェース部17を介して取得し、当該測定データをハードディスクドライブ14に患者ごとに記憶する。
また血糖値情報処理装置2は、測定データの血糖値を、当該血糖値が測定された測定日時及び時間帯区分テーブル60(図7)に基づいて複数の時間帯区分のいずれかに区分し、測定データの血糖値及び測定日時と分類した時間帯区分とを関連付けた血糖値データベースを生成する。
そして血糖値情報処理装置2は、例えばグラフ表示画面70(図8)においてグラフ種類選択ボタン表示領域75の血糖値ノートボタン75Fが操作部16を介して選択操作されると、血糖値ベータベースに記録された血糖値が測定時刻と共に一覧表示された血糖値一覧表271を血糖値ノート表示画面270(図28)に表示する。
このとき血糖値情報処理装置2は、血糖値一覧表271の任意の血糖値が選択決定されたことを認識すると、その血糖値を反転表示すると共に、その血糖値の直下に時間帯区分変更ポップアップメニュー300を表示し、左ボタン304又は右ボタン305が選択されると、選択している血糖値を1つ前又は1つ後の時間帯区分へ移動表示すると共に、当該血糖値を1つ前又は1つ後の時間帯区分に再区分し直すように血糖値ベータベースを更新する。
従って血糖値情報処理装置2は、例えば医師の判断により血糖値を適切であると思われる時間帯区分に容易に変更させられるので、当該変更された時間帯区分を用いて上述した種々のグラフ表示を行うことができ、より適切な判断材料を医師に提供することができる。
また血糖値情報処理装置2は、任意の血糖値の時間帯区分を変更する際に当該血糖値の測定時刻を変更することがないため、例えば1時間ごとの血糖値を用いたグラフ表示画面150、160、170及び180(図16~図19)を表示する際、測定時刻を正確に反映したグラフ表示を行うことができる。
さらに血糖値情報処理装置2は、任意の血糖値の測定日付及び測定時刻を時間帯区分変更ポップアップメニュー300に対する操作に応じて変更することにより、血糖値測定器5が誤った時間に設定されている場合であっても、変更された測定日付及び測定時刻を用いて上述した種々のグラフ表示を行うことができる。
また血糖値情報処理装置2は、例えばグラフ表示画面70において例えば1か月分の血糖値を時系列に沿ってプロットした折れ線グラフ81の下方にスライドバー88を設け、当該スライドバー88が平行移動されると、移動量に応じて遡った1か月分の血糖値だけを時系列に沿って折れ線グラフ81にプロットするようにした。
従って血糖値情報処理装置2は、折れ線グラフ81にプロットされる血糖値の範囲を変更することなく、その期間だけをスライドバー88の移動量に応じて変更することにより、折れ線グラフ81にプロットする血糖値の期間を容易に変更させることができる。
これにより血糖値情報処理装置2は、スライドバー88を平行移動させるだけで、当該スライドバー88の移動に応じて随時プロットする血糖値の期間を変更するので、医師に対して血糖値の推移をより連続的にかつ長期的に目視確認させることができる。
また血糖値情報処理装置2は、スライドバー88が平行移動されると、移動量に応じて遡った折れ線グラフ81にプロットした血糖値の平均値、標準偏差値、最大値、最小値及びデータ個数を再度算出し、当該平均値、標準偏差値、最大値、最小値及びデータ個数をそれぞれ血糖値情報表示領域83の平均値表示欄83A、標準偏差値表示欄83B、最大値表示欄83C、最小値表示欄83D及び測定回数表示欄83Eに表示するようにした。
これにより血糖値情報処理装置2は、現在折れ線グラフ81にプロットしている血糖値だけの平均値、標準偏差値、最大値、最小値及びデータ個数を、スライドバー88の移動に応じて表示することができる。
また血糖値情報処理装置2は、例えばグラフ表示画面70の比較ボタン86が選択操作されると、グラフ表示領域77の上側に折れ線グラフ81を縦方向に縮小表示すると共に、折れ線グラフ81と同一の範囲でかつ直前の期間の折れ線グラフ92を当該グラフ表示領域77の下側に表示するようにした。
従って血糖値情報処理装置2は、比較ボタン86を選択させるという容易な操作を医師に行わせるだけで、同一範囲でかつ連続した2つの期間でなる例えば折れ線グラフを提供することができる。
また血糖値情報処理装置2は、同一範囲でかつ連続した2つの期間でなる例えば折れ線グラフを表示することにより、連続した2つの期間での血糖値の遷移を比較させることができる。
以上の構成によれば血糖値情報処理装置2は、血糖値測定器5により測定された血糖値及び当該血糖値が測定された測定日時を取得し、当該測定日時に基づいて血糖値を複数の時間帯区分に区分し、当該時間帯区分及び測定日付を軸とする血糖値一覧表271の任意の血糖値が選択決定されたことを認識すると時間帯区分変更ポップアップメニュー300を表示し、左ボタン304又は右ボタン305が選択されると、選択している血糖値を1つ前又は1つ後の時間帯区分へ移動させることにより、従来と比してより正確な時間帯区分の血糖値及び血糖値情報を提供することができる。
また血糖値情報処理装置2は、血糖値測定器5により測定された血糖値及び当該血糖値が測定された測定日時を取得し、例えばグラフ表示画面70において例えば1か月分の血糖値を時系列に沿ってプロットした折れ線グラフ81の下方にスライドバー88を設け、当該スライドバー88が平行移動されると、移動量に応じて遡った例えば1か月分の血糖値だけを時系列に沿って折れ線グラフ81上にプロットするようにしたことにより、ユーザに対して煩雑な操作を強いることなく、ユーザが所望する期間又は範囲の血糖値及び血糖値情報を容易に提供することができる。
(5)他の実施の形態
なお上述した実施の形態においては、血糖値情報処理装置2と血糖値測定装置5とが通信モジュール6及び光通信ユニットを介して無線接続されるようにした場合について述べたが、本発明はこれに限らず、血糖値情報処理装置2と血糖値測定装置5とが無線通信により接続されるようにしても良いし、また所定のケーブル等を介して有線接続されるようにしても良い。
また上述した実施の形態においては、1台の血糖値情報処理装置2が血糖値測定器5により供給される測定データを保存及び管理するようにした場合について述べたが、本発明はこれに限らず、例えばイントラネット等により接続された複数台の血糖値情報処理装置2が血糖値測定器5により供給される測定データを保存及び管理するようにしても良いし、また複数台の血糖値情報処理装置2のうちの1台がマスタとして測定データを保存及び管理し、残りの血糖値情報処理装置2がマスタとしての血糖値情報処理装置2にアクセスすることにより測定データを一時的に使用するようにしても良い。
さらに上述した実施の形態においては、血糖値測定器5により供給される測定データを患者ごとのフォルダに保存するようにした場合について述べたが、本発明はこれに限らず、例えば複数台の血糖値測定器5にそれぞれ固有の識別番号が設定されているような場合には、当該血糖値測定器5の識別番号ごとに測定データを保存するようにしても良い。
この場合、血糖値情報処理装置2は、血糖値測定器5の識別番号と患者名とを予め関連付けておくようにすれば、患者検索画面40(図6)により患者名が選択されると、当該患者名に関連付けられた識別番号のフォルダから測定データを読み出すことにより上述した血糖値情報処理を実行することができる。
さらに上述した実施の形態においては、CPU11が、予めハードディスクドライブ14に格納されている血糖値情報処理プログラムに従い、上述した血糖値情報処理を行うようにした場合について述べたが、本発明はこれに限らず、記憶媒体からインストールした血糖値情報処理プログラムや、インターネットからダウンロードした血糖値情報処理プログラム、その他種々のルートによってインストールした血糖値情報処理プログラムに従って上述した血糖値情報処理を行うようにしても良い。
さらに上述した実施の形態においては、取得部として外部接続インターフェース部17、表示制御部としてCPU11によって本発明の血糖値情報処理装置としての情報処理装置2を構成するようにした場合について述べた。本発明はこれに限らず、この他種々の構成でなる取得部、表示制御部によって血糖値情報処理装置を構成するようにしても良い。
さらに上述した実施の形態においては、取得部として外部接続インターフェース部17、区分部としてCPU11、表示制御部としてCPU11、変更部としてのCPU11によって本発明の血糖値情報処理装置としての血糖値情報処理装置2を構成するようにした場合について述べた。本発明はこれに限らず、この他種々の構成でなる取得部、区分部、表示制御部、変更部によって血糖値情報処理装置を構成するようにしても良い。 Hereinafter, an embodiment of the present invention will be described in detail with reference to the drawings.
(1) Configuration of blood glucose level information processing system
As shown in FIG. 1,reference numeral 1 denotes a blood glucose level information processing system as an embodiment of the present invention as a whole, and includes a blood glucose level information processing device 2, a printer 3, and a blood glucose level measurement unit 4.
The blood glucose levelinformation processing apparatus 2 is, for example, a personal computer, and is connected to the printer 3 via, for example, a USB (Universal Serial Bus) cable and connected to the printer 3 via an optical communication module (not shown) connected via an RS232C cable. Optical communication with the value measuring unit 4 is possible.
The blood sugarlevel measuring unit 4 is provided with a blood sugar level measuring device 5 that measures blood sugar levels by a patient, and a communication module 6 that communicates with the blood sugar level information processing apparatus 2 and the printer 3.
The blood glucose level measuringdevice 5 collects the blood of the patient with a replaceable measuring chip 7 provided at the tip thereof, reacts the collected blood with the reagent enclosed in the measuring chip 7, and causes the reaction. The concentration of glucose contained in the blood is measured by optically reading the color of the blood, and as a result, the blood glucose level is obtained.
The blood glucoselevel measuring device 5 has a clock function inside, for example, is configured to count time based on the date and time input by the user at the time of initial setting, and the measured blood glucose level together with the measurement date and time. The measurement data is stored in, for example, a non-volatile memory provided therein.
Here, the blood glucose level changes depending on the time before and after the meal, the time zone and lifestyle, etc. In order to grasp the change, the patient, for example, before breakfast, after breakfast, before lunch, after lunch, before dinner, after dinner The blood glucoselevel measuring device 5 is used to measure blood glucose level several times before going to bed and at midnight and 1 day.
Therefore, since the blood glucoselevel measuring device 5 can store, for example, 150 measurement data, for example, when the patient measures four times a day, the measurement data for about 36 days can be stored. Has been made.
By the way, the blood glucoselevel measuring device 5 is provided with an optical communication transmission / reception unit (not shown) at a position facing the optical communication transmission / reception unit 9A of the communication module 6 so that it can optically communicate with the communication module 6. Yes.
When the optical communication button 8A is pressed down by the user while the blood glucoselevel measuring device 5 is placed, the communication module 6 transmits the measurement data stored in the memory of the blood glucose level measuring device 5 to the optical communication transmitting / receiving unit. Via the optical communication transmitting / receiving unit 9A and receiving the measurement data by optical communication.
Then, thecommunication module 6 transmits the measurement data received from the blood sugar level measuring device 5 to the blood sugar level information processing device 2 via the optical communication transmitting / receiving unit 9B.
In addition, when the print button 8B is pressed down by the user while the blood glucoselevel measuring device 5 is placed, the communication module 6 is the same as when the optical communication button 8A is pressed down. Receive measurement data from.
Then, thecommunication module 6 transmits the measurement data to the printer 3 connected via a predetermined cable (not shown), so that the printer 3 prints the blood glucose level and the measurement date / time of the measurement data in the order from the oldest measurement date / time. It is made to be able to do.
(2) Circuit configuration of blood glucose level information processing apparatus
As shown in FIG. 2, the blood glucose levelinformation processing apparatus 2 includes a CPU (Central Processing Unit) 11, a ROM (Read Only Memory) 12, a RAM (Random Access Memory) 13, a hard disk drive 14, an LCD (Liquid Crystal Display), and the like. A display unit 15, an operation unit 16 including a mouse and a keyboard, an external connection interface unit 17, and a clock unit 18 for counting time are connected via a bus 19.
In this blood glucose levelinformation processing apparatus 2, the CPU 11 reads out a basic program stored in the ROM 12, develops it in the RAM 13, performs overall control according to the basic program, and executes various application programs stored in the ROM 12 or the hard disk drive 14. The data is expanded in the RAM 13 and various processes are executed according to the various application programs.
The blood glucose levelinformation processing apparatus 2 is connected to an optical communication module (not shown) via an RS232C cable connected to the external connection interface unit 17 and via a USB cable connected to the external connection interface unit 17. It is connected to the printer 3 (FIG. 1).
Therefore, when the optical communication button 8A of thecommunication module 6 is pressed by the user and the measurement data is transmitted from the blood glucose level measuring device 5 via the communication module 6, the blood glucose level information processing apparatus 2 causes the external connection interface unit 17 to be connected. And stored in the hard disk drive 14.
At this time, since it is assumed that the blood glucose levelinformation processing apparatus 2 receives measurement data from a large number of blood glucose level measuring devices 5, for example, measurement is performed in folders respectively associated with patient names provided in the hard disk drive 14. It is designed to store data.
(3) Blood glucose level information processing
When the blood glucose level information processing program is selected in response to an operation on theoperation unit 16 by the user (in this case, for example, a doctor), the CPU 11 reads the blood glucose level information processing program from the hard disk drive 14 and expands it in the RAM 13. Blood glucose level information processing is executed according to the blood glucose level information processing program.
When executing the blood sugar level information processing, theCPU 11 displays a start screen 20 on the display unit 15 as shown in FIG. The start screen 20 displays, for example, blood glucose level meter transmission guide illustrations 21 and 22 for guiding a transmission method for transmitting measurement data from two different types of blood glucose level measuring devices 5 and a log-in button 23 for logging into a doctor. Has been.
When thelogin button 23 on the start screen 20 is selected by, for example, a cursor (not shown) by the operation of the operation unit 16 by the doctor, the CPU 11 logs in the login screen 30 that requests the doctor to log in as shown in FIG. Is displayed on the display unit 15. The login screen 30 displays a user name input field 31 and a password input field 32 for inputting a user name and a password, a login button 33 for performing login, and a cancel button 34 for canceling login.
When the user name and password are input to the username input field 31 and the password input field 32 of the login screen 30 and the login button 33 is selected by the operation of the operation unit 16 by the doctor, the CPU 11 uses the registered use. It is determined whether or not the user name and password match, and if they match, the patient search screen 40 is displayed on the display unit 15 as shown in FIG.
Thepatient search screen 40 includes, for example, a patient search button 41 for selecting a mode for searching a specific patient from a patient database registered in advance in the hard disk drive 14 (hereinafter referred to as a search mode), and a new patient in the patient database. A patient registration button 42 for selecting a mode for registering (hereinafter referred to as a registration mode) and a mode-specific display area 43 are provided. In this patient database, a patient's name, kana, sex, patient ID, and the like are associated and registered.
When theCPU 11 displays the patient search screen 40 on the display unit 15, the patient search button 41 is selected as a default, and a patient name input field 44 and a patient ID input field 45 for inputting a patient name and a patient ID, and a search A search button 46 for executing the above, a patient list display field 47 for displaying a list of search results, a print button 48, and a graph display button 49 are displayed in the display area 43 for each mode.
Then, theCPU 11 inputs at least one of the patient name and the patient ID in the patient name input field 44 and the patient ID input field 45 by the operation of the doctor on the operation unit 16, and selects the search button 46.
At this time, theCPU 11 searches the patient name and patient ID input in the patient name input field 44 and the patient ID input field 45 from the patient database stored in the hard disk drive 14, and detects a matching patient name or patient ID. As shown in FIG. 6, the matched patient name, kana, sex and patient ID are read from the patient database and displayed in the patient list display column 47 as patient items 47a.
When theprint button 48 is selected in response to an operation on the operation unit 16 by the doctor while the patient item 47a is displayed in the patient list display column 47, the CPU 11 displays the patient list display column 47 in the external connection interface unit. The printer 3 (FIG. 1) is made to print via the printer 17.
Incidentally, when thepatient registration button 42 on the patient search screen 40 is selected via the operation unit 16, the CPU 11 can execute a registration mode to newly register a patient.
By the way, when thegraph display button 49 is selected after the patient item 47a in the patient list display field 47 is selected via the operation unit 16, the CPU 11 stores it in the folder corresponding to the patient name of the selected patient item 47a. The measured data is read from the hard disk drive 14.
Then, theCPU 11 compares the blood glucose level of the read measurement data with the measurement date / time of the blood glucose level and the time zone division table 60 as shown in FIG. Divide into
Here, in the time zone classification table 60, for example, the time zone classification is “before breakfast”, “after breakfast”, “before lunch”, “after lunch”, “before dinner”, “after dinner”, “before bedtime”, and “ It is divided into eight “midnight”.
In addition, the time zone classification table 60 allows the time zone division “before breakfast” to correspond to the measurement time “03:00 to 07:00” by inputting the set input time via theoperation unit 16. The category “after breakfast” corresponds to the measurement time “7:00 to 10:00”, the time zone category “before lunch” corresponds to the measurement time “10:00 to 12:00”, and the time zone category “after lunch” ”Corresponds to the measurement time“ 12:00 to 15:00 ”, the time zone classification“ before dinner ”corresponds to the measurement time“ 15:00 to 18:00 ”, and the time zone division“ after dinner ”is the measurement time. Corresponding to “18:00 to 21:00”, the time zone classification “before going to bed” corresponds to the measurement time “21:00 to 24:00”, and the time zone classification “midnight” is the measurement time “24:00 to 03:00 ”.
Therefore, when the measurement time based on the measurement date and time of the measurement data read from thehard disk drive 14 is, for example, “06:30”, the CPU 11 classifies the blood glucose level of the measurement data into the time zone classification “before breakfast” For example, when the measurement time of the measurement data is “14:20”, the blood glucose level of the measurement data is classified into the time zone classification “after lunch”.
In this way, when theCPU 11 reads out the measurement data stored in the folder corresponding to the patient name of the patient item 47a from the hard disk drive 14, the blood glucose level of all of the read out measurement data is divided into any time zone. .
Then, theCPU 11 generates a blood glucose level database that associates the blood glucose level of the measurement data and the time zone segmented with the measurement date and time, and stores the blood glucose level database in a folder corresponding to the patient name of the hard disk drive 14, for example. A graph display screen 70 as shown in FIG. 8 is displayed on the display unit 15.
Thegraph display screen 70 includes a menu bar 71 on which menu items that can be executed are displayed, a patient information column 72 for displaying patient information, a standby button 73 for shifting to a standby mode, a logoff button 74 for logging off, and a graph type. A graph type selection button display area 75 for displaying a plurality of buttons for selecting a graph, a graph type selection button display area 76, and a graph display area 77 for displaying a graph.
In thepatient information column 72, the name and patient ID of the selected patient are displayed in the patient name display column 72A and the patient ID display column 72B, respectively. A patient detail button 72C and a new button are displayed on the right side of the patient ID display column 72B. 72D and a search button 72E are provided.
When thepatient detail button 72C in the patient information column 72 is selected via the operation unit 16, the CPU 11 displays the patient detailed information.
TheCPU 11 can register a new patient when the new button 72D in the patient information column 72 is selected via the operation unit 16.
Further, when thepatient search button 72E in the patient information column 72 is selected via the operation unit 16, the CPU 11 displays the patient search screen (FIG. 5) and can search for a patient again.
The graph type selection button display area 75 is provided with atrend button 75A, a period average button 75B, a 24h trend button 75C, a ratio button 75D, a My graph button 75E, and a blood glucose level note button 75F, and any one of them is selected. The trend button 75A is selected by default.
In the graph type selectionbutton display area 76, a graph type corresponding to each of the trend button 75A, the period average button 75B, the 24h trend button 75C, the ratio button 75D, and the My graph button 75E of the graph type selection button display area 75 is selected. A plurality of buttons are displayed, and when the trend button 75A is selected, an all time button 76A and a time zone button 76B are displayed. Incidentally, the all time button 76A is selected by default.
The graph display area 77 includes buttons selected in the graph type selection button display area 75 (atrend button 75A, a period average button 75B, a 24h trend button 75C, a ratio button 75D, a My graph button 75E, and a blood glucose level note button 75F). ) And a graph corresponding to the button selected in the graph type selection button display area 76 (in this case, the all time button 76A or the time zone button 76B) and various information related to the graph are displayed. Has been made.
In the graph display area 77, when thetrend button 75A and the all time button 76A are selected, a line graph 81 is displayed, a period information display area 82, a blood glucose level information display area 83, a time zone classification selection check. A box 84, a legend display area 85, a comparison button 86, and a print button 87 are provided.
Here, in the time zone categoryselection check box 84, “before morning” corresponds to the time zone category “before breakfast”, “after morning” corresponds to the time zone category “after breakfast”, and “before noon” is the time zone category. Corresponds to “before lunch”, “after lunch” corresponds to the time zone “after lunch”, “before night” corresponds to the time zone “before dinner”, “after night” corresponds to the time zone “dinner” Corresponding to “after”, “before sleeping” corresponds to the time zone classification “before going to bed”, and “midnight” corresponds to the time zone classification “midnight”.
TheCPU 11 displays the date corresponding to the range of “1 month” displayed in the range selection menu 82A of the period information display area 82 with the current date acquired from the clock unit 18 as a reference, and a start date display field 82B and an end date display. Displayed in the column 82C. This range selection menu 82A is a pull-down menu so that a doctor can select a range, and for example, “1 month”, “2 months”, “3 months”, and “6 months” can be selected. As a default, “1 month” is selected and displayed.
At the same time, theCPU 11 reads the blood glucose level database corresponding to the patient name displayed in the patient name display field 72A from the hard disk drive 14, and starts the start date displayed in the start date display field 82B and the end date display field 82C based on the measurement date and time. Blood glucose level in the range from the date to the end date, and the time zone division (in this case, “before breakfast”, “after breakfast”, “after dinner”, and “late night”) checked in the time zone selection checkbox 84 Only extract from the blood glucose database.
Then, theCPU 11 plots the extracted blood glucose level with the symbols for each time zone along the time series, and generates a line graph 81 by connecting the symbols that precede and follow each other with a straight line.
Here, in theline graph 81, the horizontal axis is the date, and the vertical axis is the blood glucose level (mg / dl). The line graph 81 is divided into a plurality of regions according to the blood glucose level. For example, a region in which the blood glucose level is 0 to 59 [mg / dl] that is hypoglycemic is a green hypoglycemic region 81A, a blood glucose level, and the like. A normal region having a value of 60 to 109 [mg / dl] is, for example, a white normal region 81B, and a region between normal and hyperglycemia having a blood glucose level of 110 to 125 [mg / dl] is, for example, a yellow false positive The region 81C and the region considered to be hyperglycemia with a blood glucose level of 126 to 400 [mg / dl] are defined as, for example, a pink hyperglycemia region 81D.
Theline graph 81 has a so-called gradation display in which the color scheme near the boundaries of the hypoglycemia region 81A, normal region 81B, false positive region 81C, and hyperglycemia region 81D is gradually changed from one color to the other. .
Furthermore, in theline graph 81, when the plotted blood glucose level is 0 to 59 [mg / dl] and 126 [mg / dl] or more as shown in the legend display area 85, the plotted blood glucose level is By highlighting the symbol, it is possible for the doctor to easily visually check.
Further, theCPU 11 calculates the average value, standard deviation value, maximum value, minimum value, and number of data of the blood sugar level extracted from the blood sugar level database, and calculates the average value, standard deviation value, maximum value, minimum value, and number of data, respectively. Displayed in the average value display field 83A, the standard deviation value display field 83B, the maximum value display field 83C, the minimum value display field 83D, and the measurement frequency display field 83E of the blood glucose level information display area 83.
Incidentally, theline graph 81 is provided with a slide bar 88 for moving a reference (in this case, a reference date) below the line graph 81.
As shown in FIG. 9, when theslide bar 88 is moved via the operation unit 16, the CPU 11 is configured to go back the reference date according to the amount of movement of the slide bar 88, and the reference date that goes back. Only the blood glucose level for the previous month is extracted from the blood glucose level database again, and the blood glucose level is plotted again on the line graph 81 with symbols for each time zone along the time series.
At this time, theCPU 11 displays the retroactive reference date in the end date display column 82C, and displays the date one month before the reference date in the start date display column 82B. The CPU 11 again calculates the average value, standard deviation value, maximum value, minimum value, and number of data of the blood glucose level extracted again from the blood glucose level database, and calculates the average value, standard deviation value, maximum value, minimum value, and data. The numbers are displayed in the average value display field 83A, the standard deviation value display field 83B, the maximum value display field 83C, the minimum value display field 83D, and the measurement frequency display field 83E of the blood sugar level information display area 83, respectively.
Thus, when theslide bar 88 is moved, the blood glucose level information processing apparatus 2 can change only the date while fixing the range plotted on the line graph 81.
Incidentally, theCPU 11 changes the horizontal axis of the line graph 81 from one month to three months when, for example, “three months” of the range selection menu 82A in the period information display area 82 is selected via the operation unit 16. Blood glucose levels for three months are plotted on a line graph 81 with symbols for each time zone along a time series.
By the way, when thecomparison button 86 on the graph display screen 70 is selected via the operation unit 16, the CPU 11 adds period information to the graph display area 77 as shown in FIG. Display area 82, blood glucose level information display area 83, time zone classification selection check box 84, legend display area 85, line graph 91 obtained by reducing the line graph 81 in the vertical direction, line graph 92, comparison period information display area 93, comparative blood glucose A graph display screen 90 provided with a value information display area 94, a comparison release button 95 and a print button 87 is displayed on the display unit 15.
Specifically, theCPU 11 displays “1 month” which is the same as the range selection menu 82A in the period selection menu 93A of the comparison period information display area 93, and immediately before the start date displayed in the start date display field 82B. The comparison start date and the comparison end date corresponding to the range of “1 month” are displayed in the comparison start date display column 93B and the comparison end date display column 93C, respectively.
Further, theCPU 11 extracts the blood glucose level from the comparison start date displayed in the comparison start date display column 93B and the comparison end date display column 93C from the blood glucose level database read from the hard disk drive 14 to the comparison end date based on the measurement date. In addition, only the blood glucose levels of the time zone divisions checked in the time zone division selection check box 84 (in this case, “before breakfast”, “after breakfast”, “after dinner”, and “late night”) are arranged along the time series. A line graph 92 is generated by plotting the symbols for each time zone segment and connecting the symbols that precede and follow each other with a straight line.
TheCPU 11 displays the line graphs 91 and 92 in the graph display area 77 so as to be arranged vertically.
Further, theCPU 11 calculates the average value, standard deviation value, maximum value, minimum value, and number of data of blood glucose values plotted on the line graph 92, and calculates the average value, standard deviation value, maximum value, minimum value, and number of data, respectively. In the comparative blood glucose level information display area 94, the average value display field 94A, the standard deviation value display field 94B, the maximum value display field 94C, the minimum value display field 94D, and the measurement frequency display field 94E are displayed.
In addition, when theslide bar 96 provided below the line graph 91 is moved through the operation unit 16, the CPU 11 goes back the reference date according to the amount of movement of the slide bar 96. Only the blood glucose level for one month until the reference date is re-plotted on the line graph 91 with the symbols for each time zone along the time series, and the line graph 92 is also the same number of days as the all-time line graph 91. It is designed to re-plot only going back.
Furthermore, even when theslide bar 97 provided below the line graph 92 is moved through the operation unit 16, the CPU 11 is configured to go back the reference date according to the amount of movement of the slide bar 97. Re-plot only the blood glucose level for one month until the reference date going back to the line graph 92 with the symbols for each time zone along the time series, and the line graph 91 is also the same number of days as the line graph 92. It is made to re-plot as going back.
Further, when the comparison cancelbutton 95 on the graph display screen 90 is selected and operated via the operation unit 16, the CPU 11 displays the graph display screen 70 (FIG. 8) on the display unit 15 again.
By the way, for example, when thetime zone button 76B of the graph type selection button display area 76 in the graph display screen 70 (FIG. 8) is selected and operated via the operation unit 16, the CPU 11 assigns the same reference numerals to the corresponding parts in FIG. As shown in FIG. 11, a graph display screen 100 in which a line graph 101 is displayed in the graph display area 77 is displayed on the display unit 15.
At this time, theCPU 11 extracts the blood glucose level from the start date to the end date displayed in the start date display column 82B and the end date display column 82C from the blood glucose level database read from the hard disk drive 14, and further. Only the blood glucose level of the time zone category checked in the time zone category selection check box 84 (in this case, “before breakfast”, “after breakfast”, “after dinner”, and “late night”) is linear for each symbol of the time zone category. The graph display screen 100 is generated by plotting as shown in FIG.
Further, when theslide bar 88 provided below the line graph 101 is moved and operated via the operation unit 16 of the doctor, the CPU 11 goes back the reference date according to the moving amount of the slide bar 88. Only the blood glucose level for one month until the reference date that goes back is re-plotted on the line graph 101 so as to be connected by a straight line for each symbol of the time zone.
Further, when thecomparison button 86 on the graph display screen 100 is selected and operated via the operation unit 16, the CPU 11 displays the graph display screen 90 when the comparison button 86 on the graph display screen 70 described above is selected and operated. Similarly, the line graph 101 is reduced in the vertical direction on the upper side of the graph display area 77, and a line graph (not shown) in the same range as the line graph 101 and the previous period is displayed in the graph display area 77. Display on the bottom.
By the way, for example, when the periodaverage button 75B of the graph type selection button display area 75 in the graph display screen 70 (FIG. 8) is selected and operated via the operation unit 16, the CPU 11 attaches the same reference numerals to the corresponding parts in FIG. As shown in FIG. 12, the graph display screen 110 is displayed on the display unit 15.
In thegraph display screen 110, a monthly average button 76C and a weekly average button 76D are displayed in the graph type selection button display area 76, and a period information display area 82, a blood glucose level information display area 83, and a time zone classification selection are displayed in the graph display area 77. A check box 84, a legend display area 85, an average graph 111, a blood glucose level information table 112, and an additional check box column 113 are provided. In this case, the range selection menu 82A is configured to select, for example, “12 months”, “24 months”, and “36 months”, and “12 months” is selected and displayed as a default.
When theCPU 11 displays the graph display screen 110 on the display unit 15, it is the period displayed in the start date display field 82 </ b> B and the end date display field 82 </ b> C and the time period classification checked in the time period classification selection check box 84 (this In this case, blood glucose levels of “before breakfast”, “after breakfast”, “after dinner”, and “midnight”) are extracted from the blood glucose beta base on a monthly basis based on the measurement date and time.
Then, theCPU 11 calculates the average value, standard deviation value, maximum value, minimum value, number of data, and number of times of hypoglycemia (0 to 59 [mg / dl]) for each extracted blood glucose level.
Further, theCPU 11 displays an average graph 111 in which the calculated average value and standard deviation value for twelve months are indicated by a horizontal line and a vertical bar, respectively, in the graph display area 77, and calculates the average value of the calculated blood glucose level for each month, The standard deviation value (SD), the maximum value, the minimum value, the number of data (N number), and the number of hypoglycemia are displayed in the blood glucose level information table 112.
Incidentally, when thecomparison button 86 on the graph display screen 110 is selected and operated via the operation unit 16, the CPU 11 displays the graph display screen 90 when the comparison button 86 on the graph display screen 70 described above is selected and operated. Similarly to the above, the average graph 111 is vertically reduced and displayed on the upper side of the graph display area 77, and an average graph (not shown) in the same period and the previous period is displayed in the graph display area 77. Display on the bottom.
When the SD broken line display check box A in the additionalcheck box column 113 on the graph display screen 110 is selected and operated via the operation unit 16, the CPU 11 adds the same reference numerals to the corresponding parts in FIG. In addition, a graph display screen 120 on which a standard deviation line graph 122 in which standard deviation values for each month are connected with a straight line is displayed between the average graph 121 obtained by reducing the average graph 111 in the vertical direction and the blood glucose level information table 112 is displayed. To do.
Further, when the reference testvalue check box 113B in the additional check box column 113 on the graph display screen 110 is selected and operated via the operation unit 16, the CPU 11 selects, for example, the monthly HbA1c value registered in the patient database or the like in advance. It can be displayed as a line graph.
Incidentally, when thecomparison button 86 on the graph display screen 120 is selected and operated through the operation unit 16, the CPU 11 displays the graph display screen 90 when the comparison button 86 on the graph display screen 70 described above is selected and operated. Similarly, the average graph 111 and the standard deviation line graph 122 are vertically reduced on the upper side of the graph display area 77, and the average graph of the immediately preceding period is within the same range as the average graph 111 and the standard deviation line graph 122. A standard deviation line graph (not shown) is displayed below the graph display area 77.
On the other hand, when the weeklyaverage button 76D of the graph type selection button display area 76 on the graph display screen 110 (FIG. 12) is selected and operated via the operation unit 16, the CPU 11 attaches the same reference numeral to the corresponding part to FIG. The graph display screen 130 as shown in FIG. 14 is displayed on the display unit 15.
In this case, on thegraph display screen 130, the range selection menu 82A can select, for example, “12 weeks”, “24 weeks”, and “36 weeks”, and “12 weeks” is selected and displayed as a default. Yes.
When displaying thegraph display screen 130 on the display unit 15, the CPU 11 is a period displayed in the start date display field 82 </ b> B and the end date display field 82 </ b> C and the time period class checked in the time period class selection check box 84 (this In this case, blood glucose levels of “before breakfast”, “after breakfast”, “after dinner”, and “late night”) are extracted from the blood glucose beta base on a weekly basis based on the measurement date and time.
Then, theCPU 11 calculates the average value, standard deviation value, maximum value, minimum value, number of data, and number of times of hypoglycemia (0 to 59 [mg / dl]) for each extracted blood glucose level.
In addition, theCPU 11 displays an average graph 131 in which the calculated average value and standard deviation value for 12 weeks are indicated by a horizontal line and a vertical bar in the graph display area 77, and the calculated average value and standard value of the blood glucose level for each week. The deviation value, the maximum value, the minimum value, the number of data, and the number of hypoglycemia are displayed in the blood glucose level information table 132.
Incidentally, when thecomparison button 86 on the graph display screen 130 is selected and operated via the operation unit 16, the CPU 11 displays the graph display screen 90 when the comparison button 86 on the graph display screen 70 described above is selected and operated. In the same manner as above, the average graph 131 is vertically reduced and displayed on the upper side of the graph display area 77, and an average graph (not shown) in the same period and the previous period is displayed in the graph display area 77. Display on the bottom.
When the SD broken linedisplay check box 113A in the additional check box column 113 on the graph display screen 130 is selected and operated via the operation unit 16, the CPU 11 adds the same reference numerals to the corresponding parts in FIG. In addition, a graph display screen 140 on which a standard deviation line graph 142 in which standard deviation values for each week are connected with a straight line between the average graph 141 obtained by reducing the average graph 131 in the vertical direction and the blood glucose level information table 132 is displayed. To do.
Incidentally, when thecomparison button 86 on the graph display screen 140 is selected and operated through the operation unit 16, the CPU 11 displays the graph display screen 90 when the comparison button 86 on the graph display screen 70 described above is selected and operated. In the same manner as above, the average graph 141 and the standard deviation line graph 142 are vertically reduced on the upper side of the graph display area 77, and the same graph as the average graph 141 and the standard deviation line graph 142 and the average graph of the immediately preceding period are displayed. A standard deviation line graph (not shown) is displayed below the graph display area 77.
By the way, for example, when the24h trend button 75C of the graph type selection button display area 75 in the graph display screen 70 (FIG. 8) is selected and operated via the operation unit 16, the CPU 11 attaches the same reference numerals to those corresponding to FIG. As shown in FIG. 16, the graph display screen 150 is displayed on the display unit 15.
In thegraph display screen 150, an all time button 76A and a time zone button 76B are displayed in the graph type selection button display area 76, and a period information display area 82, a blood glucose level information display area 83, and a legend display area are displayed in the graph display area 77. 85, a comparison button 86, a print button 87, an average graph 151, a blood glucose level information table 152, and a check box field 153 are provided.
In thisgraph display screen 150, the range selection menu 82A can select, for example, “1 month”, “2 months”, “3 months”, and “6 months”, and selects “1 month” as a default. it's shown.
In thecheck box column 153, an SD bar display check box 153A, an average value check box 153B, and a plot check box 153C are provided, and the average value check box 153B is checked as a default.
When theCPU 11 displays the graph display screen 150 on the display unit 15, the blood glucose level of the period displayed in the start date display field 82 </ b> B and the end date display field 82 </ b> C is measured every hour based on the measurement date and time from the blood sugar level beta base. Extraction is performed, and the average value, standard deviation value, maximum value, minimum value, number of data, and number of hypoglycemia of the extracted blood glucose level for each hour are calculated.
And CPU11 displays theaverage graph 151 which showed the calculated average value and standard deviation value for every hour by the horizontal line and the vertical bar in the graph display area 77, respectively, and calculated the average value of the blood glucose level for every hour, The standard deviation value, the maximum value, the minimum value, the number of data, and the number of hypoglycemia are displayed in the blood glucose level information table 152.
Incidentally, when thecomparison button 86 on the graph display screen 150 is selected and operated through the operation unit 16, the CPU 11 displays the graph display screen 90 when the comparison button 86 on the graph display screen 70 described above is selected and operated. Similarly to the above, the average graph 151 is vertically reduced and displayed on the upper side of the graph display region 77, and an average graph (not shown) in the same period and the previous period is displayed in the graph display region 77. Display on the bottom.
On the other hand, when the SD bardisplay check box 153A in the check box field 153 on the graph display screen 150 is selected and operated via the operation unit 16, the CPU 11 shows the corresponding parts in FIG. As described above, the graph display screen 160 in which the bar graph 162 showing the standard deviation value for each hour in a bar shape is displayed between the average graph 161 obtained by reducing the average graph 151 in the vertical direction and the blood glucose level information table 152. .
Incidentally, when thecomparison button 86 on the graph display screen 160 is selected and operated through the operation unit 16, the CPU 11 displays the graph display screen 90 when the comparison button 86 on the graph display screen 70 described above is selected and operated. In the same manner, the average graph 161 and the bar graph 162 are vertically reduced and displayed on the upper side of the graph display area 77, and the same range as the average graph 161 and the bar graph 162 and the average graph and bar graph of the immediately preceding period (not shown). ) Is displayed below the graph display area 77.
By the way, when theplot check box 153C in the check box column 153 on the graph display screen 150 (FIG. 16) is selected and operated via the operation unit 16, the CPU 11 adds the same reference numerals to the corresponding parts in FIG. A graph display screen 170 as shown is displayed. At this time, the CPU 11 checks the plot check box 153C in the check box column 153 and unchecks the average value check box 153B. Although the blood glucose levels used in FIGS. 16 and 18 are actually the same, for convenience of explanation, different blood glucose levels are used in FIGS. 16 and 18, and the average graph 151 in FIG. 16 and the plot graph in FIG. The values of 171 and the blood glucose level information table 152 are only examples.
Further, theCPU 11 displays a plot graph 171 in which all the extracted blood glucose levels for one month are divided and plotted every hour in the graph display area 77 of the graph display screen 170.
In theplot graph 171, the plotted blood glucose level is plotted when the blood glucose level is 0 to 59 [mg / dl] and 126 [mg / dl] or more as shown in the legend display area 85. By highlighting the plot point of the blood glucose level, the doctor can easily make a visual check.
Incidentally, when thecomparison button 86 on the graph display screen 170 is selected and operated through the operation unit 16, the CPU 11 displays the graph display screen 90 when the comparison button 86 on the graph display screen 70 described above is selected and operated. In the same manner as described above, the plot graph 171 is vertically reduced and displayed on the upper side of the graph display region 77, and a plot graph (not shown) in the same range as the plot graph 171 and the previous period is displayed in the graph display region 77. Display on the bottom.
On the other hand, when the SD bardisplay check box 153A in the check box field 153 on the graph display screen 170 is selected and operated via the operation unit 16, the CPU 11 is a diagram in which the same reference numerals are assigned to the corresponding parts in FIGS. 19, a graph display screen 180 in which a bar graph 162 showing a standard deviation value for each hour in a bar shape is displayed between a plot graph 181 obtained by reducing the plot graph 171 in the vertical direction and the blood glucose level information table 152. Is displayed.
Incidentally, when thecomparison button 86 on the graph display screen 180 is selected and operated through the operation unit 16, the CPU 11 displays the graph display screen 90 when the comparison button 86 on the graph display screen 70 described above is selected and operated. Similarly, the plot graph 181 and the bar graph 162 are vertically reduced and displayed on the upper side of the graph display area 77, and the plot graph and the bar graph (not shown) in the same range as the plot graph 181 and the bar graph 162 in the immediately preceding period are not shown. ) Is displayed below the graph display area 77.
By the way, for example, when thetime zone button 76B in the graph type selection button display area 76 on the graph display screen 150 (FIG. 16) is selected and operated via the operation unit 16, the CPU 11 assigns the same reference numerals to those corresponding to FIG. A graph display screen 190 as shown in FIG. 20 is displayed on the display unit 15.
When theCPU 11 displays the graph display screen 190 on the display unit 15, the period displayed in the start date display field 82B and the end date display field 82C corresponding to “one month” displayed by default in the range selection menu 82A. The blood glucose level is extracted from the blood glucose level beta base for each time zone based on the measurement date and time.
Then, theCPU 11 calculates the average value, the standard deviation value, the maximum value, the minimum value, the number of data, and the number of hypoglycemia for each extracted time zone segment.
In addition, theCPU 11 displays an average graph 191 in which the calculated average value and standard deviation value for each time zone segment are indicated by a horizontal line and a vertical bar in the graph display area 77, and the average blood glucose level for each calculated time zone segment. The value, the standard deviation value, the maximum value, the minimum value, the number of data, and the number of hypoglycemia are displayed in the blood glucose level information table 192.
Incidentally, when thecomparison button 86 on the graph display screen 190 is selected and operated via the operation unit 16, the CPU 11 displays the graph display screen 90 when the comparison button 86 on the graph display screen 70 described above is selected and operated. Similarly to the above, the average graph 191 is reduced in the vertical direction on the upper side of the graph display area 77, and an average graph (not shown) in the previous period within the same range as the average graph 191 is displayed in the graph display area 77. Display on the bottom.
When the SD bardisplay check box 153A in the check box field 153 on the graph display screen 190 is selected and operated via the operation unit 16, the CPU 11 assigns the same reference numerals to the corresponding parts in FIG. Then, a graph display screen 200 on which a bar graph 202 showing the standard deviation values for each time zone in a bar shape is displayed between the average graph 201 obtained by reducing the average graph 191 in the vertical direction and the blood glucose level information table 192.
Incidentally, when thecomparison button 86 on the graph display screen 200 is selected and operated via the operation unit 16, the CPU 11 displays the graph display screen 90 when the comparison button 86 on the graph display screen 70 described above is selected and operated. Similarly, the average graph 201 and the bar graph 202 are vertically reduced and displayed on the upper side of the graph display area 77, and the average graph and the bar graph (not shown) in the same range as the average graph 201 and the bar graph 202 in the immediately preceding period are shown. ) Is displayed below the graph display area 77.
On the other hand, when theplot check box 153C in the check box field 153 on the graph display screen 190 (FIG. 20) is selected and operated via the operation unit 16, the CPU 11 adds the same reference numerals to those corresponding to FIG. A graph display screen 210 as shown in FIG. At this time, the CPU 11 checks the plot check box 153C in the check box column 153 and unchecks the average value check box 153B. Although the blood glucose levels used in FIGS. 20 and 22 are actually the same, for convenience of explanation, different blood glucose levels are used in FIGS. 20 and 22, and the average graph 191 in FIG. 20 and the plot graph in FIG. 211 and the values in the blood glucose level information table 192 are merely examples.
Further, theCPU 11 displays a plot graph 211 in which the extracted blood glucose level for one month is divided and plotted for each time zone in the graph display area 77 of the graph display screen 210.
In theplot graph 211, the plotted blood glucose level is plotted when the blood glucose level is 0 to 59 [mg / dl] and 126 [mg / dl] or more as shown in the legend display area 85. By highlighting the blood glucose level / lot point, the doctor can easily visually check.
Incidentally, when thecomparison button 86 on the graph display screen 210 is selected and operated through the operation unit 16, the CPU 11 displays the graph display screen 90 when the comparison button 86 on the graph display screen 70 described above is selected and operated. Similarly to the graph display area 77, the plot graph 211 is vertically reduced and displayed on the upper side of the graph display area 77, and a plot graph (not shown) in the same range as the plot graph 211 and in the immediately preceding period is displayed in the graph display area 77. Display on the bottom.
When the SD bardisplay check box 153A in the check box field 153 on the graph display screen 210 is selected and operated through the operation unit 16, the CPU 11 adds the same reference numerals to the corresponding parts in FIG. 21 and FIG. As shown, a graph display screen 220 in which a bar graph 202 showing a standard deviation value for each time zone section in a bar shape is displayed between a plot graph 221 obtained by reducing the plot graph 211 in the vertical direction and the blood glucose level information table 192. indicate.
Incidentally, when thecomparison button 86 on the graph display screen 220 is selected and operated through the operation unit 16, the CPU 11 displays the graph display screen 90 when the comparison button 86 on the graph display screen 70 described above is selected and operated. Similarly, the plot graph 221 and the bar graph 202 are vertically reduced on the upper side of the graph display area 77, and the plot graph and bar graph (not shown) in the same range as the plot graph 221 and the bar graph 202 in the immediately preceding period are shown. ) Is displayed below the graph display area 77.
By the way, for example, when theratio button 75D of the graph type selection button display area 75 in the graph display screen 70 (FIG. 8) is selected and operated via the operation unit 16, the CPU 11 attaches the same reference numerals to the corresponding parts in FIG. As shown in FIG. 24, a graph display screen 230 is displayed on the display unit 15.
In thisgraph display screen 230, a pie chart button by time zone 76E, a stacked bar graph month button 76F and a stacked bar graph week button 76G are displayed in the graph type selection button display area 76, and the pie chart button by time zone 76E is selected and displayed as a default. Has been. In this case, on the graph display screen 230, two pie graphs 231 and 232 are displayed side by side in the graph display area 77.
Further, therange selection menu 82A is configured to select, for example, “1 month”, “2 months”, “3 months”, and “6 months”, and “1 month” is selected and displayed as a default.
When theCPU 11 displays the graph display screen 230 on the display unit 15, the time period segment (this period displayed in the start date display field 82 B and the end date display field 82 C and the time period classification check box 233 is checked) In this case, blood glucose levels of “before breakfast”, “before lunch”, “before dinner”, and “before bedtime”) are extracted from the blood glucose level beta base based on the measurement date and time zone classification.
Then, theCPU 11 calculates the average value, standard deviation value, maximum value, minimum value, and number of data of the extracted blood glucose levels, and the blood glucose level with respect to the data number of the extracted blood glucose levels is 0 to 59, 60 to 109, 110. Calculate the ratio of the number of data to be ~ 125 and 126 or more.
Further, theCPU 11 displays the average value, standard deviation value, maximum value, minimum value, and number of data of the blood glucose level for each calculated time zone section in the blood glucose level information table 234, and shows the calculated blood glucose level ratio in the pie chart 231. Display as.
In addition, theCPU 11 determines the time zone classification (in this case, “after breakfast”, “after lunch”, which is the period displayed in the start date display column 82B and the end date display column 82C and checked in the time zone category selection check box 235. The blood glucose level of “after dinner” and “late night”) is extracted from the blood glucose level beta base based on the measurement date and time zone classification.
Then, theCPU 11 calculates the average value, standard deviation value, maximum value, minimum value, and number of data of the extracted blood glucose levels, and the blood glucose level with respect to the data number of the extracted blood glucose levels is 0 to 59, 60 to 109, 110. Calculate the ratio of the number of data to be ~ 125 and 126 or more.
In addition, theCPU 11 displays the average value, standard deviation value, maximum value, minimum value, and number of data of the blood glucose level for each calculated time zone section in the blood glucose level information table 236 and the calculated blood glucose level ratio in the pie chart 232. Display as.
Incidentally, when thecomparison button 85 on the graph display screen 230 is selected and operated through the operation unit 16, the CPU 11 displays the graph display screen 90 when the comparison button 86 on the graph display screen 70 described above is selected and operated. Similarly, the pie chart 231 and the pie chart 232 are reduced on the upper side of the graph display area 77, and the same range as the pie chart 231 and the pie chart 232 reduced on the lower side of the graph display area 77 A period pie chart (not shown) is displayed.
On the other hand, when the stacked bar graph month button 76F in the graph type selectionbutton display area 76 on the graph display screen 230 is selected and operated via the operation unit 16, the CPU 11 corresponds to FIG. A graph display screen 240 as shown in FIG.
When displaying thegraph display screen 240 on the display unit 15, the CPU 11 is a period displayed in the start date display field 82 </ b> B and the end date display field 82 </ b> C and the time period class checked in the time period class selection check box 84 (this In this case, blood glucose levels of “before breakfast”, “after breakfast”, “after dinner”, and “late night”) are extracted from the blood glucose beta base based on the measurement date and time zone classification.
Then, theCPU 11 calculates the average value, standard deviation value, maximum value, minimum value, and number of data of the extracted blood sugar levels, respectively, and the blood sugar level relative to the number of monthly data of the extracted blood sugar levels is 0 to 59, 60 to The ratios of the data numbers 109, 110 to 125, and 126 or more are calculated.
Then, theCPU 11 displays the average value, standard deviation value, maximum value, minimum value, and number of data of the calculated blood glucose level in the blood glucose level information display area 83, and displays the calculated ratio of the blood glucose level for each month as a bar graph 241. To do.
Incidentally, when thecomparison button 86 on the graph display screen 240 is selected and operated through the operation unit 16, the CPU 11 displays the graph display screen 90 when the comparison button 86 on the graph display screen 70 described above is selected and operated. Similarly, the bar graph 241 is vertically reduced and displayed on the upper side of the graph display area 77, and a bar graph (not shown) in the same range as the bar graph 241 and the immediately preceding period is displayed on the lower side of the graph display area 77. indicate.
On the other hand, when the stacked bargraph week button 76G in the graph type selection button display area 76 on the graph display screen 230 (FIG. 24) is selected and operated via the operation unit 16, the CPU 11 assigns the same reference numerals to the corresponding parts in FIG. The attached graph display screen 250 as shown in FIG. 26 is displayed on the display unit 15.
When theCPU 11 displays the graph display screen 250 on the display unit 15, the period displayed in the start date display column 82B and the end date display column 82C corresponding to “12 weeks” displayed by default in the range selection menu 82A. And the time zone classification checked in the time zone category selection check box 84 (in this case, “before breakfast”, “after breakfast”, “after dinner”, and “late night”) Extract based on time zone classification.
Then, theCPU 11 calculates the average value, standard deviation value, maximum value, minimum value, and number of data of the extracted blood sugar levels, respectively, and the blood sugar level with respect to the number of weekly data of the extracted blood sugar level is 0 to 59, 60 to The ratios of the data numbers 109, 110 to 125, and 126 or more are calculated.
Then, theCPU 11 displays the average value, standard deviation value, maximum value, minimum value, and number of data of the calculated blood glucose level in the blood glucose level information display area 83, and displays the calculated ratio of the blood glucose level for each week as a bar graph 251. To do.
Incidentally, when thecomparison button 86 on the graph display screen 250 is selected and operated via the operation unit 16, the CPU 11 displays the graph display screen 90 when the comparison button 86 on the graph display screen 70 described above is selected and operated. Similarly, the bar graph 251 is reduced in the vertical direction above the graph display area 77, and a bar graph (not shown) in the same range as the bar graph 251 and the immediately preceding period is displayed below the graph display area 77. indicate.
By the way, for example, when the Mygraph button 75E in the graph type selection button display area 75 in the graph display screen 70 (FIG. 8) is selected and operated via the operation unit 16, the CPU 11 attaches the same reference numerals to the corresponding parts in FIG. As shown in FIG. 27, a graph display screen 260 is displayed on the display unit 15.
Here, thegraph display screen 260 can display an arbitrary graph. For example, a line graph 261 corresponding to the line graph 81 in FIG. 8 and an average graph 262 corresponding to the average graph 111 in FIG. 12 are displayed. Displayed in the graph display area 77.
For example, when the blood glucoselevel note button 75F in the graph type selection button display area 75 in the graph display screen 70 (FIG. 8) is selected and operated via the operation unit 16, the CPU 11 attaches the same reference numerals to the corresponding parts in FIG. As shown in FIG. 28, a blood glucose level list 271 in which the blood glucose levels recorded in the blood glucose level beta base are listed together with the measurement time is displayed on the blood glucose level note display screen 270.
That is, in the blood sugar level list 271, blood sugar levels are arranged in a matrix with measurement times, with the vertical axis representing the date and the horizontal axis representing the time zone. In this blood glucose level list 271, when the blood glucose level is 0 to 59 [mg / dl] and when it is 126 [mg / dl] or more, the blood glucose level is highlighted.
By the way, the blood glucose level is measured by the patient himself / herself before and after a meal, for example, at home or at the office by using the blood glucose level measuring device 5 (FIG. 1). Moreover, a patient does not necessarily have a meal according to the set time zone division. Therefore, when theCPU 11 divides the blood glucose level into the corresponding time zone segments based on the measurement time of the measurement data measured by the blood glucose level measuring device 5, the CPU 11 divides the blood glucose level into a different time zone segment and generates a blood glucose level database. It is possible that Moreover, since the date and time are set by the patient at the time of initial setting, for example, the blood glucose level measuring device 5 may be set to an incorrect date and time.
Therefore, in the blood sugar levelinformation processing apparatus 2, the blood sugar level database generated by the CPU 11 can be corrected by the judgment of the doctor.
Specifically, as shown in FIG. 29A in which the blood glucoselevel list portion 271A which is a part of FIG. 28 is displayed, the CPU 11 selects (clicks) any blood glucose level in the blood glucose level list 271 with the cursor Cu. ), The blood glucose level and the corresponding measurement time are surrounded by a selection frame FR, and a doctor is visually confirmed that an arbitrary blood glucose level has been selected.
When theCPU 11 recognizes that the blood sugar level enclosed by the selection frame FR is selected and is determined by double-clicking the mouse of the operation unit 16, for example, as shown in FIG. A value and measurement time are displayed in reverse video, and a time zone classification change pop-up menu 300 is displayed on the blood glucose level list 271 directly below the blood glucose level.
The time zone classification change pop-upmenu 300 includes a measurement date display field 301 that displays the measurement date of the determined blood sugar level, a measurement time display field 302 that displays the measurement time of the blood sugar level, and a blood glucose that displays the blood sugar level. Value display field 303, Left button 304 for moving the blood glucose level time zone to the previous time zone, Right for moving the blood glucose time zone to the next time zone A button 305, a delete button 306, a cancel button 307, and a confirm button 308 are provided.
When theCPU 11 recognizes that the left button 304 of the time zone division change pop-up menu 300 is selected via the cursor Cu as shown in FIG. 29C, the CPU 11 selects as shown in FIG. 29D. The displayed blood glucose level is moved to the left time zone, that is, the previous time zone. At this time, the CPU 11 allows the doctor to easily find the blood glucose level with the changed time zone segment by setting the blood glucose level to which the time zone segment has been moved in the selection state surrounded by the selection frame FR. .
When theCPU 11 recognizes that the right button 305 of the time zone change pop-up menu 300 is selected via the cursor Cu, the CPU 11 sets the selected blood glucose level to the right time zone, that is, the next time zone. Move to display.
Further, when theCPU 11 recognizes that the confirmation button 308 has been selected via the cursor Cu after the measurement date display field 301 formed by the pull-down menu of the time zone classification change pop-up menu 300 has been changed via the operation unit 16. The selected blood glucose level is moved and displayed to the changed measurement date.
Further, when theCPU 11 recognizes that the confirmation button 308 has been selected via the cursor Cu after the measurement time display field 302 of the time zone classification change pop-up menu 300 has been input, for example, via the keyboard of the operation unit 16. Then, based on the inputted measurement time, the time zone section is re-divided, and the blood glucose level is moved and displayed to the re-divided time zone section.
In this way, in the blood glucose levelinformation processing apparatus 2, the time zone classification, the measurement date, and the measurement time of the blood glucose level measured by the blood glucose level measuring device 5 are caused to perform a predetermined operation on the time zone classification change pop-up menu 300. Can be changed.
When the save button 272 (FIG. 28) is selected via theoperation unit 16, the blood glucose level information processing apparatus 2 is changed to reflect the changed time zone classification, measurement date, and measurement time of the blood glucose level. The blood glucose level beta base is updated with the time zone classification, measurement date, and measurement time of the blood glucose level.
As a result, the blood glucose levelinformation processing apparatus 2 can easily change the blood glucose level to a suitable time zone, measurement date, and measurement time based on, for example, a doctor's judgment. The above-described various graph displays can be performed using the date and measurement time, and more appropriate judgment materials can be provided to the doctor.
(4) Operation and effect
In the above configuration, the blood glucose levelinformation processing device 2 acquires measurement data including the blood glucose level measured by the blood glucose level measuring device 5 and the measurement date and time when the blood glucose level was measured via the external connection interface unit 17, Measurement data is stored in the hard disk drive 14 for each patient.
Further, the blood glucose levelinformation processing device 2 classifies the blood glucose level of the measurement data into one of a plurality of time zone categories based on the measurement date and time and the time zone classification table 60 (FIG. 7) when the blood glucose level was measured. A blood glucose level database in which the blood glucose level of the measurement data and the measurement date / time are associated with the classified time zone is generated.
For example, when the blood glucoselevel note button 75F in the graph type selection button display area 75 is selected and operated through the operation unit 16 on the graph display screen 70 (FIG. 8), the blood glucose level information processing apparatus 2 changes to the blood glucose level beta base. A blood glucose level list 271 in which the recorded blood glucose levels are displayed together with the measurement time is displayed on the blood glucose level note display screen 270 (FIG. 28).
At this time, when the blood sugar levelinformation processing apparatus 2 recognizes that any blood sugar level in the blood sugar level list 271 has been selected and determined, the blood sugar level is highlighted and the time zone classification change pop-up is displayed directly below the blood sugar level. When the menu 300 is displayed and the left button 304 or the right button 305 is selected, the selected blood glucose level is moved to the previous or next time zone and displayed, and the blood glucose level is moved to the previous one. Alternatively, the blood glucose level beta base is updated so as to repartition into the next time zone.
Accordingly, the blood glucose levelinformation processing apparatus 2 can easily change the blood glucose level to a time zone segment that is considered appropriate, for example, based on the judgment of a doctor. Therefore, the various graph displays described above using the changed time zone segment. Can be performed, and more appropriate judgment materials can be provided to the doctor.
Moreover, since the blood glucose levelinformation processing apparatus 2 does not change the measurement time of the blood glucose level when changing the time zone classification of any blood glucose level, for example, the graph display screen 150 using the blood glucose level for every hour. , 160, 170, and 180 (FIGS. 16 to 19), a graph that accurately reflects the measurement time can be displayed.
Furthermore, the blood glucose levelinformation processing apparatus 2 changes the measurement date and time of any blood glucose level according to the operation on the time zone change pop-up menu 300, so that the blood glucose level measuring device 5 is set to an incorrect time. Even if it is a case, the various graph display mentioned above can be performed using the changed measurement date and measurement time.
The blood glucose levelinformation processing apparatus 2 also provides a slide bar 88 below a line graph 81 in which, for example, a blood glucose level for one month is plotted in time series on the graph display screen 70, and the slide bar 88 moves in parallel. Then, only the blood glucose level for one month going back according to the amount of movement was plotted on the line graph 81 along the time series.
Therefore, the blood glucose levelinformation processing apparatus 2 plots the blood glucose level on the line graph 81 by changing only the period according to the movement amount of the slide bar 88 without changing the range of the blood glucose level plotted on the line graph 81. The period of blood sugar level can be easily changed.
As a result, the blood glucose levelinformation processing apparatus 2 changes the blood glucose level period to be plotted at any time according to the movement of the slide bar 88 simply by moving the slide bar 88 in parallel. Visual confirmation can be made more continuously and in the long term.
In addition, when theslide bar 88 is translated, the blood glucose level information processing apparatus 2 averages, standard deviation value, maximum value, minimum value, and number of data of blood glucose values plotted on a line graph 81 traced back according to the amount of movement. Are calculated again, and the average value, standard deviation value, maximum value, minimum value, and number of data are respectively calculated in the average value display field 83A, the standard deviation value display field 83B, the maximum value display field 83C, and the minimum value in the blood glucose level information display area 83. The value is displayed in the value display field 83D and the measurement number display field 83E.
Thereby, the blood glucose levelinformation processing apparatus 2 displays the average value, the standard deviation value, the maximum value, the minimum value, and the number of data of only the blood glucose level currently plotted in the line graph 81 according to the movement of the slide bar 88. be able to.
Further, for example, when thecomparison button 86 on the graph display screen 70 is selected, the blood glucose level information processing apparatus 2 displays the line graph 81 on the upper side of the graph display area 77 in a reduced size in the vertical direction and is the same as the line graph 81. The line graph 92 of the range and immediately before is displayed below the graph display area 77.
Therefore, the blood glucose levelinformation processing apparatus 2 can provide, for example, a line graph including two consecutive periods within the same range by simply causing the doctor to perform an easy operation of selecting the comparison button 86.
Moreover, the blood glucose levelinformation processing apparatus 2 can compare the transition of the blood glucose level in two consecutive periods by displaying, for example, a line graph including two consecutive periods in the same range.
According to the above configuration, the blood glucose levelinformation processing device 2 acquires the blood glucose level measured by the blood glucose level measuring device 5 and the measurement date / time when the blood glucose level was measured, and based on the measurement date / time, a plurality of blood glucose levels are obtained. When it is recognized that an arbitrary blood glucose level in the blood glucose level list 271 centering on the time zone classification and the measurement date is selected and determined, the time zone classification change pop-up menu 300 is displayed and the left button When 304 or the right button 305 is selected, by moving the selected blood glucose level to the previous or next time zone, the blood glucose level of the more accurate time zone and Blood glucose level information can be provided.
Further, the blood glucose levelinformation processing apparatus 2 acquires the blood glucose level measured by the blood glucose level measuring device 5 and the measurement date and time when the blood glucose level was measured, and for example, displays the blood glucose level for one month on the graph display screen 70, for example. A slide bar 88 is provided below the line graph 81 plotted along the series. When the slide bar 88 is translated, only the blood glucose level for one month, for example, traced back according to the amount of movement is shown along the time series. By plotting on the line graph 81, the blood glucose level and blood glucose level information in the period or range desired by the user can be easily provided without forcing the user to perform complicated operations.
(5) Other embodiments
In the above-described embodiment, the blood glucose levelinformation processing device 2 and the blood glucose level measuring device 5 are described as being wirelessly connected via the communication module 6 and the optical communication unit. However, the blood glucose level information processing device 2 and the blood glucose level measuring device 5 may be connected by wireless communication, or may be connected by wire via a predetermined cable or the like.
In the above-described embodiment, the case where one blood glucose levelinformation processing apparatus 2 stores and manages the measurement data supplied by the blood glucose level measuring device 5 has been described. However, the present invention is not limited to this. Alternatively, for example, a plurality of blood glucose level information processing devices 2 connected via an intranet or the like may store and manage measurement data supplied by the blood glucose level measuring device 5, or a plurality of blood glucose level information processing units. One of the devices 2 stores and manages measurement data as a master, and the remaining blood glucose level information processing device 2 accesses the blood glucose level information processing device 2 as a master to temporarily use the measurement data. Anyway.
Furthermore, in the above-described embodiment, the case where the measurement data supplied by the blood glucoselevel measuring device 5 is stored in the folder for each patient has been described. However, the present invention is not limited to this, for example, a plurality of blood glucose levels. When a unique identification number is set for each value measuring device 5, the measurement data may be stored for each identification number of the blood glucose level measuring device 5.
In this case, if the blood glucose levelinformation processing apparatus 2 associates the identification number of the blood glucose level measuring device 5 and the patient name in advance, when the patient name is selected on the patient search screen 40 (FIG. 6), The blood glucose level information processing described above can be executed by reading the measurement data from the folder of the identification number associated with the patient name.
Further, in the above-described embodiment, the case where theCPU 11 performs the above-described blood glucose level information processing according to the blood glucose level information processing program stored in the hard disk drive 14 in advance has been described. The blood sugar level information processing program installed from the storage medium, the blood sugar level information processing program downloaded from the Internet, and the blood sugar level information processing program installed by various other routes may be used. good.
Further, in the above-described embodiment, the case where theinformation processing apparatus 2 as the blood glucose level information processing apparatus of the present invention is configured by the external connection interface unit 17 as the acquisition unit and the CPU 11 as the display control unit has been described. The present invention is not limited to this, and the blood glucose level information processing apparatus may be configured by an acquisition unit and a display control unit having various configurations.
Furthermore, in the above-described embodiment, the blood glucose level information processing apparatus as the blood glucose level information processing apparatus of the present invention includes the externalconnection interface unit 17 as the acquisition unit, the CPU 11 as the sorting unit, the CPU 11 as the display control unit, and the CPU 11 as the changing unit. The case where 2 is configured has been described. The present invention is not limited to this, and the blood glucose level information processing apparatus may be configured by an acquisition unit, a sorting unit, a display control unit, and a changing unit having various configurations.
(1)血糖値情報処理システムの構成
図1に示すように、1は全体として本発明の一実施の形態としての血糖値情報処理システムを示し、血糖値情報処理装置2、プリンタ3、及び血糖値測定ユニット4が設けられている。
血糖値情報処理装置2は、例えばパーソナルコンピュータでなり、例えばUSB(Universal Serial Bus)ケーブルを介してプリンタ3と接続され、またRS232Cケーブルにより接続された光通信モジュール(図示せず)を介して血糖値測定ユニット4と光通信し得るようになされている。
血糖値測定ユニット4は、患者により血糖値を測定させる血糖値測定器5と、血糖値情報処理装置2及びプリンタ3と通信する通信モジュール6とが設けられている。
血糖値測定器5は、その先端に設けられた取り替え式の測定用チップ7により患者の血液を採取し、当該採取した血液と測定用チップ7に封入された試薬とを反応させ、その反応させた血液の色を光学的に読み取ることにより血液に含まれるグルコース濃度を測定し、その結果として血糖値を得る。
また血糖値測定器5は、その内部に時計機能を有し、例えば初期設定時にユーザにより入力された日付及び時刻を基に時間をカウントするようになされており、測定した血糖値を測定日時と共に測定データとして自身の内部に設けられた例えば不揮発性メモリに記憶する。
ここで血糖値は、食事の前後、時間帯及び生活習慣などにより変化するので、その変化を把握するために、患者は、例えば朝食前、朝食後、昼食前、昼食後、夕食前、夕食後、就寝前及び深夜と1日に複数回の血糖値測定を血糖値測定器5を用いて行う。
そこで血糖値測定器5は、例えば150件分の測定データを記憶し得るようになされているため、例えば患者が1日4回測定する場合、約36日分の測定データを記憶し得るようになされている。
ところで血糖値測定器5は、通信モジュール6の光通信送受信部9Aと対向する位置に光通信送受信部(図示せず)が設けられており、当該通信モジュール6と光通信し得るようになされている。
通信モジュール6は、血糖値測定器5が載置された状態で、光通信ボタン8Aがユーザによって押下操作されると、血糖値測定器5のメモリに記憶された測定データを光通信送受信部を介して当該血糖値測定器5に送信させ、光通信送受信部9Aを介して測定データを光通信により受信するようになされている。
そして通信モジュール6は、血糖値測定器5から受信した測定データを光通信送受信部9Bを介して血糖値情報処理装置2へ送信する。
また通信モジュール6は、血糖値測定器5が載置された状態で、印刷ボタン8Bがユーザによって押下操作されると、光通信ボタン8Aが押下操作された場合と同様に、血糖値測定器5から測定データを受信する。
そして通信モジュール6は、所定のケーブル(図示せず)を介して接続されたプリンタ3に測定データを送信することにより、プリンタ3によって測定データの血糖値及び測定日時をその測定日時が古い順に印刷し得るようになされている。
(2)血糖値情報処理装置の回路構成
血糖値情報処理装置2は、図2に示すように、CPU(Central Processing Unit)11、ROM(Read Only Memory)12、RAM(Random Access Memory)13、ハードディスクドライブ14、LCD(Liquid Crystal Display)等でなる表示部15、マウス及びキーボード等でなる操作部16、外部接続インターフェース部17及び時間をカウントする時計部18がバス19を介して接続されている。
この血糖値情報処理装置2は、CPU11がROM12に格納された基本プログラムを読み出してRAM13に展開し、当該基本プログラムに従って全体を統括制御すると共に、ROM12又はハードディスクドライブ14に格納された各種アプリケーションプログラムをRAM13に展開し、当該各種アプリケーションプログラムに従って各種処理を実行するようになされている。
血糖値情報処理装置2は、外部接続インターフェース部17に接続されたRS232Cケーブルを介して光通信モジュール(図示せず)と接続され、また当該外部接続インターフェース部17に接続されたUSBケーブルを介してプリンタ3(図1)と接続されている。
従って血糖値情報処理装置2は、通信モジュール6の光通信ボタン8Aがユーザによって押下操作され、血糖値測定器5から測定データが通信モジュール6を介して送信されると、外部接続インターフェース部17を介して受信し、ハードディスクドライブ14に保存するようになされている。
このとき血糖値情報処理装置2は、多数の血糖値測定器5から測定データを受信することが想定されているため、例えばハードディスクドライブ14に設けられた患者名にそれぞれ対応付けられたフォルダに測定データを記憶するようになされている。
(3)血糖値情報処理
CPU11は、ユーザ(この場合、例えば医師)の操作部16に対する操作に応じて、血糖値情報処理プログラムが選択されると、当該血糖値情報処理プログラムをハードディスクドライブ14から読み出してRAM13に展開し、血糖値情報処理プログラムに従って血糖値情報処理を実行する。
CPU11は、血糖値情報処理を実行すると、図3に示すように、スタート画面20を表示部15に表示する。スタート画面20は、例えば2種類の異なるタイプの血糖値測定器5から測定データを送信させる送信方法を案内する血糖値測定器送信案内イラスト21及び22と、医師にログインさせるログインボタン23とが表示されている。
CPU11は、医師の操作部16に対する操作によりスタート画面20のログインボタン23が例えばカーソル(図示せず)によって選択されると、図4に示すように、医師に対してログインを要求するログイン画面30を表示部15に表示する。このログイン画面30は、利用者名及びパスワードを入力させる利用者名入力欄31及びパスワード入力欄32と、ログインを行わせるログインボタン33と、ログインを中止させるキャンセルボタン34とが表示されている。
CPU11は、医師の操作部16に対する操作によりログイン画面30の利用者名入力欄31及びパスワード入力欄32に利用者名及びパスワードが入力されてログインボタン33が選択されると、予め登録された利用者名及びパスワードと一致するか否かを判断し、一致した場合、図5に示すように、患者検索画面40を表示部15に表示する。
患者検索画面40は、例えばハードディスクドライブ14に予め登録された患者データベースから特定の患者を検索させるモード(以下、これを検索モードと呼ぶ)を選択させる患者検索ボタン41と、患者データベースに新規の患者を登録させるモード(以下、これを登録モードと呼ぶ)を選択させる患者登録ボタン42と、モード別表示領域43とが設けられている。この患者データベースには、患者の氏名、カナ、性別及び患者ID等がそれぞれ関連付けられて登録されている。
CPU11は、患者検索画面40を表示部15に表示する際、デフォルトとして患者検索ボタン41が選択されており、患者氏名及び患者IDを入力させる患者氏名入力欄44及び患者ID入力欄45と、検索を実行する検索ボタン46と、検索結果をリスト表示する患者リスト表示欄47と、印刷ボタン48と、グラフ表示ボタン49とをモード別表示領域43に表示する。
そしてCPU11は、医師の操作部16に対する操作により患者氏名入力欄44及び患者ID入力欄45に患者氏名及び患者IDの少なくとも一方が入力されて検索ボタン46が選択される。
このときCPU11は、ハードディスクドライブ14に保存された患者データベースから患者氏名入力欄44及び患者ID入力欄45に入力された患者氏名及び患者IDを検索し、一致した患者氏名又は患者IDを検出した場合、図6に示すように、患者データベースから一致した患者の氏名、カナ、性別及び患者IDを読み出して患者項目47aとして患者リスト表示欄47に表示する。
CPU11は、患者リスト表示欄47に患者項目47aを表示している状態で、印刷ボタン48が医師の操作部16に対する操作に応じて選択されると、当該患者リスト表示欄47を外部接続インターフェース部17を介してプリンタ3(図1)に印刷させるようになされている。
因みにCPU11は、患者検索画面40の患者登録ボタン42が操作部16を介して選択されると、登録モードを実行し、患者を新規に登録させ得るようになされている。
ところでCPU11は、患者リスト表示欄47の患者項目47aが操作部16を介して選択された後、グラフ表示ボタン49が選択されると、選択された患者項目47aの患者名に対応するフォルダに記憶された測定データをハードディスクドライブ14から読み出す。
そしてCPU11は、読み出した測定データの血糖値を、当該血糖値の測定日時と図7に示すような時間帯区分テーブル60とを比較することにより、時間帯区分テーブル60における時間帯区分のいずれかに区分する。
ここで時間帯区分テーブル60では、例えば時間帯区分が「朝食前」、「朝食後」、「昼食前」、「昼食後」、「夕食前」、「夕食後」、「就寝前」及び「深夜」の8つに区分されている。
また時間帯区分テーブル60は、設定入力時刻を操作部16を介して入力させておくことにより、時間帯区分「朝食前」が測定時刻「03:00~07:00」に対応し、時間帯区分「朝食後」が測定時刻「7:00~10:00」に対応し、時間帯区分「昼食前」が測定時刻「10:00~12:00」に対応し、時間帯区分「昼食後」が測定時刻「12:00~15:00」に対応し、時間帯区分「夕食前」が測定時刻「15:00~18:00」に対応し、時間帯区分「夕食後」が測定時刻「18:00~21:00」に対応し、時間帯区分「就寝前」が測定時刻「21:00~24:00」に対応し、時間帯区分「深夜」が測定時刻「24:00~03:00」に対応する。
従ってCPU11は、ハードディスクドライブ14から読み出した測定データの測定日時に基づく測定時刻が例えば「06:30」であった場合には当該測定データの血糖値を時間帯区分「朝食前」に区分し、測定データの測定時刻が例えば「14:20」であった場合には当該測定データの血糖値を時間帯区分「昼食後」に区分するようになされている。
このようにしてCPU11は、患者項目47aの患者名に対応するフォルダに記憶された測定データをハードディスクドライブ14から読み出すと、読み出した全ての測定データの血糖値をいずれかの時間帯区分に区分する。
そしてCPU11は、測定データの血糖値及び測定日時と区分した時間帯区分とを関連付けた血糖値データベースを生成し、当該血糖値データベースを例えばハードディスクドライブ14の患者名に対応するフォルダに記憶した後、図8に示すようなグラフ表示画面70を表示部15に表示する。
このグラフ表示画面70は、実行できるメニュー項目が表示されたメニューバー71、患者情報等を表示する患者情報欄72、スタンバイモードに移行するスタンバイボタン73、ログオフするためのログオフボタン74、グラフの種類を選択する複数のボタンを表示するグラフ種類選択ボタン表示領域75、グラフタイプ選択ボタン表示領域76、及びグラフを表示するグラフ表示領域77とが設けられている。
患者情報欄72には、選択されている患者の氏名及び患者IDが患者氏名表示欄72A及び患者ID表示欄72Bにそれぞれ表示され、当該患者ID表示欄72Bの右側に患者詳細ボタン72C、新規ボタン72D及び検索ボタン72Eが設けられている。
CPU11は、患者情報欄72の患者詳細ボタン72Cが操作部16を介して選択されると、患者の詳細情報を表示する。
またCPU11は、患者情報欄72の新規ボタン72Dが操作部16を介して選択されると、新規の患者を登録させ得るようになされている。
さらにCPU11は、患者情報欄72の患者検索ボタン72Eが操作部16を介して選択されると、患者検索画面(図5)を表示し、再び患者を検索させ得るようになされている。
グラフ種類選択ボタン表示領域75には、トレンドボタン75A、期間平均ボタン75B、24hトレンドボタン75C、割合ボタン75D、Myグラフボタン75E及び血糖値ノートボタン75Fが設けられ、いずれか1つが選択されるようになされており、デフォルトではトレンドボタン75Aが選択されている。
グラフタイプ選択ボタン表示領域76には、グラフ種類選択ボタン表示領域75のトレンドボタン75A、期間平均ボタン75B、24hトレンドボタン75C、割合ボタン75D及びMyグラフボタン75Eにそれぞれ対応するグラフタイプを選択させるためのボタンが複数個表示されるようになされており、トレンドボタン75Aが選択されている場合には全時間ボタン76A及び時間帯別ボタン76Bが表示される。因みにデフォルトでは全時間ボタン76Aが選択されている。
グラフ表示領域77には、グラフ種類選択ボタン表示領域75で選択されたボタン(トレンドボタン75A、期間平均ボタン75B、24hトレンドボタン75C、割合ボタン75D、Myグラフボタン75E及び血糖値ノートボタン75Fのいずれか)、及びグラフタイプ選択ボタン表示領域76で選択されたボタン(この場合、全時間ボタン76A又は時間帯別ボタン76B)に対応したグラフ及びそのグラフに関連した各種情報等が表示されるようになされている。
このグラフ表示領域77には、トレンドボタン75A及び全時間ボタン76Aが選択されているとき、折れ線グラフ81が表示されると共に、期間情報表示領域82、血糖値情報表示領域83、時間帯区分選択チェックボックス84、凡例表示領域85、比較ボタン86及び印刷ボタン87が設けられている。
ここで時間帯区分選択チェックボックス84では、「朝前」が時間帯区分「朝食前」に対応し、「朝後」が時間帯区分「朝食後」に対応し、「昼前」が時間帯区分「昼食前」に対応し、「昼後」が時間帯区分「昼食後」に対応し、「夜前」が時間帯区分「夕食前」に対応し、「夜後」が時間帯区分「夕食後」に対応し、「寝前」が時間帯区分「就寝前」に対応し、「深夜」が時間帯区分「深夜」に対応する。
CPU11は、時計部18から取得した現在の日付を基準として、期間情報表示領域82の範囲選択メニュー82Aに表示された「1ヶ月」の範囲に対応する日付を開始日付表示欄82B及び終了日付表示欄82Cに表示する。この範囲選択メニュー82Aは、範囲を医師に選択させ得るようにプルダウンメニューでなり、例えば「1ヶ月」、「2ヶ月」、「3ヶ月」及び「6ヶ月」を選択させ得るようになされており、デフォルトとして「1ヶ月」を選択表示している。
これと共にCPU11は、ハードディスクドライブ14から患者氏名表示欄72Aに表示された患者氏名に対応する血糖値データベースを読み出し、測定日時に基づいて開始日付表示欄82B及び終了日付表示欄82Cに表示された開始日付から終了日付までの範囲で、かつ時間帯区分選択チェックボックス84にチェックされた時間帯区分(この場合、「朝食前」、「朝食後」、[夕食後]及び「深夜」)の血糖値だけを血糖値データベースから抽出する。
そしてCPU11は、抽出した血糖値を時系列に沿って時間帯区分ごとのシンボルでプロットし、互いに前後するシンボル同士を直線で結ぶようにして折れ線グラフ81を生成する。
ここで折れ線グラフ81は、横軸が日付とされ、縦軸が血糖値(mg/dl)とされる。また折れ線グラフ81は、血糖値に応じて複数の領域に分割されており、例えば、血糖値が0~59[mg/dl]の低血糖とされる領域を例えば緑色の低血糖領域81A、血糖値が60~109[mg/dl]の正常とされる領域を例えば白色の正常領域81B、血糖値が110~125[mg/dl]の正常と高血糖との間の領域を例えば黄色の擬陽性領域81C、及び血糖値が126~400[mg/dl]の高血糖とされる領域を例えばピンク色の高血糖領域81Dとする。
また折れ線グラフ81では、低血糖領域81A、正常領域81B、擬陽性領域81C及び高血糖領域81Dのそれぞれの境界付近の配色を一方の色から他方の色へ徐々に変化させる所謂グラデーション表示になされている。
さらに折れ線グラフ81では、プロットされた血糖値が凡例表示領域85に示されているように0~59[mg/dl]及び126[mg/dl]以上であった場合、そのプロットされた血糖値のシンボルを強調表示させることにより、医師に容易に目視確認させ得るようになされている。
またCPU11は、血糖値データベースから抽出した血糖値の平均値、標準偏差値、最大値、最小値及びデータ個数を算出し、当該平均値、標準偏差値、最大値、最小値及びデータ個数をそれぞれ血糖値情報表示領域83の平均値表示欄83A、標準偏差値表示欄83B、最大値表示欄83C、最小値表示欄83D及び測定回数表示欄83Eに表示する。
ところで折れ線グラフ81には、その下方に基準(この場合、基準日)を移動させるためのスライドバー88が設けられている。
CPU11は、図9に示すように、スライドバー88が操作部16を介して移動操作された場合、基準日をスライドバー88の移動量に応じて遡るようになされており、その遡った基準日までの1か月分の血糖値だけを再び血糖値データベースから抽出し、その血糖値を時系列に沿って時間帯区分ごとのシンボルで折れ線グラフ81にプロットし直すようになされている。
このときCPU11は、遡った基準日を終了日付表示欄82Cに表示すると共に、開始日付表示欄82Bに基準日より1ヶ月前の日付を表示する。またCPU11は、血糖値データベースから抽出し直した血糖値の平均値、標準偏差値、最大値、最小値及びデータ個数を再度算出し、当該平均値、標準偏差値、最大値、最小値及びデータ個数をそれぞれ血糖値情報表示領域83の平均値表示欄83A、標準偏差値表示欄83B、最大値表示欄83C、最小値表示欄83D及び測定回数表示欄83Eに表示する。
このようにして血糖値情報処理装置2は、スライドバー88が移動操作されると、折れ線グラフ81にプロットされる範囲を固定したまま、日付だけを変更し得るようになされている。
因みにCPU11は、期間情報表示領域82における範囲選択メニュー82Aの例えば「3ヶ月」が操作部16を介して選択されると、折れ線グラフ81の横軸を1か月分から3か月分に変更し、3か月分の血糖値を時系列に沿って時間帯区分ごとのシンボルで折れ線グラフ81にプロットする。
ところでCPU11は、グラフ表示画面70の比較ボタン86が操作部16を介して選択されると、図8との対応部分に同一符号を付した図10に示すように、グラフ表示領域77に期間情報表示領域82、血糖値情報表示領域83、時間帯区分選択チェックボックス84、凡例表示領域85、折れ線グラフ81を縦方向に縮小した折れ線グラフ91、折れ線グラフ92、比較期間情報表示領域93、比較血糖値情報表示領域94、比較解除ボタン95及び印刷ボタン87が設けられたグラフ表示画面90を表示部15に表示するようになされている。
具体的には、CPU11は、比較期間情報表示領域93の期間選択メニュー93Aに範囲選択メニュー82Aと同一である「1ヶ月」を表示し、開始日付表示欄82Bに表示された開始日付の直前の「1ヶ月」の範囲に相当する比較開始日付及び比較終了日付をそれぞれ比較開始日付表示欄93B及び比較終了日付表示欄93Cに表示する。
またCPU11は、ハードディスクドライブ14から読み出した血糖値データベースから、測定日時に基づいて比較開始日付表示欄93B及び比較終了日付表示欄93Cに表示された比較開始日付から比較終了日付までの血糖値を抽出し、さらに時間帯区分選択チェックボックス84にチェックされた時間帯区分(この場合、「朝食前」、「朝食後」、[夕食後]及び「深夜」)の血糖値だけを時系列に沿って時間帯区分ごとのシンボルでプロットし、互いに前後するシンボル同士を直線で結ぶようにして折れ線グラフ92を生成する。
そしてCPU11は、折れ線グラフ91及び92を上下に並べるようにしてグラフ表示領域77に表示するようになされている。
またCPU11は、折れ線グラフ92にプロットした血糖値の平均値、標準偏差値、最大値、最小値及びデータ個数を算出し、当該平均値、標準偏差値、最大値、最小値及びデータ個数をそれぞれ比較血糖値情報表示領域94の平均値表示欄94A、標準偏差値表示欄94B、最大値表示欄94C、最小値表示欄94D及び測定回数表示欄94Eに表示する。
またCPU11は、折れ線グラフ91の下方に設けられたスライドバー96が操作部16を介して移動操作された場合、基準日をスライドバー96の移動量に応じて遡るようになされており、その遡った基準日までの1か月分の血糖値だけを時系列に沿って時間帯区分ごとのシンボルで折れ線グラフ91にプロットし直すと共に、折れ線グラフ92についても全時間折れ線グラフ91と同様の日数分だけ遡るようにしてプロットし直すようになされている。
さらにCPU11は、折れ線グラフ92の下方に設けられたスライドバー97が操作部16を介して移動操作された場合でも、基準日をスライドバー97の移動量に応じて遡るようになされており、その遡った基準日までの1か月分の血糖値だけを時系列に沿って時間帯区分ごとのシンボルで折れ線グラフ92にプロットし直すと共に、折れ線グラフ91についても折れ線グラフ92と同様の日数分だけ遡るようにしてプロットし直すようになされている。
またCPU11は、グラフ表示画面90の比較解除ボタン95が操作部16を介して選択操作されると、グラフ表示画面70(図8)を再び表示部15に表示するようになされている。
ところでCPU11は、例えばグラフ表示画面70(図8)におけるグラフタイプ選択ボタン表示領域76の時間帯別ボタン76Bが操作部16を介して選択操作されると、図8との対応部分に同一符号を付した図11に示すように、グラフ表示領域77に折れ線グラフ101が表示されたグラフ表示画面100を表示部15に表示する。
このときCPU11は、ハードディスクドライブ14から読み出した血糖値データベースから、測定日時に基づいて開始日付表示欄82B及び終了日付表示欄82Cに表示された開始日付から終了日付までの血糖値を抽出し、さらに時間帯区分選択チェックボックス84にチェックされた時間帯区分(この場合、「朝食前」、「朝食後」、「夕食後」及び「深夜」)の血糖値だけを時間帯区分のシンボル毎に直線で結ぶようにしてプロットしてグラフ表示画面100を生成する。
またCPU11は、折れ線グラフ101の下方に設けられたスライドバー88が医師の操作部16を介して移動操作された場合、基準日をスライドバー88の移動量に応じて遡るようになされており、その遡った基準日までの1か月分の血糖値だけを時間帯区分のシンボル毎に直線で結ぶようにして折れ線グラフ101上にプロットし直すようになされている。
さらにCPU11は、グラフ表示画面100の比較ボタン86が操作部16を介して選択操作されると、上述したグラフ表示画面70の比較ボタン86が選択操作された際にグラフ表示画面90を表示する場合と同様に、グラフ表示領域77の上側に折れ線グラフ101を縦方向に縮小表示すると共に、折れ線グラフ101と同一の範囲でかつ直前の期間の折れ線グラフ(図示せず)を当該グラフ表示領域77の下側に表示する。
ところでCPU11は、例えばグラフ表示画面70(図8)におけるグラフ種類選択ボタン表示領域75の期間平均ボタン75Bが操作部16を介して選択操作されると、図8との対応部分に同一符号を付した図12に示すように、グラフ表示画面110を表示部15に表示する。
このグラフ表示画面110では、グラフタイプ選択ボタン表示領域76に月平均ボタン76C及び週平均ボタン76Dが表示され、グラフ表示領域77に期間情報表示領域82、血糖値情報表示領域83、時間帯区分選択チェックボックス84、凡例表示領域85、平均グラフ111、血糖値情報テーブル112及び付加チェックボックス欄113が設けられている。この場合、範囲選択メニュー82Aは、例えば「12ヶ月」、「24ヶ月」及び「36ヶ月」を選択させるようになされており、デフォルトとして「12ヶ月」を選択表示している。
CPU11は、グラフ表示画面110を表示部15に表示する際、開始日付表示欄82B及び終了日付表示欄82Cに表示された期間でかつ時間帯区分選択チェックボックス84にチェックされた時間帯区分(この場合、「朝食前」、「朝食後」、「夕食後」及び「深夜」)の血糖値を血糖値ベータベースから測定日時を基に月ごとに抽出する。
そしてCPU11は、抽出した月ごとの血糖値の平均値、標準偏差値、最大値、最小値、データ数、低血糖(0~59[mg/dl])の回数をそれぞれ算出する。
またCPU11は、算出した12か月分の平均値及び標準偏差値をそれぞれ横線及び縦バーにより示した平均グラフ111をグラフ表示領域77に表示すると共に、算出した月ごとの血糖値の平均値、標準偏差値(SD)、最大値、最小値、データ数(N数)、低血糖の回数を血糖値情報テーブル112に表示する。
因みにCPU11は、グラフ表示画面110の比較ボタン86が操作部16を介して選択操作されると、上述したグラフ表示画面70の比較ボタン86が選択操作された際にグラフ表示画面90を表示する場合と同様に、グラフ表示領域77の上側に平均グラフ111を縦方向に縮小表示すると共に、平均グラフ111と同一の範囲でかつ直前の期間の平均グラフ(図示せず)を当該グラフ表示領域77の下側に表示する。
CPU11は、グラフ表示画面110における付加チェックボックス欄113のSD折れ線表示チェックボックスAが操作部16を介して選択操作されると、図12との対応部分に同一符号を付した図13に示すように、平均グラフ111を縦方向に縮小した平均グラフ121と血糖値情報テーブル112との間に月ごとの標準偏差値を直線で結んだ標準偏差折れ線グラフ122が表示されたグラフ表示画面120を表示する。
またCPU11は、グラフ表示画面110における付加チェックボックス欄113の参考検査値チェックボックス113Bが操作部16を介して選択操作されると、例えば予め患者データベース等に登録された月ごとのHbA1c値などを折れ線グラフとして表示し得るようになされている。
因みにCPU11は、グラフ表示画面120の比較ボタン86が操作部16を介して選択操作されると、上述したグラフ表示画面70の比較ボタン86が選択操作された際にグラフ表示画面90を表示する場合と同様に、グラフ表示領域77の上側に平均グラフ111及び標準偏差折れ線グラフ122を縦方向に縮小表示すると共に、平均グラフ111及び標準偏差折れ線グラフ122と同一の範囲でかつ直前の期間の平均グラフ及び標準偏差折れ線グラフ(図示せず)を当該グラフ表示領域77の下側に表示する。
一方、CPU11は、グラフ表示画面110(図12)におけるグラフタイプ選択ボタン表示領域76の週平均ボタン76Dが操作部16を介して選択操作されると、図12との対応部分に同一符号を付した図14に示すようなグラフ表示画面130を表示部15に表示する。
この場合、グラフ表示画面130では、範囲選択メニュー82Aが例えば「12週間」、「24週間」及び「36週間」を選択させ得るようになされており、デフォルトとして「12週間」を選択表示している。
CPU11は、グラフ表示画面130を表示部15に表示する際、開始日付表示欄82B及び終了日付表示欄82Cに表示された期間でかつ時間帯区分選択チェックボックス84にチェックされた時間帯区分(この場合、「朝食前」、「朝食後」、「夕食後」及び「深夜」)の血糖値を血糖値ベータベースから測定日時を基に週ごとに抽出する。
そしてCPU11は、抽出した週ごとの血糖値の平均値、標準偏差値、最大値、最小値、データ数、低血糖(0~59[mg/dl])の回数をそれぞれ算出する。
またCPU11は、算出した12週間分の平均値及び標準偏差値をそれぞれ横線及び縦バーにより示した平均グラフ131をグラフ表示領域77に表示すると共に、算出した週ごとの血糖値の平均値、標準偏差値、最大値、最小値、データ数、低血糖の回数を血糖値情報テーブル132に表示する。
因みにCPU11は、グラフ表示画面130の比較ボタン86が操作部16を介して選択操作されると、上述したグラフ表示画面70の比較ボタン86が選択操作された際にグラフ表示画面90を表示する場合と同様に、グラフ表示領域77の上側に平均グラフ131を縦方向に縮小表示すると共に、平均グラフ131と同一の範囲でかつ直前の期間の平均グラフ(図示せず)を当該グラフ表示領域77の下側に表示する。
CPU11は、グラフ表示画面130における付加チェックボックス欄113のSD折れ線表示チェックボックス113Aが操作部16を介して選択操作されると、図14との対応部分に同一符号を付した図15に示すように、平均グラフ131を縦方向に縮小した平均グラフ141と血糖値情報テーブル132との間に週ごとの標準偏差値を直線で結んだ標準偏差折れ線グラフ142が表示されたグラフ表示画面140を表示する。
因みにCPU11は、グラフ表示画面140の比較ボタン86が操作部16を介して選択操作されると、上述したグラフ表示画面70の比較ボタン86が選択操作された際にグラフ表示画面90を表示する場合と同様に、グラフ表示領域77の上側に平均グラフ141及び標準偏差折れ線グラフ142を縦方向に縮小表示すると共に、平均グラフ141及び標準偏差折れ線グラフ142と同一の範囲でかつ直前の期間の平均グラフ及び標準偏差折れ線グラフ(図示せず)を当該グラフ表示領域77の下側に表示する。
ところでCPU11は、例えばグラフ表示画面70(図8)におけるグラフ種類選択ボタン表示領域75の24hトレンドボタン75Cが操作部16を介して選択操作されると、図8との対応部分に同一符号を付した図16に示すように、グラフ表示画面150を表示部15に表示する。
このグラフ表示画面150では、グラフタイプ選択ボタン表示領域76に全時間ボタン76A及び時間帯別ボタン76Bが表示され、グラフ表示領域77に期間情報表示領域82、血糖値情報表示領域83、凡例表示領域85、比較ボタン86、印刷ボタン87、平均グラフ151、血糖値情報テーブル152、チェックボックス欄153が設けられている。
このグラフ表示画面150では、範囲選択メニュー82Aが例えば「1ヶ月」、「2ヶ月」、「3ヶ月」及び「6ヶ月」を選択させ得るようになされており、デフォルトとして「1ヶ月」を選択表示している。
またチェックボックス欄153には、SD棒表示チェックボックス153A、平均値チェックボックス153B及びプロットチェックボックス153Cが設けられており、デフォルトとして平均値チェックボックス153Bがチェックされている。
CPU11は、グラフ表示画面150を表示部15に表示する際、開始日付表示欄82B及び終了日付表示欄82Cに表示された期間の血糖値を血糖値ベータベースから測定日時を基に1時間ごとに抽出し、当該抽出した1時間ごとの血糖値の平均値、標準偏差値、最大値、最小値、データ数、低血糖の回数をそれぞれ算出する。
そしてCPU11は、算出した1時間ごとの平均値及び標準偏差値をそれぞれ横線及び縦バーにより示した平均グラフ151をグラフ表示領域77に表示すると共に、算出した1時間ごとの血糖値の平均値、標準偏差値、最大値、最小値、データ数、低血糖の回数を血糖値情報テーブル152に表示する。
因みにCPU11は、グラフ表示画面150の比較ボタン86が操作部16を介して選択操作されると、上述したグラフ表示画面70の比較ボタン86が選択操作された際にグラフ表示画面90を表示する場合と同様に、グラフ表示領域77の上側に平均グラフ151を縦方向に縮小表示すると共に、平均グラフ151と同一の範囲でかつ直前の期間の平均グラフ(図示せず)を当該グラフ表示領域77の下側に表示する。
一方、CPU11は、グラフ表示画面150におけるチェックボックス欄153のSD棒表示チェックボックス153Aが操作部16を介して選択操作されると、図16との対応部分に同一符号を付した図17に示すように、平均グラフ151を縦方向に縮小した平均グラフ161と血糖値情報テーブル152との間に1時間ごとの標準偏差値を棒状に示した棒グラフ162が表示されたグラフ表示画面160を表示する。
因みにCPU11は、グラフ表示画面160の比較ボタン86が操作部16を介して選択操作されると、上述したグラフ表示画面70の比較ボタン86が選択操作された際にグラフ表示画面90を表示する場合と同様に、グラフ表示領域77の上側に平均グラフ161及び棒グラフ162を縦方向に縮小表示すると共に、平均グラフ161及び棒グラフ162と同一の範囲でかつ直前の期間の平均グラフ及び棒グラフ(図示せず)を当該グラフ表示領域77の下側に表示する。
ところでCPU11は、グラフ表示画面150(図16)におけるチェックボックス欄153のプロットチェックボックス153Cが操作部16を介して選択操作されると、図16との対応部分に同一符号を付した図18に示すようなグラフ表示画面170を表示する。このときCPU11は、チェックボックス欄153のプロットチェックボックス153Cにチェックを入れると共に、平均値チェックボックス153Bのチェックを外す。なお図16及び図18で用いられる血糖値が実際上は同一であるが、説明の便宜上、図16及び図18では異なる血糖値を用いており、図16の平均グラフ151、図18のプロットグラフ171、及び血糖値情報テーブル152の値はその一例に過ぎない。
またCPU11は、グラフ表示画面170のグラフ表示領域77に、抽出した1ヶ月分の全ての血糖値を1時間ごとに区分してプロットしたプロットグラフ171を表示する。
プロットグラフ171では、プロットされた血糖値が凡例表示領域85に示されているように血糖値が0~59[mg/dl]及び126[mg/dl]以上であった場合、そのプロットされた血糖値のプロット点を強調表示することにより、医師に容易に目視確認させ得る。
因みにCPU11は、グラフ表示画面170の比較ボタン86が操作部16を介して選択操作されると、上述したグラフ表示画面70の比較ボタン86が選択操作された際にグラフ表示画面90を表示する場合と同様に、グラフ表示領域77の上側にプロットグラフ171を縦方向に縮小表示すると共に、プロットグラフ171と同一の範囲でかつ直前の期間のプロットグラフ(図示せず)を当該グラフ表示領域77の下側に表示する。
一方、CPU11は、グラフ表示画面170におけるチェックボックス欄153のSD棒表示チェックボックス153Aが操作部16を介して選択操作されると、図17及び図18との対応部分に同一符号を付した図19に示すように、プロットグラフ171を縦方向に縮小したプロットグラフ181と血糖値情報テーブル152との間に1時間ごとの標準偏差値を棒状に示した棒グラフ162が表示されたグラフ表示画面180を表示する。
因みにCPU11は、グラフ表示画面180の比較ボタン86が操作部16を介して選択操作されると、上述したグラフ表示画面70の比較ボタン86が選択操作された際にグラフ表示画面90を表示する場合と同様に、グラフ表示領域77の上側にプロットグラフ181及び棒グラフ162を縦方向に縮小表示すると共に、プロットグラフ181及び棒グラフ162と同一の範囲でかつ直前の期間のプロットグラフ及び棒グラフ(図示せず)を当該グラフ表示領域77の下側に表示する。
ところでCPU11は、例えばグラフ表示画面150(図16)におけるグラフタイプ選択ボタン表示領域76の時間帯別ボタン76Bが操作部16を介して選択操作されると、図16との対応部分に同一符号を付した図20に示すようなグラフ表示画面190を表示部15に表示する。
CPU11は、グラフ表示画面190を表示部15に表示する際、範囲選択メニュー82Aにデフォルトで表示された「1ヶ月」分に対応する開始日付表示欄82B及び終了日付表示欄82Cに表示された期間の血糖値を測定日時を基に時間帯区分ごとに血糖値ベータベースから抽出する。
そしてCPU11は、抽出した時間帯区分ごとの血糖値の平均値、標準偏差値、最大値、最小値、データ数、低血糖の回数をそれぞれ算出する。
またCPU11は、算出した時間帯区分ごとの平均値及び標準偏差値をそれぞれ横線及び縦バーにより示した平均グラフ191をグラフ表示領域77に表示すると共に、算出した時間帯区分ごとの血糖値の平均値、標準偏差値、最大値、最小値、データ数、低血糖の回数を血糖値情報テーブル192に表示する。
因みにCPU11は、グラフ表示画面190の比較ボタン86が操作部16を介して選択操作されると、上述したグラフ表示画面70の比較ボタン86が選択操作された際にグラフ表示画面90を表示する場合と同様に、グラフ表示領域77の上側に平均グラフ191を縦方向に縮小表示すると共に、平均グラフ191と同一の範囲でかつ直前の期間の平均グラフ(図示せず)を当該グラフ表示領域77の下側に表示する。
CPU11は、グラフ表示画面190におけるチェックボックス欄153のSD棒表示チェックボックス153Aが操作部16を介して選択操作されると、図20との対応部分に同一符号を付した図21に示すように、平均グラフ191を縦方向に縮小した平均グラフ201と血糖値情報テーブル192との間に時間帯区分ごとの標準偏差値を棒状に示した棒グラフ202が表示されたグラフ表示画面200を表示する。
因みにCPU11は、グラフ表示画面200の比較ボタン86が操作部16を介して選択操作されると、上述したグラフ表示画面70の比較ボタン86が選択操作された際にグラフ表示画面90を表示する場合と同様に、グラフ表示領域77の上側に平均グラフ201及び棒グラフ202を縦方向に縮小表示すると共に、平均グラフ201及び棒グラフ202と同一の範囲でかつ直前の期間の平均グラフ及び棒グラフ(図示せず)を当該グラフ表示領域77の下側に表示する。
一方、CPU11は、グラフ表示画面190(図20)におけるチェックボックス欄153のプロットチェックボックス153Cが操作部16を介して選択操作されると、図20との対応部分に同一符号を付した図22に示すようなグラフ表示画面210を表示する。このときCPU11は、チェックボックス欄153のプロットチェックボックス153Cにチェックを入れると共に、平均値チェックボックス153Bのチェックを外す。なお図20及び図22で用いられる血糖値が実際上は同一であるが、説明の便宜上、図20及び図22では異なる血糖値を用いており、図20の平均グラフ191、図22のプロットグラフ211、及び血糖値情報テーブル192の値はその一例に過ぎない。
またCPU11は、グラフ表示画面210のグラフ表示領域77に、抽出した1ヶ月分の血糖値を時間帯区分ごとに区分してプロットしたプロットグラフ211を表示する。
プロットグラフ211では、プロットされた血糖値が凡例表示領域85に示されているように血糖値が0~59[mg/dl]及び126[mg/dl]以上であった場合、そのプロットされた血糖値のプ/ロット点を強調表示させることにより、医師に容易に目視確認させ得る。
因みにCPU11は、グラフ表示画面210の比較ボタン86が操作部16を介して選択操作されると、上述したグラフ表示画面70の比較ボタン86が選択操作された際にグラフ表示画面90を表示する場合と同様に、グラフ表示領域77の上側にプロットグラフ211を縦方向に縮小表示すると共に、プロットグラフ211と同一の範囲でかつ直前の期間のプロットグラフ(図示せず)を当該グラフ表示領域77の下側に表示する。
CPU11は、グラフ表示画面210におけるチェックボックス欄153のSD棒表示チェックボックス153Aが操作部16を介して選択操作されると、図21及び図22との対応部分に同一符号を付した図23に示すように、プロットグラフ211を縦方向に縮小したプロットグラフ221と血糖値情報テーブル192との間に時間帯区分ごとの標準偏差値を棒状に示した棒グラフ202が表示されたグラフ表示画面220を表示する。
因みにCPU11は、グラフ表示画面220の比較ボタン86が操作部16を介して選択操作されると、上述したグラフ表示画面70の比較ボタン86が選択操作された際にグラフ表示画面90を表示する場合と同様に、グラフ表示領域77の上側にプロットグラフ221及び棒グラフ202を縦方向に縮小表示すると共に、プロットグラフ221及び棒グラフ202と同一の範囲でかつ直前の期間のプロットグラフ及び棒グラフ(図示せず)を当該グラフ表示領域77の下側に表示する。
ところでCPU11は、例えばグラフ表示画面70(図8)におけるグラフ種類選択ボタン表示領域75の割合ボタン75Dが操作部16を介して選択操作されると、図8との対応部分に同一符号を付した図24に示すように、グラフ表示画面230を表示部15に表示する。
このグラフ表示画面230では、グラフタイプ選択ボタン表示領域76に時間帯別円グラフボタン76E、積上げ棒グラフ月ボタン76F及び積上げ棒グラフ週ボタン76Gが表示され、デフォルトとして時間帯別円グラフボタン76Eが選択表示されている。この場合、グラフ表示画面230では、グラフ表示領域77に2つの円グラフ231及び232が左右に並べられて表示される。
また範囲選択メニュー82Aは、例えば「1ヶ月」、「2ヶ月」、「3ヶ月」及び「6ヶ月」を選択させるようになされており、デフォルトとして「1ヶ月」を選択表示している。
CPU11は、グラフ表示画面230を表示部15に表示する際、開始日付表示欄82B及び終了日付表示欄82Cに表示された期間でかつ時間帯区分選択チェックボックス233にチェックされた時間帯区分(この場合、「朝食前」、「昼食前」、「夕食前」及び「就寝前」)の血糖値を血糖値ベータベースから測定日時及び時間帯区分を基に抽出する。
そしてCPU11は、抽出した血糖値の平均値、標準偏差値、最大値、最小値及びデータ数をそれぞれ算出すると共に、抽出した血糖値のデータ数に対する血糖値が0~59、60~109、110~125及び126以上となるデータ数の割合を算出する。
またCPU11は、算出した時間帯区分ごとの血糖値の平均値、標準偏差値、最大値、最小値、データ数を血糖値情報テーブル234に表示すると共に、算出した血糖値の割合を円グラフ231として表示する。
またCPU11は、開始日付表示欄82B及び終了日付表示欄82Cに表示された期間でかつ時間帯区分選択チェックボックス235にチェックされた時間帯区分(この場合、「朝食後」、「昼食後」、「夕食後」及び「深夜」)の血糖値を血糖値ベータベースから測定日時及び時間帯区分を基に抽出する。
そしてCPU11は、抽出した血糖値の平均値、標準偏差値、最大値、最小値及びデータ数をそれぞれ算出すると共に、抽出した血糖値のデータ数に対する血糖値が0~59、60~109、110~125及び126以上となるデータ数の割合を算出する。
またCPU11は、算出した時間帯区分ごとの血糖値の平均値、標準偏差値、最大値、最小値、データ数を血糖値情報テーブル236に表示すると共に、算出した血糖値の割合を円グラフ232として表示する。
因みにCPU11は、グラフ表示画面230の比較ボタン85が操作部16を介して選択操作されると、上述したグラフ表示画面70の比較ボタン86が選択操作された際にグラフ表示画面90を表示する場合と同様に、グラフ表示領域77の上側に円グラフ231及び円グラフ232を縮小表示すると共に、当該グラフ表示領域77の下側に縮小した円グラフ231及び円グラフ232と同一の範囲でかつ直前の期間の円グラフ(図示せず)をそれぞれ表示する。
一方、CPU11は、グラフ表示画面230におけるグラフタイプ選択ボタン表示領域76の積上げ棒グラフ月ボタン76Fが操作部16を介して選択操作されると、図24との対応部分に同一符号を付した図25に示すようなグラフ表示画面240を表示部15に表示する。
CPU11は、グラフ表示画面240を表示部15に表示する際、開始日付表示欄82B及び終了日付表示欄82Cに表示された期間でかつ時間帯区分選択チェックボックス84にチェックされた時間帯区分(この場合、「朝食前」、「朝食後」、「夕食後」及び「深夜」)の血糖値を血糖値ベータベースから測定日時及び時間帯区分を基に抽出する。
そしてCPU11は、抽出した血糖値の平均値、標準偏差値、最大値、最小値及びデータ数をそれぞれ算出すると共に、抽出した血糖値の月ごとのデータ数に対する血糖値が0~59、60~109、110~125及び126以上となるデータ数の割合をそれぞれ算出する。
そしてCPU11は、算出した血糖値の平均値、標準偏差値、最大値、最小値、データ数を血糖値情報表示領域83に表示すると共に、算出した月ごとの血糖値の割合を棒グラフ241として表示する。
因みにCPU11は、グラフ表示画面240の比較ボタン86が操作部16を介して選択操作されると、上述したグラフ表示画面70の比較ボタン86が選択操作された際にグラフ表示画面90を表示する場合と同様に、グラフ表示領域77の上側に棒グラフ241を縦方向に縮小表示すると共に、棒グラフ241と同一の範囲でかつ直前の期間の棒グラフ(図示せず)を当該グラフ表示領域77の下側に表示する。
一方、CPU11は、グラフ表示画面230(図24)におけるグラフタイプ選択ボタン表示領域76の積上げ棒グラフ週ボタン76Gが操作部16を介して選択操作されると、図24との対応部分に同一符号を付した図26に示すようなグラフ表示画面250を表示部15に表示する。
CPU11は、グラフ表示画面250を表示部15に表示する際、範囲選択メニュー82Aにデフォルトで表示された「12週間」分に対応する開始日付表示欄82B及び終了日付表示欄82Cに表示された期間でかつ時間帯区分選択チェックボックス84にチェックされた時間帯区分(この場合、「朝食前」、「朝食後」、「夕食後」及び「深夜」)の血糖値を血糖値データベースから測定日時及び時間帯区分を基に抽出する。
そしてCPU11は、抽出した血糖値の平均値、標準偏差値、最大値、最小値及びデータ数をそれぞれ算出すると共に、抽出した血糖値の週ごとのデータ数に対する血糖値が0~59、60~109、110~125及び126以上となるデータ数の割合をそれぞれ算出する。
そしてCPU11は、算出した血糖値の平均値、標準偏差値、最大値、最小値、データ数を血糖値情報表示領域83に表示すると共に、算出した週ごとの血糖値の割合を棒グラフ251として表示する。
因みにCPU11は、グラフ表示画面250の比較ボタン86が操作部16を介して選択操作されると、上述したグラフ表示画面70の比較ボタン86が選択操作された際にグラフ表示画面90を表示する場合と同様に、グラフ表示領域77の上側に棒グラフ251を縦方向に縮小表示すると共に、棒グラフ251と同一の範囲でかつ直前の期間の棒グラフ(図示せず)を当該グラフ表示領域77の下側に表示する。
ところでCPU11は、例えばグラフ表示画面70(図8)におけるグラフ種類選択ボタン表示領域75のMyグラフボタン75Eが操作部16を介して選択操作されると、図8との対応部分に同一符号を付した図27に示すように、グラフ表示画面260を表示部15に表示する。
ここでグラフ表示画面260は、任意のグラフを表示し得るようになされており、例えば、図8における折れ線グラフ81に相当する折れ線グラフ261、及び図12における平均グラフ111に相当する平均グラフ262をグラフ表示領域77に表示する。
CPU11は、例えばグラフ表示画面70(図8)におけるグラフ種類選択ボタン表示領域75の血糖値ノートボタン75Fが操作部16を介して選択操作されると、図8との対応部分に同一符号を付した図28に示すように、血糖値ベータベースに記録された血糖値が測定時刻と共に一覧表示された血糖値一覧表271を血糖値ノート表示画面270に表示する。
すなわち血糖値一覧表271は、縦軸を日付とし、横軸を時間帯区分として血糖値が測定時刻と共にマトリクス状に配置されている。この血糖値一覧表271では、血糖値が0~59[mg/dl]であった場合、及び126[mg/dl]以上であった場合、当該血糖値を反転表示するようになされている。
ところで血糖値は、血糖値測定器5(図1)によって患者自らが食前及び食後等に例えば自宅や会社等で測定する。また患者は、必ずしも設定された時間帯区分に従って食事を取れるとは限らない。そのためCPU11は、血糖値測定器5によって測定された測定データの測定時刻に基づいて血糖値を該当する時間帯区分に区分する際、実際とは異なる時間帯区分に区分して血糖値データベースを生成してしまうことが考えられる。また血糖値測定器5は、例えば初期設定時に患者によって日付及び時刻が設定されているため、誤った日付及び時刻に設定されている場合も考えられる。
そこで血糖値情報処理装置2では、CPU11によって生成された血糖値データベースを医師の判断により修正させ得るようになされている。
具体的には、図28の一部である血糖値一覧部分271Aを表示した図29(A)に示すように、CPU11は、血糖値一覧表271の任意の血糖値がカーソルCuによって選択(クリック)されると、当該血糖値及び対応する測定時刻を選択枠FRで囲み、任意の血糖値を選択したことを医師に目視確認させる。
そしてCPU11は、選択枠FRで囲んだ血糖値が選択された状態で、操作部16の例えばマウスがダブルクリックされて決定されたことを認識すると、図29(B)に示すように、その血糖値及び測定時刻を反転表示すると共に、その血糖値の直下に時間帯区分変更ポップアップメニュー300を血糖値一覧表271に重ねて表示する。
この時間帯区分変更ポップアップメニュー300には、決定された血糖値の測定日付を表示する測定日付表示欄301、当該血糖値の測定時刻を表示する測定時刻表示欄302、当該血糖値を表示する血糖値表示欄303、当該血糖値の時間帯区分を1つ前の時間帯区分に移動させるための左ボタン304、当該血糖値の時間帯区分を1つ後の時間帯区分に移動させるための右ボタン305、削除ボタン306、キャンセルボタン307及び確定ボタン308が設けられている。
CPU11は、図29(C)に示すように、時間帯区分変更ポップアップメニュー300の左ボタン304がカーソルCuを介して選択されたことを認識すると、図29(D)に示すように、選択している血糖値を左側の時間帯区分、すなわち1つ前の時間帯区分へ移動表示する。このときCPU11は、時間帯区分を移動させた血糖値を選択枠FRで囲んだ選択状態にしておくことにより、医師に時間帯区分を変更した血糖値を容易に発見させ得るようになされている。
またCPU11は、時間帯区分変更ポップアップメニュー300の右ボタン305がカーソルCuを介して選択されたことを認識すると、選択している血糖値を右側の時間帯区分、すなわち1つ後の時間帯区分へ移動表示する。
さらにCPU11は、時間帯区分変更ポップアップメニュー300のプルダウンメニューでなる測定日付表示欄301が操作部16を介して変更された後、確定ボタン308が当該カーソルCuを介して選択されたことを認識すると、変更された測定日付へ選択されている血糖値を移動表示する。
さらにCPU11は、時間帯区分変更ポップアップメニュー300の測定時刻表示欄302が例えば操作部16のキーボードを介して入力操作された後、確定ボタン308が当該カーソルCuを介して選択されたことを認識すると、当該入力された測定時刻を基に時間帯区分を再区分し、その再区分された時間帯区分へ当該血糖値を移動表示する。
このようにして血糖値情報処理装置2では、血糖値測定器5によって測定された血糖値の時間帯区分、測定日付及び測定時刻を、時間帯区分変更ポップアップメニュー300に対する所定の操作を行わせることにより、変更させ得るようになされている。
そして血糖値情報処理装置2は、保存ボタン272(図28)が操作部16を介して選択されると、変更された血糖値の時間帯区分、測定日付及び測定時刻を反映させるべく、変更された血糖値の時間帯区分、測定日付及び測定時刻に血糖値ベータベースを更新する。
これにより血糖値情報処理装置2は、例えば医師の判断により血糖値を適切であると思われる時間帯区分、測定日付、測定時刻に容易に変更させられるので、当該変更された時間帯区分、測定日付、測定時刻を用いて上述した種々のグラフ表示を行うことができ、より適切な判断材料を医師に提供することができる。
(4)動作及び効果
以上の構成において血糖値情報処理装置2は、血糖値測定器5により測定された血糖値及び当該血糖値が測定された測定日時からなる測定データを外部接続インターフェース部17を介して取得し、当該測定データをハードディスクドライブ14に患者ごとに記憶する。
また血糖値情報処理装置2は、測定データの血糖値を、当該血糖値が測定された測定日時及び時間帯区分テーブル60(図7)に基づいて複数の時間帯区分のいずれかに区分し、測定データの血糖値及び測定日時と分類した時間帯区分とを関連付けた血糖値データベースを生成する。
そして血糖値情報処理装置2は、例えばグラフ表示画面70(図8)においてグラフ種類選択ボタン表示領域75の血糖値ノートボタン75Fが操作部16を介して選択操作されると、血糖値ベータベースに記録された血糖値が測定時刻と共に一覧表示された血糖値一覧表271を血糖値ノート表示画面270(図28)に表示する。
このとき血糖値情報処理装置2は、血糖値一覧表271の任意の血糖値が選択決定されたことを認識すると、その血糖値を反転表示すると共に、その血糖値の直下に時間帯区分変更ポップアップメニュー300を表示し、左ボタン304又は右ボタン305が選択されると、選択している血糖値を1つ前又は1つ後の時間帯区分へ移動表示すると共に、当該血糖値を1つ前又は1つ後の時間帯区分に再区分し直すように血糖値ベータベースを更新する。
従って血糖値情報処理装置2は、例えば医師の判断により血糖値を適切であると思われる時間帯区分に容易に変更させられるので、当該変更された時間帯区分を用いて上述した種々のグラフ表示を行うことができ、より適切な判断材料を医師に提供することができる。
また血糖値情報処理装置2は、任意の血糖値の時間帯区分を変更する際に当該血糖値の測定時刻を変更することがないため、例えば1時間ごとの血糖値を用いたグラフ表示画面150、160、170及び180(図16~図19)を表示する際、測定時刻を正確に反映したグラフ表示を行うことができる。
さらに血糖値情報処理装置2は、任意の血糖値の測定日付及び測定時刻を時間帯区分変更ポップアップメニュー300に対する操作に応じて変更することにより、血糖値測定器5が誤った時間に設定されている場合であっても、変更された測定日付及び測定時刻を用いて上述した種々のグラフ表示を行うことができる。
また血糖値情報処理装置2は、例えばグラフ表示画面70において例えば1か月分の血糖値を時系列に沿ってプロットした折れ線グラフ81の下方にスライドバー88を設け、当該スライドバー88が平行移動されると、移動量に応じて遡った1か月分の血糖値だけを時系列に沿って折れ線グラフ81にプロットするようにした。
従って血糖値情報処理装置2は、折れ線グラフ81にプロットされる血糖値の範囲を変更することなく、その期間だけをスライドバー88の移動量に応じて変更することにより、折れ線グラフ81にプロットする血糖値の期間を容易に変更させることができる。
これにより血糖値情報処理装置2は、スライドバー88を平行移動させるだけで、当該スライドバー88の移動に応じて随時プロットする血糖値の期間を変更するので、医師に対して血糖値の推移をより連続的にかつ長期的に目視確認させることができる。
また血糖値情報処理装置2は、スライドバー88が平行移動されると、移動量に応じて遡った折れ線グラフ81にプロットした血糖値の平均値、標準偏差値、最大値、最小値及びデータ個数を再度算出し、当該平均値、標準偏差値、最大値、最小値及びデータ個数をそれぞれ血糖値情報表示領域83の平均値表示欄83A、標準偏差値表示欄83B、最大値表示欄83C、最小値表示欄83D及び測定回数表示欄83Eに表示するようにした。
これにより血糖値情報処理装置2は、現在折れ線グラフ81にプロットしている血糖値だけの平均値、標準偏差値、最大値、最小値及びデータ個数を、スライドバー88の移動に応じて表示することができる。
また血糖値情報処理装置2は、例えばグラフ表示画面70の比較ボタン86が選択操作されると、グラフ表示領域77の上側に折れ線グラフ81を縦方向に縮小表示すると共に、折れ線グラフ81と同一の範囲でかつ直前の期間の折れ線グラフ92を当該グラフ表示領域77の下側に表示するようにした。
従って血糖値情報処理装置2は、比較ボタン86を選択させるという容易な操作を医師に行わせるだけで、同一範囲でかつ連続した2つの期間でなる例えば折れ線グラフを提供することができる。
また血糖値情報処理装置2は、同一範囲でかつ連続した2つの期間でなる例えば折れ線グラフを表示することにより、連続した2つの期間での血糖値の遷移を比較させることができる。
以上の構成によれば血糖値情報処理装置2は、血糖値測定器5により測定された血糖値及び当該血糖値が測定された測定日時を取得し、当該測定日時に基づいて血糖値を複数の時間帯区分に区分し、当該時間帯区分及び測定日付を軸とする血糖値一覧表271の任意の血糖値が選択決定されたことを認識すると時間帯区分変更ポップアップメニュー300を表示し、左ボタン304又は右ボタン305が選択されると、選択している血糖値を1つ前又は1つ後の時間帯区分へ移動させることにより、従来と比してより正確な時間帯区分の血糖値及び血糖値情報を提供することができる。
また血糖値情報処理装置2は、血糖値測定器5により測定された血糖値及び当該血糖値が測定された測定日時を取得し、例えばグラフ表示画面70において例えば1か月分の血糖値を時系列に沿ってプロットした折れ線グラフ81の下方にスライドバー88を設け、当該スライドバー88が平行移動されると、移動量に応じて遡った例えば1か月分の血糖値だけを時系列に沿って折れ線グラフ81上にプロットするようにしたことにより、ユーザに対して煩雑な操作を強いることなく、ユーザが所望する期間又は範囲の血糖値及び血糖値情報を容易に提供することができる。
(5)他の実施の形態
なお上述した実施の形態においては、血糖値情報処理装置2と血糖値測定装置5とが通信モジュール6及び光通信ユニットを介して無線接続されるようにした場合について述べたが、本発明はこれに限らず、血糖値情報処理装置2と血糖値測定装置5とが無線通信により接続されるようにしても良いし、また所定のケーブル等を介して有線接続されるようにしても良い。
また上述した実施の形態においては、1台の血糖値情報処理装置2が血糖値測定器5により供給される測定データを保存及び管理するようにした場合について述べたが、本発明はこれに限らず、例えばイントラネット等により接続された複数台の血糖値情報処理装置2が血糖値測定器5により供給される測定データを保存及び管理するようにしても良いし、また複数台の血糖値情報処理装置2のうちの1台がマスタとして測定データを保存及び管理し、残りの血糖値情報処理装置2がマスタとしての血糖値情報処理装置2にアクセスすることにより測定データを一時的に使用するようにしても良い。
さらに上述した実施の形態においては、血糖値測定器5により供給される測定データを患者ごとのフォルダに保存するようにした場合について述べたが、本発明はこれに限らず、例えば複数台の血糖値測定器5にそれぞれ固有の識別番号が設定されているような場合には、当該血糖値測定器5の識別番号ごとに測定データを保存するようにしても良い。
この場合、血糖値情報処理装置2は、血糖値測定器5の識別番号と患者名とを予め関連付けておくようにすれば、患者検索画面40(図6)により患者名が選択されると、当該患者名に関連付けられた識別番号のフォルダから測定データを読み出すことにより上述した血糖値情報処理を実行することができる。
さらに上述した実施の形態においては、CPU11が、予めハードディスクドライブ14に格納されている血糖値情報処理プログラムに従い、上述した血糖値情報処理を行うようにした場合について述べたが、本発明はこれに限らず、記憶媒体からインストールした血糖値情報処理プログラムや、インターネットからダウンロードした血糖値情報処理プログラム、その他種々のルートによってインストールした血糖値情報処理プログラムに従って上述した血糖値情報処理を行うようにしても良い。
さらに上述した実施の形態においては、取得部として外部接続インターフェース部17、表示制御部としてCPU11によって本発明の血糖値情報処理装置としての情報処理装置2を構成するようにした場合について述べた。本発明はこれに限らず、この他種々の構成でなる取得部、表示制御部によって血糖値情報処理装置を構成するようにしても良い。
さらに上述した実施の形態においては、取得部として外部接続インターフェース部17、区分部としてCPU11、表示制御部としてCPU11、変更部としてのCPU11によって本発明の血糖値情報処理装置としての血糖値情報処理装置2を構成するようにした場合について述べた。本発明はこれに限らず、この他種々の構成でなる取得部、区分部、表示制御部、変更部によって血糖値情報処理装置を構成するようにしても良い。 Hereinafter, an embodiment of the present invention will be described in detail with reference to the drawings.
(1) Configuration of blood glucose level information processing system
As shown in FIG. 1,
The blood glucose level
The blood sugar
The blood glucose level measuring
The blood glucose
Here, the blood glucose level changes depending on the time before and after the meal, the time zone and lifestyle, etc. In order to grasp the change, the patient, for example, before breakfast, after breakfast, before lunch, after lunch, before dinner, after dinner The blood glucose
Therefore, since the blood glucose
By the way, the blood glucose
When the optical communication button 8A is pressed down by the user while the blood glucose
Then, the
In addition, when the print button 8B is pressed down by the user while the blood glucose
Then, the
(2) Circuit configuration of blood glucose level information processing apparatus
As shown in FIG. 2, the blood glucose level
In this blood glucose level
The blood glucose level
Therefore, when the optical communication button 8A of the
At this time, since it is assumed that the blood glucose level
(3) Blood glucose level information processing
When the blood glucose level information processing program is selected in response to an operation on the
When executing the blood sugar level information processing, the
When the
When the user name and password are input to the user
The
When the
Then, the
At this time, the
When the
Incidentally, when the
By the way, when the
Then, the
Here, in the time zone classification table 60, for example, the time zone classification is “before breakfast”, “after breakfast”, “before lunch”, “after lunch”, “before dinner”, “after dinner”, “before bedtime”, and “ It is divided into eight “midnight”.
In addition, the time zone classification table 60 allows the time zone division “before breakfast” to correspond to the measurement time “03:00 to 07:00” by inputting the set input time via the
Therefore, when the measurement time based on the measurement date and time of the measurement data read from the
In this way, when the
Then, the
The
In the
When the
The
Further, when the
The graph type selection button display area 75 is provided with a
In the graph type selection
The graph display area 77 includes buttons selected in the graph type selection button display area 75 (a
In the graph display area 77, when the
Here, in the time zone category
The
At the same time, the
Then, the
Here, in the
The
Furthermore, in the
Further, the
Incidentally, the
As shown in FIG. 9, when the
At this time, the
Thus, when the
Incidentally, the
By the way, when the
Specifically, the
Further, the
The
Further, the
In addition, when the
Furthermore, even when the
Further, when the comparison cancel
By the way, for example, when the
At this time, the
Further, when the
Further, when the
By the way, for example, when the period
In the
When the
Then, the
Further, the
Incidentally, when the
When the SD broken line display check box A in the additional
Further, when the reference test
Incidentally, when the
On the other hand, when the weekly
In this case, on the
When displaying the
Then, the
In addition, the
Incidentally, when the
When the SD broken line
Incidentally, when the
By the way, for example, when the
In the
In this
In the
When the
And CPU11 displays the
Incidentally, when the
On the other hand, when the SD bar
Incidentally, when the
By the way, when the
Further, the
In the
Incidentally, when the
On the other hand, when the SD bar
Incidentally, when the
By the way, for example, when the
When the
Then, the
In addition, the
Incidentally, when the
When the SD bar
Incidentally, when the
On the other hand, when the
Further, the
In the
Incidentally, when the
When the SD bar
Incidentally, when the
By the way, for example, when the
In this
Further, the
When the
Then, the
Further, the
In addition, the
Then, the
In addition, the
Incidentally, when the
On the other hand, when the stacked bar graph month button 76F in the graph type selection
When displaying the
Then, the
Then, the
Incidentally, when the
On the other hand, when the stacked bar
When the
Then, the
Then, the
Incidentally, when the
By the way, for example, when the My
Here, the
For example, when the blood glucose
That is, in the blood sugar level list 271, blood sugar levels are arranged in a matrix with measurement times, with the vertical axis representing the date and the horizontal axis representing the time zone. In this blood glucose level list 271, when the blood glucose level is 0 to 59 [mg / dl] and when it is 126 [mg / dl] or more, the blood glucose level is highlighted.
By the way, the blood glucose level is measured by the patient himself / herself before and after a meal, for example, at home or at the office by using the blood glucose level measuring device 5 (FIG. 1). Moreover, a patient does not necessarily have a meal according to the set time zone division. Therefore, when the
Therefore, in the blood sugar level
Specifically, as shown in FIG. 29A in which the blood glucose
When the
The time zone classification change pop-up
When the
When the
Further, when the
Further, when the
In this way, in the blood glucose level
When the save button 272 (FIG. 28) is selected via the
As a result, the blood glucose level
(4) Operation and effect
In the above configuration, the blood glucose level
Further, the blood glucose level
For example, when the blood glucose
At this time, when the blood sugar level
Accordingly, the blood glucose level
Moreover, since the blood glucose level
Furthermore, the blood glucose level
The blood glucose level
Therefore, the blood glucose level
As a result, the blood glucose level
In addition, when the
Thereby, the blood glucose level
Further, for example, when the
Therefore, the blood glucose level
Moreover, the blood glucose level
According to the above configuration, the blood glucose level
Further, the blood glucose level
(5) Other embodiments
In the above-described embodiment, the blood glucose level
In the above-described embodiment, the case where one blood glucose level
Furthermore, in the above-described embodiment, the case where the measurement data supplied by the blood glucose
In this case, if the blood glucose level
Further, in the above-described embodiment, the case where the
Further, in the above-described embodiment, the case where the
Furthermore, in the above-described embodiment, the blood glucose level information processing apparatus as the blood glucose level information processing apparatus of the present invention includes the external
本発明の血糖値情報処理装置は、例えばパーソナルコンピュータ以外にも、PDA(Personal Digital Assistant)、携帯電話機等のその他種々の電子機器に適用することができる。
The blood glucose level information processing apparatus of the present invention can be applied to various other electronic devices such as a PDA (Personal Digital Assistant) and a mobile phone in addition to a personal computer, for example.
1……血糖値情報処理システム、2……血糖値情報処理装置、3……プリンタ、4……血糖値測定ユニット、5……血糖値測定器、6……通信モジュール、11……CPU、12……ROM、13……RAM、14……ハードディスクドライブ、15……表示部、16……操作部、17……外部接続インターフェース部、18…時計部、60…時間帯区分テーブル、70……グラフ表示画面、86……比較ボタン、88……スライドバー、300……時間帯区分変更ポップアップメニュー、304……左ボタン、305……右ボタン
DESCRIPTION OF SYMBOLS 1 ... Blood glucose level information processing system, 2 ... Blood glucose level information processing apparatus, 3 ... Printer, 4 ... Blood glucose level measuring unit, 5 ... Blood glucose level measuring device, 6 ... Communication module, 11 ... CPU, DESCRIPTION OF SYMBOLS 12 ... ROM, 13 ... RAM, 14 ... Hard disk drive, 15 ... Display part, 16 ... Operation part, 17 ... External connection interface part, 18 ... Timepiece part, 60 ... Time zone division table, 70 ... ... Graph display screen, 86 ... Comparison button, 88 ... Slide bar, 300 ... Time zone change pop-up menu, 304 ... Left button, 305 ... Right button
Claims (13)
- 外部の血糖値測定装置により測定された単数又は複数の血糖値及び当該単数又は複数の血糖値が測定された測定日時を取得する取得部と、
所定の期間に対応する上記血糖値を上記測定日時に基づいて時系列に沿ってプロットさせた血糖値グラフ、及び上記時系列に沿って平行移動するスライドバーを表示部に対して表示させる表示制御部と
を具え、
上記表示制御部は、
上記スライドバーが平行移動されると、上記期間の範囲を固定させたまま、当該スライドバーの移動量に応じた先の期間に対応した上記血糖値の上記血糖値グラフを表示させる
ことを特徴とする血糖値情報処理装置。 An acquisition unit for acquiring one or more blood glucose levels measured by an external blood glucose level measuring device and a measurement date and time when the one or more blood glucose levels were measured;
Display control for displaying on the display unit a blood glucose level graph in which the blood glucose level corresponding to a predetermined period is plotted along a time series based on the measurement date and time, and a slide bar that translates along the time series With parts and
The display control unit
When the slide bar is translated, the blood glucose level graph of the blood glucose level corresponding to the previous period corresponding to the movement amount of the slide bar is displayed while the range of the period is fixed. Blood glucose level information processing device. - 上記期間に含まれる上記血糖値に関する血糖値情報を算出する算出部と、
上記表示制御部は、
上記血糖値グラフ及び上記スライドバーと共に、上記算出部により算出された上記血糖値情報を表示させる
ことを特徴とする請求項1に記載の血糖値情報処理装置。 A calculation unit for calculating blood glucose level information related to the blood glucose level included in the period;
The display control unit
The blood glucose level information processing apparatus according to claim 1, wherein the blood glucose level information calculated by the calculation unit is displayed together with the blood glucose level graph and the slide bar. - 上記算出部は、
上記血糖値グラフに表示される上記期間が移動した場合、上記血糖値情報を再算出し、
上記表示制御部は、
上記算出部により再計算された上記血糖値情報を表示させる
ことを特徴とする請求項2に記載の血糖値情報処理装置。 The calculation unit is
When the period displayed on the blood glucose level graph moves, recalculate the blood glucose level information,
The display control unit
The blood glucose level information processing apparatus according to claim 2, wherein the blood glucose level information recalculated by the calculation unit is displayed. - 上記表示制御部は、
上記血糖値グラフ、上記スライドバー及び上記血糖値情報と共に、比較ボタンを表示させ、上記比較ボタンが選択されると、上記期間に対して直前の期間の血糖値がプロットされた直前血糖値グラフを上記血糖値グラフと上下に並べて表示させる
ことを特徴とする請求項3に記載の血糖値情報処理装置。 The display control unit
A comparison button is displayed together with the blood glucose level graph, the slide bar and the blood glucose level information, and when the comparison button is selected, a blood glucose level graph immediately before the blood glucose level of the previous period is plotted with respect to the period. The blood sugar level information processing apparatus according to claim 3, wherein the blood sugar level graph is displayed side by side with the blood sugar level graph. - 上記血糖値グラフは、上記血糖値に応じて複数の領域に区分されるよう当該複数の領域が異なる色に配色され、互いに隣接する上記領域同士の境界付近が一方から他方へ徐々に変色するようなグラデーション配色でなる
ことを特徴とする請求項3に記載の血糖値情報処理装置。 In the blood glucose level graph, the plurality of regions are arranged in different colors so as to be divided into a plurality of regions according to the blood glucose level, and the vicinity of the boundary between the adjacent regions gradually changes from one to the other. The blood glucose level information processing apparatus according to claim 3, wherein the blood sugar level information processing apparatus has a gradation color scheme. - 外部の血糖値測定装置により測定された単数又は複数の血糖値及び当該単数又は複数の血糖値が測定された測定日時を取得する取得ステップと、
所定の期間に対応する上記血糖値を上記測定日時に基づいて時系列に沿ってプロットさせた血糖値グラフ、及び上記時系列に沿って平行移動するスライドバーを表示部に対して表示させるグラフ表示ステップと、
上記スライドバーが平行移動されると、上記期間の範囲を固定させたまま、当該スライドバーの移動量に応じた先の期間に対応した上記血糖値の上記血糖値グラフを表示させる移動表示ステップと
ことを特徴とする血糖値情報処理方法。 An acquisition step of acquiring one or more blood glucose levels measured by an external blood glucose level measuring device and a measurement date and time when the one or more blood glucose levels were measured;
A blood glucose level graph in which the blood glucose level corresponding to a predetermined period is plotted along the time series based on the measurement date and time, and a graph display for displaying on the display unit a slide bar that translates along the time series Steps,
When the slide bar is translated, a movement display step of displaying the blood glucose level graph of the blood glucose level corresponding to the previous period corresponding to the movement amount of the slide bar while fixing the range of the period. A blood glucose level information processing method characterized by the above. - コンピュータに対して、
外部の血糖値測定装置により測定された単数又は複数の血糖値及び当該単数又は複数の血糖値が測定された測定日時を取得する取得ステップと、
所定の期間に対応する上記血糖値を上記測定日時に基づいて時系列に沿ってプロットさせた血糖値グラフ、及び上記時系列に沿って平行移動するスライドバーを表示部に対して表示させるグラフ表示ステップと、
上記スライドバーが平行移動されると、上記期間の範囲を固定させたまま、当該スライドバーの移動量に応じた先の期間に対応した上記血糖値の上記血糖値グラフを表示させる移動表示ステップと
を実行させる血糖値情報処理プログラム。 Against the computer,
An acquisition step of acquiring one or more blood glucose levels measured by an external blood glucose level measuring device and a measurement date and time when the one or more blood glucose levels were measured;
A blood glucose level graph in which the blood glucose level corresponding to a predetermined period is plotted along the time series based on the measurement date and time, and a graph display for displaying on the display unit a slide bar that translates along the time series Steps,
When the slide bar is translated, a movement display step of displaying the blood glucose level graph of the blood glucose level corresponding to the previous period corresponding to the movement amount of the slide bar while fixing the range of the period. A blood sugar level information processing program for executing - 外部の血糖値測定装置により測定された単数又は複数の血糖値及び当該単数又は複数の血糖値が測定された測定日時を取得する取得部と、
上記血糖値を上記測定日時に基づいて所定時間帯幅を持つ複数の時間帯区分に区分する区分部と、
上記測定日時に基づく測定日付と上記複数の時間帯区分とを軸として上記血糖値を一覧表示し、そのなかから特定の血糖値が選択されると、当該特定の血糖値の時間帯区分を前後に移動させるための前ボタン及び後ボタンが設けられたポップアップメニューを表示部に対して表示させる表示制御部と、
上記前ボタンが選択されると、上記特定の血糖値を隣接する前の時間帯区分に変更し、上記後ボタンが選択されると、上記特定の血糖値を隣接する後の時間帯区分に変更する変更部と
を具える血糖値情報処理装置。 An acquisition unit for acquiring one or more blood glucose levels measured by an external blood glucose level measuring device and a measurement date and time when the one or more blood glucose levels were measured;
A division unit for dividing the blood glucose level into a plurality of time zone divisions having a predetermined time zone width based on the measurement date and time;
The blood glucose level is displayed in a list with the measurement date based on the measurement date and time and the plurality of time zone segments as axes, and when a specific blood glucose level is selected, the time zone segment of the specific blood glucose level is moved forward and backward. A display control unit for displaying a pop-up menu provided with a front button and a rear button for moving to a display unit;
When the front button is selected, the specific blood glucose level is changed to the adjacent time zone, and when the rear button is selected, the specific blood glucose level is changed to the adjacent time zone. A blood glucose level information processing apparatus comprising: - 上記表示制御部は、上記血糖値を一覧表示させる際、上記測定日時に基づく測定時刻を上記血糖値と共に一覧表示させ、
上記変更部は、
上記特定の血糖値の上記時間帯区分を変更する際、上記測定時刻を変更することなく上記時間帯区分だけを変更する
ことを特徴とする請求項8に記載の血糖値情報処理装置。 When displaying the blood glucose level as a list, the display control unit displays a list of measurement times based on the measurement date and time together with the blood glucose level,
The change part is
The blood glucose level information processing apparatus according to claim 8, wherein when changing the time zone division of the specific blood glucose level, only the time zone division is changed without changing the measurement time. - 上記表示制御部は、
上記ポップアップメニューに、上記前修正ボタン及び上記後修正ボタンに加えて上記特定の血糖値の上記測定日付及び上記測定時刻を表示させ、
上記変更部は、
所定の変更操作に応じて、上記測定日付及び上記測定時刻を変更する
ことを特徴とする請求項8に記載の血糖値情報処理装置。 The display control unit
In the pop-up menu, in addition to the pre-correction button and the post-correction button, the measurement date and the measurement time of the specific blood glucose level are displayed,
The change part is
The blood glucose level information processing apparatus according to claim 8, wherein the measurement date and the measurement time are changed according to a predetermined change operation. - 上記表示制御部は、
上記ポップアップメニューを上記特定の血糖値の直下に表示させる
ことを特徴とする請求項9または10に記載の血糖値情報処理装置。 The display control unit
The blood glucose level information processing apparatus according to claim 9 or 10, wherein the pop-up menu is displayed immediately below the specific blood glucose level. - 外部の血糖値測定装置により測定された単数又は複数の血糖値及び当該単数又は複数の血糖値が測定された測定日時を取得する取得ステップと、
上記血糖値を上記測定日時に基づいて所定時間帯幅を持つ複数の時間帯区分に区分する区分ステップと、
上記測定日時に基づく測定日付と上記複数の時間帯区分とを軸として上記血糖値を一覧表示し、そのなかから特定の血糖値が選択されると、当該特定の血糖値の時間帯区分を前後に移動させるための前ボタン及び後ボタンが設けられたポップアップメニューを表示部に対して表示させる表示制御ステップと、
上記前ボタンが選択されると、上記特定の血糖値を隣接する前の時間帯区分に変更し、上記後ボタンが選択されると、上記特定の血糖値を隣接する後の時間帯区分に変更する変更ステップと
を具える血糖値情報処理方法。 An acquisition step of acquiring one or more blood glucose levels measured by an external blood glucose level measuring device and a measurement date and time when the one or more blood glucose levels were measured;
A step of dividing the blood glucose level into a plurality of time zone segments having a predetermined time zone width based on the measurement date and time;
The blood glucose level is displayed in a list with the measurement date based on the measurement date and time and the plurality of time zone segments as axes, and when a specific blood glucose level is selected, the time zone segment of the specific blood glucose level is moved forward and backward. A display control step for displaying a pop-up menu provided with a front button and a rear button for moving the display on the display unit;
When the front button is selected, the specific blood glucose level is changed to the adjacent time zone, and when the rear button is selected, the specific blood glucose level is changed to the adjacent time zone. A blood glucose level information processing method comprising: - コンピュータに
外部の血糖値測定装置により測定された単数又は複数の血糖値及び当該単数又は複数の血糖値が測定された測定日時を取得する取得ステップと、
上記血糖値を上記測定日時に基づいて所定時間帯幅を持つ複数の時間帯区分に区分する区分ステップと、
上記測定日時に基づく測定日付と上記複数の時間帯区分とを軸として上記血糖値を一覧表示し、そのなかから特定の血糖値が選択されると、当該特定の血糖値の時間帯区分を前後に移動させるための前ボタン及び後ボタンが設けられたポップアップメニューを表示部に対して表示させる表示制御ステップと、
上記前ボタンが選択されると、上記特定の血糖値を隣接する前の時間帯区分に変更し、上記後ボタンが選択されると、上記特定の血糖値を隣接する後の時間帯区分に変更する変更ステップと
を実行させる血糖値情報処理プログラム。 An acquisition step of acquiring one or more blood glucose levels measured by an external blood glucose level measuring device in the computer and a measurement date and time when the one or more blood glucose levels were measured;
A step of dividing the blood glucose level into a plurality of time zone segments having a predetermined time zone width based on the measurement date and time;
The blood glucose level is displayed in a list with the measurement date based on the measurement date and time and the plurality of time zone segments as axes, and when a specific blood glucose level is selected, the time zone segment of the specific blood glucose level is moved forward and backward. A display control step for displaying a pop-up menu provided with a front button and a rear button for moving the display on the display unit;
When the front button is selected, the specific blood glucose level is changed to the adjacent time zone, and when the rear button is selected, the specific blood glucose level is changed to the adjacent time zone. A blood glucose level information processing program for executing
Priority Applications (4)
| Application Number | Priority Date | Filing Date | Title |
|---|---|---|---|
| CN200980138544.1A CN102165306B (en) | 2008-09-29 | 2009-09-16 | Blood sugar information processor, blood sugar information processing method, and blood sugar information processing program |
| EP09816225A EP2333527A4 (en) | 2008-09-29 | 2009-09-16 | Blood sugar information processor, blood sugar information processing method, and blood sugar information processing program |
| US13/074,409 US8626453B2 (en) | 2008-09-29 | 2011-03-29 | Blood glucose level information processing apparatus, blood glucose level information processing method and blood glucose level information processing program |
| HK11113098.1A HK1158754A1 (en) | 2008-09-29 | 2011-12-05 | Blood sugar information processor, blood sugar information processing method |
Applications Claiming Priority (4)
| Application Number | Priority Date | Filing Date | Title |
|---|---|---|---|
| JP2008-251768 | 2008-09-29 | ||
| JP2008251767A JP5185049B2 (en) | 2008-09-29 | 2008-09-29 | Blood glucose level information processing apparatus, blood glucose level information processing method, and blood glucose level information processing program |
| JP2008251768A JP2010082009A (en) | 2008-09-29 | 2008-09-29 | Blood sugar information processor, blood sugar information processing method, and blood sugar information processing program |
| JP2008-251767 | 2008-09-29 |
Related Child Applications (1)
| Application Number | Title | Priority Date | Filing Date |
|---|---|---|---|
| US13/074,409 Continuation US8626453B2 (en) | 2008-09-29 | 2011-03-29 | Blood glucose level information processing apparatus, blood glucose level information processing method and blood glucose level information processing program |
Publications (1)
| Publication Number | Publication Date |
|---|---|
| WO2010035811A1 true WO2010035811A1 (en) | 2010-04-01 |
Family
ID=42059806
Family Applications (1)
| Application Number | Title | Priority Date | Filing Date |
|---|---|---|---|
| PCT/JP2009/066707 WO2010035811A1 (en) | 2008-09-29 | 2009-09-16 | Blood sugar information processor, blood sugar information processing method, and blood sugar information processing program |
Country Status (5)
| Country | Link |
|---|---|
| US (1) | US8626453B2 (en) |
| EP (1) | EP2333527A4 (en) |
| CN (2) | CN102165306B (en) |
| HK (1) | HK1158754A1 (en) |
| WO (1) | WO2010035811A1 (en) |
Cited By (5)
| Publication number | Priority date | Publication date | Assignee | Title |
|---|---|---|---|---|
| JP2014144025A (en) * | 2013-01-25 | 2014-08-14 | Terumo Corp | Blood sugar meter |
| JP5802656B2 (en) * | 2010-04-14 | 2015-10-28 | アークレイ株式会社 | Blood glucose level measuring device, blood glucose level measurement result display method, and blood glucose level measurement result display control program |
| CN106908594A (en) * | 2011-03-31 | 2017-06-30 | 泰尔茂株式会社 | blood glucose value data processing method |
| CN109843155A (en) * | 2016-10-19 | 2019-06-04 | 三星电子株式会社 | For providing the electronic device and method of blood glucose care |
| US10485488B2 (en) | 2015-06-24 | 2019-11-26 | Cardiac Pacemakers, Inc. | Event detection using a variable threshold |
Families Citing this family (22)
| Publication number | Priority date | Publication date | Assignee | Title |
|---|---|---|---|---|
| US8346335B2 (en) | 2008-03-28 | 2013-01-01 | Abbott Diabetes Care Inc. | Analyte sensor calibration management |
| DK3718922T3 (en) | 2009-08-31 | 2022-04-19 | Abbott Diabetes Care Inc | Glucose monitoring system and procedure |
| EP2660606B1 (en) * | 2010-12-28 | 2017-05-03 | Terumo Kabushiki Kaisha | Blood glucose measuring device |
| JP5771060B2 (en) * | 2011-05-02 | 2015-08-26 | シスメックス株式会社 | Sample analyzer and data processing apparatus |
| US9451907B2 (en) | 2011-06-22 | 2016-09-27 | Arkray, Inc. | Measuring apparatus |
| US9519393B2 (en) * | 2011-09-30 | 2016-12-13 | Siemens Schweiz Ag | Management system user interface for comparative trend view |
| EP2843413B1 (en) * | 2012-04-24 | 2020-05-06 | Terumo Kabushiki Kaisha | Blood glucose meter |
| US20140068487A1 (en) * | 2012-09-05 | 2014-03-06 | Roche Diagnostics Operations, Inc. | Computer Implemented Methods For Visualizing Correlations Between Blood Glucose Data And Events And Apparatuses Thereof |
| WO2014052136A1 (en) | 2012-09-26 | 2014-04-03 | Abbott Diabetes Care Inc. | Method and apparatus for improving lag correction during in vivo measurement of analyte concentration with analyte concentration variability and range data |
| WO2014115851A1 (en) * | 2013-01-25 | 2014-07-31 | テルモ株式会社 | Blood glucose meter |
| CN103646411A (en) * | 2013-12-25 | 2014-03-19 | 友达光电股份有限公司 | Chart analysis system and method |
| EP4035586A1 (en) | 2015-04-16 | 2022-08-03 | Gentuity LLC | Micro-optic probes for neurology |
| JP6981967B2 (en) | 2015-08-31 | 2021-12-17 | ジェンテュイティ・リミテッド・ライアビリティ・カンパニーGentuity, LLC | Imaging system including imaging probe and delivery device |
| CA3016176A1 (en) * | 2016-03-17 | 2017-09-21 | Becton, Dickinson And Company | Medical record system using a patient avatar |
| US10925547B2 (en) * | 2017-01-16 | 2021-02-23 | Bionime Corporation | System for monitoring physiological condition |
| TWI667012B (en) * | 2017-06-30 | 2019-08-01 | 華廣生技股份有限公司 | Method for analyzing physiological parameter values |
| CN109215784B (en) * | 2017-06-30 | 2022-11-18 | 华广生技股份有限公司 | Method for analyzing physiological parameter values |
| JP6347881B1 (en) * | 2017-08-23 | 2018-06-27 | イセット株式会社 | Automatic notification device |
| JP7160935B2 (en) | 2017-11-28 | 2022-10-25 | ジェンテュイティ・リミテッド・ライアビリティ・カンパニー | Imaging system |
| US11553861B1 (en) * | 2018-05-29 | 2023-01-17 | My Salt and Sugar, LLC | Apparatus to detect salt concentrations and glucose in bodily fluids |
| JP7205145B2 (en) * | 2018-10-02 | 2023-01-17 | カシオ計算機株式会社 | Electronic clock and display method |
| CN113053059A (en) * | 2021-03-17 | 2021-06-29 | 北京融安特智能科技股份有限公司 | Information display method and device, computing equipment and storage medium |
Citations (6)
| Publication number | Priority date | Publication date | Assignee | Title |
|---|---|---|---|---|
| JPS63135144A (en) * | 1986-11-27 | 1988-06-07 | シャープ株式会社 | Electronic clinical thermometer |
| JP2000060803A (en) | 1998-08-21 | 2000-02-29 | Terumo Corp | Blood sugar level information processing system |
| JP2001245900A (en) * | 2000-03-02 | 2001-09-11 | Arkray Inc | Graph, its indication method and apparatus for its indication |
| JP2003271737A (en) * | 2002-03-15 | 2003-09-26 | Matsushita Electric Ind Co Ltd | Medical examination assisting system |
| JP2008191716A (en) * | 2007-01-31 | 2008-08-21 | Signpost Corp | Method for presenting risk of disease and its program |
| US20080235053A1 (en) * | 2007-03-20 | 2008-09-25 | Pinaki Ray | Communication medium for diabetes management |
Family Cites Families (3)
| Publication number | Priority date | Publication date | Assignee | Title |
|---|---|---|---|---|
| US5345550A (en) * | 1992-12-23 | 1994-09-06 | International Business Machines Corporation | User-modifiable popup menus for object oriented behavior |
| AU2003268538A1 (en) * | 2002-09-11 | 2004-04-30 | Becton, Dickinson And Company | Monitoring blood glucose including convenient display of measurement values________________________________________________________ |
| US20070033074A1 (en) * | 2005-06-03 | 2007-02-08 | Medtronic Minimed, Inc. | Therapy management system |
-
2009
- 2009-09-16 EP EP09816225A patent/EP2333527A4/en not_active Ceased
- 2009-09-16 CN CN200980138544.1A patent/CN102165306B/en not_active Expired - Fee Related
- 2009-09-16 WO PCT/JP2009/066707 patent/WO2010035811A1/en active Application Filing
- 2009-09-16 CN CN2012105077689A patent/CN103091309A/en active Pending
-
2011
- 2011-03-29 US US13/074,409 patent/US8626453B2/en not_active Expired - Fee Related
- 2011-12-05 HK HK11113098.1A patent/HK1158754A1/en not_active IP Right Cessation
Patent Citations (6)
| Publication number | Priority date | Publication date | Assignee | Title |
|---|---|---|---|---|
| JPS63135144A (en) * | 1986-11-27 | 1988-06-07 | シャープ株式会社 | Electronic clinical thermometer |
| JP2000060803A (en) | 1998-08-21 | 2000-02-29 | Terumo Corp | Blood sugar level information processing system |
| JP2001245900A (en) * | 2000-03-02 | 2001-09-11 | Arkray Inc | Graph, its indication method and apparatus for its indication |
| JP2003271737A (en) * | 2002-03-15 | 2003-09-26 | Matsushita Electric Ind Co Ltd | Medical examination assisting system |
| JP2008191716A (en) * | 2007-01-31 | 2008-08-21 | Signpost Corp | Method for presenting risk of disease and its program |
| US20080235053A1 (en) * | 2007-03-20 | 2008-09-25 | Pinaki Ray | Communication medium for diabetes management |
Non-Patent Citations (1)
| Title |
|---|
| See also references of EP2333527A4 * |
Cited By (7)
| Publication number | Priority date | Publication date | Assignee | Title |
|---|---|---|---|---|
| JP5802656B2 (en) * | 2010-04-14 | 2015-10-28 | アークレイ株式会社 | Blood glucose level measuring device, blood glucose level measurement result display method, and blood glucose level measurement result display control program |
| CN106908594A (en) * | 2011-03-31 | 2017-06-30 | 泰尔茂株式会社 | blood glucose value data processing method |
| CN106908594B (en) * | 2011-03-31 | 2020-02-04 | 泰尔茂株式会社 | Blood glucose value data processing method |
| JP2014144025A (en) * | 2013-01-25 | 2014-08-14 | Terumo Corp | Blood sugar meter |
| US10485488B2 (en) | 2015-06-24 | 2019-11-26 | Cardiac Pacemakers, Inc. | Event detection using a variable threshold |
| US11166679B2 (en) | 2015-06-24 | 2021-11-09 | Cardiac Pacemakers, Inc. | Event detection using a variable threshold |
| CN109843155A (en) * | 2016-10-19 | 2019-06-04 | 三星电子株式会社 | For providing the electronic device and method of blood glucose care |
Also Published As
| Publication number | Publication date |
|---|---|
| US8626453B2 (en) | 2014-01-07 |
| HK1158754A1 (en) | 2012-07-20 |
| EP2333527A1 (en) | 2011-06-15 |
| CN103091309A (en) | 2013-05-08 |
| CN102165306B (en) | 2014-01-15 |
| US20110196217A1 (en) | 2011-08-11 |
| EP2333527A4 (en) | 2012-03-14 |
| CN102165306A (en) | 2011-08-24 |
Similar Documents
| Publication | Publication Date | Title |
|---|---|---|
| WO2010035811A1 (en) | Blood sugar information processor, blood sugar information processing method, and blood sugar information processing program | |
| JP5185049B2 (en) | Blood glucose level information processing apparatus, blood glucose level information processing method, and blood glucose level information processing program | |
| US11450411B2 (en) | Interface for a health measurement and monitoring system | |
| AU2009201094B2 (en) | Analyte test meter | |
| EP2154532B1 (en) | Analyte testing method and system | |
| JP2010082009A (en) | Blood sugar information processor, blood sugar information processing method, and blood sugar information processing program | |
| CN107847140A (en) | The systems, devices and methods for detecting and assessing for paresthesia epilepsy | |
| US20130318439A1 (en) | Analyte testing method and system with high and low analyte trends notification | |
| US20140068487A1 (en) | Computer Implemented Methods For Visualizing Correlations Between Blood Glucose Data And Events And Apparatuses Thereof | |
| US20160210430A1 (en) | Data management unit for supporting health control | |
| US20080208509A1 (en) | System and method for graphically plotting and displaying analyte concentration data on a calendar | |
| EP2989571A2 (en) | Diabetes management system with contextual drill down reports | |
| KR20130116290A (en) | Analyte testing method and system with high and low analyte trends notification |
Legal Events
| Date | Code | Title | Description |
|---|---|---|---|
| WWE | Wipo information: entry into national phase |
Ref document number: 200980138544.1 Country of ref document: CN |
|
| 121 | Ep: the epo has been informed by wipo that ep was designated in this application |
Ref document number: 09816225 Country of ref document: EP Kind code of ref document: A1 |
|
| WWE | Wipo information: entry into national phase |
Ref document number: 2009816225 Country of ref document: EP |
|
| NENP | Non-entry into the national phase |
Ref country code: DE |