KR20100126431A - Automatically prescribing total budget for marketing and sales resources and allocation across spending categories - Google Patents
Automatically prescribing total budget for marketing and sales resources and allocation across spending categories Download PDFInfo
- Publication number
- KR20100126431A KR20100126431A KR1020107021187A KR20107021187A KR20100126431A KR 20100126431 A KR20100126431 A KR 20100126431A KR 1020107021187 A KR1020107021187 A KR 1020107021187A KR 20107021187 A KR20107021187 A KR 20107021187A KR 20100126431 A KR20100126431 A KR 20100126431A
- Authority
- KR
- South Korea
- Prior art keywords
- media
- resources
- marketing
- facility
- user
- Prior art date
Links
Images


Classifications
-
- G—PHYSICS
- G06—COMPUTING; CALCULATING OR COUNTING
- G06Q—INFORMATION AND COMMUNICATION TECHNOLOGY [ICT] SPECIALLY ADAPTED FOR ADMINISTRATIVE, COMMERCIAL, FINANCIAL, MANAGERIAL OR SUPERVISORY PURPOSES; SYSTEMS OR METHODS SPECIALLY ADAPTED FOR ADMINISTRATIVE, COMMERCIAL, FINANCIAL, MANAGERIAL OR SUPERVISORY PURPOSES, NOT OTHERWISE PROVIDED FOR
- G06Q30/00—Commerce
- G06Q30/02—Marketing; Price estimation or determination; Fundraising
- G06Q30/0241—Advertisements
- G06Q30/0249—Advertisements based upon budgets or funds
-
- G—PHYSICS
- G06—COMPUTING; CALCULATING OR COUNTING
- G06Q—INFORMATION AND COMMUNICATION TECHNOLOGY [ICT] SPECIALLY ADAPTED FOR ADMINISTRATIVE, COMMERCIAL, FINANCIAL, MANAGERIAL OR SUPERVISORY PURPOSES; SYSTEMS OR METHODS SPECIALLY ADAPTED FOR ADMINISTRATIVE, COMMERCIAL, FINANCIAL, MANAGERIAL OR SUPERVISORY PURPOSES, NOT OTHERWISE PROVIDED FOR
- G06Q10/00—Administration; Management
- G06Q10/06—Resources, workflows, human or project management; Enterprise or organisation planning; Enterprise or organisation modelling
- G06Q10/063—Operations research, analysis or management
- G06Q10/0631—Resource planning, allocation, distributing or scheduling for enterprises or organisations
-
- G—PHYSICS
- G06—COMPUTING; CALCULATING OR COUNTING
- G06Q—INFORMATION AND COMMUNICATION TECHNOLOGY [ICT] SPECIALLY ADAPTED FOR ADMINISTRATIVE, COMMERCIAL, FINANCIAL, MANAGERIAL OR SUPERVISORY PURPOSES; SYSTEMS OR METHODS SPECIALLY ADAPTED FOR ADMINISTRATIVE, COMMERCIAL, FINANCIAL, MANAGERIAL OR SUPERVISORY PURPOSES, NOT OTHERWISE PROVIDED FOR
- G06Q30/00—Commerce
Abstract
일 실시예에서, 경험적으로 획득된 계량경제학적 데이터에 기초하여 대상 매물에 대한 수익과 같은 영업 결과를 최적화하도록 의도된 방식으로, (1) 대상 매물에 대한 마케팅 및 세일즈 리소스들에 대한 전체 예산 및 (2) 복수의 지출 카테고리('활동'이라고도 함)에 걸친 그 전체 예산의 할당 둘다를 자동으로 지정하기 위하여, 대상 매물의 정성적 기술을 이용하는 소프트웨어 퍼실리티('퍼실리티')가 제공된다.In one embodiment, in a manner intended to optimize sales results, such as revenue for the target sale, based on empirically obtained quantitative economic data, (1) the overall budget for marketing and sales resources for the target sale and (2) A software facility (“facilities”) that utilizes the qualitative description of the object offering is provided to automatically specify both allocations of the overall budget across a plurality of spending categories (also referred to as 'activities').
Description
본 출원은 1) 2008년 2월 21일에 출원된 미국 특허 가출원 제61/030,550호, 2) 2008년 7월 28일에 출원된 미국 특허 가출원 제61/084,252호, 3) 2008년 7월 28일에 출원된 미국 특허 가출원 제61/084,255호, 4) 2008년 8월 1일에 출원된 미국 특허 가출원 제61/085,819호, 및 5)2008년 8월 1일에 출원된 미국 특허 가출원 제 61/085,820호의 우선권을 주장하며, 이들은 본 명세서에 참조에 의해 포함된다.This application is directed to: 1) US Provisional Application No. 61 / 030,550, filed Feb. 21, 2008, 2) US Provisional Application No. 61 / 084,252, filed July 28, 2008, 3) July 2008. U.S. Provisional Application No. 61 / 084,255, filed May 4, U.S. Provisional Application No. 61 / 085,819, filed August 1, 2008, and 5) U.S. Provisional Application No. 61, filed August 1, 2008 / 085,820, which are incorporated herein by reference.
설명된 기술은 자동화된 결정 지원 툴들의 분야, 구체적으로는 자동화된 예산편성 툴들의 분야에 관한 것이다.The described technique relates to the field of automated decision support tools, specifically to the field of automated budgeting tools.
마케팅 통신("마케팅")은 제품이나 서비스 - 즉, "매물(offering)"의 판매자들이 그 매물에 대하여 잠재적인 구매자들을 교육하게 해주는 프로세스이다. 마케팅은 종종 판매자들의 주요한 비용이며, 종종 각종의 상이한 광고 매체 및/또는 아웃렛들 등의 다수의 컴포넌트들이나 카테고리들, 및 기타 마케팅 기술들로 이루어진다. 다수의 컴포넌트들 각각에 지출의 레벨을 귀속시키는 마케팅 예산을 개발하는 것에 연루된 복잡성에도 불구하고, 유용한 자동화된 결정 지원 툴들은 거의 없기 때문에, 이 활동을 주관적인 결정에 의존하여 수동으로 수행하는 것이 보편화되어 있으며, 많은 경우들에서 불리한 결과들을 초래한다.Marketing communication ("marketing") is a process that allows sellers of a product or service-that is, "offering" to educate potential buyers about the property. Marketing is often the major cost of sellers and often consists of a number of components or categories, such as various different advertising media and / or outlets, and other marketing techniques. Despite the complexity involved in developing marketing budgets attributing levels of spending to each of a number of components, there are few useful automated decision support tools, so it is common practice to perform this activity manually based on subjective decisions. And in many cases adverse consequences.
유용한 결정 지원 툴들이 존재하는 몇몇 경우, 툴의 사용자가, 대상 매물(subject offering)로의 마케팅 리소스들의 과거의 할당에 대한 많은 양의 데이터 및 그들이 생성한 결과들을 제공할 필요가 있는 것이 보통이다. 새로운 매물의 경우와 같은 많은 경우들에서, 그러한 데이터는 이용가능하지 않다. 그러한 데이터가 이용 가능한 경우에도, 이 데이터에 액세스하고 이것을 결정 지원 툴에 제공하는 것은 불편할 수 있다.In some cases where useful decision support tools exist, it is common for a user of the tool to provide a large amount of data and past results of their assignment of marketing resources to a subject offering. In many cases, such as in the case of a new sale, such data is not available. Even when such data is available, it can be inconvenient to access this data and provide it to the decision support tool.
따라서, 사용자가 매물에 대한 과거의 실적 데이터(performance data)를 제공할 필요없이, 자금 또는 다른 리소스들을 매물에 유리하게 할당하는 것을 자동적으로 지정하는 툴 및 그것의 각종 컴포넌트들은 상당한 유용성이 있을 것이다.Thus, tools and their various components that automatically specify the allocation of funds or other resources to the property in favor of the user without having to provide historical performance data for the property will be of considerable utility.
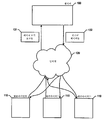
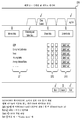
도 1은 퍼실리티(facility)를 제공하는 데에 이용되는 컴포넌트들의 전형적인 배치 내에서의 데이터 흐름을 도시하는 고레벨 데이터 흐름도.
도 2는 퍼실리티가 실행되는 컴퓨터 시스템들 및 기타 장치들 중 적어도 일부에 통상적으로 포함되는 컴포넌트들 중 일부를 도시하는 블럭도.
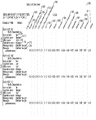
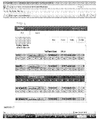
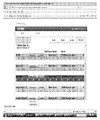
도 3은 과거의 마케팅 노력들의 라이브러리의 샘플 콘텐츠를 도시하는 테이블도.
도 4는 퍼실리티에 대한 접근을 허가된 사용자들로 제한하기 위해 퍼실리티에 의해 이용되는 로그인 페이지(sign-in page)를 도시하는 디스플레이도.
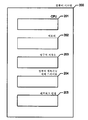
도 5는 보기/편집 모드에서 퍼실리티에 의해 생성된 페이지 디스플레이를 도시하는 흐름도.
도 6-9는 전체적인 마케팅 예산 및 그 배분이 퍼실리티에 의해 지정되기 위한 대상 매물에 대한 정보를 요청하기 위해 퍼실리티에 의해 제공된 디스플레이들을 도시하는 도면.
도 10은 사용자가 결과들을 검토하기 위한 분석의 형태를 선택하는 것을 허용하기 위하여, 대상 매물에 대한 정보 수집 후 퍼실리티에 의해 제공되는 결과 네비게이션 디스플레이를 도시하는 디스플레이도.
도 11은 퍼실리티가 갖는 최적의 전체 마케팅 예산을 전달하기 위해 퍼실리티에 의해 제공된 디스플레이가 대상 매물에 대하여 결정되는 것을 도시하는 디스플레이도.
도 12는 지출 믹스 정보를 보여주기 위하여 퍼실리티에 의해 제공된 디스플레이. 이 디스플레이는 퍼실리티에 의해 지정된 전체 예산(1201)을 포함한다.
도 13은 사용자로부터 추가적인 매물 속성 정보를 수집하는 것을 설명하는 프로세스도.
도 14는 대상 매물에 대하여 도출된 세 개의 척도들: 인지(cognition), 감성(affect), 및 경험(experience)의 전개를 도시하는 프로세스도.
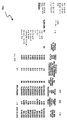
도 15는 도 14에 도시된 세 개의 도출된 속성들의 상이한 조합에 대한 각각의 마케팅 활동 할당들의 세트들을 도시하는 테이블도.
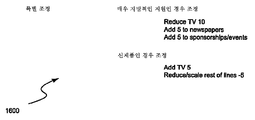
도 16은 도 15의 테이블에 의해 지정된 초기 할당이 다수의 특별한 조건들에 대하여 어떻게 조정되어야 하는지를 도시하는 프로세스도.
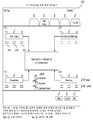
도 17은 퍼실리티가 각각의 마케팅 활동에서의 지출에 대한 달러 금액을 어떻게 결정하는지 도시하는 프로세스도.
도 18은 도 17에 도시된 결과들에 대한 최종적인 조정을 도시하는 프로세스도.
도 19는 세 가지 상이한 형태들로 패키지된 동일 제품과 같이, 다수의 관련된 대상 매물들에 관하여 퍼실리티에 의해 만들어진 리소스 할당 지정들(resource allocation prescriptions)을 표현하기 위하여 퍼실리티에 의해 제공된 디스플레이를 도시하는 디스플레이도.
도 20 내지 도 23은 데이터 입력들을 지정하고 자동으로 수집하기 위해 일부 실시예들에서 퍼실리티에 의해 제시되는 전형적인 사용자 인터페이스를 도시하는 디스플레이도.
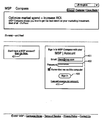
도 24 내지 도 26은 임의의 리소스 또는 매체 채널에 대한 디지탈 구매의 방법을 제공하는 퍼실리티를 위한 스크린샷을 도시한 도면.1 is a high level data flow diagram illustrating the flow of data within a typical arrangement of components used to provide facility.
2 is a block diagram illustrating some of the components typically included in at least some of the computer systems and other devices on which the facility is executed.
3 is a table diagram illustrating sample content of a library of past marketing efforts.
4 is a display diagram showing a sign-in page used by the facility to limit access to the facility to authorized users.
Fig. 5 is a flow chart showing page display generated by the facility in the view / edit mode.
6-9 illustrate the displays provided by the facility to request information about the item for sale for the overall marketing budget and its allocation to be specified by the facility.
FIG. 10 is a display diagram illustrating a results navigation display provided by the facility after collecting information about the subject property to allow the user to select a form of analysis for reviewing the results.
FIG. 11 is a display diagram illustrating that a display provided by a facility is determined for a subject for sale to convey an optimal overall marketing budget of the facility.
12 is a display provided by the facility to show expenditure mix information. This display includes the overall budget 1201 specified by the facility.
13 is a process diagram illustrating collecting additional property information from a user.
FIG. 14 is a process diagram illustrating the development of three measures: cognition, affect, and experience derived for a subject offering.
FIG. 15 is a table diagram illustrating sets of respective marketing activity assignments for different combinations of the three derived attributes shown in FIG. 14.
16 is a process diagram showing how the initial allocation specified by the table of FIG. 15 should be adjusted for a number of special conditions.
FIG. 17 is a process diagram illustrating how the facility determines a dollar amount for expenditure in each marketing activity.
FIG. 18 is a process diagram showing final adjustments to the results shown in FIG. 17. FIG.
FIG. 19 is a display showing a display provided by the facility to represent resource allocation prescriptions made by the facility with respect to a number of related subject offerings, such as the same product packaged in three different forms. Degree.
20-23 are display diagrams illustrating a typical user interface presented by the facility in some embodiments for specifying and automatically collecting data inputs.
24-26 illustrate screenshots for a facility that provides a method of digital purchase for any resource or media channel.
이하의 설명은 본 발명의 다양한 실시예들을 설명하는 것으로 의도된다. 따라서, 논의되는 구체적인 수정들은 본 발명의 범위에 대한 제한으로서 해석되어서는 안 된다. 당업자라면, 본 발명의 범위를 벗어나지 않고서 다양한 등가물, 변경들 및 수정들이 이루어질 수 있음을 분명히 알고, 그러한 등가적인 실시예들도 여기에 포함되어야 함을 이해할 것이다.The following description is intended to describe various embodiments of the invention. Accordingly, the specific modifications discussed should not be construed as limitations on the scope of the invention. Those skilled in the art will clearly appreciate that various equivalents, changes, and modifications may be made without departing from the scope of the present invention, and that such equivalent embodiments should be included herein.
경험적으로 획득된 계량경제학적 데이터(econometric data)에 기초하여 대상 매물에 대한 수익 등의 영업 결과를 최적화시키는 방식으로, (1) 대상 매물에 대한 마케팅 및 세일즈 리소스들에 대한 전체 예산 및 (2) 복수의 지출 카테고리들("활동들"로도 호칭됨)에 대한 전체 예산의 할당 모두를 자동적으로 지정하기 위하여 대상 매물의 정성적 설명(qualitative description)을 이용하는 소프트웨어 퍼실리티("퍼실리티")가 제공된다.(1) the overall budget for marketing and sales resources for the target item and (2) by optimizing sales results, such as revenue for the target item, based on empirically obtained econometric data. A software facility (“facilities”) that utilizes the qualitative description of the object for sale is automatically provided to automatically specify all allocations of the overall budget for a plurality of spending categories (also called “activities”).
초기화 단계에서, 퍼실리티는 대상 매물에 대한 마케팅 노력에 필요한 관계를 갖지 않는 각종 매물들에 대한 과거의 마케팅 노력들에 대한 데이터를 고려한다. 이 데이터는 각각의 그러한 노력에 대하여, (1) 마케팅된 매물의 특징; (2) 전체 마케팅 예산; (3) 마케팅 활동들 사이의 할당; 및 (4) 영업 결과들을 반영한다. 이 데이터는 직접 수행한 마케팅 연구들에 의하거나, 학술 간행물들로부터의 획득에 의하는 등 다양한 방법들로 획득될 수 있다.In the initialization phase, the facility considers data about past marketing efforts for various items that do not have a relationship necessary for the marketing effort for the target item. This data includes, for each such effort, (1) the characteristics of the marketed property; (2) the overall marketing budget; (3) allocation among marketing activities; And (4) reflect business results. This data can be obtained in a variety of ways, such as by direct marketing studies or by acquisitions from academic publications.
퍼실리티는 이 데이터를 이용하여 퍼실리티의 목적들에 적합한 리소스들을 생성한다. 첫째, 퍼실리티는 전체 마케팅 예산에 특정 레벨의 리소스들을 할당하는 것의 영업 결과에 대한 영향을 예측하는, 과거의 모든 마케팅 노력들에 걸친 전체 마케팅 예산에 대한 평균 탄력성 척도(average elasticity measure)를 계산한다. 둘째, 퍼실리티는 전체 마케팅 예산에 대한 평균 탄력성 척도에 대하여, 전체 마케팅 예산에 대한 평균 탄력성 척도가 과거의 마케팅 노력들의 특정의 특징들을 반영하기 위해 얼마나 증가 또는 감소하는지를 지정하는 다수의 조정 인자들을 도출한다. 셋째, 정성적으로 유사한 매물들의 다수의 그룹들의 각각의 과거의 마케팅 노력들에 대하여, 퍼실리티는 그룹에 대한 마케팅 노력들의 영업 결과에 각각의 마케팅 활동이 영향을 미친 정도를 나타내는 활동당 탄력성 척도들(per-activity elasticity measures)를 도출한다.The facility uses this data to create resources suitable for the purposes of the facility. First, the facility calculates an average elasticity measure for the overall marketing budget across all past marketing efforts, which predicts the impact on sales results of allocating specific levels of resources to the overall marketing budget. Second, the facility derives a number of adjustment factors that, relative to the average elasticity measure for the overall marketing budget, specify how the average elasticity measure for the overall marketing budget increases or decreases to reflect certain characteristics of past marketing efforts. . Third, for each past marketing efforts of multiple groups of qualitatively similar items, the facility measures per-elasticity elasticity measures that indicate the extent to which each marketing activity influenced the sales outcomes of the marketing efforts for the group. Per-activity elasticity measures are derived.
퍼실리티는 사용자로부터 대상 매물의 정성적 설명을 요청하기 위해 인터뷰 기술들을 이용한다. 퍼실리티는 요청된 정성적 설명의 일부를 이용하여 전체 마케팅 예산에 대한 평균 탄력성 척도에 적용할 조정 인자들을 식별한다. 퍼실리티는 대상 매물에 대한 수익의 최고 레벨을 생성하거나, 사용자가 지정한 기타 목적을 최대화하는 것으로 예측된 이상적인 전체 마케팅 예산을 식별하기 위해 상기 식별된 조정 인자들에 의해 조정된 전체 마케팅 예산에 대한 평균 탄력성 척도의 한 버전을 이용한다.The facility uses interviewing techniques to request a qualitative description of the subject offering from the user. The facility uses some of the requested qualitative descriptions to identify adjustment factors to apply to the average elasticity measure for the overall marketing budget. The facility is the average resiliency of the overall marketing budget adjusted by the identified adjustment factors to generate the highest level of revenue for the target property or to identify the ideal overall marketing budget that is expected to maximize the other objectives specified by the user. Use a version of the scale.
이상적인 전체 마케팅 예산을 식별한 후, 퍼실리티는 대상 매물의 요청된 정성적 설명을 이용하여 대상 매물이 다른 매물들의 그룹들 중 어느 것에 가장 근사하게 매칭하는지 결정하고, 그 그룹에 대하여 도출된 활동당 탄력성 척도들의 세트로부터 이상적 마케팅 활동 할당들의 세트를 도출한다.After identifying the ideal overall marketing budget, the facility uses the requested qualitative description of the target offering to determine which of the groups of other listings most closely matches the elasticity per activity derived for that group. A set of ideal marketing activity assignments are derived from a set of measures.
일부 실시예들에서, 퍼실리티는 배급된 매체(syndicated media), 배급된 세일즈 데이터, 인터넷 매체, 인터넷 행동 데이터(internet behavioral data), 자연 검색 질의 데이터(natural search query data), 유료 검색 활동 데이터(paid search activity data), 텔레비젼, 라디오, 프린트와 같은 매체 데이터, 소비자 행동 데이터, 추적 조사 데이터(tracking survey data), 경제학적 데이터, 기상 데이터, 주식 시장과 같은 금융 데이터, 경쟁 마케팅 지출 데이터(competitive marketing spend data), 및 온라인 및 오프라인 세일즈 데이터를 포함하는 다수의 유형의 외부 소스들 중 하나 이상으로부터 수신된 데이터를 고려한다.In some embodiments, the facility may include syndicated media, distributed sales data, internet media, internet behavioral data, natural search query data, paid search activity data. media data such as search activity data, television, radio, print, consumer behavior data, tracking survey data, economic data, weather data, financial data such as stock market, competitive marketing spend data data), and data received from one or more of a number of types of external sources, including online and offline sales data.
일부 실시예들에서, 퍼실리티는 상이한 사용자 입력들에 기초하는 2개의 상이한 최적화 스킴을 이용하여 생성된 작업-보정된 리소스 할당들(work-amended resource allocations)을 결합하기 위해, 리소스 탄력성들(resource elasticities) 또는 리프트 인자들(lift factors)의 균일한 집합을 이용한다. 일부 실시예들에서, 퍼실리티들은 퍼실리티가 추천하는 할당들에 따라 마케팅 리소스들을 구매하고 스케쥴링하기 위한 기능성을 제공한다. 일부 실시예들에서, 퍼실리티는 멀티미디어 유형 및/또는 멀티플랫폼 매체 공급자들 내에서 자원 할당들을 최적화한다.In some embodiments, the facility uses resource elasticities to combine work-amended resource allocations created using two different optimization schemes based on different user inputs. ) Or use a uniform set of lift factors. In some embodiments, the facilities provide functionality for purchasing and scheduling marketing resources according to allocations recommended by the facility. In some embodiments, the facility optimizes resource allocations within multimedia type and / or multiplatform media providers.
이 방식으로, 퍼실리티는 사용자가 대상 매물에 대한 과거의 실적 데이터를 제공할 필요없이 대상 매물에 대한 전체 마케팅 리소스 할당 및 배분을 자동적으로 지정한다.In this way, the facility automatically assigns the overall marketing resource allocation and allocation to the target item without the user having to provide historical performance data for the target item.
퍼실리티에 의해 결정되는 세일즈 또는 마켓 응답 곡선은 다양한 리소스 드라이버들의 수학적 함수로서 영업 결과를 예상한다.The sales or market response curve determined by the facility predicts sales results as a mathematical function of various resource drivers.
세일즈 = F(드라이버 변수들의 임의의 집합)Sales = F (any set of driver variables)
여기에서, F는 수확 체감(diminishing returns)의 적절한 경제적 특성을 갖는 통계 함수를 나타낸다.Here, F represents a statistical function with appropriate economic characteristics of diminishing returns.
또한, 이러한 관계는 시계열(time series), 단면(cross-section), 또는 시계열 및 단면 둘다인 데이터에 기초하므로, 이 방법은 내재적으로 기본 조건들(underlying conditions)에 대한 직접, 간접 및 상호작용 효과들을 산출해낸다.In addition, since this relationship is based on data that is time series, cross-section, or both time series and cross-section, the method inherently has direct, indirect and interactive effects on underlying conditions. Yields them.
이러한 효과들은 기본 드라이버 변수들 및 데이터 구조들에서의 변경에 세일즈가 어떻게 응답하는지를 기술한다. 이러한 응답 효과들은 주로 "리프트 인자"로 알려져 있다. 특수한 부분집합 또는 케이스로서, 이러한 방법들은 단면들 또는 시계열에 대한 임의의 온-오프 조건을 읽는 것을 허용한다.These effects describe how sales respond to changes in basic driver variables and data structures. These response effects are mainly known as "lift factors". As a special subset or case, these methods allow reading any on-off condition for cross sections or time series.
상이한 유형의 리프트 인자들을 결정하고 적용하는 데에 적합한 통계 함수들의 다양한 클래스들이 존재한다. 일부 실시예들에서, 퍼실리티는 리프트 인자들의 곱셈 및 로그 로그(multiplicative and log log)(자연로그를 이용함) 및 포인트 추정(point estimates)으로서 알려진 클래스를 이용한다.There are various classes of statistical functions suitable for determining and applying different types of lift factors. In some embodiments, the facility uses a class known as multiplicative and log log (using natural log) and point estimates of lift factors.
소정 상황들에서, 퍼실리티는 카테고리별(categorical) 드라이버 데이터 및 카테고리별 결과에 적용하는 방법들을 이용한다. 이들은 다항 로짓(multinomial logit), 로짓, 프로빗, 비-매개변수 또는 해저드(hazard) 방법으로서 알려진 확률적 리프트 인자들의 클레스들을 포함한다.In certain situations, the facility uses methods that apply to categorical driver data and to categorical results. These include classes of stochastic lift factors known as multinomial logit, logit, probit, non-parameterized or hazard methods.
다양한 실시예들에서, 퍼실리티는 다양한 방식으로 결정된 다양한 다른 유형의 리프트 인자들을 사용한다. 여기에서 많은 경우에서의 "탄력성"에 관한 언급은 다양한 다른 유형들의 리프트 인자들로 확장된다.In various embodiments, the facility uses a variety of different types of lift factors determined in various ways. References herein to "elasticity" in many cases extend to various other types of lift factors.
도 1은 퍼실리티를 제공하기 위해 이용되는 컴포넌트들의 전형적인 배치 내에서의 데이터 흐름을 도시하는 고레벨 데이터 흐름도이다. 사용자 제어하에 있는 다수의 웹 클라이언트 컴퓨터 시스템들(110)은 페이지 보기 요구들(page view requests, 131)을 생성하여 인터넷(120) 등의 네트워크를 경유하여 논리 웹 서버(100)에 송신한다. 이 요구들은 통상적으로 페이지 보기 요구들 및 대상 매물에 대한 정보를 수신하고 지정된 전체 마케팅 예산 및 그 배분에 대한 정보를 제공하는 것과 관련된 각종 유형들의 다른 요구들을 포함한다. 웹 서버 내에서, 이 요구들은 모두 단일 웹 서버 컴퓨터 시스템으로 라우팅될 수 있거나, 다수의 웹 서버 컴퓨터 시스템들 사이에서 로드 밸런스(loaded-balanced)될 수 있다. 웹 서버는 통상적으로 제공된 페이지(132)로 각각에 응답한다.1 is a high level data flow diagram illustrating the data flow within a typical arrangement of components used to provide facility. A number of web
위에서 설명한 환경에 관하여 각종 실시예들이 설명되지만, 당업자라면 퍼실리티는 단일, 모놀리식 컴퓨터 시스템뿐만 아니라, 다양한 방식들로 연결된 컴퓨터 시스템들이나 유사한 장치들의 다양한 다른 조합들을 포함하는 다양한 다른 환경들에서 구현될 수 있음을 이해할 것이다. 다양한 실시예들에서, 이동전화들, PDA들, 텔레비젼들, 카메라 등과 같은 웹 클라이언트 컴퓨터 시스템들 대신에 각종 컴퓨팅 시스템들 또는 다른 상이한 클라이언트 장치들이 이용될 수 있다.While various embodiments are described with respect to the environment described above, those skilled in the art will appreciate that a facility may be implemented in a variety of other environments including a single, monolithic computer system, as well as various other combinations of computer systems or similar devices connected in various ways. I will understand. In various embodiments, various computing systems or other different client devices may be used in place of web client computer systems such as mobile phones, PDAs, televisions, cameras, and the like.
도 2는 퍼실리티가 실행되는 컴퓨터 시스템들 및 다른 장치들의 적어도 일부에 통상적으로 포함되는 컴포넌트들의 일부를 도시하는 블럭도이다. 이 컴퓨터 시스템들 및 장치들(200)은 컴퓨터 프로그램들을 실행하기 위한 하나 이상의 CPU들(201); 사용 중에 프로그램들 및 데이터를 저장하기 위한 컴퓨터 메모리(202); 프로그램들 및 데이터를 영구 저장하기 위한 하드드라이브 등의 영구 저장 장치(203); 컴퓨터 판독가능 매체 상에 저장된 프로그램들 및 데이터를 판독하기 위한 CD-ROM 드라이브 등의 컴퓨터 판독가능 매체 드라이브(204); 및 인터넷을 경유하는 것과 같이 컴퓨터 시스템을 다른 컴퓨터 시스템들에 연결하기 위한 네트워크 연결(205)을 포함할 수 있다. 통상적으로는, 퍼실리티의 동작을 지원하기 위해 위에서 설명된 바와 같이 구성된 컴퓨터 시스템들이 이용되지만, 당업자라면 퍼실리티는 다양한 컴포넌트들을 포함하는, 다양한 유형들 및 구성들의 장치들을 이용하여 구현될 수 있다는 것을 이해할 것이다.2 is a block diagram illustrating some of the components typically included in at least some of the computer systems and other devices on which the facility is executed. The computer systems and
도 3은 과거의 마케팅 노력들의 라이브러리의 샘플 콘텐츠를 도시하는 테이블도이다. 라이브러리(300)는 엔트리들(310, 320, 330) 등의 엔트리들로 이루어지는데, 각각의 엔트리는 각각이 유사한 컨텍스트를 공유하는 하나 이상의 과거의 마케팅 노력들의 세트에 대응한다. 각각의 엔트리는 신제품 속성(311), 인지 스코어 속성(312), 감성 스코어 속성(313), 경험 스코어(314), 메시지 명료성 스코어(315), 및 메시지 설득력 스코어(316)에 대한 값들을 포함하여, 엔트리에 대응하는 과거의 마케팅 노력들에 대하여 유효한 다수의 컨텍스트 속성값들을 포함한다. 각각의 엔트리는 엔트리에 대응하는 과거의 마케팅 노력들에 대한 다음의 통계적 척도들, 즉 결과의 로그(log of outcome, 351), 베이스(base, 352), 래그 인자를 갖는 결과의 로그(log of outcome with a lag factor, 353), 외부의 로그(log of external, 354), 상대 가격의 로그(log of relative price, 355), 및 상대 배분의 로그(log of relative distribution, 356)에 대한 값들을 더 포함한다. 각각의 엔트리는 TV(361), 프린트(print, 362), 라디오(radio, 363), 옥외(outdoor, 364), 인터넷 검색(internet search, 365), 인터넷 질의(internet query, 366), 히스패닉(hispanic, 367), 직접(direct, 368), 이벤트들(events, 369), 후원(sponsorship, 370), 및 기타(371)를 포함하는 다수의 카테고리들의 각각에 대한 광고 효율값들(advertising efficiency values)의 로그들을 더 포함한다.3 is a table diagram illustrating sample content of a library of past marketing efforts.
도 4는 퍼실리티로의 접근을 허가된 사용자들로 제한하기 위해 퍼실리티에 의해 이용되는 로그인 페이지를 도시하는 디스플레이도이다. 사용자는 자신의 이메일 어드레스를 필드(401)에, 자신의 패스워드를 필드(402)에 입력하고, 로그인 컨트롤(403)을 선택한다. 사용자가 이 방식으로 로그인하는 것이 곤란하다면, 사용자는 컨트롤(411)을 선택한다. 사용자가 아직 계정을 갖고 있지 않다면, 사용자는 새 계정을 생성하기 위하여 컨트롤(421)을 선택한다.4 is a display diagram illustrating a login page used by the facility to limit access to the facility to authorized users. The user enters his e-mail address in
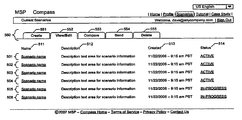
도 5는 보기/편집 모드에서 퍼실리티에 의해 생성된 페이지 디스플레이를 도시하는 흐름도이다. 디스플레이는 다수의 시나리오들(scenarios, 501-506)을 열거하며, 각각은 사용자를 위하여 생성되거나, 사용자가 연관되어 있는 조직을 위하여 생성된 기존의 매물 지정(existing offering prescription)에 대응한다. 각각의 시나리오에 대하여, 디스플레이는 시나리오의 명칭(name, 511), 시나리오의 설명(description, 512), 시나리오가 생성된 날짜(date, 513), 및 시나리오의 상태(status)를 포함한다. 사용자는 시나리오에 대한 더 많은 정보를 얻기 위하여, 그 명칭, 또는 그 상태를 선택하는 것에 의하는 등, 시나리오들 중 어느 하나를 선택할 수 있다. 디스플레이는 또한, 사용자가 퍼실리티의 상이한 모드들을 네비게이션하기 위해 사용할 수 있는 탭 영역(550)을 포함한다. 현재의 보기/편집 모드를 위한 탭(552)에 더하여, 탭 영역은 생성(create) 모드를 위한 탭(551), 비교(compare) 모드를 위한 탭(553), 송신(send) 모드를 위한 탭(554), 및 삭제(delete) 모드를 위한 탭(555)을 포함한다. 사용자는 대응하는 모드를 기동시키기 위하여 이 탭들 중 어느 하나를 선택할 수 있다.FIG. 5 is a flow diagram illustrating page display generated by the facility in view / edit mode. The display lists a number of scenarios 501-506, each corresponding to an existing offering prescription created for the user or for the organization with which the user is associated. For each scenario, the display includes the name of the scenario (511), the description of the scenario (512), the date the scenario was created (date, 513), and the status of the scenario. The user can select any of the scenarios, such as by selecting its name, or its state, to obtain more information about the scenario. The display also includes a
도 6-9는 전체 마케팅 예산 및 그것의 배분이 퍼실리티에 의해 지정될 대상 매물에 대한 정보를 요청하기 위하여 퍼실리티에 의해 제공된 디스플레이들을 도시한다. 도 6은 현재 수입(current revenue, 601), 현재 연간 마케팅 지출(current annual marketing spending, 602), 산업 전반의 다음 년도 예측 성장률(anticipated growth rate, 603), 수입의 백분율로 표현된 총수익(gross profit, 604), 및 달러의 백분율로 표현된 마켓 점유율(market share, 605)과 같은 속성들에 대한 값들을 입력하기 위한 컨트롤들을 보여준다. 디스플레이는 사용자가 입력한 속성값들을 저장하기 위하여 사용자가 선택할 수 있는 저장(save) 컨트롤(698), 및 컨텍스트 속성 값들의 입력을 위해 다음 디스플레이로 진행하기 위하여 사용자가 선택할 수 있는 계속(continue) 컨트롤(699)을 더 포함한다.6-9 illustrate the displays provided by the facility to request information about the target property for which the overall marketing budget and its allocation will be specified by the facility. Figure 6 shows current revenue (601), current annual marketing spending (602), anticipated growth rate (603) across industries, gross revenue expressed as a percentage of revenue. and controls for entering values for attributes such as profit, 604, and market share, 605, expressed as a percentage of the dollar. The display is a
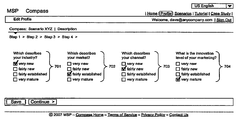
도 7은 대상 매물에 대한 속성값들을 요청하기 위해 퍼실리티에 의해 제공된 또 다른 디스플레이이다. 이것은 컨텍스트 속성들, 즉 산업 신규성(industry newness, 701), 마켓 신규성(702), 채널 신규성(703), 및 마케팅 혁신(704)에 대한 입력값들에 대한 컨트롤들을 포함한다.7 is another display provided by the facility to request attribute values for the subject property. This includes controls for context attributes, inputs for
도 8은 속성값들을 요청하기 위하여 퍼실리티에 의해 제공된 또 다른 디스플레이이다. 이것은 사용자가 컨텍스트 속성들, 즉 마케팅 정보 콘텐츠의 신규성(801), 마켓에서의 회사 위치(802), 마켓 점유율(803), 및 가격 전략(804)에 대한 값들을 입력하기 위하여 이용할 수 있는 컨트롤들을 구비한다.8 is another display provided by the facility to request attribute values. This provides controls that the user can use to enter values for contextual attributes:
도 9는 속성값들을 요청하기 위하여 퍼실리티에 의해 제공된 또 다른 디스플레이이다. 이것은 사용자가 소비자 부분 세부항목(customer segment detail)이 포함될 것인지 여부를 결정하기 위해 이용할 수 있는 컨트롤(901)을 포함한다. 디스플레이는 추가적인 컨텍스트 속성들의 값들을 지정하기 위한 차트들(910 및 920)을 더 포함한다. 차트(910)는 사용자가 대상 매물에 대하여 책임이 있는 회사에 의한 브랜딩 메시징(branding messaging) 및 포지셔닝(positioning) 노력들의 명료성(clarity) 및 일관성(consistency)에 대한 값들을 동시에 지정하기 위하여 이용될 수 있다. 차트(910)를 이용하기 위해, 사용자는 일관성 및 명료성 속성들 양자의 적절한 값들에 대응하는 차트 내에 포함된 그리드 내의 단일의 셀을 선택한다. 사용자가 회사의 광고의 설득력(persuasiveness) 및 호감도(likeability)에 대한 적절한 값들을 동시에 선택할 수 있게 하는 부분(920)도 유사하다.9 is another display provided by the facility to request attribute values. This includes a
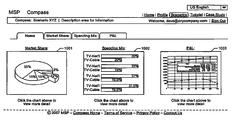
도 10은 사용자가 검토 결과들에 대한 분석의 형태를 선택하도록 하기 위하여 대상 매물에 대한 정보 수집후 퍼실리티에 의해 제공된 결과 네비게이션 디스플레이를 도시하는 디스플레이도이다. 디스플레이는 사용자가 결과에 관련된 마켓 점유율 정보를 검토하기 위하여 선택할 수 있는 컨트롤(1001), 사용자가 결과에 관련된 지출 믹스 정보를 검토하기 위하여 선택할 수 있는 컨트롤(1002), 및 사용자가 결과와 관련된 수익 및 손실 정보를 검토하기 위하여 선택할 수 있는 컨트롤(1003)을 포함한다.FIG. 10 is a display diagram illustrating a result navigation display provided by the facility after collecting information about the subject property to allow the user to select a form of analysis for the review results. The display includes a
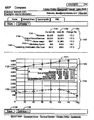
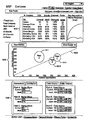
도 11은 퍼실리티가 대상 매물에 대하여 결정한 최적의 전체 마케팅 예산을 전달하기 위하여 퍼실리티에 의해 제공된 디스플레이를 도시하는 디스플레이도이다. 디스플레이는 2개의 곡선, 즉 전체 마케팅 예산(또는 "마케팅 지출")에 대한 수입(revenue, 1120) 및 전체 마케팅 예산에 대한 수익(profit)(즉, "비용 후의 마케팅 기여(marketing contribution after cost)")(1130)을 도시하는 그래프(1110)를 포함한다. 퍼실리티는 포인트(1131)를 수익 곡선(1130)의 피크인 것으로 식별하며 따라서 대응하는 마케팅 지출의 레벨인 $100을 최적의 마케팅 지출로 식별하였다. 포인트(1131)의 높이는 마케팅 지출에 의해 생성될 수익의 예측된 레벨을 나타내고, 포인트(1121)의 높이는 이 마케팅 지출에서 예측되는 전체 수입의 예측된 레벨을 나타낸다. 테이블(1150)은 최적의 마케팅 지출 및 그것의 계산에 대한 추가적인 정보를 제공한다. 테이블은, 현재 마케팅 지출(1161), 이상적 마케팅 지출(1162), 및 이 둘 간의 델타(delta)(1163)의 각각에 대하여, 이 마케팅 지출의 레벨에 대하여 계획된 수입(revenue, 1151); 이 마케팅 지출의 레벨에서 초래될 것으로 예측된 상품들 및 서비스들의 비용(costs of goods and services, 1152); 이 마케팅 지출의 레벨에서 획득될 총마진(gross margin, 1153); 마케팅 지출(marketing spend, 1154); 및 이 마케팅 지출의 레벨에서 예측된 비용 후의 마케팅 기여(marketing contribution after cost, 1155)를 도시한다.FIG. 11 is a display diagram illustrating a display provided by the facility to convey an optimal overall marketing budget determined by the facility for the object. The display shows two curves: revenue for the entire marketing budget (or "marketing spend"), 1120, and a profit for the overall marketing budget (ie, "marketing contribution after cost"). Includes a
수익 곡선을 정의하고 이것이 피크에 도달하는 전체 마케팅 예산 레벨을 식별하기 위하여, 퍼실리티는 먼저 대상 매물에 적합한 전체 마케팅 예산 탄력성을 결정한다. 이 탄력성 값은 0.01과 0.30 사이의 범위에 있고, 이 범위 내에 유지되도록 오버라이드된다(overriden). 퍼실리티는, 각각이 대상 매물에 대한 특정의 속성값에 연관된 다수의 조정 인자들에 따라서, 0.10 또는 0.11 등의 초기 탄력성값을 조정함으로써 탄력성을 계산한다. 이 조정 인자들에 대한 샘플 값들은 아래의 표 1에 도시된다.To define the profit curve and identify the overall marketing budget level at which it reaches its peak, the facility first determines the overall marketing budget elasticity that is appropriate for the target offering. This elasticity value is in the range between 0.01 and 0.30 and is overridden to remain within this range. The facility calculates elasticity by adjusting an initial elasticity value, such as 0.10 or 0.11, in accordance with a number of adjustment factors, each associated with a particular attribute value for the property. Sample values for these adjustment factors are shown in Table 1 below.
산업 신규성 컬럼은 도 7에 도시된 컨트롤(701)에 대응한다. 예를 들어, 컨트롤(701)의 최상위 체크박스가 체크되면, 퍼실리티는 산업 신규성 컬럼으로부터 조정인자 0.05를 선택하고; 컨트롤(701)의 중간의 두 박스들 중 어느 것이든 체크되면, 퍼실리티는 산업 신규성 컬럼으로부터 조정인자 0을 선택하며; 컨트롤(701)의 최하위 체크박스를 체크하면, 퍼실리티는 산업 신규성 컬럼으로부터 조정인자 -0.02를 선택한다. 유사하게, 마케팅 혁신 컬럼은 도 7에 도시된 컨트롤(704)에 대응하고, 새로운 정보 컬럼은 도 8에 도시된 컨트롤(801)에 대응되며, 마켓 점유율 컬럼은 도 8에 도시된 컨트롤(803)에 대응한다. 광고 품질 컬럼은 도 9에 도시된 차트들(910 및 920)에 대응한다. 특히, 각각의 그래프의 하위 좌측 코너에 관련하여 두 그래프들에서 선택된 셀들의 위치들의 합은 광고 품질의 높은, 중간의, 또는 낮은 레벨을 결정하기 위해 이용된다.The industrial novelty column corresponds to the
그 후, 퍼실리티는, 아래의 표 2에서 설명되는 바와 같이, 조정된 전체 마케팅 예산 탄력성을 이용하여 최대 수익이 발생하는 전체 마케팅 예산의 레벨을 결정한다.The facility then uses the adjusted overall marketing budget elasticity to determine the level of the overall marketing budget at which the maximum return occurs, as described in Table 2 below.

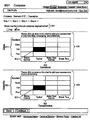
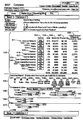
도 12는 지출 믹스(spending mix) 정보를 보여주기 위하여 퍼실리티에 의해 제공된 디스플레이이다. 디스플레이는 퍼실리티에 의해 지정된 전체 예산(1201)을 포함한다. 사용자는 아래에 도시된 배분 정보에 대한 영향을 보기를 원하는 경우 이 예산을 편집할 수 있다. 디스플레이는 또한 사용자가 마케팅 예산의 지정에 관한 특별한 이슈들을 식별하기 위하여 사용할 수 있는 컨트롤들(1202 및 1203)을 포함한다. 디스플레이는 다수의 마케팅 활동들의 각각에 대한 다양한 정보를 도시하는 테이블(1210)을 더 포함한다. 각각의 로우(1211-1222)는 상이한 마케팅 활동을 식별한다. 각각의 로우는 이하의 컬럼들, 즉 현재 백분율 할당(1204), 이상적인 백분율 할당(1205), 천단위로 표시된 브랜드에 대한 달러 할당(dollar allocation to brand in thousands, 1206), 천단위로 표시된 제품에 대한 달러 할당(dollar allocation to product in thousands, 1207), 및 현재의 할당과 이상적인 할당 사이의 천단위로 표시된 달러 차이(dollar difference in thousands between current and ideal)로 더 나누어진다. 예를 들어, 로우(1214)로부터, 퍼실리티는 프린트 광고에 대한 할당을 15%에서 10%로 감소시키는 것을 지정하고 있으며, 이 중에서 330만 달러는 브랜드에 대한 프린트 광고에 지출될 것이고, 220만 달러는 제품에 대한 프린트 광고에 지출될 것이며, 프린트 마케팅에 대한 현재의 할당은 이상적인 할당보다 185만 달러 더 많다. 디스플레이는 사용자가 바 차트 리포트(bar chart report)를 예산 및 마케팅 활동들 중 임의의 것을 포함하거나 또는 배제하도록 커스터마이즈하기 위하여 이용할 수 있는 부분(1230)을 더 포함한다. 사용자가 체크 박스들(1231-1233)을 선택하여, TV, 라디오, 및 프린트 마케팅 활동들에 대한 바 그래프들을 포함하는 리포트에 부분들(1250, 1260, 및 1270)이 추가되게 하는 것을 알 수 있다. TV 마케팅 활동에 대한 부분(1250)은 전국적인 TV에의 현재 백분율 할당을 위한 바(1252), 케이블 TV에의 현재 백분율 할당을 위한 바(1253), 전국적인 TV에의 이상적인 백분율 할당을 위한 바(1257), 및 케이블 TV에 대한 이상적인 백분율 할당을 위한 바(1258)를 포함한다. 다른 리포트 부분들도 유사하다.12 is a display provided by the facility to show spending mix information. The display includes the overall budget 1201 specified by the facility. The user can edit this budget if he wants to see the impact on the distribution information shown below. The display also includes controls 1202 and 1203 that the user can use to identify particular issues regarding the designation of the marketing budget. The display further includes a table 1210 showing various information for each of the plurality of marketing activities. Each row 1211-1222 identifies a different marketing activity. Each row contains the following columns:
도 13-18은 퍼실리티가 도 12에 도시된 활동 배분을 결정하기 위한 프로세스를 설명한다. 도 13은 사용자로부터 추가적인 매물 속성 정보를 수집하는 것을 설명하는 프로세스도이다. 일부 실시예들에서, 이 추가적인 속성 정보는 도 6-9에 도시된 것과 디자인이 유사한 사용자 인터페이스를 이용하여 사용자로부터 획득된다. 도 13은 대상 매물에 대하여 사용자로부터 값들이 요청되는 다수의 속성들(1300)을 도시한다.13-18 illustrate a process for the facility to determine the activity distribution shown in FIG. 12. 13 is a process diagram illustrating the collection of additional property information from a user. In some embodiments, this additional attribute information is obtained from the user using a user interface similar in design to that shown in FIGS. 6-9. FIG. 13 illustrates a number of
도 14는 대상 매물에 대한 세 개의 도출된 척도(measures), 즉 인지(cognition), 감성(affect), 및 경험(experience)의 도출을 도시하는 프로세스도이다. 이 도출된 척도들에 대한 값은 대상 매물에 대하여 사용자에 의해 제공된 도 13에 도시된 속성들의 값에 기초하여 도출된다.FIG. 14 is a process diagram illustrating the derivation of three derived measures, ie cognition, affect, and experience, for a subject offering. The values for these derived measures are derived based on the values of the attributes shown in FIG. 13 provided by the user for the object for sale.
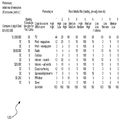
도 15는 도 14에 도시된 세 개의 도출된 속성들의 상이한 조합에 대한 각각의 마케팅 활동 할당들의 세트들을 도시하는 테이블도이다. 예를 들어, 도 15는 높은 인지 스코어 및 중간의 감성이 할당된 대상 매물들에 대하여 TV 44%, 프린트 잡지 12%, 프린트 신문 0%, 라디오 5%, 옥외 0%, 인터넷 검색 10%, 인터넷 광고어 5%, 직접 마케팅 12%, 후원들/이벤트들 7%, PR/기타 5%, 및 거리 0%의 백분율들로 마케팅 리소스들이 할당되어야 하는 것을 나타낸다. 이들 할당들의 9개 그룹들의 각각은, 라이브러리에 포함된 과거의 마케팅 노력들의 그룹들에 대하여 나타내어진 인지 및 감성 스코어들에 의해 그룹화된, 도 3에 도시된 것들과 같은 상대적인 활동 탄력성들에 기초한다.FIG. 15 is a table diagram illustrating sets of respective marketing activity assignments for different combinations of the three derived attributes shown in FIG. 14. For example, FIG. 15 shows
도 16은 도 15의 테이블에 의해 특정된 초기 할당이 다수의 특별한 조건들(1600)에 대하여 어떻게 조정되어야 하는지를 도시한다.FIG. 16 illustrates how the initial allocation specified by the table of FIG. 15 should be adjusted for a number of
도 17은 퍼실리티가 각각의 마케팅 활동에 지출된 달러 금액을 어떻게 결정하는지를 도시하는 프로세스도이다. 프로세스(1700)는 사용자에 의해 특정된 목표 시청자(target audience)의 사이즈를 구하고 목표의 감정적 백분율(affective percentage)로 나누어 구매된 도달범위(purchased reach) - 즉, 마케팅 메시지가 제공될 사용자들의 수 - 를 획득한다. 이 수에 조정된 할당 백분율을 곱하여 소비자당 빈도(frequency per customer)를 획득하며, 이것에 그 후 연간 구매 사이클들의 수(a number of purchase cycles per year) 및 임프레션당 비용(cost per impression)이 곱해져서 각각의 활동에 대한 추정된 지출이 획득된다.17 is a process diagram showing how the facility determines the dollar amount spent on each marketing activity. The
도 18은 도 17에 도시된 결과들에 대한 최종 조정을 도시하는 프로세스도이다. 프로세스(1800)는 대상 매물에 대하여 퍼실리티에 의해 결정된 전체 마케팅 예산에 부합하도록 목표 시청자를 스케일링 업 또는 다운하는 것을 특정한다.FIG. 18 is a process diagram showing the final adjustment to the results shown in FIG. 17.
도 19는 세 가지 상이한 형태들로 패키지된 동일 제품과 같이, 관련된 대상 매물들의 수에 관하여 퍼실리티에 의한 리소스 할당 지정들을 표현하기 위해 퍼실리티에 의해 제공된 디스플레이를 도시하는 디스플레이도이다. 디스플레이는 각각이 서클(circle)을 갖는 관련된 대상 매물들, 팩(pack) A, 팩 B, 및 팩 C의 각각을 그래픽적으로 표현하는 차트(1910)를 포함한다. 서클의 중심의 위치는 매물에 할당된 현재 및 이상적 전체 마케팅 예산을 나타내어, 45°라인(1920)으로부터의 각각의 서클의 거리 및 방향은 매물에 대하여 마케팅 지출이 얼마만큼 증가 또는 감소되어야 하는지를 나타낸다. 예를 들어, 팩 A에 대한 서클(1911)은 45°라인의 좌측 위에 있다는 사실은 팩 A에 대하여는 마케팅 지출이 증가되어야 함을 나타낸다. 또한, 각 서클의 지름 및/또는 면적은, 대응하는 대상 매물에 대해 퍼실리티에 의해 특정된 이상적인 전체 마케팅 예산이 채택되는 것을 가정하면, 그 매물에 대한 전체 수익 기여를 반영한다. 디스플레이는 또한 각각의 관련된 대상 매물에 대한 현재 및 이상적인 마켓 점유율(market share) 및 볼륨(volume)을 나타내는 바 그래프를 포함하는 부분(1930)을 포함한다. 디스플레이는 또한 도 11의 부분(1150)에 도시된 것과 유사한 정보를 도시하는 부분(1940)을 포함한다.FIG. 19 is a display diagram illustrating a display provided by a facility to represent resource allocation assignments by the facility with respect to the number of related object offerings, such as the same product packaged in three different forms. The display includes a chart 1910 that graphically represents each of the relevant object offerings, pack A, pack B, and pack C, each of which has a circle. The location of the center of the circle represents the current and ideal overall marketing budget allocated to the property, such that the distance and direction of each circle from the 45 °
일부 실시예들에서, 퍼실리티는 배급된 매체(syndicated media), 배급된 세일즈 데이터, 인터넷 매체, 인터넷 행동 데이터(internet behavioral data), 자연 검색 질의 데이터(natural search query data), 유료 검색 활동 데이터(paid search activity data), 텔레비젼, 라디오, 프린트와 같은 매체 데이터, 소비자 행동 데이터, 추적 조사 데이터(tracking survey data), 경제학적 데이터, 기상 데이터, 주식 시장과 같은 금융 데이터, 경쟁 마케팅 지출 데이터(competitive marketing spend data), 및 온라인 및 오프라인 세일즈 데이터를 포함하는 다수의 유형의 외부 소스들 중 하나 이상으로부터 수신된 데이터를 고려한다.In some embodiments, the facility may include syndicated media, distributed sales data, internet media, internet behavioral data, natural search query data, paid search activity data. media data such as search activity data, television, radio, print, consumer behavior data, tracking survey data, economic data, weather data, financial data such as stock market, competitive marketing spend data data), and data received from one or more of a number of types of external sources, including online and offline sales data.
다양한 실시예들에서, 퍼실리티는 이하에 더 상세하게 논의되는 다음의 추가 양태들 중 하나 이상을 포함한다.In various embodiments, the facility includes one or more of the following additional aspects discussed in more detail below.
1) 브랜드/클라이언트 요구에 대한 통신 터치포인트들(communication touchpoints)의 최소 거리 매칭(Minimum Distance Matching)1) Minimum Distance Matching of communication touchpoints to brand / client needs
2) 통신 요구들에 대한 분류 방법(인지, 정서 및 경험)2) Classification methodology for communication needs (cognition, emotion and experience)
3) 전통적인 매체와 인터넷 매체의 상호작용들, 및 경험 인자들(experience factors)3) interactions between traditional and internet media, and experience factors;
4) 핵심 매체, 인터넷 매체 및 경험 인자들의 합동 최적화(joint optimization)4) Joint optimization of core media, internet media and experience factors
5) 결과들에 대한 USMSD(user-specific multi-source data) 및 계산에 필요한 드라이버 변수들의 조합들5) Combinations of user-specific multi-source data (USMSD) on the results and driver variables required for calculation
6) 모델링을 위한 데이터 스택들의 지능적인 자동화6) Intelligent Automation of Data Stacks for Modeling
7) 모델 명세, 통계적 추정 및 전문 지식의 지능적인 자동화7) Intelligent automation of model specifications, statistical estimation and expertise
8) 마케팅 및 브랜드 응답의 예상적인 모멘텀(DNM) 표시기로서 동적인 실시간 인터넷 "네이티브" 검색 데이터를 이용8) Use dynamic, real-time Internet "native" search data as predictive momentum (DNM) indicators of marketing and brand response.
9) 마케팅 드라이버, 브랜드 모멘텀 및 마케팅 ROI를 이용한 결과들의 동적 상호작용, 최적화, 예측 및 예상의 측정9) Measure dynamic interactions, optimizations, predictions and projections of results using marketing drivers, brand momentum and marketing ROI.
10) 브랜드/클라이언트 결과들의 보고10) Reporting Brand / Client Results
1) 최소 거리 매칭 1) minimum distance matching
(1.1) 퍼실리티는 정보(Qx), 정서(Affect)(Qy) 및 경험(Qz)에 관한 입력 질문들을 이용하여, 이들 3개의 차원 및 저, 중, 고(수치적으로 1, 2, 3으로 코딩됨)의 3 포인트 스케일을 이용하여 브랜드/클라이언트 통신 요구들을 분류한다.(1.1) The facility uses these three dimensions and low, medium, and high (numerically 1, 2, 3) using input questions about information (Qx), affect (Qy), and experience (Qz). Coded) to classify brand / client communication needs.
(1.2) 퍼실리티는 통신 채널이라고도 알려진 매우 많은 수의 통신 터치포인트들 중 임의의 것을 통해 리소스들을 할당할 수 있다. 각 채널에 대하여, 퍼실리트는 브랜드/클라이언트 통신들의 정보, 정서 및 경험 차원들을 전달하기 위한 "매체"의 능력을 고려한다.(1.2) The facility may allocate resources through any of a very large number of communication touchpoints, also known as communication channels. For each channel, Facilit takes into account the ability of the "medium" to convey the information, emotion and experience dimensions of brand / client communications.
통신 채널들을 선택하는 데에 있어서, 퍼실리티는 통신 요구와 매체/채널 간의 "거리"를 최소화하여, 그 다음 마켓 응답, 및 탄력성과 이상적인 경제적 계산의 후속 응용에 관련된 터치포인트들을 선택한다.In selecting the communication channels, the facility minimizes the “distance” between the communication request and the medium / channel, thereby selecting the touchpoints involved in the market response, and subsequent application of elasticity and ideal economic calculations.
거리는 브랜드/클라이언트 요구와 매체/채널 간의 SSD(the sum of squared differences)로서 정의된다.Distance is defined as the sum of squared differences (SSD) between brand / client needs and media / channel.

^는 누승법(exponentiation)을 나타냄.^ Stands for exponentiation.
2) 분류 방법 2) Classification method
분류 방법은 위의 섹션 1.1 및 1.2에 기술되어 있다.The classification method is described in sections 1.1 and 1.2 above.
3) 전통적인 매체와 인터넷 매체 간의 상호작용 방법 3) Interaction between traditional and internet media
핵심 결과 수학식(core outcome equation)은 다음과 같이 (다른 곳에서) 정의된다.The core outcome equation is defined (where else):

추가 리소스들이 우변에 곱해진다.Additional resources are multiplied by the right hand side.
퍼실리티는 수학식 3에서 전통적인 매체를, 리소스들과 결과들을 연계(linking)하는 소위 "직접 경로(direct path)"로서 결합한다.The facility combines the traditional medium in (3) as a so-called "direct path" that links resources and results.
퍼실리티는 2가지 방식으로 인터넷을 포함하도록 이 모델을 확장한다.The facility extends this model to include the Internet in two ways.
방법 3.1은 전통적인 매체(TV, 프린트, 라디오 등)와 함께 온라인 디스플레이 및 유료 검색을 위해 인터넷 메트릭을 추가 및 포함시키는 것이다. Method 3.1 is to add and include Internet metrics for online display and paid search with traditional media (TV, print, radio, etc.).
방법 3.2는 인터넷 "자연" 검색을 위한 하나 이상의 변수/메트릭(VINS)을 추가 및 포함시키는 것이다. 자연 검색(natural search)의 예는 (임프레션 및 클릭과 구별되는 것으로서) 인터넷 검색 박스에서 사용되는 단어들에 대한 카운트 데이터이다. Method 3.2 is to add and include one or more variables / metrics (VINS) for Internet "natural" searches. An example of natural search is count data for words used in internet search boxes (as distinguished from impressions and clicks).
그 다음, 퍼실리티는 제2의 "간접 경로(indirect path)" 수학식을 추가 및 적용하고, 그에 의해 인터넷 자연 검색이 전통적인 마케팅 및 세일즈 리소스들에 의해 설명된다.The facility then adds and applies a second "indirect path" equation, whereby Internet natural search is described by traditional marketing and sales resources.

이들 2개의 수학식은 "회귀적으로(recursively)" 작동한다.These two equations work "recursively".
사실상, 마케팅 및 세일즈 리소스들은 소비자/마켓의 주목(attention) 및 발견을 추진한다. 발견 행동은 자연 검색에 의해 측정된다. 그 다음, 회귀적 프로세스에서 후속하여, 인터넷 리소스들은 주목을 액션으로 "변환(convert)"한다.In fact, marketing and sales resources drive the attention and discovery of consumers / markets. Discovery behavior is measured by natural search. Subsequently, subsequent to the recursive process, Internet resources “convert” attention to action.
4) 합동 최적화 4) Joint Optimization
그 다음, 직접 및 간접 경로 수학식은 경제학 최적화(economics optimization)의 "톱라인(topline)"을 위한 역학을 제공한다.The direct and indirect path equations then provide the dynamics for the "topline" of economics optimization.
퍼실리티는 다양한 리소스 입력 레벨들을 적용하고, 결과들을 회귀적인 톱라인 수학식들을 통하여 흐르게 하여 결과들을 산출해낸 다음, (수확체감을 위한) 연관된 탄력성 및 연관된 자원들의 마진 및 비용을 적용한다.The facility applies various resource input levels, flows the results through the regressive topline equations to produce the results, and then applies the associated elasticity (for yield) and the margin and cost of the associated resources.
또한, 일부 경우들에서, 퍼실리티는 이 방법을 제3의 수학식으로 확장하고, 이에 의해 유료 검색이 또한 자연 검색에 비교할 수 있을 만큼 다루어진다. 따라서, 유료 검색은 중간 결과이다.Furthermore, in some cases, the facility extends this method to a third equation, whereby paid search is also treated to be comparable to natural search. Thus, paid search is an intermediate result.
임의의 동적, 모멘텀, 중간 또는 임시(interim) 브랜드 메트릭(의식(awareness), 고려(consideration), 열광(buzz))이 이러한 제3의 수학식 방법을 이용하여 다루어진다.Any dynamic, momentum, intermediate or interim brand metric (awareness, consideration, buzz) is handled using this third mathematical method.
5) USMSD( User - Specific Multi - Source Data ) 5) USMSD ( User - Specific Multi - Source Data )
수요/결과 수학식들은 Demand / result equations
● 브랜드 특정적이고;● brand specific;
● 외부 산업 특정적이고;External industry specific;
● 마케팅 및 세일즈 리소스를 위한 데이터이고;Data for marketing and sales resources;
● 브랜드/사용자/클라이언트에 관련된 인터넷 특정적 데이터인 ● Internet-specific data related to brands / users / clients
데이터 입력들을 필요로 한다.Requires data inputs.
퍼실리티는 위에서 개요를 설명한 2-수학식 방법을 이용하여 수요를 모델링할 목적으로, 이들 4개의 데이터 스트림을 함께 모으는 데 있어서 특이하다.The facility is unique in bringing these four data streams together for the purpose of modeling demand using the two-mathematical method outlined above.
5.1) 전형적으로, 브랜드 데이터는 용적측정(volumetric)의 세일즈, 가격 책정(pricing), 수입, 신규 고객 카운트, 기존 고객 카운트, 고객 보유, 고객 이탈(attrition), 및 제품 또는 서비스의 고객 상향판매(upsell)/교차판매(crosssell)를 포함한다. 이것은 또한 입력 질문들로부터의 산업 및 브랜드/클라이언트 속성들을 포함한다.5.1) Typically, brand data includes volumetric sales, pricing, revenue, new customer counts, existing customer counts, customer retention, customer attrition, and customer upsell of products or services ( upsell / crosssell. This also includes industry and brand / client attributes from input questions.
5.2) 외부 데이터는 일련의 외부 인자들 및 드라이버들을 포함한다. 전형적으로, 이들은 경제적 조건 및 트렌드와, 기상, 경쟁자 마케팅 및 세일즈 리소스, 및 기타를 기술하는 요소들을 포함한다.5.2) External data includes a series of external arguments and drivers. Typically, they include elements describing economic conditions and trends, weather, competitor marketing and sales resources, and the like.
5.3) 마케팅 및 세일즈 데이터는 리소스 입력에 대한 다양한 척도들을 포함한다. 이들은 통신 매체들/터치포인트들을 위해 소비하는 리소스를 포함할 수 있다. 이들은 매체들/터치포인트들에 대한 리소스들의 물리적 척도들(직접 메일 카운트 등과 같은 물리적 단위들 또는 시간 기반의 레이팅 포인트들(time-based, rating points))을 포함한다.5.3) Marketing and sales data includes various measures of resource entry. These may include resources consuming for communication media / touchpoints. These include physical measures of resources for media / touchpoints (physical units such as direct mail counts or time-based, rating points).
5.4) 인터넷 특정적인 데이터는 주로 단어 카운트, 및 단어 클러스터들과 시멘틱 구절들의 카운트들을 이용하는 자연 검색의 척도를 포함한다. 전형적으로, 이러한 단어 척도들은 브랜드 이름 자체, 브랜드에 연관된 키 프레이징(key phrasing)의 양태들(소위 USP(universal selling proposition)), 품질과 같은 브랜드 포지셔닝의 양태들 및 브랜드에 연관된 보다 더 일반적인 또는 일반화된 단어들을 다룬다.5.4) Internet specific data mainly includes a measure of natural search using word counts and counts of word clusters and semantic phrases. Typically, these word measures are more general or generalized to the brand name itself, aspects of key phrasing associated with the brand (so-called universal selling proposition), aspects of brand positioning such as quality and brand. The words that were written.
도 20 내지 도 23은 이들 데이터 입력들의 일부 또는 전부를 지정하고 자동으로 수집하기 위해 일부 실시예들에서 퍼실리티에 의해 제시되는 전형적인 사용자 인터페이스를 도시한 디스플레이도이다. 도 20은 영업 카테고리들의 목록을 포함하는 초기 디스플레이로서, 이로부터 사용자가 가장 적합한 카테고리를 선택한다.20-23 are display diagrams illustrating a typical user interface presented by the facility in some embodiments to designate and automatically collect some or all of these data inputs. 20 is an initial display that includes a list of sales categories from which the user selects the most suitable category.
도 21은 4가지 카테고리의 데이터 입력(2110, 2120, 2130 및 2140)에 대한 데이터 검색 상태를 나타내는 대시보드(dashboard)를 보여준다. 각 유형은 그 카테고리의 데이터의 검색 상태를 나타내기 위해 상태 표시기들, 예를 들어 인터넷 데이터 카테고리(2110)에 대한 상태 표시기(2111-2113)를 갖는다. 또한, 사용자는 그 유형의 데이터에 관한 상세한 정보를 보기 위해, 데이터 유형들 중 임의의 것을 클릭할 수 있다.FIG. 21 shows a dashboard showing the data retrieval status for four categories of
도 22는 마케팅 및 세일즈 데이터 카테고리 내의 데이터에 대한 상세한 디스플레이를 보여준다. 이 디스플레이(2200)는 마케팅 및 세일즈 데이터 카테고리의 다수의 상이한 컴포넌트(2211), 컴포넌트들 각각의 검색 상태를 나타내는 상태 표시기(2212), 및 각 컴포넌트의 검색을 시작하기 위해 사용자가 조작할 수 있는 컨트롤들(2213)을 보여준다.22 shows a detailed display of the data in the marketing and sales data category. This
도 23은 디스플레이를 보여준다. 디스플레이는 매물에 관련된 자연 검색어 및 유료 검색어를 입력하기 위한 컨트롤들(2311); 각 자연 검색 및 유료 검색에 대한 관련 기간을 지정하기 위한 컨트롤들(2312); 및 자연 검색 및 유료 검색에 대한 빈도 데이터가 검색되고 저장될 곳을 지정하기 위한 컨트롤들(2313)을 포함한다.23 shows a display. The display includes
6) 지능적인 데이터 스택 6) intelligent data stack
퍼실리티는 사용자들이 결과 및 드라이버 데이터의 적합한 집합과, 퍼실리티에 의해 이용될 금융적 인자들(financial factors)을 선택할 수 있도록 하기 위해 도 20 내지 도 23에 도시된 데이터 대시보드 사용자 인터페이스를 이용한다The facility uses the data dashboard user interface shown in Figs. 20-23 to allow users to select a suitable set of results and driver data and the financial factors to be used by the facility.
그 다음, 퍼실리티는 각각의 데이터 클래스에 대한 데이터 입력 탬플릿을 제공한다(위의 5.1, 5.2, 5.3, 5.4 참조).The facility then provides a data entry template for each data class (see 5.1, 5.2, 5.3, and 5.4 above).
그 다음, 퍼실리티는 지정된 데이터 스트림들의 전체적인 완전성, 일관성 및 정확성을 사용자가 검증하기 위해 품질 및 데이터 스크러빙(scrubbing) 알고리즘의 집합을 적용한다.The facility then applies a set of quality and data scrubbing algorithms to the user to verify the overall integrity, consistency and accuracy of the designated data streams.
그 다음, 퍼실리티는 이러한 데이터 벡터들을 전체적인 퍼실리티의 모델링을 위한 매트릭스(MOM)로 변환하여 로드한다.The facility then converts and loads these data vectors into a matrix (MOM) for the modeling of the overall facility.
MOM을 위한 행 구조는 전형적으로 시간 차원, 고객 세그먼트, 트레이딩의 채널 및/또는 지리적 계층들을 포함한다.The row structure for the MOM typically includes time dimensions, customer segments, channels of trading, and / or geographic layers.
MOM을 위한 열 구조는 전형적으로 최종 결과 변수들, 중간 결과 변수들 및 드라이버 변수들을 포함한다 (5.1, 5.2, 5.3 및 5.4 참조).The thermal structure for the MOM typically includes final result variables, intermediate result variables and driver variables (see 5.1, 5.2, 5.3 and 5.4).
퍼실리티는 데이터 및 수요 모델 명세를 위한 소위 로그/로그 변환(log/log transformation)을 이용한다.The facility uses so-called log / log transformations for data and demand model specifications.
![]()
![]()
퍼실리티는 다양한 수학식들의 통계적 추정을 위해 GLS(generalized least squares) 방법을 적용한다.The facility applies a generalized least squares (GLS) method for statistical estimation of various equations.
또한, 퍼실리티는 계절적 변동(seasonality)을 포함하여, 계량경제학에서 사용되는 임의의 필요한 "더미(dummy)" 변수들을 구성한다.The facility also constitutes any necessary "dummy" variables used in metrology economics, including seasonality.
7) 지능적 추정 7) intelligent estimation
퍼실리티는 CM(Candidate Models), 통계적 진단들, t값들 및 모델/수학식 계수들에 대한 GLS 추정들에 걸친 연계 및 비교 방법들을 포함한다.The facility includes linkage and comparison methods across GLS estimates for Candidate Models (CM), statistical diagnoses, t values and model / mathematical coefficients.
퍼실리티는 약 40개의 CM 변종들 및 관련된 진단의 GLS 추정을 수행한다 (퍼실리티는 GLS에 대한 수치적 알고리즘 및 방법들을 포함한다).The facility performs GLS estimation of about 40 CM variants and associated diagnostics (the facility includes numerical algorithms and methods for GLS).
그 다음, 퍼실리티는 리소스 레벨들 및 믹스에 대한 경제적 최적화를 위해 응답 계수들(응답 탄력성들)의 BLUS(best, linear, unbiased estimates)를 선택하고 이용한다.The facility then selects and uses BLUS (best, linear, unbiased estimates) of the response coefficients (response elasticities) for economic optimization of resource levels and mix.
이 선택은 최상의 피트(best fit), 최상의 t값들, 다중공선성(multi-collinearity)의 부재, 직렬 상관의 부재, 적합한 수치적 부호(양, 음) 및 엑스퍼트 라이브러리(Expert Library)에 일관되는(CEL) 탄력성 추정에 의해 결정된다.This choice is consistent with the best fit, the best t-values, the absence of multi-collinearity, the absence of serial correlation, the appropriate numerical sign (positive and negative), and the Expert Library. CEL) is determined by elasticity estimation.
8) DNM( Dynamic Native Momentum ) 8) DNM ( Dynamic Native Momentum )
위에서 설명된 바와 같이, 인터넷 자연 검색에 관련되고 그로부터 도출된 단어 카운트들 및 단어 카운트 클러스터들은 브랜드 모멘텀, 브랜드 품질 및 브랜드 이미지를 위한 개념들을 포함하고 다룬다.As described above, word counts and word count clusters related to and derived from Internet natural search include and deal with concepts for brand momentum, brand quality and brand image.
퍼실리티는 이러한 단어/시맨틱 개념들을 2-수학식 직접 경로 및 간접 경로 수학식들에 관련되고 거기에서 사용되는 드라이버 변수들로 분류한다 (위 참조). 이러한 시멘틱 "버킷(buckets)"은 브랜드 이름 자체에 관련된 수신된 질의의 카운트, 제품이나 서비스 카테고리 및 브랜드/클라이언트 경쟁자들에 관련된 카운트, 및 보다 더 일반화된 주제(예를 들어, 하이브리드 기술 차량 대 렉서스 RXH)에 관련된 카운트들을 포함한다.The facility categorizes these word / semantic concepts into driver variables related to and used in the 2-mathematical direct path and indirect path equations (see above). These semantic "buckets" can include counts of received queries related to the brand name itself, counts related to product or service categories and brand / client competitors, and more generalized topics (eg hybrid technology vehicle vs. lexus). RXH).
퍼실리티는 Google, Yahoo 또는 MSN 또는 기타(MySpaces, Facebook, YouTube)와 같은 검색 공급자들과, 무선 및 모바일 장치로부터의 자연 검색으로부터의 단어 카운트들의 동적 피드들을 포함한다.The facility includes dynamic feeds of word counts from natural search from wireless and mobile devices, and search providers such as Google, Yahoo or MSN or others (MySpaces, Facebook, YouTube).
DNM 데이터는 전형적으로 진행중인 인터넷 트래픽의 동적 샘플이다. 퍼실리티는 "x" 백만 질의마다의 카운트를 이용한다.DNM data is typically a dynamic sample of ongoing Internet traffic. The facility uses counts per "x" million queries.
9) 최적화, 예상( prediction ) 및 예측( forecasting )에서의 인터넷 모멘텀의 동적 사용 9) optimize the dynamic use of the Internet in the momentum of the expected (prediction) and prediction (forecasting)
퍼실리티는 리소스 드라이버들에 관련된 브랜드/클라이언트 목표들의 톱-다운 최적화(top-down optimization)를 구성하기 위해, 위에서 개요를 설명한 2-수학식 방법을 이용한다. 여기에서의 드라이버들은 전통적인 마케팅 및 세일즈와, 가격 책정 및 인터넷 리소스 둘다를 포함한다.The facility uses a two-mathematical method outlined above to configure top-down optimization of brand / client goals related to resource drivers. Drivers here include both traditional marketing and sales, and pricing and internet resources.
퍼실리티는 리소스 드라이버들의 도메인을 이용하여 이상적인 결과들을 계산하기 위해 직접 계산(폐쇄 형태의 미적분학(closed form calculus)) 및 B&B(branch and bound) 휴리스틱 방법 둘다를 이용한다.The facility uses both direct calculation (closed form calculus) and branch and bound (B & B) heuristic methods to calculate ideal results using the domain of resource drivers.
10) 브랜드/클라이언트 결과 및 결론에 대한 퍼실리티 보고 10) Facility reporting on brand / client results and conclusions
퍼실리티는 브랜드/클라이언트 결과를 위한 시각적 보고 및 GUI를 포함한다 (여기에서의 Compass SMB, Compass Agency 및 Compass USMSD/DNM 참조). 예를 들어, 다양한 실시예들에서, 퍼실리티는 세일즈 응답 곡선, 수익 곡선, 및 현재 대 이상(current vs. ideal) 바 그래프 중 하나 이상을 이용하여 결과들을 디스플레이한다.The facility includes visual reporting and GUIs for brand / client results (see Compass SMB, Compass Agency and Compass USMSD / DNM here). For example, in various embodiments, the facility displays results using one or more of a sales response curve, a revenue curve, and a current vs. ideal bar graph.
다양한 실시예들에서, 퍼실리티는 이러한 채널들, 그리고 몇몇 경우에서는 다음과 같은 추가 채널들의 일부 또는 전부에 걸쳐 리소스들을 할당한다.In various embodiments, the facility allocates resources across some or all of these channels, and in some cases, additional channels as follows.
텔레비젼television
영화관Movie Theaters
라디오radio
신문newspaper
잡지magazine
인쇄물prints
고객 잡지Customer magazine
묶여지지 않은 삽입물(Loose inserts)Loose inserts
인터넷 광고Internet advertising
인터넷 검색Internet search
브랜드/회사 웹 사이트Brand / Company Website
이메일e-mail
옥외outdoors
홈쇼핑 TVHome Shopping TV
간접 광고(Product placement)Product placement
공항airport
대중 교통public transport
스포츠 이벤트의 후원Sponsorship of sporting events
기타 이벤트의 후원Sponsorship of other events
병원hospital
800/무료 전화800 / free call
가정에서의 우편Mail at home
유명인사 홍보(Celebrity endorsement)Celebrity endorsement
상점 내 광고In-store advertising
상점 내 조사In-store investigation
판촉 및 특별 판매(Promotions and special offers)Promotions and special offers
제품 샘플Product sample
친지 및 가족의 추천Recommended by relatives and family
전문가의 추천Expert Recommendation
VOD(Video on demand)Video on demand
비디오 게임Video games
스트리밍 비디오Streaming video
인터랙티브 TVInteractive TV
스펙 텍스트 테이블
Specification text table
"" ACEACE " 조정된 멀티소스 "Coordinated multisource 마켓market 응답 탄력성 라이브러리 Response Resiliency Library
MRO(market response optimization)는 전형적으로 (1) 리소스 레벨 및 믹스에서의 적절한 변형, 및 (2) 적절한 데이터 관찰을 구현하는 데이터에 기초하는 리소스 응답 탄력성 매개변수들의 BLUS(best, linear, unbiased estimates)를 필요로 한다.Market response optimization (MRO) typically includes (1) best, linear, unbiased estimates (BLUS) of resource response resiliency parameters based on data that implements (1) appropriate variations in resource levels and mixes, and (2) appropriate data observations. Need.
일부 실시예들에서, 퍼실리티는 크로스-브랜드 및 크로스-리소스 제3자 데이터를 이용하여 탄력성의 BLUS 추정을 계산하기 위하여 4단계 방법을 이용한다. 4단계 방법은 BLUS를 위한 최상의 통계적 방법들과 더 조합된, 결과들 및 드라이버들에 관한 일관성있는 제3자 데이터와 조합하여 ACE-L 메타데이터를 이용한다.In some embodiments, the facility uses a four-step method to calculate the BLUS estimate of elasticity using cross-brand and cross-resource third party data. The four-step method uses ACE-L metadata in combination with consistent third party data about results and drivers, further combined with the best statistical methods for BLUS.
값 및 결과는 리소스 최적화에 사용되는 크로스브랜드 크로스미디어 탄력성의 포괄적 데이터베이스이다. 이러한 전체적인 방법론은 ACE-L 스코어를 통해 (1) 광범위한 크로스브랜드 및 크로스 리소스 조건들에 걸친 세일즈 결과에 지출된 리소스의 순수한 효과, 및 (2) "컨텐츠 임팩트(content impacts)"를 정의하기 위한 대안적인 방법들의 임팩트들을 허용하고 측정한다.Values and results are a comprehensive database of crossbrand crossmedia resilience used for resource optimization. This holistic methodology uses the ACE-L score to (1) the net effect of resources spent on sales results across a wide range of cross-brand and cross-resource conditions, and (2) alternatives to define "content impacts". Allow and measure impacts of conventional methods.
멀티-소스 데이터Multi-source data
모델링을 위한 2가지의 주된 데이터 클래스, 즉 결과 및 드라이버가 있다. 계량경제학적인 모델링을 위해, ACE 방법은 전형적으로 결합된 시계열 및 단면 데이터(combined time-series and cross-section data)를 이용한다.There are two main data classes for modeling: results and drivers. For econometric modeling, the ACE method typically uses combined time-series and cross-section data.
MSL(Multi-Source Library) 및 결과(종속 변수)에 대하여, ACE는 라이브러리 내의 브랜드들/서비스들에 대한 세일즈 수입의 일관된 정의를 이용한다.For Multi-Source Library (MSL) and results (dependent variables), ACE uses a consistent definition of sales revenue for brands / services in the library.
MSL 및 리소스 드라이버들에 대하여, ACE는 소정 범위의 독립 변수들을 이용한다.For MSL and resource drivers, the ACE uses a range of independent variables.
단계 1: 퍼실리티는 제3자 데이터 공급자들로부터 이러한 드라이버들에 대한 데이터를 획득한다. 예를 들어, 기간, 마켓 위치 및 매체 유형에 의해 소비되는 매체에 대한 데이터 계열이 하나 이상의 제3자 소스로부터 획득될 수 있다. 데이터 클래스들은 경제(economy), 경쟁(competition), 추적(tracking), 가격 책정(pricing), 채널 펀드(channel funds), 판매부(salesforce), 소매점 조건(retail store conditions), 오프라인 마케팅 및 온라인 마케팅, 및 소정의 모멘텀 데이터를 포함한다.Step 1: The facility obtains data for these drivers from third party data providers. For example, data series for media consumed by period, market location and media type may be obtained from one or more third party sources. Data classes include economy, competition, tracking, pricing, channel funds, salesforce, retail store conditions, offline marketing and online marketing, And predetermined momentum data.
전형적으로, 이러한 3PDS(3rd Party data sources)는 클라이언트-특정적인 트랜잭션 데이터에 대한 차이들(변수에서의 오류들, 아래 참조)을 알고 있거나 잘 이해하고 있다. 그러나, 이러한 차이들은 일반적으로 일관적인 것으로 생각된다.Typically, such 3PDS (3 rd Party data sources) is a client - and to know the differences in the specific transaction data (see below Errors in variable) or understanding. However, these differences are generally considered to be consistent.
MSL에서의 단면들은 브랜드/서비스, 지리 및 그 이상의 것으로 이루어진다. 우리는 브랜드들 등에 대한 라이브러리 데이터 내에서, 또는 그러한 데이터에 걸쳐서 일관되게 정의된 3PDS 리소스 드라이버들을 적용한다. 사실상, 퍼실리티는 브랜드들/클라이언트들에 걸친 데이터 정의에서의 차이들에 기인한 데이터 변동을 제거한다.The cross sections in MSL consist of brand / service, geography and more. We apply 3PDS resource drivers that are defined consistently within, or across, the library data for brands and the like. In fact, the facility eliminates data fluctuations due to differences in data definitions across brands / clients.
ACEACE 조정된 동적 매개변수들 Tuned Dynamic Parameters
기본적인 방법은 Sales= Base Volume times (Marketing Resource)^Elasticity Parameter를 정의하는 것이며, 여기에서 ^는 자연 지수를 나타낸다.The basic method is to define the Sales = Base Volume times (Marketing Resource) ^ Elasticity parameter, where ^ represents the natural index.
![]()
![]()
각 브랜드(즉, 데이터 레코드)에 대하여, 퍼실리티는 정서(A), 인지(C) 및 경험(E)에 대하여 1-5 스케일에서 그것의 ACE 스코어를 정의한다. 또한, 퍼실리티는 로컬 마켓 또는 시간 감도에 대하여 하나의 인자(L)를 추가한다.For each brand (ie data record), the facility defines its ACE score on the 1-5 scale for emotion (A), cognition (C), and experience (E). The facility also adds one factor (L) for local market or time sensitivity.
단계 2: 그 다음, 퍼실리티는 다음의 명세를 이용하여 모델링을 확장한다.Step 2: The facility then extends modeling using the following specification.

라이브러리 내의 각 레코드(단면)는 ACE-L 스코어를 사용하고 포함한다.Each record (section) in the library uses and contains an ACE-L score.
따라서, 정서, 인지 및 경험에 관련된 컨텐츠를 전달하기 위한 매체 유형의 용량(capacity)과, 브랜드 특성으로 인한 탄력성에서의 상향 및 하향 이동이 허용된다.Thus, the media type's capacity for delivering content related to emotion, perception and experience, and upward and downward movement in elasticity due to brand characteristics are allowed.
예를 들어, 결과적으로 소비자에게 동기를 부여하는 데에 필요한 정서 스코어를 증가시키는 것은, 이러한 상황에서 상이한 컨텐츠 목표를 갖는 다른 브랜드들에 대하여 TV 매체의 탄력성이 증가하는 것을 허용한다. 프린트 및 인터넷에 대한 리프트 인자들은 정보 요구에 따라 증가한다. 옥외, 라디오 및 신문에 대한 리프트는 로컬 마켓 포커스에 따라 증가한다.For example, increasing the emotional score needed to motivate the consumer as a result allows for increased elasticity of the TV medium for other brands with different content goals in this situation. Lift factors for print and the Internet increase with information needs. Lifts for outdoors, radio and newspapers increase with local market focus.
응답 탄력성의 완전한 Complete of response resiliency BLUSBLUS 추정 calculation
ACE-L이 없는 기본 또는 핵심 탄력성 매개변수들은 아래와 같은 수식을 사용한다.Basic or core elasticity parameters without ACE-L use the following formula:
핵심 수학식:Core equation:

각각의 리소스는 이 수식을 유사하게 확장한다. 이노베이션을 포함하여 "Delta"를 추진하는 다른 인자들은 Compass®에 기술되어 있다.Each resource similarly extends this formula. Other factors driving "Delta", including innovation, are described in Compass®.
단계 3 : 퍼실리티는 Delta를 대체하기 위해, ACE 조정을 이 핵심 수학식에 순방향으로 치환한다. 결과는 추가의 드라이버들로서 ACE 컴포넌트들을 갖는 일련의 직접 효과들 및 "상호작용들"이다. 일례를 들면 다음과 같다.Step 3: The facility forwards the ACE adjustment to this core equation in order to replace Delta. The result is a series of direct effects and "interactions" with ACE components as additional drivers. For example:

이러한 직접 및 상호작용 매개변수들의 적절한 추정은 데이터 및 수식이 소정의 규칙들에 일관될 것을 요구한다.Proper estimation of these direct and interactive parameters requires that data and equations be consistent with certain rules.
하나의 규칙 또는 가정은, error 항들이 유사한 분산에도 불구하고 독립적이고 동일하게 분포된다는 것이다.One rule or assumption is that error terms are distributed independently and equally despite similar variances.
그러나, 단면 설계로 인해, 동질성(homogeneity) 가정의 몇몇 양태들은 만족되지 않을 것이다.However, due to the cross-sectional design, some aspects of the homogeneity hypothesis will not be satisfied.
이 조건은 이분산성(heteroskedasticity)으로 알려져 있다.This condition is known as heteroskedasticity.
단계 4: 이분산성을 정정하기 위하여, 퍼실리티는 단면들에 대해 고정된 효과들(Fixed Effects)을 이용하는 GLS(Generalized Least Square) 추정 및 대응하는 "가중치들(weights)" 둘다를 적용한다.Step 4: To correct the heteroscedasticity, the facility applies both Generalized Least Square (GLS) estimation and corresponding "weights" using fixed effects on the cross sections.
다른 규칙들은 래그(lag) 항들을 이용하여 직렬 상관(serial correlation)에 대하여 정정하는 것을 포함한다.Other rules include correcting for serial correlation using lag terms.
추가 기능성Additional functionality
일부 실시예들에서, 퍼실리티는 상이한 사용자 입력들에 기초하는 2개의 상이한 최적화 체계를 이용하여 생성된 작업-보정된(work-amended) 리소스 할당들을 결합하기 위하여, 리소스 탄력성 또는 리프트 인자들의 균일한 집합을 이용한다. 일부 실시예들에서, 퍼실리티들은 퍼실리티에 의해 추천되는 할당들에 따라 마케팅 리소스들을 구매하고 스케줄링하는 기능성을 제공한다. 일부 실시예들에서, 퍼실리티는 멀티미디어 유형 및/또는 멀티플랫폼 매체 공급자들 내의 리소스 할당들을 최적화한다.In some embodiments, the facility is a uniform set of resource elasticity or lift factors to combine work-amended resource allocations created using two different optimization schemes based on different user inputs. Use In some embodiments, the facilities provide functionality to purchase and schedule marketing resources according to allocations recommended by the facility. In some embodiments, the facility optimizes resource allocations within multimedia type and / or multiplatform media providers.
(1) 거리 및 출력 매개변수들을 위한 하이브리드 앵커링( Hybrid Anchoring ) (1) Hybrid Anchoring for distance and output parameters (Hybrid Anchoring )
일부 실시예들에서, 매체 유형들 및 통신 채널들에 대해 최적의 리소스 믹스를 결정하기 위하여, 2개의 주된 방법(Mix1 및 Mix2)이 퍼실리티에게 이용가능하다.In some embodiments, two main methods (Mix1 and Mix2) are available to the facility to determine the optimal resource mix for the media types and communication channels.
Mix1은 제약들에 있다면 그러한 제약들에 종속되는 클라이언트 목표들(예를 들어, 볼륨 또는 수익)을 최적화한다는 점에서 완전히 계산적인 미적분학을 적용한다. 수치적 방법은 세일즈 수입 또는 수익 목표 함수 및 최대값을 찾기 위한 미적분학을 포함한다. 퍼실리티는 각각의 드라이빙 리소스(매체 유형)에 대한 제1 도함수를 취함으로써, 유형에 의한 이상적인 리소스 레벨을 위한 도함수들의 집합의 해를 구한다. 최종 결과는 이상적인 리소스 레벨 및 믹스가 매체 유형에 의한 탄력성들 및 (달러로 측정되는 경우) 리소스들의 비용 둘다에 의존하는 것이다. 이 계산들을 완료하면, 이상적인 리소스 믹스는 각각의 탄력성들의 비율에 등가이다. 퍼실리티에 의해 적용되는 대로의 이러한 탄력성들은 라이브러리로부터 획득되고 사용자의 시나리오 프로파일에 적용된다.Mix1 applies fully computational calculus in that it optimizes client goals (eg, volume or revenue) that depend on those constraints if they are in the constraints. Numerical methods include sales revenue or revenue goal functions and calculus to find maximums. The facility solves the set of derivatives for the ideal resource level by type by taking the first derivative for each driving resource (media type). The end result is that the ideal resource level and mix depend on both the elasticities by the media type and the cost of the resources (as measured in dollars). Upon completing these calculations, the ideal resource mix is equivalent to the ratio of each elasticity. These elasticities as applied by the facility are obtained from the library and applied to the scenario profile of the user.
매체 채널들 및 터치포인트들은 급격하게 진화하고 있기 때문에, 퍼실리티는 ACE(Affect, Cognition, Experience) 속성들을 이용하여 수행되는, 이상적인 믹스를 계산하기 위한 제2의 방법도 포함한다. 여기에서, 브랜드 "포지션"은 정서, 인지 및 경험 속성들에 대한 사용자의 시나리오 프로파일 및 특정한 질문(및 스케일)에 의해 정의된다.Since media channels and touchpoints are evolving rapidly, the facility also includes a second method for computing an ideal mix, which is performed using ACE (Ffect, Cognition, Experience) attributes. Here, the brand “position” is defined by the user's scenario profile and specific question (and scale) for emotional, cognitive and experience attributes.
ACE(Mix2)에 대하여, 라이브러리는 각각의 매체 채널 및 터치포인트에 대해 ACE 스케일들을 포함하고 적용한다. Mix2에 대하여, 퍼실리티는 적용하지 않는 매체 유형들을 금지하고, 통신들을 위해 브랜드 ACE 포지션까지의 거리를 최소화함으로써 매체 유형들을 선택하고, 이상적인 방식으로 미디어 유형들을 믹스로 "계층화(layer)"하기 위해 임프레션 계산마다 도달범위(reach), 이상적 빈도(ideal frequency) 및 비용을 적용한다.For ACE Mix2, the library includes and applies ACE scales for each media channel and touchpoint. For Mix2, the facility prohibits media types that do not apply, selects media types by minimizing the distance to the brand ACE position for communications, and impressions to “layer” the media types into the mix in an ideal manner. Each calculation applies a reach, ideal frequency and cost.
일부 실시예들에서, Mix1 방법 및 Mix2 방법 중 하나가 단독으로 사용될 수도 있고, 원하는 사용자 또는 매체 채널들에게 한 방법 또는 다른 방법이 더 적용가능할 수 있으므로 2가지가 조합되어 사용될 수 있다. 많은 상황들에서, 이용가능한 매체 채널들과 정보에 오버랩이 있을 수 있거나 오버랩이 있을 것이다. 예를 들어, 전형적으로는 인터넷 채널(디스플레이, 유료 검색) 또는 프린트 또는 텔레비젼 또는 기타에 대해 오버랩이 있다.In some embodiments, one of the Mixl method and the Mix2 method may be used alone, or the two may be used in combination because one method or another method may be more applicable to the desired user or media channels. In many situations, there may or may be an overlap in information with the available media channels. For example, there is typically overlap for internet channels (display, paid search) or print or television or the like.
그것의 계산들이 "오버랩"을 갖는 경우, 퍼실리티는 Mix1에서의 탄력성들이 결과(볼륨, 수익)에 대해 인과적인 연계를 제공한다는 사실에 의존하여 2가지 방법을 조합한다.If its calculations have an "overlap", the facility combines the two methods depending on the fact that the elasticities in Mix1 provide a causal link to the result (volume, revenue).
Mix2 및 오버랩된 리소스(OR1)가 주어지면, 퍼실리티는 알려진 Mix1 탄력성(KME1)을 이용하는 계산을 중심에 놓고, 나머지 탄력성들 각각을 비율로서 계산한다. 일례는 다음과 같다.Given Mix2 and overlapped resource OR1, the facility centers the calculation using the known Mix1 elasticity (KME1) and calculates each of the remaining elasticities as a ratio. An example is as follows.

(2) 임의의 리소스 또는 매체 채널에 대한 디지탈 구매의 방법 (2) method of digital purchase for any resource or media channel
사용자의 목표들에 대하여 이상적인 예산 및 믹스를 계산한 도 24의 스크린샷을 참조하면, 퍼실리티는 사용자가 각각의 리소스 또는 매체 유형을 구입 및 스케줄링하거나 "플라이트(flight)"할 수 있게 해 주는 기능성도 포함한다. 각각의 매체 구매는 월별로 스케줄링되어, 일년 중의 모든 월, 또는 임의의 특정한 부분집합의 월들을 선택할 수 있다. 추천된 양은 구매측의 바람에 따라, 동등하게 분포되거나 변경될 수 있다. 이것은 도 25의 스크린샷에 의해 설명된다.Referring to the screenshot of Figure 24, which calculates the ideal budget and mix for the user's goals, the facility also provides functionality that allows the user to purchase and schedule or "flight" each resource or media type. Include. Each media purchase may be scheduled monthly, selecting all months of the year, or any particular subset of months. The recommended amount may be equally distributed or changed according to the purchaser's desire. This is illustrated by the screenshot of FIG.
도 25의 스크린샷에서, 이 퍼실리티는 그것의 추천된 총 리소스 할당("Total Planned Spend")을 나타낸다. 수직으로 적층된 수평 밴드들은 상이한 매체 유형(예를 들어, 텔레비젼, 라디오, 인쇄, 인터넷 검색, 인터넷 디스플레이 등)에 대응한다. 각각의 매체 유형에 대하여, 퍼실리티는 사용자 인터페이스를 이용하여 해당 매체 유형에 대한 추천된 리소스 할당(예를 들어, 텔레비전에 대하여 $17,748)과, 사용자가 그 매체 유형에 대해 커밋(commit)한 양(현재는 매체 유형들 각각에 대하여 $0)을 디스플레이한다. 각각의 다가오는 달에 대한 특정 유형의 매체의 구입, 또는 매체가 구입될 "플라이트(flight)"를 요청하기 위해, 사용자는 월에 대응하는 체크박스를 선택하고, 그 월 아래에 있는 달러값 할당을 입력한다. 이러한 입력된 값들은 각각의 매체 유형에 대하여 "requested spend" 표시에 반영된다.In the screenshot of FIG. 25, this facility represents its recommended total resource allocation (“Total Planned Spend”). Vertically stacked horizontal bands correspond to different media types (eg, television, radio, printing, internet browsing, internet display, etc.). For each media type, the facility uses the user interface to determine the recommended resource allocation for that media type (e.g., $ 17,748 for television), and the amount the user has committed to that media type (currently Displays $ 0) for each of the media types. To request the purchase of a particular type of media for each upcoming month, or a "flight" in which the media will be purchased, the user selects the checkbox corresponding to the month and assigns a dollar value assignment below that month. Enter it. These entered values are reflected in the "requested spend" indication for each medium type.
(도시되지 않은) 일부 실시예들에서, 각 매체 유형에 대한 수평 밴드는 물리적 위치, 시각, 요일, 또는 다양한 다른 타겟팅 정보, 크리에이티브를 지정 또는 식별하는 정보 등과 같이, 그 매체 유형에 대해 매체 공급자에게 지정하는 데에 유용한 추가의 정보를 포함한다.In some embodiments (not shown), the horizontal band for each media type is assigned to the media provider for that media type, such as physical location, time of day, day of week, or various other targeting information, information specifying or identifying a creative, and the like. Contains additional information useful for specifying.
각각의 플라이트에 대하여, 퍼실리티는 하나 이상의 매체 벤더의 선택을 위한 드롭다운 메뉴를 포함한다. 각 매체 유형에 대하여, 퍼실리티는 본질적으로 퍼실리티의 "마켓플레이스"의 공급측으로서 MVP(media vendor partners)의 집합을 포함한다.For each flight, the facility includes a drop down menu for selection of one or more media vendors. For each media type, the facility essentially comprises a set of media vendor partners (MVPs) as the supply side of the "marketplace" of the facility.
도 26의 스크린샷은 인터넷 디스플레이 광고가 Google AdSense 또는 DoubleClick으로부터 어떻게 구입될 수 있는지를 예로서 보여주고 있다.The screenshot in FIG. 26 shows as an example how an internet display ad can be purchased from Google AdSense or DoubleClick.
일례로서, 퍼실리티는 표준 "인터페이스" 및 온라인 디스플레이 광고 및/또는 유료 검색을 구입 및 배치할 목적을 위한, Google, Yahoo 또는 MSN과 같은 벤더들에 대한 API를 포함한다.As an example, the facility includes APIs for vendors such as Google, Yahoo or MSN, for the purpose of purchasing and deploying standard “interfaces” and online display advertising and / or paid search.
퍼실리티는 매체의 유형에 의한 "주문(orders)"을 소비하는 매체의 디지탈 구매 및 디지탈 배치를 연계하고 수행하기 위해 API를 포함한다.The facility includes APIs for associating and performing digital purchases and digital placements of media consuming "orders" by the type of media.
이를 위해, 퍼실리티는 다단계 프로세스를 이용한다. 단계들은 다음과 같다.To this end, the facility uses a multi-step process. The steps are as follows.
1. 첫번째로, 퍼실리티에 의해 제시되는 사용자 인터페이스는 선택된 타겟 "공급 또는 판매측" (일례를 들자면, 인터넷 검색 매체 카테고리 내의 Google AdWords)을 런칭하기 위해, 자기 자신의 아키텍처 프레임워크 내에 버튼을 갖는다.1. Firstly, the user interface presented by the facility has a button in its own architectural framework to launch the selected target "supply or sales side" (eg Google AdWords in the Internet search media category).
2. 다음으로, 퍼실리티는 최종 사용자가 판매측 플랫폼(이 경우에서는, Google AdWords 구매 포털)과의 상호작용을 시작하기 위하여, 고유한 사용자이름/패스워드를 "전송(pipe-in)"하기 위한 매개변수-구동되는(parametrically-driven) 방법을 갖는다.2. Next, the facility is a medium for end-users to "pipe-in" their unique usernames / passwords in order to initiate interaction with the seller-side platform (in this case, the Google AdWords Buying Portal). Has a parametrically-driven method.
3. 다음으로, 퍼실리티는 구매자의 시간대별 플라이팅 정보(time-phased flighting information)를, 마치 그것이 "공급 또는 판매측" 플랫폼의 사용자 인터페이스를 통해 미리 기록된 데이터 스크립트를 일괄-플레잉(batch-playing)하는 것처럼 그 플랫폼에 직접 송신(piping)한다.3. Next, the facility batch-plays the buyer's time-phased flighting information, as if it were a pre-recorded data script through the user interface of the "supply or sales" platform. Pipe directly to that platform.
4. 마지막으로, 퍼실리티는 매체 구매자가 구입된 리소스들에 대해 안전한 방식으로 지불할 수 있게 하여, 상업적인 트랜잭션을 완결한다.4. Finally, the facility allows the media buyer to pay for the purchased resources in a secure manner, thus completing the commercial transaction.
퍼실리티는 매체 소스 자체와 직접, 또는 매체 구매 대행업체들 또는 재판매자들과 같은 제3자를 통해 상호작용하기 위해 이들 API들을 이용한다.The facility uses these APIs to interact directly with the media source itself or through a third party such as media buying agencies or resellers.
3) 멀티채널/멀티플랫폼 리소스 및/또는 매체 채널을 위한 퍼실리티의 응용 3) Application of facilities for multichannel / multiplatform resources and / or media channels
퍼실리티는 소정 범위의 사용자들에 대한 변형들 및 응용들을 포함한다. 이들은 다음을 포함한다.The facility includes variations and applications for a range of users. These include the following:
● 멀티채널 소매상● Multichannel Retailers
● 비영리 기업● Non-profit company
● 영화를 위한 오프닝 박스오피스● Opening box office for movie
● 가격 책정 최적화 및 동적 가격 책정● Pricing Optimization and Dynamic Pricing
● 신규 제품 또는 서비스● New product or service
● 소규모 사업체● small business
● 광고 대행업체● advertising agency
● 신규 고객의 취득 및 기존 고객의 보유를 포함하는 고객 수명값● Customer lifetime values, including acquisition of new customers and retention of existing customers
● 멀티프로덕트 및 멀티지오그래피/마켓 포트폴리오 최적화● Optimize multiproduct and multigeography / market portfolios
● 멀티플랫폼 매체 공급자들Multiplatform media providers
● 마켓 개발 펀드를 포함하는 트레이드 채널 펀드● Trade channel funds, including market development funds
● 판매부서 크기, 믹스, 도달범위 및 빈도와 위치의 최적화● Optimization of sales department size, mix, reach, frequency and location
● 상점 또는 사무실의 위치 또는 지점의 최적화● Optimize the location or branch of your store or office
● 제품 이노베이션을 위한 투자 및 지출● Investment and expenditure for product innovation
예를 들어, 멀티플랫폼 매체 공급자를 위한 버전은 메인 클래스와, 포함된 매체 공급자(들)에 의해 제안되는 특정 매체 유형들/전달수단들(vehicles) 둘다를 포함하도록, 매체 리소스들 및 터치포인트들의 목록을 확장 및 적용한다. 예를 들어, 빌보드, 신문 및 라디오 광고를 제공할 수 있는 매체 공급자와 같이, 단일의 매체 공급자가 복수의 매체 유형을 제공할 수 있다. 또한, 단일의 매체 공급자가, 8개의 다른 도시에서 신문을 소유하는 신문 배급과 같이 그것이 제어하는 복수의 프로퍼티(property)에 대한 광고를 판매하기 위한 위치에 있을 수 있다. 그러한 공급자들의 예들은 ESPN, MTV, L.A. Times 및 Disney 프로퍼티를 포함한다. 그러한 공급자들에 대하여, 일부 실시예들에서, 퍼실리티는 공급자 내의 개별 프로퍼티들 및/또는 매체 유형들에 대하여 매체 공급자 레벨에서 흘림체로(cursively) 할당되었다. 퍼실리티는 이를 위해 동일한 ACE 계산들을 이용한다.For example, a version for a multiplatform media provider may include both the main class and specific media types / vehicles proposed by the included media provider (s). Expand and apply the list. For example, a single media provider can provide multiple media types, such as media providers that can provide billboards, newspapers, and radio advertisements. In addition, a single media provider may be in a position to sell advertisements for a plurality of properties it controls, such as newspaper distribution, which owns newspapers in eight different cities. Examples of such suppliers are ESPN, MTV, L.A. Contains Times and Disney properties. For such providers, in some embodiments, the facility has been allocated cursively at the media provider level for individual properties and / or media types within the provider. The facility uses the same ACE calculations for this.
당업자들이라면, 상술한 퍼실리티가 다양한 방식으로 쉽게 적응 또는 확장될 수 있음을 알 것이다.Those skilled in the art will appreciate that the aforementioned facilities can be easily adapted or extended in various ways.
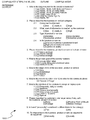
Claims (21)
상기 방법은,
사용자로부터 상기 구별된 매물의 정성적 속성들을 수신하는 단계;
경험적으로 획득된 평균 전체 마케팅 예산 탄력성 척도를 검색하는 단계;
제3자 데이터 소스로부터 상기 구별된 매물에 대한 탄력성에 관련된 추가의 데이터를 획득하는 단계;
상기 구별된 매물의 수신된 정성적 속성들 중 적어도 둘에 기초하여 상기 경험적으로 획득된 평균 전체 마케팅 예산 탄력성 척도를 조정하는 단계; 및
상기 구별된 영업 결과를 최적화시키는 경향이 있는 전체 마케팅 예산에의 리소스들의 할당을 결정하기 위하여 상기 조정된 경험적으로 획득된 평균 전체 마케팅 예산 탄력성 척도를 상기 획득된 관련된 데이터와 함께 이용하는 단계
를 포함하는 컴퓨터 판독가능한 매체.Overall marketing of the differentiated offerings for the purpose of optimizing the differentiated sales results for the offering that the computing system is expected to be driven by the allocation of resources to the overall marketing budget, at least in part. A computer readable medium having content for performing a method for automatically assigning resources to a budget, the method comprising:
The method comprises:
Receiving qualitative attributes of the distinguished property from a user;
Retrieving an empirically obtained average total marketing budget elasticity measure;
Obtaining additional data relating to the resilience to the distinguished property from a third party data source;
Adjusting the empirically obtained average overall marketing budget elasticity measure based on at least two of the received qualitative attributes of the distinguished property; And
Using the adjusted empirically obtained average total marketing budget elasticity measure along with the obtained related data to determine allocation of resources to an overall marketing budget that tends to optimize the differentiated sales results.
Computer-readable media comprising a.
사용자로부터 상기 구별된 매물의 속성들을 특징짓는 정보를 수신하는 단계;
상기 활동들 각각에 대하여, 상기 구별된 매물로부터 구별되면서도 상기 구별된 매물의 속성들을 특징짓는 상기 수신된 정보에 기초하여 상기 구별된 매물에 유사한 것으로 결정되는 하나 이상의 매물에 대한 경험적인 결과들로부터 도출되는 탄력성 척도를 결정하는 단계 - 상기 탄력성 척도는 상기 영업 결과에 대한 상기 활동의 예상되는 영향을 나타내고, 상기 결정하는 단계는 제3자 정보 공급자로부터 획득된 정보에 적어도 부분적으로 기초하여 수행됨 -; 및
상기 활동들 각각에 대해 리소스들의 할당을 생성하기 위해, 검색된 탄력성 척도들을 이용하는 단계
를 포함하는 방법.In a computer system, at least in part, the optimization of resources for each of the activities for the purpose of optimizing the business outcome for the distincted listing is expected to be driven by one or more activities to be performed on the distinct listing. In a method for automatically assigning an assignment,
Receiving information characterizing the distinguished property of the user from a user;
For each of the activities, derived from empirical results for one or more listings that are distinguished from the distinguished listing but are determined to be similar to the distinguished listing based on the received information that characterizes the distinguished listing's attributes. Determining a resilience measure to be generated, wherein the resilience measure indicates an expected effect of the activity on the business result and the determining is performed based at least in part on information obtained from a third party information provider; And
Using the retrieved elasticity measures to generate an allocation of resources for each of the activities
How to include.
상기 결정하는 단계는,
상기 구별된 매물의 속성들의 제1 부분을 특징짓는 수신된 정보를 이용하여, 속성들의 제1 부분이 유사한 방식으로 특징지어지는 매물들에 대한 경험적 결과들에 대응하는 탄력성 척도를 선택하는 단계; 및
상기 구별된 매물의 속성들의 제2 부분을 특징짓는 수신된 정보를 이용하는 것에 기초하여 상기 선택된 탄력성 척도를 조정하는 단계
를 포함하는 방법.The method of claim 4, wherein
The determining step,
Using the received information characterizing the first portion of the distinguished properties of the property, selecting an elasticity measure corresponding to the empirical results for the items for which the first portion of the properties is characterized in a similar manner; And
Adjusting the selected elasticity measure based on using received information characterizing a second portion of the distinguished properties of the property.
How to include.
각각 상이한 영업 매물 프로파일에 대한 복수의 엔트리 - 각각의 영업 매물 프로파일은 다른 영업 매물 프로파일들의 영업 매물들의 그룹으로부터 정성적으로 구별되는 하나 이상의 영업 매물들의 그룹을 기술하고, 각각의 엔트리는 영업 매물들의 그룹에 대한 마케팅 활동이 영업 결과에 미치는 영향을 나타내는 탄력성 척도를 포함함 -; 및
제3자 데이터 공급자로부터 획득된 정보
를 포함하여,
상기 프로파일들 중 구별된 프로파일에 의해 기술되는 구별된 영업 매물에 대하여, 상기 구별된 엔트리에 의해 나타내어진 상기 탄력성 척도는 상기 구별된 영업 매물에 대한 마케팅 리소스들의 할당을 자동으로 지정하기 위하여 상기 획득된 정보와 함께 사용될 수 있는 것인 하나 이상의 컴퓨터 메모리.In one or more computer memories that collectively store a generalized marketing elasticity data structure,
Multiple entries for each different sales profile—each sales profile describes a group of one or more sales listings that are qualitatively distinguished from a group of sales listings of different sales listing profiles, each entry being a group of sales listings Includes an elasticity measure that indicates the effect of marketing activities on sales results; And
Information obtained from third party data providers
Including,
For the distinctive sales for sale described by the distinct profile of the profiles, the elasticity measure represented by the distinct entry is obtained in order to automatically specify the allocation of marketing resources for the distinctive sales sale. One or more computer memories that can be used with the information.
제1 접근방식을 이용하여 확립된 대상 매물들에 대한 리소스 할당들의 제1 집합에 액세스하는 단계;
상기 리소스 할당들 중 제1 리소스 할당을 확립하기 위해 상기 제1 접근방식에서 이용된 복수의 마케팅 활동 각각에 대하여 정량적 리프트 인자들의 집합에 액세스하는 단계;
상기 제1 접근방식으로부터 구별되는 제2 접근방식을 이용하여 확립된 상기 대상 매물들에 대한 리소스 할당들의 제2 집합에 액세스하는 단계; 및
상기 액세스된 정량적 리프트 인자들의 집합을 이용하여, 상기 액세스된 리소스 할당들의 제1 집합과 상기 액세스된 리소스 할당들의 제2 집합을 결합하여, 상기 대상 매물에 대한 리소스 할당들의 최종 집합을 획득하는 단계
를 포함하는 방법. In a computing system, a method for automatically obtaining a final set of resource allocations that specify a quantitative allocation of resources for each of a plurality of marketing activities performed for a subject offering,
Accessing a first set of resource allocations for the subject offerings established using the first approach;
Accessing a set of quantitative lift factors for each of the plurality of marketing activities used in the first approach to establish a first one of the resource allocations;
Accessing a second set of resource allocations for the subject offerings established using a second approach distinct from the first approach; And
Using the set of accessed quantitative lift factors, combining the first set of accessed resource allocations and the second set of accessed resource allocations to obtain a final set of resource allocations for the target property.
How to include.
상기 방법은, 복수의 매체 유형 각각에 대하여,
주문을 위해 매체 유형의 매체 리소스들의 자동으로 추천된 양의 시각적 표시가 사용자에게 제시되게 하는 단계;
주문을 위해 상기 매체 유형의 매체 리소스들의 실제 양을 지정하는 사용자 입력을 수신하는 단계;
상기 매체 유형의 매체 리소스들의 적어도 하나의 제3자 공급자의 시각적 표시들이 상기 사용자에게 제시되게 하는 단계;
상기 매체 유형의 매체 리소스들의 상기 표시된 제3자 공급자 중 하나를 선택하는 사용자 입력을 수신하는 단계; 및
상기 매체 유형의 매체 리소스의 상기 선택된 제3자 공급자에게 상기 수신된 사용자 입력에 의해 지정된 상기 매체 유형의 매체 리소스의 실제 양에 대한 주문을 하는 단계
를 포함하는 컴퓨터 판독가능한 매체. A computer readable medium having content capable of causing a computing system to perform a method for ordering predetermined media resources for marketing the object offering for an offerer of the object,
The method, for each of a plurality of media types,
Causing a visual indication of an automatically recommended amount of media resources of the media type for the order to be presented to the user;
Receiving a user input specifying an actual amount of media resources of the media type for an order;
Causing visual indications of at least one third party provider of media resources of the media type to be presented to the user;
Receiving user input to select one of the indicated third party providers of media resources of the media type; And
Placing an order for the actual amount of the media resource of the media type specified by the received user input to the selected third party provider of the media resource of the media type.
Computer-readable media comprising a.
상기 방법은,
상기 복수의 매체 유형 중 적어도 하나에 대하여,
시각적 정보가 상기 사용자에게 제시되게 하고, 상기 매체 유형에 대해 스케줄링 정보를 요청하는 단계; 및
상기 매체 유형에 대하여 스케줄 정보를 지정하는 사용자 입력을 수신하는 단계
를 더 포함하고,
상기 행해진 주문은 상기 수신된 사용자 입력에 의해 지정된 상기 매체 유형에 대한 스케줄 정보를 포함하는 컴퓨터 판독가능한 매체.The method of claim 18,
The method comprises:
For at least one of the plurality of media types,
Causing visual information to be presented to the user and requesting scheduling information for the media type; And
Receiving a user input specifying schedule information for the media type
Further comprising:
And the order placed comprises schedule information for the media type specified by the received user input.
상기 행해진 주문들 중 적어도 하나는, 상기 주문이 행해진 상기 제3자 공급자가 상기 제공자로부터 주문에 대한 지불을 획득할 수 있게 하는 지불 정보를 포함하는 컴퓨터 판독가능한 매체.The method of claim 7, wherein
At least one of the placed orders includes payment information that enables the third party provider from whom the order was placed to obtain payment for the order from the provider.
복수의 제1 레벨 마케팅 활동 각각에 대한 정량적 리프트 인자들의 집합을 이용하여, 상기 복수의 제1 레벨 마케팅 활동에 걸친 리소스 할당을 결정하는 단계;
0이 아닌 리소스 할당을 갖는 제1 레벨 마케팅 활동들 중 하나를 매체 리소스 공급자와 연관시키는 단계; 및
상기 매체 리소스 공급자에 연관된 복수의 제2 레벨 마케팅 활동 각각에 대한 정량적 리프트 인자들의 집합을 이용하여, 상기 복수의 제2 레벨 마케팅 활동에 걸친 리소스 할당을 결정하는 단계
를 포함하는 방법.In a computing system, a method for automatically recommending resource allocations for marketing activities performed for a sale,
Determining resource allocation across the plurality of first level marketing activities using a set of quantitative lift factors for each of the plurality of first level marketing activities;
Associating one of the first level marketing activities with a non-zero resource allocation with the media resource provider; And
Determining resource allocation across the plurality of second level marketing activities using a set of quantitative lift factors for each of the plurality of second level marketing activities associated with the media resource provider.
How to include.
Applications Claiming Priority (10)
| Application Number | Priority Date | Filing Date | Title |
|---|---|---|---|
| US3055008P | 2008-02-21 | 2008-02-21 | |
| US61/030,550 | 2008-02-21 | ||
| US8425208P | 2008-07-28 | 2008-07-28 | |
| US8425508P | 2008-07-28 | 2008-07-28 | |
| US61/084,255 | 2008-07-28 | ||
| US61/084,252 | 2008-07-28 | ||
| US8581908P | 2008-08-01 | 2008-08-01 | |
| US61/085,819 | 2008-08-01 | ||
| US61/085,820 | 2008-08-01 | ||
| US8582008P | 2008-08-07 | 2008-08-07 |
Publications (1)
| Publication Number | Publication Date |
|---|---|
| KR20100126431A true KR20100126431A (en) | 2010-12-01 |
Family
ID=40985943
Family Applications (1)
| Application Number | Title | Priority Date | Filing Date |
|---|---|---|---|
| KR1020107021187A KR20100126431A (en) | 2008-02-21 | 2009-02-20 | Automatically prescribing total budget for marketing and sales resources and allocation across spending categories |
Country Status (10)
| Country | Link |
|---|---|
| US (2) | US20090216597A1 (en) |
| EP (1) | EP2247988A4 (en) |
| JP (1) | JP5530368B2 (en) |
| KR (1) | KR20100126431A (en) |
| CN (1) | CN102016734A (en) |
| AU (1) | AU2009217349B2 (en) |
| BR (1) | BRPI0907592A2 (en) |
| CA (1) | CA2716166A1 (en) |
| MX (1) | MX2010009208A (en) |
| WO (1) | WO2009105705A1 (en) |
Families Citing this family (24)
| Publication number | Priority date | Publication date | Assignee | Title |
|---|---|---|---|---|
| CN101681270A (en) * | 2007-03-19 | 2010-03-24 | 市场份额合伙人有限责任公司 | Automatically prescribing total budget for marketing and sales resources and allocation across spending categories |
| WO2009070790A1 (en) * | 2007-11-29 | 2009-06-04 | Marketshare Partners Llc | Automatically prescribing total budget for marketing and sales resources and allocation across spending categories |
| US20130035975A1 (en) * | 2011-08-05 | 2013-02-07 | David Cavander | Cross-media attribution model for allocation of marketing resources |
| WO2010019959A1 (en) * | 2008-08-15 | 2010-02-18 | Marketshare Partners Llc | Automated decision support for pricing entertainment tickets |
| US8027897B2 (en) * | 2008-10-31 | 2011-09-27 | Hewlett-Packard Development Company, L.P. | System and method for optimizing financial performance generated by marketing investments under budget constraints |
| MX2011004611A (en) | 2008-10-31 | 2011-07-28 | Marketshare Partners Llc | Automated specification, estimation, discovery of causal drivers and market response elasticities or lift factors. |
| US8180694B2 (en) * | 2008-10-31 | 2012-05-15 | Hewlett-Packard Development Company, L.P. | System and method for incorporating qualitative inputs into econometric models |
| US8180693B2 (en) * | 2008-10-31 | 2012-05-15 | Hewlett-Packard Development Company, L.P. | Prediction of financial performance for a given portfolio of marketing investments |
| US8655907B2 (en) * | 2011-07-18 | 2014-02-18 | Google Inc. | Multi-channel conversion path position reporting |
| US8825539B2 (en) * | 2011-08-26 | 2014-09-02 | Morgan Stanley & Co. Llc | Computer-based systems and methods for computing market-adjusted elasticities for accounts |
| US9208462B2 (en) * | 2011-12-21 | 2015-12-08 | Mu Sigma Business Solutions Pvt. Ltd. | System and method for generating a marketing-mix solution |
| US20140019178A1 (en) * | 2012-07-12 | 2014-01-16 | Natalie Kortum | Brand Health Measurement - Investment Optimization Model |
| US20140278622A1 (en) * | 2013-03-15 | 2014-09-18 | Marketshare Partners Llc | Iterative process for large scale marketing spend optimization |
| US9785976B2 (en) * | 2013-12-11 | 2017-10-10 | Facebook, Inc. | Simplified creation of advertisements for objects maintained by a social networking system |
| US20150186924A1 (en) | 2013-12-31 | 2015-07-02 | Anto Chittilappilly | Media spend optimization using a cross-channel predictive model |
| CN104794944B (en) * | 2015-05-11 | 2017-04-05 | 临沂大学 | A kind of on-line shop's sale experience system and method |
| US10679260B2 (en) * | 2016-04-19 | 2020-06-09 | Visual Iq, Inc. | Cross-device message touchpoint attribution |
| US10068188B2 (en) | 2016-06-29 | 2018-09-04 | Visual Iq, Inc. | Machine learning techniques that identify attribution of small signal stimulus in noisy response channels |
| US11195128B2 (en) | 2016-08-02 | 2021-12-07 | Baidu Usa Llc | Systems and methods for estimating healthcare resource demand |
| CN106779796A (en) * | 2016-11-09 | 2017-05-31 | 无锡雅座在线科技发展有限公司 | The method and device of information pushing |
| CN109472454B (en) * | 2018-10-12 | 2023-11-24 | 中国平安人寿保险股份有限公司 | Activity evaluation method, activity evaluation device, electronic equipment and storage medium |
| CN111353797B (en) * | 2018-12-20 | 2023-12-26 | 北京嘀嘀无限科技发展有限公司 | Resource allocation method and device and electronic equipment |
| US20220044277A1 (en) * | 2020-05-22 | 2022-02-10 | Business Powered.com, LLC | Computerized hub for interaction of service purchasers and service providers for real-time generation and adjustment of services |
| US11107112B1 (en) * | 2020-08-25 | 2021-08-31 | Bank Of America Corporation | System for correlation based on resource usage |
Family Cites Families (61)
| Publication number | Priority date | Publication date | Assignee | Title |
|---|---|---|---|---|
| US787353A (en) * | 1904-06-24 | 1905-04-18 | Herbert B Mounsey | Loose-leaf binder. |
| US6988076B2 (en) * | 1997-05-21 | 2006-01-17 | Khimetrics, Inc. | Strategic planning and optimization system |
| EP1031097A2 (en) * | 1997-11-19 | 2000-08-30 | i2 TECHNOLOGIES, INC. | Computer-implemented product valuation tool |
| US6925442B1 (en) * | 1999-01-29 | 2005-08-02 | Elijahu Shapira | Method and apparatus for evaluating vistors to a web server |
| US6567786B1 (en) * | 1999-09-16 | 2003-05-20 | International Business Machines Corporation | System and method for increasing the effectiveness of customer contact strategies |
| EP1285383A1 (en) * | 2000-05-19 | 2003-02-26 | Manugistic Atlanta, Inc. | Dynamic pricing system |
| US20020116237A1 (en) * | 2000-05-26 | 2002-08-22 | Marc-David Cohen | Cross-selling optimizer |
| US20080097826A1 (en) * | 2000-06-05 | 2008-04-24 | Leach Andrew K | Demand aggregation for future items contingent upon threshold demand |
| WO2001097135A2 (en) * | 2000-06-09 | 2001-12-20 | Manugistics Atlanta, Inc. | Event revenue management system |
| WO2002037211A2 (en) * | 2000-10-30 | 2002-05-10 | Archstone-Smith Operating Trust | Lease rent optimizer revenue management system |
| US7287000B2 (en) * | 2000-11-15 | 2007-10-23 | Jda Software Group, Inc. | Configurable pricing optimization system |
| US7302410B1 (en) * | 2000-12-22 | 2007-11-27 | Demandtec, Inc. | Econometric optimization engine |
| US7062447B1 (en) * | 2000-12-20 | 2006-06-13 | Demandtec, Inc. | Imputed variable generator |
| GB2375630A (en) * | 2001-02-07 | 2002-11-20 | Unilever Plc | Consumer interaction system |
| US7130811B1 (en) * | 2001-05-05 | 2006-10-31 | Demandtec, Inc. | Apparatus for merchandise promotion optimization |
| US20030115099A1 (en) * | 2001-11-01 | 2003-06-19 | Burns Stanley S. | Method of automated online media planning and buying |
| US8417564B2 (en) * | 2001-11-13 | 2013-04-09 | Revenue Management Solutions, Inc. | Method for allocating advertising resources |
| US8108249B2 (en) * | 2001-12-04 | 2012-01-31 | Kimberly-Clark Worldwide, Inc. | Business planner |
| US20030229536A1 (en) * | 2002-03-14 | 2003-12-11 | House Sandra Miller | Media planning and buying system and method |
| US20030187767A1 (en) * | 2002-03-29 | 2003-10-02 | Robert Crites | Optimal allocation of budget among marketing programs |
| WO2003093930A2 (en) * | 2002-04-30 | 2003-11-13 | Veridiem Inc. | Marketing optimization system |
| US20040230470A1 (en) * | 2003-01-30 | 2004-11-18 | Accenture Global Services Gmbh | Marketing forecasting tool using econometric modeling |
| US8560364B2 (en) * | 2003-02-14 | 2013-10-15 | Hewlett-Packard Development Company, L.P. | Identifying workforce deployment issues |
| US7379890B2 (en) * | 2003-10-17 | 2008-05-27 | Makor Issues And Rights Ltd. | System and method for profit maximization in retail industry |
| US7685011B2 (en) * | 2003-10-25 | 2010-03-23 | Wilson Thomas W | Method and system for optimizing resource allocation based on cohort times |
| US7644013B2 (en) * | 2003-12-04 | 2010-01-05 | American Express Travel Related Services Company, Inc. | System and method for resource optimization |
| US20050131770A1 (en) * | 2003-12-12 | 2005-06-16 | Aseem Agrawal | Method and system for aiding product configuration, positioning and/or pricing |
| US20050149381A1 (en) * | 2003-12-12 | 2005-07-07 | Delta Air Lines, Inc. | Method and system for estimating price elasticity of product demand |
| US20050177411A1 (en) * | 2003-12-19 | 2005-08-11 | Wolfgang Schuhn | System and method for managing demand influencing factors |
| US20050154639A1 (en) * | 2004-01-09 | 2005-07-14 | Zetmeir Karl D. | Business method and model for integrating social networking into electronic auctions and ecommerce venues. |
| US7848946B2 (en) * | 2004-01-12 | 2010-12-07 | Jda Software Group, Inc. | Sales history decomposition |
| US7580852B2 (en) * | 2004-04-15 | 2009-08-25 | Sap Ag | System and method for modeling non-stationary time series using a non-parametric demand profile |
| US7949561B2 (en) * | 2004-08-20 | 2011-05-24 | Marketing Evolution | Method for determining advertising effectiveness |
| US20060047562A1 (en) * | 2004-08-31 | 2006-03-02 | Kiefer Ralph K | Method and apparatus for planning marketing scenarios |
| US20060074749A1 (en) * | 2004-10-01 | 2006-04-06 | Reachlocal, Inc. | Method and apparatus for allocating a campaign budget among publishers for a marketing campaign |
| US20060085484A1 (en) * | 2004-10-15 | 2006-04-20 | Microsoft Corporation | Database tuning advisor |
| US20060117303A1 (en) * | 2004-11-24 | 2006-06-01 | Gizinski Gerard H | Method of simplifying & automating enhanced optimized decision making under uncertainty |
| CA2602096A1 (en) * | 2005-03-22 | 2009-09-28 | Ticketmaster | Apparatus and methods for providing queue messaging over a network |
| WO2006116570A2 (en) * | 2005-04-25 | 2006-11-02 | The Ticket Reserve, Inc. | Methods and apparatus to predict demand for a product or service |
| CN101198980A (en) * | 2005-05-09 | 2008-06-11 | 唐·W·阿丁顿 | System and method for buying and selling event tickets |
| JP5066736B2 (en) * | 2005-10-14 | 2012-11-07 | 加藤 雄一郎 | COMMUNICATION COST CALCULATION METHOD, DEVICE, SYSTEM, PROGRAM, AND RECORDING MEDIUM USING THE METHOD |
| US7873535B2 (en) * | 2005-11-04 | 2011-01-18 | Accenture Global Services Ltd. | Method and system for modeling marketing data |
| US20070112618A1 (en) * | 2005-11-09 | 2007-05-17 | Generation 5 Mathematical Technologies Inc. | Systems and methods for automatic generation of information |
| US20070143186A1 (en) * | 2005-12-19 | 2007-06-21 | Jeff Apple | Systems, apparatuses, methods, and computer program products for optimizing allocation of an advertising budget that maximizes sales and/or profits and enabling advertisers to buy media online |
| US8359226B2 (en) * | 2006-01-20 | 2013-01-22 | International Business Machines Corporation | System and method for marketing mix optimization for brand equity management |
| US8082175B2 (en) * | 2006-08-24 | 2011-12-20 | Sap Ag | System and method for optimization of a promotion plan |
| US20080109296A1 (en) * | 2006-09-08 | 2008-05-08 | Leach Andrew K | Contingent rights exchange associated with a social network |
| US20080133313A1 (en) * | 2006-12-04 | 2008-06-05 | Arash Bateni | Improved methods and systems for forecasting product demand using price elasticity |
| US20080178079A1 (en) * | 2007-01-18 | 2008-07-24 | International Business Machines Corporation | Apparatus and method for a graphical user interface to facilitate tuning sql statements |
| US20080270363A1 (en) * | 2007-01-26 | 2008-10-30 | Herbert Dennis Hunt | Cluster processing of a core information matrix |
| US20080256011A1 (en) * | 2007-01-30 | 2008-10-16 | Rice Daniel M | Generalized reduced error logistic |
| CN101681270A (en) * | 2007-03-19 | 2010-03-24 | 市场份额合伙人有限责任公司 | Automatically prescribing total budget for marketing and sales resources and allocation across spending categories |
| US8903801B2 (en) * | 2007-09-14 | 2014-12-02 | Oracle International Corporation | Fully automated SQL tuning |
| WO2009070790A1 (en) * | 2007-11-29 | 2009-06-04 | Marketshare Partners Llc | Automatically prescribing total budget for marketing and sales resources and allocation across spending categories |
| US8126748B2 (en) * | 2008-02-25 | 2012-02-28 | Tixtrack, Inc. | Sports and concert event ticket pricing and visualization system |
| US20100036700A1 (en) * | 2008-08-06 | 2010-02-11 | Marketshare Partners Llc | Automatically prescribing total budget for marketing and sales resources and allocation across spending categories |
| US20100036722A1 (en) * | 2008-08-08 | 2010-02-11 | David Cavander | Automatically prescribing total budget for marketing and sales resources and allocation across spending categories |
| WO2010019959A1 (en) * | 2008-08-15 | 2010-02-18 | Marketshare Partners Llc | Automated decision support for pricing entertainment tickets |
| US20110010211A1 (en) * | 2008-08-15 | 2011-01-13 | David Cavander | Automatically prescribing total budget for marketing and sales resources and allocation across spending categories |
| MX2011004611A (en) * | 2008-10-31 | 2011-07-28 | Marketshare Partners Llc | Automated specification, estimation, discovery of causal drivers and market response elasticities or lift factors. |
| US8458167B2 (en) * | 2009-04-01 | 2013-06-04 | International Business Machines Corporation | Client-based index advisor |
-
2009
- 2009-02-20 WO PCT/US2009/034768 patent/WO2009105705A1/en active Application Filing
- 2009-02-20 AU AU2009217349A patent/AU2009217349B2/en not_active Ceased
- 2009-02-20 US US12/390,341 patent/US20090216597A1/en not_active Abandoned
- 2009-02-20 KR KR1020107021187A patent/KR20100126431A/en not_active Application Discontinuation
- 2009-02-20 CA CA2716166A patent/CA2716166A1/en not_active Abandoned
- 2009-02-20 BR BRPI0907592-5A patent/BRPI0907592A2/en not_active Application Discontinuation
- 2009-02-20 EP EP09713006A patent/EP2247988A4/en not_active Withdrawn
- 2009-02-20 MX MX2010009208A patent/MX2010009208A/en not_active Application Discontinuation
- 2009-02-20 CN CN2009801140336A patent/CN102016734A/en active Pending
- 2009-02-20 JP JP2010547815A patent/JP5530368B2/en not_active Expired - Fee Related
-
2015
- 2015-03-16 US US14/659,440 patent/US20150294351A1/en not_active Abandoned
Also Published As
| Publication number | Publication date |
|---|---|
| CA2716166A1 (en) | 2009-08-27 |
| EP2247988A4 (en) | 2011-05-25 |
| CN102016734A (en) | 2011-04-13 |
| WO2009105705A1 (en) | 2009-08-27 |
| MX2010009208A (en) | 2010-11-12 |
| US20090216597A1 (en) | 2009-08-27 |
| JP5530368B2 (en) | 2014-06-25 |
| EP2247988A1 (en) | 2010-11-10 |
| AU2009217349B2 (en) | 2014-10-02 |
| AU2009217349A1 (en) | 2009-08-27 |
| JP2011513817A (en) | 2011-04-28 |
| US20150294351A1 (en) | 2015-10-15 |
| BRPI0907592A2 (en) | 2015-07-21 |
Similar Documents
| Publication | Publication Date | Title |
|---|---|---|
| AU2009217349B2 (en) | Automatically prescribing total budget for marketing and sales resources and allocation across spending categories | |
| US8244571B2 (en) | Automated specification, estimation, discovery of causal drivers and market response elasticities or lift factors | |
| JP5374513B2 (en) | Automatic assignment of total marketing budget and sales resources, and distribution across expenditure categories | |
| US20100036722A1 (en) | Automatically prescribing total budget for marketing and sales resources and allocation across spending categories | |
| EP3794527A1 (en) | Apparatus and method for resource allocation prediction and modeling, and resource acquisition offer generation, adjustment and approval | |
| US20150356598A1 (en) | Automatically prescribing total budget for marketing and sales resources and allocation across spending categories | |
| US20110010211A1 (en) | Automatically prescribing total budget for marketing and sales resources and allocation across spending categories | |
| US20070100656A1 (en) | System and method for sponsorship sourcing system | |
| US20100082392A1 (en) | Multi-objective optimization for allocation of advertising resources | |
| US20100036700A1 (en) | Automatically prescribing total budget for marketing and sales resources and allocation across spending categories | |
| Bauer | Product Management of a Dynamic Web Cataloging Tool for Content Management Systems |
Legal Events
| Date | Code | Title | Description |
|---|---|---|---|
| WITN | Application deemed withdrawn, e.g. because no request for examination was filed or no examination fee was paid |