JP6519262B2 - Three-dimensional object detection device, three-dimensional object detection method, three-dimensional object detection program, and mobile device control system - Google Patents
Three-dimensional object detection device, three-dimensional object detection method, three-dimensional object detection program, and mobile device control system Download PDFInfo
- Publication number
- JP6519262B2 JP6519262B2 JP2015062340A JP2015062340A JP6519262B2 JP 6519262 B2 JP6519262 B2 JP 6519262B2 JP 2015062340 A JP2015062340 A JP 2015062340A JP 2015062340 A JP2015062340 A JP 2015062340A JP 6519262 B2 JP6519262 B2 JP 6519262B2
- Authority
- JP
- Japan
- Prior art keywords
- image
- parallax
- road surface
- dimensional object
- map
- Prior art date
- Legal status (The legal status is an assumption and is not a legal conclusion. Google has not performed a legal analysis and makes no representation as to the accuracy of the status listed.)
- Active
Links
Images

Classifications
-
- G—PHYSICS
- G06—COMPUTING; CALCULATING OR COUNTING
- G06T—IMAGE DATA PROCESSING OR GENERATION, IN GENERAL
- G06T7/00—Image analysis
- G06T7/70—Determining position or orientation of objects or cameras
-
- G—PHYSICS
- G06—COMPUTING; CALCULATING OR COUNTING
- G06T—IMAGE DATA PROCESSING OR GENERATION, IN GENERAL
- G06T11/00—2D [Two Dimensional] image generation
- G06T11/20—Drawing from basic elements, e.g. lines or circles
- G06T11/206—Drawing of charts or graphs
-
- G—PHYSICS
- G06—COMPUTING; CALCULATING OR COUNTING
- G06T—IMAGE DATA PROCESSING OR GENERATION, IN GENERAL
- G06T7/00—Image analysis
- G06T7/20—Analysis of motion
-
- G—PHYSICS
- G06—COMPUTING; CALCULATING OR COUNTING
- G06V—IMAGE OR VIDEO RECOGNITION OR UNDERSTANDING
- G06V20/00—Scenes; Scene-specific elements
- G06V20/50—Context or environment of the image
- G06V20/56—Context or environment of the image exterior to a vehicle by using sensors mounted on the vehicle
-
- H—ELECTRICITY
- H04—ELECTRIC COMMUNICATION TECHNIQUE
- H04N—PICTORIAL COMMUNICATION, e.g. TELEVISION
- H04N13/00—Stereoscopic video systems; Multi-view video systems; Details thereof
- H04N13/20—Image signal generators
- H04N13/204—Image signal generators using stereoscopic image cameras
-
- G—PHYSICS
- G06—COMPUTING; CALCULATING OR COUNTING
- G06T—IMAGE DATA PROCESSING OR GENERATION, IN GENERAL
- G06T2207/00—Indexing scheme for image analysis or image enhancement
- G06T2207/10—Image acquisition modality
- G06T2207/10004—Still image; Photographic image
- G06T2207/10012—Stereo images
-
- G—PHYSICS
- G06—COMPUTING; CALCULATING OR COUNTING
- G06T—IMAGE DATA PROCESSING OR GENERATION, IN GENERAL
- G06T2207/00—Indexing scheme for image analysis or image enhancement
- G06T2207/10—Image acquisition modality
- G06T2207/10016—Video; Image sequence
- G06T2207/10021—Stereoscopic video; Stereoscopic image sequence
-
- G—PHYSICS
- G06—COMPUTING; CALCULATING OR COUNTING
- G06T—IMAGE DATA PROCESSING OR GENERATION, IN GENERAL
- G06T2207/00—Indexing scheme for image analysis or image enhancement
- G06T2207/30—Subject of image; Context of image processing
- G06T2207/30248—Vehicle exterior or interior
- G06T2207/30252—Vehicle exterior; Vicinity of vehicle
- G06T2207/30256—Lane; Road marking
-
- G—PHYSICS
- G06—COMPUTING; CALCULATING OR COUNTING
- G06T—IMAGE DATA PROCESSING OR GENERATION, IN GENERAL
- G06T2207/00—Indexing scheme for image analysis or image enhancement
- G06T2207/30—Subject of image; Context of image processing
- G06T2207/30248—Vehicle exterior or interior
- G06T2207/30252—Vehicle exterior; Vicinity of vehicle
- G06T2207/30261—Obstacle
-
- H—ELECTRICITY
- H04—ELECTRIC COMMUNICATION TECHNIQUE
- H04N—PICTORIAL COMMUNICATION, e.g. TELEVISION
- H04N13/00—Stereoscopic video systems; Multi-view video systems; Details thereof
- H04N13/20—Image signal generators
- H04N13/204—Image signal generators using stereoscopic image cameras
- H04N13/239—Image signal generators using stereoscopic image cameras using two 2D image sensors having a relative position equal to or related to the interocular distance
-
- H—ELECTRICITY
- H04—ELECTRIC COMMUNICATION TECHNIQUE
- H04N—PICTORIAL COMMUNICATION, e.g. TELEVISION
- H04N13/00—Stereoscopic video systems; Multi-view video systems; Details thereof
- H04N2013/0074—Stereoscopic image analysis
- H04N2013/0081—Depth or disparity estimation from stereoscopic image signals
Landscapes
- Engineering & Computer Science (AREA)
- Physics & Mathematics (AREA)
- General Physics & Mathematics (AREA)
- Theoretical Computer Science (AREA)
- Multimedia (AREA)
- Computer Vision & Pattern Recognition (AREA)
- Signal Processing (AREA)
- Image Analysis (AREA)
- Image Processing (AREA)
- Measurement Of Optical Distance (AREA)
- Fittings On The Vehicle Exterior For Carrying Loads, And Devices For Holding Or Mounting Articles (AREA)
- Studio Devices (AREA)
- Traffic Control Systems (AREA)
- Mechanical Engineering (AREA)
Description
本発明は、車両などの移動体の前方を複数の撮像手段により撮像した複数の撮像画像に基づいて当該移動体の前方に存在する立体物を検出する立体物検出装置、立体物検出方法、立体物検出プログラム、及びその検出結果を用いて移動体に搭載された機器を制御する移動体機器制御システムに関する。
The present invention relates to a three-dimensional object detection apparatus, a three-dimensional object detection method, and a three-dimensional object detection method for detecting a three-dimensional object existing in front of a moving object based on a plurality of captured images BACKGROUND OF THE
自動車の安全性において、従来は歩行者や自動車と衝突したときに、いかに歩行者を守れるか、乗員を保護できるかの観点から自動車のボディー構造などの開発が行われてきた。しかしながら近年、情報処理技術、画像処理技術の発達により、高速に人や自動車を検出する技術が開発されてきている。これらの技術を応用して、衝突する前に自動的にブレーキをかけ、衝突を未然に防ぐという自動車もすでに発売されている。自動的にブレーキをかけるには人や他車までの距離を正確に測定する必要があり、そのためには、ミリ波レーダ、レーザレーダによる測距、ステレオカメラによる測距などが実用化されている。 In terms of vehicle safety, in the past, developments have been made on the body structure of a car and the like from the viewpoint of how to protect the pedestrian when it collides with a pedestrian or a car and how to protect the occupants. However, in recent years, with the development of information processing technology and image processing technology, technology for detecting people and vehicles at high speed has been developed. By applying these technologies, vehicles are also put on the market to automatically brake before a collision to prevent a collision. To apply braking automatically, it is necessary to accurately measure the distance to people and other vehicles. For that purpose, millimeter-wave radar, ranging with laser radar, ranging with stereo camera, etc. are put to practical use .
ステレオカメラで人や他車などの物体の三次元的な位置や大きさを正確に検出するためには水平方向の視差を検出する必要があり、視差を検出するために使われる方法としてブロックマッチング方式が知られている。 In order to accurately detect the three-dimensional position or size of an object such as a person or another vehicle with a stereo camera, it is necessary to detect parallax in the horizontal direction, and block matching is a method used to detect parallax. The scheme is known.
しかし、ブロックマッチング方式では垂直に近いエッジあるいはテクスチャがある部分の視差を高い精度で検出することができるが、水平に近いエッジでは視差を検出できないか、仮に検出できても精度の高いものではない。 However, although the block matching method can detect with high accuracy the parallax of a part near a vertical edge or a texture, the parallax can not be detected at an edge close to a horizontal, or even if it can be detected, the accuracy is not high. .
このため、立体物、特に前方を走る自動車をひとつの物体として認識することが困難であった。その理由は、前方を走る自動車は箱状のオブジェクトであり、左右端の垂直線とそれを繋ぐ水平線の集合とみなせるため、ブロックマッチング方式では、オブジェクトの視差は両端の垂直線の部分だけしか検出することができず、オブジェクトを並走した二つのオブジェクトと認識してしまうことが多いからである。 For this reason, it has been difficult to recognize a three-dimensional object, particularly a car traveling ahead, as a single object. The reason is that a car traveling forward is a box-like object, and it can be regarded as a set of vertical lines at the left and right ends and horizontal lines connecting them, so in the block matching method, only the vertical lines at both ends are detected It is often impossible to recognize an object as two parallel objects.
この問題に対応した発明として、特許文献1に記載された前方車両検出装置及び方法がある。この前方車両検出装置及び方法では、自車線内の前走車の検出と距離を求める目的で、路面と同じ高さにある物体を除去した後の視差画像中に、左右に同じ視差値を有する画素があるとき、当該左右画素間の画素に前記視差値を代入して補間視差画像を作成することで、一つのオブジェクトと認識する。
As an invention corresponding to this problem, there is a forward vehicle detection device and method described in
しかしながら、特許文献1に記載された前方車両検出装置及び方法では、自動車と並走している他の自動車、その近くの標識、その他の立体物の間で視差を補間してしまい、物体を正確に認識できないという問題がある。
However, in the forward vehicle detection apparatus and method described in
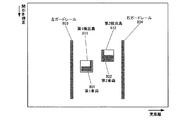
また、視差値には分散があり、この分散は、ステレオカメラの基線長が小さいほど、被写体までの距離が遠いほど検出される視差値に対する割合が大きくなることが知られている。このため、隣接車線の前方で複数の車両が縦列走行していて、遠方の車両の一部が見えている場合、手前の車両と奥の車両の視差値が連結してしまい、ひとつの孤立領域として検出されることがある。 Further, it is known that there is a variance in the parallax value, and the proportion of the variance to the detected parallax value increases as the distance to the subject increases as the baseline length of the stereo camera decreases. For this reason, when a plurality of vehicles are traveling in tandem in front of the adjacent lane and a part of the distant vehicles is visible, the parallax values of the vehicles in front and the vehicles in back are connected, and one isolated area It may be detected as
この場合、物体としての検出は可能であるが、孤立領域の視差値の平均値に基づく物体までの距離計算に影響を及ぼし、検出した距離が手前の物体までの距離より大きくなることがある。物体までの距離が正確でないと、自動緊急ブレーキなどの機能が正常に働かなくなる恐れがある。 In this case, although detection as an object is possible, it affects the calculation of the distance to the object based on the average value of the parallax values of the isolated region, and the detected distance may be larger than the distance to the object in front. If the distance to the object is not accurate, functions such as automatic emergency braking may not work properly.
このように、従来の前方車両検出装置及び方法では、複数の物体が一つの孤立領域として検出されてしまい、正しい物体検出ができないという問題がある。 As described above, the conventional forward vehicle detection apparatus and method have a problem that a plurality of objects are detected as one isolated area, and correct object detection can not be performed.
本発明は、このような問題を解決するためになされたものであり、その目的は、車両などの移動体に搭載された複数の撮像手段により前記移動体の移動方向の前方を撮像して得た複数の撮像画像及びその撮像画像から生成した視差画像に基づいて、前記移動方向の前方に存在する立体物の三次元的な位置や大きさを検出するときに、複数の立体物の連結を防止して、立体物の正確な位置や大きさを検出できるようにすることである。 The present invention has been made to solve such a problem, and an object thereof is to obtain an image of the front of the moving direction of the moving body by a plurality of imaging means mounted on the moving body such as a vehicle. When detecting a three-dimensional position or size of a solid object existing in front of the moving direction based on a plurality of captured images and a parallax image generated from the captured images, connection of the plurality of solid objects is It is to prevent so that the exact position and size of a solid thing can be detected.
本発明に係る立体物検出装置は、移動体に搭載された複数の撮像手段により前記移動体の移動方向の前方を撮像して得た複数の撮像画像及びその撮像画像から生成した視差画像に基づいて、前記移動方向の前方に存在する立体物を検出する立体物検出装置であって、
前記視差画像に基づいて、前記移動方向に対する横方向の距離と前記移動方向の距離とを関連付けた視差値の頻度分布を表すマップを生成するマップ生成手段と、前記頻度分布に基づいて孤立領域を検出する孤立領域検出手段と、前記孤立領域内の前記頻度分布に基づいて、前記孤立領域を分割する孤立領域分割手段と、前記分割された孤立領域に基づいて立体物を検出する立体物検出手段と、を有する立体物検出装置である。
The three-dimensional object detection device according to the present invention is based on a plurality of captured images obtained by capturing an image of the front of the moving direction of the moving object by a plurality of imaging units mounted on the moving object and parallax images generated from the captured images. A three-dimensional object detection device for detecting a three-dimensional object existing in front of the moving direction,
Map generation means for generating a map representing a frequency distribution of parallax values in which the distance in the lateral direction with respect to the movement direction is associated with the distance in the movement direction based on the parallax image; Isolated area detecting means for detecting, isolated area dividing means for dividing the isolated area based on the frequency distribution in the isolated area, and solid object detecting means for detecting a three-dimensional object based on the divided isolated area And a three-dimensional object detection device.
本発明によれば、移動体に搭載された複数の撮像手段により前記移動体の移動方向の前方を撮像して得た複数の撮像画像及びその撮像画像から生成した視差画像に基づいて、前記移動方向の前方に存在する立体物の三次元的な位置や大きさを検出するときに、複数の立体物の連結を防止して、立体物の正確な位置や大きさを検出することができる。 According to the present invention, the movement is performed based on a plurality of captured images obtained by capturing an image of the front of the moving direction of the moving body by a plurality of imaging units mounted on the moving body and a parallax image generated from the captured image. When detecting the three-dimensional position and size of a three-dimensional object present in front of the direction, it is possible to prevent the connection of a plurality of three-dimensional objects and to detect the accurate position and size of the three-dimensional object.
以下、本発明に係る立体物検出装置を有する移動体機器制御システムの実施形態について説明する。 Hereinafter, an embodiment of a mobile device control system having a three-dimensional object detection device according to the present invention will be described.
〈車載機器制御システムの概略構成〉
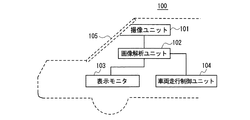
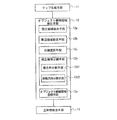
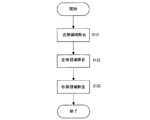
図1は、本発明の実施形態に係る移動体機器制御システムとしての車載機器制御システムの概略構成を示す模式図である。
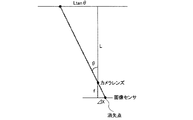
この車載機器制御システムは、移動体である自動車などの自車両100に搭載されており、撮像ユニット101、画像解析ユニット102、表示モニタ103、及び車両走行制御ユニット104からなる。そして、撮像ユニット101で撮像した自車両の進行方向(移動方向)の前方領域(撮像領域)の撮像画像データから、自車両前方の路面(移動面)の相対的な高さ情報(相対的な傾斜状況を示す情報)を検知し、その検知結果から、自車両前方の走行路面の3次元形状を検出し、その検出結果を利用して各種車載機器の制御を行う。
<Schematic Configuration of In-vehicle Device Control System>
FIG. 1 is a schematic view showing a schematic configuration of an in-vehicle device control system as a mobile device control system according to an embodiment of the present invention.
The on-vehicle device control system is mounted on the
撮像ユニット101は、例えば、自車両100のフロントガラス105のルームミラー(図示せず)付近に設置される。撮像ユニット101の撮像によって得られる撮像画像データ等の各種データは、画像処理手段としての画像解析ユニット102に入力される。画像解析ユニット102は、撮像ユニット101から送信されてくるデータを解析して、自車両100が走行している路面部分(自車両の真下に位置する路面部分)に対する自車両前方の走行路面上の各地点における相対的な高さ(位置情報)を検出し、自車両前方の走行路面の3次元形状を把握する。
The
画像解析ユニット102の解析結果は、表示モニタ103及び車両走行制御ユニット104に送られる。表示モニタ103は、撮像ユニット101で得られた撮像画像データ及び解析結果を表示する。車両走行制御ユニット104は、画像解析ユニット102による走行路面の相対傾斜状況の認識結果に基づいて自車両前方の他車両、歩行者、各種障害物などの認識対象物を認識し、その認識結果に基づいて、自車両100の運転者へ警告を報知したり、自車両のハンドルやブレーキを制御するなどの走行支援制御を行ったりする。
The analysis result of the
〈撮像ユニット101及び画像解析ユニット102の概略構成〉
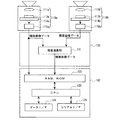
図2は、図1における撮像ユニット101及び画像解析ユニット102の概略構成を示す模式図である。
<Schematic Configuration of
FIG. 2 is a schematic view showing a schematic configuration of the
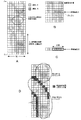
撮像ユニット101は、撮像手段としての2つの撮像部110a,110bを備えたステレオカメラで構成されており、2つの撮像部110a,110bは同一のものである。各撮像部110a,110bは、それぞれ、撮像レンズ111a,111bと、受光素子が2次元配置された画像センサ113a,113bを含んだセンサ基板114a,114bと、センサ基板114a,114bから出力されるアナログ電気信号(画像センサ113a,113b上の各受光素子が受光した受光量に対応する電気信号)をデジタル電気信号に変換した撮像画像データを生成して出力する信号処理部115a,115bとから構成されている。撮像ユニット101からは、輝度画像データと視差画像データが出力される。
The
また、撮像ユニット101は、FPGA(Field-Programmable Gate Array)等からなる処理ハードウェア部120を備えている。この処理ハードウェア部120は、各撮像部110a,110bから出力される輝度画像データから視差画像を得るために、各撮像部110a,110bでそれぞれ撮像した撮像画像間の対応画像部分の視差値を演算する視差画像情報生成手段としての視差演算部121を備えている。
The
ここでいう視差値とは、各撮像部110a,110bでそれぞれ撮像した撮像画像の一方を基準画像、他方を比較画像とし、撮像領域内の同一地点に対応した基準画像上の画像部分に対する比較画像上の画像部分の位置ズレ量を、当該画像部分の視差値として算出したものである。三角測量の原理を利用することで、この視差値から当該画像部分に対応した撮像領域内の当該同一地点までの距離を算出することができる。
The parallax value referred to here is a comparison image with respect to an image portion on a reference image corresponding to the same point in the imaging region, with one of the images taken by each of the
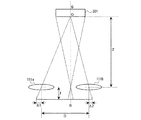
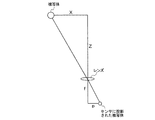
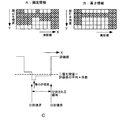
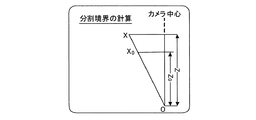
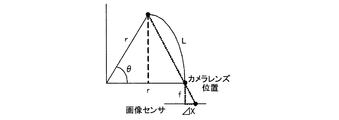
図3は、三角測量の原理を利用することで視差値から距離を算出する原理を説明するための図である。図において、fは撮像レンズ111a,111bのそれぞれの焦点距離であり、Dは光軸間の距離である。また、Zは撮像レンズ111a,111bから被写体301までの距離(光軸に平行な方向の距離)である。この図において、被写体301上にある点Oに対する左右画像での結像位置は、結像中心からの距離がそれぞれΔ1とΔ2となる。このときの視差値dは、d=Δ1+Δ2と規定することができる。
FIG. 3 is a diagram for explaining the principle of calculating the distance from the parallax value by using the principle of triangulation. In the figure, f is the focal length of each of the
図2の説明に戻る。画像解析ユニット102は、画像処理基板等から構成され、撮像ユニット101から出力される輝度画像データ及び視差画像データを記憶するRAMやROM等で構成される記憶手段122と、識別対象の認識処理や視差計算制御などを行うためのコンピュータプログラムを実行するCPU(Central Processing Unit)123と、データI/F(インタフェース)124と、シリアルI/F125を備えている。
It returns to the explanation of FIG. The
処理ハードウェア部120を構成するFPGAは、画像データに対してリアルタイム性が要求される処理、例えばガンマ補正、ゆがみ補正(左右の撮像画像の平行化)、ブロックマッチングによる視差演算を行って視差画像の情報を生成し、画像解析ユニット102のRAMに書き出す処理などを行う。画像解析ユニット102のCPUは、各撮像部110a,110bの画像センサコントローラの制御および画像処理基板の全体的な制御を担う。また、路面の3次元形状の検出処理、ガードレールその他の各種オブジェクト(識別対象物)の検出処理などを実行する立体物検出プログラムをROMからロードして、RAMに蓄えられた輝度画像データや視差画像データを入力して各種処理を実行し、その処理結果をデータI/F124やシリアルI/F125から外部へと出力する。このような処理の実行に際し、データI/F124を利用して、自車両100の車速、加速度(主に自車両前後方向に生じる加速度)、操舵角、ヨーレートなどの車両動作情報を入力し、各種処理のパラメータとして使用することもできる。外部に出力されるデータは、自車両100の各種機器の制御(ブレーキ制御、車速制御、警告制御など)を行うための入力データとして使用される。
The FPGA that configures the
〈物体検出処理の概要〉
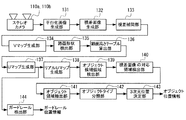
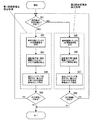
図4は、図2における処理ハードウェア部120及び画像解析ユニット102で実現される物体検出処理について説明するための機能ブロック図である。以下、本実施形態における物体検出処理について説明する。
<Overview of Object Detection Processing>
FIG. 4 is a functional block diagram for explaining object detection processing implemented by the
ステレオカメラを構成する2つの撮像部110a,110bからは輝度画像データが出力される。このとき、撮像部110a,110bがカラーの場合には、そのRGB信号から輝度信号(Y)を得るカラー輝度変換を、例えば下記の式〔1〕を用いて行う。
Y=0.3R+0.59G+0.11B …式〔1〕
Luminance image data is output from the two
Y = 0.3R + 0.59G + 0.11B ... Formula [1]
《平行化画像生成処理》
輝度画像データに対して、まず、平行化画像生成部131で平行化画像生成処理が実行される。この平行化画像生成処理は、撮像部110a,110bにおける光学系の歪みや左右の撮像部110a,110bの相対的な位置関係から、各撮像部110a,110bから出力される輝度画像データ(基準画像と比較画像)を、2つのピンホールカメラが平行に取り付けられたときに得られる理想的な平行化ステレオ画像となるように変換する。これは、各画素での歪み量を、Δx=f(x,y)、Δy=g(x,y)という多項式を用いて計算し、その計算結果を用いて、各撮像部110a,110bから出力される輝度画像データ(基準画像と比較画像)の各画素を変換する。多項式は、例えば、x(画像の横方向位置)、y(画像の縦方向位置)に関する5次多項式に基づく。
<< Parallelized image generation processing >>
First, parallelized image generation processing is performed on the luminance image data by the parallelized
《視差画像生成処理》
このようにして平行化画像処理を行った後、次に、視差演算部121(図2)によって構成される視差画像生成部132において、視差画像データ(視差画像情報)を生成する視差画像生成処理を行う。視差画像生成処理では、まず、2つの撮像部110a,110bのうちの一方の撮像部110aの輝度画像データを基準画像データとし、他方の撮像部110bの輝度画像データを比較画像データとし、これらを用いて両者の視差を演算して、視差画像データを生成して出力する。この視差画像データは、基準画像データ上の各画像部分について算出される視差値dに応じた画素値をそれぞれの画像部分の画素値として表した視差画像を示すものである。
Parallax image generation processing
After the parallelization image processing is performed as described above, next, parallax image generation processing for generating parallax image data (parallax image information) in the parallax
具体的には、視差画像生成部132は、基準画像データのある行について、一つの注目画素を中心とした複数画素(例えば16画素×1画素)からなるブロックを定義する。一方、比較画像データにおける同じ行において、定義した基準画像データのブロックと同じサイズのブロックを1画素ずつ横ライン方向(X方向)へずらし、基準画像データにおい
て定義したブロックの画素値の特徴を示す特徴量と比較画像データにおける各ブロックの画素値の特徴を示す特徴量との相関を示す相関値を、それぞれ算出する。そして、算出した相関値に基づき、比較画像データにおける各ブロックの中で最も基準画像データのブロックと相関があった比較画像データのブロックを選定するマッチング処理を行う。その後、基準画像データのブロックの注目画素と、マッチング処理で選定された比較画像データのブロックの対応画素との位置ズレ量を視差値dとして算出する。このような視差値dを算出する処理を基準画像データの全域又は特定の一領域について行うことで、視差画像データを得ることができる。
Specifically, the parallax
マッチング処理に用いるブロックの特徴量としては、例えば、ブロック内の各画素の値(輝度値)を用いることができ、相関値としては、例えば、基準画像データのブロック内の各画素の値(輝度値)と、これらの画素にそれぞれ対応する比較画像データのブロック内の各画素の値(輝度値)との差分の絶対値の総和を用いることができる。この場合、当該総和が最も小さくなるブロックが最も相関があると言える。 For example, the value (brightness value) of each pixel in the block can be used as the feature amount of the block used for the matching process, and the correlation value can be, for example, the value of each pixel in the block of the reference image data (brightness A sum of absolute values of differences between the values) and the values (brightness values) of the respective pixels in the block of the comparison image data respectively corresponding to these pixels can be used. In this case, it can be said that the block with the smallest total sum is most correlated.
視差画像生成部132でのマッチング処理をハードウェア処理によって実現する場合には、例えばSSD(Sum of Squared Difference)、ZSSD(Zero-mean Sum of Squared Difference)、SAD(Sum of Absolute Difference)、ZSAD(Zero-mean Sum of Absolute Difference)などの方法を用いることができる。なお、マッチング処理では画素単位での視差値しか算出できないので、1画素未満のサブピクセルレベルの視差値が必要な場合には推定値を用いる必要がある。その推定方法としては、例えば、等角直線方式、二次曲線方式等を利用することができる。ただし、このサブピクセルレベルの推定視差値には誤差が発生するので、この推定誤差を減少させるEEC(推定誤差補正)などを用いてもよい。
When the matching processing in the parallax
《視差画像補間処理の概要》
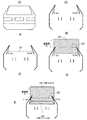
視差画像生成処理を行ったら、次に画像解析ユニット102によって構成される視差補間部133において、視差画像補間処理を行い、補間視差画像を生成する。図5は、視差画像補間処理の概要について説明するための図である。ここで、図5Aは撮像画像、図5Bは視差画像である。また、図5C〜Eは、視差画像補間処理を実行する条件を説明するための図である。
<< Overview of parallax image interpolation processing >>
After performing parallax image generation processing, next, in the
図5Aに示す車両の撮像画像(輝度画像)310から、視差画像生成部132により図5Bに示す視差画像320が生成される。視差値dは水平方向の位置ズレの度合いなので、撮像画像310の水平エッジ部分や輝度変化の少ない部分では視差が計算できないため、車両を一つのオブジェクトとして認識できなくなる。
The
そこで、視差補間部133では、下記a〜eの5つの判定条件に基づいて、視差画像の同一ライン上の2点、即ち図5Bに示す同一Y座標(画像の垂直方向)の2点の画素P1(視差値D1)、P2(視差値D2)を補間する。
Therefore, in the
a:2点間の実距離が所定の長さより短い(第1判定条件)。
視差値D1に対応する距離をZ1、画素P1、P2間の画像上の距離をPXとすると、2点間の近似的な実距離RZは、ステレオカメラの焦点距離をfとすると、「RZ=Z1/f*PX」で算出することができる。RZが所定の値(乗用車1台に相当する幅:1900mm)以内であれば、この条件は満たされる。
a: The actual distance between two points is shorter than a predetermined length (first determination condition).
Assuming that the distance corresponding to the parallax value D1 is Z1 and the distance on the image between the pixels P1 and P2 is PX, an approximate actual distance RZ between two points is f, the focal distance of the stereo camera is “RZ = It can be calculated by “Z1 / f * PX”. If RZ is within a predetermined value (width corresponding to one passenger car: 1900 mm), this condition is satisfied.
b:2点間に他の視差値が存在しない(第2判定条件)。
即ち、図5Cにおける画素P1と画像P2を結ぶライン321上の画素に視差値が存在しない。
b: There is no other disparity value between the two points (second determination condition).
That is, no parallax value exists in the pixel on the
c:2点の奥行の差(自車両100の前方方向の距離の差)がどちらか一方の距離に応じて設定する閾値より小さい、又は2点の奥行の差がどちらか一方の距離における測距精度に応じて設定する閾値より小さい(第3判定条件)。 c: The difference in depth between two points (difference in distance in the forward direction of the vehicle 100) is smaller than the threshold set according to one of the distances, or the difference in depth between two points is measured at one of the distances It is smaller than the threshold set according to the distance accuracy (third determination condition).
ここで、左側の画素P1の視差値D1より距離Z1を計算する。ステレオ方式の測距精度、特にブロックマッチングによる測距精度は距離に依存する。つまり、その精度は例えば距離±10%という具合である。そこで、測距精度が10%であるならば、奥行の差の閾値をZ1の20%(=Z1*0.2)とする。 Here, the distance Z1 is calculated from the parallax value D1 of the pixel P1 on the left side. The distance measurement accuracy of the stereo method, in particular, the distance measurement accuracy by block matching depends on the distance. That is, the accuracy is, for example, the distance ± 10%. Therefore, if the distance measurement accuracy is 10%, the threshold value of the depth difference is set to 20% of Z1 (= Z1 * 0.2).
d:2点より高く、かつ所定の高さ(例えば1.5m:車高に対応)以下の位置に水平エッジが存在する(第4判定条件)。
即ち、図5Dに示すように、例えば2点から1.5m以内の高さの領域322に水平エッジが所定数以上存在するか否かを判定する。高さ1.5mに相当する画素数PZは、画素P1の視差値D1から算出される距離Z1とステレオカメラの焦点距離fから、「PZ=1.5m*f/Z1」の式により算出することができる。
d: A horizontal edge is present at a position higher than two points and not more than a predetermined height (for example, 1.5 m: corresponding to the vehicle height) (fourth determination condition).
That is, as shown in FIG. 5D, it is determined, for example, whether or not a predetermined number or more of horizontal edges exist in an
ここで、「水平エッジが存在する場合」とは、画素P1、P2間のある画素(注目画素)において、その上方の領域322内に水平エッジがあることを意味する。つまり、後述するエッジ位置カウントのラインバッファの前記画素位置における値が1以上PZ以下である。
Here, "when there is a horizontal edge" means that there is a horizontal edge in a
そして、後述する水平エッジ検出処理(図6のステップS2、図7A)を1ライン実行した後、次ラインの視差補間において画素P1、P2間を補間しようとするとき、画素P1、P2間に水平エッジが存在する場合が画素P1、P2間の画素数の1/2より大きいとき、第4判定条件は真となる。
想定するシーンは車両の屋根323である。水平エッジが連続している場合、画素P1、P2の視差値D1、D2の差が所定値以下であれば補間する。
Then, after performing one line of horizontal edge detection processing (step S2 in FIG. 6, FIG. 7A) to be described later, when trying to interpolate between pixels P1 and P2 in parallax interpolation of the next line The fourth determination condition is true when the presence of an edge is larger than 1/2 of the number of pixels between the pixels P1 and P2.
The assumed scene is the
e:2点間の上下近傍にその2点より遠方の視差情報(遠方視差値)が存在しない(第5判定条件)。
遠方の視差情報とは、視差値D1、D2から得られる距離Z1、Z2の大きい方の値の20%以上遠方の距離に対応する視差値である。
e: There is no disparity information (far disparity value) farther from the two points in the upper and lower vicinity between the two points (fifth determination condition).
The distant parallax information is a parallax value corresponding to a distant distance of 20% or more of the larger value of the distances Z1 and Z2 obtained from the parallax values D1 and D2.
即ち、例えば図5Eに示すように、画素P1、P2より高い位置(上側1.5m以内。画素数でいえばPZ以内)の領域322、或いは領域322の下側10ライン以内の領域324で、画素P1、P2間の各画素の上下方向に遠方視差を持つ場合を画素P1、P2間の全画素について数える。そして、その総和が所定の値(例えば2)以上のとき、第5判定条件は真となる。
That is, for example, as shown in FIG. 5E, in the
ここで、「P1、P2間のある画素が遠方視差を持つ場合」とは、後述する上側視差位置カウントに1以上PZ以下の値があるか、又は後述する下側視差位置ビットフラグの各ビットのいずれかに1が立っている場合である。
第5判定条件が偽となる場合とは、補間しようとするラインの近傍に遠方視差が存在する場合、即ち、遠方の物体が見えている場合である。その場合は、視差補間をしないことになる。
Here, “when a pixel between P1 and P2 has a far parallax” means that the upper parallax position count described later has a value of 1 or more and PZ or less, or each bit of the lower parallax position bit flag described later If one of them is standing.
The case where the fifth determination condition is false is a case where a distant parallax is present in the vicinity of the line to be interpolated, that is, a case where a distant object is viewed. In that case, parallax interpolation is not performed.
《視差画像補間処理のフロー》
次に視差補間処理について詳細に説明する。
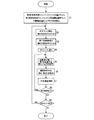
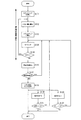
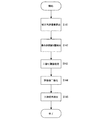
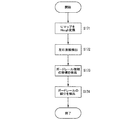
図6は、視差画像補間処理の全体の流れを示すフローチャートである。
まず、第4判定条件用ラインバッファ(エッジ位置カウント)、及び第5判定条件用ラインバッファ(上側視差位置カウント、下側視差位置ビットフラグ)を初期化する(ステップS1)。
<< Flow of parallax image interpolation processing >>
Next, disparity interpolation processing will be described in detail.
FIG. 6 is a flowchart showing the entire flow of parallax image interpolation processing.
First, the fourth determination condition line buffer (edge position count) and the fifth determination condition line buffer (upper disparity position count, lower disparity position bit flag) are initialized (step S1).
ここで、エッジ位置カウントは、視差補間するラインより何ライン上に水平エッジがあるかを表す情報を画素単位で保持するためにラインバッファに設定されたカウンタである。また、上側視差位置カウントは、視差補間するラインより何ライン上の領域322内に遠方視差値があるかを示す情報を保持するためにラインバッファに設定されたカウンタである。また、下側視差位置ビットフラグは、視差補間するラインの下側10ライン以内(領域324内)に遠方視差値があることを表す情報を保持するためにラインバッファに設定されたカウンタである。下側視差位置ビットフラグは、11ビットフラグが1ラインの画素数分用意される。
Here, the edge position count is a counter set in the line buffer in order to hold, in pixel units, information representing how many horizontal edges above the line to be subjected to disparity interpolation. Further, the upper parallax position count is a counter set in the line buffer to hold information indicating how many distant parallax values exist in the
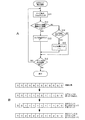
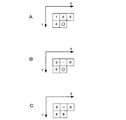
次に、第4判定条件のために、ある1ラインの水平エッジを検出する(ステップS2)。図7は、ステップS2(水平エッジ検出処理)の詳細について説明するための図である。ここで、図7Aは、水平エッジ検出処理のアルゴリズムを示すフローチャートであり、図7Bは、エッジ位置カウント及びその値の変化の例を示す図である。 Next, a horizontal edge of a certain line is detected for the fourth determination condition (step S2). FIG. 7 is a diagram for describing the details of step S2 (horizontal edge detection processing). Here, FIG. 7A is a flowchart showing an algorithm of horizontal edge detection processing, and FIG. 7B is a view showing an example of edge position count and change of the value thereof.
まず輝度画像をSobel(ソーベル)フィルタで処理することで、垂直エッジ及び水平エッジの強度を求め(ステップS11)、水平エッジ強度が垂直エッジ強度の2倍を超えているか否かを判断する(ステップS12)。 First, the intensity image is processed with a Sobel filter to obtain the strengths of vertical edges and horizontal edges (step S11), and it is determined whether the horizontal edge strength exceeds twice the vertical edge strength (step S11). S12).
そして、水平エッジ強度が垂直エッジ強度の2倍を超えているときは(ステップS12:YES)、水平エッジありと判断してエッジ位置カウントを1に設定する(ステップS13)。一方、水平エッジ強度が垂直エッジ強度の2倍以下のときは(ステップS12:NO)、水平エッジなしと判断して、エッジ位置カウントが0より大きいか否かを判断する(ステップS14)。そして、0より大きいときは(ステップS14:YES)、エッジ位置カウントを1つインクリメントする(ステップS15)。ステップS14でエッジ位置カウントが0であると判断したときは(ステップS14:NO)、エッジ位置カウントを更新しない。 When the horizontal edge strength exceeds twice the vertical edge strength (step S12: YES), it is determined that there is a horizontal edge, and the edge position count is set to 1 (step S13). On the other hand, if the horizontal edge strength is equal to or less than twice the vertical edge strength (step S12: NO), it is judged that there is no horizontal edge, and it is judged whether the edge position count is larger than 0 (step S14). When it is larger than 0 (step S14: YES), the edge position count is incremented by one (step S15). If it is determined in step S14 that the edge position count is 0 (step S14: NO), the edge position count is not updated.
水平エッジの有無とエッジ位置カウントの値によりステップS13、S15でエッジ位置カウントの値を更新した後、又はステップS14でエッジ位置カウントが0であると判断した後(ステップS14:NO)、ステップS16に進み、ライン内の次の画素の有無を判断する。 After updating the edge position count value in steps S13 and S15 based on the presence / absence of the horizontal edge and the edge position count value, or after determining that the edge position count is 0 in step S14 (step S14: NO), step S16 To determine the presence or absence of the next pixel in the line.
次の画素があるときは(ステップS16:YES)、ステップS11に移行し、ステップS11〜S15を繰り返す。次の画素がないときは(ステップS16:NO)、この図に示す1ライン分の水平エッジ検出処理が終了する。 When there is a next pixel (step S16: YES), the process proceeds to step S11, and steps S11 to S15 are repeated. When there is no next pixel (step S16: NO), the horizontal edge detection process for one line shown in this figure ends.
図7Aに示すように、各画素に対応するエッジ位置カウントの初期値はステップS1で初期化された0になっている。あるラインで水平エッジが見つかり始めると、ステップS13でエッジ位置カウントが1に設定される。図7Bでは、全12画素のうち、中央の2画素及び両端の4画素を除く6画素について、水平エッジが検出されたことを示している。次のラインでは、両端の4画素を除く8画素について、水平エッジが検出されたことを示している。その次のラインでは、水平エッジが検出されないため、ステップS15でエッジ位置カウントがインクリメントされ、2になっている。 As shown in FIG. 7A, the initial value of the edge position count corresponding to each pixel is 0 initialized in step S1. When a horizontal edge starts to be found in a certain line, the edge position count is set to 1 in step S13. FIG. 7B shows that horizontal edges have been detected for six pixels excluding the central two pixels and the four pixels at both ends out of a total of 12 pixels. The next line indicates that horizontal edges have been detected for eight pixels excluding the four pixels at both ends. In the next line, since the horizontal edge is not detected, the edge position count is incremented to 2 in step S15.
以後の各ラインで水平エッジが検出された場合は、エッジ位置カウントの値が1となり、水平エッジが検出されない限り、エッジ位置カウントが1ずつインクリメントされる。従って、各画素に対応するエッジ位置カウントの値により、視差補間をしようとする何ライン上に水平エッジがあるかが判る。 When a horizontal edge is detected in each subsequent line, the value of the edge position count becomes 1, and the edge position count is incremented by 1 unless a horizontal edge is detected. Therefore, the value of the edge position count corresponding to each pixel indicates the number of lines on which horizontal interpolation is to be performed on the parallax interpolation.
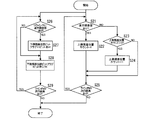
1ライン分の水平エッジ検出処理が終了したら、次に第5判定条件のために遠方視差値を検出する(ステップS3)。図8は、ステップS3(遠方視差値検出処理)のアルゴリズムを示すフローチャートである。 When the horizontal edge detection process for one line is completed, the far parallax value is detected for the fifth determination condition (step S3). FIG. 8 is a flowchart showing an algorithm of step S3 (far disparity value detection processing).
図5Eにおける上側の領域322に対する処理(以下、上側遠方視差値検出処理)、下側の領域324に対する処理(以下、下側遠方視差値検出処理)が並行して行われるが、便宜上、上側遠方視差値検出処理、下側遠方視差値検出処理の順で個別に説明する。
The processing for the
上側遠方視差値検出処理では、まず遠方視差値の有無を判断する(ステップS21)。判断の結果、あるときは(ステップS21:YES)、上側視差位置カウントを1に設定し(ステップS22)、ないときは(ステップS21:NO)、上側視差位置カウントが0より大きいか否かを判断する(ステップS23)。そして、0より大きいときは(ステップS23:YES)、上側視差位置カウントを1つインクリメントする(ステップS24)。 In the upper side far parallax value detection process, first, the presence or absence of the far parallax value is determined (step S21). As a result of the judgment, when there is (step S21: YES), the upper parallax position count is set to 1 (step S22), and when it is not (step S21: NO), whether the upper parallax position count is larger than 0 or not It judges (step S23). Then, when it is larger than 0 (step S23: YES), the upper parallax position count is incremented by one (step S24).
遠方視差値の有無とそのときの上側視差位置カウントの値によりステップS22或いはS24で上側視差位置カウントの値を更新した後、又はステップS23で上側視差位置カウントが0であると判断した後(ステップS23:NO)、ステップS25に進み、ライン内の次の画素の有無を判断する。 After updating the value of the upper parallax position count in step S22 or S24 based on the presence of the far parallax value and the value of the upper parallax position count at that time, or after determining that the upper parallax position count is 0 in step S23 (step S23: NO) Go to step S25, and determine the presence or absence of the next pixel in the line.
次の画素があるときは(ステップS25:YES)、ステップS21に移行し、ステップS21〜S24を繰り返す。次の画素がないときは(ステップS25:NO)、この図に示す1ライン分の上側遠方視差値検出処理が終了する。 When there is a next pixel (step S25: YES), the process proceeds to step S21, and steps S21 to S24 are repeated. If there is no next pixel (step S25: NO), the upper distant disparity value detection process for one line shown in this figure ends.
つまり、上側遠方視差値検出処理は、図7Aに示す処理における水平エッジを遠方視差値に変えたものである。 That is, in the upper side far disparity value detection process, the horizontal edge in the process shown in FIG. 7A is changed to the far disparity value.
下側遠方視差値検出処理では、まず下側11ライン目に遠方視差値があるか否かを判断する(ステップS26)。判断の結果、あるときは(ステップS26:YES)、下側視差位置ビットフラグの11ビット目を1に設定した後(ステップS27)、下側視差位置ビットフラグを1ビット右へシフトする(ステップS28)。判断の結果、ないときは(ステップS26:NO)、そのまま下側視差位置ビットフラグを1ビット右へシフトする。これにより、2つの画素(P1、P2)間の画素の下側10ライン内で最も近いラインにある下側遠方視差値の位置が判る。 In the lower distant parallax value detection process, first, it is determined whether there is a distant parallax value in the lower 11th line (step S26). As a result of determination, if there is (step S26: YES), the 11th bit of the lower parallax position bit flag is set to 1 (step S27), and then the lower parallax position bit flag is shifted 1 bit to the right (step S27) S28). As a result of the determination, if there is not (step S26: NO), the lower disparity position bit flag is shifted to the right by one bit as it is. Thereby, the position of the lower far parallax value in the closest line in the lower 10 lines of the pixels between the two pixels (P1, P2) can be determined.
ライン内に次の画素がある間は(ステップS29:YES)、ステップS26〜S28を繰り返し、なくなったら(ステップS29:NO)、この図に示す1ライン分の下側遠方視差値検出処理が終了する。 While there is the next pixel in the line (step S29: YES), steps S26 to S28 are repeated, and if there is no more (step S29: NO), the processing for detecting the lower distant parallax value for one line shown in this figure ends. Do.
1ライン分の遠方視差値検出処理が終了したら、次のラインに進み(ステップS4)、第1〜第3判定条件を満たす2点を設定する(ステップS5)。次に、ステップS5で設定した2点に対して、第4、第5判定条件を満たすか否かを調べ(ステップS6)、満たしている場合は、視差値を補間する(ステップS7)。このとき、2点の視差値の平均値を2点間の視差値とする。 When the far parallax value detection process for one line is completed, the process proceeds to the next line (step S4), and two points satisfying the first to third determination conditions are set (step S5). Next, it is checked whether or not the fourth and fifth determination conditions are satisfied at the two points set in step S5 (step S6), and if it is satisfied, the parallax value is interpolated (step S7). At this time, an average value of disparity values at two points is set as a disparity value between two points.
視差値を補間しようとする画素がある間は(ステップS8:YES)、ステップS5〜S7を繰り返し、なくなったら(ステップS8:NO)、ステップS9に進んで、次のラインの有無を判断する。そして、次のラインがある間は(ステップS9:YES)、ステップS2〜S8を繰り返し、なくなったら(ステップS9:NO)、この図に示す視差補間処理が終了する。 While there is a pixel for which the parallax value is to be interpolated (step S8: YES), steps S5 to S7 are repeated, and if there is no more (step S8: NO), the process proceeds to step S9 to determine the presence or absence of the next line. Then, while there is a next line (step S9: YES), steps S2 to S8 are repeated, and when there is no more (step S9: NO), the parallax interpolation process shown in this figure ends.
ここで、水平エッジ検出処理(図6のステップS2、図7のステップS11〜S16)及び下側遠方視差値検出処理(図8のステップS26〜S29)について説明を補足する。 Here, the horizontal edge detection processing (step S2 in FIG. 6, steps S11 to S16 in FIG. 7) and the lower far parallax value detection processing (steps S26 to S29 in FIG. 8) will be supplemented.
水平エッジ検出処理において、例えば図5Aに示す輝度画像の上端のラインから水平エッジ検出処理を行った結果、図5Dに示す屋根323に対応するラインで初めて水平エッジが検出されたものとする。
In the horizontal edge detection processing, for example, horizontal edge detection processing is performed from the line at the upper end of the luminance image shown in FIG. 5A, and it is assumed that the horizontal edge is detected for the first time in the line corresponding to the
この場合、水平エッジ検出処理の対象が輝度画像の上端のラインから屋根323に対応するラインの1本上のラインまでの間は、エッジ位置カウントの値は初期値0のままである(ステップS12:NO→S14:NO)。従って、水平エッジ検出処理の後、遠方視差値検出処理(ステップS3)を行い、ステップS4で次のラインに進み、ステップS5で2点を設定でき、ステップS6で第4判定条件を満たすか否かを判定する際、「水平エッジが存在する場合」に該当しないため、第4判定条件は満たされないことになる。
In this case, the value of the edge position count remains at the
そして、屋根323に対応するラインで水平エッジが検出された場合は(ステップS12:YES)、水平エッジが検出された画素に対応するエッジ位置カウントの値が1になる(ステップS13)。このとき、屋根323に対応するラインの次のラインに対する第4判定条件の判定処理(ステップS6)においては「水平エッジが存在する場合」に該当する。従って、第4判定条件における「画素P1、P2間に水平エッジが存在する場合が画素P1、P2間の画素数の1/2より大きい」が満たされれば、第4判定条件が満たされることになる。このときのエッジ位置カウントの値である1は、その2点(画素P1、P2)の1ライン上、つまり、屋根323に対応するラインに水平エッジが存在することを表している。
When a horizontal edge is detected in the line corresponding to the roof 323 (step S12: YES), the value of the edge position count corresponding to the pixel where the horizontal edge is detected becomes 1 (step S13). At this time, the determination processing (step S6) of the fourth determination condition for the line next to the line corresponding to the
さらに屋根323に対応するラインの次のラインから下の各ラインで水平エッジが検出されなかった場合(ステップS12:NO)、屋根323に対応するラインで水平エッジが検出された画素に対応するエッジ位置カウントの値が水平エッジ検出処理を実行する度に1つずつ増加する(ステップS14:YES→S15)。この間、第4判定条件における「水平エッジが存在する場合」に該当する。従って、第4判定条件における「画素P1、P2間に水平エッジが存在する場合が画素P1、P2間の画素数の1/2より大きい」が満たされれば、第4判定条件が満たされることになる。また、水平エッジ検出処理を実行する度に1つずつ増加するエッジ位置カウントの値は、その水平エッジ検出処理を実行したラインの次のライン上にステップS5で設定された2点(画素P1、P2)から屋根323に対応するラインまでのライン数を表している。
Furthermore, when the horizontal edge is not detected in each line below the line following the line corresponding to the roof 323 (step S12: NO), the edge corresponding to the pixel in which the horizontal edge is detected in the line corresponding to the
下側遠方視差値検出処理において、例えば図5Aに示す輝度画像の上端のラインから遠方視差値検出処理を行った結果、図5Eに示すライン325で初めて下側遠方視差値が検出されたものとする。
In the lower far parallax value detection process, for example, the lower far parallax value is detected for the first time at a
この場合、下側遠方視差値検出処理の対象が輝度画像の上端のラインからライン325の1本上のラインまでの間は、下側視差位置ビットフラグの全11ビットは0のままである(ステップS26:NO→S28)。このため、遠方視差値検出処理の後、ステップS4で次のラインに進み、ステップS5で2点を設定でき、ステップS6で第5判定条件を満たすか否かを判定する際、第5判定条件における「P1、P2間のある画素が遠方視差を持つ場合」の内、「下側視差位置ビットフラグの各ビットのいずれかに1が立っている」には該当しないことになる。 In this case, all 11 bits of the lower disparity position bit flag remain 0 while the target of the lower far disparity value detection processing is from the line at the upper end of the luminance image to the line immediately above the line 325 (0 Step S26: NO → S28). For this reason, after the far parallax value detection processing, the process proceeds to the next line in step S4, and two points can be set in step S5. When it is determined whether the fifth determination condition is satisfied in step S6, the fifth determination condition In the case where "a certain pixel between P1 and P2 has a distant parallax" in the above, it does not correspond to "one of each bit of the lower parallax position bit flag is set".
そして、ライン325で下側遠方視差値が検出された場合は、下側視差位置ビットフラグの11ビット目が1となり(ステップS26:YES→S27)、さらに10ビット目が1となる(ステップS28)。このとき、ライン325の次のラインに対する第5判定条件の判定処理(ステップS6)においては「下側視差位置ビットフラグの各ビットのいずれかに1が立っている」に該当する。このときの下側視差位置ビットフラグの10ビット目が1となっていることは、2点(画素P1、P2)の10ライン下に遠方視差値があることを表している。
When the lower far parallax value is detected on the
さらにライン325の次のラインから下の各ラインで下側遠方視差値が検出されなかった場合(ステップS26:NO)、下側遠方視差値検出処理の対象のラインが下がる度に下側視差位置ビットフラグの1が右にシフトしてゆく。従って、例えば下側視差位置ビットフラグの8ビット目が1のときは、2点(画素P1、P2)の8ライン下に下側遠方視差値があることを表している。
Furthermore, when the lower distant parallax value is not detected in each line below the line following the line 325 (step S26: NO), the lower parallax position is detected each time the target line of the lower distant parallax value detection process goes down.
ここで、本実施形態に係る視差画像補間処理の利点について説明する。
図5Bにおける2点(画素P1、P2)の視差値を補間しようとすると、下記(イ)〜(ニ)の4つの判断ステップが必要となる。
(イ)2点の視差値が近いか否かを判断する。
(ロ)2点の上側1.5m以内に水平エッジがあるか否かを判断する。
(ハ)水平エッジの下側に遠方視差値があるか否かを判断する。
(ニ)2点の下側に遠方視差値があるか否かを判断する。
Here, an advantage of the parallax image interpolation process according to the present embodiment will be described.
If it is going to interpolate the parallax value of two points (pixel P1, P2) in FIG. 5B, following four judgment steps of (i)-(vi) will be needed.
(A) It is determined whether or not the parallax values of the two points are close.
(B) It is determined whether or not there is a horizontal edge within 1.5 m above the two points.
(C) It is determined whether there is a far disparity value below the horizontal edge.
(D) It is determined whether there is a far disparity value below the two points.
そして、視差が近いと判断された場合に,毎回水平エッジがあるか否か、遠方視差値があるか否かを検出する処理を実行すると、画像に映っている内容により実行時間が読めない上に、非常に長い処理時間を要することもあり得る。 Then, when it is determined that the parallax is close, the execution time can not be read due to the content shown in the image when the process of detecting whether there is a horizontal edge and the far parallax value is executed every time. It may also take very long processing time.
これに対して、本実施形態では、視差値が近いか否かを判断するのと同期して各ラインを走査して水平エッジの有無、遠方視差の有無を検出することになるが、どのような内容の画像が入力されても処理時間はほとんど変わらずに一定である。このため、実行時間の見積もりが容易になり、実時間処理を行う装置やシステムを構築するときに有効である。また、高速性が要求される場合でも処理する画素を間引くことで処理時間を大幅に減らすことができる。 On the other hand, in the present embodiment, each line is scanned in synchronization with determining whether the parallax value is close to detect the presence or absence of the horizontal edge and the presence or absence of the distant parallax. The processing time is constant with almost no change even if an image of various contents is input. Therefore, estimation of the execution time becomes easy, which is effective when constructing an apparatus or system that performs real-time processing. Further, even when high speed is required, the processing time can be significantly reduced by thinning out the pixels to be processed.
《Vマップ生成処理》
このようにして視差画像補間処理を行ったら、次にVマップ生成部134において、Vマップを生成するVマップ生成処理を実行する。視差画像データに含まれる各視差画素データは、x方向位置とy方向位置と視差値dとの組(x,y,d)で示される。これを、X軸にd、Y軸にy、Z軸に頻度fを設定した三次元座標情報(d,y,f)に変換したもの、又はこの三次元座標情報(d,y,f)から所定の頻度閾値を超える情報に限定した三次元座標情報(d,y,f)を、視差ヒストグラム情報として生成する。本実施形態の視差ヒストグラム情報は、三次元座標情報(d,y,f)からなり、この三次元ヒストグラム情報をX−Yの2次元座標系に分布させたものを、Vマップ(視差ヒストグラムマップ)と呼ぶ。
<< V map generation process >>
After the parallax image interpolation process is performed as described above, next, the V
具体的に説明すると、Vマップ生成部134は、画像を上下方向に複数分割して得られる視差画像データの各行領域について、視差値頻度分布を計算する。この視差値頻度分布を示す情報が視差ヒストグラム情報である。
Specifically, the V
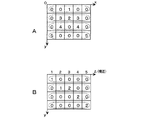
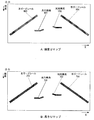
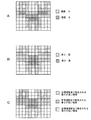
図9は視差画像データ、及びその視差画像データから生成されるVマップについて説明するための図である。ここで、図9Aは視差画像の視差値分布の一例を示す図であり、図9Bは、図9Aの視差画像の行毎の視差値頻度分布を示すVマップを示す図である。 FIG. 9 is a diagram for describing parallax image data and a V map generated from the parallax image data. Here, FIG. 9A is a diagram showing an example of the parallax value distribution of the parallax image, and FIG. 9B is a diagram showing a V map showing the parallax value frequency distribution for each row of the parallax image of FIG. 9A.
図9Aに示すような視差値分布をもった視差画像データが入力されたとき、Vマップ生成部134は、行毎の各視差値のデータの個数の分布である視差値頻度分布を計算し、これを視差ヒストグラム情報として出力する。このようにして得られる各行の視差値頻度分布の情報を、Y軸に視差画像上のy方向位置(撮像画像の上下方向位置)をとりX軸に視差値をとった二次元直交座標系上に表すことで、図9Bに示すようなVマップを得ることができる。このVマップは、頻度fに応じた画素値をもつ画素が前記二次元直交座標系上に分布した画像として表現することもできる。
When parallax image data having a parallax value distribution as shown in FIG. 9A is input, the V
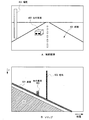
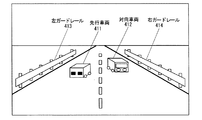
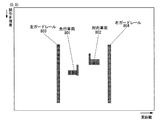
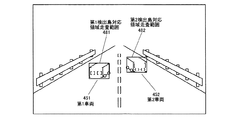
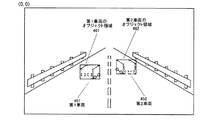
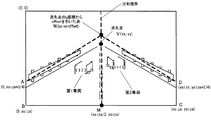
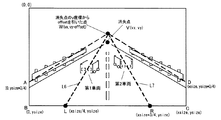
図10は、一方の撮像部で撮像された基準画像としての撮影画像の画像例と、その撮影画像に対応するVマップを示す図である。ここで、図10Aが撮影画像であり、図10BがVマップである。即ち、図10Aに示すような撮影画像から図10Bに示すVマップが生成される。Vマップでは、路面より下の領域には視差は検出されないので、斜線で示した領域Aで視差がカウントされることはない。 FIG. 10 is a view showing an image example of a captured image as a reference image captured by one imaging unit and a V map corresponding to the captured image. Here, FIG. 10A is a photographed image, and FIG. 10B is a V map. That is, the V map shown in FIG. 10B is generated from the photographed image as shown in FIG. 10A. In the V map, since parallax is not detected in the area below the road surface, parallax is not counted in the hatched area A.
図10Aに示す画像例では、自車両が走行している路面401と、自車両の前方に存在する先行車両402と、路外に存在する電柱403が映し出されている。また、図10Bに示すVマップには、画像例に対応して、路面501、先行車両502、及び電柱503がある。
In the example of an image shown to FIG. 10A, the road surface 401 in which the own vehicle is drive | running | working, the preceding vehicle 402 which exists in front of the own vehicle, and the telephone pole 403 which exists out of the road are shown. Further, in the V map shown in FIG. 10B, there are a road surface 501, a leading
この画像例は、自車両の前方路面が相対的に平坦な路面、即ち、自車両の前方路面が自車両の真下の路面部分と平行な面を自車両前方へ延長して得られる仮想の基準路面(仮想基準移動面)に一致している場合のものである。この場合、画像の下部に対応するVマップの下部において、高頻度の点は、画像上方へ向かうほど視差値dが小さくなるような傾きをもった略直線状に分布する。このような分布を示す画素は、視差画像上の各行においてほぼ同一距離に存在していてかつ最も占有率が高く、しかも画像上方へ向かうほど距離が連続的に遠くなる識別対象物を映し出した画素であると言える。 This image example is a virtual reference obtained by extending the surface in front of the host vehicle relatively flat, ie, the surface in front of the host vehicle parallel to the road surface portion directly below the host vehicle to the front of the host vehicle It corresponds to the road surface (virtual reference movement surface). In this case, in the lower part of the V map corresponding to the lower part of the image, the high frequency points are distributed in a substantially straight line with an inclination such that the parallax value d becomes smaller toward the upper side of the image. Pixels showing such a distribution are present at approximately the same distance in each row on the parallax image and have the highest occupancy rate, and pixels that project an object of identification whose distance increases continuously as they move upward in the image It can be said that
撮像部110aでは自車両前方領域を撮像するため、その撮像画像の内容は、図10Aに示すように、画像上方へ向かうほど路面の視差値dは小さくなる。また、同じ行(横ライン)内において、路面を映し出す画素はほぼ同じ視差値dを持つことになる。従って、Vマップ上において上述した略直線状に分布する高頻度の点は、路面(移動面)を映し出す画素が持つ特徴に対応したものである。よって、Vマップ上における高頻度の点を直線近似して得られる近似直線上又はその近傍に分布する点の画素は、高い精度で、路面を映し出している画素であると推定することができる。また、各画素に映し出されている路面部分までの距離は、当該近似直線上の対応点の視差値dから高精度に求めることができる。
Since the
ここで、Vマップ上における高頻度の点を直線近似する際、その直線近似処理に含める点をどの範囲まで含めるかは、その処理結果の精度を大きく左右する。即ち、直線近似処理に含める範囲が広いほど、路面に対応しない点が多く含まれ、処理精度を落とすことになり、また、直線近似処理に含める範囲が狭いほど、路面に対応する点の数が少なく、やはり処理精度を落とす結果となる。そこで、本実施形態では、後述する直線近似処理の対象とする視差ヒストグラム情報部分を、以下のようにして抽出している。 Here, when a high frequency point on the V map is subjected to linear approximation, the range to which the point included in the linear approximation processing is to be determined largely influences the accuracy of the processing result. That is, the wider the range included in the straight line approximation process, the more points that do not correspond to the road surface are included, which lowers the processing accuracy, and the narrower the range included in the straight line approximation process, the number of points corresponding to the road surface There is also a result that the processing accuracy is reduced. So, in this embodiment, the parallax histogram information part made into the object of the straight line approximation processing mentioned below is extracted as follows.
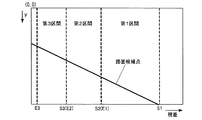
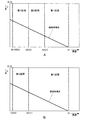
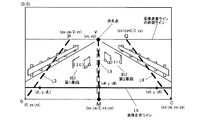
図11は、抽出範囲を説明するためのVマップを示す図である。
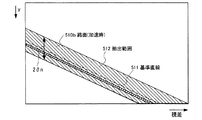
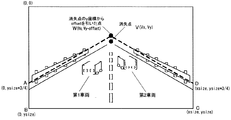
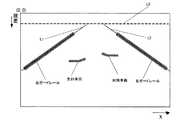
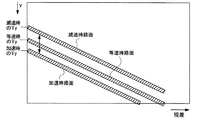
本実施形態における抽出条件は、自車両の前方路面が自車両の真下の路面部分510と平行な面を自車両前方へ延長して得られる仮想の基準路面(仮想基準移動面)に対応する視差値dと画像上下方向位置yとの関係を基準として定まる所定の抽出範囲2δn内に属するという条件である。この基準路面に対応する視差値dと画像上下方向位置yとの関係は、図11に示すように、Vマップ上において直線(以下「基準直線」という。)511で示される。本実施形態では、この基準直線511を中心に画像上下方向へ±δの範囲を、抽出範囲512として規定している。この抽出範囲512は、状況に応じて刻々と変化する実際の路面のVマップ要素(d,y,f)の変動範囲を含むように設定される。
FIG. 11 is a diagram showing a V map for explaining the extraction range.
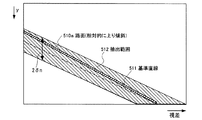
The extraction condition in the present embodiment is a parallax corresponding to a virtual reference road surface (virtual reference movement surface) obtained by extending a plane parallel to the road surface portion 510 directly below the own vehicle ahead of the own vehicle forward to the own vehicle The condition is that it falls within a predetermined extraction range 2δ n which is determined based on the relationship between the value d and the vertical position y of the image. The relationship between the parallax value d corresponding to the reference road surface and the vertical position y of the image is indicated by a straight line (hereinafter referred to as a "reference straight line") 511 on the V map, as shown in FIG. In the present embodiment, a range of ± δ in the vertical direction of the image around the reference
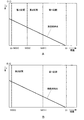
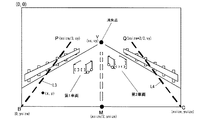
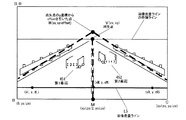
具体的には、例えば、自車両前方の路面が相対的に上り傾斜である場合、当該路面が相対的に平坦である場合よりも、撮像画像中に映し出される路面画像部分(移動面画像領域)は画像上側へ広がる。しかも、同じ画像上下方向位置yに映し出される路面画像部分を比較すると、相対的に上り傾斜である場合には、相対的に平坦である場合よりも、視差値dが大きくなる。この場合のVマップ要素(d,y,f)は、Vマップ上において、図12に示すように、おおよそ、基準直線511に対し、上側に位置し、かつ、傾き(絶対値)が大きい直線を示すものとなる。本実施形態では、前方の路面510aにおける相対的な上り傾斜が想定され得る範囲内であれば、その路面のVマップ要素(d,y,f)が抽出範囲512内に収まる。
Specifically, for example, when the road surface ahead of the host vehicle is relatively uphill, the road surface image portion (moving surface image area) displayed in the captured image than in the case where the road surface is relatively flat. Spreads to the top of the image. Moreover, when the road surface image portions displayed at the same image vertical direction position y are compared, the parallax value d is larger in the case of a relatively upward slope than in the case of a relatively flat surface. In this case, the V map elements (d, y, f) are positioned approximately on the upper side with respect to the reference
また、例えば、自車両前方の路面が相対的に下り傾斜である場合、そのVマップ要素(d,y,f)は、Vマップ上において、基準直線に対し、下側に位置し、かつ、傾き(絶対値)が小さい直線を示すものとなる。本実施形態では、前方の路面における相対的な下り傾斜が想定され得る範囲内であれば、その路面のVマップ要素(d,y,f)が抽出範囲内に収まる。 Also, for example, when the road surface ahead of the host vehicle is relatively downward inclined, the V map element (d, y, f) is located below the reference straight line on the V map and The slope (absolute value) shows a small straight line. In the present embodiment, the V map element (d, y, f) of the road surface falls within the extraction range if the relative downward slope on the road surface ahead can be assumed.
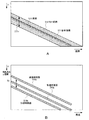
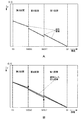
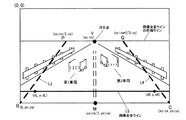
また、例えば、自車両100が速度を加速している加速時においては、自車両100の後方に加重がかかり、自車両の姿勢は、自車両前方が鉛直方向上側を向くような姿勢となる。この場合、自車両100の速度が一定である場合と比べて、撮像画像中に映し出される路面画像部分(移動面画像領域)は画像下側へシフトする。この場合のVマップ要素(d,y,f)は、Vマップ上において、図13に示すように、おおよそ、基準直線511に対し、下側に位置し、かつ、基準直線とほぼ平行な直線を示すものとなる。本実施形態では、自車両100の加速が想定され得る範囲内であれば、その路面510bのVマップ要素(d,y,f)が抽出範囲512内に収まる。
Further, for example, during acceleration in which the
また、例えば、自車両100が速度を減速している減速時においては、自車両100の前方に加重がかかり、自車両の姿勢は、自車両前方が鉛直方向下側を向くような姿勢となる。この場合、自車両100の速度が一定である場合と比べて、撮像画像中に映し出される路面画像部分(移動面画像領域)は画像上側へシフトする。この場合のVマップ要素(d,y,f)は、Vマップ上において、おおよそ、基準直線に対し、上側に位置し、かつ、基準直線とほぼ平行な直線を示すものとなる。本実施形態では、自車両100の減速が想定され得る範囲内であれば、その路面のVマップ要素(d,y,f)が抽出範囲512内に収まる。
In addition, for example, at the time of deceleration at which the
本実施形態では、路面を検出するための抽出範囲512は、この路面の上下、つまり加速減速に応じて仮想路面直線511を上下させることで、路面の視差データをVマップの抽出範囲512の中心にすえることができ、常に最適な状態で路面データの抽出と近似を行うことが可能になる。これにより、δnを小さくすることができ、Vマップの抽出範囲512を狭めることができるので、処理時間の短縮につながる。
In the present embodiment, the extraction range 512 for detecting the road surface is the center of the V map extraction range 512 by moving the virtual road surface
車両の加速減速度に応じて基準直線511を上下させる度合いは、実験によって,車両の加速度センサの出力とそのときの基準直線511の変動との対応テーブルを作ったり、その関係を近似する関係式を作ったりして、車両毎に決定することができる。
The degree to which the reference
ただし、加速時には基準直線511を下げ(切片を大きくする)、減速時には基準直線511を上げる(切片を小さくする)ことには各車種共通であり、実際には加速度の値に応じてどれだけ基準直線511の切片を変更するか、小さな変換テーブルをもつことで対応する。
However, it is common to all models to lower the reference straight line 511 (increase the intercept) during acceleration and raise the reference
この切片の変動に伴い、消失点のy座標Vyが変動する。消失点の変動に応じて後述する多重Vマップを作成する際の領域が変動し、より正確に路面の視差データをVマップに反映させることが可能になる。なお、消失点の詳細については後述する。 The y coordinate Vy of the vanishing point fluctuates with the fluctuation of the intercept. An area at the time of creating a multiplex V map to be described later fluctuates according to the fluctuation of the vanishing point, and it becomes possible to more accurately reflect the road surface parallax data on the V map. The details of the vanishing point will be described later.
《Vマップ生成部の内部構成》
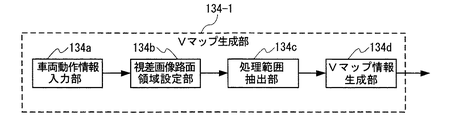
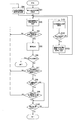
図14は、図4におけるVマップ生成部の内部構成の一例を示す処理ブロック図である。このVマップ生成部134−1は、車両動作情報入力部134a、視差画像路面領域設定部134b、処理範囲抽出部134c、及びVマップ情報生成部134dからなる。
<< Internal configuration of V map generation unit >>
FIG. 14 is a processing block diagram showing an example of the internal configuration of the V map generation unit in FIG. The V map generation unit 134-1 includes a vehicle operation
Vマップ生成部134−1は、視差補間部133から出力される視差画像データを受け取ると、まず、車両動作情報入力部134aにおいて、自車両100の加速度情報を含む車両動作情報を取得する。車両動作情報入力部134aに入力される車両動作情報は、自車両100に搭載されている機器から取得してもよいし、撮像ユニット101に加速度センサ等の車両動作情報取得手段を搭載し、その車両動作情報取得手段から取得してもよい。
When receiving the parallax image data output from the
このようにして車両動作情報を取得したら、次に、視差画像路面領域設定部134bにおいて、視差補間部133から取得した視差画像データに対し、撮像画像の一部である所定の路面画像候補領域(移動面画像候補領域)を設定する。この設定では、想定される状況の範囲内では路面が映し出されることがない領域を除外した画像領域を路面画像候補領域として設定する。具体的な設定方法としては、予め決められた固定の画像領域を路面画像候補領域として設定してもよいが、本実施形態では、撮像画像内における路面の消失点を示す消失点情報に基づいて路面画像候補領域を設定する。
When vehicle operation information is acquired in this manner, next, in the parallax image road surface
このようにして路面画像候補領域を設定したら、次に、処理範囲抽出部134cにおいて、視差画像路面領域設定部134bが設定した路面画像候補領域内の視差画像データの中から、上述した抽出条件を満たす視差画素データ(視差画像情報構成要素)を抽出する処理を行う。即ち、Vマップ上において基準直線511を中心にした画像上下方向へ±δnの範囲に属する視差値dと画像上下方向位置yとをもつ視差画素データを抽出する。このようにして抽出条件を満たす視差画素データを抽出した後、Vマップ情報生成部134dにおいて、処理範囲抽出部134cが抽出した視差画素データ(x,y,d)をVマップ要素(d,y,f)に変換して、Vマップ情報を生成する。
After setting the road surface image candidate area in this manner, next, in the processing
以上の説明では、Vマップ情報生成部134dでVマップ情報を生成する前段階の処理範囲抽出部134cにおいて、路面画像部分に対応しない視差画像データ部分と区別して路面画像部分に対応する視差画像データ部分を抽出する例について説明したが、次のように、Vマップ情報を生成した後の段階で、同様の抽出処理を行ってもよい。
In the above description, the parallax image data corresponding to the road surface image portion is distinguished from the parallax image data portion not corresponding to the road surface image portion in the processing
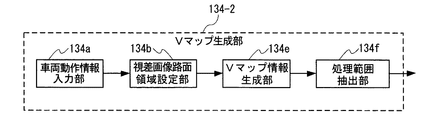
図15は、Vマップ情報を生成した後の段階で抽出処理を行う例におけるVマップ生成部134内の処理ブロック図である。このVマップ生成部134−2は、車両動作情報入力部134a、視差画像路面領域設定部134b、Vマップ情報生成部134e、及び処理範囲抽出部134fからなる。
FIG. 15 is a processing block diagram in the V
Vマップ生成部134−2では、視差画像路面領域設定部134bにおいて路面画像候補領域を設定した後、Vマップ情報生成部134eにおいて、視差画像路面領域設定部134bが設定した路面画像候補領域内の視差画素データ(x,y,d)をVマップ要素(d,y,f)に変換して、Vマップ情報を生成する。このようにしてVマップ情報を生成した後、処理範囲抽出部134fにおいて、Vマップ情報生成部134eが生成したVマップ情報の中から、上述した抽出条件を満たすVマップ要素を抽出する処理を行う。即ち、Vマップ上において基準直線511を中心にとした画像上下方向へ±δnの範囲に属する視差値dと画像上下方向位置yとをもつVマップ要素を抽出する。そして、抽出したVマップ要素で構成されるVマップ情報を出力する。
After the V map generation unit 134-2 sets the road surface image candidate area in the parallax image road surface
《Vマップ生成処理のフロー》
〔第1の処理例〕
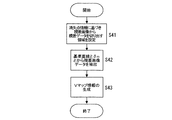
図16は、本実施形態におけるVマップ情報生成処理の第1の処理例の流れを示すフローチャートである。また、図17は、視差画像に設定される路面画像候補領域について説明するための図である。
<< Flow of V map generation process >>
First Processing Example
FIG. 16 is a flowchart showing a flow of a first processing example of V map information generation processing in the present embodiment. Moreover, FIG. 17 is a figure for demonstrating the road surface image candidate area | region set to a parallax image.
本処理例においては、車両動作情報(自車両前後方向の加速度情報)を用いずにVマップ情報を作成する例である。本処理例においては、自車両100の加速度情報を用いないため、基準路面に対応する基準直線を中心にとした抽出範囲すなわち値δの大きさは、比較的大きなものを用いる。
In this processing example, V map information is created without using vehicle operation information (acceleration information in the front-rear direction of the host vehicle). In the present processing example, since the acceleration information of the
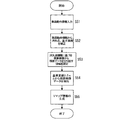
本処理例においては、まず、路面の消失点情報に基づいて路面画像候補領域を設定する(ステップS41)。路面の消失点情報を求める方法には特に制限はなく、公知の方法を広く利用することができる。 In the present processing example, first, a road surface image candidate area is set based on vanishing point information of the road surface (step S41). There is no restriction | limiting in particular in the method of calculating | requiring the vanishing point information of a road surface, A well-known method can be utilized widely.
本処理例では、この路面の消失点情報(Vx,Vy)が示す消失点の画像上下方向位置Vyから所定のoffset値を引いた画像上下方向位置(Vy−offset値)から、当該視差画像データの画像上下方向位置yの最大値ysize(視差画像の最下部)までの範囲を、路面画像候補領域に設定する。また、画像上下方向位置が消失点に近い画像部分においては、その画像左右方向両端部分の画像領域に路面が映し出されることはあまり無い。そこで、この画像領域も除外して路面画像候補領域に設定してもよい。この場合、視差画像上に設定される路面画像候補領域は、図17に示すWABCDの各点で囲まれた領域となる。 In this processing example, the parallax image data is obtained from the image vertical direction position (Vy-offset value) obtained by subtracting a predetermined offset value from the image vertical direction position Vy of the vanishing point indicated by the vanishing point information (Vx, Vy) of the road surface. The range up to the maximum value ysize (the lowermost part of the parallax image) of the vertical position y of the image is set as the road surface image candidate area. Further, in the image portion where the position in the vertical direction of the image is close to the vanishing point, the road surface is not often displayed in the image region at both end portions in the horizontal direction of the image. Therefore, this image area may be excluded and set as the road surface image candidate area. In this case, the road surface image candidate area set on the parallax image is an area surrounded by each point of WABCD shown in FIG.
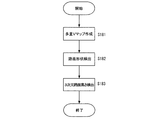
このようにして路面画像候補領域を設定した後、この第1の処理例では、設定された路面画像候補領域内の視差画像データの中から、上述した抽出条件を満たす視差画素データ(視差画像情報構成要素)を抽出する処理を行う(ステップS42)。この処理では、予め設定されている固定の基準直線の情報と、その基準直線を基準とした抽出範囲を規定するための±δの情報とを用いて、当該抽出範囲に属する視差画素データを抽出する。その後、抽出した視差画素データ(x,y,d)をVマップ要素(d,y,f)に変換して、Vマップ情報を生成する(ステップS43)。 After the road surface image candidate area is set in this manner, in the first processing example, parallax pixel data (parallax image information satisfying the above-described extraction condition from parallax image data in the set road surface image candidate area) A process of extracting the component) is performed (step S42). In this process, parallax pixel data belonging to the extraction range is extracted using information of a fixed reference straight line set in advance and information of ± δ for defining the extraction range based on the reference straight line. Do. Thereafter, the extracted parallax pixel data (x, y, d) is converted into a V map element (d, y, f) to generate V map information (step S43).
〔第2の処理例〕
図18は、本実施形態におけるVマップ情報生成処理の第2の処理例の流れを示すフローチャートである。
Second Processing Example
FIG. 18 is a flowchart showing a flow of a second processing example of the V map information generation processing in the present embodiment.
この第2の処理例においては、車両動作情報(自車両前後方向の加速度情報)を用いてVマップ情報を作成する例である。まず、車両動作情報を入力したら(ステップS51)、この車両動作情報に含まれる自車両前後方向の加速度情報に基づき、消失点情報と基準直線の情報を補正する(ステップS52)。以後のステップS54、S55は、それぞれ第1の処理例におけるステップS42、S43と同じである。 In this second processing example, V map information is created using vehicle operation information (acceleration information in the front-rear direction of the host vehicle). First, when the vehicle operation information is input (step S51), the vanishing point information and the information of the reference straight line are corrected based on the acceleration information of the own vehicle longitudinal direction included in the vehicle operation information (step S52). The subsequent steps S54 and S55 are the same as steps S42 and S43 in the first processing example, respectively.
ステップS52における消失点情報の補正は、次のようにして行う。例えば自車両100の加速時には、自車両後方部分が加重され、自車両100の姿勢は、自車両前方が鉛直方向上側を向くような姿勢となる。この姿勢変化により、路面の消失点は、画像下側へ変位することになるので、これ合わせて、路面の消失点情報の画像上下方向位置Vyを加速度情報に基づいて補正する。例えば自車両100の減速時にも、同様に、その加速度情報に基づいて路面の消失点情報の画像上下方向位置Vyを補正する。このような補正を行うことで、後述する消失点情報を用いた路面画像候補領域の設定処理において、路面を映し出している画像部分を適切に路面画像候補領域として設定することができる。
The correction of the vanishing point information in step S52 is performed as follows. For example, at the time of acceleration of the
また、基準直線情報の補正は、次のようにして行う。基準直線情報は、基準直線の傾きαと、切片(画像左端と基準直線とが交わる点の画像上下方向位置)βとを含む情報である。例えば自車両100の加速時には、自車両後方部分が加重され、自車両100の姿勢は、自車両前方が鉛直方向上側を向くような姿勢となる。この姿勢変化により、路面を映し出す路面画像部分は、全体的に画像下側へ変位することになる。
Further, the correction of the reference straight line information is performed as follows. The reference straight line information is information including an inclination α of the reference straight line and an intercept (an image vertical direction position of a point where the left end of the image and the reference straight line intersect) β. For example, at the time of acceleration of the
そこで、これに合わせて、抽出範囲を画像下側へシフトさせるために、その抽出範囲の基準となる基準直線の切片βを加速度情報に基づいて補正する。例えば自車両100の減速時にも、同様に、基準直線の切片βを加速度情報に基づいて補正する。このような補正を行うことで、抽出範囲内の視差画素データを抽出する処理において、路面を映し出している画像部分を適切に路面画像候補領域として設定することができる。このように加速度情報を用いて基準直線の情報を補正するので、抽出範囲を規定するδn値は、自車両の加速や減速を考慮しないでもよくなる。そのため、第2の処理例の抽出範囲は、固定された基準直線を基準に抽出範囲を設定する上述の処理例1よりも、狭くすることができ、処理時間の短縮や路面検出精度の向上を図ることができる。
Therefore, in accordance with this, in order to shift the extraction range to the lower side of the image, the intercept β of the reference straight line serving as the reference of the extraction range is corrected based on the acceleration information. For example, also at the time of deceleration of the
以上説明した第1の処理例及び第2の処理例は、いずれも、Vマップ情報を生成する前段階で、路面画像部分に対応する視差画像データ部分を抽出する処理、即ち図14に示すVマップ生成部134−1により実行される処理である。Vマップ情報を生成した後の段階で、路面画像部分に対応するVマップ要素を抽出する処理、即ち図15に示すVマップ生成部134−2により実行される処理でも同様である。 In both the first processing example and the second processing example described above, processing for extracting a parallax image data portion corresponding to a road surface image portion at a stage before generating V map information, that is, V shown in FIG. This is a process executed by the map generation unit 134-1. The same applies to the process of extracting the V map element corresponding to the road surface image portion at the stage after the V map information is generated, that is, the process executed by the V map generation unit 134-2 shown in FIG.
《路面形状検出》
次に、路面形状検出部135で行う処理について説明する。
路面形状検出部135では、Vマップ生成部134においてVマップ情報が生成されたら、路面に対応する視差値及びy方向位置の組(Vマップ要素)が示す特徴、すなわち、撮像画像の上方に向かうほど視差値が低くなるという特徴を示すVマップ上の高頻度の点を直線近似する処理を行う。なお、路面が平坦な場合には一本の直線で十分な精度で近似可能であるが、車両進行方向において路面の傾斜状況が変化するような路面については、一本の直線で十分な精度の近似は難しい。従って、本実施形態においては、Vマップの情報(Vマップ情報)を視差値に応じて2以上の視差値区画に区分けし、各視差値区画についてそれぞれ個別に直線近似を行う。
Road surface shape detection
Next, the process performed by the road surface
In the road surface
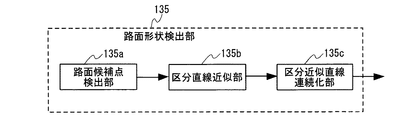
図19は、路面形状検出部135内の処理ブロック図である。
本実施形態の路面形状検出部135は、Vマップ生成部134から出力されるVマップ情報(Vマップ情報)を受け取ると、まず、路面候補点検出部135aにおいて、路面に対応するVマップ要素が示す特徴、即ち、撮像画像の上方に向かうほど視差値が低くなるという特徴を示すVマップ上の高頻度の点を、路面候補点として検出する。
FIG. 19 is a processing block diagram in the road surface
When the road surface
このとき、本実施形態では、路面候補点検出部135aでの路面候補点検出処理は、Vマップの情報(Vマップ情報)を視差値に応じて2以上の視差値区画に区分けし、各視差値区画にそれぞれ対応した決定アルゴリズムに従って各視差値区画における路面候補点を決定する。具体的には、例えば、所定の基準距離に対応する視差値を境に、VマップをX軸方向(横軸方向)に2つの領域、すなわち視差値の大きい領域と小さい領域に区分けし、その領域ごとに異なる路面候補点検出アルゴリズムを用いて路面候補点を検出する。なお、視差値の大きい近距離領域については、後述する第1路面候補点検出処理を行い、視差の小さい遠距離領域については、後述する第2路面候補点検出処理を行う。
At this time, in the present embodiment, the road surface candidate point detection processing by the road surface candidate
ここで、前記のように視差の大きい近距離領域と視差の小さい遠距離領域とで、路面候補点検出処理の方法を変える理由について説明する。
図10Aに示したように、自車両100の前方を撮像した撮像画像で、近距離の路面部分についてはその路面画像領域の占有面積が大きく、路面に対応する画素数が多いので、Vマップ上の頻度が大きい。これに対し、遠距離の路面部分については、その路面画像領域の撮像画像内における占有面積が小さく、路面に対応する画素数が少ないので、Vマップ上の頻度が小さい。すなわち、Vマップにおいて、路面に対応する点の頻度値は、遠距離では小さく、近距離では大きい。そのため、例えば同じ頻度閾値を用いるなど、両領域について同じ基準で路面候補点を検出しようとすると、近距離領域については路面候補点を適切に検出できるが、遠距離領域については路面候補点が適切に検出できないおそれがあり、遠距離領域の路面検出精度が劣化する。逆に、遠距離領域の路面候補点を十分に検出できるような基準で近距離領域の検出を行うと、近距離領域のノイズ成分が多く検出され、近距離領域の路面検出精度が劣化する。そこで、本実施形態では、Vマップを近距離領域と遠距離領域とに区分し、各領域についてそれぞれ適した基準や検出方法を用いて路面候補点を検出することにより、両領域の路面検出精度を高く維持している。
Here, the reason why the method of road surface candidate point detection processing is changed between the short distance area with large parallax and the long distance area with small parallax as described above will be described.
As shown in FIG. 10A, in the captured image obtained by capturing the front of the
図20は、第1路面候補点検出処理及び第2路面候補点検出処理の検出方法を説明するための図である。
第1路面候補点検出処理では、各視差値dについて、所定の検索範囲内でy方向位置を変えながら、Vマップ情報に含まれる各Vマップ要素(d,y,f)の頻度値fが第1頻度閾値よりも大きく、かつ、最も頻度値fが大きいVマップ要素を探索し、そのVマップ要素を当該視差値dについての路面候補点として決定する。このときの第1頻度閾値は、低めに設定し、路面に対応するVマップ要素が抜け落ちないようにするのが好ましい。本実施形態においては、上述したとおり、Vマップ生成部134において路面に対応するVマップ要素を抽出していることから、第1頻度閾値を低めに設定しても、路面分に対応しないVマップ要素が路面候補点として決定される事態は軽減されるからである。
FIG. 20 is a diagram for explaining a detection method of the first road surface candidate point detection process and the second road surface candidate point detection process.
In the first road surface candidate point detection process, for each parallax value d, the frequency value f of each V map element (d, y, f) included in the V map information is changed while changing the y direction position within a predetermined search range. A V map element larger than the first frequency threshold and having the largest frequency value f is searched, and the V map element is determined as a road surface candidate point for the disparity value d. The first frequency threshold at this time is preferably set to a lower value so that the V map element corresponding to the road surface is not dropped. In the present embodiment, as described above, since the V
ここで、各視差値dについてy値を変化させる検索範囲は、上述したVマップ生成部134における抽出範囲、すなわち、基準直線の画像上下方向位置ypを中心にとした画像上下方向へ±δの範囲である。具体的には、「yp−δn」から「yp+δn」の範囲を探索範囲とする。これにより、探索すべきy値の範囲が限定され、高速な路面候補点検出処理を実現できる。
Here, the search range in which the y value is changed for each parallax value d is ± δ in the vertical direction of the image around the image vertical position yp of the reference straight line, that is, the extraction range in the V
一方、第2路面候補点検出処理は、第1頻度閾値の変わりにこれとは別の第2頻度閾値を用いる点を除いて、前記第1路面候補点検出処理と同じである。すなわち、第2路面候補点検出処理では、各視差値dについて、所定の検索範囲内でy方向位置を変えながら、Vマップ情報に含まれる各Vマップ要素(d,y,f)の頻度値fが第2頻度閾値よりも大きく、かつ、最も頻度値fが大きいVマップ要素を探索し、そのVマップ要素を当該視差値dについての路面候補点として決定する。 On the other hand, the second road surface candidate point detection process is the same as the first road surface candidate point detection process except that a second frequency threshold different from the first frequency threshold is used. That is, in the second road surface candidate point detection process, the frequency value of each V map element (d, y, f) included in the V map information while changing the y direction position within a predetermined search range for each parallax value d. A V map element for which f is larger than the second frequency threshold and having the largest frequency value f is searched, and the V map element is determined as a road surface candidate point for the disparity value d.
図21は、路面候補点検出部135aで行う路面候補点検出処理の流れを示すフローチャートである。
入力されるVマップの情報について、例えば視差値dの大きい順に路面候補点の検出を行い、各視差値dについての路面候補点(y,d)を検出する。視差値dが所定の基準距離に対応する基準視差値よりも大きい場合(ステップS81:YES)、上述した第1路面候補点検出処理を行う。すなわち、当該視差値dに応じたyの探索範囲(「yp−δn」〜「yp+δn」)を設定し(ステップS82)、この探索範囲内における頻度値fが第1頻度閾値よりも大きいVマップ要素(d,y,f)を抽出する(ステップS83)。そして、抽出したVマップ要素のうち、最大の頻度値fを持つVマップ要素(d,y,f)を、当該視差値dの路面候補点として検出する(ステップS84)。
FIG. 21 is a flowchart showing a flow of road surface candidate point detection processing performed by the road surface candidate
For the information of the input V map, for example, road surface candidate points are detected in descending order of the parallax value d, and road surface candidate points (y, d) for each parallax value d are detected. If the parallax value d is larger than the reference parallax value corresponding to the predetermined reference distance (step S81: YES), the first road surface candidate point detection process described above is performed. That is, a search range ("yp-δn" to "yp + δn") of y corresponding to the disparity value d is set (step S82), and a V map in which the frequency value f within this search range is larger than the first frequency threshold The element (d, y, f) is extracted (step S83). Then, among the extracted V map elements, the V map element (d, y, f) having the maximum frequency value f is detected as a road surface candidate point of the parallax value d (step S 84).
そして、視差値dが基準視差値以下になるまで第1路面候補点検出処理を繰り返し行い(ステップS82〜S84)、視差値dが基準視差値以下になったら(ステップS81:NO)、今度は、上述した第2路面候補点検出処理で路面候補点検出を行う。すなわち、第2路面候補点検出処理でも当該視差値dに応じたyの探索範囲(「yp−δn」〜「yp+δn」)を設定し(ステップS85)、この探索範囲内における頻度値fが第1頻度閾値よりも大きいVマップ要素(d,y,f)を抽出する(ステップS86)。そして、抽出したVマップ要素のうち、最大の頻度値fを持つVマップ要素(d,y,f)を、当該視差値dの路面候補点として検出する(ステップS87)。この第2路面候補点検出処理を、視差値dがなくなるまで繰り返し行う(ステップS85〜S87)。 Then, the first road surface candidate point detection process is repeated until the parallax value d becomes equal to or less than the reference parallax value (steps S82 to S84), and when the parallax value d becomes equal to or less than the reference parallax value (step S81: NO) The road surface candidate point detection is performed in the second road surface candidate point detection process described above. That is, even in the second road surface candidate point detection process, a search range ("yp-δn" to "yp + δn") of y according to the parallax value d is set (step S85), and the frequency value f within this search range is A V map element (d, y, f) larger than one frequency threshold is extracted (step S 86). Then, among the extracted V map elements, the V map element (d, y, f) having the maximum frequency value f is detected as a road surface candidate point of the parallax value d (step S 87). This second road surface candidate point detection process is repeated until the parallax value d disappears (steps S85 to S87).
このようにして路面候補点検出部135aにより各視差値dについての路面候補点(抽出処理対象)を検出したら、次に、区分直線近似部135bにより、これらの路面候補点についてVマップ上の近似直線を求める直線近似処理を行う。このとき、路面が平坦な場合であれば、Vマップの視差値範囲全域にわたって一本の直線で十分な精度の近似が可能であるが、車両進行方向において路面の傾斜状況が変化している場合には、一本の直線で十分な精度の近似が難しい。従って、本実施形態においては、Vマップの情報(Vマップ情報)を視差値に応じて2以上の視差値区画に区分けし、各視差値区画についてそれぞれ個別に直線近似処理を行う。
When the road surface candidate point (extraction processing target) for each parallax value d is detected by the road surface candidate
直線近似処理は、最小二乗近似を利用することができるが、より正確に行うにはRMA(Reduced Major Axis)などの他の近似を用いるのがよい。その理由は、最小二乗近似は、X軸のデータに誤差がなく、Y軸のデータに誤差が存在するという前提があるときに、正確に計算されるものである。しかしながら、Vマップ情報から検出される路面候補点の性質を考えると、Vマップ情報に含まれる各Vマップ要素のデータは、Y軸のデータyについては画像上の正確な位置を示していると言えるが、X軸のデータである視差値dについては、誤差を含んでいるものである。また、路面候補点検出処理では、Y軸方向に沿って路面候補点の探索を行い、その最大のy値をもつVマップ要素を路面候補点として検出するものであるため、路面候補点はY軸方向の誤差も含んでいる。従って、路面候補点となっているVマップ要素は、X軸方向にもY軸方向にも誤差を含んでいることになり、最小二乗近似の前提が崩れている。従って、二変数(dとy)に互換性のある回帰直線(RMA)が有効である。 The linear approximation process can use a least squares approximation, but to perform more accurately, it is preferable to use another approximation such as RMA (Reduced Major Axis). The reason is that the least squares approximation is accurately calculated when it is assumed that there is no error in the X-axis data and there is an error in the Y-axis data. However, considering the nature of the road surface candidate point detected from the V map information, it is assumed that the data of each V map element included in the V map information indicates the correct position on the image for the data y of Y axis. Although it can be said that the parallax value d which is data of the X axis includes an error. Further, in the road surface candidate point detection process, the road surface candidate point is searched along the Y-axis direction, and the V map element having the largest y value is detected as the road surface candidate point. It also includes an axial error. Therefore, the V map element, which is a road surface candidate point, includes an error in both the X axis direction and the Y axis direction, and the premise of the least squares approximation is broken. Therefore, a regression line (RMA) compatible with two variables (d and y) is effective.
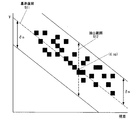
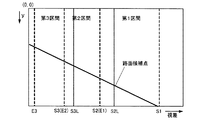
図22は、Vマップを3つの区間(視差値区画)に区分けした例を示す説明図である。
本実施形態においては、Vマップ情報を視差値に応じて3つの視差値区画に区分けする。具体的には、視差値が大きい順に、第1区間、第2区間、第3区間に区分けする。このとき、距離を基準にして区間を等しく区分けする場合、Vマップ上では遠距離の区間ほど区間(視差値範囲)が狭くなり、直線近似の精度が悪化する。また、視差値を基準にして区間を等しく区分けする場合、今度は、Vマップ上において近距離の区間の幅が狭くなる。この場合、第1区間が非常に狭いものとなって、その第1区間はほとんど意味を成さなくなる。
FIG. 22 is an explanatory view showing an example in which the V map is divided into three sections (disparity value sections).
In the present embodiment, the V map information is divided into three disparity value sections in accordance with the disparity value. Specifically, it divides into a 1st area, a 2nd area, and a 3rd area in order with a large parallax value. At this time, when the sections are equally divided on the basis of the distance, the section (disparity value range) becomes narrower as the section is longer on the V map, and the accuracy of the linear approximation is deteriorated. Further, when the sections are equally divided based on the parallax value, the width of the short-distance section becomes narrow on the V map. In this case, the first section becomes very narrow and the first section hardly makes sense.
そこで、本実施形態においては、第1区間については予め決められた固定距離に対応する幅をもつように設定し、第2区間及び第3区間については、一つ前の区間の幅に対応する距離の定数倍(たとえば2倍)の距離に対応する幅をもつように設定するという区分けルールを採用している。このような区分けルールにより、どの区間についても、適度な幅(視差値範囲)を持たせることができる。すなわち、このような区分けルールによって各区間にそれぞれ対応する距離範囲が異なることになるが、各区間の直線近似処理に使用する路面候補点の数が各区間で均一化でき、どの区間でも適切な直線近似処理を行うことができるようになる。 Therefore, in the present embodiment, the first section is set to have a width corresponding to a predetermined fixed distance, and the second and third sections correspond to the width of the immediately preceding section. A classification rule is adopted in which the width is set to have a distance corresponding to a constant multiple (for example, twice) of the distance. According to such a classification rule, an appropriate width (disparity value range) can be given to any section. That is, although the distance range corresponding to each section is different according to such a division rule, the number of road surface candidate points used for the linear approximation processing of each section can be equalized in each section, and any section is appropriate It becomes possible to perform linear approximation processing.
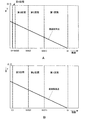
なお、図22に示した例では、第1区間及び第2区間が重複(オーバーラップ)することなく連続し、第2区間及び第3区間も重複することなく連続するように各区間を区分けしているが、各区間が重複するように区分けしてもよい。例えば、図23に示すように、第2区間の始点S2Lを第1区間の3:1内分点とし(第2区間の終点E2は図22の例と同じ。)、第3区間の始点S3Lを第1区間の終点E1と第2区間の終点E2との間の3:1内分点としてもよい(第3区間の終点E3は図22の例と同じ。)。 In the example shown in FIG. 22, each section is divided so that the first section and the second section continue without overlapping (overlap), and the second section and the third section also continue without overlapping. However, each section may be divided so as to overlap. For example, as shown in FIG. 23, the start point S2L of the second section is a 3: 1 internal division point of the first section (the end point E2 of the second section is the same as the example of FIG. 22), and the start point S3L of the third section. May be a 3: 1 internal division point between the end point E1 of the first section and the end point E2 of the second section (the end point E3 of the third section is the same as the example of FIG. 22).
区間に応じて距離範囲を変更したり、区間をオーバーラップさせたりすることで、各区間の直線近似処理に使用する候補点数を均一化して、各区間の直線近似処理の精度を高めることができる。また、区間をオーバーラップさせることにより、各区間の直線近似処理の相関を高めることもできる。 By changing the distance range according to the section or overlapping the sections, it is possible to equalize the number of candidate points used for the linear approximation processing of each section and to improve the accuracy of the linear approximation processing of each section. . Further, by making the sections overlap, it is possible to enhance the correlation of the linear approximation processing of each section.
また、上述した区分けルールに従って視差値が大きい順に区間を設定していくと、図24Aに示すように、例えば、最終の第4区間が本来の区間幅(視差値範囲)より狭い幅しか設定できない場合がある。このような場合には、図24Bに示すように、最終の第4区間をひとつ前の第3区間と結合して、ひとつの区間(第3区間)として設定してもよい。 Further, when the sections are set in the descending order of the parallax value according to the classification rule described above, as shown in FIG. 24A, for example, the final fourth section can only set a width narrower than the original section width (disparity value range) There is a case. In such a case, as shown in FIG. 24B, the final fourth section may be combined with the immediately preceding third section and set as one section (third section).
図25は、区分直線近似部135bで行う区分直線近似処理の流れを示すフローチャートであり、図26は、当初の区間を示す説明図(図26A)、及び当初の第1区間を延長した後の区間を示す説明図(図26B)である。また、図27は、当初の区間を示す説明図(図27A)、及び当初の第2区間を延長した後の区間を示す説明図(図27B)である。また、図28は、得られた各区間の近似直線が区間境界で連続にならない状態を示す説明図(図28A)、及び各区間の近似直線が区間境界において連続になる修正した例を示す説明図(図28B)である。
FIG. 25 is a flow chart showing the flow of the parting line approximation process performed by the parting
区分直線近似部135bは、路面候補点検出部135aから出力される各視差値dの路面候補点のデータを受け取ったら、まず、最近距離の第1区間(最も視差値が大きい区間)を設定する(ステップS91)。そして、この第1区間内の各視差値dに対応した路面候補点を抽出する(ステップS92)。このとき、抽出された路面候補点の数が所定の値以下である場合(ステップS93:NO)、当該第1区間を所定の視差値分だけ延長する(ステップS94)。具体的には、図26Aに示す当初の第1区間と第2区間とを結合して、図26Bに示すように、新たにひとつの第1区間(延長された第1区間)とする。このとき、当初の第3区間は新たな第2区間となる。そして、延長された第1区間内の各視差値dに対応した路面候補点を再び抽出し(ステップS92)、抽出された路面候補点の数が所定の値よりも多くなった場合には(ステップS93:YES)、抽出した路面候補点について直線近似処理を行う(ステップS95)。
When receiving the data of road surface candidate points of each parallax value d output from the road surface candidate
なお、第1区間ではない区間、例えば第2区間を延長する場合には、図27Aに示す当初の第2区間と第3区間とを結合して、図27Bに示すように、新たに一つの第2区間(延長された第2区間)とする。 In addition, when extending a section that is not the first section, for example, the second section, the original second section and the third section shown in FIG. 27A are combined to newly add one as shown in FIG. 27B. The second section (the extended second section) is used.
このようにして直線近似処理を行ったら(ステップS96:NO)、次に、その直線近似処理により得られる近似直線の信頼性判定を行う。この信頼性判定では、最初に、得られた近似直線の傾きと切片が所定の範囲内にあるかどうかを判定する(ステップS97)。この判定で所定の範囲内ではない場合には(ステップS97:NO)、当該第1区間を所定の視差値分だけ延長し(ステップS94)、延長された第1区間について再び直線近似処理を行う(ステップS92〜95)。そして、所定の範囲内ではあると判定されたら(ステップS97:YES)、その直線近似処理を行った区間が第1区間か否かを判断する(ステップS98)。 When the linear approximation process is performed in this manner (step S96: NO), next, the reliability determination of the approximate straight line obtained by the linear approximation process is performed. In this reliability determination, it is first determined whether the slope and the intercept of the obtained approximate straight line are within a predetermined range (step S97). When it is not within the predetermined range in this determination (step S97: NO), the first section is extended by the predetermined parallax value (step S94), and the linear approximation process is performed again for the extended first section. (Steps S92 to 95). Then, if it is determined that it is within the predetermined range (step S97: YES), it is determined whether the section for which the linear approximation process has been performed is the first section (step S98).
このとき、第1区間であると判断された場合には(ステップS98:YES)、その近似直線の相関値が所定の値よりも大きいかどうかを判定する(ステップS99)。この判定において、近似直線の相関値が所定の値よりも大きければ、その近似直線を当該第1区間の近似直線として決定する。近似直線の相関値が所定の値以下であれば、当該第1区間を所定の視差値分だけ延長し(ステップS94)、延長された第1区間について再び直線近似処理を行い(ステップS92〜95)、再び信頼性判定を行う(ステップS97〜S99)。なお、第1区間でない区間については(ステップS98:NO)、近似直線の相関値に関する判定処理(ステップS99)は実施しない。 At this time, if it is determined that it is the first section (step S98: YES), it is determined whether the correlation value of the approximate straight line is larger than a predetermined value (step S99). In this determination, if the correlation value of the approximate straight line is larger than a predetermined value, the approximate straight line is determined as the approximate straight line of the first section. If the correlation value of the approximate straight line is equal to or less than a predetermined value, the first section is extended by a predetermined disparity value (step S94), and the linear approximation process is performed again for the extended first section (steps S92 to S95). And the reliability judgment is performed again (steps S97 to S99). In addition, the determination process (step S99) regarding the correlation value of an approximate straight line is not implemented about the area which is not a 1st area (step S98: NO).
その後、残りの区間があるか否かを確認し(ステップS100)、もし残りの区間が無ければ(ステップS100:NO)、区分直線近似部135bは区分直線近似処理を終了する。一方、残りの区間がある場合には(ステップS100:YES)、前区間の幅に対応する距離を定数倍した距離に対応する幅をもった次の区間(第2区間)を設定する(ステップS101)。そして、この設定後に残っている区間が更に次に設定される区間(第3区間)よりも小さいか否かを判断する(ステップS102)。この判断において小さくないと判断されたなら(ステップS102:NO)、当該第2区間内の各視差値dに対応した路面候補点を抽出して直線近似処理を行うとともに(ステップS92〜S95)、信頼性判定処理を行う(ステップS97〜S99)。
Thereafter, it is checked whether there is a remaining section (step S100), and if there is no remaining section (step S100: NO), the segment
このようにして順次区間を設定し、その区間の直線近似処理及び信頼性判定処理を行うという処理を繰り返していくと、いずれ、前記ステップS102において、設定後に残っている区間が更に次に設定される区間よりも小さいと判断される(ステップS102:YES)。この場合、設定された区間を延長して当該残っている区間を含めるようにし、これを最後の区間として設定する(ステップS103)。この場合、この最後の区間内の各視差値dに対応した路面候補点を抽出し(ステップS92)、抽出した路面候補点について直線近似処理を行ったら(ステップS15)、ステップS96において最後の区間であると判断されるので(ステップS96:YES)、区分直線近似部135bは区分直線近似処理を終了する。
In this way, when the sections are sequentially set, and the process of performing the linear approximation processing and the reliability determination processing of the sections is repeated, the sections remaining after the setting are further set at the next step in the step S102. Is determined to be smaller than the interval (step S102: YES). In this case, the set section is extended to include the remaining section, and this is set as the last section (step S103). In this case, road surface candidate points corresponding to each parallax value d in the last section are extracted (step S92), and linear approximation processing is performed on the extracted road surface candidate points (step S15). (Step S96: YES), the sectioned
このようにして区分直線近似部135bが各区間の直線近似処理を実行して得た各区間の近似直線は、図28Aに示すように、通常、区間境界で連続したものにはならない。そのため、本実施形態では、各区間の近似直線が区間境界において連続になるように、区分直線近似部135bから出力される近似直線を図28Bに示すように修正する。具体的には、例えば、区間の境界上における両区間の近似直線の端点間の中点を通るように両近似直線を修正する。
In this manner, the approximate straight line of each section obtained by performing the straight line approximation processing of each section by the dividing straight
《路面高さテーブル算出》
以上のようにして、路面形状検出部135においてVマップ上の近似直線の情報が得られたら、次に、路面高さテーブル算出部136において、路面高さ(自車両の真下の路面部分に対する相対的な高さ)を算出してテーブル化する路面高さテーブル算出処理を行う。路面形状検出部135により生成されたVマップ上の近似直線の情報から、撮像画像上の各行領域(画像上下方向の各位置)に映し出されている各路面部分までの距離を算出できる。一方、自車両の真下に位置する路面部分をその面に平行となるように自車両進行方向前方へ延長した仮想平面の自車両進行方向における各面部分が、撮像画像中のどの各行領域に映し出されるかは予め決まっており、この仮想平面(基準路面)はVマップ上で直線(基準直線)により表される。路面形状検出部135から出力される近似直線を基準直線と比較することで、自車両前方の各路面部分の高さを得ることができる。簡易的には、路面形状検出部135から出力される近似直線上のY軸位置から、これに対応する視差値から求められる距離だけ自車両前方に存在する路面部分の高さを算出できる。路面高さテーブル算出部136では、近似直線から得られる各路面部分の高さを、必要な視差範囲についてテーブル化する。
Calculation of road surface height table
As described above, when the information on the approximate straight line on the V map is obtained in the road surface
なお、ある視差値dにおいてY軸位置がy’である地点に対応する撮像画像部分に映し出されている物体の路面からの高さは、当該視差値dにおける近似直線上のY軸位置をy0としたとき、(y’−y0)から算出することができる。一般に、Vマップ上における座標(d,y’)に対応する物体についての路面からの高さHは、下記の式〔2〕より算出することができる。ただし、下記の式〔2〕において、「z」は、視差値dから計算される距離(z=BF/(d−offset))であり、「f」はカメラの焦点距離を(y’−y0)の単位と同じ単位に変換した値である。ここで、「BF」は、ステレオカメラの基線長と焦点距離を乗じた値であり、「offset」は無限遠の物体を撮影したときの視差値である。
H=z×(y’−y0)/f …式〔2〕
Note that the height from the road surface of the object shown in the captured image portion corresponding to the point where the Y-axis position is y ′ at a certain parallax value d is equal to the Y-axis position on the approximate straight line in the parallax value d And can be calculated from (y'-y0). Generally, the height H from the road surface for an object corresponding to the coordinates (d, y ′) on the V map can be calculated by the following equation [2]. However, in the following formula [2], “z” is the distance calculated from the parallax value d (z = BF / (d−offset)), and “f” is the camera focal length (y′− It is a value converted into the same unit as y0). Here, “BF” is a value obtained by multiplying the base length of the stereo camera and the focal length, and “offset” is a parallax value when an object at infinity is photographed.
H = z × (y′−y0) / f formula [2]
次に、本実施形態の特徴部分の説明を行う。図29は、図4のUマップ生成部137〜3次元位置決定部143によって実現される本実施形態の特徴部分の機能ブロック図であり、図30は、図29の機能ブロックにより実行される処理の手順を示すフローチャートである。
Next, features of the present embodiment will be described. FIG. 29 is a functional block diagram of a feature of the present embodiment realized by the U
図29に示すように、本実施形態の特徴部分は、マップ生成手段11、オブジェクト候補領域検出手段12、及び立体物検出手段13によって構成されている。ここで、オブジェクト候補領域検出手段12は、孤立領域検出手段12a、周辺領域除去手段12b、分割選択手段12c、孤立領域分割手段12d、およびオブジェクト候補領域登録手段12eよって構成されており、孤立領域分割手段12dは、横方向分割手段12d1及び移動方向分割手段12d2によって構成されている。
As shown in FIG. 29, the characteristic part of the present embodiment is configured by the map generation unit 11, the object candidate area detection unit 12, and the solid
また、図30に示すように、図29の機能ブロックにより実行される処理の手順は、マップ生成工程(ステップS61)、孤立領域検出工程(ステップS62)、周辺領域除去工程(ステップS63)、分割選択工程(ステップS64)、孤立領域分割工程(ステップS65)、オブジェクト候補領域登録工程(ステップS66)、および立体物検出工程(ステップS67)によって構成されている。 Further, as shown in FIG. 30, the procedure of the process executed by the functional block of FIG. 29 includes a map generation step (step S61), an isolated area detection step (step S62), a peripheral area removal step (step S63), and division. The selection step (step S64), the isolated area division step (step S65), the object candidate area registration step (step S66), and the three-dimensional object detection step (step S67).
以降、図29に示すブロック、および図30に示す各工程の詳細な内容について説明する。 Hereinafter, the detailed contents of the blocks shown in FIG. 29 and each step shown in FIG. 30 will be described.
《Uマップ生成》
マップ生成手段11に対応するUマップ生成部137について説明する。
Uマップ生成部137では、Uマップを生成するUマップ生成処理、即ちマップ生成工程(ステップS61)に対応する処理として、頻度Uマップ生成処理及び高さUマップ生成処理を実行する。
<< U map generation >>
The U
The U
頻度Uマップ生成処理では、視差画像データに含まれる各視差画素データにおけるx方向位置とy方向位置と視差値dとの組(x,y,d)を、X軸にx、Y軸にd、Z軸に頻度を設定して、X−Yの2次元ヒストグラム情報を作成する。これを頻度Uマップと呼ぶ。本実施形態のUマップ生成部137では、路面高さテーブル算出部136によってテーブル化された各路面部分の高さに基づいて、路面からの高さHが所定の高さ範囲(たとえば20cmから3m)にある視差画像の点(x,y,d)についてだけ頻度Uマップを作成する。この場合、路面から当該所定の高さ範囲に存在する物体を適切に抽出することができる。なお、例えば、撮像画像の下側5/6の画像領域に対応する視差画像の点(x,y,d)についてだけUマップを作成するようにしてもよい。この場合、撮像画像の上側1/6は、ほとんどの場合、空が映し出されていて認識対象とする必要のある物体が映し出されていないためである。
In the frequency U map generation process, a pair (x, y, d) of an x-direction position, a y-direction position, and a parallax value d in each parallax pixel data included in parallax image data is The frequency is set on the Z axis, and two-dimensional histogram information of XY is created. This is called a frequency U map. In the U
また、高さUマップ生成処理では、視差画像データに含まれる各視差画素データにおけるx方向位置とy方向位置と視差値dとの組(x,y,d)を、X軸にx、Y軸にd、Z軸に路面からの高さを設定して、X−Yの2次元ヒストグラム情報を作成する。これを高さUマップと呼ぶ。このときの高さの値は路面からの高さが最高のものである。 In the height U map generation process, a pair (x, y, d) of the x-direction position, the y-direction position, and the parallax value d in each parallax pixel data included in parallax image data The x-y two-dimensional histogram information is created by setting the axis from d and the z-axis from the height from the road surface. This is called a height U map. The value of the height at this time is the highest from the road surface.
図31は、撮像部110aで撮像される基準画像の一例を模式的に表した画像例であり、図32は、図31の画像例に対応するUマップである。ここで、図32Aは頻度Uマップであり、図32Bは高さUマップである。
FIG. 31 is an example of an image schematically showing an example of a reference image captured by the
図31に示す画像例では、路面の左右両側にガードレール413,414が存在し、他車両としては、先行車両411と対向車両412がそれぞれ1台ずつ存在する。このとき、頻度Uマップにおいては、図32Aに示すように、左右のガードレール413,414に対応する高頻度の点は、左右両端側から中央に向かって上方へ延びるような略直線状6
03,604に分布する。一方、先行車両411と対向車両412に対応する高頻度の点は、左右のガードレールの間で、略X軸方向に平行に延びる線分の状態601,602で分布する。なお、先行車両411の背面部分又は対向車両412の前面部分以外に、これらの車両の側面部分が映し出されているような状況にあっては、同じ他車両を映し出している画像領域内において視差が生じる。このような場合、図32Aに示すように、他車両に対応する高頻度の点は、略X軸方向に平行に延びる線分と略X軸方向に対して傾斜した線分とが連結した状態の分布を示す。
In the image example shown in FIG. 31, guard rails 413 and 414 exist on the left and right sides of the road surface, and as the other vehicle, one leading vehicle 411 and one oncoming vehicle 412 exist. At this time, in the frequency U map, as shown in FIG. 32A, high frequency points corresponding to the left and right guard rails 413 and 414 are substantially linear 6 extending upward from the left and right ends toward the center.
It is distributed in 03,604. On the other hand, high frequency points corresponding to the leading vehicle 411 and the oncoming vehicle 412 are distributed between the left and right guardrails in the
また、高さUマップにおいては、左右のガードレール413,414、先行車両411、及び対向車両412における路面からの高さが最高の点が頻度Uマップと同様に分布する。ここで、先行車両に対応する点の分布701及び対向車両に対応する点の分布702の高さはガードレールに対応する点の分布703,704よりも高くなる。これにより、高さUマップにおける物体の高さ情報を物体検出に利用することができる。
Further, in the height U map, points having the highest height from the road surface in the left and right guard rails 413 and 414, the leading vehicle 411, and the oncoming vehicle 412 are distributed similarly to the frequency U map. Here, the heights of the
《リアルUマップ生成》
以上のようにUマップを生成したら、次にリアルUマップ生成部138がリアルUマップを生成する。リアルUマップは、Uマップにおける横軸を画像の画素単位から実際の距離に変換し、縦軸の視差値を距離に応じた間引き率を有する間引き視差に変換したものである。リアルUマップは、マップ生成手段11に含んでも良いが、以降の処理を行えるようであれば必ずしも要するものではない。
<< Real U map generation >>
After the U map is generated as described above, next, the real U
図33は、図32Aに示す頻度Uマップに対応するリアルUマップ(以下、リアル頻度Uマップ)を示す図である。図示のように、左右のガードレールは垂直の線状のパターン803,804で表され、先行車両、対向車両も実際の形に近いパターン801、802で表される。
FIG. 33 is a view showing a real U map (hereinafter, real frequency U map) corresponding to the frequency U map shown in FIG. 32A. As illustrated, the left and right guardrails are represented by vertical linear patterns 803 and 804, and the preceding vehicle and the oncoming vehicle are also represented by
縦軸の間引き視差は、遠距離(ここでは50m以上)については間引きなし、中距離(20m以上、50m未満)については1/2に間引き、近距離(10m以上、20m未満)については1/3に間引き、近距離(10m以上、20m未満)については1/8に間引いたものである。 The thinning parallax on the vertical axis is not thinned for a long distance (here, 50 m or more), 1/2 for an intermediate distance (20 m or more and less than 50 m), and 1 / l for a short distance (10 m or more and less than 20 m) It is thinned out to 3 and thinned out to 1/8 for a short distance (10 m or more and less than 20 m).
つまり、遠方ほど、間引く量を少なくしている。その理由は、遠方では物体が小さく写るため、視差データが少なく、距離分解能も小さいので間引きを少なくし、逆に近距離では、物体が大きく写るため、視差データが多く、距離分解能も大きいので間引きを多くする。 In other words, the amount of thinning is reduced as the distance increases. The reason is that since the object appears small at a distance, there is little parallax data and the distance resolution is small, so thinning is reduced, and conversely, an object is large at a short distance, so there is much parallax data and the distance resolution is large. To make
横軸を画像の画素単位から実際の距離へ変換する方法、Uマップの(x,d)からリアルUマップの(X,d)を求める方法の一例について図34を用いて説明する。
カメラから見て左右10mずつ、即ち20mの幅をオブジェクト検出範囲として設定する。リアルUマップの横方向1画素の幅を10cmとすると、リアルUマップの横方向サイズは200画素となる。
An example of a method of converting the horizontal axis from the pixel unit of the image to an actual distance and a method of obtaining (X, d) of the real U map from (x, d) of the U map will be described using FIG.
When viewed from the camera, a width of 10 m on each side, that is, 20 m, is set as the object detection range. Assuming that the width of one pixel in the horizontal direction of the real U map is 10 cm, the horizontal size of the real U map is 200 pixels.
カメラの焦点距離をf、カメラ中心からのセンサの横方向の位置をp、カメラから被写体までの距離をZ、カメラ中心から被写体までの横方向の位置をXとする。センサの画素サイズをsとすると、xとpの関係は「x=p/s」で表される。また、ステレオカメラの特性から、「Z=Bf/d」の関係がある。 The focal length of the camera is f, the lateral position of the sensor from the camera center is p, the distance from the camera to the subject is Z, and the lateral position from the camera center to the subject is X. Assuming that the pixel size of the sensor is s, the relationship between x and p is represented by “x = p / s”. Also, due to the characteristics of the stereo camera, there is a relationship of “Z = Bf / d”.
また、図より、「x=p*Z/f」の関係があるから、「X=sxB/d」で表すことができる。Xは実距離であるが、リアルUマップ上での横方向1画素の幅が10cmあるので、容易にXのリアルUマップ上での位置を計算することができる。 Also, from the figure, since there is a relationship of “x = p * Z / f”, it can be represented by “X = sxB / d”. Although X is a real distance, since the width of one pixel in the horizontal direction on the real U map is 10 cm, the position on X's real U map can be easily calculated.
図32Bに示す高さUマップに対応するリアルUマップ(以下、リアル高さUマップ)も同様の手順で作成することができる。 A real U map (hereinafter, real height U map) corresponding to the height U map shown in FIG. 32B can also be created in the same procedure.
リアルUマップには、縦横の高さをUマップより小さくできるので処理が高速になるというメリットがある。また、横方向が距離に非依存になるため、遠方、近傍いずれでも同じ物体は同じ幅で検出することが可能になり、後段の周辺領域除去や、横分割、縦分割への処理分岐の判定(幅の閾値処理)が簡単になるというメリットもある。 The real U map has an advantage that the processing becomes faster because the height in the vertical and horizontal directions can be smaller than that in the U map. In addition, since the horizontal direction becomes independent of distance, the same object can be detected with the same width in both far and near areas, and it is possible to determine the processing branch to the subsequent peripheral area removal, horizontal division, and vertical division. There is also an advantage that (the threshold processing of the width) becomes easy.
Uマップの高さは,最短距離を何メートルにするかで決定される。つまり、「d=Bf/Z」であるから、dの最大値は決定される。視差値dはステレオ画像を扱うため、通常画素単位で計算されるが、少数を含むため、視差値に例えば32を乗じて小数部分を四捨五入して整数化した視差値を使用する。 The height of the U map is determined by how many meters the shortest distance is. That is, since “d = Bf / Z”, the maximum value of d is determined. The disparity value d is usually calculated in pixel units to handle stereo images, but since it includes a small number, the disparity value is multiplied by 32, for example, and the fractional part is rounded off to use an integer-scaled disparity value.
例えば、4mを最短距離にして、画素単位の視差値が30であるステレオカメラの場合、Uマップの高さの最大値は30×32で960となる。また、2mを最短距離にして、画素単位の視差値が60であるステレオカメラの場合、60×32で1920となる。 For example, in the case of a stereo camera in which the parallax value in units of pixels is 30 with 4 m as the shortest distance, the maximum value of the height of the U map is 960 at 30 × 32. Further, in the case of a stereo camera in which the parallax value in units of pixels is 60 by setting 2 m as the shortest distance, 60 × 32 results in 1920.
Zが1/2になると、dは2倍になるので,それだけUマップの高さ方向のデータは巨大となる。そこで、リアルUマップを作成するときには、近距離ほど間引いてその高さを圧縮する。 When Z is halved, d is doubled, so the data in the height direction of the U map becomes huge. Therefore, when creating a real U map, the height is reduced by thinning out at a short distance.
上記のカメラの場合、50mでは視差値が2.4画素、20mで視差値が6画素、8mで視差値が15画素、2mで60画素となる。従って、50m以上では視差値は間引きなし、20m以上50m未満では1/2間引き、8m以上20m未満では1/3間引き、8m未満では1/15間引きというように近距離になるほど大きな間引きをする。 In the case of the above camera, the parallax value is 2.4 pixels at 50 m, 6 pixels at 20 m, 8 pixels at 15 m, and 60 pixels at 2 m. Therefore, if the distance is 50 m or more, the parallax value is not reduced, 1/2 reduced when 20 m or more and less than 50 m, 1/3 reduced when 8 m or more and less than 20 m, and 1/15 reduced when less than 8 m.
この場合、無限遠から50mまでは、高さが2.4×32=77、50mから20mまでは高さが(6−2.4)×32/2=58、20mから8mまでは高さが(15−6)×32/3=96、8m未満では高さが(60−15)×32/15=96となる。この結果、リアルUマップの総高さは77+58+96+96=327となり,Uマップの高さよりかなり小さくなるから、ラベリングによるオブジェクト検出を高速に行うことができる。 In this case, the height is 2.4 × 32 = 77 from infinity to 50 m, the height is (6-2.4) × 32/2 = 58 from 50 m to 20 m, and the height from 20 m to 8 m (15-6) × 32/3 = 96, and if less than 8 m, the height is (60−15) × 32/15 = 96. As a result, since the total height of the real U map is 77 + 58 + 96 + 96 = 327, which is considerably smaller than the height of the U map, object detection by labeling can be performed at high speed.
《オブジェクト候補領域検出》
次に、オブジェクト候補領域検出手段12に対応するオブジェクト候補領域検出部139について説明する。
Object candidate area detection
Next, the object candidate
図35は、オブジェクト候補領域検出部139で行うオブジェクト候補領域検出処理の流れを示すフローチャートである。このフローチャートは、図30に示すフローチャートにおける孤立領域検出工程(ステップS62)、周辺領域除去工程(ステップS63)、分割選択工程(ステップS64)、孤立領域分割工程(ステップS65)、およびオブジェクト候補領域登録工程(ステップS66)の詳細な内容を示している。
FIG. 35 is a flowchart showing a flow of object candidate area detection processing performed by the object candidate
『孤立領域検出』
オブジェクト候補領域検出部139では、まずリアルUマップ生成部138で生成された頻度リアルUマップの情報の平滑化を行う(ステップS111)。
"Isolated area detection"
The object candidate
これは、頻度値を平均化することで、有効な孤立領域を検出しやすくするためである。即ち、視差値には計算誤差等もあって分散があり、かつ、視差値がすべての画素について計算されているわけではないので、リアルUマップは図33に示した模式図とは異なり、ノイズを含んでいる。そこで、ノイズを除去するためと、検出したいオブジェクトを分割しやすくするため、リアルUマップを平滑化する。これは画像の平滑化と同様に、平滑化フィルタ(例えば3×3画素の単純平均)をリアルUマップの頻度値(頻度リアルUマップ)に対して適用することで、ノイズと考えられるような頻度は減少し、オブジェクトの部分では頻度が周囲より高い、まとまったグループとなり,後段の孤立領域検出処理を容易にする効果がある。 This is to make it easy to detect an effective isolated area by averaging frequency values. That is, since the parallax value also includes a calculation error and the like, and the parallax value is not calculated for all the pixels, the real U map is different from the schematic diagram shown in FIG. Contains. Therefore, the real U map is smoothed to remove noise and to easily divide the object to be detected. This is considered to be noise by applying a smoothing filter (for example, a simple average of 3 × 3 pixels) to a frequency value of a real U map (frequency real U map) as in the case of image smoothing. The frequency is reduced, and in the part of the object, the group is grouped more frequently than the surroundings, which has the effect of facilitating the subsequent isolated area detection processing.
次に、二値化の閾値を設定する(ステップS112)。最初は小さい値(=0)を用いて、平滑化されたリアルUマップの二値化を行う(ステップS113)。その後、値のある座標のラベリングを行って、孤立領域を検出する(ステップS114)。 Next, a threshold for binarization is set (step S112). Initially, the smoothed real U map is binarized using a small value (= 0) (step S113). Thereafter, labeling of coordinates having a value is performed to detect an isolated area (step S114).
この二つのステップでは、リアル頻度Uマップで頻度が周囲より高い孤立領域(島と呼ぶことにする)を検出する。検出には、リアル頻度Uマップをまず二値化する(ステップS113)。最初は閾値0で二値化を行う。これは、オブジェクトの高さや、その形状、路面視差との分割などがあるため、島は孤立しているものもあれば他の島と連結しているものもあることの対策である。即ち、小さい閾値からリアル頻度Uマップを二値化することで最初は孤立した適切な大きさの島を検出し、その後、閾値を増加させていくことで連結している島を分割し、孤立した適切な大きさの島として検出することを可能にしたものである。 In these two steps, a real frequency U map is used to detect isolated regions (referred to as islands) whose frequency is higher than that of the surroundings. For detection, the real frequency U map is first binarized (step S113). First, binarization is performed with a threshold value of 0. This is a measure against the fact that some islands are isolated and some are connected to other islands because of the height of the object, its shape, and division with the road surface parallax. That is, by binarizing the real frequency U map from a small threshold, an island of an appropriately isolated size is detected at first, and then the connected islands are divided by increasing the threshold, and the island is isolated. It is possible to detect as an island of appropriate size.
二値化後の島を検出する方法はラベリングを用いる(ステップS114)。二値化後の黒である座標(頻度値が二値化閾値より高い座標)をその連結性に基づいてラベリングして、同一ラベルが付いた領域を島とする。 The method of detecting the island after binarization uses labeling (step S114). Coordinates that are black after binarization (coordinates whose frequency value is higher than the binarization threshold) are labeled based on their connectivity, and areas with the same label are regarded as islands.
図36は、ラベリングの方法について説明するための図である。図36Aに示すように、○の位置が黒であってラベル付け対象座標(注目画素)であるとき、1,2,3,4の位置の座標にラベル付けされた座標があれば、その画素のラベルと同一ラベルを割り当てる。もし、図36Bに示すように複数のラベル(ここでは8と9)が存在すれば、図36Cに示すように、最も小さい値のラベル(ここでは8)を割り当て、その他のラベル(ここでは9)が付いた座標のラベルをそのラベルで置き換える。その島の幅は実のオブジェクトに近い幅Wとみなすことができる。この幅Wが所定の範囲内にあるものをオブジェクト候補領域とみなす。
FIG. 36 is a diagram for describing a labeling method. As shown in FIG. 36A, when the position of ○ is black and is the labeling target coordinate (target pixel), if there is a coordinate labeled at the coordinate of the
図35の説明に戻る。検出された複数の孤立領域についてそれぞれ大きさの判定を行う(ステップS115)。これは、検出対象が歩行者から大型自動車であるため、孤立領域の幅がそのサイズの範囲であるか否かを判定するのである。もし、その大きさが大きければ(ステップS115:YES)、二値化閾値を1だけインクリメントして(ステップS112)、リアル頻度Uマップの当該孤立領域内だけ二値化を行う(ステップS113)。そしてラベリングを行い、より小さな孤立領域を検出して(ステップS114)、その大きさを判定する(ステップS115)。 It returns to the explanation of FIG. Size determination is performed for each of the plurality of isolated areas detected (step S115). This is because the object to be detected is a pedestrian to a large car, so it is determined whether the width of the isolated area is within the range of its size. If the size is large (step S115: YES), the binarization threshold is incremented by 1 (step S112), and binarization is performed only in the isolated region of the real frequency U map (step S113). Then, labeling is performed, a smaller isolated area is detected (step S114), and the size is determined (step S115).
上記の閾値設定からラベリングの処理を繰り返し行い、所望の大きさの孤立領域を検出するのである。ここまでの処理(ステップS112〜ステップS115)が、孤立領域検出手段12aにより実行される孤立領域検出工程(ステップS62)に対応する。 The processing of labeling is repeated from the above threshold setting to detect an isolated area of a desired size. The processing up to this point (steps S112 to S115) corresponds to the isolated area detection step (step S62) performed by the isolated area detection means 12a.
所望の大きさの孤立領域が検出できたなら(ステップS115:NO)、次に周辺領域除去を行う(ステップS116)。これは、遠方にある物体で、路面検出の精度が悪く、路面の視差がリアルUマップ内に導入され、物体と路面の視差が一塊になって検出された場合のその左右、近傍の高さが路面に近い部分の領域(孤立領域内の周辺部分)を削除する処理である。除去領域が存在する場合は(ステップS117:YES)、もう一度ラベリングを行って孤立領域の再設定を行う(ステップS114)。ステップS116およびステップS117は周辺領域除去手段12bにより実行される周辺領域除去工程(ステップS63)に対応する。
If an isolated area of a desired size can be detected (step S115: NO), peripheral area removal is performed next (step S116). This is an object at a distance, the road surface detection accuracy is poor, the parallax of the road surface is introduced into the real U map, and the parallax between the object and the road surface is the height when it is detected as one mass Is a process of deleting the area near the road surface (the peripheral area in the isolated area). If there is a removal area (step S117: YES), labeling is performed again to reset the isolated area (step S114). Steps S116 and S117 correspond to the peripheral area removing step (step S63) executed by the peripheral
除去領域がなくなったら(ステップS117:NO)、周辺領域除去を行った孤立領域の大きさ(幅と高さ、距離)を判定し(ステップS118)、その結果に応じて、横方向分割(ステップS119)又は縦方向分割(ステップS120)又は何もしないでオブジェクト候補領域として登録する。横方向分割又は縦方向分割を行った場合は(ステップS121:YES、ステップS122:YES)、もう一度ラベリングを行って孤立領域の再設定を行う(ステップS114)。 If there is no more removal area (step S117: NO), the size (width, height, distance) of the isolated area from which the peripheral area has been removed is determined (step S118), and the division in the horizontal direction (step S118) S119) or vertical division (step S120) or nothing is registered as an object candidate area. If horizontal division or vertical division has been performed (step S121: YES, step S122: YES), labeling is performed again to reset the isolated area (step S114).
ここで、ステップS118は、分割選択手段12cにより実行される分割選択工程(ステップS64)に対応する。また、横方向分割(ステップS119)、縦方向分割(ステップS120)は、それぞれ横方向分割手段12d1、移動方向分割手段12d2により実行される横方向分割工程(ステップS65a)、移動方向分割工程(ステップS65b)に対応する。そして、オブジェクト候補領域として登録する処理は、オブジェクト候補領域登録手段12eにより実行されるオブジェクト候補領域登録工程(ステップS66)に対応する。
Here, step S118 corresponds to the division selection step (step S64) executed by the
物体同士が横に並んで近接している(自動車とバイク、自動車と歩行者、自動車同士など)場合、リアル頻度Uマップの平滑化が原因で一つの孤立領域として検出されることがある。或いは視差画像の視差補間の悪影響で異なる物体同士の視差がつながってしまうことがある。横方向分割はこのようなケースを検出して分割する処理である(詳細については後述)。 When the objects are adjacent to each other side by side (cars and bikes, cars and pedestrians, cars, etc.), smoothing of the real frequency U map may be detected as one isolated area. Or the parallax of different objects may be connected by the bad influence of the parallax interpolation of a parallax image. Horizontal division is processing for detecting and dividing such a case (details will be described later).
また、複数の先行車両が隣の車線を走行しているときに、それらが遠方にいる場合、ステレオ画像から得られる視差の分散が大きい場合、リアル頻度Uマップ上では物体それぞれの視差値が上下に伸び、連結してしまうことがある。このため、これを一つの孤立領域として検出してしまう場合がある。縦方向分割はこのようなケースを検出して、手前を走る先行車両とその向こうを走る先行車両とに分割する処理である(詳細については後述)。 In addition, when a plurality of preceding vehicles are traveling in the adjacent lane, if they are far from each other, if the disparity distribution obtained from the stereo image is large, the disparity values of the respective objects rise and fall on the real frequency U map Sometimes stretch and become connected. Therefore, this may be detected as one isolated area. The longitudinal division is processing for detecting such a case and dividing it into a preceding vehicle traveling in front and a preceding vehicle traveling in the opposite direction (details will be described later).
以下、周辺領域除去手段12b、横方向分割手段12d1、移動方向分割手段12d2にて行われる周辺領域除去、横方向分割、縦方向分割について詳細に説明する。
The peripheral area removal, horizontal division, and vertical division performed by the peripheral
『周辺領域除去』
図37は、周辺領域除去について説明するためのリアルUマップであり、図38は、周辺領域除去処理の流れを示すフローチャートである。ここで、図37Aは、平滑化後のリアル頻度Uマップであり、図37Bは、リアル高さUマップであり、図37Cは、周辺領域が除去されたリアル高さUマップである。これらのマップは実データを模式的に示したものである(後記の図39、図41も同様)。また、このリアル頻度Uマップは、図33における車両(先行車両や対向車両)に対応する点の分布の付近を取り出したものである。また、リアル高さUマップは、不図示のリアル高さUマップにおける車両に対応する点の分布の付近を取り出したものである。
"Peripheral area removal"
FIG. 37 is a real U map for describing peripheral area removal, and FIG. 38 is a flowchart showing a flow of peripheral area removal processing. Here, FIG. 37A is a real frequency U map after smoothing, FIG. 37B is a real height U map, and FIG. 37C is a real height U map from which a surrounding area is removed. These maps schematically show actual data (the same applies to FIGS. 39 and 41 described later). Further, this real frequency U map is obtained by taking out the vicinity of the distribution of points corresponding to the vehicles (preceding vehicles and oncoming vehicles) in FIG. Further, the real height U map is obtained by taking out the vicinity of the distribution of points corresponding to the vehicles in the real height U map (not shown).
図37A、図37Bは、いずれも、遠方の路面(白線等)が実際の高さよりも低く検出され、路面と車両とが一緒に検出された塊の例を示している。図37Aと図37Bとを比較すると、図37Bにおける高さの高い領域、高さの低い領域と、図37Aにおける頻度の高い領域、頻度の高い領域とが合致していない。このようなケースでは、頻度情報ではなく、高さ情報を利用することで、オブジェクトと路面との境界を検出して周辺領域を除去する。高さ情報の方が物体の形をより正確に表しているからである。 FIGS. 37A and 37B each show an example of a lump in which a distant road surface (white line or the like) is detected lower than the actual height and the road surface and the vehicle are detected together. Comparing FIG. 37A with FIG. 37B, the high-height region and the low-height region in FIG. 37B do not match the high-frequency region and the high-frequency region in FIG. 37A. In such a case, the boundary between the object and the road surface is detected and the surrounding area is removed by using the height information instead of the frequency information. This is because the height information more accurately represents the shape of the object.
周辺領域の除去処理は、図38に示すように、近傍領域除去処理(ステップS131)、左側領域除去処理(ステップS132)、右側領域除去処理(ステップS133)からなる。 As shown in FIG. 38, the peripheral area removal process includes a neighboring area removal process (step S131), a left area removal process (step S132), and a right area removal process (step S133).
近傍領域除去処理(ステップS131)における近傍領域除去の判定方法は、高さの閾値を下記のように設定し,下記(i)又は(ii)又は(iii)が孤立領域の最下端(ボトムライン)から成り立ち続ける場合に該当ラインの頻度を変更して除去する。 In the determination method of the near region removal in the near region removal process (step S131), the threshold value of the height is set as follows, and the following (i) or (ii) or (iii) is the lowest end of the isolated region (bottom line If the frequency of the corresponding line is changed and removed.
高さの閾値の設定:高さ閾値を塊内の最大高さに応じて設定する。即ち、例えば、最大高さが120cm以上であれば閾値を60cm、最大高さが120cm未満であれば閾値を40cmとする。
(i)ライン内に高さを持つ点が所定の点数(たとえば5)以下で閾値以上の高さを持つ点
がない。
(ii)ライン内に閾値以上の高さを持つ点数が閾値未満の高さを持つ点数より少なく、閾
値以上の高さを持つ点数が2未満である。
(iii)閾値以上の高さを持つ点数がライン全体の高さを持つ点数の10%未満である。
Setting the height threshold: Set the height threshold according to the maximum height in the mass. That is, for example, if the maximum height is 120 cm or more, the threshold is 60 cm, and if the maximum height is less than 120 cm, the threshold is 40 cm.
(i) There is no point having a height in the line having a height equal to or greater than a threshold value at a predetermined score (for example, 5) or less.
(ii) The number of points having a height above the threshold in the line is less than the point having a height below the threshold, and the number of points having a height above the threshold is less than 2.
(iii) The score having the height equal to or greater than the threshold is less than 10% of the score having the height of the entire line.
左側領域除去処理(ステップS132)及び右側領域除去処理(ステップS133)における左右領域除去の判定方法は、高さの閾値を下記のように設定し、下記(iv)又は(v)又は(vi)が孤立領域の左端又は右端の列から成り立ち続ける場合に該当列の頻度を変更して除去する。 The determination method of the left and right area removal in the left area removal processing (step S132) and the right area removal processing (step S133) sets the threshold of height as follows, and the following (iv) or (v) or (vi) In the case where continues to consist of the leftmost or rightmost column of the isolated area, the frequency of the corresponding column is changed and removed.
高さの閾値の設定:高さ閾値を塊内の最大高さに応じて設定する。即ち、例えば、最大高さが120cm以上であれば閾値を60cm、最大高さが120cm未満であれば閾値を40cmとする。 Setting the height threshold: Set the height threshold according to the maximum height in the mass. That is, for example, if the maximum height is 120 cm or more, the threshold is 60 cm, and if the maximum height is less than 120 cm, the threshold is 40 cm.
(iv)列内に高さを持つ点が所定の点数(たとえば5)以下で閾値以上の高さを持つ点がない。
(v)列内に閾値以上の高さを持つ点数が閾値未満の高さを持つ点数より少なく,閾値以上の高さを持つ点数が2未満である。
(vi)閾値以上の高さを持つ点数が列全体の高さを持つ点数の10%未満である。
(iv) There is no point having a height in a row having a height equal to or greater than a threshold value at a predetermined score (for example, 5) or less.
(v) The number of points having a height equal to or greater than the threshold in the row is less than the point having a height less than the threshold, and the number of points having a height equal to or greater than the threshold is less than 2.
(vi) The score having the height equal to or greater than the threshold is less than 10% of the score having the height of the entire row.
以上のようにして近傍、及び左右の高さが低い領域を除去すると、図37Cに示すように、中央の高さの高い領域が残り、近傍及び左右の高さの低い領域が除去される。なお、ここで提示した数値は一例に過ぎず、他の数値でもよいことは言うまでもない。 As described above, when the neighborhood and the area where the height on the left and right is low is removed, as shown in FIG. 37C, the area where the height of the center is high remains, and the area where the height near and left and right is low is removed. Needless to say, the numerical values presented here are merely examples, and other numerical values may be used.
『横方向分割』
図39は、横方向分割について説明するための図であり、図40は、横方向分割処理の流れを示すフローチャートである。ここで、図39Aは、平滑化後のリアル頻度Uマップを示し、図39Bは、リアル高さUマップを示す。また、図39Cは、分割境界の検出方法を示す。
"Horizontal division"
FIG. 39 is a diagram for explaining horizontal division, and FIG. 40 is a flowchart showing the flow of horizontal division processing. Here, FIG. 39A shows a real frequency U map after smoothing, and FIG. 39B shows a real height U map. Further, FIG. 39C shows a method of detecting division boundaries.
まず横方向分割の実行条件(ステップS118→ステップS119)について説明する。横方向分割が有効なケースでは、横方向にオブジェクトが連結しているので、例えば自動車1台の幅(約2m)に別の物体が近接している(例えば50cm離れている)ときには、リアルUマップら検出した孤立領域の幅が2.5mを越えていると推定される。そこで、孤立領域の幅が2.5mを越えている場合は、この横方向分割を実行する。 First, the execution condition of horizontal division (step S118 → step S119) will be described. In the case where horizontal division is effective, objects are connected in the horizontal direction, so when another object is close (for example, 50 cm away) to the width of one car (about 2 m), for example, the real U The width of the isolated area detected by the map is estimated to exceed 2.5 m. Therefore, when the width of the isolated area exceeds 2.5 m, this horizontal division is performed.
横方向分割処理は、図40に示すように、縦方向評価値算出処理(ステップS141)、最小評価値位置検出処理(ステップS142)、二値化閾値設定処理(ステップS143)、評価値二値化処理(ステップS144)、分割境界検出処理(ステップS145)からなる。 In the horizontal direction division processing, as shown in FIG. 40, the vertical direction evaluation value calculation processing (step S141), the minimum evaluation value position detection processing (step S142), the binarization threshold setting processing (step S143), and the evaluation value binary. It consists of the conversion process (step S144) and the division boundary detection process (step S145).
縦方向評価値算出処理(ステップS141)では、周辺領域が除去された孤立領域のリアル頻度Uマップとリアル高さUマップの各点における値の積を列方向に加算して、横方向の評価値を算出する。即ち、図39A、図39Bの各X座標の評価値を「Σ(頻度*高さ)」として算出する。ここで、ΣはY方向の総和をとることを意味する。 In the vertical evaluation value calculation process (step S141), the product of the values at each point of the real frequency U map and the real height U map of the isolated area from which the peripheral area has been removed is added in the column direction to evaluate in the horizontal direction. Calculate the value. That is, the evaluation value of each X coordinate in FIG. 39A and FIG. 39B is calculated as “Σ (frequency * height)”. Here, Σ means taking the sum in the Y direction.
最小評価値位置検出処理(ステップS142)では、図39Cに示すように、算出した評価値から最小値とその位置を検出する。また、二値化閾値設定処理(ステップS143)では、図39Cに示すように、各評価値の平均に所定の係数(例えば0.5)を乗じて、評価値の二値化閾値を求める。 In the minimum evaluation value position detection process (step S142), as shown in FIG. 39C, the minimum value and its position are detected from the calculated evaluation value. Further, in the binarization threshold setting process (step S143), as shown in FIG. 39C, the average of each evaluation value is multiplied by a predetermined coefficient (for example, 0.5) to obtain a binarization threshold of the evaluation value.
評価値二値化処理(ステップS144)では、その二値化閾値で評価値を二値化する。また、分割境界検出処理(ステップS145)では、図39Cに示すように、最小評価値を含み、二値化閾値より小さい評価値を含む領域を分割領域として設定する。そして、その分割領域の両端を分割境界とし、その分割境界の内側の頻度値を変更することで、孤立領域を横方向に分割する。 In the evaluation value binarization process (step S144), the evaluation value is binarized with the binarization threshold value. Further, in the division boundary detection process (step S145), as shown in FIG. 39C, an area including the minimum evaluation value and including an evaluation value smaller than the binarization threshold is set as a division area. Then, both ends of the divided area are set as division boundaries, and the frequency value inside the division boundary is changed to divide the isolated area in the horizontal direction.
このような評価値を用いた理由として、下記(vii)、(viii)、(ix)の3点が挙げられる。
(vii)連結している部分の頻度値は、オブジェクトの頻度値よりも比較的小さくなる。
(viii)高さUマップで連結している部分は、オブジェクトの部分とは高さが異なったり、高さを持つデータが少なかったりする。
(ix)視差補間の影響で連結している部分は、高さUマップにおける視差の分散が小さい。
The following three points (vii), (viii) and (ix) can be mentioned as the reason for using such an evaluation value.
(vii) The frequency value of connected parts is relatively smaller than the frequency value of the object.
(viii) The portion connected in the height U map is different in height from the portion of the object, or there is less data having a height.
(ix) In the part connected by the influence of disparity interpolation, the variance of disparity in the height U map is small.
『縦方向分割』
図41は、縦方向分割が有効な場合について説明するための図であり、図42は、縦方向分割について説明するための図である。また、図43は、縦方向分割処理の流れを示すフローチャートであり、図44は、縦方向分割における分割境界について説明するための図である。
"Vertical division"
FIG. 41 is a diagram for describing a case where vertical division is effective, and FIG. 42 is a diagram for describing vertical division. FIG. 43 is a flowchart showing the flow of vertical direction division processing, and FIG. 44 is a diagram for explaining division boundaries in vertical direction division.
縦方向分割は次のような場合に効果がある。図41に示すように、複数(ここでは3台)の先行車両423〜425が白線421及び422で区画されている走行車線の隣の車線を走行していてそれらが遠方にいる場合、ステレオ画像から得られる視差値の分散が大きい場合、リアル頻度Uマップ上では、物体それぞれの視差値が上下に伸び、連結してしまうことがある。これを一つの孤立領域426として検出するケースである。縦方向分割はこのようなケースを検出して手前を走る先行車とその向こうを走る先行車とに分割する場合に有効な処理である。
Vertical division is effective in the following cases. As shown in FIG. 41, when a plurality (three in this case) of leading
次に縦方向分割の実行条件(ステップS118→ステップS120)について説明する。縦方向分割が有効なケースでは、リアルUマップ上で縦方向にオブジェクトが並んでいるので、二台以上の縦列状態を一つの孤立領域として検出した場合は二台以上の車が持つ視差の範囲と車間距離を合わせた範囲がその孤立領域の視差範囲となる。そのため、ガードレールや壁以外で視差(距離)が広い範囲を有するものということで、基本的には縦列走行の分割が難しくなるある程度遠方(たとえば20m以遠)で、距離に応じて孤立領域の視差(距離)範囲が大きい孤立領域が縦方向分割の対象となる。一方、ガードレールや建物の壁などは視差範囲が広くても幅が狭いので幅の狭い孤立領域は縦方向分割の対象とはならない。 Next, the execution condition of vertical division (step S118 → step S120) will be described. In the case where vertical division is effective, objects are arranged in the vertical direction on the real U map, so when two or more cascaded states are detected as one isolated area, the parallax range of two or more cars is detected. The range obtained by combining the distance between the vehicle and the inter-vehicle distance is the parallax range of the isolated region. Therefore, the parallax (distance) is in a wide range other than the guardrail and the wall, and basically, the parallax of the isolated area according to the distance at a certain distance (for example, 20 m or more) where division of parallel travel becomes difficult Isolated regions with a large range) are subject to vertical division. On the other hand, since the guardrail and the wall of the building are narrow even if the parallax range is wide, the narrow isolated area is not a target of vertical division.
具体的には孤立領域の最近傍距離をZmin、最遠方距離をZmax、幅をWとすると下記(x)、(xi)以下のいずれかの条件を満たすときに縦方向分割を実行する。
(x)W>1500mmかつZmin>100mのとき、Zmax−Zmin>50m
(xi)W>1500mmかつ100m≧Zmin>20mのとき、Zmax−Zmin>40m
Specifically, assuming that the nearest distance of the isolated region is Zmin, the farthest distance is Zmax, and the width is W, the vertical division is performed when any of the following conditions (x) and (xi) or less is satisfied.
(x) Zmax-Zmin> 50m when W> 1500mm and Zmin> 100m
(xi) Zmax-Zmin> 40 m when W> 1500 mm and 100 mmaxZ min> 20 m
縦方向分割処理は、図43に示すように、実幅算出領域設定処理(ステップS151)、横方向評価値算出処理(ステップS152)、実幅設定処理(ステップS153)、分割境界設定処理(ステップS154)、分割処理(ステップS155)からなる。 In the vertical direction division processing, as shown in FIG. 43, the actual width calculation area setting processing (step S151), the horizontal direction evaluation value calculation processing (step S152), the actual width setting processing (step S153), and the division boundary setting processing (step S154) consists of division processing (step S155).
図42Aは左隣の車線を走行している2台の先行車が一つの孤立領域として検出された平滑化後のリアル頻度Uマップの例を示している。この場合、下側(手前)の頻度の大きい領域がすぐ前を走る先行車を表し、上側(奥側)の頻度の大きい領域がさらに前を走る先行車を表す。先行車の左右端に視差が集中し、その分散が大きいので、頻度の大きい領域の両側で左カーブを描くように視差が伸びている。この伸びが大きいため、手前の先行車の視差の伸びと奥側の先行車の視差の伸びとが連結して二台の先行車がひとつの孤立領域として検出されてしまっている。 FIG. 42A shows an example of a smoothed real frequency U map in which two preceding vehicles traveling in a lane adjacent to the left are detected as one isolated region. In this case, the lower (front) high frequency area represents a preceding vehicle traveling immediately ahead, and the upper (rear) high frequency area represents a preceding vehicle traveling further forward. Because the parallaxes are concentrated at the left and right ends of the preceding vehicle and the dispersion thereof is large, the parallaxes are extended so as to draw a left curve on both sides of the high frequency area. Since the expansion is large, the expansion of the parallax of the preceding vehicle in the front and the expansion of the parallax of the preceding vehicle on the back side are connected, and two preceding vehicles are detected as one isolated region.
このような場合、検出された孤立領域の幅は実際の先行車の幅より大きい事が常である。そこで、実幅を算出するための領域をまず設定する(実幅算出領域設定処理:ステップS151)。これは、孤立領域のZmaxからZminの大きさに応じて、所定の距離範囲Zrを下記の(xii)〜(xiv)に示すように設定して、その距離範囲に相当する視差範囲の領域内で手前の先行車の実幅を探索する処理である。 In such a case, the width of the detected isolated area is always larger than the width of the actual preceding vehicle. Therefore, an area for calculating the actual width is first set (actual width calculation area setting process: step S151). The predetermined distance range Zr is set as shown in (xii) to (xiv) below according to the size of Zmax to Zmin of the isolated region, and the region of the parallax range corresponding to the distance range is set. Is the process of searching for the actual width of the preceding vehicle ahead.
(xii)Zmin<50mならば、Zr=20m
(xii1)50m≦Zmin<100mならば、Zr=25m
(xiv)100m≦Zminならば、Zr=30m
(xii) if Zmin <50m, then Zr = 20m
(xii1) If 50 m ≦ Z min <100 m, then Zr = 25 m
(xiv) Zr = 30 m if 100 m ≦ Z min
図42Aにおいて、上端がZmax、下端がZmin、破線の枠で示された領域が実幅算出領域Zrである。このZrの値はステレオカメラから得られる視差の分散の大きさから設定することができる。 In FIG. 42A, the upper end is Zmax, the lower end is Zmin, and a region indicated by a broken line frame is the actual width calculation region Zr. The value of this Zr can be set from the size of the variance of the parallax obtained from the stereo camera.
次に、上記実幅算出領域内で横方向評価値を算出する(横方向評価値算出処理:ステップS152)。即ち、図42Bに示すように、実幅算出領域の各ラインで頻度値の積算し、それを各ラインでの評価値とする。そしてその評価値が最大であるラインを実幅検出位置とする。 Next, a lateral evaluation value is calculated in the actual width calculation area (horizontal evaluation value calculation process: step S152). That is, as shown in FIG. 42B, the frequency value is integrated in each line of the actual width calculation area, and this is used as the evaluation value in each line. Then, the line with the largest evaluation value is taken as the actual width detection position.
次いで、この実幅検出位置における、頻度値が連続して存在して最大の長さ(幅)を有する領域を実幅領域と検出する。また、その長さ、つまり実幅検出位置における連続した頻度の最大長を実幅とする(実幅設定処理:ステップS153)。図42Cの場合は、実幅は5となる。 Then, an area having frequency values continuously present at the actual width detection position and having the maximum length (width) is detected as the actual width area. In addition, the length, that is, the maximum length of the continuous frequency at the actual width detection position is set as the actual width (actual width setting process: step S153). In the case of FIG. 42C, the actual width is five.
次に、その実幅の境界の外側を分割境界とし(分割境界設定処理:ステップS154)、その分割境界を基準として孤立領域の各視差における分割境界の位置を順次計算して設定する(分割処理:ステップS155)。 Next, the outside of the boundary of the actual width is set as the division boundary (division boundary setting process: step S154), the position of the division boundary in each parallax of the isolated area is sequentially calculated and set based on the division boundary (division processing: Step S155).
分割境界の計算方法について図44を用いて説明する。
カメラの原点(レンズの中心)をO、カメラの向いている方向をカメラ中心軸(リアルUマップの中心の縦軸)の方向とする。また、実幅領域の分割境界の位置が、距離Z0,横位置X0とする。このとき距離Zにおける分割境界の位置をXとすると下記の式〔3〕が成り立つ。
X=X0*(Z/Z0) …式〔3〕
The calculation method of the division | segmentation boundary is demonstrated using FIG.
The origin of the camera (the center of the lens) is O, and the direction in which the camera is facing is the direction of the camera center axis (the vertical axis of the center of the real U map). Further, it is assumed that the position of the division boundary of the actual width area is the distance Z 0 and the lateral position X 0 . At this time, assuming that the position of the division boundary at the distance Z is X, the following equation [3] holds.
X = X 0 * (Z / Z 0 ) ... Formula [3]
また、BFをステレオカメラの基線長と焦点距離を掛け合わせたもの、d0をZ0に対応する視差、dをZに対応する視差、offsetを無限遠における視差とすると、「Z=BF/(d−offset)」、「Z0=BF/(d0−offset)」であるので、式〔3〕を下記の式〔4〕のように変形することができる。
X=X0*(d0−offset)/(d−offset) …式〔4〕
Further, those obtained by multiplying the base length and the focal length of the stereo camera BF, parallax corresponding to d 0 to Z 0, disparity corresponding to d to Z, when the parallax offset infinite in the far, "Z = BF / Since (d−offset) and “Z 0 = BF / (d 0 −offset)”, the equation [3] can be transformed into the following equation [4].
X = X 0 * (d 0 -offset) / (d-offset) ... Formula [4]
視差値dとリアルUマップの間引き視差との対応関係がわかっているので、式〔4〕から孤立領域内の分割境界の位置を全ての間引き視差の値で決定することができる。その結果が図42Dに「頻度値を変更、分割する位置」として示した箇所である。この箇所は、図35のステップS122経由でステップS114に移行したときに、頻度値が0に更新される。 Since the correspondence between the parallax value d and the thinning-out parallax of the real U map is known, the position of the division boundary in the isolated area can be determined by all the thinning-out parallax values from Expression [4]. The result is a portion shown in FIG. 42D as “a position where the frequency value is changed and divided”. The frequency value is updated to 0 when the process proceeds to step S114 via step S122 in FIG.
このようにすると、手前にある先行車の領域と奥に見えるオブジェクトの領域とを分割することができる。また、孤立領域の左下に縦に長い領域が分割されるがこれは幅が細いのでノイズとして処理されることになる。 In this way, it is possible to divide the area of the preceding vehicle in the foreground and the area of the object visible in the back. Also, a vertically long area is divided at the lower left of the isolated area, but this is treated as noise because it is narrow.
なお、図42に示す例は先行車が左隣の車線を走行している場合であったが、先行車が右隣の車線を走行している場合は、孤立領域のリアル頻度Uマップは、図42の例を左右反転した分布となる。 Although the example shown in FIG. 42 is the case where the preceding vehicle is traveling in the lane next to the left, when the preceding vehicle is traveling in the lane next to the right, the real frequency U map of the isolated area is The distribution in FIG. 42 is horizontally inverted.
《視差画像の対応領域検出、及びオブジェクト領域抽出》
次に、視差画像の対応領域検出部140及びオブジェクト領域抽出部141について説明する。これらは立体物検出手段13に対応する。図45は、オブジェクト候補領域検出部139でオブジェクト候補領域として登録された孤立領域が内接する矩形領域を設定したリアル頻度Uマップを示す図であり、図46は、図45における矩形領域に対応する走査範囲を設定した視差画像を示す図であり、図47は、図46における走査範囲を探索してオブジェクト領域を設定した視差画像を示す図である。
<< Correspondence area detection of parallax image, and object area extraction >>
Next, the parallax image corresponding
オブジェクト候補領域検出部139によりオブジェクト候補領域として登録された孤立領域について、図45に示すように、当該孤立領域としての第1車両801、第2車両802が内接する矩形領域として第1検出島811及び第2検出島812を設定したとき、この矩形領域の幅(Uマップ上のX軸方向長さ)は、当該孤立領域に対応する識別対象物(オブジェクト)の幅に対応する。また、設定した矩形領域の高さは、当該孤立領域に対応する識別対象物(オブジェクト)の奥行き(自車両進行方向長さ)に対応している。一方で、各孤立領域に対応する識別対象物(オブジェクト)の高さについては、この段階では不明である。視差画像の対応領域検出部140は、オブジェクト候補領域に係る孤立領域に対応したオブジェクトの高さを得るために、当該孤立領域に対応する視差画像上の対応領域を検出する。
As shown in FIG. 45, an isolated area registered as an object candidate area by the object candidate
視差画像の対応領域検出部140は、オブジェクト候補領域検出部139から出力される孤立領域(オブジェクト候補領域として登録された孤立領域)の情報に基づき、リアルUマップから検出した第1検出島811及び第2検出島812の位置、幅と最小視差から、図46に示す視差画像で検出すべき範囲である第1検出島対応領域走査範囲481及び第2検出島対応領域走査範囲482のx方向範囲(xmin,xmax)を決定できる。また、視差画像においてオブジェクトの高さと位置(ymin=”最大視差dmaxの時の路面からの最大高さに相当するy座標”からymax=”最大視差dmaxから得られる路面の高さを示すy”まで)を決定できる。
The corresponding
次に、オブジェクトの正確な位置を検出するため、設定した走査範囲を走査し、オブジェクト候補領域検出部139で登録された孤立領域が内接する矩形の奥行き(最小視差dmin,最大視差dmax)の範囲の値を視差にもつ画素を候補画素として抽出する。そして、抽出した候補画素群の中で検出幅に対して横方向に所定の割合以上あるラインを候補ラインとする。
Next, in order to detect the accurate position of the object, the set scanning range is scanned, and the range of the depth (minimum parallax dmin, maximum parallax dmax) of the rectangle inscribed in the isolated area registered by the object candidate
次に、縦方向に走査して、ある注目しているオブジェクト候補ラインの周囲に他のオブジェクト候補ラインが所定の密度以上ある場合には,その注目しているオブジェクト候補ラインをオブジェクトラインとして判定する。 Next, scanning is performed in the vertical direction, and when there is a predetermined density or more of another object candidate line around a certain focused object candidate line, the focused object candidate line is determined as an object line .
次に、オブジェクト領域抽出部141は、視差画像の探索領域でオブジェクトラインを探索して、オブジェクトラインの最下端、最上端を決定し、図47に示すように、オブジェクトライン群の外接矩形461,462を視差画像におけるオブジェクト(第1車両、第2車両)の領域451,452として決定する。
Next, the object
図48は、視差画像の対応領域検出部140及びオブジェクト領域抽出部141で行われる処理の流れを示すフローチャートである。
まずリアルUマップにおける島の位置、幅と最小視差から、視差画像に対するx軸方向の探索範囲を設定する(ステップS161)。
FIG. 48 is a flowchart showing a flow of processing performed by the corresponding
First, the search range in the x-axis direction with respect to the parallax image is set based on the position, width and minimum parallax of the island in the real U map (step S161).
次に島の最大視差dmaxと路面高さの関係から、視差画像に対するy軸方向の最大探索値ymaxを設定する(ステップS162)。次にリアル高さUマップにおける島の最大高さ、及びステップS172で設定したymaxとdmaxとから、視差画像に対するy軸方向の最小探索値yminを求めて設定することで、視差画像に対するy軸方向の探索範囲を設定する(ステップS163)。 Next, from the relationship between the maximum parallax dmax of the island and the road height, the maximum search value ymax in the y-axis direction with respect to the parallax image is set (step S162). Next, the minimum search value ymin in the y-axis direction for the parallax image is obtained and set from the maximum height of the island in the real height U map and the ymax and dmax set in step S172, thereby the y-axis for the parallax image The search range of the direction is set (step S163).
次いで設定した探索範囲で視差画像を探索して、島の最小視差dmin,最大視差dmaxの範囲内にある画素を抽出し、オブジェクト候補画素とする(ステップS164)。そのオブジェクト候補画素が横方向に一定以上の割合にあるとき、そのラインをオブジェクト候補ラインとして抽出する(ステップS165)。 Next, the parallax image is searched in the set search range, and pixels in the range of the minimum parallax dmin of the island and the maximum parallax dmax are extracted, and are set as object candidate pixels (step S164). When the object candidate pixel is in the horizontal direction at a certain ratio or more, the line is extracted as an object candidate line (step S165).
オブジェクト候補ラインの密度を計算して、密度が所定の値より大きい場合はそのラインをオブジェクトラインと決定する(ステップS166)。最後にオブジェクトライン群の外接矩形を視差画像内のオブジェクト領域として検出する(ステップS167)。 The density of the object candidate line is calculated, and if the density is larger than a predetermined value, the line is determined as an object line (step S166). Finally, a circumscribed rectangle of the object line group is detected as an object area in the parallax image (step S167).
《オブジェクトタイプ分類》
次に、オブジェクトタイプ分類部142について説明する。
前記オブジェクト領域抽出部141で抽出されるオブジェクト領域の高さ(yomax−yomin)から、下記の式〔5〕より、そのオブジェクト領域に対応する画像領域に映し出されている識別対象物(オブジェクト)の実際の高さHoを計算できる。ただし、「zo」は、当該オブジェクト領域内の最小視差値dから計算される当該オブジェクト領域に対応するオブジェクトと自車両との距離であり、「f」はカメラの焦点距離を(yomax−yomin)の単位と同じ単位に変換した値である。
Ho=zo×(yomax−yomin)/f …式〔5〕
Object type classification
Next, the object
From the height (yomax-yomin) of the object area extracted by the object
Ho = zo × (yomax−yomin) / f formula [5]
同様に、オブジェクト領域抽出部141で抽出されるオブジェクト領域の幅(xomax−xomin)から、下記の式〔6〕より、そのオブジェクト領域に対応する画像領域に映し出されている識別対象物(オブジェクト)の実際の幅Woを計算できる。
Wo=zo×(xomax−xomin)/f …式〔6〕
Similarly, from the width (xomax−xomin) of the object area extracted by the object
Wo = zo × (xomax−xomin) / f formula [6]
また、当該オブジェクト領域に対応する画像領域に映し出されている識別対象物(オブジェクト)の奥行きDoは、当該オブジェクト領域に対応した孤立領域内の最大視差値dmaxと最小視差値dminから、下記の式〔7〕より計算することができる。
Do=BF×{(1/(dmin−offset)−1/(dmax−offset)} …式〔7〕
Further, the depth Do of the identification target (object) displayed in the image area corresponding to the object area is expressed by the following equation from the maximum parallax value dmax and the minimum parallax value dmin in the isolated area corresponding to the object area It can be calculated from [7].
Do = BF × {(1 / (dmin−offset) −1 / (dmax−offset)) ... Formula [7]
オブジェクトタイプ分類部142は、このようにして計算できるオブジェクト領域に対応するオブジェクトの高さ、幅、奥行きの情報から、そのオブジェクトタイプの分類を行う。図49に示す表は、オブジェクトタイプの分類を行うためのテーブルデータの一例を示すものである。これによれば、自車両前方に存在する識別対象物(オブジェクト)が、歩行者なのか、自転車なのか、小型車なのか、トラックなどか等を区別して認識することが可能となる。
The object
《3次元位置決定》
次に、3次元位置決定部143について説明する。
検出されたオブジェクト領域に対応するオブジェクトまでの距離や、視差画像の画像中心と視差画像上のオブジェクト領域の中心との画像上の距離も把握されることから、オブジェクトの3次元位置を決定することができる。
Three-dimensional position determination
Next, the three-dimensional
Since the distance to the object corresponding to the detected object region and the distance on the image between the image center of the parallax image and the center of the object region on the parallax image are also grasped, the three-dimensional position of the object is determined. Can.
視差画像上のオブジェクト領域の中心座標を(region_centerX,region_centerY)とし、視差画像の画像中心座標を(image_centerX,image_centerY)としたとき、識別対象物(オブジェクト)の撮像部110a,110bに対する相対的な横方向位置および高さ方向位置は、下記の式〔8〕及び式〔9〕より計算できる。
Xo=Z×(region_centerX−image_centerX)/f …式〔8〕
Yo=Z×(region_centerY−image_centerY)/f …式〔9〕
Assuming that the center coordinates of the object region on the parallax image are (region_centerX, region_centerY) and the image center coordinates of the parallax image are (image_centerX, image_centerY), the relative lateral to the
Xo = Z × (region_center X-image_center X) / f equation (8)
Yo = Z × (region_centerY−image_centerY) / f equation (9)
《ガードレール検出》
次にガードレール検出部144について説明する。
図50は、ガードレール検出部144で行われるガードレール検出処理の流れを示すフローチャートであり、図51は、ガードレール検出処理の対象範囲について直線近似処理して得られた近似直線を表したUマップを示す図である。また、図52は、直線近似処理して得られた直線からガードレール候補座標を検出するための処理について説明するための図である。
<< guard rail detection >>
Next, the
FIG. 50 is a flow chart showing a flow of guardrail detection processing performed by the
路面の側方などに設置される側壁やガードレールは、一般に、路面から30〜100cmの範囲内に存在するので、ガードレール検出処理の対象範囲として、この範囲に対応するUマップ内の領域を選定する。その後、この対象範囲について、Uマップの頻度に重み付けを行い、Hough(ハフ)変換して(ステップS171)、図51に示すような近似直線L1,L2を検出する(ステップS172)。この近似直線L1,L2において、視差が大きい方の端点は画像の境界とし、視差が小さい方の端点は距離換算で例えば30mの距離に相当する視差値とする。なお、Hough変換により直線が見つからなかった場合は、ガードレールは検出されない。 Sidewalls and guardrails installed on the side of the road surface, etc. generally exist within a range of 30 to 100 cm from the road surface, so select a region in the U map corresponding to this range as a target range for guardrail detection processing. . Thereafter, the frequency of the U map is weighted for this target range, Hough conversion is performed (step S171), and approximate straight lines L1 and L2 as shown in FIG. 51 are detected (step S172). In the approximate straight lines L1 and L2, an end point with a larger parallax is a boundary of the image, and an end point with a smaller parallax is a parallax value equivalent to a distance of, for example, 30 m in distance conversion. If no straight line is found by the Hough transform, no guardrail is detected.
このような近似直線が得られたら、次に、図52に示すように、近似直線上L1の座標位置を中心とした周囲の領域(たとえば5×5領域611)について、頻度値の総和が所定の閾値を超えている座標位置を、左ガードレールの視差マップ612からガードレール候補座標613として検出する(ステップS173)。このようにして検出されるガードレール候補座標613の間隔が所定の距離以下である場合には、それらのガードレール候補座標613をつないでガードレール線分614として決定する(ステップS174)。
When such an approximate straight line is obtained, next, as shown in FIG. 52, the sum of the frequency values is predetermined for the surrounding area (for example, 5 × 5 area 611) centered on the coordinate position of L1 on the approximate straight line. A coordinate position exceeding the threshold of is detected as a guardrail candidate coordinate 613 from the
その後、このようにして得られ得るガードレール線分の最小X座標xminと最大X座標xmaxにそれぞれ対応する視差値d1,d2を、検出した近似直線の式から算出する。このとき、上述した路面形状検出部135で算出したyとdの近似直線より、該当する視差d1,d2における路面座標(y1,y2)が決定される。ガードレールは、路面の高さから30cm以上1m以下の範囲としているので、前記式〔2〕を利用し、視差画像上でのガードレールの高さ(30cmと1m)として、yg1_30、yg1_100、yg2_30、yg2_100が決定される。
After that, the parallax values d1 and d2 respectively corresponding to the minimum X coordinate x min and the maximum X coordinate x max of the guardrail line segment obtained as described above are calculated from the equation of the detected approximate straight line. At this time, the road surface coordinates (y1, y2) in the corresponding parallaxes d1, d2 are determined from the approximate straight line of y and d calculated by the road surface
図53は、図17に示す視差画像上にガードレール検出部144で検出されたガードレール領域を重畳した図である。
視差画像上でのガードレール領域471は、(xgmin,yg1_30)、(xgmin、yg1_100)、(xgmax、yg2_100)、(xgmax_yg2_30)の4点で囲まれる領域(図中に網掛けした領域)となる。なお、ここでは左側のガードレールについて説明したが、右側のガードレールについても同様に検出できる。
FIG. 53 is a diagram in which the guardrail area detected by the
The guardrail area 471 on the parallax image is an area (shaded area in the drawing) surrounded by four points of (xgmin, yg1_30), (xgmin, yg1_100), (xgmax, yg2_100), and (xgmax_yg2_30). In addition, although the guard rail on the left side was demonstrated here, it can detect similarly about the guard rail on the right side.
《消失点情報》
次に、Vマップ生成部134における処理に用いる消失点情報について説明する。
消失点情報は、路面の消失点に対応する画像上の位置座標を示す情報である。この消失点情報は、撮像画像上に映し出される路面上の白線や車両動作情報などから特定することができる。
<< Losing point information >>
Next, vanishing point information used for processing in the V
The vanishing point information is information indicating position coordinates on the image corresponding to the vanishing point of the road surface. The vanishing point information can be identified from white lines on the road surface, vehicle operation information, and the like displayed on the captured image.
図54は、自車両の前輪の舵角から消失点の画像左右方向位置Vxを検出する原理を示す説明図であり、図55は、自車両のヨーレート及び車速から消失点の画像左右方向位置Vxを検出する原理を示す説明図である。また、図56は、自車両の加速時や減速時に消失点の画像上下方向位置Vyが変化することを示す説明図である。 FIG. 54 is an explanatory view showing the principle of detecting the image left-right direction position Vx of the vanishing point from the steering angle of the front wheel of the vehicle, and FIG. 55 shows the image left-right direction position Vx of the vanishing point from the yaw rate and vehicle speed of the vehicle. It is explanatory drawing which shows the principle which detects. FIG. 56 is an explanatory view showing that the image vertical direction position Vy of the vanishing point changes at the time of acceleration or deceleration of the host vehicle.
例えば、自車両100の前輪の舵角θが車両動作情報として取得できる場合には、図54に示すように、その舵角θから消失点の画像左右方向位置Vxを検出することが可能である。即ち、カメラレンズから距離Lだけ離れた位置におけるカメラからの水平方向への位置ズレ量は、L×tanθから求めることができる。従って、画像センサ上の水平方向位置ズレ量をΔxは、カメラの焦点距離をfとし、画像センサの画素サイズをpixelsizeとすると、下記の式〔10〕から求めることができる。この式〔10〕を用いることにより、画像センサのX方向サイズをxsizeとすると、消失点のX座標Vxは、下記の式〔11〕から求めることができる。
Δx=f×tanθ/pixelsize …式〔10〕
Vx=xsize/2+Δx …式〔11〕
For example, when the steering angle θ of the front wheel of the
Δx = f × tan θ / pixelsize ... Formula [10]
Vx = xsize / 2 + Δx formula [11]
また、例えば、自車両100のヨーレート(回転角速度)ωと、車速vが車両動作情報として取得できる場合には、図55に示すように、そのヨーレートωと車速vとを用いて消失点の画像左右方向位置Vxを検出することが可能である。即ち、自車両100が距離Lだけ進んだときに想定される水平位置のズレ量は、自車両100の回転半径r(r=L/θ)と回転角とから、(1−cosθ)となる。従って、画像センサ上の水平方向位置ズレ量Δxは、下記の式〔12〕から求めることができる。この式〔12〕を用いて得られるΔxを用いて、消失点のX座標Vxは、前記の式〔11〕から求めることができる。このときの距離Lは、例えば100mと設定する。
Δx=±(1−cosθ)×f×r/L/pixelsize …式〔12〕
Also, for example, when the yaw rate (rotational angular velocity) ω of the
Δx = ± (1−cos θ) × f × r / L / pixelsize ... Formula [12]
このようにして求まる消失点のX座標Vxが画像外を示すものとなった場合、消失点情報のX座標Vxとして、画像端部を設定する。 When the X coordinate Vx of the vanishing point obtained in this manner indicates the outside of the image, the image end is set as the X coordinate Vx of the vanishing point information.
一方、消失点のY座標Vyについては、直前の処理によって求めた路面の近似直線の切片から求めることができる。消失点のY座標Vyは、Vマップ上において、上述した処理によって求まる路面の近似直線の切片に対応している。従って、直前の処理によって求めた路面の近似直線の切片をそのまま消失点のY座標Vyとして決定してもよい。 On the other hand, the Y coordinate Vy of the vanishing point can be obtained from the intercept of the approximate straight line of the road surface obtained by the immediately preceding process. The Y coordinate Vy of the vanishing point corresponds to the intercept of the approximate straight line of the road surface obtained by the above-described processing on the V map. Therefore, the intercept of the approximate straight line of the road surface obtained by the immediately preceding process may be determined as the Y coordinate Vy of the vanishing point as it is.
ただし、自車両100が加速している時には、自車両後方部分が加重され、自車両100の姿勢は、自車両前方が鉛直方向上側を向くような姿勢となる。この姿勢変化により、加速時における路面の近似直線は、図56に示すように、等速時における路面の近似直線よりもVマップ上において下側へシフトしたものとなる。逆に、減速時における路面の近似直線は、図56に示すように、等速時における路面の近似直線よりもVマップ上において上側へシフトしたものとなる。従って、直前の処理によって求めた路面の近似直線の切片を、車速前後方向における加速度情報(車両動作情報)によって補正したものを、消失点のY座標Vyとして決定するのが好ましい。
However, when the
〔変形例1〕
次に、前記実施形態についての他の変形例(以下「変形例1」という。)について説明する。
前記実施形態においては、自車両進行方向における路面の高さ変化(自車両進行方向における路面の起伏)を把握することはできるが、路面幅方向における路面高さの違い(路面幅方向における路面の傾斜)を把握することはできない。本変形例1では、路面幅方向における路面の傾斜を把握することができる例について説明する。
[Modification 1]
Next, another modified example (hereinafter referred to as “modified example 1”) of the embodiment will be described.
In the above embodiment, although it is possible to grasp the change in the height of the road surface in the traveling direction of the host vehicle (the ups and downs of the road surface in the traveling direction of the host vehicle), the difference in road height in the road surface width direction (the road surface in the road surface width direction Can not understand the slope). In the first modification, an example in which the inclination of the road surface in the road surface width direction can be grasped will be described.
図57は、本変形例1における主要な処理の流れを示すフローチャートであり、図58は、路面の消失点と視差画像の下端中心とを結ぶ直線を境界にして左右に二分割した視差画像の例を示す説明図である。また、図59は、消失点と視差画像左下点とを結ぶ直線L3と、消失点と視差画像右下点とを結ぶ直線L4とを設定した視差画像の例を示す説明図であり、図60は、図59の視差画像に対して、ひとつの画像走査ラインL5を設定したときの説明図である。また、図61は、2つの直線L3,L4と画像走査ラインとの両交点以外の画像走査ライン上の視差値を線形補間したときの説明図である。 FIG. 57 is a flowchart showing the flow of the main processing in the first modification, and FIG. 58 is a parallax image divided into two on the left and right with a straight line connecting the vanishing point of the road surface and the bottom center of the parallax image as a boundary. It is explanatory drawing which shows an example. FIG. 59 is an explanatory view showing an example of a parallax image in which a straight line L3 connecting the vanishing point and the parallax image lower left point and a straight line L4 connecting the vanishing point and the parallax image lower right point are set. These are explanatory drawings when one image scanning line L5 is set with respect to the parallax image of FIG. Further, FIG. 61 is an explanatory diagram when the parallax values on the image scanning line other than the intersections of the two straight lines L3 and L4 and the image scanning line are linearly interpolated.
まず、前記実施形態と同様、図58に示すように、路面の消失点(Vx,Vy)が示す消失点の画像上下方向位置Vyから所定のoffset値を引いた画像上下方向位置(Vy−offset値)の地点Wと、図58中に示したABCDの各点で囲まれた領域を設定する。そして、図58に示すように、視差画像上において、路面の消失点(Vx,Vy)と視差画像の下端中心M(xsize/2,ysize)とを結ぶ直線を分割境界にして、WABCDの各点で囲まれた領域を、WABMの各点で囲まれた左領域と、WMCDの各点で囲まれた右領域とに左右二分割して、各領域をそれぞれ路面画像候補領域として設定する。その後、各路面画像候補領域に対し、それぞれ個別に上述した実施形態の方法でVマップを作成する(ステップS181)。このようにして視差画像上の路面画像候補領域を複数の領域に分割して各領域について個別に作成した部分的なVマップを組み合わせたものを、多重Vマップという。 First, as shown in FIG. 58, the image vertical direction position (Vy-offset) obtained by subtracting a predetermined offset value from the image vertical direction position Vy of the vanishing point indicated by the vanishing point (Vx, Vy) of the road surface. An area surrounded by point W of the value) and each point of ABCD shown in FIG. 58 is set. Then, as shown in FIG. 58, in the parallax image, each straight line connecting the vanishing point (Vx, Vy) of the road surface and the bottom center M (xsize / 2, ysize) of the parallax image is a division boundary. The area surrounded by the points is divided into left and right areas divided into the left area surrounded by the points of the WABM and the right area surrounded by the points of the WMCD, and each area is set as a road surface image candidate area. Thereafter, for each road surface image candidate area, a V map is created individually by the method of the embodiment described above (step S181). A combination of partial V maps separately generated for each area by dividing the road surface image candidate area on the parallax image into a plurality of areas in this manner is called a multiplexed V map.
その後、それぞれの領域のVマップから、領域ごとに、上述した実施形態の方法で路面に対応する区分近似直線を得る。また、図59に示すように、消失点V(Vx,Vy)と同じy座標を持つ地点P(xsize/3,Vy)と地点B(0,ysize)とを結ぶ直線L3を作成する。また、消失点V(Vx,Vy)と同じy座標を持つ他の地点Q(xsize×2/
3,Vy)と地点C(xsize,ysize)とを結ぶ直線L4を作成する。そして、それぞれの直線上における点(x,y)に対し、左右の領域についてそれぞれ得た区分近似直線上の点(y,d)を関連付け、(x,y,d)の関係を作成する(ステップS182)。これにより、図59に示す左右の直線L3,L4上における路面の高さを決定することができる(ステップS183)。
Thereafter, from the V map of each area, a section approximation straight line corresponding to the road surface is obtained for each area by the method of the above-described embodiment. Further, as shown in FIG. 59, a straight line L3 connecting point P (xsize / 3, Vy) and point B (0, ysize) having the same y coordinate as vanishing point V (Vx, Vy) is created. Also, another point Q (xsize × 2 /) having the same y-coordinate as the vanishing point V (Vx, Vy)
A straight line L4 connecting 3, Vy) and a point C (xsize, ysize) is created. Then, with respect to the point (x, y) on each straight line, the point (y, d) on the segment approximation straight line obtained for each of the left and right areas is associated to create the relationship of (x, y, d) Step S182). Thus, the height of the road surface on the left and right straight lines L3 and L4 shown in FIG. 59 can be determined (step S183).
なお、地点P,QのX座標を消失点VのX座標と同じ位置にすると、地点Pと地点Qとの間の路面高さが異なるときに、その地点で路面高さの急激な変化が生じ、不具合が起こす。逆に、地点P,QとのX方向距離が離れすぎると、路面の実情(画像内では路面が遠くに行くほど狭くなる)と整合しない。本変形例1においては、これらを考慮して、地点P,QのX座標は、それぞれ、xsize/3、ysize×2/3としている。 If the X coordinates of the points P and Q are the same as the X coordinates of the vanishing point V, when the road height between the points P and Q is different, the road height suddenly changes at that point. The problem occurs. Conversely, if the X-direction distance from the points P and Q is too far, it does not match the actual condition of the road surface (in the image, the road surface becomes narrower as it goes farther). In the first modification, taking these into consideration, the X coordinates of the points P and Q are xsize / 3 and ysize × 2/3, respectively.
次に、図59に示した左右の直線L3,L4以外の路面の高さを決定する。まず、図60に示すように、ひとつの画像走査ライン(視差画像X軸方向ライン)L5を設定する。この画像走査ラインL5と左の直線L3との交点を(xL,y,dL)とし、この画像走査ラインL5と右の直線L4との交点を(xR,y,dR)とする。画像走査ラインL5上における両交点の間の視差値は、図61に示すように線形補間するとともに、画像走査ラインL5上における両交点の左右外側の視差値は、それぞれの交点における視差値dR,dLと同じ視差値を割り当てる。これにより、路面幅方向に路面が傾斜している場合についても、その傾斜を反映させた路面形状を検出することができる(ステップS172,S173)。なお、画像走査ラインL5の開始端は地点Bと地点Cとを通るラインであり、終端は地点Pと地点Qとを通るラインである。 Next, the heights of the road surfaces other than the left and right straight lines L3 and L4 shown in FIG. 59 are determined. First, as shown in FIG. 60, one image scanning line (parallax image X axis direction line) L5 is set. The intersection of the image scanning line L5 and the left straight line L3 is (xL, y, dL), and the intersection of the image scanning line L5 and the right straight line L4 is (xR, y, dR). The parallax value between both the intersections on the image scanning line L5 is linearly interpolated as shown in FIG. 61, and the parallax values on the outer left and right of both the intersections on the image scanning line L5 are the parallax values dR, Assign the same disparity value as dL. Thereby, also in the case where the road surface is inclined in the road surface width direction, it is possible to detect the road surface shape reflecting the inclination (steps S172 and S173). The start end of the image scanning line L5 is a line passing through the point B and the point C, and the end is a line passing through the point P and the point Q.
〔変形例2〕
次に、前記実施形態についての他の変形例(以下「変形例2」という。)について説明する。
実際の路面の中には、路面の排水を良くするために路面の幅方向中央部分が高くなっているかまぼこ型の形状を示す路面がある。このような路面については、前記変形例1の場合には、路面幅方向における路面傾斜を適切に検出することができない。本変形例2においては、前記変形例1よりもより高精度に路面幅方向における路面傾斜を把握することができるものである。
[Modification 2]
Next, another modified example (hereinafter referred to as "modified example 2") of the embodiment will be described.
Among the actual road surfaces, there is a road surface exhibiting a semi-cylindrical shape in which the central portion in the width direction of the road surface is raised to improve drainage of the road surface. For such a road surface, in the case of the first modification, the road surface inclination in the road surface width direction can not be appropriately detected. In the second modification, it is possible to grasp the road surface inclination in the road surface width direction with higher accuracy than the first modification.
図62は、変形例2において、路面の消失点と視差画像の左1/4の下端地点とを結ぶ直線L6と、路面の消失点と視差画像の右1/4の下端地点とを結ぶ直線L7とを境界にして左右に三分割した視差画像の例を示す説明図である。また、図63は、図62の視差画像に対し、ひとつの画像走査ラインL5を設定したときの説明図であり、図64は、3つの直線L3,L4,L8と画像走査ラインとの両交点以外の画像走査ライン上の視差値を線形補間したときの説明図である。 62, in the second modification, a straight line L6 connecting the vanishing point of the road surface and the lower end point of the left 1⁄4 of the parallax image, and a straight line connecting the vanishing point of the road surface and the lower end point of the right 1⁄4 of the parallax image It is explanatory drawing which shows the example of the parallax image divided into three right and left by making a boundary with L7. Further, FIG. 63 is an explanatory diagram when one image scanning line L5 is set for the parallax image of FIG. 62, and FIG. 64 is a cross point of both straight lines L3, L4 and L8 and the image scanning line. FIG. 16 is an explanatory diagram when linearly interpolating parallax values on image scanning lines other than the above;
具体的に説明すると、図62に示すように、視差画像上において、視差画像の下端を4等分したときの画像左側1/4の地点L(xsize/4,ysize)と地点Wとを結ぶ直線L6を設定するとともに、画像右側1/4の地点R(3/4×xsize,ysize)と地点Wとを結ぶ直線L7を設定する。本変形例2では、これらの直線L6,L7を境界にして、WABCDの各点で囲まれた領域を、WABLの各点で囲まれた左領域と、WLRの各点で囲まれた中央領域と、WRCDの各点で囲まれた右領域とに、三分割して、各領域をそれぞれ路面画像候補領域として設定する。その後、各路面画像候補領域に対し、それぞれ個別に上述した実施形態の方法でVマップを作成する。その後、それぞれの領域のVマップから、領域ごとに、上述した実施形態の方法で路面に対応する区分近似直線を得る。
Specifically, as shown in FIG. 62, on the parallax image, a point L (xsize / 4, ysize) on the
また、図63に示すように、本変形例2においては、前記変形例1の場合と同様に、地点P(xsize/3,Vy)と地点B(0,ysize)とを結ぶ直線L3を作成するとともに、地点Q(xsize×2/3,Vy)と地点C(xsize,ysize)とを結ぶ直線L4を作成するほか、新たに、路面の消失点Vと視差画像の下端中心M(xsize/2,ysize)とを結ぶ直線L8を作成する。そして、それぞれの直線上における点(x,y)に対し、先に求めた3つの領域についてそれぞれ得た区分近似直線上の点(y,d)を関連付け、(x,y,d)の関係を作成する。これにより、図63に示す3つの直線L3,L4,L8上における路面の高さを決定することができる。 Further, as shown in FIG. 63, in the second modification, as in the case of the first modification, a straight line L3 connecting the point P (xsize / 3, Vy) and the point B (0, ysize) is created. In addition to creating a straight line L4 connecting the point Q (xsize × 2/3, Vy) and the point C (xsize, ysize), newly, the vanishing point V of the road surface and the bottom center M (xsize / of parallax image) 2. Create a straight line L8 connecting with (2, ysize). Then, with respect to the point (x, y) on each straight line, the point (y, d) on the piecewise approximate straight line obtained for each of the three regions previously obtained is associated, and the relationship of (x, y, d) Create Thus, the height of the road surface on the three straight lines L3, L4 and L8 shown in FIG. 63 can be determined.
次に、図63に示した3つの直線L3,L4,L8以外の路面の高さを決定する。まず、前記変形例1と同様、図63に示すように、ひとつの画像走査ライン(視差画像X軸方向ライン)L5を設定する。この画像走査ラインL5と左の直線L3との交点を(xL,y,dL)とし、この画像走査ラインL5と右の直線L4との交点を(xR,y,dR)とし、この画像走査ラインL5と中央の直線L8との交点を(xM,y,dM)とする。画像走査ラインL5上における各交点の間の視差値は、図64に示すように線形補間するとともに、画像走査ラインL5上における左右の交点の左右外側の視差値は、それぞれの左右交点における視差値dR,dLと同じ視差値を割り当てる。これにより、路面幅方向に路面がかまぼこ形状に傾斜している場合についても、その傾斜を反映させた路面形状を検出することができる。 Next, the heights of the road surfaces other than the three straight lines L3, L4 and L8 shown in FIG. 63 are determined. First, as in the first modification, as shown in FIG. 63, one image scanning line (parallax image X axis direction line) L5 is set. The intersection of the image scanning line L5 and the left straight line L3 is (xL, y, dL), and the intersection of the image scanning line L5 and the right straight line L4 is (xR, y, dR). Let the intersection of L5 and the central straight line L8 be (xM, y, dM). The parallax values between the respective intersections on the image scanning line L5 are linearly interpolated as shown in FIG. 64, and the parallax values at the left and right outsides of the left and right intersections on the image scanning line L5 are the parallax values at the respective left and right intersections Assign the same disparity value as dR and dL. Thus, even in the case where the road surface is inclined in a semicylindrical shape in the road surface width direction, the road surface shape reflecting the inclination can be detected.
このように路面高さを三つの区分近似直線を用いて近似することでさらに路面高さの近似精度を向上させることができる。なお、この破線で示した直線は固定ではなく、道路状況に応じて設定することにしてもかまわない。即ち、例えば図65に示すように、ガードレールの下端としたり、白線の上に設定したりすることで少なくとも破線の上では、より正確な3次元路面高さを検出することができる。 The approximation accuracy of the road surface height can be further improved by approximating the road surface height using the three segment approximation straight lines in this way. The straight line indicated by the broken line is not fixed, and may be set according to the road condition. That is, as shown in FIG. 65, for example, by setting the lower end of the guardrail or setting it on a white line, it is possible to detect more accurate three-dimensional road surface height at least on the broken line.
なお、変形例1及び変形例2は、視差画像をそれぞれ二分割、三分割する例を示しているが、同様の構成で視差画像の分割数を増やすことで、より精確な路面の形状の検出が可能となる。
In addition, although the
以上のように、本実施形態においては、路面高さ(自車両進行方向における路面の起伏や路面幅方向における路面傾斜など)を高い精度で検出することができる。路面高さの検出精度が高ければ、路面の高さを利用して検出するオブジェクトの検出精度も向上し、歩行者や他車両などのオブジェクト分類の精度も向上する結果、オブジェクトへの衝突回避の確率を向上させ、道路交通の安全に貢献することが可能である。 As described above, in the present embodiment, it is possible to detect the road surface height (such as the unevenness of the road surface in the traveling direction of the host vehicle and the road surface inclination in the road surface width direction) with high accuracy. If the detection accuracy of the road surface height is high, the detection accuracy of the object detected by using the height of the road surface is also improved, and the accuracy of the object classification of pedestrians and other vehicles is also improved. It is possible to improve the probability and contribute to the safety of road traffic.
11…マップ生成手段、12…オブジェクト候補領域検出手段、12a…孤立領域検出手段、12b…周辺領域除去手段、12d…孤立領域分割手段、12d1…横方向分割手段、12d2…移動方向分割手段、13…立体物検出手段、100…自車両、104…車両走行制御ユニット、110a,110b…撮像部、132…視差画像生成部、135…路面形状検出部、138…リアルUマップ生成部、139…オブジェクト候補領域検出部。 11: Map generation means, 12: Object candidate area detection means, 12a: Isolated area detection means, 12b: Peripheral area removal means, 12d: Isolated area division means, 12d1: Horizontal direction division means, 12d2: Movement direction division means, 13 ... 3D object detection means, 100 ... own vehicle, 104 ... vehicle travel control unit, 110a, 110b ... imaging unit, 132 ... parallax image generation unit, 135 ... road surface shape detection unit, 138 ... real U map generation unit, 139 ... object Candidate area detection unit.
Claims (10)
前記視差画像に基づいて、前記移動方向に対する横方向の距離と前記移動方向の距離とを関連付けた視差値の頻度分布を表すマップを生成するマップ生成手段と、
前記頻度分布に基づいて孤立領域を検出する孤立領域検出手段と、
前記孤立領域内の前記頻度分布に基づいて、前記孤立領域を分割する孤立領域分割手段と、
前記分割された孤立領域に基づいて立体物を検出する立体物検出手段と、
を有する立体物検出装置。 Based on a plurality of captured images obtained by capturing an image of the front of the moving direction of the moving object by a plurality of imaging units mounted on the moving object and a parallax image generated from the captured image, the image exists in front of the moving direction. A three-dimensional object detection device for detecting a three-dimensional object, comprising
Map generation means for generating a map representing a frequency distribution of parallax values in which the distance in the lateral direction with respect to the movement direction is associated with the distance in the movement direction based on the parallax image;
Isolated area detection means for detecting an isolated area based on the frequency distribution;
An isolated area dividing unit that divides the isolated area based on the frequency distribution in the isolated area;
A three-dimensional object detection means for detecting a three-dimensional object based on the divided isolated region;
Three-dimensional object detection device having.
前記孤立領域分割手段は、前記孤立領域の前記移動方向の長さが所定の値より長い場合、前記孤立領域を前記移動方向に分割する移動方向分割手段を有する、立体物検出装置。 In the three-dimensional object detection device according to claim 1,
The three-dimensional object detection device, wherein the isolated area dividing means includes moving direction dividing means that divides the isolated area in the moving direction when the length of the moving area in the moving area is longer than a predetermined value.
前記孤立領域分割手段は、前記孤立領域の前記横方向の長さが所定の値より長い場合、前記孤立領域を前記横方向に分割する横方向分割手段を有する、立体物検出装置。 In the three-dimensional object detection device according to claim 1 or 2,
The three-dimensional object detection device, wherein the isolated area dividing unit includes a horizontal direction dividing unit that divides the isolated area in the lateral direction when the horizontal length of the isolated area is longer than a predetermined value.
前記移動方向分割手段は、前記孤立領域の前記移動方向の長さが前記移動方向の距離に応じて設定された長さより長い場合に、前記頻度分布に基づいて前記孤立領域内の立体物の実幅を推定し、その実幅と視差値とから前記孤立領域を分割する位置を決定する、立体物検出装置。 In the three-dimensional object detection device according to claim 2,
The moving direction dividing means is configured to determine the actual size of the three-dimensional object in the isolated area based on the frequency distribution, when the length in the moving direction of the isolated area is longer than the length set in accordance with the distance in the moving direction. A three-dimensional object detection device which estimates a width and determines a position at which the isolated region is divided from the actual width and a parallax value.
前記マップ生成手段は、前記視差値の高さ分布を表すマップを生成し、
前記横方向分割手段は、前記孤立領域内の前記頻度分布と高さ分布の積を前記移動方向に加算した値に基づいて、前記孤立領域を分割する位置を決定する、立体物検出装置。 In the three-dimensional object detection device according to claim 3,
The map generation unit generates a map representing a height distribution of the disparity value,
The three-dimensional object detection device according to claim 1, wherein the horizontal direction dividing means determines a position at which the isolated area is divided, based on a value obtained by adding the product of the frequency distribution and the height distribution in the isolated area to the moving direction.
前記マップ生成手段は、前記視差値の高さ分布を表すマップを生成し、
前記孤立領域分割手段は、孤立領域内の周辺部の高さの低い部分を除去する周辺領域除去手段を有する、立体物検出装置。 In the three-dimensional object detection device according to any one of claims 1 to 3,
The map generation unit generates a map representing a height distribution of the disparity value,
The three-dimensional object detection device, wherein the isolated area dividing means includes peripheral area removing means for removing a low height portion of the peripheral portion in the isolated area.
前記移動方向分割手段は、前記孤立領域内の頻度を前記横方向に加算して、最大値を得る移動方向の位置を検出する手段と、前記検出された位置での連続した頻度の最大長を前記立体物の実幅と推定する手段と、を有する、立体物検出装置。 In the three-dimensional object detection device according to claim 4,
The moving direction dividing means adds the frequency in the isolated area in the lateral direction to detect the position in the moving direction to obtain the maximum value, and the maximum length of the continuous frequency at the detected position And a means for estimating the actual width of the three-dimensional object.
前記視差画像に基づいて、前記移動方向に対する横方向の距離と前記移動方向の距離とを関連付けた視差値の頻度分布を表すマップを生成する工程と、
前記頻度分布に基づいて孤立領域を検出する工程と、
前記孤立領域内の前記頻度分布に基づいて、前記孤立領域を分割する工程と、
前記分割された孤立領域に基づいて立体物を検出する工程と、
を有する立体物検出方法。 Based on a plurality of captured images obtained by capturing an image of the front of the moving direction of the moving object by a plurality of imaging units mounted on the moving object and a parallax image generated from the captured image, the image exists in front of the moving direction. A three-dimensional object detection method implemented by a three-dimensional object detection device for detecting a three-dimensional object, comprising:
Generating a map representing a frequency distribution of disparity values in which a distance in a lateral direction with respect to the moving direction and a distance in the moving direction are associated based on the parallax image;
Detecting an isolated area based on the frequency distribution;
Dividing the isolated area based on the frequency distribution in the isolated area;
Detecting a three-dimensional object based on the divided isolated area;
A three-dimensional object detection method having
前記立体物検出手段の処理結果に基づいて、前記移動体に搭載された所定の機器を制御する移動体機器制御手段と、を有する移動体機器制御システムであって、
前記立体物検出手段として、請求項1乃至7のいずれかに記載された立体物検出装置を用いる、移動体機器制御システム。
Based on a plurality of captured images obtained by capturing an image of the front of the moving direction of the moving object by a plurality of imaging units mounted on the moving object and a parallax image generated from the captured image, the image exists in front of the moving direction. A three-dimensional object detection means for detecting a three-dimensional object;
A mobile device control system comprising: mobile device control means for controlling a predetermined device mounted on the mobile body based on the processing result of the three-dimensional object detection means,
A mobile device control system using the three-dimensional object detection device according to any one of claims 1 to 7 as the three-dimensional object detection means.
Priority Applications (2)
| Application Number | Priority Date | Filing Date | Title |
|---|---|---|---|
| JP2015062340A JP6519262B2 (en) | 2014-04-10 | 2015-03-25 | Three-dimensional object detection device, three-dimensional object detection method, three-dimensional object detection program, and mobile device control system |
| US14/682,496 US9330320B2 (en) | 2014-04-10 | 2015-04-09 | Object detection apparatus, object detection method, object detection program and device control system for moveable apparatus |
Applications Claiming Priority (3)
| Application Number | Priority Date | Filing Date | Title |
|---|---|---|---|
| JP2014081390 | 2014-04-10 | ||
| JP2014081390 | 2014-04-10 | ||
| JP2015062340A JP6519262B2 (en) | 2014-04-10 | 2015-03-25 | Three-dimensional object detection device, three-dimensional object detection method, three-dimensional object detection program, and mobile device control system |
Publications (2)
| Publication Number | Publication Date |
|---|---|
| JP2015207281A JP2015207281A (en) | 2015-11-19 |
| JP6519262B2 true JP6519262B2 (en) | 2019-05-29 |
Family
ID=54265316
Family Applications (1)
| Application Number | Title | Priority Date | Filing Date |
|---|---|---|---|
| JP2015062340A Active JP6519262B2 (en) | 2014-04-10 | 2015-03-25 | Three-dimensional object detection device, three-dimensional object detection method, three-dimensional object detection program, and mobile device control system |
Country Status (2)
| Country | Link |
|---|---|
| US (1) | US9330320B2 (en) |
| JP (1) | JP6519262B2 (en) |
Families Citing this family (61)
| Publication number | Priority date | Publication date | Assignee | Title |
|---|---|---|---|---|
| US9830518B2 (en) * | 2012-08-30 | 2017-11-28 | Honda Motor Co., Ltd. | Lane mark recognition device |
| JP6519262B2 (en) * | 2014-04-10 | 2019-05-29 | 株式会社リコー | Three-dimensional object detection device, three-dimensional object detection method, three-dimensional object detection program, and mobile device control system |
| TWI500904B (en) * | 2014-09-18 | 2015-09-21 | Vivotek Inc | Stereo camera and automatic range finding method for measuring a distance between stereo camera and reference plane |
| US9794543B2 (en) * | 2015-03-02 | 2017-10-17 | Ricoh Company, Ltd. | Information processing apparatus, image capturing apparatus, control system applicable to moveable apparatus, information processing method, and storage medium of program of method |
| JP6805534B2 (en) | 2015-07-02 | 2020-12-23 | 株式会社リコー | Parallax image generator, parallax image generation method and parallax image generation program, object recognition device, device control system |
| JP6592991B2 (en) * | 2015-07-06 | 2019-10-23 | 株式会社リコー | Object detection apparatus, object detection method, and program |
| JP6516012B2 (en) | 2015-09-15 | 2019-05-22 | 株式会社リコー | Image processing apparatus, object recognition apparatus, device control system, image processing method and program |
| JP6657789B2 (en) * | 2015-10-29 | 2020-03-04 | 株式会社リコー | Image processing device, imaging device, device control system, frequency distribution image generation method, and program |
| WO2017090326A1 (en) | 2015-11-27 | 2017-06-01 | 株式会社リコー | Image processing device, image pickup device, apparatus control system, distribution data generation method, and program |
| WO2017094300A1 (en) | 2015-11-30 | 2017-06-08 | 株式会社リコー | Image processing device, object recognition device, device conrol system, image processing method, and program |
| EP3389009A4 (en) * | 2015-12-10 | 2018-12-19 | Ricoh Company, Ltd. | Image processing device, object recognition device, apparatus control system, image processing method and program |
| EP3392830B1 (en) | 2015-12-14 | 2023-09-06 | Ricoh Company, Ltd. | Image processing device, object recognition device, apparatus control system, image processing method and program |
| EP3399499A4 (en) | 2015-12-28 | 2019-01-09 | Ricoh Company, Ltd. | Image processing device, object recognition device, machinery control system, image processing method, and image processing program |
| WO2017130639A1 (en) | 2016-01-28 | 2017-08-03 | 株式会社リコー | Image processing device, imaging device, mobile entity apparatus control system, image processing method, and program |
| EP3410416B1 (en) * | 2016-01-28 | 2021-08-04 | Ricoh Company, Ltd. | Image processing device, imaging device, mobile entity apparatus control system, image processing method, and program |
| WO2017128441A1 (en) * | 2016-01-31 | 2017-08-03 | 冯旋宇 | Vehicle image distance measuring method and system |
| JP6690267B2 (en) * | 2016-02-03 | 2020-04-28 | トヨタ自動車株式会社 | Vehicle three-dimensional object detection device |
| JP6687039B2 (en) | 2016-02-05 | 2020-04-22 | 株式会社リコー | Object detection device, device control system, imaging device, object detection method, and program |
| JP6614247B2 (en) | 2016-02-08 | 2019-12-04 | 株式会社リコー | Image processing apparatus, object recognition apparatus, device control system, image processing method and program |
| WO2017145600A1 (en) * | 2016-02-23 | 2017-08-31 | 株式会社リコー | Image processing device, imaging device, mobile entity apparatus control system, image processing method, and program |
| JP6733225B2 (en) | 2016-03-08 | 2020-07-29 | 株式会社リコー | Image processing device, imaging device, mobile device control system, image processing method, and program |
| JP6631691B2 (en) | 2016-03-10 | 2020-01-15 | 株式会社リコー | Image processing device, device control system, imaging device, image processing method, and program |
| WO2017154389A1 (en) * | 2016-03-10 | 2017-09-14 | 株式会社リコー | Image processing device, imaging device, mobile apparatus control system, image processing method, and program |
| JP6743882B2 (en) | 2016-03-14 | 2020-08-19 | 株式会社リコー | Image processing device, device control system, imaging device, image processing method, and program |
| JP6795027B2 (en) | 2016-03-15 | 2020-12-02 | 株式会社リコー | Information processing equipment, object recognition equipment, device control systems, moving objects, image processing methods and programs |
| JP6711395B2 (en) | 2016-03-17 | 2020-06-17 | 株式会社リコー | Image processing device, imaging device, mobile device control system, mobile device, image processing method, and program |
| JP6665925B2 (en) | 2016-03-18 | 2020-03-13 | 株式会社リコー | Image processing apparatus, mobile equipment control system, image processing program, and image processing method |
| WO2017158982A1 (en) * | 2016-03-18 | 2017-09-21 | 株式会社リコー | Image processing device, image processing method, image processing program, object recognition device, and apparatus control system |
| JP6936557B2 (en) * | 2016-05-16 | 2021-09-15 | 日立Astemo株式会社 | Search processing device and stereo camera device |
| JP6816401B2 (en) * | 2016-08-09 | 2021-01-20 | 株式会社リコー | Image processing device, imaging device, mobile device control system, image processing method, and program |
| JP6836350B2 (en) * | 2016-08-11 | 2021-02-24 | 株式会社Subaru | Movement speed arithmetic unit |
| EP3293671B1 (en) * | 2016-09-12 | 2020-04-15 | Ricoh Company, Ltd. | Image processing device, object recognizing device, device control system, moving body, image processing method, and program |
| KR102507383B1 (en) * | 2016-11-08 | 2023-03-08 | 한국전자통신연구원 | Method and system for stereo matching by using rectangular window |
| JP6943092B2 (en) * | 2016-11-18 | 2021-09-29 | 株式会社リコー | Information processing device, imaging device, device control system, moving object, information processing method, and information processing program |
| JP6969245B2 (en) * | 2016-11-18 | 2021-11-24 | 株式会社リコー | Information processing device, image pickup device, device control system, mobile body, information processing method, and information processing program |
| EP3327696B1 (en) * | 2016-11-22 | 2021-03-17 | Ricoh Company, Ltd. | Information processing apparatus, imaging device, device control system, mobile body, information processing method, and program |
| US10628960B2 (en) | 2016-11-24 | 2020-04-21 | Ricoh Company, Ltd. | Information processing apparatus, imaging apparatus, device control system, moving object, information processing method, and recording medium |
| JP6907513B2 (en) * | 2016-11-25 | 2021-07-21 | 株式会社リコー | Information processing equipment, imaging equipment, equipment control system, information processing method and program |
| JP7206583B2 (en) * | 2016-11-25 | 2023-01-18 | 株式会社リコー | Information processing device, imaging device, device control system, moving object, information processing method and program |
| JP7119317B2 (en) | 2016-11-28 | 2022-08-17 | 株式会社リコー | Information processing device, imaging device, device control system, moving object, information processing method, and information processing program |
| JP6844223B2 (en) * | 2016-11-30 | 2021-03-17 | 株式会社リコー | Information processing equipment, imaging equipment, equipment control system, information processing method and program |
| JP6950170B2 (en) | 2016-11-30 | 2021-10-13 | 株式会社リコー | Information processing device, imaging device, device control system, information processing method, and program |
| JP2018092596A (en) | 2016-11-30 | 2018-06-14 | 株式会社リコー | Information processing device, imaging device, apparatus control system, mobile body, information processing method, and program |
| CN109983468A (en) * | 2016-12-01 | 2019-07-05 | 深圳市大疆创新科技有限公司 | Use the method and system of characteristic point detection and tracking object |
| JP6597588B2 (en) | 2016-12-20 | 2019-10-30 | トヨタ自動車株式会社 | Image display device |
| JP6601422B2 (en) * | 2017-01-11 | 2019-11-06 | トヨタ自動車株式会社 | Image display device |
| CN107330881B (en) * | 2017-06-30 | 2020-11-06 | 燕山大学 | Method for identifying wheel hub valve hole |
| JP6764378B2 (en) * | 2017-07-26 | 2020-09-30 | 株式会社Subaru | External environment recognition device |
| WO2019031137A1 (en) * | 2017-08-07 | 2019-02-14 | 日立オートモティブシステムズ株式会社 | Roadside object detection device, roadside object detection method, and roadside object detection system |
| US10647282B2 (en) * | 2017-11-06 | 2020-05-12 | Magna Electronics Inc. | Vehicle vision system with undercarriage cameras |
| JP7091686B2 (en) * | 2018-02-08 | 2022-06-28 | 株式会社リコー | 3D object recognition device, image pickup device and vehicle |
| CN110378185A (en) * | 2018-04-12 | 2019-10-25 | 北京图森未来科技有限公司 | A kind of image processing method applied to automatic driving vehicle, device |
| JP7103834B2 (en) * | 2018-04-20 | 2022-07-20 | 株式会社小松製作所 | Work machine control system, work machine, and work machine control method |
| FR3080702A1 (en) * | 2018-04-25 | 2019-11-01 | Valeo Schalter Und Sensoren Gmbh | ESTIMATION OF DISTANCE SEPARATING A MOTOR VEHICLE FROM OBJECTS DETECTED BY PROCESSING IMAGES CAPTURED FROM THE MOTOR VEHICLE |
| CN110728710B (en) * | 2018-07-16 | 2023-10-27 | 株式会社理光 | Visual mileage calculation method, device and computer readable storage medium |
| KR102586966B1 (en) * | 2018-08-01 | 2023-10-10 | 한화에어로스페이스 주식회사 | Interior-map generation system and interior-exploration robot |
| JP2020053774A (en) | 2018-09-25 | 2020-04-02 | 株式会社リコー | Imaging apparatus and image recording method |
| CN110162040B (en) * | 2019-05-10 | 2022-06-17 | 重庆大学 | Low-speed automatic driving trolley control method and system based on deep learning |
| CN111179232A (en) * | 2019-12-20 | 2020-05-19 | 山东大学 | Steel bar size detection system and method based on image processing |
| US11312300B1 (en) * | 2021-01-29 | 2022-04-26 | Toyota Motor Engineering & Manufacturing North America, Inc. | Object notification systems for identifying and notifying vehicles of relevant objects |
| CN115717890A (en) * | 2022-10-13 | 2023-02-28 | 上海中电电子系统科技股份有限公司 | Clean room cleanliness detection method based on robot inspection |
Family Cites Families (20)
| Publication number | Priority date | Publication date | Assignee | Title |
|---|---|---|---|---|
| US6384414B1 (en) * | 1997-11-25 | 2002-05-07 | Board Of Regents, The University Of Texas System | Method and apparatus for detecting the presence of an object |
| JP3562751B2 (en) * | 1998-06-09 | 2004-09-08 | 矢崎総業株式会社 | Forward vehicle detection method and device |
| JP3739693B2 (en) * | 2001-11-09 | 2006-01-25 | 本田技研工業株式会社 | Image recognition device |
| US7132975B2 (en) * | 2004-05-28 | 2006-11-07 | Time Domain Corporation | Apparatus and method for detecting moving objects |
| JP4719543B2 (en) | 2005-09-26 | 2011-07-06 | 株式会社リコー | Workflow system, server device, processing method of workflow system, and workflow program |
| JP2007102545A (en) | 2005-10-05 | 2007-04-19 | Ricoh Co Ltd | Electronic document creation apparatus, electronic document creation method, and electronic document creation program |
| JP4647515B2 (en) | 2006-02-20 | 2011-03-09 | 株式会社リコー | Coordinate detection device, writing instrument, and coordinate input system |
| JP5164351B2 (en) * | 2006-09-07 | 2013-03-21 | 富士重工業株式会社 | Object detection apparatus and object detection method |
| EP2051042B1 (en) * | 2007-10-18 | 2010-11-03 | Nectar Imaging S.r.l. | Device for tomographically recording objects |
| JP5188452B2 (en) | 2009-05-22 | 2013-04-24 | 富士重工業株式会社 | Road shape recognition device |
| US9229102B1 (en) * | 2009-12-18 | 2016-01-05 | L-3 Communications Security And Detection Systems, Inc. | Detection of movable objects |
| JP5664152B2 (en) | 2009-12-25 | 2015-02-04 | 株式会社リコー | Imaging device, in-vehicle imaging system, and object identification device |
| CN103052968B (en) | 2010-08-03 | 2016-03-02 | 松下知识产权经营株式会社 | Article detection device and object detecting method |
| JP5580233B2 (en) * | 2011-03-22 | 2014-08-27 | 富士重工業株式会社 | Outside vehicle monitoring apparatus and outside vehicle monitoring method |
| US9062980B2 (en) * | 2011-11-22 | 2015-06-23 | Hitachi, Ltd. | Autonomous mobile system |
| US20140319349A1 (en) * | 2011-11-23 | 2014-10-30 | National University Corporation Kobe University | Motion detection device |
| JP2014006885A (en) | 2012-05-31 | 2014-01-16 | Ricoh Co Ltd | Level difference recognition apparatus, level difference recognition method, and program for level difference recognition |
| JP6398347B2 (en) | 2013-08-15 | 2018-10-03 | 株式会社リコー | Image processing apparatus, recognition object detection method, recognition object detection program, and moving object control system |
| JP6340850B2 (en) * | 2014-03-18 | 2018-06-13 | 株式会社リコー | Three-dimensional object detection device, three-dimensional object detection method, three-dimensional object detection program, and mobile device control system |
| JP6519262B2 (en) * | 2014-04-10 | 2019-05-29 | 株式会社リコー | Three-dimensional object detection device, three-dimensional object detection method, three-dimensional object detection program, and mobile device control system |
-
2015
- 2015-03-25 JP JP2015062340A patent/JP6519262B2/en active Active
- 2015-04-09 US US14/682,496 patent/US9330320B2/en active Active
Also Published As
| Publication number | Publication date |
|---|---|
| US9330320B2 (en) | 2016-05-03 |
| US20150294160A1 (en) | 2015-10-15 |
| JP2015207281A (en) | 2015-11-19 |
Similar Documents
| Publication | Publication Date | Title |
|---|---|---|
| JP6519262B2 (en) | Three-dimensional object detection device, three-dimensional object detection method, three-dimensional object detection program, and mobile device control system | |
| JP6550881B2 (en) | Three-dimensional object detection device, three-dimensional object detection method, three-dimensional object detection program, and mobile device control system | |
| JP6340850B2 (en) | Three-dimensional object detection device, three-dimensional object detection method, three-dimensional object detection program, and mobile device control system | |
| JP6274557B2 (en) | Moving surface information detection apparatus, moving body device control system using the same, and moving surface information detection program | |
| JP6657789B2 (en) | Image processing device, imaging device, device control system, frequency distribution image generation method, and program | |
| JP6662388B2 (en) | Image processing device, imaging device, device control system, distribution data generation method, and program | |
| JP6150164B2 (en) | Information detection apparatus, mobile device control system, mobile object, and information detection program | |
| JP6705496B2 (en) | Image processing device, imaging device, mobile device control system, mobile device, image processing method, and program | |
| JP4650079B2 (en) | Object detection apparatus and method | |
| JP6702340B2 (en) | Image processing device, imaging device, mobile device control system, image processing method, and program | |
| JP6583527B2 (en) | Image processing apparatus, imaging apparatus, mobile device control system, image processing method, and program | |
| JP5145585B2 (en) | Target detection device | |
| JP6753134B2 (en) | Image processing device, imaging device, mobile device control system, image processing method, and image processing program | |
| JP6705497B2 (en) | Image processing device, imaging device, mobile device control system, image processing method, program, and mobile device | |
| US10748014B2 (en) | Processing device, object recognition apparatus, device control system, processing method, and computer-readable recording medium | |
| JP2009053818A (en) | Image processor and method thereof | |
| JP6340849B2 (en) | Image processing apparatus, image processing method, image processing program, and mobile device control system | |
| JP2009245042A (en) | Traffic flow measurement device and program | |
| CN109522779B (en) | Image processing apparatus and method | |
| JP6812701B2 (en) | Image processing equipment, mobile device control system, image processing method, and program | |
| WO2024042607A1 (en) | External world recognition device and external world recognition method | |
| JP2021056841A (en) | Teacher data forming device and image classification device |
Legal Events
| Date | Code | Title | Description |
|---|---|---|---|
| A621 | Written request for application examination |
Free format text: JAPANESE INTERMEDIATE CODE: A621 Effective date: 20180208 |
|
| A977 | Report on retrieval |
Free format text: JAPANESE INTERMEDIATE CODE: A971007 Effective date: 20190208 |
|
| TRDD | Decision of grant or rejection written | ||
| A01 | Written decision to grant a patent or to grant a registration (utility model) |
Free format text: JAPANESE INTERMEDIATE CODE: A01 Effective date: 20190326 |
|
| A61 | First payment of annual fees (during grant procedure) |
Free format text: JAPANESE INTERMEDIATE CODE: A61 Effective date: 20190408 |
|
| R151 | Written notification of patent or utility model registration |
Ref document number: 6519262 Country of ref document: JP Free format text: JAPANESE INTERMEDIATE CODE: R151 |