JP4192490B2 - Ultrasonic diagnostic equipment - Google Patents
Ultrasonic diagnostic equipment Download PDFInfo
- Publication number
- JP4192490B2 JP4192490B2 JP2002126075A JP2002126075A JP4192490B2 JP 4192490 B2 JP4192490 B2 JP 4192490B2 JP 2002126075 A JP2002126075 A JP 2002126075A JP 2002126075 A JP2002126075 A JP 2002126075A JP 4192490 B2 JP4192490 B2 JP 4192490B2
- Authority
- JP
- Japan
- Prior art keywords
- waveform
- signal
- frequency
- ultrasonic
- diagnostic apparatus
- Prior art date
- Legal status (The legal status is an assumption and is not a legal conclusion. Google has not performed a legal analysis and makes no representation as to the accuracy of the status listed.)
- Expired - Fee Related
Links
Images


Classifications
-
- G—PHYSICS
- G01—MEASURING; TESTING
- G01S—RADIO DIRECTION-FINDING; RADIO NAVIGATION; DETERMINING DISTANCE OR VELOCITY BY USE OF RADIO WAVES; LOCATING OR PRESENCE-DETECTING BY USE OF THE REFLECTION OR RERADIATION OF RADIO WAVES; ANALOGOUS ARRANGEMENTS USING OTHER WAVES
- G01S15/00—Systems using the reflection or reradiation of acoustic waves, e.g. sonar systems
- G01S15/88—Sonar systems specially adapted for specific applications
- G01S15/89—Sonar systems specially adapted for specific applications for mapping or imaging
- G01S15/8906—Short-range imaging systems; Acoustic microscope systems using pulse-echo techniques
- G01S15/895—Short-range imaging systems; Acoustic microscope systems using pulse-echo techniques characterised by the transmitted frequency spectrum
- G01S15/8954—Short-range imaging systems; Acoustic microscope systems using pulse-echo techniques characterised by the transmitted frequency spectrum using a broad-band spectrum
-
- A—HUMAN NECESSITIES
- A61—MEDICAL OR VETERINARY SCIENCE; HYGIENE
- A61B—DIAGNOSIS; SURGERY; IDENTIFICATION
- A61B8/00—Diagnosis using ultrasonic, sonic or infrasonic waves
-
- G—PHYSICS
- G01—MEASURING; TESTING
- G01S—RADIO DIRECTION-FINDING; RADIO NAVIGATION; DETERMINING DISTANCE OR VELOCITY BY USE OF RADIO WAVES; LOCATING OR PRESENCE-DETECTING BY USE OF THE REFLECTION OR RERADIATION OF RADIO WAVES; ANALOGOUS ARRANGEMENTS USING OTHER WAVES
- G01S15/00—Systems using the reflection or reradiation of acoustic waves, e.g. sonar systems
- G01S15/88—Sonar systems specially adapted for specific applications
- G01S15/89—Sonar systems specially adapted for specific applications for mapping or imaging
- G01S15/8906—Short-range imaging systems; Acoustic microscope systems using pulse-echo techniques
- G01S15/8959—Short-range imaging systems; Acoustic microscope systems using pulse-echo techniques using coded signals for correlation purposes
- G01S15/8963—Short-range imaging systems; Acoustic microscope systems using pulse-echo techniques using coded signals for correlation purposes using pulse inversion
-
- G—PHYSICS
- G01—MEASURING; TESTING
- G01S—RADIO DIRECTION-FINDING; RADIO NAVIGATION; DETERMINING DISTANCE OR VELOCITY BY USE OF RADIO WAVES; LOCATING OR PRESENCE-DETECTING BY USE OF THE REFLECTION OR RERADIATION OF RADIO WAVES; ANALOGOUS ARRANGEMENTS USING OTHER WAVES
- G01S7/00—Details of systems according to groups G01S13/00, G01S15/00, G01S17/00
- G01S7/52—Details of systems according to groups G01S13/00, G01S15/00, G01S17/00 of systems according to group G01S15/00
- G01S7/52017—Details of systems according to groups G01S13/00, G01S15/00, G01S17/00 of systems according to group G01S15/00 particularly adapted to short-range imaging
- G01S7/52023—Details of receivers
- G01S7/52036—Details of receivers using analysis of echo signal for target characterisation
- G01S7/52038—Details of receivers using analysis of echo signal for target characterisation involving non-linear properties of the propagation medium or of the reflective target
Landscapes
- Physics & Mathematics (AREA)
- Engineering & Computer Science (AREA)
- Remote Sensing (AREA)
- Radar, Positioning & Navigation (AREA)
- Acoustics & Sound (AREA)
- Health & Medical Sciences (AREA)
- Life Sciences & Earth Sciences (AREA)
- General Physics & Mathematics (AREA)
- Computer Networks & Wireless Communication (AREA)
- Radiology & Medical Imaging (AREA)
- Veterinary Medicine (AREA)
- Molecular Biology (AREA)
- Surgery (AREA)
- Animal Behavior & Ethology (AREA)
- General Health & Medical Sciences (AREA)
- Public Health (AREA)
- Medical Informatics (AREA)
- Heart & Thoracic Surgery (AREA)
- Biomedical Technology (AREA)
- Pathology (AREA)
- Nuclear Medicine, Radiotherapy & Molecular Imaging (AREA)
- Biophysics (AREA)
- Ultra Sonic Daignosis Equipment (AREA)
- Measurement Of Velocity Or Position Using Acoustic Or Ultrasonic Waves (AREA)
Description
【0001】
【発明の属する技術分野】
本発明は、超音波診断装置に係り、特に超音波が被検体内を伝播する際発生する高調波信号を画像化する超音波診断装置に関する。
【0002】
【従来の技術】
超音波診断装置は、被検体内に超音波信号を送信し、そのエコー信号を含む受信信号に基づいて例えば断層画像等の診断に供する情報を得るものである。
【0003】
このような断層画像を表示する技術において、送信信号の基本波成分(周波数f0)に対する高調波成分(例えば周波数2f0,3f0等)を画像化することによって、コントラストの良い画像が得られることがが報告されている。このような撮像法は、ティッシュ・ハーモニック・イメージング(Tissue Harmonic Imaging)と呼ばれている。
【0004】
上述した高調波成分は、主に超音波が被検体内を伝播する際に生ずる非線型歪みに起因して発生する。すなわち、生体内に照射された超音波は、組織の非線型応答により組織伝播中に信号が歪み、高調波成分が増大する。この結果、そのエコー信号には例えば基本波f0の2倍周波数の2f0や、3倍周波数の3f0の成分が含まれることとなる。
【0005】
ティッシュ・ハーモニック・イメージングにおいては、いかにして強い高調波成分のエコーを抽出できるかがポイントとなる。従来報告されているティッシュ・ハーモニック・イメージング方法の一例として、フィルタ法と呼ばれるものがある。これは、中心周波数が例えば2f0の帯域通過フィルタを用いて受信信号から例えば2f0の高調波成分を抽出するものである。また、他の一例として、パルスインバージョン法と呼ばれるものがある。これは、極性を相互に反転させた第1および第2の送信波形を時間間隔をおいて送信し、それぞれのエコー信号を整相加算して基本波成分を打ち消すことによって2次の高調波成分を強調するものである。
【0006】
【発明が解決しようとする課題】
しかしながら、超音波信号の高調波成分は、基本波成分と比べて周波数が高いから伝播時に減衰の影響を受けやすく、深部からのエコー信号の到達度、つまりペネトレーションがよくないという問題点があった。一方、基本波の中心周波数f0を下げれば減衰の影響を受けにくくなるからペネトレーションは改善できるが、周知のように分解能が低下してしまう。
【0007】
上述した問題点に鑑み、本発明の課題は、分解能を維持しつつペネトレーションを向上することにある。
【0008】
【課題を解決するための手段】
本発明は、超音波探触子と、前記超音波探触子を介して被検体に超音波信号を送信する送波部と、前記超音波探触子により受信された受波信号を処理する受波部と、前記受波部で処理された前記受波信号に基づいて画像を生成する画像生成部とを備えてなり、前記送波部は、超音波信号を同じ方向に時間間隔をおいて複数回送信する機能を有し、該複数回送信される超音波信号には第1波形と第2波形とを含み、前記受波部は、前記第1波形に対応する受波信号と前記第2波形に対応する受波信号とを整相加算する機能を有してなる超音波診断装置において、前記送波部は前記第1波形を経時的に周波数が増加するように推移させ、かつ前記第2波形を経時的に周波数が低減するように推移させる機能と、前記超音波信号の送波フォーカス深さを可変設定する機能を有し、前記第1波形は経時的に周波数が増加する一続きの波形であり、前記第2波形は経時的に周波数が低減する一続きの波形であり、かつ前記第1波形と前記第2波形は時間軸の直交線に対して線対称の形状であり、前記第1波形および前記第2波形の周波数が推移する変化率が前記送波フォーカス深さに応じて可変設定されることを特徴とする。
【0009】
これによれば、従来のように同じ周波数f0の波形を極性反転して送波する場合に対して整相加算後の受波信号の周波数スペクトラムが変化し、f0ないし2f0の周波数帯域における成分を強調することができる。このような周波数帯域の成分は2f0よりも周波数が低いから減衰の影響を受けにくく、ペネトレーションがよい。したがって、この周波数成分を抽出し、これに基づいて画像を生成することによって、f0を下げなくても、つまり分解能を低下させなくても、ティッシュ・ハーモニック・イメージングにおけるペネトレーションを向上させることができる。
【0010】
ここで、送波部が上記第1波形を経時的に周波数が増加するように推移させ、かつ上記第2波形を経時的に周波数が低減するように推移させる機能を有する場合において、上記第1波形と上記第2波形は時間軸の直交線に対して線対称の形状を有する。また、周波数が推移する波形とは、例えば周波数の異なる波形の1サイクルまたは複数サイクルを連結してなるものであってもよい。また、周波数が異なる波形の1/2サイクル、1/4サイクル、1/8サイクル等の部分を連結してなる構成としてもよく、連続的に周波数が変化するチャープ波形を用いるものであってもよい。
【0011】
この場合、上述した周波数スペクトラムの変化は第1波形および第2波形の周波数が推移する変化率を可変設定することにより変化するが、特に被検体内の深い部位(探触子から遠い部位)からの診断情報を得る場合には、受波信号の周波数スペクトラムを低く偏移させてペネトレーション重視の設定とするとよい。そこで、送波部は超音波信号の送波フォーカス深さを可変設定する機能を有し、第1波形および第2波形の周波数が推移する変化率が送波フォーカス深さに応じて可変設定されるようにするとよい。
【0012】
また、この場合、第1波形および第2波形はそれぞれ信号強度が低減するよう推移するようにすると、上述したスペクトラムの変化を強調することができる。この場合、送波フォーカス深さに応じて第1波形および第2波形の信号強度が推移する変化率を送波フォーカス深さに応じて可変設定するようにしてもよい。
【0013】
また、第1波形および第2波形の極性が相互に反転されている構成とし、受波部は、第1波形および第2波形にそれぞれ対応する受波信号をゲインの差をつけてそれぞれ増幅または低減し、整相加算する機能を有する構成としてもよい。
【0014】
このようにしても整相加算後の受波信号の周波数スペクトラムが変化し、f0ないし2f0の周波数帯域における成分を強調することができるから、f0を下げなくても、つまり分解能を低下させなくても、ペネトレーションを向上することができる。この場合、ゲインの差が受波信号の受信タイミング、つまり受波フォーカス深さに応じて可変設定される構成としてもよい。例えば、第1波形と第2波形とにそれぞれ対応する受波信号に対して、受信タイミングとゲインとの相関曲線が異なったタイム・ゲイン・コントロールを行なう構成にするとよい。
【0015】
また、受波部は、受波信号に受波フォーカス処理を行なう機能と、この受波信号の設定周波数帯域を抽出するフィルタとを有し、受波フォーカスの設定深さに応じて周波数帯域を可変設定する構成としてもよい。これによれば、受波フォーカス深さ、すなわち被検体内の診断対象部位の深さの違いに起因する減衰の違いによる受波信号のスペクトラムの変化に適応し、好適な周波数帯域の成分を抽出することができる。
【0016】
また、送波フォーカスの設定深さに応じて第1波形と第2波形の周波数が推移する変化率または信号強度が推移する変化率を可変設定する場合には、これらを可変することによる受波信号のスペクトラム変化に適応するため、フィルタの周波数帯域を送波フォーカスの設定深さに応じて可変設定する構成としてもよい。また、送波部は上記第1波形を経時的に周波数が増加するように推移させ、かつ上記第2波形を経時的に周波数が低減するように推移させる機能を有する場合において、上記第1波形あるいは上記第2波形あるいは上記第1波形と上記第2波形の双方が2サイクル以上毎に周波数を増加減少させてもよいし、上記第1波形あるいは上記第2波形あるいは上記第1波形と上記第2波形の双方が1サイクル未満毎に周波数を増加減少させてもよいし、上記第1波形あるいは上記第2波形あるいは上記第1波形と上記第2波形の双方が連続的に周波数を増加減少させてもよい。
【0017】
【発明の実施の形態】
以下、本発明を適用してなる超音波診断装置の第1の実施形態について説明する。図1は、本実施形態の超音波診断装置の構成を示す図である。図1に示すように、超音波診断装置は、超音波探触子1と、超音波探触子1を介して図示しない被検体に超音波信号を送信する送波部3と、超音波探触子1を介して被検体からのエコー信号等を含む受波信号を受信し処理する受波部5と、受波部5によって処理された受波信号に基づいて診断画像を生成し表示する画像作成表示部7とを有して構成されている。画像作成表示部7は、図示しない検波、圧縮等を行なうビデオ処理部、ドプラ処理部および走査変換部を含んでなる。
【0018】
送波部3は、所望の振幅、周波数、開始位相をそれぞれ有する複数の波形を組み合わせた送波信号を生成する機能を有する任意波形発生器9と、任意波形発生器9が出力した波形を時間反転させる機能を有する時間軸制御器11と、パワーアンプを有してなり、時間軸制御器11の出力信号に応じて超音波探触子1に駆動信号を供給する送波器13とを有してなる。なお、時間軸制御器11は、任意波形発生器9の出力を入力信号としていわゆるファーストイン・ファーストアウト機能とファーストイン・ラストアウト機能とを有するものであり、シフトレジスタを有して構成されている。
【0019】
受波部5は、超音波探触子1から出力される受波信号が入力され、図示しない前置増幅器、タイム・ゲイン・コントロール(TGC)増幅器、A/D変換器を含んでなる受信器15と、受信器15から出力される超音波探触子1の各振動子に対応するチャンネルの受波信号を整相し、加算してRFライン信号として出力する整相加算器17と、整相加算部17から先に出力された受波信号を保持し、時間遅延させて後に出力された受波信号と位相まで考慮してRF加算して出力するライン加算器19と、ライン加算器19の出力信号から特定の周波数帯域を抽出する帯域通過ディジタルフィルタ演算機能を有する帯域フィルタ21とを有して構成されている。整相加算部17として、加算処理中の歪みを最小限とするため、いわゆるディジタルビームフォーマを用いる。また、上述した送波部3、受波部5および画像作成表示部7内の各要素の動作を統括して制御するシステム制御部23が設けられている。また、超音波探触子1は、図示しない被検体に対向して列状または面状に並べられた複数の振動子25を有して構成されている。
【0020】
次に、上述した超音波診断装置の動作について説明する。はじめに、任意波形発生器9は、システム制御部23からの指示に基づいて、送波信号の波形を生成し出力する。この任意波形発生器9の出力信号波形は、周波数を変えた波形を連続させて構成されている。この点、詳細につき後述する。任意発生器9の出力信号は時間軸制御器11に入力され、先ずファーストイン・ファーストアウト機能により時間反転させることなく第1波形として出力される。そして、時間軸制御器11は、第1波形から時間的に遅延させて、ファーストイン・ラストアウト機能によって、第1波形を時間反転した第2波形を出力する。送波器13は、これらの第1波形、第2波形に基づいて、周知の送波フォーカス処理を施して、超音波探触子1の各振動子25の駆動信号を生成し、出力する。送波器13から図示しない送受波分離回路を経て駆動信号を供給された振動子25はそれぞれ振動して超音波を発生し、それぞれの振動子25から出た超音波の波面が一致する方向に進む超音波ビームが図示しない被検体内に形成される。
【0021】
一方、このような超音波ビームとして被検体内を伝播する超音波信号は、被検体内の音響インピーダンスが異なる部位において反射し、この反射波は超音波探触子1に戻り、受波信号として受信される。受波信号は振動子25によって音波から電気的な信号に変換され、図示しない送受波分離回路を経て受信器15に入力される。受信部15において、各振動子25に対応する各チャンネルの受波信号は前置増幅器およびTCG増幅器による増幅を受け、A/D変換され、出力される。受信部15の出力信号は整相加算器17に入力され、受波信号の発生部位から各振動子25までの距離の違いに起因する受波信号の各チャンネル間のタイミングのずれを時間遅延処理によって逐次補正をする周知のダイナミックフォーカス処理を施された後に加算され、出力される。これらの受波に伴なう処理は、上述した第1波形、第2波形のそれぞれに対応した受波信号のそれぞれについて行なわれる。そして、これらの第1波形に対応する受波信号と、第2波形に対応する受波信号とは、ライン加算器19が第1波形に対応する受波信号を一時的に保持し、時間遅延させてから第2波形に対応する受波信号と加算することによって合成され、合成された受波信号として出力される。そして、帯域フィルタ21において、合成された受波信号の所定の周波数帯域成分が抽出され、画像作成表示部7は、この抽出された周波数帯域成分の信号に基づいて超音波診断画像を生成して表示する。すなわち、超音波診断装置は、以上の動作をビーム方向を走査しながら実施し、画像作成表示部7において、各走査線に対応するライン加算器の出力に検波、圧縮等のビデオ処理、ドプラ信号処理、走査変換を行ない周知のBモードまたはドプラモードの画像を生成する。なお、システム制御部23は、これらの一連の動作をコントロールするとともに、任意波形発生器9のデータも併せて発生する。
【0022】
次に、本実施形態の超音波診断装置の特徴に係る第1波形、第2波形の波形および、送波信号および受波信号の周波数スペクトラムについて説明する。先ず、本実施形態の特徴を理解しやすくするため、既存のパルスインバージョン法における第1波形、第2波形の波形および送波信号および受波信号の周波数スペクトラムについて図2にシミュレーション結果を図示し、説明する。図2(1)は、時間を横軸にとり、送波信号の音圧を縦軸にとって第1波形および第2波形を示したグラフである。ここで、第1波形を実線で示し、第2波形を破線で示す。図2(1)に示すとおり、第1波形および第2波形はともに同じ周波数f0(=2MHz)である正弦波2周期の連続に、生体中の波形に類似させるためにハニング重みを掛けたものである。そして、第1波形と第2波形とは、その極性を反転した関係となっている。すなわち、第1波形は信号の開始時において音圧が立ち下がる極性となっており、第2波形は立ち上がる極性となっている。
【0023】
図2(2)は、送波信号と、第1波形および第2波形にそれぞれ対応する受波信号を整相加算した受波信号との周波数スペクトラムを示すグラフである。このグラフは横軸にf0=2.0MHzに対する比周波数(f/f0)をとり、縦軸に信号強度(dB)をとったものである。図2(2)において、送波信号のスペクトラムを破線で示し、合成された受波信号のスペクトラムを実線で示している。
【0024】
図2(2)に示すように、送波信号のスペクトラムは、周波数を0から向上させると信号強度が向上し、周波数f0において第1の極大となるピークを有する。そして、さらに周波数が上がると信号強度が低減され、周波数2f0においては、第1のピークに対して−40dB以下まで低減される。そして、周波数2f0からさらに周波数を向上させると信号強度は再び向上に転じ、周波数2.3f0近傍において第2のピークをとり、その後は再び低減する。この第2のピークの信号強度は、第1のピークに対して約−32dBとなっている。
【0025】
一方、合成された受波信号のスペクトラムは、信号強度が極大となるピークを0.6f0近傍、2f0近傍および4f0近傍に有し、信号強度が極小となる谷を1.2f0近傍および3.3f0近傍に有する。ピークのうち信号強度が最大となるのは2f0近傍のピークであって、この信号強度に対する0.6f0近傍および4f0近傍のピークの信号強度はともに約−14dBである。一方、信号強度が極小となる谷における信号強度は、2f0のピークにおける信号強度に対して1.2f0近傍において約−28dB、3.3f0近傍において約−21dBである。
【0026】
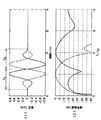
次に、本実施形態の超音波診断装置における周波数が推移する第1波形および第2波形の波形と、送波信号および受波信号の周波数スペクトラムの一例について図3にシミュレーション結果を図示し、説明する。図3(1)は、時間を横軸にとり、送波信号の音圧を縦軸にとって第1波形および第2波形を示したグラフである。ここで、第1波形を実線で示し、第2波形を破線で示す。図3(1)に示すように、第1波形は、周波数f1(=1.8MHz)の1サイクル目と、周波数f2(=2.2MHz)の2サイクル目とを連続させて構成され、信号開始時に音圧が立ち下がる極性となっている。一方、第2波形は、周波数f2の1サイクル目と、周波数f1の2サイクル目とを連続させて構成され、信号開始時に音圧が立ち上がる極性となっている。また、これらの第1波形および第2波形にはいずれも図2(1)に示す波形と同様のハニング重みが掛けられている。換言すれば、第2波形は、第1波形を時間反転させたものといえる。
【0027】
図3(2)は、送波信号と、第1波形および第2波形にそれぞれ対応する受波信号を整相加算してなる受波信号との周波数スペクトラムを示すグラフである。このグラフは、図2(2)と同様に横軸にf0=2.0MHzに対する比周波数(f/f0)をとり、縦軸に信号強度(dB)をとったものである。図3(2)において、送波信号のスペクトラムを破線で示し、整相加算された受波信号のスペクトラムを実線で示している。
【0028】
図3(2)に示すように、送波信号のスペクトラムは、周波数を0から向上させると信号強度が向上し、周波数f0において極大となるピークを有する。そして、さらに周波数を向上すると、信号強度が低下する。周波数2f0附近において、信号強度の低下率は小さくなり、低下率がほぼ0となった後、再び信号強度は低下率を大きくしつつ低減する。ちなみに周波数2f0近傍における信号強度は、周波数f0のピークに対し約−23dBである。
【0029】
一方、整相加算された受波信号のスペクトラムは、信号強度が極大となるピークを0.4f0近傍、1.6f0近傍および2.8f0近傍に有し、信号強度が極小となる谷を0.7f0近傍、2.2f0近傍および3.7f0近傍に有する。極大となるピークのうち信号強度が最大となるのは1.6f0近傍のピークであって、この信号強度に対する0.4f0近傍および2.8f0近傍のピークの信号強度はそれぞれ約−12dBおよび−2dBである。一方、信号強度が極小となる谷における信号強度は、0.7f0近傍において約−14dB、2.2f0近傍において約−17dB、3.7f0近傍において約−35dBである。
【0030】
図3(2)を図2(2)と比較すると明らかなように、既存のパルスインバージョン法においては、第1波形と第2波形とにそれぞれ対応する受波信号を合成すると、2f0近傍の周波数成分が最も強調されるのに対し、f1とf2とをずらすことによって、信号強度のピークが1.6f0近傍となり、周波数スペクトラムが低く偏移していることがわかる。
【0031】
そして、本実施形態の超音波診断装置においては、送波フォーカスの設定深さに応じて、周波数f1とf2との差Δf(=|f1−f2|)を可変設定していることを特徴とする。具体的には、送波フォーカス深さが深くなるにつれて、第1波形および第2波形にそれぞれ対応する受波信号を合成した信号の周波数スペクトラムが低く偏移するようにΔfを可変設定している。なお、このとき周波数f1とf2の平均周波数はf0のまま一定である。また、送波フォーカス深さが浅いときには、Δfを0として既存のパルスインバージョン法による送受信を行なうようにしている。そして、送波フォーカス深さが深くなるにつれてΔfを変化させ、上述した周波数スペクトルのピークが、2f0から例えばf0まで、好ましくは2f0から例えば1.5f0まで偏移するように送波信号を生成する。例えば、送波フォーカス深さを変えた複数の超音波ビームの受波信号をつなぎ合わせて1本のビームラインに係る受波信号を完成させる周知の送信多段フォーカスを行なう場合においては、各段のフォーカス深さに応じてΔfを可変するようにする。例えば、3段のフォーカスを行なう場合、フォーカス深さが浅い準に周波数スペクトラムのピークが例えば2f0、1.8f0、1.6f0となるように各段のΔfを設定するようにする。このような送波フォーカス深さに応じたΔfの設定は、シミュレーションまたは超音波ファントムを用いた実験によって行なうことができる。
【0032】
また、本実施形態の超音波診断装置においては、上述した周波数スペクトラムの偏移に応じて帯域フィルタ21の通過周波数帯域を可変することを特徴とする。具体的には、整相加算後の受波信号のスペクトラムの偏移に適応するため、送波フォーカス深さが深くなるにつれて通過周波数帯域を低く偏移させる。
【0033】
また、この帯域フィルタ21の通過周波数帯域は、送波信号が変わらない場合でも、受波フォーカスの深さに応じて可変される。すなわち、図4は、被検体の浅い部位、つまり超音波探触子から近い部位からの受波信号の受信スペクトラムと、被検体の深い部位、つまり超音波探触子から遠い部位からの受波信号の受信スペクトラムを示す模式図である。なお、図4においては、説明の簡単のため、高調波成分として2f0のみを表示している。なお、送波信号は通常数サイクルのパルス波であるから図4に示すようにスペクトラムは、f0、2f0を中心にそれぞれある程度の帯域を有する。図4に示すように、深い位置からの受波信号のスペクトラムは、超音波が生体内を伝播する際の非線型歪みに起因して高調波成分が多くなるが、高調波成分のスペクトラム分布に着目すると、周波数が高い成分ほど伝播時の減衰による影響が大きいため、周波数スペクトラムは低く偏移し、中心周波数も低下する。そこで、これに対処するため、帯域フィルタ21の通過周波数帯域は、受波フォーカスのダイナミックフォーカスに連動して、受波フォーカスのフォーカス深さが深くなるにつれて低く偏移するように設定される。具体的には、帯域フィルタ21としてディジタルFIRフィルタを用いる場合、その係数を受波フォーカス深さに連動して可変にするとよい。
【0034】
以上のように、本実施形態によれば、周波数が増加するように推移する第1波形と周波数が低減するよう推移する第2波形とにそれぞれ対応する受波信号を整相加算することによって、f0ないし2f0における周波数成分を強調しているから、2f0を強調する既存のパルスインバージョン法よりも減衰の影響を受けにくく、フォーカス深さの深い部分でペネトレーションを向上することができ、また浅い部分では、2f0成分で画像化するので、分解能も維持できる効果がある。
【0035】
また、第1波形と第2波形の周波数が推移する変化率を送波フォーカス深さに応じて可変設定しているので、浅いフォーカス深さにおいては比較的高い周波数成分を強調してコントラスト重視の設定とし、深いフォーカス深さにおいては比較的低い周波数成分を強調してペネトレーション重視の設定とすることができ、送波フォーカスの設定深さに適応して良好な画像を生成することができる。
【0036】
さらに、整相加算後の受波信号に対して周波数帯域通過フィルタ演算を行ない、この通過周波数帯域を送波フォーカス深さに応じて可変しているので、送波信号の周波数が推移する変化率に応じて強調される周波数帯域を抽出することができる。
【0037】
また、この通過周波数帯域は受波フォーカス深さに応じても可変設定されるので、受波信号の伝播距離の違いによる減衰の違いに起因する受波信号のスペクトラム変化に適応した周波数帯域を抽出することができる。
【0038】
また、例えばペネトレーションが問題となりにくい比較的浅い部位を診断する場合には、2f0よりも高い周波数の成分を抽出して画像生成を行なうようにしてもよい。例えば、図3(2)を見ると、2.8f0近傍にもピークがあることがわかるが、例えばこのような周波数が2f0よりも大きいピーク近傍の信号強度を帯域通過フィルタによって抽出し、画像生成を行なってもよい。これによれば、浅い部位を診断する際の画像コントラストが良好となる。
【0039】
また、このような浅い部位を診断する場合には、送波信号の中心周波数を高くするようにしてもよい。例えば、図3の例においては、中心周波数f0=2.0MHzとし、第1波形と第2波形をf1=1.8MHz、f2=2.2MHzとしているが、これを例えば中心周波数f0=2.1MHz、f1=2.0MHz、f2=2.2MHzとしてもよい。これによれば、ペネトレーションが問題となりにくい比較的浅い深度においてコントラストの良好な画像を得ることができる。
【0040】
なお、上述した実施形態においては、時間軸制御器によって第1波形を時間反転させることによって第2波形を得ているが、任意波形発生器が直接第2波形を発生可能な場合には、時間軸制御器は不要である。
【0041】
また、上述した実施形態においては、第1波形と第2波形はそれぞれ2サイクルの波形を連続させてなるが、3サイクル以上の波形を連続する構成としてもよい。例えば、第1波形がf1=1.8MHz、f2=2.0MHz、f3=2.2MHzの波形をそれぞれ1サイクルずつ連続させたものであり、第2波形が第1波形を時間反転させたものであってもよい。このように、第1波形が中心周波数f1,f2,・・fn,・・fN(N≧2)の1サイクル波形の連続であって、かつf1<f2<・・<fn<・・<fNであり、第2波形が第1波形の時間軸反転関係にある場合、N=4以上であっても本発明の趣旨は損なわれないが、波数が増加すると両送波の差は相対的に軽減されるから、本発明はN<6程度の範囲でとりわけ有効であると考えられる。
【0042】
また、上述した実施形態においては、第1波形と第2波形とはそれぞれ1サイクル毎に周波数を異ならせた正弦波の組合せによって構成しているが、例えば2サイクル以上毎に周波数を異ならせるようにしてもよい。また、例えば1/2サイクル、1/4サイクル毎のように細かく周波数を異ならせたり、さらに、周波数が連続的に推移するいわゆるチャープ波形を用いる構成としてもよい。
【0043】
次に、本発明を適用してなる超音波診断装置の第2の実施形態について説明する。第1の実施形態と同じ部分については説明を省略し、相違点についてのみ説明する。本実施形態の超音波診断装置は、第1波形および第2波形の振幅がともに推移することを特徴とする。すなわち、本実施形態においては、第1波形と第2波形のそれぞれの最初のサイクルの波形の振幅が、これに続く波形の振幅よりも大きく設定されていることを特徴とする。
【0044】
本実施形態の超音波診断装置における周波数及び振幅が推移する第1波形および第2波形の波形と、送波信号および受波信号の周波数スペクトラムの一例について図5にシミュレーション結果を図示し、説明する。図5(1)は、時間を横軸にとり、送波信号の音圧を縦軸にとって第1波形および第2波形を示したグラフである。ここで、第1波形を実線で示し、第2波形を破線で示す。図5(1)に示すように、第1波形は、周波数f1(=1.8MHz)の1サイクル目と、周波数f2(=2.2MHz)の2サイクル目とを連続させて構成され、信号開始時に音圧が立ち下がる極性となっている。一方、第2波形は、周波数f2の1サイクル目と、周波数f1の2サイクル目とを連続させて構成され、信号開始時に音圧が立ち上がる極性となっている。そして、第1波形、第2波形ともに、1サイクル目の振幅A1よりも2サイクル目の振幅A2が小さく設定され、例えば図5(1)の場合には、A2=0.9A1に設定されている。
【0045】
図5(2)は、送波信号と、第1波形および第2波形にそれぞれ対応する受波信号を整相加算してなる受波信号との周波数スペクトラムを示すグラフである。図2(2)と同様に横軸にf0=2.0MHzに対する比周波数(f/f0)をとり、横軸に信号強度(dB)をとったものである。図5(2)において、送波信号のスペクトラムを破線で示し、整相加算された受波信号のスペクトラムを実線にて示している。
【0046】
図5(2)に示すように、送波信号のスペクトラムは図3(2)に示す送波信号スペクトラムと類似しているが、周波数2f0近傍における信号強度はf0近傍における信号強度に対して約―25dBとなっている。
【0047】
一方、整相加算された受波信号のスペクトラムは、信号強度が極大となるピークを0.4f0近傍、1.6f0近傍および2.8f0近傍に有し、信号強度が極小となる谷を0.7f0近傍、2.2f0近傍および3.8f0近傍に有する。極大となるピークのうち信号強度が最大となるのは1.6f0近傍のピークであって、この信号強度に対する0.4f0近傍および2.8f0近傍のピークの信号強度はそれぞれ約−13dBおよび約−2dBである。一方、信号強度が極小となる谷における信号強度は、0.7f0近傍において約−17dB、2.2f0近傍において約−10dB、3.8f0近傍においては−40dB以下となっている。
【0048】
図5(2)と図2(2)とを比較すると明らかなように、本実施形態のように周波数f1とf2とをずらし、振幅A1とA2とをずらすことによって、信号強度のピークが1.6f0近傍となり、周波数スペクトラムが低く偏移していることがわかる。
【0049】
そして、本実施形態の超音波診断装置においては、送波フォーカスの設定深さに応じて、周波数f1とf2との差Δfを可変設定し、さらに振幅A1およびA2の比A2/A1を可変設定している。具体的には、第1の実施形態と同様に、送波フォーカス深さが深くなるにつれて、第1波形および第2波形にそれぞれ対応する受波信号を合成した信号の周波数スペクトラムが低く偏移するようにΔfおよびA2/A1を可変設定している。
【0050】
以上のように、本実施形態によれば、上述した第1の実施形態と同様の効果に加え、第1波形と第2波形の振幅をともに推移させることによって、整相加算された受波信号のスペクトラム偏移をより強調することができる。
【0051】
次に、本発明を適用してなる超音波診断装置の第3の実施形態について説明する。これも第1の実施形態と同じ部分については説明を省略し、相違点についてのみ説明する。
図6は、本実施形態の超音波診断装置の構成を示す図である。図6に示すように、超音波診断装置は、図示しない複数の超音波振動子または超音波トランスデューサのアレーを有する超音波探触子または超音波プローブ31と、超音波プローブ31を介して図示しない被検体に送信される送波信号を制御するパルス反転制御部33と、パルス反転制御部33からの指示に応じて送波信号を生成し、超音波プローブ31を駆動する送波整相回路35とを有する。送波整相回路35は、図示しない送波タイミング発生回路、送波ビームフォーマ回路および送波ドライバを有し、超音波プローブ31に高圧送波信号を供給するものである。このとき、送波ビームフォーマ回路は、送波タイミング発生回路により発生された送波タイミング信号に基づき、所定の方位の超音波ビームを形成するビームフォーミング信号を生成する。ビームフォーミング信号は、方位に対応した時間差が付与された複数の駆動信号からなる。
【0052】
また、超音波プローブを介して被検体から受信された受波信号を、複数の超音波トランスデューサの各チャンネルにわたって整相加算する受信整相回路37と、受信整相回路37の出力信号を可変設定されるゲインに応じて増幅または低減する可変ゲイン回路39と、可変ゲイン回路39の出力信号を一時的に記憶し、時間間隔をおいて可変ゲイン回路39が出力した信号と整相加算する2ビーム加算部41とが設けられている。そして、2ビーム加算器41の出力信号に対してディジタル帯域通過フィルタ演算を行なう可変帯域フィルタ43が設けられ、この可変帯域フィルタ43の出力信号に基づいて、検波、対数圧縮、エンハンス処理を含む周知のBモード画像処理を行なうBモード処理部45と、DSC回路47と、DSC回路47が出力するビデオ信号を画像表示するモニタ49が設けられている。また、可変ゲイン回路39と可変帯域フィルタ43とを制御する制御部51が設けられ、制御部51には入力手段を有する操作卓53がつながれている。なお、可変ゲイン回路39は、パルス反転制御部33および制御部51からの指示に基づいて、時間間隔をおいて受信された複数の受波信号に対して異なったゲインにより周知のタイム・ゲイン・コントロールを行なう機能を有する。また、可変帯域フィルタ43は、制御部51が発する時間制御信号により、通過周波数帯域の中心周波数と帯域幅とが受信深さに応じて可変する受波ダイナミックフィルタ機能を有する。
【0053】
次に、上述した超音波診断装置の動作について説明する。本実施形態の超音波診断装置においては、第1波形及び第2波形は図2(1)に示したものと同じ波形、すなわち、周波数f0の波形を2つ連続させ、第1波形と第2波形とが時間反転または極性反転の関係となる既存のパルスインバージョン法と同じ波形を用いる。そして、可変ゲイン回路39において、第1波形に対応する受波信号と、第2波形に対応する受波信号とに、受波信号の受信タイミング、つまり検出部位の深さに応じて異なったゲイン(振幅利得)によってタイム・ゲイン・コントロールを行なってから、2ビーム加算部41において整相加算し1本のRF信号とすることを特徴とする。
【0054】
図7ないし9は、本実施形態における送波信号と、合成された受波信号の周波数スペクトラムのシミュレーション結果を示すグラフであって、それぞれ第1波形と第2波形に対応する受波信号に対するゲインの比が、それぞれ1:1,1.2:0.8,1.35:0.65であるものを示すグラフである。各図とも、図2(2)と同様に、横軸にf0=2MHzに対する比周波数(f/f0)をとり、縦軸に信号強度(dB)をとっている。また、送波信号のスペクトラムを破線で示し、整相加算後の受波信号のスペクトラムを実線で示している。なお、ここで送波信号のスペクトラムは、いうまでもなく図2(2)に示したものと同様になる。
【0055】
次に、各図における整相加算後の受波信号のスペクトラムについて説明する。図7は、第1波形および第2波形にそれぞれ対応する受波信号に対するゲインの比(以下、「ゲイン比」と称する。)が1:1であるときのものである。図7に示すように、受波信号のスペクトラムは、信号強度が極大となるピークを0.6f0近傍、1.9f0近傍および3.7f0近傍に有する。一方、信号強度が極小となる谷を1.1f0近傍および2.9f0近傍に有する。信号強度が最大となるのは1.9f0近傍のピークにおいてであり、このときの信号強度に対する各ピークおよび谷における信号強度は、0.6f0近傍において約−9dB、1.1f0近傍において約−25dB、2.9f0近傍において約−17dB、3.7f0近傍において約−6dBである。
【0056】
図8は、ゲイン比が1.2:0.8であるときのものである。図8に示すように、受波信号のスペクトラムは、信号強度が極大となるピークを0.6f0近傍、1.9f0近傍および3.7f0近傍に有する。一方、信号強度が極小となる谷をf0近傍および2.9f0近傍に有する。信号強度が最大となるのは1.9f0近傍のピークにおいてであり、このときの信号強度に対する各ピークおよび谷における信号強度は、0.6f0近傍において約−8dB、f0近傍において約−15dB、2.9f0近傍において約−13dB、3.7f0近傍において約−5dBである。
【0057】
図9は、ゲイン比が1.2:0.8であるときのものである。図9に示すように、受波信号のスペクトラムは、信号強度が極大となるピークを0.6f0近傍、1.9f0近傍および3.7f0近傍に有する。一方、信号強度が極小となる谷を0.9f0近傍および2.9f0近傍に有する。信号強度が最大となるのは1.9f0近傍のピークにおいてであり、このときの信号強度に対する各ピークおよび谷における信号強度は、0.6f0近傍において約−8dB、0.9f0近傍において約−9dB、2.9f0近傍において約−10dB、3.7f0近傍において約−5dBである。
【0058】
図7ないし図9を比較すると明らかなように、ゲイン比を変化させることによって整相加算した受波信号のスペクトラムは変化し、例えばf0から2f0の周波数帯域における成分に着目すると、図7よりも図8、図8よりも図9のほうが強調されていることがわかる。例えば、1.5f0における信号強度に着目すると、1.9f0のピークに対する信号強度は、図7では約−7dB、図8では約−5dB、図9では約−3dBとなっている。
【0059】
そして、本実施形態においては、受波フォーカスの設定深さに応じて、ゲイン比を可変設定している。具体的には、受波フォーカス深さが深くなるにつれてゲイン比が大きくなるように設定している。このようなゲイン比の変更は、周知の受波ダイナミックフォーカスと連動し、受波タイミングに応じて連続的に行なわれる。すなわち、第1波形と第2波形とにそれぞれ対応する受波信号に対して、受信タイミングとゲインとの相関曲線が異なったタイム・ゲイン・コントロールを行なうようにしている。
【0060】
また、可変帯域フィルタ43は、受波フォーカスの設定深さに応じて通過周波数帯域を可変設定するようにしている。具体的には、受波フォーカス深さが浅い領域においては、通過周波数帯域を広く設定し、かつその中心周波数を低く設定することにより2次高調波成分を広帯域で通過させるようにしている。そして、受波フォーカス深さが深くなり、基本波成分が強調されてくるにつれて可変帯域フィルタの通過周波数帯域を狭く設定し、かつその中心周波数および下限周波数を高く設定することにより、基本波成分の低減を図るようにしている。
【0061】
以上のように、本実施形態によれば、第1波形と第2波形が相互に極性を反転されなる構成とし、第1波形および第2波形にそれぞれ対応する受波信号をゲインの差をつけてそれぞれ増幅または低減することによって、整相加算後の受波信号の周波数スペクトラムを変化させ、f0ないし2f0の周波数帯域における成分を強調することができるから、f0を下げなくても、分解能を低下させなくても、ペネトレーションを向上することができる。
【0062】
また、ゲインの差および可変帯域フィルタの通過周波数帯域を受波フォーカス深さに応じて可変設定しているから、比較的浅い部位においてはゲイン差を小さくするか、あるいは0とし、また可変帯域フィルタの通過周波数帯域を広く設定することによって基本波成分を打ち消された広帯域な2次の高調波成分を強調することができる。一方、比較的深い部位においてはゲイン差を大きくし、また通過周波数帯域を狭くし、かつその中心周波数を低くすることによってペネトレーションを向上することができる。
【0063】
なお、上述した実施形態では、第1波形に対応する受波信号に対するゲインと、第2波形に対応する受波信号に対するゲインとをともに可変させているが、一方を固定して他方のみ可変させる構成としてもよい。例えば、第1波形に対応するゲインを1に固定し、第2波形に対応するゲインのみ可変してもよい。例えば、ゲインの比を、1:1,1:0.6,1:0.3のように段階状に可変設定するようにしてもよい。また、受波信号に対するゲインを異ならせることに加え、あるいは代えて、第1波形と第2波形の送波時の振幅を異ならせるようにしてもよい。
【0064】
【発明の効果】
本発明によれば、分解能を維持しつつペネトレーションを向上することができる。
【図面の簡単な説明】
【図1】本発明を適用してなる超音波診断装置の第1の実施形態の構成を示す図である。
【図2】既存のパルスインバージョン法による送波信号波形と、送波信号および受波信号のスペクトラムとのシミュレーション結果を示すグラフである。
【図3】図1の超音波診断装置における送波信号波形と、送波信号および受波信号のスペクトラムとのシミュレーション結果を示すグラフである。
【図4】受波信号の発生深さによる受信スペクトラムの変化を示す模式図である。
【図5】本発明を適用してなる超音波診断装置の第2の実施形態の送波信号波形と、送波信号および受波信号のスペクトラムとのシミュレーション結果を示すグラフである。
【図6】本発明を適用してなる超音波診断装置の第3の実施形態の構成を示す図である。
【図7】本発明を適用してなる超音波診断装置の第3の実施形態の送波信号および受波信号のスペクトラムのシミュレーション結果を示すグラフである。
【図8】本発明を適用してなる超音波診断装置の第3の実施形態の送波信号および受波信号のスペクトラムのシミュレーション結果を示すグラフである。
【図9】本発明を適用してなる超音波診断装置の第3の実施形態の送波信号および受波信号のスペクトラムのシミュレーション結果を示すグラフである。
【符号の説明】
1 超音波探触子
3 送波部
5 受波部
7 画像作成表示部
9 任意波形発生器
11 時間軸制御器
13 送波器
15 受信器
17 整相加算器
19 ライン加算器
21 帯域フィルタ
23 システム制御部[0001]
BACKGROUND OF THE INVENTION
The present invention relates to an ultrasonic diagnostic apparatus, and more particularly to an ultrasonic diagnostic apparatus that images a harmonic signal generated when ultrasonic waves propagate through a subject.
[0002]
[Prior art]
The ultrasonic diagnostic apparatus transmits an ultrasonic signal into a subject, and obtains information used for diagnosis such as a tomographic image based on a received signal including the echo signal.
[0003]
In the technique for displaying such a tomographic image, a fundamental wave component (frequency f0) (For example, frequency 2f)0, 3f0It has been reported that an image with good contrast can be obtained by imaging the above. Such an imaging method is called Tissue Harmonic Imaging.
[0004]
The above-described harmonic components are generated mainly due to nonlinear distortion that occurs when ultrasonic waves propagate through the subject. That is, the ultrasonic wave irradiated into the living body is distorted during tissue propagation due to the non-linear response of the tissue, and the harmonic component increases. As a result, the echo signal includes, for example, the fundamental wave f.02f of twice the frequency0Or 3f of 3 times the frequency0Will be included.
[0005]
In tissue harmonic imaging, the key is how to extract echoes of strong harmonic components. One example of a conventionally reported tissue harmonic imaging method is called a filter method. This is because the center frequency is 2f, for example.0For example, 2f from the received signal using a bandpass filter of0The harmonic component of is extracted. Another example is called a pulse inversion method. This is because the first and second transmission waveforms whose polarities are reversed with respect to each other are transmitted at time intervals, and the second harmonic component is canceled by phasing and adding the respective echo signals to cancel the fundamental wave component. Is emphasized.
[0006]
[Problems to be solved by the invention]
However, since the harmonic component of the ultrasonic signal has a higher frequency than the fundamental component, it is susceptible to attenuation during propagation, and the degree of arrival of the echo signal from the deep part, that is, the penetration is not good. . On the other hand, the center frequency f of the fundamental wave0Decreasing the value makes it less susceptible to attenuation, so penetration can be improved, but as is well known, the resolution decreases.
[0007]
In view of the above-described problems, an object of the present invention is to improve the penetration while maintaining the resolution.
[0008]
[Means for Solving the Problems]
The present invention processes an ultrasonic probe, a wave transmitting unit that transmits an ultrasonic signal to a subject via the ultrasonic probe, and a received signal received by the ultrasonic probe A receiving unit; and an image generating unit that generates an image based on the received signal processed by the receiving unit. The transmitting unit transmits the ultrasonic signal in the same direction with a time interval. The ultrasonic signal transmitted a plurality of times includes a first waveform and a second waveform, and the reception unit includes a reception signal corresponding to the first waveform, In the ultrasonic diagnostic apparatus having a function of performing phasing addition with the received signal corresponding to the second waveform, the transmitting unit causes the first waveform to change so that the frequency increases with time, and A function of shifting the second waveform so that the frequency decreases with time, and a transmission focus depth of the ultrasonic signal; A has a function of variably set,The first waveform is a continuous waveform whose frequency increases over time, the second waveform is a continuous waveform whose frequency decreases over time, and the first waveform and the second waveform are time-dependent. It is a line-symmetric shape with respect to the orthogonal line of the axis,The rate of change of the frequency of the first waveform and the second waveform is variably set according to the transmission focus depth.
[0009]
According to this, the same frequency f as in the prior art.0The frequency spectrum of the received signal after phasing addition changes when the waveform of0Or 2f0The components in the frequency band of can be emphasized. Such a frequency band component is 2f.0Since the frequency is lower than that, it is not easily affected by attenuation and has good penetration. Therefore, by extracting this frequency component and generating an image based thereon, f0The penetration in tissue harmonic imaging can be improved without lowering the image, that is, without reducing the resolution.
[0010]
here,In the case where the transmission unit has a function of shifting the first waveform so that the frequency increases with time, and having the function of shifting the second waveform so that the frequency decreases with time, the first waveform and the The second waveform has an axisymmetric shape with respect to the orthogonal line of the time axis. Also,The waveform in which the frequency changes may be formed by, for example, connecting one cycle or a plurality of cycles of waveforms having different frequencies. Moreover, it is good also as a structure which connects parts, such as 1/2 cycle, 1/4 cycle, 1/8 cycle, etc. of the waveform from which a frequency differs, Even if it uses a chirp waveform from which a frequency changes continuously. Good.
[0011]
In this case, the change in the frequency spectrum described above changes by variably setting the rate of change in the frequency of the first waveform and the second waveform, but particularly from a deep part (part far from the probe) in the subject. When obtaining the diagnostic information, it is preferable to shift the frequency spectrum of the received signal to a low value and to make settings with emphasis on penetration. Therefore, the transmission unit has a function of variably setting the transmission focus depth of the ultrasonic signal, and the rate of change of the frequency of the first waveform and the second waveform is variably set according to the transmission focus depth. It is good to do so.
[0012]
In this case, if the first waveform and the second waveform are changed so that the signal intensity decreases, the above-described spectrum change can be emphasized. In this case, the change rate at which the signal intensity of the first waveform and the second waveform changes according to the transmission focus depth may be variably set according to the transmission focus depth.
[0013]
Further, the polarities of the first waveform and the second waveform are inverted from each other, and the receiving unit amplifies or receives the received signals respectively corresponding to the first waveform and the second waveform with a gain difference. It is good also as a structure which has the function to reduce and perform phasing addition.
[0014]
Even in this case, the frequency spectrum of the received signal after phasing addition changes, and f0Or 2f0Since the component in the frequency band can be emphasized, f0The penetration can be improved without lowering, that is, without reducing the resolution. In this case, the gain difference may be variably set according to the reception timing of the reception signal, that is, the reception focus depth. For example, it may be configured to perform time gain control with different correlation curves between the reception timing and the gain for the received signals corresponding to the first waveform and the second waveform, respectively.
[0015]
Further, the receiving unit has a function of performing reception focus processing on the received signal and a filter for extracting a set frequency band of the received signal, and the frequency band is set according to the set depth of the received focus. It may be configured to be variably set. According to this, it is possible to adapt to changes in the spectrum of the received signal due to the difference in attenuation due to the difference in the received focus depth, that is, the depth of the region to be diagnosed in the subject, and extract components in a suitable frequency band can do.
[0016]
Further, when the change rate at which the frequency of the first waveform and the second waveform change or the change rate at which the signal intensity changes is variably set according to the setting depth of the transmission focus, the reception by changing them. In order to adapt to changes in the spectrum of the signal, the frequency band of the filter may be variably set according to the setting depth of the transmission focus.In the case where the transmission unit has a function of changing the first waveform so that the frequency increases with time and changing the second waveform so that the frequency decreases with time, the first waveform Alternatively, the frequency of both the second waveform or the first waveform and the second waveform may be increased or decreased every two or more cycles, or the first waveform, the second waveform, the first waveform, and the first waveform may be decreased. Both of the two waveforms may increase or decrease the frequency every less than one cycle, or the first waveform or the second waveform or both the first waveform and the second waveform may increase or decrease the frequency continuously. May be.
[0017]
DETAILED DESCRIPTION OF THE INVENTION
Hereinafter, a first embodiment of an ultrasonic diagnostic apparatus to which the present invention is applied will be described. FIG. 1 is a diagram illustrating a configuration of an ultrasonic diagnostic apparatus according to the present embodiment. As shown in FIG. 1, the ultrasonic diagnostic apparatus includes an
[0018]
The
[0019]
The
[0020]
Next, the operation of the above-described ultrasonic diagnostic apparatus will be described. First, the arbitrary waveform generator 9 generates and outputs a waveform of a transmission signal based on an instruction from the
[0021]
On the other hand, an ultrasonic signal propagating in the subject as such an ultrasonic beam is reflected at a portion where the acoustic impedance in the subject is different, and this reflected wave returns to the
[0022]
Next, the first waveform, the second waveform, and the frequency spectrum of the transmitted signal and the received signal according to the features of the ultrasonic diagnostic apparatus of the present embodiment will be described. First, in order to make it easy to understand the features of the present embodiment, the simulation results are shown in FIG. 2 for the first waveform, the waveform of the second waveform, and the frequency spectrum of the transmitted signal and received signal in the existing pulse inversion method. ,explain. FIG. 2 (1) is a graph showing the first waveform and the second waveform with time on the horizontal axis and the sound pressure of the transmitted signal on the vertical axis. Here, the first waveform is indicated by a solid line, and the second waveform is indicated by a broken line. As shown in FIG. 2A, both the first waveform and the second waveform have the same frequency f.0Hanning weights are applied to a series of two cycles of a sine wave (= 2 MHz) to resemble a waveform in a living body. And the 1st waveform and the 2nd waveform have the relation which reversed the polarity. That is, the first waveform has a polarity with which the sound pressure falls at the start of the signal, and the second waveform has a polarity with which the sound pressure rises.
[0023]
FIG. 2 (2) is a graph showing the frequency spectrum of the transmitted signal and the received signal obtained by phasing and adding the received signals corresponding to the first waveform and the second waveform, respectively. This graph shows f on the horizontal axis0= Specific frequency for 2.0 MHz (f / f0), And the vertical axis represents the signal intensity (dB). In FIG. 2 (2), the spectrum of the transmitted signal is indicated by a broken line, and the spectrum of the combined received signal is indicated by a solid line.
[0024]
As shown in FIG. 2 (2), the spectrum of the transmitted signal increases the signal strength when the frequency is increased from 0, and the frequency f0Has a peak having the first maximum. When the frequency is further increased, the signal intensity is reduced and the frequency 2f0Is reduced to -40 dB or less with respect to the first peak. And frequency 2f0When the frequency is further improved from the above, the signal strength starts to improve again, and the frequency 2.3f0It takes a second peak in the vicinity and then decreases again. The signal intensity of the second peak is about −32 dB with respect to the first peak.
[0025]
On the other hand, the spectrum of the synthesized received signal has a peak at which the signal intensity becomes maximum at 0.6 f.0Neighborhood, 2f0Neighborhood and 4f0There is a valley that has a minimum signal strength in the vicinity of 1.2 f.0Neighborhood and 3.3f0Have in the vicinity. The maximum signal strength of the peak is 2f0A nearby peak, 0.6f for this signal strength0Neighborhood and 4f0The signal strength of nearby peaks is about -14 dB. On the other hand, the signal strength in the valley where the signal strength is minimum is 2f.01.2f for signal strength at peak0Nearly -28dB, 3.3f0It is about -21 dB in the vicinity.
[0026]
Next, a simulation result is illustrated in FIG. 3 for an example of the waveforms of the first waveform and the second waveform, and the frequency spectrum of the transmitted signal and the received signal in which the frequency changes in the ultrasonic diagnostic apparatus of the present embodiment. To do. FIG. 3A is a graph showing the first waveform and the second waveform with time on the horizontal axis and the sound pressure of the transmitted signal on the vertical axis. Here, the first waveform is indicated by a solid line, and the second waveform is indicated by a broken line. As shown in FIG. 3 (1), the first waveform has a frequency f.1The first cycle of (= 1.8 MHz) and the frequency f2The second cycle of (= 2.2 MHz) is configured to be continuous and has a polarity in which the sound pressure falls at the start of the signal. On the other hand, the second waveform has a frequency f2Cycle 1 and frequency f1And the second cycle of thestand upPolarity. The first waveform and the second waveform are both subjected to the same Hanning weight as the waveform shown in FIG. In other words, the second waveform can be said to be a time reversal of the first waveform.
[0027]
FIG. 3B is a graph showing the frequency spectrum of the transmitted signal and the received signal obtained by phasing and adding the received signals corresponding to the first waveform and the second waveform, respectively. This graph shows f on the horizontal axis as in FIG.0= The specific frequency (f / f0) with respect to 2.0 MHz is taken, and the signal intensity (dB) is taken on the vertical axis. In FIG. 3B, the spectrum of the transmitted signal is indicated by a broken line, and the spectrum of the received signal subjected to phasing and addition is indicated by a solid line.
[0028]
As shown in FIG. 3 (2), in the spectrum of the transmission signal, when the frequency is increased from 0, the signal strength is improved and the frequency f0Has a maximum peak. And if the frequency is further improved, the signal strength decreases. Frequency 2f0Recently, the rate of decrease in signal strength decreases, and after the rate of decrease becomes almost zero, the signal strength decreases again while increasing the rate of decrease. By the way, frequency 2f0The signal strength in the vicinity is the frequency f0The peak is about -23 dB.
[0029]
On the other hand, the spectrum of the received signal that has been subjected to phasing and addition has a peak at which the signal intensity becomes maximum at 0.40Neighborhood, 1.6f0Neighborhood and 2.8f0A valley that has a minimum signal strength in the vicinity is 0.7 f.0Neighborhood, 2.2f0Neighborhood and 3.7f0Have in the vicinity. Of the maximum peaks, the signal intensity is maximum at 1.6 f.0A nearby peak, 0.4 f for this signal strength0Neighborhood and 2.8f0The signal strength of neighboring peaks is about -12 dB and -2 dB, respectively. On the other hand, the signal strength in the valley where the signal strength is minimum is 0.7 f.0-14dB, 2.2f in the vicinity0Nearly -17dB, 3.7f in the vicinity0It is about -35 dB in the vicinity.
[0030]
As is clear from comparing FIG. 3 (2) with FIG. 2 (2), in the existing pulse inversion method, if the received signals corresponding to the first waveform and the second waveform are synthesized, 2f0Nearest frequency components are most emphasized, whereas f1And f2And the peak of the signal intensity is 1.6 f.0It can be seen that the frequency spectrum is shifted low.
[0031]
In the ultrasonic diagnostic apparatus according to the present embodiment, the frequency f depends on the set depth of the transmission focus.1And f2Δf (= | f1-F2|) Is variably set. Specifically, Δf is variably set so that the frequency spectrum of the signal obtained by synthesizing the reception signals corresponding to the first waveform and the second waveform shifts lower as the transmission focus depth becomes deeper. . At this time, the frequency f1And f2The average frequency is f0It remains constant. When the transmission focus depth is shallow, Δf is set to 0 and transmission / reception is performed by the existing pulse inversion method. Then, Δf is changed as the transmission focus depth becomes deeper, and the peak of the frequency spectrum described above becomes 2f.0For example f0Up to 2f0For example 1.5f0A transmission signal is generated so as to shift to For example, in the case of performing known transmission multi-stage focusing in which reception signals of a plurality of ultrasonic beams having different transmission focus depths are connected to complete a reception signal related to one beam line, Δf is varied according to the focus depth. For example, when performing three-stage focusing, the peak of the frequency spectrum is, for example, 2f when the focus depth is shallow.01.8f01.6f0Δf of each stage is set so that The setting of Δf according to the transmission focus depth can be performed by simulation or an experiment using an ultrasonic phantom.
[0032]
Further, the ultrasonic diagnostic apparatus according to the present embodiment is characterized in that the pass frequency band of the
[0033]
Further, the pass frequency band of the
[0034]
As described above, according to the present embodiment, by phasing and adding the received signals respectively corresponding to the first waveform in which the frequency is increased and the second waveform in which the frequency is decreased, f0Or 2f0Since the frequency component in is emphasized, 2f0It is less susceptible to attenuation than the existing pulse inversion method that emphasizes, and penetration can be improved at a deep focus portion, and 2f at a shallow portion.0Since the image is formed with the components, the resolution can be maintained.
[0035]
Also, since the rate of change of the frequency of the first waveform and the second waveform is variably set according to the transmission focus depth, a relatively high frequency component is emphasized at a shallow focus depth to emphasize the contrast. In the deep focus depth, a relatively low frequency component can be emphasized so that penetration is emphasized, and a good image can be generated by adapting to the set depth of transmission focus.
[0036]
Furthermore, since the frequency band pass filter operation is performed on the received signal after phasing addition, and this pass frequency band is varied according to the transmission focus depth, the rate of change at which the frequency of the transmitted signal changes It is possible to extract a frequency band that is emphasized according to the above.
[0037]
In addition, since this pass frequency band is variably set according to the reception focus depth, the frequency band adapted to the change in the spectrum of the received signal due to the difference in attenuation due to the difference in the propagation distance of the received signal is extracted. can do.
[0038]
For example, when diagnosing a relatively shallow site where penetration is not a problem, 2f0Image generation may be performed by extracting higher frequency components. For example, referring to FIG. 3 (2), 2.8f0Although it can be seen that there is a peak in the vicinity, for example, such a frequency is 2f.0An image may be generated by extracting a signal intensity in the vicinity of a larger peak by a band pass filter. According to this, the image contrast at the time of diagnosing a shallow part becomes favorable.
[0039]
Moreover, when diagnosing such a shallow site | part, you may make it raise the center frequency of a transmission signal. For example, in the example of FIG. 3, the center frequency f0= 2.0 MHz, and the first waveform and the second waveform are f1= 1.8MHz, f2= 2.2 MHz, for example, this is the center frequency f0= 2.1 MHz, f1= 2.0 MHz, f2= 2.2 MHz may be set. According to this, an image with good contrast can be obtained at a relatively shallow depth at which penetration is not a problem.
[0040]
In the above-described embodiment, the second waveform is obtained by time-inverting the first waveform by the time axis controller. However, when the arbitrary waveform generator can directly generate the second waveform, the time is An axis controller is not required.
[0041]
Further, in the above-described embodiment, the first waveform and the second waveform are each formed by continuing two cycles of waveforms, but may be configured by continuing waveforms of three cycles or more. For example, the first waveform is f1= 1.8MHz, f2= 2.0 MHz, f3= 2.2 MHz waveform may be continuous for each cycle, and the second waveform may be obtained by time-reversing the first waveform. Thus, the first waveform is a continuous one-cycle waveform with center frequencies f1, f2,... Fn,... FN (N ≧ 2), and f1 <f2 <. When the second waveform is in a time axis inversion relationship with the first waveform, even if N = 4 or more, the gist of the present invention is not impaired, but when the wave number increases, the difference between the two transmission waves is relatively Since this is mitigated, the present invention is considered to be particularly effective in the range of N <6.
[0042]
In the above-described embodiment, the first waveform and the second waveform are each configured by a combination of sine waves having different frequencies for each cycle. For example, the frequencies are changed for every two cycles or more. It may be. Further, for example, the frequency may be finely changed, such as every 1/2 cycle or 1/4 cycle, or a so-called chirp waveform in which the frequency continuously changes may be used.
[0043]
Next, a second embodiment of an ultrasonic diagnostic apparatus to which the present invention is applied will be described. Description of the same parts as those in the first embodiment is omitted, and only differences will be described. The ultrasonic diagnostic apparatus of this embodiment is characterized in that the amplitudes of the first waveform and the second waveform both change. That is, the present embodiment is characterized in that the amplitude of the waveform of the first cycle of each of the first waveform and the second waveform is set to be larger than the amplitude of the subsequent waveform.
[0044]
FIG. 5 shows a simulation result for an example of the waveforms of the first waveform and the second waveform, and the frequency spectrum of the transmitted signal and the received signal in which the frequency and amplitude change in the ultrasonic diagnostic apparatus of the present embodiment. . FIG. 5 (1) is a graph showing the first waveform and the second waveform with time on the horizontal axis and the sound pressure of the transmitted signal on the vertical axis. Here, the first waveform is indicated by a solid line, and the second waveform is indicated by a broken line. As shown in FIG. 5 (1), the first waveform has a frequency f.1The first cycle of (= 1.8 MHz) and the frequency f2The second cycle of (= 2.2 MHz) is configured to be continuous and has a polarity in which the sound pressure falls at the start of the signal. On the other hand, the second waveform has a frequency f2Cycle 1 and frequency f1The second cycle is continuous, and the polarity is such that the sound pressure rises at the start of the signal. In both the first waveform and the second waveform, the amplitude A2 in the second cycle is set smaller than the amplitude A1 in the first cycle. For example, in the case of FIG. 5A, A2 = 0.9A1 is set. Yes.
[0045]
FIG. 5B is a graph showing the frequency spectrum of the transmission signal and the reception signal obtained by phasing and adding the reception signals corresponding to the first waveform and the second waveform, respectively. As in FIG. 2 (2), the horizontal axis represents f.0= Specific frequency for 2.0 MHz (f / f0) And the horizontal axis represents the signal intensity (dB). In FIG. 5 (2), the spectrum of the transmitted signal is indicated by a broken line, and the spectrum of the received signal subjected to phasing and addition is indicated by a solid line.
[0046]
As shown in FIG. 5 (2), the spectrum of the transmitted signal is similar to the transmitted signal spectrum shown in FIG. 3 (2), but the frequency 2f0The signal strength in the vicinity is f0It is about −25 dB with respect to the signal strength in the vicinity.
[0047]
On the other hand, the spectrum of the received signal that has been subjected to phasing and addition has a peak at which the signal intensity becomes maximum at 0.40Neighborhood, 1.6f0Neighborhood and 2.8f0A valley that has a minimum signal strength in the vicinity is 0.7 f.0Neighborhood, 2.2f0Neighborhood and 3.8f0Have in the vicinity. Of the maximum peaks, the signal intensity is maximum at 1.6 f.0A nearby peak, 0.4 f for this signal strength0Neighborhood and 2.8f0The signal strength of neighboring peaks is about -13 dB and about -2 dB, respectively. On the other hand, the signal strength in the valley where the signal strength is minimum is 0.7 f.0Nearly -17dB, 2.2f0About -10dB in the vicinity, 3.8f0In the vicinity, it is −40 dB or less.
[0048]
As is clear from a comparison between FIG. 5 (2) and FIG. 2 (2), the frequency f is as in this embodiment.1And f2And by shifting the amplitudes A1 and A2, the peak of the signal intensity is 1.6 f.0It can be seen that the frequency spectrum is shifted low.
[0049]
In the ultrasonic diagnostic apparatus according to the present embodiment, the frequency f depends on the set depth of the transmission focus.1And f2And the ratio A2 / A1 of the amplitudes A1 and A2 are variably set. Specifically, as in the first embodiment, as the transmission focus depth increases, the frequency spectrum of the signal obtained by synthesizing the received signals respectively corresponding to the first waveform and the second waveform shifts lower. Thus, Δf and A2 / A1 are variably set.
[0050]
As described above, according to the present embodiment, in addition to the same effects as those of the first embodiment described above, the received signal subjected to phasing addition by shifting the amplitudes of the first waveform and the second waveform together. It is possible to further emphasize the spectral shift of.
[0051]
Next, a third embodiment of an ultrasonic diagnostic apparatus to which the present invention is applied will be described. The description of the same parts as those of the first embodiment is also omitted, and only the differences are described.
FIG. 6 is a diagram illustrating a configuration of the ultrasonic diagnostic apparatus according to the present embodiment. As shown in FIG. 6, the ultrasonic diagnostic apparatus is not illustrated via an ultrasonic probe or
[0052]
In addition, the
[0053]
Next, the operation of the above-described ultrasonic diagnostic apparatus will be described. In the ultrasonic diagnostic apparatus of the present embodiment, the first waveform and the second waveform are the same as those shown in FIG.0Are used, and the same waveform as the existing pulse inversion method in which the first waveform and the second waveform have a time reversal or polarity reversal relationship is used. Then, in the
[0054]
7 to 9 are graphs showing simulation results of the frequency spectrum of the transmitted signal and the synthesized received signal in the present embodiment, and gains for the received signals corresponding to the first waveform and the second waveform, respectively. Are ratios of 1: 1, 1.2: 0.8, and 1.35: 0.65, respectively. In each figure, as in FIG. 2 (2), the horizontal axis represents f.0= Specific frequency for 2 MHz (f / f0), And the vertical axis represents the signal intensity (dB). Further, the spectrum of the transmitted signal is indicated by a broken line, and the spectrum of the received signal after phasing addition is indicated by a solid line. Here, needless to say, the spectrum of the transmitted signal is the same as that shown in FIG.
[0055]
Next, the spectrum of the received signal after phasing addition in each figure will be described. FIG. 7 shows the case where the ratio of gain to the received signal corresponding to the first waveform and the second waveform (hereinafter referred to as “gain ratio”) is 1: 1. As shown in FIG. 7, the spectrum of the received signal has a peak at which the signal intensity reaches a maximum of 0.6 f.0Neighborhood, 1.9f0Neighborhood and 3.7f0Have in the vicinity. On the other hand, the valley where the signal intensity becomes minimum is 1.1 f.0Neighborhood and 2.9f0Have in the vicinity. The maximum signal strength is 1.9f0The signal strength at each peak and valley with respect to the signal strength at this time is 0.6 f.0-9dB, 1.1f in the vicinity0About -25dB in the vicinity, 2.9f0Nearly -17dB, 3.7f in the vicinity0It is about −6 dB in the vicinity.
[0056]
FIG. 8 shows the case where the gain ratio is 1.2: 0.8. As shown in FIG. 8, the spectrum of the received signal has a peak at which the signal intensity reaches a maximum of 0.6 f.0Neighborhood, 1.9f0Neighborhood and 3.7f0Have in the vicinity. On the other hand, the valley where the signal intensity is minimized is f0Neighborhood and 2.9f0Have in the vicinity. The maximum signal strength is 1.9f0The signal strength at each peak and valley with respect to the signal strength at this time is 0.6 f.0-8 dB in the vicinity, f0Nearly -15dB, 2.9f in the vicinity0Nearly -13dB, 3.7f in the vicinity0It is about −5 dB in the vicinity.
[0057]
FIG. 9 shows the case where the gain ratio is 1.2: 0.8. As shown in FIG. 9, the spectrum of the received signal has a peak at which the signal intensity reaches a maximum of 0.6 f.0Neighborhood, 1.9f0Neighborhood and 3.7f0Have in the vicinity. On the other hand, the valley where the signal intensity is minimized is 0.9 f.0Neighborhood and 2.9f0Have in the vicinity. The maximum signal strength is 1.9f0The signal strength at each peak and valley with respect to the signal strength at this time is 0.6 f.0Nearly -8dB, 0.9f0Nearly -9dB, 2.9f in the vicinity0About -10dB in the vicinity, 3.7f0It is about −5 dB in the vicinity.
[0058]
As is apparent from a comparison of FIGS. 7 to 9, the spectrum of the received signal subjected to phasing and addition is changed by changing the gain ratio, for example, f0To 2f08 is more emphasized than FIG. 7 and FIG. 9 is emphasized rather than FIG. For example, 1.5f0Paying attention to the signal strength at 1.9f0The signal intensity with respect to the peak is about -7 dB in FIG. 7, about -5 dB in FIG. 8, and about -3 dB in FIG.
[0059]
In the present embodiment, the gain ratio is variably set according to the setting depth of the reception focus. Specifically, the gain ratio is set to increase as the receiving focus depth increases. Such a change in the gain ratio is continuously performed according to the reception timing in conjunction with the well-known reception dynamic focus. That is, time gain control is performed on the received signals corresponding to the first waveform and the second waveform, respectively, with different correlation curves between the reception timing and the gain.
[0060]
The
[0061]
As described above, according to the present embodiment, the first waveform and the second waveform are configured to have opposite polarities, and the received signals corresponding to the first waveform and the second waveform are given a gain difference. Respectively, by changing the frequency spectrum of the received signal after the phasing addition,0Or 2f0Since the component in the frequency band can be emphasized, f0The penetration can be improved without reducing the resolution or reducing the resolution.
[0062]
Since the gain difference and the pass frequency band of the variable band filter are variably set according to the receiving focus depth, the gain difference is reduced or set to 0 at a relatively shallow portion, and the variable band filter By setting a wide pass frequency band, it is possible to emphasize a broadband second-order harmonic component in which the fundamental wave component is canceled. On the other hand, the penetration can be improved by increasing the gain difference, narrowing the pass frequency band, and lowering the center frequency in a relatively deep part.
[0063]
In the above-described embodiment, the gain for the received signal corresponding to the first waveform and the gain for the received signal corresponding to the second waveform are both varied, but one is fixed and only the other is varied. It is good also as a structure. For example, the gain corresponding to the first waveform may be fixed to 1 and only the gain corresponding to the second waveform may be varied. For example, the gain ratio may be variably set stepwise such as 1: 1, 1: 0.6, 1: 0.3. Further, in addition to or instead of making the gain for the received signal different, the amplitude at the time of transmission of the first waveform and the second waveform may be made different.
[0064]
【The invention's effect】
According to the present invention, it is possible to improve the penetration while maintaining the resolution.
[Brief description of the drawings]
FIG. 1 is a diagram showing a configuration of a first embodiment of an ultrasonic diagnostic apparatus to which the present invention is applied.
FIG. 2 is a graph showing a simulation result of a transmission signal waveform by an existing pulse inversion method and a spectrum of a transmission signal and a reception signal.
3 is a graph showing a simulation result of a transmission signal waveform and a spectrum of a transmission signal and a reception signal in the ultrasonic diagnostic apparatus of FIG. 1;
FIG. 4 is a schematic diagram showing a change in a reception spectrum depending on a generation depth of a reception signal.
FIG. 5 is a graph showing a simulation result of a transmission signal waveform and a spectrum of a transmission signal and a reception signal of an ultrasonic diagnostic apparatus according to a second embodiment to which the present invention is applied.
FIG. 6 is a diagram showing a configuration of a third embodiment of an ultrasonic diagnostic apparatus to which the present invention is applied.
FIG. 7 is a graph showing a simulation result of a spectrum of a transmission signal and a reception signal of an ultrasonic diagnostic apparatus according to a third embodiment to which the present invention is applied.
FIG. 8 is a graph showing a simulation result of a spectrum of a transmission signal and a reception signal of an ultrasonic diagnostic apparatus to which the present invention is applied according to a third embodiment.
FIG. 9 is a graph showing a simulation result of a spectrum of a transmission signal and a reception signal of the third embodiment of the ultrasonic diagnostic apparatus to which the present invention is applied.
[Explanation of symbols]
1 Ultrasonic probe
3 Wave transmitter
5 receiving part
7 Image creation display
9 Arbitrary waveform generator
11 Time axis controller
13 Transmitter
15 Receiver
17 Phased adder
19 line adder
21 Bandpass filter
23 System controller
Claims (8)
Priority Applications (7)
| Application Number | Priority Date | Filing Date | Title |
|---|---|---|---|
| JP2002126075A JP4192490B2 (en) | 2002-04-26 | 2002-04-26 | Ultrasonic diagnostic equipment |
| US10/512,472 US8043220B2 (en) | 2002-04-26 | 2003-04-03 | Ultrasonograph |
| EP03747204A EP1500371A4 (en) | 2002-04-26 | 2003-04-03 | Ultrasonograph |
| CN2007101848126A CN101152095B (en) | 2002-04-26 | 2003-04-03 | Ultrasonograph |
| CNB038092891A CN100430023C (en) | 2002-04-26 | 2003-04-03 | Ultrasonic diagnostic equipment |
| PCT/JP2003/004285 WO2003090625A1 (en) | 2002-04-26 | 2003-04-03 | Ultrasonograph |
| CNB2007101848107A CN100560029C (en) | 2002-04-26 | 2003-04-03 | Diagnostic ultrasound equipment |
Applications Claiming Priority (1)
| Application Number | Priority Date | Filing Date | Title |
|---|---|---|---|
| JP2002126075A JP4192490B2 (en) | 2002-04-26 | 2002-04-26 | Ultrasonic diagnostic equipment |
Related Child Applications (2)
| Application Number | Title | Priority Date | Filing Date |
|---|---|---|---|
| JP2008098901A Division JP4769840B2 (en) | 2008-04-07 | 2008-04-07 | Ultrasonic diagnostic equipment |
| JP2008098933A Division JP4719765B2 (en) | 2008-04-07 | 2008-04-07 | Ultrasonic diagnostic equipment |
Publications (3)
| Publication Number | Publication Date |
|---|---|
| JP2003310609A JP2003310609A (en) | 2003-11-05 |
| JP2003310609A5 JP2003310609A5 (en) | 2005-09-15 |
| JP4192490B2 true JP4192490B2 (en) | 2008-12-10 |
Family
ID=29267583
Family Applications (1)
| Application Number | Title | Priority Date | Filing Date |
|---|---|---|---|
| JP2002126075A Expired - Fee Related JP4192490B2 (en) | 2002-04-26 | 2002-04-26 | Ultrasonic diagnostic equipment |
Country Status (5)
| Country | Link |
|---|---|
| US (1) | US8043220B2 (en) |
| EP (1) | EP1500371A4 (en) |
| JP (1) | JP4192490B2 (en) |
| CN (3) | CN100560029C (en) |
| WO (1) | WO2003090625A1 (en) |
Families Citing this family (26)
| Publication number | Priority date | Publication date | Assignee | Title |
|---|---|---|---|---|
| US20040267129A1 (en) * | 2003-05-30 | 2004-12-30 | Angelsen Bjorn A.J. | Ultrasonic contrast agent detection and imaging by low frequency manipulation of high frequency scattering properties |
| US8038616B2 (en) * | 2003-05-30 | 2011-10-18 | Surf Technology As | Acoustic imaging by nonlinear low frequency manipulation of high frequency scattering and propagation properties |
| US8333702B2 (en) | 2004-10-27 | 2012-12-18 | Kabushiki Kaisha Toshiba | Ultrasonic probe and ultrasonic diagnostic apparatus |
| JP5355924B2 (en) * | 2008-03-31 | 2013-11-27 | 株式会社東芝 | Ultrasonic diagnostic equipment |
| JP4769840B2 (en) * | 2008-04-07 | 2011-09-07 | 株式会社日立メディコ | Ultrasonic diagnostic equipment |
| JP4627556B2 (en) * | 2008-08-08 | 2011-02-09 | アロカ株式会社 | Ultrasonic diagnostic equipment |
| EP2661329B1 (en) * | 2011-01-06 | 2014-09-10 | The Lubrizol Corporation | Improvements in or relating to ultrasound generating apparatus, and methods for generating ultrasound |
| US8900148B2 (en) * | 2011-03-09 | 2014-12-02 | Fujifilm Corporation | Ultrasound diagnostic apparatus |
| AU2012332817B2 (en) | 2011-10-28 | 2017-03-30 | Decision Sciences International Corporation | Spread spectrum coded waveforms in ultrasound imaging |
| WO2013191261A1 (en) * | 2012-06-22 | 2013-12-27 | 株式会社東芝 | Ultrasound diagnostic device |
| JP5924296B2 (en) | 2013-03-19 | 2016-05-25 | コニカミノルタ株式会社 | Ultrasound diagnostic imaging equipment |
| US9844359B2 (en) | 2013-09-13 | 2017-12-19 | Decision Sciences Medical Company, LLC | Coherent spread-spectrum coded waveforms in synthetic aperture image formation |
| JP6344026B2 (en) * | 2014-04-14 | 2018-06-20 | コニカミノルタ株式会社 | Ultrasonic probe and ultrasonic diagnostic imaging apparatus |
| KR102303830B1 (en) * | 2014-08-20 | 2021-09-17 | 삼성전자주식회사 | Ultrasonic diagnostic equipment capable of generating harmonic image and method of generating ultrasonic image including harmonic image |
| US10743838B2 (en) | 2015-02-25 | 2020-08-18 | Decision Sciences Medical Company, LLC | Acoustic signal transmission couplants and coupling mediums |
| JP6235508B2 (en) * | 2015-03-18 | 2017-11-22 | 株式会社Subaru | Ultrasonic flaw detection system, ultrasonic flaw detection method, and aircraft part manufacturing method |
| JP6443217B2 (en) | 2015-05-21 | 2018-12-26 | コニカミノルタ株式会社 | Ultrasound diagnostic imaging equipment |
| JP6591242B2 (en) * | 2015-09-14 | 2019-10-16 | キヤノンメディカルシステムズ株式会社 | Ultrasonic diagnostic apparatus and signal processing apparatus |
| CN108366775B (en) | 2015-10-08 | 2022-06-14 | 决策科学医疗有限责任公司 | Acoustic surgical tracking system and method |
| US20180317888A1 (en) * | 2015-11-24 | 2018-11-08 | Koninklijke Philips N.V. | Ultrasound systems with microbeamformers for different transducer arrays |
| EP3482692A4 (en) * | 2016-07-05 | 2020-01-22 | Hitachi, Ltd. | Spectrum analysis device, spectrum analysis method, and ultrasonic imaging device |
| CA3112852A1 (en) * | 2018-09-18 | 2020-03-26 | The University Of British Columbia | Ultrasonic analysis of a subject |
| JP7302163B2 (en) | 2018-11-22 | 2023-07-04 | コニカミノルタ株式会社 | ULTRASOUND DIAGNOSTIC APPARATUS AND ULTRASOUND IMAGE GENERATING METHOD |
| JP7280713B2 (en) * | 2019-02-27 | 2023-05-24 | キヤノンメディカルシステムズ株式会社 | ultrasound diagnostic equipment |
| US11154274B2 (en) | 2019-04-23 | 2021-10-26 | Decision Sciences Medical Company, LLC | Semi-rigid acoustic coupling articles for ultrasound diagnostic and treatment applications |
| JP2023549818A (en) | 2020-11-13 | 2023-11-29 | ディスィジョン サイエンシズ メディカル カンパニー,エルエルシー | System and method for synthetic aperture ultrasound imaging of objects |
Family Cites Families (23)
| Publication number | Priority date | Publication date | Assignee | Title |
|---|---|---|---|---|
| US4534221A (en) * | 1982-09-27 | 1985-08-13 | Technicare Corporation | Ultrasonic diagnostic imaging systems for varying depths of field |
| JP3090718B2 (en) * | 1990-07-11 | 2000-09-25 | 株式会社東芝 | Ultrasound diagnostic equipment |
| US5243993A (en) * | 1991-06-28 | 1993-09-14 | Life Fitness | Apparatus and method for measuring heart rate |
| JPH0542157A (en) * | 1991-08-09 | 1993-02-23 | Olympus Optical Co Ltd | Ultrasonic diagnostic device |
| JP2627835B2 (en) | 1991-08-19 | 1997-07-09 | 石塚硝子株式会社 | Section discharge device of 28-type glass forming machine |
| US5517996A (en) * | 1994-04-21 | 1996-05-21 | Hitachi Medical Corporation | Ultrasonic diagnostic apparatus |
| US5724976A (en) * | 1994-12-28 | 1998-03-10 | Kabushiki Kaisha Toshiba | Ultrasound imaging preferable to ultrasound contrast echography |
| US5608690A (en) * | 1995-03-02 | 1997-03-04 | Acuson Corporation | Transmit beamformer with frequency dependent focus |
| US5582173A (en) * | 1995-09-18 | 1996-12-10 | Siemens Medical Systems, Inc. | System and method for 3-D medical imaging using 2-D scan data |
| JP4382884B2 (en) | 1996-11-08 | 2009-12-16 | コーニンクレッカ フィリップス エレクトロニクス エヌ ヴィ | Ultrasonic image processing method and apparatus using harmonics |
| JP3377395B2 (en) * | 1997-03-21 | 2003-02-17 | 株式会社荏原製作所 | Focused electromagnetic ultrasonic transducer and electromagnetic ultrasonic inspection method |
| US5913823A (en) * | 1997-07-15 | 1999-06-22 | Acuson Corporation | Ultrasound imaging method and system for transmit signal generation for an ultrasonic imaging system capable of harmonic imaging |
| US5891040A (en) * | 1998-02-18 | 1999-04-06 | Hewlett-Packard Company | Method for maintaining a constant velocity to color map in an ultrasound flow imaging system |
| JP4095729B2 (en) * | 1998-10-26 | 2008-06-04 | 株式会社日立製作所 | Therapeutic ultrasound system |
| US6110119A (en) * | 1998-12-31 | 2000-08-29 | General Electric Company | Ultrasound color flow imaging utilizing a plurality of algorithms |
| JP4150460B2 (en) | 1999-04-26 | 2008-09-17 | ジーイー横河メディカルシステム株式会社 | Ultrasonic diagnostic equipment |
| JP3302946B2 (en) | 1999-07-01 | 2002-07-15 | 松下電器産業株式会社 | Ultrasonic transmission / reception method and ultrasonic diagnostic apparatus |
| KR100626944B1 (en) | 1999-09-24 | 2006-09-20 | 도꾸리쯔교세이호징 가가꾸 기쥬쯔 신꼬 기꼬 | Ultrasonic transmitter/receiver by pulse compression |
| JP2001095798A (en) * | 1999-10-01 | 2001-04-10 | Matsushita Electric Ind Co Ltd | Ultrasonic picture taking procedure and ultrasonic wave diagnosis apparatus |
| JP4642977B2 (en) * | 2000-07-26 | 2011-03-02 | 株式会社東芝 | Ultrasonic diagnostic apparatus and ultrasonic imaging method |
| WO2002060326A1 (en) | 2001-02-01 | 2002-08-08 | Hitachi Medical Corporation | Ultrasonic enhanced-contrast imager and its method |
| DE10106142A1 (en) * | 2001-02-10 | 2002-08-14 | Valeo Schalter & Sensoren Gmbh | Method for operating an ultrasound multi-sensor array |
| JP3286311B2 (en) * | 2001-08-24 | 2002-05-27 | 松下電器産業株式会社 | Ultrasound diagnostic equipment |
-
2002
- 2002-04-26 JP JP2002126075A patent/JP4192490B2/en not_active Expired - Fee Related
-
2003
- 2003-04-03 CN CNB2007101848107A patent/CN100560029C/en not_active Expired - Fee Related
- 2003-04-03 WO PCT/JP2003/004285 patent/WO2003090625A1/en active Application Filing
- 2003-04-03 CN CNB038092891A patent/CN100430023C/en not_active Expired - Fee Related
- 2003-04-03 US US10/512,472 patent/US8043220B2/en not_active Expired - Fee Related
- 2003-04-03 CN CN2007101848126A patent/CN101152095B/en not_active Expired - Fee Related
- 2003-04-03 EP EP03747204A patent/EP1500371A4/en not_active Withdrawn
Also Published As
| Publication number | Publication date |
|---|---|
| CN100430023C (en) | 2008-11-05 |
| WO2003090625A1 (en) | 2003-11-06 |
| JP2003310609A (en) | 2003-11-05 |
| US20060058677A1 (en) | 2006-03-16 |
| CN1649544A (en) | 2005-08-03 |
| CN100560029C (en) | 2009-11-18 |
| EP1500371A4 (en) | 2011-07-27 |
| CN101156785A (en) | 2008-04-09 |
| CN101152095A (en) | 2008-04-02 |
| EP1500371A1 (en) | 2005-01-26 |
| CN101152095B (en) | 2012-10-24 |
| US8043220B2 (en) | 2011-10-25 |
Similar Documents
| Publication | Publication Date | Title |
|---|---|---|
| JP4192490B2 (en) | Ultrasonic diagnostic equipment | |
| JP5851575B2 (en) | Ultrasonic diagnostic equipment | |
| JP4551524B2 (en) | Ultrasonic probe and ultrasonic diagnostic apparatus | |
| JP4931910B2 (en) | Ultrasonic imaging device | |
| JP4642977B2 (en) | Ultrasonic diagnostic apparatus and ultrasonic imaging method | |
| JP2004181209A (en) | Ultrasonic diagnostic apparatus | |
| JP5281107B2 (en) | Ultrasonic diagnostic apparatus and ultrasonic image generation method | |
| JP6344026B2 (en) | Ultrasonic probe and ultrasonic diagnostic imaging apparatus | |
| JP2003265466A (en) | Ultrasonograph | |
| JP4719765B2 (en) | Ultrasonic diagnostic equipment | |
| JP4769840B2 (en) | Ultrasonic diagnostic equipment | |
| JP4575014B2 (en) | Ultrasonic diagnostic equipment | |
| JP4580490B2 (en) | Ultrasonic diagnostic equipment | |
| JP3320853B2 (en) | Ultrasound diagnostic equipment | |
| JP2007190045A (en) | Ultrasonic diagnostic device | |
| JP2002301071A (en) | Ultrasonic imaging method and apparatus | |
| JP6769511B2 (en) | Ultrasonic diagnostic equipment | |
| JP2002301072A (en) | Ultrasonic imaging method and apparatus | |
| JP6504297B2 (en) | Ultrasonic diagnostic equipment | |
| US11896428B2 (en) | Adaptive selection of ultrasound frequency | |
| JP2003190163A (en) | Ultrasonic imaging system and method therefor | |
| JP6318594B2 (en) | Ultrasound diagnostic imaging equipment | |
| JP2023184248A (en) | Ultrasonic diagnostic device, method for controlling ultrasonic diagnostic device, and control program for ultrasonic diagnostic device | |
| JPH0654846A (en) | Ultrasonic diagnostic device | |
| Trucco et al. | Improving harmonic imaging by a novel beamforming process for ultrasound medical scanners |
Legal Events
| Date | Code | Title | Description |
|---|---|---|---|
| A521 | Written amendment |
Free format text: JAPANESE INTERMEDIATE CODE: A523 Effective date: 20050329 |
|
| A621 | Written request for application examination |
Free format text: JAPANESE INTERMEDIATE CODE: A621 Effective date: 20050329 |
|
| A131 | Notification of reasons for refusal |
Free format text: JAPANESE INTERMEDIATE CODE: A131 Effective date: 20080205 |
|
| A521 | Written amendment |
Free format text: JAPANESE INTERMEDIATE CODE: A523 Effective date: 20080407 |
|
| A131 | Notification of reasons for refusal |
Free format text: JAPANESE INTERMEDIATE CODE: A131 Effective date: 20080430 |
|
| A521 | Written amendment |
Free format text: JAPANESE INTERMEDIATE CODE: A523 Effective date: 20080630 |
|
| TRDD | Decision of grant or rejection written | ||
| A01 | Written decision to grant a patent or to grant a registration (utility model) |
Free format text: JAPANESE INTERMEDIATE CODE: A01 Effective date: 20080819 |
|
| A01 | Written decision to grant a patent or to grant a registration (utility model) |
Free format text: JAPANESE INTERMEDIATE CODE: A01 |
|
| A61 | First payment of annual fees (during grant procedure) |
Free format text: JAPANESE INTERMEDIATE CODE: A61 Effective date: 20080908 |
|
| R150 | Certificate of patent or registration of utility model |
Free format text: JAPANESE INTERMEDIATE CODE: R150 |
|
| FPAY | Renewal fee payment (event date is renewal date of database) |
Free format text: PAYMENT UNTIL: 20111003 Year of fee payment: 3 |
|
| FPAY | Renewal fee payment (event date is renewal date of database) |
Free format text: PAYMENT UNTIL: 20111003 Year of fee payment: 3 |
|
| FPAY | Renewal fee payment (event date is renewal date of database) |
Free format text: PAYMENT UNTIL: 20121003 Year of fee payment: 4 |
|
| FPAY | Renewal fee payment (event date is renewal date of database) |
Free format text: PAYMENT UNTIL: 20121003 Year of fee payment: 4 |
|
| FPAY | Renewal fee payment (event date is renewal date of database) |
Free format text: PAYMENT UNTIL: 20131003 Year of fee payment: 5 |
|
| S111 | Request for change of ownership or part of ownership |
Free format text: JAPANESE INTERMEDIATE CODE: R313111 |
|
| S533 | Written request for registration of change of name |
Free format text: JAPANESE INTERMEDIATE CODE: R313533 |
|
| R350 | Written notification of registration of transfer |
Free format text: JAPANESE INTERMEDIATE CODE: R350 |
|
| LAPS | Cancellation because of no payment of annual fees |