JP3926688B2 - Reproduction signal quality evaluation method and information reproduction apparatus - Google Patents
Reproduction signal quality evaluation method and information reproduction apparatus Download PDFInfo
- Publication number
- JP3926688B2 JP3926688B2 JP2002196099A JP2002196099A JP3926688B2 JP 3926688 B2 JP3926688 B2 JP 3926688B2 JP 2002196099 A JP2002196099 A JP 2002196099A JP 2002196099 A JP2002196099 A JP 2002196099A JP 3926688 B2 JP3926688 B2 JP 3926688B2
- Authority
- JP
- Japan
- Prior art keywords
- reproduction signal
- value
- state transition
- time
- state
- Prior art date
- Legal status (The legal status is an assumption and is not a legal conclusion. Google has not performed a legal analysis and makes no representation as to the accuracy of the status listed.)
- Expired - Lifetime
Links
Images


Classifications
-
- G—PHYSICS
- G11—INFORMATION STORAGE
- G11B—INFORMATION STORAGE BASED ON RELATIVE MOVEMENT BETWEEN RECORD CARRIER AND TRANSDUCER
- G11B7/00—Recording or reproducing by optical means, e.g. recording using a thermal beam of optical radiation by modifying optical properties or the physical structure, reproducing using an optical beam at lower power by sensing optical properties; Record carriers therefor
- G11B7/12—Heads, e.g. forming of the optical beam spot or modulation of the optical beam
- G11B7/125—Optical beam sources therefor, e.g. laser control circuitry specially adapted for optical storage devices; Modulators, e.g. means for controlling the size or intensity of optical spots or optical traces
- G11B7/126—Circuits, methods or arrangements for laser control or stabilisation
- G11B7/1267—Power calibration
Landscapes
- Physics & Mathematics (AREA)
- Optics & Photonics (AREA)
- Signal Processing For Digital Recording And Reproducing (AREA)
- Optical Recording Or Reproduction (AREA)
Description
【0001】
【発明の属する技術分野】
本発明は、記録媒体に記録されたディジタル情報を最尤復号方式によって復号する場合において、復号された信号の品質を評価する方法およびこのような評価を行なうことができる情報再生装置に関する。
【0002】
【従来の技術】
近年、AV機器やパーソナルコンピュータなどにおいて、HDD(ハードディスクドライブ)、光ディスクドライブあるいは光磁気ディスクドライブなどの、記録媒体に記録されたディジタル情報を再生することができる装置が広く利用されている。
【0003】
図1は、従来の光ディスクドライブ900の部分的な構成を示す。光ディスク1からの反射光は、光学ヘッド2により再生信号に変換される。再生信号は波形等化器3により波形整形された後、コンパレータ4において2値化される。コンパレータ4のしきい値は、通常、コンパレータ4から出力される2値化信号の積分結果が0となるようにフィードバック制御される。
【0004】
光ディスクドライブ900では、PLL(phase looked loop)回路によって再生信号に同期するクロック信号(再生クロック信号)が生成される。再生クロック信号を生成するために、位相比較器5は、コンパレータ4から出力された2値化信号と、VCO(電圧制御発振器)7から出力されるクロック信号との位相誤差を検出する。検出された位相誤差はLPF(ローパスフィルタ)6によって平均化処理され、このLPF6からの出力に基づいてVCO7の制御電圧が設定される。このようにしてVCO7の制御電圧(VCO7の発振周波数)は、位相比較器5から出力される位相誤差が常に0になるようにフィードバック制御され得る。これにより、VCO7によって再生信号と同期したクロック信号を出力させることが可能である。このようなPLL回路を用いれば、例えばディスクが偏心を有している場合などにおいても、安定して再生信号に同期したクロック信号を抽出することができる。
【0005】
再生クロック信号は、記録符号(ディジタル情報)が1か0かを判断するために用いられる。より具体的には、再生クロック信号によって規定される窓幅(ウィンドウ幅)内にコンパレータ4の検出パルス(すなわち、コンパレータ4から出力される2値化信号におけるしきい値を超える信号部分)が存在するか否かを検出することによってディジタル情報を再生することができる。
【0006】
ただし、再生信号の符号間干渉や記録マークの歪あるいは回路ノイズやPLL回路の制御残差等によって、コンパレータ4から出力される検出パルスが再生クロックのウィンドウ幅を外れてしまい、それによって誤りが発生する場合がある。このようなコンパレータ4の検出パルスと再生クロックとの間の時間のずれは「ジッタ」と呼ばれている。
【0007】
上述のようにしてディジタル情報を再生する場合、ジッタの分布を求めることで再生信号品質(誤り率)を検出することができる。このジッタの分布は、平均値が0の正規分布をなすと仮定することができ、この場合に、誤り率Pj(σ/Tw)は、ジッタ分布の標準偏差σを用いて以下の式(1)および(2)で表される。
【0008】
【数1】

【数2】
ここで、σは正規分布と仮定したジッタの分布の標準偏差であり、Twはウィンドウ幅である。
【0011】
図2に示すグラフから、ジッタの標準偏差の増加にしたがって誤り率(ビットエラーレートBER)が増加することがわかる。再生信号のジッタは、TIA(タイム・インターバル・アナライザ)を用いて実際に測定することができる。このため、現実的に誤りが発生しない場合であっても、信号の品質をジッタの標準偏差σ/Twで評価することができ、これにより誤りの発生しやすさを予想することができる。このようにしてジッタの標準偏差を測定すれば、例えばドライブの性能、記録媒体の性能、光学ヘッドなどの性能を確認および検査することができる。また、ジッタの標準偏差が低下するように等化器のパラメータなどを調節することで、より安定した再生動作を行なうことが可能である。
【0012】
【発明が解決しようとする課題】
一方、上述のようにコンパレータ4から出力される2値化信号から直接的にディジタル情報を再生する方法とは異なり、最尤復号方式によってディジタル情報を再生する方法が知られている。この最尤復号方式としては、例えばPRML(Partial Response Maximum Likelihood)方式が知られている。PRML方式では、記録密度が高い場合において符号間干渉が起こることを考慮した上でデータの記録および再生が行なわれている。より具体的には、記録媒体から再生された信号は、波形等化器やデジタルフィルタなどを用いて所定の周波数特性を持つようにパーシャルレスポンス等化された後、ビタビ復号などを用いて最尤な(最も確からしい)2値化データに復号される。PRML方式では、S/N(信号対雑音)の低い再生信号や、符号間干渉の影響が比較的大きい再生信号からであっても、誤り率の低いデータを復号することが可能である。
【0013】
このような最尤復号方式では、再生信号に基づいて、最も確からしい状態遷移列を選択することによって復号が行なわれる。一般に、時刻kまでの、状態Sn(nは状態数)に至る状態遷移の確からしさを表す量は式(3)で定義される。
【0014】
【数3】
ここでyiは時刻iにおける再生信号(デジタルサンプルデータ)の値、levelvは期待される理想的な再生信号の値である。
【0016】
最尤復号回路では、上記の式(3)で求められる確からしさを表す量が最小となるような状態遷移列が選択される。最尤復号方式を用いる場合、上述の時刻kごとに検出パルスがウィンドウ幅に入っているか否かで"1"と"0"とを判別する方法とは異なり、時刻kごとに再生クロックでサンプリングされたデータykを用いてユークリッド距離(yk-levelv)2を求めており、このユークリッド距離に基づいて復号が行なわれる。このため、最尤復号方式での復号結果は、過去のサンプリングされた再生信号のサンプル値ykにも影響されることになる。
【0017】
このような最尤復号方式を用いる場合、ジッタの標準偏差σが同じ値の再生信号であっても、誤りが発生する場合と発生しない場合とがある。このため、再生信号のジッタの標準偏差σを用いて、最尤復号によって得られる2値化結果の誤り率を予想することは困難である。従って、最尤復号方式により適した誤り率の予測方法(信号品質評価方法)を用いる必要がある。
【0018】
最尤復号方式で再生された信号の品質を評価する方法は、例えば特開平10−21651号公報に記載されている。この公報に記載の装置では、ユークリッド距離が最小となる2つのパス(状態遷移列)の尤度の差を求め、この差を統計処理することによって信号品質を評価している。
【0019】
より具体的には、時刻kにおいて同一の状態を取る2つのパスの尤度の差を求めるために、時刻k−1において異なる2つの状態(各パスにおける時刻k−1での状態)のそれぞれにおける既に最尤と判断されたパス(生き残りパス)のブランチメトリックの累積値が用いられている。しかしながら、時刻k−1でのブランチメトリックの累積値を用いる場合、時刻k−1以前のパスとして、実際に尤度を調べたいパスとは異なるパスを誤って選択している場合などにおいて、所望でないブランチメトリックの累積値を用いてしまう可能性があった。上記公報には、ユークリッド距離が最小となる2つのパスを選択して、これらの尤度の差を求めることは記載されているものの、その2つのパスについての実際に求めたい尤度の計算をより確実に行なうための方法については特に記載されていない。
【0020】
本発明は、上記課題を鑑みてなされたものであり、その目的とするところは、最尤復号による2値化結果の誤り率との相関のある指標を用いた再生信号品質の評価方法および評価装置を提供することにある。
【0021】
【課題を解決するための手段】
本発明の再生信号品質評価方法は、時刻k−j(kは3以上の整数、jは2以上の整数)における第1状態Sk-jから時刻kにおける第2状態Skへと遷移するn(nは2以上の整数)通りの状態遷移列のうちから最も確からしい状態遷移列を選択する最尤復号方式によって再生信号の復号を行なう場合における、前記復号された信号の品質評価方法であって、前記時刻k−jから時刻kまでの所定の期間jにおける前記n通りの状態遷移列を規定する前記第1状態Sk-jと前記第2状態Skとの所定の組み合わせを検出する工程と、前記検出された前記所定の組み合わせによって規定される前記n通りの状態遷移列のうちの最も確からしい第1の状態遷移列の前記所定の期間jにおける状態遷移の確からしさを表す指標をPaとし、2番目に確からしい第2の状態遷移列の前記所定の期間jにおける状態遷移の確からしさを示す指標をPbとするとき、|Pa−Pb|を用いて前記時刻k−jから時刻kまでの復号結果の信頼性を判断する工程とを包含する。
【0022】
ある好ましい実施形態において、前記Paは、前記所定の期間jにおける前記第1の状態遷移列が示す期待値と実際のサンプル値との差に基づいて規定され、前記Pbは、前記所定の期間jにおける前記第2の状態遷移列が示す期待値と前記実際のサンプル値との差に基づいて規定される。
【0023】
ある好ましい実施形態において、前記Paは、前記所定の期間jにおける、前記第1の状態遷移列が示す時刻k−j+1から時刻kまでの期待値lk-j+1 ,・・・,lk-1,lkと前記実際のサンプル値yk-j+1 ,・・・,yk-1,ykとの差の2乗の累積値に対応し、前記Pbは、前記第2の状態遷移列が示す時刻k−j+1から時刻kまでの期待値mk-j+1 ,・・・,mk-1,mkと前記実際のサンプル値yk-j+1 ,・・・,yk-1,ykとの差の2乗の累積値に対応する。
【0024】
ある好ましい実施形態において、n=2である。
【0025】
ある好ましい実施形態において、前記第1の状態遷移列と前記第2の状態遷移列とのユークリッド距離は最小値を有する。
【0026】
ある好ましい実施形態において、前記|Pa−Pb|を複数回測定することによって、前記復号結果の信頼性のバラツキを判断する工程をさらに包含する。
【0027】
ある好ましい実施形態において、前記信頼性のバラツキは、前記|Pa−Pb|の分布の標準偏差を用いて示される。
【0028】
ある好ましい実施形態において、前記信頼性のバラツキは、前記|Pa−Pb|の標準偏差と前記|Pa−Pb|の分布の平均値とを用いて示される。
【0029】
ある好ましい実施形態において、前記|Pa−Pb|が所定の値を超える頻度を検出することによって前記復号結果の信頼性のバラツキを判断する。
【0030】
ある好ましい実施形態において、記録符号の最小極性反転間隔が2であり、かつ、PR(C0,C1,C0)等化された再生信号を復号することを特徴とする。
【0031】
ある好ましい実施形態において、記録符号の最小極性反転間隔が2であり、かつ、PR(C0,C1,C1,C0)等化された再生信号を復号することを特徴とする。
【0032】
ある好ましい実施形態において、記録符号の最小極性反転間隔が2であり、かつ、PR(C0,C1,C2,C1,C0)等化された再生信号を復号することを特徴とする。
【0033】
ある好ましい実施形態において、前記|Pa−Pb|を計算するとき、前記実際のサンプル値の2乗の計算を行なわないことを特徴とする。
【0034】
本発明による情報再生装置は、再生信号の振幅値を調整するゲインコントローラと、所定の等化特性となるように前記再生信号を波形整形する波形等化器と、前記再生信号と同期がとられた再生クロックを生成する再生クロック生成回路と、前記再生信号を前記再生クロックでサンプリングを行なうことによってサンプリングデータを生成し、前記サンプリングデータを出力するA/D変換器と、前記サンプリングデータから最も確からしいディジタル情報を復号する最尤検出器と、前記最尤検出器において最も確からしいと判断された第1の状態遷移列の所定の期間における状態遷移の確からしさを表す指標をPaとし、2番目に確からしい第2の状態遷移列の前記所定の期間における状態遷移の確からしさを示す指標をPbとするとき、|Pa−Pb|を算出する差分メトリック演算器とを備える。
【0035】
ある好ましい実施形態において、前記波形等化器とは異なる所定の等化特性となるように波形整形を行なう追加の波形等化器を更に備え、前記再生クロックは、前記追加の波形等化器によって波形整形された再生信号から生成される。
【0036】
【発明の実施の形態】
以下、本発明による再生信号品質評価方法および情報再生装置の実施の形態を説明する。
【0037】
以下、本発明の実施形態にかかる再生信号品質の評価方法について説明する。以下に説明する形態において、記録符号としては、(1,7)RLL変調方式などに従って規定された最小極性反転間隔が2の符号が用いられる。すなわち、記録符号は0または1が必ず2以上連続する。また、記録系の周波数特性と再生系の周波数特性とが、全体としてPR(1,2,2,1)等化特性を示すように設定されているPRML方式を利用して復号を行う。以下、より具体的な復号手順について説明する。
【0038】
記録符号(0または1のいずれか)を以下のように表記する。
【0039】
現在の記録符号 :bk
1時刻前の記録符号:bk-1
2時刻前の記録符号:bk-2
3時刻前の記録符号:bk-3
【0040】
PR(1,2,2,1)等化されている場合の再生信号の理想的な値をLevelvとすると、Levelvは以下の式(4)で表される。
【0041】
Levelv=bk-3+2bk-2+2bk-1+bk …(4)
【0042】
ここでkは時刻を表す整数、vは0〜6までの整数である。PR(1,2,2,1)等化の場合、記録符号の組み合わせに応じて、理想的なサンプル値(期待値)が0〜6までの7通りの値(Levelv)を取り得る。
【0043】
次に、記録符号の状態の遷移について説明する。時刻kでの状態をS(bk-2,bk-1,bk)とし、時刻k−1での状態をS(b k-3,b k-2,b k-1)とする。時刻k−1での状態と時刻kでの状態との組み合わせを考えると、以下の表1に示すような状態遷移表が得られる。上述のように、0と1との最小反転間隔が2である変調方式が採用されているため、記録符号が取り得る状態遷移は以下の10通りに限定される。
【0044】
【表1】
簡単のために、時刻kでの状態S(0,0,0)kをS0k、状態S(0,0,1)kをS1k、状態S(0,1,1)kをS2k、状態S(1,1,1)kをS3k、状態S(1,1,0)kをS4k、状態S(1,0,0)kをS5kというように表記する。時刻k−1から時刻kまでの期間(再生クロックの1周期Tに対応する時間)に生じ得る状態遷移は図3に示す状態遷移図で表され、また、これを時間軸に関して展開すると図4に示すトレリス図が得られる。
【0046】
ここで、時刻kでの状態S0kと時刻k-5での状態S0k-5とに注目する。図5は、状態S0kと状態S0k-5との間で取り得る2つの状態遷移列を示している。取り得る状態遷移列の一方をパスAとすると、パスAは状態S0k-5、S0k-4、S0k-3、S0k-2、S0k-1、S0kを遷移し、他方の状態遷移列をパスBとするとパスBは状態S0k-5、S1k-4、S2k-3、S4k-2、S5k-1、S0kを遷移する。なお、図4および図5では、状態遷移ごとに(記録符号/Levelv)が示されているが、Levelvは−3〜3までの7つの値を取るものとして示しており、−3〜3のそれぞれが上記のLevelvの0〜6のそれぞれに対応している。
【0047】
このように、時刻k−5での状態がS0k-5であり、かつ、時刻kでの状態がS0kであるような場合には、上述のパスAまたはパスBのいずれかを遷移するものと推定される。すなわち、時刻k−7から時刻kまでの復号データ(Ck-7, Ck-6, Ck-5, Ck-4, Ck-3, Ck-2, Ck-1, Ck)=(0,0,0,x,x,0,0,0)となる復号結果(xは0または1の値)が得られた場合には、パスAまたはパスBの状態遷移が最も確からしいと推定されたこととなる。
【0048】
このようにして時刻kでの状態S0kと時刻k-5での状態S0k-5とが検出された場合(すなわち、(0,0,0,x,x,0,0,0)となる復号結果が得られた場合)、パスAとパスBとのいずれがより確からしいかが判断される。この判断は、パスAが示す理想的なサンプル値(期待値)と実際のサンプル値とのずれの大きさと、パスBが示す理想的なサンプル値(期待値)と実際のサンプル値とのずれの大きさとを比較することによって行なうことができる。より具体的には、パスAとパスBのそれぞれが示す時刻k−4から時刻kまでの期待値(Levelv)のそれぞれと、再生信号yk-4からykまでの実際の値のそれぞれとの差の2乗の累積結果に基づいて、パスAまたはパスBのいずれの状態遷移列がより確からしいかを判断することができる。
【0049】
ここで、パスAが示す時刻k−4から時刻kまでの期待値lk-4,lk-3,lk-2,lk-1,lk(すなわち、0,0,0,0,0)のそれぞれと再生信号yk-4からykまでの値との差の2乗の累積値をPaとし、パスBの時刻k−4から時刻kまでの期待値mk-4,mk-3,mk-2,mk-1,mk(すなわち、1,3,4,3,1)と再生信号yk-4からykまでの値との差の2乗の累積値をPbとすると、累積値Paは以下の式(5)で表され、累積値Pbは以下の式(6)で表される。
【0050】
Pa=(yk-4-0)2+(yk-3-0)2+(yk-2-0)2+(yk-1-0)2+(yk-0)2 …(5)
【0051】
Pb=(yk-4-1)2+(yk-3-3)2+(yk-2-4)2+(yk-1-3)2+(yk-1)2 …(6)
【0052】
このようにして求められる累積値Paは、時刻k−5から時刻kまでの所定の期間におけるパスAの遷移の確からしさを示す指標であり、Paの値が小さいほどパスAが確からしいことになる。また、累積値Pbは、時刻k−5から時刻kまでの所定の期間における、パスBの遷移の確からしさを示す指標であり、Pbの値が小さいほどパスBが確からしいことになる。PaまたはPbの値が0である場合にはパスAまたはパスBの確からしさが最大となる。
【0053】
次に、PaとPbとの差Pa−Pbの意味について説明する。最尤復号回路はPa<<Pbであれば、パスAを自信を持って選択し、Pa>>PbであればパスBを自信を持って選択することになる。ただし、Pa=PbであればパスA、パスBのいずれを選択してもおかしくなく、復号結果が正しいかどうかは5分5分であるといえる。従って、Pa−Pbの値は、復号結果の信頼性を判断するために用いられ得る。すなわち、Pa−Pbの絶対値が大きいほど復号結果の信頼性は高く、Pa−Pbの絶対値が0に近いほど復号結果の信頼性は低いことになる。
【0054】
この復号結果の信頼性を示す指標Pa−Pbは再生信号の品質を評価するために用いられる。このために、例えば、復号結果に基づいて所定の時間あるいは所定の回数Pa−Pbを求めることによりPa−Pbの分布を得る。Pa−Pbの分布の模式図を図6に示す。図6(a)は再生信号にノイズが重畳された場合のPa−Pbの分布を示している。この分布には2つのピークがあり、1つはPa=0となるときに頻度が極大となり、もう1つはPb=0となるときに頻度が極大となる。Pa=0となるときのPa−Pbの値を−Pstd、Pb=0となるときのPa−Pbの値をPstdと表すことにする。Pa−Pbの絶対値をとり、|Pa−Pb|−Pstdを求めると図6(b)に示すような分布が得られる。
【0055】
この分布を正規分布であると仮定して、分布の標準偏差σと平均値Paveを求める。この分布の標準偏差σと平均値Paveとは、ビット誤り率を予測するために用いられ得る。例えば、|Pa−Pb|の分布を示すものとして推定される分布曲線がなだらかであり、この分布曲線が、|Pa−Pb|の値が0以下を取り得るような関数によって規定されるとき(すなわち、|Pa−Pb|が0を取る頻度が0ではないとき)に、|Pa−Pb|の値が0以下となる確率に応じた頻度で復号の誤りが発生するとみなした場合、標準偏差σと平均値Paveとを用いて、誤り確率P(σ,Pave)は以下の式(7)によって規定することができる。
【0056】
P(σ,Pave)=erfc(Pstd+Pave /σ) …(7)
【0057】
このように、Pa−Pbの分布から求めた平均値Paveと標準偏差σとを用いれば、最尤復号方式による2値化結果の誤り率を予想することができる。つまり平均値Paveと標準偏差σとを再生信号品質の指標として用いることが可能である。なお、上記の例では|Pa−Pb|の分布が正規分布であることを仮定しているが、|Pa−Pb|の分布が正規分布であると見なすことが困難である場合には、上述のような平均値Paveと標準偏差σとを求める代わりに、|Pa−Pb|の値が所定の基準値以下になる回数をカウントするようにしてもよい。こうして得られたカウント数は、|Pa−Pb|のバラツキの程度を示す指標となり得る。
【0058】
以上に説明したように、本実施形態によれば、所定の期間において所定の第1の状態(例えばS0)から所定の第2の状態(例えばS0)へと状態遷移が生じる場合に、取り得る2つのパスについての上記所定の期間における確からしさの差の絶対値|Pa−Pb|を計算することによって復号の信頼性を判断することができる。さらに、|Pa−Pb|を複数回測定して復号の信頼性|Pa−Pb|のバラツキ程度(分布)を得ることによって、再生信号の品質の評価(ビット誤り率の予測)を行なうことができる。
【0059】
なお、このような方法によって信号品質の評価を行なう場合、最も誤りが生じやすい2つのパス(すなわち、2つのパス間のユークリッド距離が最小となるもの)を取り得る状態遷移の組み合わせを選択し、このような2つのパスの確からしさの差の絶対値|Pa−Pb|を用いて信号品質を評価すればよい。以下、この点について詳細に説明する。
【0060】
上述のように最小極性反転間隔が2であるとともに、PR(1,2,2,1)等化を用いた状態遷移則に従う再生信号を復号する場合、2つのパスを取り得る状態遷移は、時刻k−5から時刻kの範囲では、上述のS0k-5からS0kへの遷移の他に15通りある。下記の表2に、その状態遷移(時刻k−5での状態と時刻kでの状態との組み合わせ)と、それぞれの状態遷移においてPa−Pbが取り得る値(Pstd)とを示す。
【0061】
【表2】
上記の16通りの復号結果の信頼性Pa−Pbは下記の式(8)で表すことができる。
【0063】
なお、Ak=(yk-0)2,Bk=(yk-1)2,Ck=(yk-2)2,Dk=(yk-3)2,Ek=(yk-4)2,Fk=(yk-5)2,Gk=(yk-6)2である。
【0065】
また、上記式(8)を、Pstdが10の場合と36の場合とに分けて示すと、Pstd=10となる場合は式(9)で表され、Ptsd=36となる場合は式(10)で表される。
【0066】
ここで、それぞれの場合について誤り率の指標を得ることについて考える。Pstdが10であるような状態遷移では、最尤復号結果ckから式(9)を満たすPa−Pbを求め、その分布から標準偏差σ10と平均値Pave10を求める。他方、Pstdが36であるような状態遷移では、最尤復号結果ckから式(10)を満たすPa−Pbを求め、その分布から標準偏差σ36と平均値Pave36を求める。それぞれの分布が正規分布であると仮定すると、誤りを起こす確率P10,P36は、それぞれ下記の式(11)および(12)で表される。すなわち、最尤復号結果のパターンごとに誤り率を推定することができ、標準偏差σ10および平均値Pave10、または、標準偏差σ36および平均値Pave36を再生信号の品質の指標として用いることができる。
【0069】
【数4】
【数5】
また、状態遷移のパターンを検出する範囲を1時刻増やし、時刻k−6から時刻kの範囲で2つの状態遷移列を取り得る状態遷移の組み合わせパターンを検出する場合には、以下の表3に示される8パターンがさらに検出され得る。
【0072】
【表3】
上記式(11)、(12)と同様に、表3のパターンにおける誤りを起こす確率P12は、式(13)で示される。
【0074】
【数6】
ここで重要なのは、信頼性|Pa−Pb|を再生信号品質の指標として好適に利用するためには、誤る可能性(誤り率)が大きい状態遷移のパターンのみを検出すればよいということである。すなわち、すべての状態遷移のパターンを検出しなくても、誤り率と相関のある指標を得ることができる。
【0076】
ここで、誤る可能性が大きい状態遷移パターンとは、信頼性|Pa−Pb|の最大値が小さくなるような状態遷移パターン(すなわち、パスAとパスBとの絶対距離であるユークリッド距離が最小となるパターン)である。ここでは、表2に示した、PaまたはPbのいずれか一方が0の場合においてPa−Pb=±10をとる8つのパターンがこれに該当する。
【0077】
再生信号に含まれる雑音のうちホワイトノイズが支配的であるとすると、P10>P12>>P36となることが予想される。P10のみ1ビットシフトエラーを示し、他のパターンは2ビット以上のシフトエラーを意味する。PRML処理後のエラーパターンを分析すると、ほとんどが、1ビットシフトエラーであるため、P10を用いる式(11)により再生信号の誤り率を適切に推定できる。このように、所定の期間に所定の状態遷移を取るパターンを検出し、この検出された状態遷移における|Pa−Pb|−Pstdの分布の標準偏差σ10、平均値Pave10を指標として用いて、再生信号の品質を評価することが可能である。
【0078】
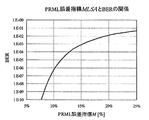
上述のように誤り率は標準偏差σ10を用いて予測され得るが、例えば、以下の式(14)で定義されるPRML誤差指標MLSA(Maximum Likelihood Sequence Amplitude)を信号品質(誤り率)を示す指標として用いてもよい。
【0079】
【数7】
ここで、d2 minは、取り得る2つのパスのユークリッド距離の最小値の2乗であり、本実施形態の変調符号とPRML方式との組み合わせでは10となる。なお、上記の指標MLSAは、式(11)における平均値Pave10が0となるとの仮定のもとに規定されている。これは、平均値Pave10は典型的には0に近い値をとるものと考えることができ、平均値Pave10を考慮しない場合にも、指標として誤り率との相関性を持つものが得られるからである。
【0081】
式(14)で定義した指標MLSAと式(11)より算出できる誤り率BER(BitError Rate)との関係を図16に示す。図2で示した、ジッタと誤り率の関係と同様に、指標MLSAの増加にしたがって誤り率が増加していることがわかる。すなわち、指標MLSAを用いて、PRML処理後の誤り率を予想することができることがわかる。
【0082】
なお、これまで、一般的なPR(C0,C1,C1,C0)等化(C0,C1は任意の正の数)の一例として、PR(1,2,2,1)等化が適用される場合について具体的に説明したが、これ以外のPR(C0,C1,C1,C0)等化(C0,C1は任意の正の数)が適用される場合についても上記と同様の手順によって誤り率と相関を持つ指標を得ることができる。
【0083】
以下、上記の形態とは異なる形態として、最小極性反転間隔が2である記録符号が用いられるとともにPR(C0,C1,C0)等化(例えば、PR(1,2,1)等化)が適用される形態について説明する。なお、C0、C1は任意の正の数である。
【0084】
記録符号(0または1のいずれか)を以下のように表記する。
【0085】
現時刻の記録符号 :bk
1時刻前の記録符号:bk-1
2時刻前の記録符号:bk-2
【0086】
PR(C0,C1,C0)等化されている場合の再生信号の理想的な値をLevelvとすると、Levelvは以下の式(15)で表される。
【0087】
Levelv=C0×bk-2+C1×bk-1+C0×bk …(15)
【0088】
ここでkは時刻を表す整数、vは0〜3までの整数である。また、時刻kでの状態をS(bk-1,bk)とすると以下の表4に示すような状態遷移表が得られる。
【0089】
【表4】
簡単のために時刻kでの状態S(0,0))) kをS0k、状態S(0,1))) kをS1k、状態S(1,1))) kをS2k、状態S(1,0))) kをS3kというように表記する。この場合の状態遷移は図17に示す状態遷移図で示され、また、これを時間軸に関して展開すると図18に示すトレリス図が得られる。
【0091】
ここで、記録符号の最小極性反転間隔が2であり、PR(C0,C1,C0)等化が用いられているという条件の下では、ある時刻の所定の状態から別の時刻の所定の状態へ遷移するときに2つの状態遷移(パスAおよびパスB)を取り得るような状態遷移パターン(状態の組み合わせ)は表5に示すように6通り存在する。
【0092】
【表5】
ここで、パスAとパスBとのいずれがより確からしいかが判断される。この判断は、パスAが示す理想的なサンプル値(期待値)と実際のサンプル値とのずれの大きさと、パスBが示す理想的なサンプル値(期待値)と実際のサンプル値とのずれの大きさとを比較することによって行なうことができる。
【0094】
例えば、状態遷移S0k-3 → S2kが推定されたとすると、パスA(S0k-3、S0k-2, S1k-1, S2k)、パスB(S0k-3、S1k-2, S2k-1, S2k)のいずれを遷移した場合であっても時刻k−3では状態S0k-3 をとり、時刻kではS2kをとる。この場合、時刻k−2から時刻kまでの期待値と再生信号の値yk-2、yk-1、ykとの差の2乗の累積値によってパスAかパスBのどちらの状態遷移がより確からしいかが判断される。ここで、パスAが示す時刻k−2から時刻kまでの期待値のそれぞれと再生信号yk-2からykまでの値との差の2乗の累積値をPaとし、パスBの時刻k−2から時刻kまでの期待値と再生信号yk-2からykまでの値との差の2乗の累積値をPbとすると、累積値Paは以下の式(16)で表され、累積値Pbは以下の式(17)で表される。
【0095】
Pa= (yk-2−0)2+(yk-1−C0)2+(yk−(C1+C2))2 …(16)
【0096】
Pb= (yk-2−C0)2+(yk-1−(C0+C1))2+(yk−(2×C0+C1))2 …(17)
【0097】
ここで、Pa<<PbであればパスAの可能性が高いと推定され、Pa>>PbであればパスBの可能性が高いと推定される。すなわち、最小極性反転間隔が2である記録符号とPR(C0,C1,C0)等化を用いた場合においても、|Pa−Pb|を用いて復号結果の信頼性を判断することができる。また、|Pa−Pb|の分布に基づいて再生信号の品質の評価(誤り率の推定)を行なうことができる。
【0098】
また、白色のノイズが伝送路に重畳された場合を考えると、誤りをもっとも起こしうる状態遷移はパスAとパスBとのユークリッド距離が最小となるものと考えられる。このようにユークリッド距離が最小となる2つのパスを取るものとしては、以下の表6に示す2通りの状態遷移のパターンが挙げられる。
【0099】
【表6】
ここで、復号結果をckとし(kは整数)、表6に示す状態遷移における信頼性Pa−Pbをまとめると式(18)が得られる。
【0101】
ここで、AAk、BBk、CCk、DDkは以下の式で表される。
【0103】
AAk=(yk−0)2、 BBk=(yk−C0)2、
CCk=(yk−(C0+C1))2、 DDk=(yk−(2×C0+C1))2、
【0104】
復号結果ckから式(18)を満たす|Pa−Pb|−(2×C02+C12)を求め、その分布から標準偏差σと平均値Paveを求める。分布が正規分布であると仮定すると、誤りを起こす確率は式(19)で表される。したがって標準偏差σと平均値Paveより再生信号の誤り率を推定でき、信号品質の指標とすることができる。
【0105】
【数8】
このようにして、最小極性反転間隔が2である記録符号が用いられるとともにPR(C0,C1,C0)等化が適用されている場合にも、所定の状態遷移をとるパスの所定の期間における確からしさの差|Pa−Pb|に基づいて、再生信号の品質を評価することができる。
【0107】
以下、上記の形態とは異なる形態として、最小極性反転間隔が2である符号とPR(C0,C1,C2,C1,C0)等化が適用される形態について説明する。なお、C0、C1、C2は任意の正の数である。
【0108】
記録符号を以下のように表記する。
【0109】
現時刻の記録符号 :bk
1時刻前の記録符号:bk-1
2時刻前の記録符号:bk-2
3時刻前の記録符号:bk-3
4時刻前の記録符号:bk-4
【0110】
PR(C0,C1,C2,C1,C0)等化されている場合の再生信号の理想的な値をLevelvとすると、Levelvは以下の式(20)で表される。
【0111】
Levelv=C0×bk-4+C1×bk-3+C2×bk-2+C1×bk-1+C0×bk …(20)
【0112】
ここでkは時刻を表す整数、vは0〜8までの整数である。また、時刻kでの状態をS(bk-3,bk-2,bk-1,bk)とすると、以下の表7に示すような状態遷移表が得られる。
【0113】
【表7】
簡単のために時刻kでの状態S(0,0,0,0)kをS0k、状態S(0,0,0,1)kをS1k、状態S(0,0,1,1)kをS2k、状態S(0,1,1,1)kをS3k、状態S(1,1,1,1)kをS4k、状態S(1,1,1,0)kをS5k、状態S(1,1,0,0)kをS6k、状態S(1,0,0,0)kをS7k、状態S(1,0,0,1)kをS8k、状態S(0,1,1,0)kをS9kというように表記する。この場合の状態遷移は図19に示す状態遷移図で示され、また、これを時間軸に関して展開すると図20に示すトレリス図が得られる。
【0115】
ここで、記録符号の最小極性反転間隔が2であり、PR(C0,C1,C2,C1,C0)等化が用いられているという条件の下では、ある時刻の所定の状態から別の時刻の所定の状態へ遷移するときに2つの状態遷移(パスAおよびパスB)を取り得るような状態遷移パターン(状態の組み合わせ)は表8〜10に示すように90通り存在する。
【0116】
【表8】
【表9】
【表10】
なお、表8〜10は便宜上3つの表に分けられているが、1つの表にまとめられても良い。
【0120】
ここで、パスAとパスBとのいずれがより確からしいかが判断される。この判断は、パスAが示す理想的なサンプル値(期待値)と実際のサンプル値とのずれの大きさと、パスBが示す理想的なサンプル値(期待値)と実際のサンプル値とのずれの大きさとを比較することによって行なうことができる。
【0121】
例えば、状態遷移S0k-5 → S6kが推定されたとすると、パスA、パスBの何れを遷移した場合であっても時刻k−5では状態S0k-5 をとり、時刻kではS6kをとることから、時刻k−4から時刻kまでの再生信号の値、yk-4、yk-3、yk-2、yk-1、ykと期待値との差の2乗の累積値によってパスAかパスBのどちらの状態遷移がより確からしいかが判断される。パスAにおける期待値と実際の値との差の2乗の累積値をPaとし、パスBにおける期待値と実際の値との差の2乗の累積値をPbとすると、累積値Paは以下の式(21)で表され、累積値Pbは以下の式(22)で表される。
【0122】
ここでPa<<Pbであれば、パスAの可能性が高いと推定され、Pa>>Pbであれば、パスBの可能性が高いと推定される。すなわち、最小極性反転間隔が2である符号とPR(C0,C1,C2,C1,C0)等化を用いた場合においても|Pa−Pb|を用いて復号結果の信頼性を判断することができる。また、|Pa−Pb|の分布に基づいて再生信号の品質の評価(誤り率の推定)を行なうことができる。
【0125】
白色のノイズが伝送路に重畳された場合を考えると、誤りをもっとも起こしうる状態遷移はパスAとパスBのユークリッド距離が最小となるものとなるのであり、以下の表11に示す18通りの状態遷移が挙げられる。
【0126】
【表11】
上記18通りの状態遷移のときの復号結果をckとし(kは整数)、表11に示す状態遷移における信頼性Pa−Pbをまとめると式(23)が得られる。
【0128】
ここで、AAk、BBk、CCk、DDk、EEk、FFk、GGk、HHk、IIk、JJkは以下の式で表される。
【0130】
AAk=(yk−0)2、 BBk=(yk−C0)2、
CCk=(yk−(C0+C1))2、 DDk=(yk−(C1+C2))2、
EEk=(yk−(C0+C1+C2))2、 FFk=(yk−(2×C1+C2))2、
GGk=(yk−(C0+2×C1+C2))2、HHk=(yk−2×C0))2、
IIk=(yk−(2×C0+C1))2、 JJk=(yk−(2×C0+2×C1+C2))2
【0131】
復号結果ckから式(23)をみたす|Pa−Pb|−(2×C02+2×C12+C22)を求め、その分布から標準偏差σと平均値Paveを求める。この分布が正規分布であると仮定すると、誤りを起こす確率は式(24)で表される。したがって標準偏差σと平均値Paveより再生信号の誤り率を推定でき、信号品質を評価することができる。
【0132】
【数9】
このようにして、最小極性反転間隔が2である記録符号が用いられるとともにPR(C0,C1,C2,C1,C0)等化が適用されている場合にも、所定の状態遷移をとるパスの所定の期間における確からしさの差|Pa−Pb|に基づいて、再生信号の品質を評価することができる。
【0134】
(実施形態2)
以下、上記に示したPR(1,2,2,1)等化を用いるPRML方式によって復号を行なう場合における各状態の確からしさ、および復号の信頼性Pa−Pbを計算する方法の具体例について詳細に説明する。
【0135】
前述のように、PR(1,2,2,1)等化を用いる場合、図4に示すようなトレリス線図が得られる。ここで、各状態S0〜S5の時刻kでの確からしさLk S0〜Lk S5は、以下に示すように時刻k−1での所定の状態の確からしさLk-1 S0〜Lk-1 S5と、時刻kでの実際のサンプル値ykとを用いて以下の式(25)で表される。なお、以下の式における演算子min[xxx,zzz]は、xxxとzzzとのうちのいずれか小さい方を選択するものとする。
【0136】
本実施形態では、時刻k−1での確からしさLk-1に加算されるブランチメトリック(例えば(yk+3)2)は常に1/2されるとともにyk 2/2が減算されるものとする。なおPRML方式では、上述のLk S0〜Lk S5を互いに比較して値が小さくなるものを選択できれば良いことから、上記のような計算規則をLk S0〜Lk S5を求める全ての式について適用した場合には復号結果に影響が及ぶことはない。その結果、各状態S0〜S5の時刻kでの確からしさLk S0〜Lk S5は以下の式(26)で表される。
【0138】
この式(26)を展開すると、下記の式(27)が得られる。
【0140】
ここで、Ak、Bk、Ck、Ek、Fk、Gkを以下のように定義する。
【0142】
Ak=3yk+9/2=(yk-th4)+(yk-th5)+(yk-th6)
Bk=2yk+2=(yk-th4)+(yk-th5)
Ck=yk+1/2=(yk-th4)
Ek=-yk+1/2=(th3-yk)
Fk=-2yk+2=(th3-yk)+(th2-yk)
Gk=-3yk+9/2=(th3-yk)+(th2-yk)+(th1-yk)
【0143】
なお、th1=5/2、th2=3/2、th3=1/2、th4=-1/2、th5=-3/2、th6=-5/2を満たすものとする。
【0144】
このようにしてLk S0〜Lk S5を上記(27)式に従って求めるようにしておけば、時刻kでサンプル値ykが検出された場合に、理想値とサンプル値との差の2乗の計算を行なわずとも、Ak〜Gkに示されるような単純な乗算および加算によって確からしさLk S0〜Lk S5を求めることが可能である。従って、回路構成を複雑にせずに済むという利点が得られる。
【0145】
さらに実施形態1で説明したように、2つの取り得る状態遷移列(パスAおよびパスB)の確からしさの差|Pa−Pb|を求めることで信号品質を評価することが可能であるが、このPa−Pbを求める計算も2乗の計算を含まない比較的簡単なものとすることができる。以下、Pa−Pbの求め方を具体的に説明する。
【0146】
例えば、実施形態1で説明したように、PR(1,2,2,1)等化が適用されている場合、ユークリッド距離が最小となるパスAおよびパスBについてPa−Pbを求めることが望ましい。すなわち、表2に示した状態遷移のうち、Pa=0またはPb=0のときにPa−Pbが±10をとる8通りの状態遷移が生じている場合にPa−Pbを求めることが望ましい。
【0147】
例えば、上記8通りの状態遷移のうちS0k-4 → S4kの遷移についてPa−Pbを求める場合について説明する。この場合、パスAは、S0→S0→S1→S2→S4を遷移し、パスBは、S0→S1→S2→S3→S4を遷移する。このときパスAの確からしさPaは(yk-3+3)2/2+(yk-2+2)2/2+(yk-1+0)2/2+(yk−1)2/2で表される。また、パスBの確からしさPbは(yk-3+2)2/2+(yk-2+0)2/2+(yk-1−2)2/2+(yk−2)2/2で表される。
【0148】
このとき、Pa−Pbは上述のAk〜Gkを用いて表すことが可能である。具体的には、Pa−Pb=(Ak-3−Bk-3)+Bk-2−Fk-1+(Ek−Fk)で表される。このように本実施形態によれば、Pa−Pbは、サンプル値ykと設定値th1〜th6との単純な加減算で求められるAk〜Gkを用いて表されるため、2乗の演算などを行なう必要がなく、比較的容易に求めることができる。従って、回路構成を複雑にしないですむという利点が得られる。
【0149】
なお、上記には遷移S0k-4 → S4kについてのPa−Pbの求め方を説明したが、他の遷移についてのPa−Pbも同様に、上記のAk〜Gkを用いて表すことが可能である。以下にこれらの例を示す。
【0150】
状態遷移S0k-4→S3kの場合、
Pa−Pb=(Ak-3−Bk-3)+Bk-2−Fk-1+(Fk−Gk)
状態遷移S2k-4→S0kの場合、
Pa−Pb=(Ek-3−Fk-3)−Fk-2+Bk-1+(Ak−Bk)
状態遷移S2k-4→S1kの場合、
Pa−Pb=(Ek-3−Fk-3)−Fk-2+Bk-1+(Bk−Ck)
状態遷移S5k-4→S4kの場合、
Pa−Pb=(Bk-3−Ck-3)+Bk-2−Fk-1+(Ek−Fk)
状態遷移S5k-4→S3kの場合、
Pa−Pb=(Bk-3−Ck-3)+Bk-2−Fk-1+(Fk−Gk)
状態遷移S3k-4→S0kの場合、
Pa−Pb=(Fk-3−Gk-3)−Fk-2+Bk-1+(Ak−Bk)
状態遷移S3k-4→S1kの場合、
Pa−Pb=(Fk-3−Gk-3)−Fk-2+Bk-1+(Bk−Ck)
【0151】
(実施形態3)
以下、図7を参照しながら、PRML方式で再生信号の復号を行なう光ディスク装置100を説明する。
【0152】
光ディスク装置100において、光ディスク8から光ヘッド50によって読み出された再生信号はプリアンプ9によって増幅され、ACカップリングされたのちAGC(automatic gain controller)10に入力される。AGC10では後段の波形等化器11の出力が所定の振幅となるようゲインが調整される。AGC10から出力された再生信号は、波形等化器11によって波形整形される。波形整形された再生信号は、PLL回路12とA/D変換器13とに出力される。
【0153】
PLL回路12は再生信号に同期する再生クロックを生成する。なお、このPLL回路12は、図1に示した従来のPLL回路(位相比較器5、LPF6およびVCO7で構成される回路)と同様の構成を有していて良い。また、A/D変換器13は、PLL回路12から出力された再生クロックと同期して再生信号のサンプリングを行なう。このようにして得られたサンプリングデータはA/D変換器13からデジタルフィルタ14に出力される。
【0154】
デジタルフィルタ14は、記録再生系の周波数特性がビタビ回路15の想定する特性(本実施形態ではPR(1,2,2,1)等化特性)となるように設定された周波数特性をもつ。このデジタルフィルタ14から出力されたデータは、最尤復号を行なうビタビ回路15に入力される。ビタビ回路15は、PR(1,2,2,1)等化された信号を最尤復号方式で復号することによって2値化データを出力する。
【0155】
また、ビタビ回路15からは、復号された2値化データとともに、時刻ごとのユークリッド距離の計算結果(ブランチメトリック)が、差分メトリック解析器16へと出力される。差分メトリック解析器16は、ビタビ回路15から得られた2値化データから状態遷移を判別し、この判別結果とブランチメトリックとによって復号結果の信頼性を示すPa−Pbを求める。これによって復号結果の誤り率を推定することができる。
【0156】
以下、図8を参照しながら、ビタビ回路15および差分メトリック解析器16について詳細に説明する。図8は、ビタビ回路15および差分メトリック解析器16の構成を示す。デジタルフィルタ14から出力されたサンプル値ykは、ビタビ回路15のブランチメトリック演算回路17に入力される。ブランチメトリック演算回路17では、サンプル値ykと期待値levelvとの距離に相当するブランチメトリックが計算される。PR(1,2,2,1)等化が用いられているため、期待値levelvは0〜6までの7つの値を持つ。時刻kにおける、それぞれの期待値とサンプル値ykとの距離を表すブランチメトリックAk、Bk、Ck、Dk、Ek、Fk、Gkのそれぞれは下記の式(28)で規定される。
【0157】
このようにして計算されたブランチメトリックは、加算/比較/選択回路18に入力される。入力された時刻kでのブランチメトリックと時刻k−1での各状態の確からしさ(メトリック値)とから、時刻kでの各状態S0〜S5(図4参照)の確からしさが求まる。各状態の確からしさは式(29)で表される。なお、min[xxx,zzz]は、xxxまたはzzzのうちの小さい方の値を選択する関数である。
【0159】
時刻kでのメトリック値Lk S0〜Lk S5はレジスタ19に格納され、つぎの時刻k+1での各状態のメトリック値の演算に用いられる。また、回路18は、式(29)に従ってメトリック値が最小となる状態遷移を選択するとともに、下記の式 (30)に示すように選択結果に基づいて制御信号Sel0〜Sel3を、図9に示す回路構成を有するパスメモリ20に出力する。
【0161】
パスメモリ20は、入力された制御信号に基づいて状態遷移則に従う最も確からしい状態遷移列を推定することができ、この推定された状態遷移列に対応する2値化データckを出力する。
【0163】
一方、再生信号の品質の評価を行なうために、ブランチメトリック演算回路17から出力されたブランチメトリックは遅延回路21に入力され、加算/比較/選択回路18およびパスメモリ20における信号処理時間分だけ遅延された後に差分メトリック演算器22に出力される。また、パスメモリ20から出力された2値化データckは状態遷移検出器23に入力され、ここにおいて2値化データの所定のパターンの検出が行なわれる。具体的には、上述の式(9)に示される8通りの状態遷移に対応するデータパターンの検出が行なわれる。差分メトリック演算器22は、状態遷移検出器23が所定の状態遷移を検出したときに、上述の式(9)に従って、その検出された状態遷移についてのPa−Pbを計算する。
【0164】
なお、Pa−Pbは、実施形態2で説明したような2乗の演算を含まないような計算方法で求めることも可能である。実施形態2の方法によれば、Pa−Pbは、ブランチメトリック演算回路17で計算されるブランチメトリックを用いることなく求められ得る。従って、このような場合には、ディジタルフィルタ14から出力されたサンプル値ykを遅延回路21のみを介して直接的に差分メトリック演算器22に入力するような回路構成を採用すればよい。差分メトリック演算器22では、実施形態2で説明したような方法に従って、サンプル値ykからPa−Pbが求められ得る。
【0165】
このようにして計算された、検出された所定の状態遷移についてのPa−Pbの値は、平均値/標準偏差演算器24に入力される。平均値/標準偏差演算器24は入力されたPa−Pbの分布の平均値と標準偏差を求め、これらの2つの値(すなわち、平均値Pave10および標準偏差σ10)を出力する。なお、ここで出力される平均値Pave10および標準偏差σ10は、2つのパスのユークリッド距離が最小値をとる(すなわち、パスを誤る可能性が高い)所定の状態遷移についての値である。式(11)に基づいて、平均値Pave10および標準偏差σ10から再生信号の誤り率を推定することができる。すなわち、平均値/標準偏差演算器24から得られた標準偏差、平均値は、誤り率と相関のある再生信号品質を示す指標として用いられる。なお、上述したように、平均値がゼロに近い値を取ると予想されるため、Pave10をゼロと見なして誤り率を求めるようにしてもよい。
【0166】
以上、図7に示す構成を有する光ディスク装置100について説明したが、光ディスク装置は、図10に示すようにPLL回路におけるクロック再生のために適切な等化特性を有する波形等化器B28をさらに備えるような構成を有していても良い。この場合にも、図7に示した光ディスク装置100と同様に標準偏差、平均値を求めることができ、これにより再生信号の品質を評価することができる。また、このようにクロック再生に適した波形整形を行なう波形等化器と、PRML復号方式に適した波形整形を行なう波形等化器とを別個に設けることで、好ましい再生クロック信号を生成できるとともに、PRML方式での復号の正確性を向上させることが可能である。なお、このような2以上の波形等化器を用いる光ディスク装置は、本願出願人と同一の出願人によって出願された米国特許出願番号第09/996,843号に記載されている。本明細書においてこの米国特許出願番号第09/996,843号を援用する。
【0167】
また、図11に示すように、A/D変換器13の出力(デジタル信号)から再生クロックを生成するようにしてもよい。この場合にも、図7に示した光ディスク装置100と同様に標準偏差、平均値を求めることができ、これにより再生信号の品質を評価することができる。
【0168】
また、上述のように差分メトリック解析器16から出力されるPa−Pbの分布の標準偏差σ、平均値Paveを指標として用いて再生信号の品質を評価することができるが、この指標(標準偏差σおよび平均値Pave)に基づいて再生信号品質を改善する制御を行なうことも可能である。例えば、図12に示すように、周波数特性制御手段29を用いて、差分メトリック解析器16から出力される平均値が0となるように、あるいは、標準偏差が最小となるように波形等化器11の周波数特性を変化することで再生信号品質を改善することができる。また、情報を記録することが可能な光ディスク装置においては、差分メトリック解析器16から出力される平均値が0となるように、あるいは標準偏差が最小となるように、記録パワーや記録補償量を制御することによって記録パラメータの最適化を行うことができる。
【0169】
(実施形態4)
次に、図13を参照しながら本発明の実施形態4にかかる光ディスク装置を説明する。
【0170】
本実施形態では、差分メトリック解析器160は、上述の式(14)によって規定されるPRML誤差指標MLSA(M=σ/2・dmin 2)を出力するように構成されている。なお、PRML誤差指標MLSAは、最も確からしい状態遷移列と再生信号との標準偏差(平均二乗誤差)σを、当該状態遷移列と2番目に確からしい状態遷移列とのユークリッド距離で除算することによって求められる。PRML誤差指標MLSAは、PRMLを用いた場合の再生信号品質を好適に評価することができる指標である。
【0171】
差分メトリック解析器160から出力される誤差指標MLSAは、周波数特性制御手段290に供給される。周波数特性制御手段290は、この誤差指標MLSAが最小になるように、波形等化器の特性(例えば、ブースト量やブースト中心周波数)を最適化する。例えば、ブースト量を微少量変化させ、変化前後のポイントにおけるPRML誤差指標MLSAを比較して、よりMLSAが小さくなるほうのブースト量を選択する。このような動作を繰り返すことにより波形等化器の特性が最適化され、PRML誤差指標MLSAを最小値に収束させることができる。
【0172】
また、図14に示すように、差分メトリック解析器160によって生成されたPRML誤差指標MLSAを、フォーカスオフセット探査手段291に供給するようにしてもよい。信号再生時、光ヘッド50が出射するビームスポットが常に光ディスク8の情報記録面付近を走査し得るようにフォーカスサーボ制御が行なわれる。このフォーカスサーボ制御は、サーボアンプ91によって検出されたフォーカス誤差信号が、引算器92を介して所定目標値X0になるように光ヘッド50のフォーカスアクチュエータ(不図示)をフィードバック制御することで実行される。ここで、フォーカスオフセット探査手段291が、所定目標値X0としてPRML誤差指標MLSAを最小とするような目標値X0を引算器92に対して出力するようにすれば、PRML誤差指標MLSAが最小となるような(すなわち、誤り率が最小となるような)フォーカスサーボ制御を行うことができる。なお、このような目標値X0の探査を行なうためには、例えば、上記目標値X0を微少変化させたときのPRML誤差指標MLSAの変化を検出および比較すればよい。
【0173】
なお、本実施の形態では、PRML誤差指標MLSA を用いてフォーカス目標値を最適化しているが、本発明は他のサーボ目標値の最適化にも応用することができる。上記のPRML誤差指標MLSA を用いて、例えば、トラッキングサーボ、ディスクチルト制御、レンズ球面収差補正制御等を行うことが可能である。
【0174】
さらに、図15に示すように、信号再生用光ヘッド50および信号記録用光ヘッド51の2種類の光ヘッドを備える光ディスク装置において、差分メトリック解析器160から出力されるPRML誤差指標MLSAを用いて、記録パワーを制御するようにしてもよい。光ディスクに記録するべき信号は、記録信号生成手段103によって変調器102を介して信号記録用光ヘッド51に供給される。変調器102は、適当な記録パワーPと上記記録信号とを掛け合わせて光ヘッド51に供給する。このとき、差分メトリック解析器160によって生成されたPRML誤差指標MLSAを記録パワー制御手段292に供給することで、記録パワー制御手段292は、PRML誤差指標MLSAが最小になるように上記記録パワーPを決定することができる。
【0175】
なお、図15に示す光ディスク装置は、記録動作および再生動作のそれぞれを別々のヘッドを用いて行っているが、1つのヘッドの機能を記録と再生との間で切り替え、上記の各動作を実行するようにしてもよい。また、上記には、記録パワーを制御する例を示したが、PRML誤差指標MLSAに基づいて記録パルスの幅や位相を制御するような構成としてもよい。
【0176】
【発明の効果】
本発明の再生信号品質評価方法によれば、n通りの状態遷移列のうちから最も確からしい状態遷移列を推定する最尤復号方式において、時刻k−jでの状態から時刻kでの状態に至るまでの所定期間における状態遷移の確からしさ(例えば、所定期間におけるユークリッド距離の累積値)をPaとし、2番目に確からしい状態遷移列の時刻k−jでの状態から時刻kの状態に至るまでの所定期間における状態遷移の確からしさ(例えば、所定期間におけるユークリッド距離の累積値)をPbとするとき、時刻k−jから時刻kまでの復号結果の信頼性を|Pa−Pb|によって判断する。また、この複数回測定された|Pa−Pb|のばらつきを求めることによって、最尤復号の2値化結果の誤り率と相関のある信号品質を示す指標が得られる。
【図面の簡単な説明】
【図1】従来の光ディスクドライブの構成図
【図2】ジッタとビット誤り率の関係を示す図
【図3】本発明の実施例で用いる最小極性反転間隔が2であることとPR(1,2,2,1)等化の制約から定まる状態遷移図
【図4】本発明の実施例で用いる最小極性反転間隔が2であることとPR(1,2,2,1)等化の制約から定まるトレリス図
【図5】本発明の実施例で用いるトレリス図において状態S0kと状態S0k-5間でとりうる2つの状態遷移列を示す図
【図6】復号結果の信頼性を示すPa-Pbの分布の模式図
【図7】本発明の実施形態3にかかる再生信号品質評価装置の構成図
【図8】本発明の実施形態3にかかる再生信号品質評価装置のビタビ回路、差分メトリック解析器の詳細構成図
【図9】本発明の実施形態3にかかる再生信号品質評価装置のパスメモリの構成図
【図10】本発明の実施形態3にかかる別の再生信号品質評価装置の構成図
【図11】本発明の実施形態3にかかるさらに別の再生信号品質評価装置の構成図
【図12】本発明の実施形態3にかかるさらに別の再生信号品質評価装置の構成図
【図13】本発明の実施形態4にかかる光ディスク装置の構成図
【図14】本発明の実施形態4にかかる別の光ディスク装置の構成図
【図15】本発明の実施形態4にかかるさらに別のの光ディスク装置の構成図
【図16】指標MLSAと誤り率BER(Bit Error Rate)との関係を示すグラフ
【図17】本発明の実施例で用いる最小極性反転間隔が2であることとPR(C0,C1,C0)等化の制約から定まる状態遷移図
【図18】本発明の実施例で用いる最小極性反転間隔が2であることとPR(C0,C1,C0)等化の制約から定まるトレリス図
【図19】本発明の実施例で用いる最小極性反転間隔が2であることとPR(C0,C1,C2,C1,C0)等化の制約から定まる状態遷移図
【図20】本発明の実施例で用いる最小極性反転間隔が2であることとPR(C0,C1,C2,C1,C0)等化の制約から定まるトレリス図
【符号の説明】
1、8 光ディスク
2 光学ヘッド
3、11 波形等化器
4 コンパレータ
5、位相比較器
6 LPF
7 VCO
9 プリアンプ
10、28 AGC
12 PLL回路
13 A/D変換器
14 デジタルフィルタ
15 ビタビ回路
16 差分メトリック解析器
17 ブランチメトリック演算回路
18 加算/比較/選択回路
19 レジスタ
20 パスメモリ
21 遅延回路
22 差分メトリック演算器
23 状態遷移検出器
24 セレクタA
25 セレクタB
26、27 平均値/標準偏差演算器
28 波形等化器B
29 周波数特性制御手段[0001]
BACKGROUND OF THE INVENTION
The present invention relates to a method for evaluating the quality of a decoded signal when decoding digital information recorded on a recording medium by a maximum likelihood decoding method, and an information reproducing apparatus capable of performing such evaluation.
[0002]
[Prior art]
In recent years, devices capable of reproducing digital information recorded on a recording medium, such as an HDD (Hard Disk Drive), an optical disk drive, or a magneto-optical disk drive, have been widely used in AV equipment and personal computers.
[0003]
FIG. 1 shows a partial configuration of a conventional
[0004]
In the
[0005]
The recovered clock signal is used to determine whether the recording code (digital information) is 1 or 0. More specifically, the detection pulse of the comparator 4 (that is, the signal portion exceeding the threshold value in the binarized signal output from the comparator 4) exists within the window width (window width) defined by the reproduction clock signal. The digital information can be reproduced by detecting whether or not to do so.
[0006]
However, the detection pulse output from the
[0007]
When digital information is reproduced as described above, the reproduction signal quality (error rate) can be detected by obtaining the jitter distribution. This jitter distribution can be assumed to be a normal distribution with an average value of 0. In this case, the error rate Pj (σ / Tw) is expressed by the following equation (1) using the standard deviation σ of the jitter distribution: ) And (2).
[0008]
[Expression 1]
[Expression 2]
Here, σ is the standard deviation of the jitter distribution assumed to be a normal distribution, and Tw is the window width.
[0011]
From the graph shown in FIG. 2, it can be seen that the error rate (bit error rate BER) increases as the standard deviation of jitter increases. The jitter of the reproduced signal can be actually measured using a TIA (Time Interval Analyzer). For this reason, even if no error actually occurs, the signal quality can be evaluated by the standard deviation σ / Tw of the jitter, and thereby the likelihood of occurrence of the error can be predicted. By measuring the standard deviation of jitter in this way, for example, the performance of the drive, the performance of the recording medium, the performance of the optical head, etc. can be confirmed and tested. Further, it is possible to perform a more stable reproduction operation by adjusting equalizer parameters or the like so that the standard deviation of jitter is reduced.
[0012]
[Problems to be solved by the invention]
On the other hand, unlike the method of reproducing digital information directly from the binary signal output from the
[0013]
In such a maximum likelihood decoding method, decoding is performed by selecting the most probable state transition sequence based on the reproduced signal. In general, an amount representing the probability of the state transition to the state Sn (n is the number of states) up to the time k is defined by Expression (3).
[0014]
[Equation 3]
Where yiIs the value of the playback signal (digital sample data) at time i, levelvIs an expected value of an ideal reproduction signal.
[0016]
In the maximum likelihood decoding circuit, a state transition sequence that minimizes the amount representing the probability obtained by the above equation (3) is selected. In the case of using the maximum likelihood decoding method, sampling is performed with a reproduction clock at each time k, unlike the method of determining “1” and “0” depending on whether or not the detection pulse falls within the window width at each time k. Data ykEuclidean distance (yk-levelv)2And the decoding is performed based on the Euclidean distance. Therefore, the decoding result in the maximum likelihood decoding method is the sample value y of the past sampled reproduction signal.kWill also be affected.
[0017]
When such a maximum likelihood decoding method is used, an error may or may not occur even if a reproduced signal has the same jitter standard deviation σ. For this reason, it is difficult to predict the error rate of the binarization result obtained by the maximum likelihood decoding using the standard deviation σ of the jitter of the reproduction signal. Therefore, it is necessary to use an error rate prediction method (signal quality evaluation method) more suitable for the maximum likelihood decoding method.
[0018]
A method for evaluating the quality of a signal reproduced by the maximum likelihood decoding method is described in, for example, Japanese Patent Laid-Open No. 10-21651. In the apparatus described in this publication, the signal quality is evaluated by obtaining a difference in likelihood between two paths (state transition sequences) having a minimum Euclidean distance and statistically processing the difference.
[0019]
More specifically, in order to obtain the difference in likelihood between two paths that take the same state at time k, each of two different states (states at time k-1 in each path) at time k−1. The cumulative value of the branch metric of the path (surviving path) that has already been determined to be the maximum likelihood is used. However, when the cumulative value of the branch metric at time k−1 is used, it is desirable if, for example, a path different from the path whose actual likelihood is to be checked is erroneously selected as the path before time k−1. There was a possibility of using the cumulative value of non-branch metrics. Although the above publication describes that two paths that minimize the Euclidean distance are selected and the difference between these likelihoods is calculated, the likelihood that is actually desired for the two paths is calculated. There is no particular description of a method for performing it more reliably.
[0020]
The present invention has been made in view of the above problems, and an object of the present invention is to provide a method and an evaluation method for reproducing signal quality using an index correlated with an error rate of a binarization result by maximum likelihood decoding. To provide an apparatus.
[0021]
[Means for Solving the Problems]
The reproduction signal quality evaluation method of the present invention is the first state S at time k−j (k is an integer of 3 or more, j is an integer of 2 or more)kjTo the second state S at time kkOf the decoded signal in the case of decoding the reproduction signal by the maximum likelihood decoding method that selects the most probable state transition sequence from n (n is an integer of 2 or more) state transition sequences In the quality evaluation method, the first state S that defines the n state transition sequences in a predetermined period j from the time k−j to the time k.kjAnd the second state SkAnd a state of the first state transition sequence most probable of the n state transition sequences defined by the detected predetermined combination in the predetermined period j. When the index indicating the probability of transition is Pa and the index indicating the probability of state transition in the predetermined period j of the second most likely state transition sequence is Pb, | Pa−Pb | is used. And determining the reliability of the decoding result from time k-j to time k.
[0022]
In a preferred embodiment, Pa is defined based on a difference between an expected value indicated by the first state transition sequence in the predetermined period j and an actual sample value, and Pb is defined as the predetermined period j. Is defined based on the difference between the expected value indicated by the second state transition sequence and the actual sample value.
[0023]
In a preferred embodiment, Pa is a time k−j indicated by the first state transition sequence in the predetermined period j.+1Expected value from time to time kkj +1 , ..., lk-1, LkAnd the actual sample value ykj +1 , ..., yk-1, YkAnd Pb is the time k−j indicated by the second state transition sequence.+1Expected value m from time to time kkj +1 , ..., mk-1, MkAnd the actual sample value ykj +1 , ..., yk-1, YkCorresponds to the cumulative value of the square of the difference.
[0024]
In certain preferred embodiments, n = 2.
[0025]
In a preferred embodiment, the Euclidean distance between the first state transition sequence and the second state transition sequence has a minimum value.
[0026]
In a preferred embodiment, the method further includes a step of determining a variation in reliability of the decoding result by measuring the | Pa-Pb |
[0027]
In a preferred embodiment, the reliability variation is indicated by using a standard deviation of the distribution of | Pa-Pb |.
[0028]
In a preferred embodiment, the reliability variation is indicated by using a standard deviation of the | Pa−Pb | and an average value of the distribution of the | Pa−Pb |.
[0029]
In a preferred embodiment, a variation in reliability of the decoding result is determined by detecting a frequency that | Pa−Pb | exceeds a predetermined value.
[0030]
In a preferred embodiment, the recorded signal has a minimum polarity inversion interval of 2 and a reproduction signal equalized by PR (C0, C1, C0) is decoded.
[0031]
In a preferred embodiment, the recorded signal has a minimum polarity inversion interval of 2 and a reproduction signal equalized by PR (C0, C1, C1, C0) is decoded.
[0032]
In a preferred embodiment, the recorded signal has a minimum polarity inversion interval of 2 and PR (C0, C1, C2, C1, C0) equalized reproduction signals are decoded.
[0033]
In a preferred embodiment, when calculating | Pa−Pb |, the square of the actual sample value is not calculated.
[0034]
An information reproducing apparatus according to the present invention is synchronized with a gain controller that adjusts an amplitude value of a reproduced signal, a waveform equalizer that shapes the reproduced signal to have a predetermined equalization characteristic, and the reproduced signal. A reproduction clock generation circuit for generating a reproduction clock, an A / D converter for generating sampling data by sampling the reproduction signal with the reproduction clock, and outputting the sampling data; A maximum likelihood detector that decodes probable digital information, and Pa as an index representing the probability of state transition in a predetermined period of the first state transition sequence determined to be most probable in the maximum likelihood detector. When an index indicating the probability of state transition in the predetermined period of the second state transition sequence that is likely to be And a difference metric calculator for calculating a | Pa-Pb.
[0035]
In a preferred embodiment, an additional waveform equalizer that performs waveform shaping to have a predetermined equalization characteristic different from that of the waveform equalizer is further provided, and the recovered clock is generated by the additional waveform equalizer. It is generated from a waveform-shaped reproduction signal.
[0036]
DETAILED DESCRIPTION OF THE INVENTION
Embodiments of a reproduction signal quality evaluation method and an information reproduction apparatus according to the present invention will be described below.
[0037]
Hereinafter, a reproduction signal quality evaluation method according to an embodiment of the present invention will be described. In the form described below, a code having a minimum polarity inversion interval of 2 defined according to the (1,7) RLL modulation method or the like is used as the recording code. That is, the recording code always has two or more 0s or 1s. Also, decoding is performed using a PRML system in which the frequency characteristics of the recording system and the frequency characteristics of the reproduction system are set so as to exhibit PR (1, 2, 2, 1) equalization characteristics as a whole. Hereinafter, a more specific decoding procedure will be described.
[0038]
The recording code (either 0 or 1) is expressed as follows.
[0039]
Current recording code: bk
Recording code one hour before: bk-1
Recording code two hours ago: bk-2
[0040]
The ideal value of the reproduction signal when PR (1, 2, 2, 1) equalization is set to Level.vThen, LevelvIs represented by the following equation (4).
[0041]
Levelv= Bk-3+ 2bk-2+ 2bk-1+ Bk …(Four)
[0042]
Here, k is an integer representing time, and v is an integer from 0 to 6. In the case of PR (1, 2, 2, 1) equalization, seven kinds of values (Level) where the ideal sample value (expected value) is 0 to 6 depending on the combination of recording codes.v) Can be taken.
[0043]
Next, the transition of the recording code state will be described. The state at time k is S (bk-2, bk-1, bk) And the state at time k−1 is S (bk-3, bk-2, bk-1). Considering the combination of the state at time k-1 and the state at time k, a state transition table as shown in Table 1 below is obtained. As described above, since the modulation scheme in which the minimum inversion interval between 0 and 1 is 2 is adopted, the state transitions that can be taken by the recording code are limited to the following 10 types.
[0044]
[Table 1]
For simplicity, state S (0,0,0) at time kkS0k, State S (0,0,1)kS1k, State S (0,1,1)kS2k, State S (1,1,1)kS3k, State S (1,1,0)kS4k, State S (1,0,0)kS5kIt describes as follows. State transitions that can occur in the period from time k-1 to time k (time corresponding to one period T of the recovered clock) are represented by the state transition diagram shown in FIG. 3, and when this is expanded with respect to the time axis, FIG. The trellis diagram shown in Fig. 1 is obtained.
[0046]
Here, state S0 at time kkAnd state S0 at time k-5k-5Pay attention to. FIG. 5 shows the state S0kAnd state S0k-5Two state transition sequences that can be taken between and are shown. If one of the possible state transition sequences is path A, path A is in state S0.k-5, S0k-4, S0k-3, S0k-2, S0k-1, S0k, And the other state transition sequence is path B, path B is in state S0k-5, S1k-4, S2k-3, S4k-2, S5k-1, S0kTransition. 4 and 5, (record code / Levelv) is shown for each state transition, but Level is shown as having seven values from −3 to 3, and −3 to 3 Each corresponds to 0 to 6 of the above Level.
[0047]
Thus, the state at time k-5 is S0.k-5And the state at time k is S0kIn such a case, it is presumed that the path A or the path B is transited. That is, the decrypted data from time k-7 to time k (Ck-7, Ck-6, Ck-5, Ck-4, Ck-3, Ck-2, Ck-1, Ck) = (0,0,0, x, x, 0,0,0) When a decoding result (x is a value of 0 or 1) is obtained, the state transition of path A or path B is the most. It is estimated that it is certain.
[0048]
In this way, the state S0 at time kkAnd state S0 at time k-5k-5Is detected (that is, when a decoding result of (0,0,0, x, x, 0,0,0) is obtained), which is more likely to be path A or path B? Is judged. This determination is based on the magnitude of the deviation between the ideal sample value (expected value) indicated by the path A and the actual sample value, and the deviation between the ideal sample value (expected value) indicated by the path B and the actual sample value. This can be done by comparing the size of. More specifically, an expected value (Level) from time k-4 to time k indicated by each of path A and path B.v) And playback signal yk-4To ykIt is possible to determine which state transition sequence of path A or path B is more likely based on the cumulative result of the square of the difference from each of the actual values up to.
[0049]
Here, expected value l from time k-4 to time k indicated by path Ak-4, Lk-3, Lk-2, Lk-1, Lk(That is, each of 0, 0, 0, 0, 0) and the reproduction signal yk-4To ykThe cumulative value of the square of the difference from the previous value is Pa, and the expected value m from time k-4 to time k of path Bk-4, Mk-3, Mk-2, Mk-1, Mk(Ie, 1, 3, 4, 3, 1) and the reproduction signal yk-4To ykIf the cumulative value of the square of the difference from the previous value is Pb, the accumulated value Pa is represented by the following equation (5), and the accumulated value Pb is represented by the following equation (6).
[0050]
Pa = (yk-4-0)2+ (yk-3-0)2+ (yk-2-0)2+ (yk-1-0)2+ (yk-0)2 …(Five)
[0051]
Pb = (yk-4-1)2+ (yk-3-3)2+ (yk-2-Four)2+ (yk-1-3)2+ (yk-1)2 … (6)
[0052]
The accumulated value Pa obtained in this way is an index indicating the probability of the transition of the path A in a predetermined period from the time k-5 to the time k. The smaller the value of Pa, the more likely the path A is. Become. The accumulated value Pb is an index indicating the probability of the transition of the path B in a predetermined period from the time k-5 to the time k. The smaller the value of Pb, the more likely the path B is. When the value of Pa or Pb is 0, the probability of path A or path B is maximized.
[0053]
Next, the meaning of the difference Pa−Pb between Pa and Pb will be described. The maximum likelihood decoding circuit selects the path A with confidence if Pa << Pb, and selects the path B with confidence if Pa >> Pb. However, if Pa = Pb, it does not matter which path A or path B is selected, and it can be said that whether the decoding result is correct is 5
[0054]
The index Pa-Pb indicating the reliability of the decoding result is used for evaluating the quality of the reproduction signal. For this purpose, for example, a Pa-Pb distribution is obtained by obtaining Pa-Pb for a predetermined time or a predetermined number of times based on the decoding result. A schematic diagram of the distribution of Pa-Pb is shown in FIG. FIG. 6A shows the distribution of Pa-Pb when noise is superimposed on the reproduction signal. This distribution has two peaks, one having a maximum when Pa = 0, and the other having a maximum when Pb = 0. The value of Pa-Pb when Pa = 0 is expressed as -Pstd, and the value of Pa-Pb when Pb = 0 is expressed as Pstd. When the absolute value of Pa-Pb is taken and | Pa-Pb | -Pstd is obtained, a distribution as shown in FIG. 6B is obtained.
[0055]
Assuming that this distribution is a normal distribution, a standard deviation σ and an average value Pave of the distribution are obtained. The standard deviation σ and the average value Pave of this distribution can be used to predict the bit error rate. For example, when the distribution curve estimated as indicating the distribution of | Pa−Pb | is gentle and this distribution curve is defined by a function that can take a value of | Pa−Pb | That is, when it is considered that a decoding error occurs at a frequency according to the probability that the value of | Pa-Pb | is 0 or less when the frequency at which | Pa-Pb | Using σ and the average value Pave, the error probability P (σ, Pave) can be defined by the following equation (7).
[0056]
P (σ, Pave) = erfc (Pstd + Pave / σ)… (7)
[0057]
Thus, using the average value Pave and the standard deviation σ obtained from the Pa-Pb distribution, the error rate of the binarization result by the maximum likelihood decoding method can be predicted. That is, the average value Pave and the standard deviation σ can be used as an index of the reproduction signal quality. In the above example, it is assumed that the distribution of | Pa−Pb | is a normal distribution. However, when it is difficult to consider the distribution of | Pa−Pb | Instead of obtaining the average value Pave and the standard deviation σ as described above, the number of times that the value of | Pa−Pb | is equal to or smaller than a predetermined reference value may be counted. The count number thus obtained can serve as an index indicating the degree of variation of | Pa−Pb |.
[0058]
As described above, according to the present embodiment, it can be taken when a state transition occurs from a predetermined first state (for example, S0) to a predetermined second state (for example, S0) in a predetermined period. The reliability of decoding can be determined by calculating the absolute value | Pa−Pb | of the difference in certainty in the predetermined period for the two paths. Further, by measuring | Pa−Pb | multiple times to obtain a degree of variation (distribution) in decoding reliability | Pa−Pb |, the quality of the reproduced signal can be evaluated (prediction of bit error rate). it can.
[0059]
When signal quality is evaluated by such a method, a combination of state transitions that can take two paths that are most likely to cause an error (that is, a path that minimizes the Euclidean distance between the two paths) is selected. The signal quality may be evaluated using the absolute value | Pa−Pb | of the difference between the probabilities of the two paths. Hereinafter, this point will be described in detail.
[0060]
As described above, when decoding a reproduction signal that has a minimum polarity reversal interval of 2 and follows a state transition rule using PR (1, 2, 2, 1) equalization, state transitions that can take two paths are: In the range from time k-5 to time k, the above-described S0 is set.k-5To S0kThere are 15 ways to transition to. Table 2 below shows the state transition (a combination of the state at time k-5 and the state at time k) and the value (Pstd) that Pa-Pb can take in each state transition.
[0061]
[Table 2]
The reliability Pa-Pb of the above 16 decoding results can be expressed by the following equation (8).
[0063]
Ak= (yk-0)2, Bk= (yk-1)2, Ck= (yk-2)2, Dk= (yk-3)2, Ek= (yk-Four)2, Fk= (yk-Five)2, Gk= (yk-6)2It is.
[0065]
Further, when the above equation (8) is divided into a case where Pstd is 10 and a case where it is 36, it is represented by equation (9) when Pstd = 10, and when Ptsd = 36, equation (10) ).
[0066]
Here, it is considered to obtain an index of error rate in each case. In a state transition where Pstd is 10, the maximum likelihood decoding result ckPa-Pb satisfying equation (9) is obtained from the standard deviation σ from the distribution.TenAnd average value PaveTenAsk for. On the other hand, in the state transition where Pstd is 36, the maximum likelihood decoding result ckPa-Pb satisfying equation (10) is obtained from the standard deviation σ from the distribution.36And average value Pave36Ask for. Assuming that each distribution is a normal distribution, the error probability PTen, P36Are represented by the following formulas (11) and (12), respectively. That is, the error rate can be estimated for each pattern of the maximum likelihood decoding result, and the standard deviation σTenAnd average value PaveTenOr standard deviation σ36And average value Pave36Can be used as an index of the quality of the reproduction signal.
[0069]
[Expression 4]
[Equation 5]
In addition, in the case where a state transition pattern detection range is increased by one time and a combination pattern of state transitions that can take two state transition sequences in the range from time k-6 to time k is detected, the following table 3 is used. The 8 patterns shown can be further detected.
[0072]
[Table 3]
Like the equations (11) and (12) above, the probability P of causing an error in the pattern of Table 312Is represented by equation (13).
[0074]
[Formula 6]
What is important here is that in order to use reliability | Pa−Pb | as an index of reproduction signal quality, it is only necessary to detect a pattern of a state transition that has a high possibility of error (error rate). . That is, an index correlated with the error rate can be obtained without detecting all the state transition patterns.
[0076]
Here, a state transition pattern with a high possibility of error is a state transition pattern in which the maximum value of reliability | Pa−Pb | is small (that is, the Euclidean distance that is the absolute distance between the path A and the path B is minimum). Pattern). Here, this corresponds to the eight patterns shown in Table 2 in which Pa-Pb = ± 10 when either Pa or Pb is 0.
[0077]
Assuming that white noise is dominant among noises included in the reproduction signal, PTen> P12>> P36It is expected that PTenOnly 1 bit shift error is shown, and other patterns mean shift errors of 2 bits or more. When the error pattern after PRML processing is analyzed, most of them are 1-bit shift errors.TenThe error rate of the reproduced signal can be appropriately estimated by the equation (11) using Thus, a pattern that takes a predetermined state transition in a predetermined period is detected, and the standard deviation σ of the distribution of | Pa−Pb | −Pstd in the detected state transition is detected.Ten, Average value PaveTenCan be used as an index to evaluate the quality of the reproduced signal.
[0078]
As mentioned above, the error rate is the standard deviation σTenFor example, the PRML error index MLSA (Maximum Likelihood Sequence) defined by the following equation (14) is used. Amplitude) may be used as an index indicating signal quality (error rate).
[0079]
[Expression 7]
Where d2 minIs the square of the minimum value of the Euclidean distance of two possible paths, and is 10 in the combination of the modulation code and the PRML system of this embodiment. The index MLSA is the average value Pave in the equation (11).TenIs defined on the assumption that 0 is zero. This is the average value PaveTenCan typically be considered as taking a value close to 0, and the average value PaveTenThis is because an index having a correlation with the error rate can be obtained even when the above is not considered.
[0081]
FIG. 16 shows the relationship between the index MLSA defined by Equation (14) and the error rate BER (BitError Rate) that can be calculated from Equation (11). Similar to the relationship between jitter and error rate shown in FIG. 2, it can be seen that the error rate increases as the index MLSA increases. That is, it can be seen that the error rate after PRML processing can be predicted using the index MLSA.
[0082]
In addition,Until now,generalPRAs an example of (C0, C1, C1, C0) equalization (C0, C1 is an arbitrary positive number), the case where PR (1, 2, 2, 1) equalization is applied has been specifically described. , Other than thisPREven when (C0, C1, C1, C0) equalization (C0, C1 is an arbitrary positive number) is applied, an index having a correlation with the error rate can be obtained by the same procedure as described above.
[0083]
Hereinafter, as a form different from the above form, a recording code having a minimum polarity inversion interval of 2 is used and PR (C0, C1, C0) equalization (for example, PR (1, 2, 1) equalization) is used. A form to be applied will be described. C0 and C1 are arbitrary positive numbers.
[0084]
The recording code (either 0 or 1) is expressed as follows.
[0085]
Current time recording code: bk
Recording code one hour before: bk-1
Recording code two hours ago: bk-2
[0086]
When the ideal value of the reproduction signal when PR (C0, C1, C0) is equalized is Level, Level is expressed by the following equation (15).
[0087]
Level = C0 × bk-2+ C1 × bk-1+ C0 × bk … (15)
[0088]
Here, k is an integer representing time, and v is an integer from 0 to 3. Also, the state at time k is S (bk-1, bk), A state transition table as shown in Table 4 below is obtained.
[0089]
[Table 4]
State S (0,0) at time k for simplicity)) kS0k, State S (0,1))) kS1k, State S (1,1))) kS2k, State S (1,0))) kS3kIt describes as follows. The state transition in this case is shown in the state transition diagram shown in FIG. 17, and when this is developed with respect to the time axis, the trellis diagram shown in FIG. 18 is obtained.
[0091]
Here, under the condition that the minimum polarity reversal interval of the recording code is 2 and PR (C0, C1, C0) equalization is used, a predetermined state at one time from a predetermined state at another time As shown in Table 5, there are six types of state transition patterns (combination of states) that can take two state transitions (path A and path B) when transitioning to.
[0092]
[Table 5]
Here, it is determined which path A or path B is more likely. This determination is based on the magnitude of the deviation between the ideal sample value (expected value) indicated by the path A and the actual sample value, and the deviation between the ideal sample value (expected value) indicated by the path B and the actual sample value. This can be done by comparing the size of.
[0094]
For example, state transition S0k-3 → S2kIs estimated, the path A (S0k-3, S0k-2, S1k-1, S2k), Path B (S0k-3, S1k-2, S2k-1, S2k), The state S0 at time k-3k-3And take S2 at time kkTake. In this case, the expected value from time k-2 to time k and the value y of the reproduction signalk-2, Yk-1, YkWhether or not the state transition of the path A or the path B is more likely is determined by the cumulative value of the square of the difference between the path A and the path B. Here, each of the expected values from time k-2 to time k indicated by path A and the reproduction signal yk-2To ykThe accumulated value of the square of the difference from the values up to is Pa, and the expected value from time k-2 to time k of path B and the reproduction signal yk-2To ykIf the cumulative value of the square of the difference from the previous value is Pb, the accumulated value Pa is represented by the following equation (16), and the accumulated value Pb is represented by the following equation (17).
[0095]
Pa = (yk-2−0)2+ (Yk-1-C0)2+ (Yk− (C1 + C2))2 … (16)
[0096]
Pb = (yk-2-C0)2+ (Yk-1− (C0 + C1))2+ (Yk− (2 × C0 + C1))2 … (17)
[0097]
Here, if Pa << Pb, the possibility of the path A is estimated to be high, and if Pa >> Pb, the possibility of the path B is estimated to be high. That is, even when a recording code having a minimum polarity inversion interval of 2 and PR (C0, C1, C0) equalization are used, the reliability of the decoding result can be determined using | Pa-Pb |. Further, the quality of the reproduced signal can be evaluated (error rate estimation) based on the distribution of | Pa−Pb |.
[0098]
Considering the case where white noise is superimposed on the transmission line, it is considered that the state transition that can cause the most error is that the Euclidean distance between the path A and the path B is the minimum. Examples of the two paths that minimize the Euclidean distance include the two state transition patterns shown in Table 6 below.
[0099]
[Table 6]
Here, the decryption result is ck(K is an integer), and the reliability Pa-Pb in the state transitions shown in Table 6 is summarized to obtain Expression (18).
[0101]
Where AAk, BBk, CCk, DDkIs represented by the following equation.
[0103]
AAk= (Yk−0)2, BBk= (Yk-C0)2,
CCk= (Yk− (C0 + C1))2, DDk= (Yk− (2 × C0 + C1))2,
[0104]
Decryption result ckTo satisfy Equation (18) | Pa-Pb |-(2 × C02+ C12) And a standard deviation σ and an average value Pave are obtained from the distribution. Assuming that the distribution is a normal distribution, the probability of making an error is expressed by Equation (19). Therefore, the error rate of the reproduced signal can be estimated from the standard deviation σ and the average value Pave, and can be used as an indicator of signal quality.
[0105]
[Equation 8]
In this way, even when a recording code having a minimum polarity reversal interval of 2 is used and PR (C0, C1, C0) equalization is applied, a path that takes a predetermined state transition in a predetermined period The quality of the reproduction signal can be evaluated based on the difference in probability | Pa−Pb |.
[0107]
Hereinafter, as an embodiment different from the above-described embodiment, an embodiment in which a code having a minimum polarity inversion interval of 2 and PR (C0, C1, C2, C1, C0) equalization is applied will be described. Note that C0, C1, and C2 are arbitrary positive numbers.
[0108]
The recording code is expressed as follows.
[0109]
Current time recording code: bk
Recording code one hour before: bk-1
Recording code two hours ago: bk-2
[0110]
When the ideal value of the reproduction signal when PR (C0, C1, C2, C1, C0) is equalized is Level, Level is expressed by the following equation (20).
[0111]
Level = C0 × bk-4+ C1 × bk-3+ C2 × bk-2+ C1 × bk-1+ C0 × bk… (20)
[0112]
Here, k is an integer representing time, and v is an integer from 0 to 8. Also, the state at time k is S (bk-3, bk-2, bk-1, bk), A state transition table as shown in Table 7 below is obtained.
[0113]
[Table 7]
State S (0,0,0,0) at time k for simplicitykS0k, State S (0,0,0,1)kS1k, State S (0,0,1,1)kS2k, State S (0,1,1,1)kS3k, State S (1,1,1,1)kS4k, State S (1,1,1,0)kS5k, State S (1,1,0,0)kS6k, State S (1,0,0,0)kS7k, State S (1,0,0,1)kS8k, State S (0,1,1,0)kS9kIt describes as follows. The state transition in this case is shown in the state transition diagram shown in FIG. 19, and when this is developed with respect to the time axis, the trellis diagram shown in FIG. 20 is obtained.
[0115]
Here, under the condition that the minimum polarity reversal interval of the recording code is 2 and PR (C0, C1, C2, C1, C0) equalization is used, a predetermined time from a certain time to another time As shown in Tables 8 to 10, there are 90 state transition patterns (state combinations) that can take two state transitions (path A and path B) when transitioning to a predetermined state.
[0116]
[Table 8]
[Table 9]
[Table 10]
Although Tables 8 to 10 are divided into three tables for convenience, they may be combined into one table.
[0120]
Here, it is determined which path A or path B is more likely. This determination is based on the magnitude of the deviation between the ideal sample value (expected value) indicated by the path A and the actual sample value, and the deviation between the ideal sample value (expected value) indicated by the path B and the actual sample value. This can be done by comparing the size of.
[0121]
For example, state transition S0k-5 → S6kIs estimated, the state S0 is obtained at time k-5 regardless of whether the path A or the path B is transited.k-5Take S6 at time kkFrom the time k-4 to the time k, yk-4, Yk-3, Yk-2, Yk-1, YkWhether the state transition of path A or path B is more likely is determined based on the cumulative value of the square of the difference between the expected value and the expected value. If the cumulative value of the square of the difference between the expected value and the actual value in the path A is Pa, and the cumulative value of the square of the difference between the expected value and the actual value in the path B is Pb, the cumulative value Pa is The accumulated value Pb is expressed by the following formula (22).
[0122]
Here, if Pa << Pb, the possibility of the path A is estimated to be high, and if Pa >> Pb, the possibility of the path B is estimated to be high. That is, even when a code having a minimum polarity inversion interval of 2 and PR (C0, C1, C2, C1, C0) equalization is used, the reliability of the decoding result can be determined using | Pa-Pb |. it can. Further, the quality of the reproduced signal can be evaluated (error rate estimation) based on the distribution of | Pa−Pb |.
[0125]
Considering the case where white noise is superimposed on the transmission line, the state transition that can cause the most error is that the Euclidean distance between the path A and the path B becomes the minimum, and is shown in Table 11 below.18There are street state transitions.
[0126]
[Table 11]
the above18The decoding result at the time of the state transition is ck(K is an integer), and the reliability Pa-Pb in the state transitions shown in Table 11 is summarized to obtain Expression (23).
[0128]
Where AAk, BBk, CCk, DDk, EEk, FFk, GGk, HHk, IIk, JJkIs represented by the following equation.
[0130]
AAk= (Yk−0)2, BBk= (Yk-C0)2,
CCk= (Yk− (C0 + C1))2, DDk= (Yk− (C1 + C2))2,
EEk= (Yk− (C0 + C1 + C2))2, FFk= (Yk− (2 × C1 + C2))2,
GGk= (Yk− (C0 + 2 × C1 + C2))2, HHk= (Yk−2 × C0))2,
IIk= (Yk− (2 × C0 + C1))2, JJk= (Yk− (2 × C0 + 2 × C1 + C2))2
[0131]
Decryption result ckEquation (23) from | Pa−Pb | − (2 × C02+2 x C12+ C22) And a standard deviation σ and an average value Pave are obtained from the distribution. Assuming that this distribution is a normal distribution, the probability of making an error is expressed by equation (24). Therefore, the error rate of the reproduced signal can be estimated from the standard deviation σ and the average value Pave, and the signal quality can be evaluated.
[0132]
[Equation 9]
In this way, even when a recording code having a minimum polarity inversion interval of 2 is used and PR (C0, C1, C2, C1, C0) equalization is applied, a path that takes a predetermined state transition is used. The quality of the reproduction signal can be evaluated on the basis of the difference | Pa−Pb |
[0134]
(Embodiment 2)
Hereinafter, a specific example of a method for calculating the reliability of each state and the decoding reliability Pa-Pb when decoding is performed by the PRML method using the PR (1, 2, 2, 1) equalization described above. This will be described in detail.
[0135]
As described above, when PR (1, 2, 2, 1) equalization is used, a trellis diagram as shown in FIG. 4 is obtained. Here, the probability L of each state S0 to S5 at time kk S0~ Lk S5Is the certainty L of the predetermined state at time k−1 as shown below.k-1 S0~ Lk-1 S5And the actual sample value y at time kkAnd is expressed by the following equation (25). Note that the operator min [xxx, zzz] in the following expression selects the smaller one of xxx and zzz.
[0136]
In this embodiment, the probability L at time k−1.k-1Branch metric (e.g. (yk+3)2) Is always halved and yk 2Assume that / 2 is subtracted. In the PRML system, the above-mentioned Lk S0~ Lk S5Since it is only necessary to select the ones whose values are small by comparing each other,k S0~ Lk S5When applied to all the equations for obtaining, the decoding result is not affected. As a result, the probability L of each state S0 to S5 at time kk S0~ Lk S5Is represented by the following equation (26).
[0138]
When this equation (26) is expanded, the following equation (27) is obtained.
[0140]
Where Ak, Bk, Ck, Ek, Fk, GkIs defined as follows.
[0142]
Ak= 3yk+ 9/2 = (yk-th4) + (yk-th5) + (yk-th6)
Bk= 2yk+ 2 = (yk-th4) + (yk-th5)
Ck= Yk+ 1/2 = (yk-th4)
Ek= -Yk+ 1/2 = (th3-yk)
Fk= -2yk+ 2 = (th3-yk) + (th2-yk)
Gk= -3yk+ 9/2 = (th3-yk) + (th2-yk) + (th1-yk)
[0143]
It is assumed that th1 = 5/2, th2 = 3/2, th3 = 1/2, th4 = -1 / 2, th5 = -3 / 2, and th6 = -5 / 2.
[0144]
In this way Lk S0~ Lk S5Is obtained according to the above equation (27), the sample value y at time kkIs detected without calculating the square of the difference between the ideal value and the sample value.k~ GkThe probability L by simple multiplication and addition as shown ink S0~ Lk S5Can be obtained. Therefore, there is an advantage that the circuit configuration is not complicated.
[0145]
Further, as described in the first embodiment, it is possible to evaluate the signal quality by obtaining the difference | Pa−Pb | between the two possible state transition sequences (path A and path B). The calculation for obtaining Pa-Pb can also be made relatively simple without including a square calculation. Hereinafter, how to determine Pa-Pb will be described in detail.
[0146]
For example, as described in the first embodiment, when PR (1, 2, 2, 1) equalization is applied, it is desirable to obtain Pa-Pb for the path A and the path B that minimize the Euclidean distance. . That is, among the state transitions shown in Table 2, it is desirable to obtain Pa-Pb when there are eight state transitions in which Pa-Pb takes ± 10 when Pa = 0 or Pb = 0.
[0147]
For example, of the above eight state transitions, S0k-4 → S4kA case where Pa-Pb is obtained for the transition of will be described. In this case, the path A transits from S0 → S0 → S1 → S2 → S4, and the path B transits from S0 → S1 → S2 → S3 → S4. At this time, the probability Pa of path A is (yk-3+3)2/ 2 + (yk-2+2)2/ 2 + (yk-1+0)2/ 2 + (yk-1)2/ 2. The probability Pb of path B is (yk-3+2)2/ 2 + (yk-2+0)2/ 2 + (yk-1-2)2/ 2 + (yk-2)2/ 2.
[0148]
At this time, Pa-Pb is the above-mentioned A.k~ GkIt is possible to express using Specifically, Pa−Pb = (Ak-3-Bk-3) + Bk-2-Fk-1+ (Ek-Fk). Thus, according to this embodiment, Pa-Pb is the sample value y.kA obtained by simple addition and subtraction between the values and set values th1 to th6k~ GkTherefore, it is not necessary to perform a square operation or the like and can be obtained relatively easily. Therefore, there is an advantage that the circuit configuration is not complicated.
[0149]
In the above, transition S0k-4 → S4kAlthough the method for obtaining Pa-Pb for the other transitions has been described, the Pa-Pb for the other transitions is similarly described in the above Ak~ GkIt is possible to express using Examples of these are given below.
[0150]
State transition S0k-4→ S3kin the case of,
Pa-Pb = (Ak-3-Bk-3) + Bk-2-Fk-1+ (Fk-Gk)
State transition S2k-4→ S0kin the case of,
Pa-Pb = (Ek-3-Fk-3-Fk-2+ Bk-1+ (Ak-Bk)
State transition S2k-4→ S1kin the case of,
Pa-Pb = (Ek-3-Fk-3-Fk-2+ Bk-1+ (Bk-Ck)
State transition S5k-4→ S4kin the case of,
Pa-Pb = (Bk-3-Ck-3) + Bk-2-Fk-1+ (Ek-Fk)
State transition S5k-4→ S3kin the case of,
Pa-Pb = (Bk-3-Ck-3) + Bk-2-Fk-1+ (Fk-Gk)
State transition S3k-4→ S0kin the case of,
Pa-Pb = (Fk-3-Gk-3-Fk-2+ Bk-1+ (Ak-Bk)
State transition S3k-4→ S1kin the case of,
Pa-Pb = (Fk-3-Gk-3-Fk-2+ Bk-1+ (Bk-Ck)
[0151]
(Embodiment 3)
Hereinafter, an
[0152]
In the
[0153]
The
[0154]
The
[0155]
Further, the
[0156]
Hereinafter, the
[0157]
The branch metric calculated in this way is input to the addition / comparison / selection circuit 18. The probability of each state S0 to S5 (see FIG. 4) at time k is obtained from the branch metric at time k and the probability (metric value) of each state at time k-1. The probability of each state is expressed by equation (29). Note that min [xxx, zzz] is a function that selects the smaller value of xxx or zzz.
[0159]
Metric value L at time kk S0~ Lk S5Is stored in the
[0161]
The
[0163]
On the other hand, in order to evaluate the quality of the reproduction signal, the branch metric output from the branch metric calculation circuit 17 is input to the
[0164]
Note that Pa-Pb can also be obtained by a calculation method that does not include a square operation as described in the second embodiment. According to the method of the second embodiment, Pa-Pb can be obtained without using the branch metric calculated by the branch metric calculation circuit 17. Therefore, in such a case, the sample value y output from the
[0165]
The Pa-Pb value for the detected predetermined state transition calculated in this way is input to the average value /
[0166]
The
[0167]
Further, as shown in FIG. 11, a reproduction clock may be generated from the output (digital signal) of the A /
[0168]
Further, as described above, the quality of the reproduction signal can be evaluated using the standard deviation σ and the average value Pave of the distribution of Pa-Pb output from the differential
[0169]
(Embodiment 4)
Next, an optical disc apparatus according to
[0170]
In the present embodiment, the differential
[0171]
The error index MLSA output from the differential
[0172]
In addition, as shown in FIG. 14, the PRML error index MLSA generated by the differential
[0173]
In the present embodiment, the focus target value is optimized using the PRML error index MLSA. However, the present invention can also be applied to optimization of other servo target values. For example, tracking servo, disc tilt control, lens spherical aberration correction control, and the like can be performed using the PRML error index MLSA.
[0174]
Further, as shown in FIG. 15, in an optical disc apparatus having two types of optical heads, ie, a signal reproducing
[0175]
In the optical disk apparatus shown in FIG. 15, the recording operation and the reproduction operation are performed using separate heads. However, the function of one head is switched between recording and reproduction, and the above operations are executed. You may make it do. Further, although an example in which the recording power is controlled has been described above, the recording pulse width and phase may be controlled based on the PRML error index MLSA.
[0176]
【The invention's effect】
According to the reproduction signal quality evaluation method of the present invention, in the maximum likelihood decoding method for estimating the most probable state transition sequence among n state transition sequences, the state at time kj is changed to the state at time k. The probability of state transition in a predetermined period until reaching (for example, the accumulated value of the Euclidean distance in the predetermined period) is Pa, and the state from the state k at the time kj in the second most probable state transition to the state at time k is reached. When the probability of state transition in a predetermined period until (for example, the accumulated value of the Euclidean distance in the predetermined period) is Pb, the reliability of the decoding result from time kj to time k is determined by | Pa-Pb | To do. Further, by obtaining the variation of | Pa−Pb | measured for a plurality of times, an index indicating the signal quality correlated with the error rate of the binarization result of the maximum likelihood decoding is obtained.
[Brief description of the drawings]
FIG. 1 is a configuration diagram of a conventional optical disk drive.
FIG. 2 is a diagram showing the relationship between jitter and bit error rate.
FIG. 3 is a state transition diagram determined from the fact that the minimum polarity inversion interval used in the embodiment of the present invention is 2 and the restriction of PR (1, 2, 2, 1) equalization.
FIG. 4 is a trellis diagram determined from the fact that the minimum polarity inversion interval used in the embodiment of the present invention is 2 and the restriction of PR (1, 2, 2, 1) equalization.
FIG. 5 shows a state S0 in the trellis diagram used in the embodiment of the present invention.kAnd state S0k-5Diagram showing two possible state transition sequences
FIG. 6 is a schematic diagram of a distribution of Pa-Pb indicating reliability of a decoding result.
FIG. 7 is a configuration diagram of a reproduction signal quality evaluation apparatus according to a third embodiment of the present invention.
FIG. 8 is a detailed configuration diagram of a Viterbi circuit and a differential metric analyzer of the reproduction signal quality evaluation apparatus according to the third embodiment of the present invention.
FIG. 9 is a configuration diagram of a path memory of a reproduction signal quality evaluation apparatus according to a third embodiment of the present invention.
FIG. 10 is a configuration diagram of another reproduction signal quality evaluation apparatus according to the third embodiment of the present invention.
FIG. 11 is a configuration diagram of still another reproduction signal quality evaluation apparatus according to the third embodiment of the present invention.
FIG. 12 is a configuration diagram of still another reproduction signal quality evaluation apparatus according to the third embodiment of the present invention.
FIG. 13 is a configuration diagram of an optical disc device according to a fourth embodiment of the present invention.
FIG. 14 is a configuration diagram of another optical disc apparatus according to
FIG. 15 is a configuration diagram of still another optical disc device according to
FIG. 16 is a graph showing the relationship between the index MLSA and the error rate BER (Bit Error Rate);
FIG. 17 is a state transition diagram determined by the fact that the minimum polarity reversal interval used in the embodiment of the present invention is 2 and the restriction of PR (C0, C1, C0) equalization.
FIG. 18 is a trellis diagram determined from the fact that the minimum polarity inversion interval used in the embodiment of the present invention is 2 and the restrictions of PR (C0, C1, C0) equalization.
FIG. 19 is a state transition diagram determined by the fact that the minimum polarity reversal interval used in the embodiment of the present invention is 2 and the restriction of PR (C0, C1, C2, C1, C0) equalization.
FIG. 20 is a trellis diagram determined by the fact that the minimum polarity reversal interval used in the embodiment of the present invention is 2 and the restriction of PR (C0, C1, C2, C1, C0) equalization.
[Explanation of symbols]
1, 8 Optical disc
2 Optical head
3, 11 Waveform equalizer
4 Comparator
5. Phase comparator
6 LPF
7 VCO
9 Preamplifier
10, 28 AGC
12 PLL circuit
13 A / D converter
14 Digital filter
15 Viterbi circuit
16 Differential metric analyzer
17 Branch metric arithmetic circuit
18 Addition / comparison / selection circuit
19 registers
20 pass memory
21 Delay circuit
22 Difference metric calculator
23 State transition detector
24 Selector A
25 Selector B
26, 27 Average / standard deviation calculator
28 Waveform equalizer B
29 Frequency characteristic control means
Claims (17)
前記時刻k−jから時刻kまでの所定の期間jにおける前記n通りの状態遷移列を規定する前記第1状態Sk-jと前記第2状態Skとの所定の組み合わせを検出する工程と、
前記検出された前記所定の組み合わせによって規定される前記n通りの状態遷移列のうちの最も確からしい第1の状態遷移列の前記所定の期間jにおける状態遷移の確からしさを表す指標をPaとし、2番目に確からしい第2の状態遷移列の前記所定の期間jにおける状態遷移の確からしさを示す指標をPbとし、Pa=0となるときのPa−Pbの値を−Pstd、Pb=0となるときのPa−Pbの値をPstdとするとき、前記Pstdを基準に|Pa−Pb|を用いて前記時刻k−jから時刻kまでの復号結果の信頼性を判断する工程と
を包含する再生信号品質評価方法。N (n is an integer equal to or greater than 2) states that transition from the first state S kj at time k−j (k is an integer equal to or greater than 3 and j is an integer equal to or greater than 2) to the second state S k at time k A method for evaluating the quality of a decoded signal in the case of decoding a reproduction signal by a maximum likelihood decoding method that selects a most probable state transition sequence from among transition sequences,
Detecting a predetermined combination of the first state S kj and the second state S k that defines the n state transition sequences in a predetermined period j from the time k−j to the time k;
An index representing the probability of state transition in the predetermined period j of the most probable first state transition sequence among the n number of state transition sequences defined by the detected predetermined combination is Pa, An index indicating the probability of the state transition in the predetermined period j of the second most likely second state transition sequence is Pb, and the value of Pa−Pb when Pa = 0 is −Pstd, Pb = 0. And determining the reliability of the decoding result from the time k-j to the time k using | Pa-Pb | with the Pstd as a reference when the value of Pa-Pb is Pstd. Playback signal quality evaluation method.
所定の等化特性となるように前記再生信号を波形整形する波形等化器と、
前記再生信号と同期がとられた再生クロックを生成する再生クロック生成回路と、
前記再生信号を前記再生クロックでサンプリングを行なうことによってサンプリングデータを生成し、前記サンプリングデータを出力するA/D変換器と、
前記サンプリングデータから最も確からしいディジタル情報を復号する最尤検出器と、
前記最尤検出器において最も確からしいと判断された第1の状態遷移列の所定の期間における状態遷移の確からしさを表す指標をPaとし、2番目に確からしい第2の状態遷移列の前記所定の期間における状態遷移の確からしさを示す指標をPbとし、Pa=0となるときのPa−Pbの値を−Pstd、Pb=0となるときのPa−Pbの値をPstdとするとき、前記Pstdを基準に|Pa−Pb|を算出する差分メトリック解析器と
を備える情報再生装置。A gain controller for adjusting the amplitude value of the reproduction signal;
A waveform equalizer that shapes the reproduction signal so as to have a predetermined equalization characteristic;
A reproduction clock generation circuit for generating a reproduction clock synchronized with the reproduction signal;
An A / D converter that generates sampling data by sampling the reproduction signal with the reproduction clock and outputs the sampling data;
A maximum likelihood detector for decoding the most probable digital information from the sampled data;
An index indicating the probability of state transition in a predetermined period of the first state transition sequence determined to be most likely in the maximum likelihood detector is Pa, and the predetermined state of the second state transition sequence that is most likely to be second. When the index indicating the probability of state transition in the period is Pb, the value of Pa−Pb when Pa = 0 is −Pstd, and the value of Pa−Pb when Pb = 0 is Pstd , A difference metric analyzer that calculates | Pa−Pb | with respect to Pstd .
前記再生クロックは、前記追加の波形等化器によって波形整形された再生信号から生成される請求項15または16に記載の情報再生装置。An additional waveform equalizer that performs waveform shaping to have a predetermined equalization characteristic different from that of the waveform equalizer;
The information reproduction apparatus according to claim 15 or 16 , wherein the reproduction clock is generated from a reproduction signal whose waveform has been shaped by the additional waveform equalizer.
Priority Applications (1)
| Application Number | Priority Date | Filing Date | Title |
|---|---|---|---|
| JP2002196099A JP3926688B2 (en) | 2001-07-19 | 2002-07-04 | Reproduction signal quality evaluation method and information reproduction apparatus |
Applications Claiming Priority (5)
| Application Number | Priority Date | Filing Date | Title |
|---|---|---|---|
| JP2001219372 | 2001-07-19 | ||
| JP2001-219372 | 2001-07-19 | ||
| JP2001-251138 | 2001-08-22 | ||
| JP2001251138 | 2001-08-22 | ||
| JP2002196099A JP3926688B2 (en) | 2001-07-19 | 2002-07-04 | Reproduction signal quality evaluation method and information reproduction apparatus |
Publications (3)
| Publication Number | Publication Date |
|---|---|
| JP2003141823A JP2003141823A (en) | 2003-05-16 |
| JP2003141823A5 JP2003141823A5 (en) | 2005-10-13 |
| JP3926688B2 true JP3926688B2 (en) | 2007-06-06 |
Family
ID=27347189
Family Applications (1)
| Application Number | Title | Priority Date | Filing Date |
|---|---|---|---|
| JP2002196099A Expired - Lifetime JP3926688B2 (en) | 2001-07-19 | 2002-07-04 | Reproduction signal quality evaluation method and information reproduction apparatus |
Country Status (1)
| Country | Link |
|---|---|
| JP (1) | JP3926688B2 (en) |
Families Citing this family (33)
| Publication number | Priority date | Publication date | Assignee | Title |
|---|---|---|---|---|
| US7038869B2 (en) * | 2003-04-14 | 2006-05-02 | Matsushita Electric Industrial Co., Ltd. | Recording control apparatus, recording and reproduction apparatus, and recording control method |
| JP4143489B2 (en) | 2003-07-09 | 2008-09-03 | キヤノン株式会社 | Information playback device |
| JP4109173B2 (en) | 2003-09-09 | 2008-07-02 | 松下電器産業株式会社 | Adaptive equalization apparatus and adaptive equalization method |
| EP1679709A1 (en) * | 2003-10-31 | 2006-07-12 | Matsushita Electric Industrial Co., Ltd. | Recording method, recording apparatus, program and recording control apparatus |
| CN100474429C (en) | 2003-11-06 | 2009-04-01 | 松下电器产业株式会社 | Recording/reproducing apparatus, recording/reproducing method, and recording power adjustment apparatus |
| KR20070015106A (en) * | 2004-01-28 | 2007-02-01 | 마쯔시다덴기산교 가부시키가이샤 | Servo position adjustment method and servo position adjustment device |
| JP4313755B2 (en) | 2004-05-07 | 2009-08-12 | 株式会社日立製作所 | Reproduction signal evaluation method and optical disc apparatus |
| US7616544B2 (en) | 2004-12-07 | 2009-11-10 | Panasonic Corporation | Access unit, access method, computer-readable recording medium recorded with access program, and control unit |
| JP4622632B2 (en) | 2005-03-31 | 2011-02-02 | ソニー株式会社 | Maximum likelihood decoding apparatus, signal evaluation method, reproduction apparatus |
| JP4750488B2 (en) | 2005-07-08 | 2011-08-17 | ソニー株式会社 | Evaluation device, playback device, and evaluation method |
| JP2007207284A (en) * | 2006-01-30 | 2007-08-16 | Toshiba Corp | Optical disk device and tilt control method of same |
| US8004945B2 (en) | 2006-03-13 | 2011-08-23 | Panasonic Corporation | Recording medium access device |
| JP4523583B2 (en) | 2006-12-27 | 2010-08-11 | 太陽誘電株式会社 | Data recording evaluation method and optical disk recording / reproducing apparatus |
| KR20090091688A (en) | 2006-12-28 | 2009-08-28 | 파나소닉 주식회사 | Information recording medium evaluation method, information recording medium, information recording medium manufacturing method, signal processing method, and access control device |
| JP5003284B2 (en) * | 2007-05-24 | 2012-08-15 | 日本電気株式会社 | Signal quality measuring apparatus and information reproducing apparatus |
| JP4987843B2 (en) | 2007-12-28 | 2012-07-25 | パナソニック株式会社 | Phase error detection device, waveform shaping device, and optical disk device |
| JP5450376B2 (en) | 2008-02-28 | 2014-03-26 | パナソニック株式会社 | Signal evaluation method and signal evaluation apparatus |
| JP2009238301A (en) | 2008-03-27 | 2009-10-15 | Taiyo Yuden Co Ltd | Data recording evaluation method, optical disk recording and reproducing device |
| JPWO2009122642A1 (en) * | 2008-03-31 | 2011-07-28 | パナソニック株式会社 | Reproduction signal quality evaluation apparatus and method |
| RU2497205C2 (en) | 2008-07-01 | 2013-10-27 | Панасоник Корпорэйшн | Method to assess reproduction signal, device to assess reproduction signal, and device on optical disc equipped with such device of reproduction signal assessment |
| US8179760B2 (en) | 2008-10-02 | 2012-05-15 | Panasonic Corporation | Reproduction signal evaluation method, information recording medium, reproduction apparatus and recording apparatus |
| MX2010005892A (en) | 2008-10-02 | 2010-08-12 | Panasonic Corp | Reproduced signal evaluating method, information recording medium, reproducing device, and recording device. |
| WO2010089987A1 (en) | 2009-02-03 | 2010-08-12 | パナソニック株式会社 | Read-back signal evaluation method, read-back signal evaluation device, and optical disc device provided with same |
| JP4764932B2 (en) | 2009-02-03 | 2011-09-07 | 株式会社日立製作所 | Reproduction signal evaluation method and optical disc apparatus |
| JP4764939B2 (en) | 2009-04-14 | 2011-09-07 | 株式会社日立製作所 | Recording condition adjusting method and optical disc apparatus |
| JP4959749B2 (en) * | 2009-05-08 | 2012-06-27 | 株式会社日立製作所 | Recording condition adjusting method and optical disc apparatus |
| JP5469390B2 (en) | 2009-07-15 | 2014-04-16 | 日立コンシューマエレクトロニクス株式会社 | Reproduction signal evaluation method and recording adjustment method |
| JP4812881B2 (en) | 2010-01-20 | 2011-11-09 | 日立コンシューマエレクトロニクス株式会社 | Recording condition adjusting method and optical disc apparatus |
| WO2013051211A1 (en) | 2011-10-04 | 2013-04-11 | パナソニック株式会社 | Decoding method and decoding device |
| JP5309197B2 (en) * | 2011-10-21 | 2013-10-09 | 日立コンシューマエレクトロニクス株式会社 | Recording condition adjusting method and optical disc apparatus |
| JP5427903B2 (en) * | 2012-02-02 | 2014-02-26 | 日立コンシューマエレクトロニクス株式会社 | Recording condition adjusting method and optical disc apparatus |
| WO2013145747A1 (en) | 2012-03-29 | 2013-10-03 | パナソニック株式会社 | Decoding device and decoding method |
| WO2020100777A1 (en) | 2018-11-15 | 2020-05-22 | パナソニックIpマネジメント株式会社 | Optical disk device |
-
2002
- 2002-07-04 JP JP2002196099A patent/JP3926688B2/en not_active Expired - Lifetime
Also Published As
| Publication number | Publication date |
|---|---|
| JP2003141823A (en) | 2003-05-16 |
Similar Documents
| Publication | Publication Date | Title |
|---|---|---|
| JP3926688B2 (en) | Reproduction signal quality evaluation method and information reproduction apparatus | |
| US8270542B2 (en) | Method for evaluating quality of read signal and apparatus for reading information | |
| JP4750488B2 (en) | Evaluation device, playback device, and evaluation method | |
| JP5391081B2 (en) | Reproduction signal evaluation method, reproduction signal evaluation apparatus, and optical disc apparatus including the same | |
| JP5089939B2 (en) | Recording / reproducing apparatus, evaluation value calculation method | |
| JP4102738B2 (en) | Optical disk signal quality evaluation method, quality evaluation apparatus, and optical disk apparatus | |
| KR20050028822A (en) | Optical disc apparatus | |
| JP2004335079A (en) | Recording control unit, recording and reproducing device, and recording control method | |
| JP3857685B2 (en) | Signal evaluation method, information recording / reproducing apparatus, information reproducing apparatus, and information medium | |
| US6928125B2 (en) | Recording state detection system for use in a disk drive | |
| JP5441906B2 (en) | Reproduction signal evaluation method, reproduction signal evaluation apparatus, and optical disc apparatus including the same | |
| US20060015797A1 (en) | Information reproducing method and information recording reproducing apparatus with maximum likelihood decoding | |
| US7460451B2 (en) | Information-reproducing apparatus equipped with PLL circuit | |
| JP2006269045A (en) | Signal quality evaluation device, information reading/reproducing device, signal quality evaluation method, recording conditions determining method, signal quality evaluation program, computer-readable storage medium containing signal quality evaluation program | |
| JP4501960B2 (en) | Viterbi detector and information reproducing apparatus | |
| JP2005166221A (en) | Information reproducing method and apparatus | |
| JP4254800B2 (en) | Reproduction signal evaluation apparatus and method, reproduction apparatus and method, and recording apparatus and method | |
| JP3819287B2 (en) | Recording medium evaluation method, evaluation apparatus and reproducing apparatus | |
| JP2006202459A (en) | Reproducing device and recording/reproducing device | |
| JP4174408B2 (en) | Information playback device | |
| WO2009122642A1 (en) | Reproduction signal quality evaluation device and method | |
| JP4254801B2 (en) | Reproduction signal evaluation apparatus and method, reproduction apparatus and method, and recording apparatus and method | |
| JP2008262611A (en) | Decoding method, decoding device and information reproduction device | |
| JP2006302479A (en) | Method and device for recording/reproducing optical recording medium, and method and device for reproducing optical recording medium | |
| JP2004022156A (en) | Signal reproducing method and signal reproducing device |
Legal Events
| Date | Code | Title | Description |
|---|---|---|---|
| A521 | Request for written amendment filed |
Free format text: JAPANESE INTERMEDIATE CODE: A523 Effective date: 20050610 |
|
| A621 | Written request for application examination |
Free format text: JAPANESE INTERMEDIATE CODE: A621 Effective date: 20050610 |
|
| A131 | Notification of reasons for refusal |
Free format text: JAPANESE INTERMEDIATE CODE: A131 Effective date: 20061128 |
|
| A521 | Request for written amendment filed |
Free format text: JAPANESE INTERMEDIATE CODE: A523 Effective date: 20070126 |
|
| TRDD | Decision of grant or rejection written | ||
| A01 | Written decision to grant a patent or to grant a registration (utility model) |
Free format text: JAPANESE INTERMEDIATE CODE: A01 Effective date: 20070227 |
|
| A61 | First payment of annual fees (during grant procedure) |
Free format text: JAPANESE INTERMEDIATE CODE: A61 Effective date: 20070228 |
|
| R150 | Certificate of patent or registration of utility model |
Ref document number: 3926688 Country of ref document: JP Free format text: JAPANESE INTERMEDIATE CODE: R150 Free format text: JAPANESE INTERMEDIATE CODE: R150 |
|
| FPAY | Renewal fee payment (event date is renewal date of database) |
Free format text: PAYMENT UNTIL: 20110309 Year of fee payment: 4 |
|
| FPAY | Renewal fee payment (event date is renewal date of database) |
Free format text: PAYMENT UNTIL: 20110309 Year of fee payment: 4 |
|
| FPAY | Renewal fee payment (event date is renewal date of database) |
Free format text: PAYMENT UNTIL: 20120309 Year of fee payment: 5 |
|
| FPAY | Renewal fee payment (event date is renewal date of database) |
Free format text: PAYMENT UNTIL: 20130309 Year of fee payment: 6 |
|
| FPAY | Renewal fee payment (event date is renewal date of database) |
Free format text: PAYMENT UNTIL: 20130309 Year of fee payment: 6 |
|
| FPAY | Renewal fee payment (event date is renewal date of database) |
Free format text: PAYMENT UNTIL: 20140309 Year of fee payment: 7 |
|
| EXPY | Cancellation because of completion of term |