JP2013525035A - Method and apparatus for motion correction and image improvement for optical coherence tomography - Google Patents
Method and apparatus for motion correction and image improvement for optical coherence tomography Download PDFInfo
- Publication number
- JP2013525035A JP2013525035A JP2013508283A JP2013508283A JP2013525035A JP 2013525035 A JP2013525035 A JP 2013525035A JP 2013508283 A JP2013508283 A JP 2013508283A JP 2013508283 A JP2013508283 A JP 2013508283A JP 2013525035 A JP2013525035 A JP 2013525035A
- Authority
- JP
- Japan
- Prior art keywords
- data set
- data
- dimensional
- oct
- motion
- Prior art date
- Legal status (The legal status is an assumption and is not a legal conclusion. Google has not performed a legal analysis and makes no representation as to the accuracy of the status listed.)
- Granted
Links
- 230000033001 locomotion Effects 0.000 title claims abstract description 363
- 238000000034 method Methods 0.000 title claims abstract description 239
- 238000012937 correction Methods 0.000 title claims description 73
- 238000012014 optical coherence tomography Methods 0.000 title description 274
- 230000006872 improvement Effects 0.000 title description 7
- 230000009466 transformation Effects 0.000 claims abstract description 125
- 238000003384 imaging method Methods 0.000 claims abstract description 69
- 238000000844 transformation Methods 0.000 claims abstract description 37
- 230000006870 function Effects 0.000 claims description 156
- 238000005070 sampling Methods 0.000 claims description 105
- 238000006073 displacement reaction Methods 0.000 claims description 85
- 238000012545 processing Methods 0.000 claims description 81
- 238000005457 optimization Methods 0.000 claims description 79
- 238000005259 measurement Methods 0.000 claims description 61
- 238000003672 processing method Methods 0.000 claims description 61
- 230000008569 process Effects 0.000 claims description 55
- 230000000295 complement effect Effects 0.000 claims description 46
- 210000001525 retina Anatomy 0.000 claims description 27
- 238000006243 chemical reaction Methods 0.000 claims description 24
- 238000007781 pre-processing Methods 0.000 claims description 23
- 230000009467 reduction Effects 0.000 claims description 21
- 238000004364 calculation method Methods 0.000 claims description 20
- 230000010287 polarization Effects 0.000 claims description 17
- 230000008859 change Effects 0.000 claims description 16
- 238000010606 normalization Methods 0.000 claims description 14
- 210000003733 optic disk Anatomy 0.000 claims description 13
- 238000011156 evaluation Methods 0.000 claims description 12
- 210000004087 cornea Anatomy 0.000 claims description 8
- 238000013480 data collection Methods 0.000 claims description 8
- 230000036961 partial effect Effects 0.000 claims description 8
- 238000012952 Resampling Methods 0.000 claims description 7
- 230000036541 health Effects 0.000 claims description 6
- 230000001629 suppression Effects 0.000 claims description 3
- 230000001131 transforming effect Effects 0.000 claims description 3
- 239000000523 sample Substances 0.000 description 101
- 239000013598 vector Substances 0.000 description 61
- 230000000875 corresponding effect Effects 0.000 description 35
- 230000000694 effects Effects 0.000 description 32
- 230000002207 retinal effect Effects 0.000 description 23
- 230000002829 reductive effect Effects 0.000 description 21
- 230000004424 eye movement Effects 0.000 description 20
- 239000000463 material Substances 0.000 description 20
- 238000010586 diagram Methods 0.000 description 18
- 230000008901 benefit Effects 0.000 description 13
- 230000001965 increasing effect Effects 0.000 description 11
- 238000013459 approach Methods 0.000 description 9
- 238000013507 mapping Methods 0.000 description 9
- 238000011524 similarity measure Methods 0.000 description 9
- 230000003595 spectral effect Effects 0.000 description 9
- 238000012935 Averaging Methods 0.000 description 8
- 230000004434 saccadic eye movement Effects 0.000 description 8
- 230000001133 acceleration Effects 0.000 description 7
- 230000035945 sensitivity Effects 0.000 description 7
- 238000001514 detection method Methods 0.000 description 6
- 0 CCCCC(CC)CC1C(C(C)*C)C(CC)CC1 Chemical compound CCCCC(CC)CC1C(C(C)*C)C(CC)CC1 0.000 description 5
- 206010061818 Disease progression Diseases 0.000 description 5
- 230000006399 behavior Effects 0.000 description 5
- 238000003745 diagnosis Methods 0.000 description 5
- 230000005750 disease progression Effects 0.000 description 5
- 238000005516 engineering process Methods 0.000 description 5
- 230000007246 mechanism Effects 0.000 description 5
- 210000004126 nerve fiber Anatomy 0.000 description 5
- 238000009877 rendering Methods 0.000 description 5
- 230000011218 segmentation Effects 0.000 description 5
- 208000010412 Glaucoma Diseases 0.000 description 4
- 230000017531 blood circulation Effects 0.000 description 4
- 210000004204 blood vessel Anatomy 0.000 description 4
- 230000003247 decreasing effect Effects 0.000 description 4
- 238000009826 distribution Methods 0.000 description 4
- 239000000835 fiber Substances 0.000 description 4
- 230000001788 irregular Effects 0.000 description 4
- 230000003902 lesion Effects 0.000 description 4
- 230000000877 morphologic effect Effects 0.000 description 4
- 230000003287 optical effect Effects 0.000 description 4
- 230000010363 phase shift Effects 0.000 description 4
- 230000004044 response Effects 0.000 description 4
- 230000002123 temporal effect Effects 0.000 description 4
- 241001441286 Parazenidae Species 0.000 description 3
- 206010064930 age-related macular degeneration Diseases 0.000 description 3
- 230000004397 blinking Effects 0.000 description 3
- 238000001914 filtration Methods 0.000 description 3
- 210000003128 head Anatomy 0.000 description 3
- 208000002780 macular degeneration Diseases 0.000 description 3
- 230000004281 retinal morphology Effects 0.000 description 3
- 238000012876 topography Methods 0.000 description 3
- 238000013519 translation Methods 0.000 description 3
- 206010038848 Retinal detachment Diseases 0.000 description 2
- 206010044565 Tremor Diseases 0.000 description 2
- 230000002159 abnormal effect Effects 0.000 description 2
- 230000009471 action Effects 0.000 description 2
- 230000002457 bidirectional effect Effects 0.000 description 2
- 230000015556 catabolic process Effects 0.000 description 2
- 238000010276 construction Methods 0.000 description 2
- 230000002596 correlated effect Effects 0.000 description 2
- 239000013078 crystal Substances 0.000 description 2
- 238000006731 degradation reaction Methods 0.000 description 2
- 201000010099 disease Diseases 0.000 description 2
- 208000037265 diseases, disorders, signs and symptoms Diseases 0.000 description 2
- 229940079593 drug Drugs 0.000 description 2
- 239000003814 drug Substances 0.000 description 2
- 238000007876 drug discovery Methods 0.000 description 2
- 238000000605 extraction Methods 0.000 description 2
- 239000000796 flavoring agent Substances 0.000 description 2
- 235000019634 flavors Nutrition 0.000 description 2
- 230000014509 gene expression Effects 0.000 description 2
- 238000001727 in vivo Methods 0.000 description 2
- 230000000670 limiting effect Effects 0.000 description 2
- 239000012528 membrane Substances 0.000 description 2
- 238000012544 monitoring process Methods 0.000 description 2
- 238000004445 quantitative analysis Methods 0.000 description 2
- 230000004256 retinal image Effects 0.000 description 2
- 230000002441 reversible effect Effects 0.000 description 2
- 238000004611 spectroscopical analysis Methods 0.000 description 2
- 238000001228 spectrum Methods 0.000 description 2
- 210000002301 subretinal fluid Anatomy 0.000 description 2
- 238000006467 substitution reaction Methods 0.000 description 2
- 238000010408 sweeping Methods 0.000 description 2
- 230000017105 transposition Effects 0.000 description 2
- 230000000007 visual effect Effects 0.000 description 2
- PXFBZOLANLWPMH-UHFFFAOYSA-N 16-Epiaffinine Natural products C1C(C2=CC=CC=C2N2)=C2C(=O)CC2C(=CC)CN(C)C1C2CO PXFBZOLANLWPMH-UHFFFAOYSA-N 0.000 description 1
- 206010012689 Diabetic retinopathy Diseases 0.000 description 1
- 208000003098 Ganglion Cysts Diseases 0.000 description 1
- 241001465754 Metazoa Species 0.000 description 1
- XUIMIQQOPSSXEZ-UHFFFAOYSA-N Silicon Chemical compound [Si] XUIMIQQOPSSXEZ-UHFFFAOYSA-N 0.000 description 1
- 208000005400 Synovial Cyst Diseases 0.000 description 1
- 230000006978 adaptation Effects 0.000 description 1
- 230000002730 additional effect Effects 0.000 description 1
- 238000010171 animal model Methods 0.000 description 1
- 238000010009 beating Methods 0.000 description 1
- 239000012472 biological sample Substances 0.000 description 1
- 210000004027 cell Anatomy 0.000 description 1
- 210000002987 choroid plexus Anatomy 0.000 description 1
- 239000002131 composite material Substances 0.000 description 1
- 230000006835 compression Effects 0.000 description 1
- 238000007906 compression Methods 0.000 description 1
- 238000002939 conjugate gradient method Methods 0.000 description 1
- 230000008878 coupling Effects 0.000 description 1
- 238000010168 coupling process Methods 0.000 description 1
- 238000005859 coupling reaction Methods 0.000 description 1
- 238000005520 cutting process Methods 0.000 description 1
- 238000013075 data extraction Methods 0.000 description 1
- 238000013506 data mapping Methods 0.000 description 1
- 230000007423 decrease Effects 0.000 description 1
- 230000001419 dependent effect Effects 0.000 description 1
- 238000011161 development Methods 0.000 description 1
- 230000018109 developmental process Effects 0.000 description 1
- 206010012601 diabetes mellitus Diseases 0.000 description 1
- 238000002059 diagnostic imaging Methods 0.000 description 1
- 238000002405 diagnostic procedure Methods 0.000 description 1
- 238000009792 diffusion process Methods 0.000 description 1
- 239000006185 dispersion Substances 0.000 description 1
- 230000002708 enhancing effect Effects 0.000 description 1
- 208000030533 eye disease Diseases 0.000 description 1
- 230000000193 eyeblink Effects 0.000 description 1
- 238000007667 floating Methods 0.000 description 1
- 239000003102 growth factor Substances 0.000 description 1
- 238000007689 inspection Methods 0.000 description 1
- 230000004410 intraocular pressure Effects 0.000 description 1
- 238000007726 management method Methods 0.000 description 1
- 239000011159 matrix material Substances 0.000 description 1
- 238000000691 measurement method Methods 0.000 description 1
- 238000000386 microscopy Methods 0.000 description 1
- 238000012986 modification Methods 0.000 description 1
- 230000004048 modification Effects 0.000 description 1
- 238000007491 morphometric analysis Methods 0.000 description 1
- 230000003562 morphometric effect Effects 0.000 description 1
- 238000013425 morphometry Methods 0.000 description 1
- 210000002445 nipple Anatomy 0.000 description 1
- 230000008520 organization Effects 0.000 description 1
- 230000035515 penetration Effects 0.000 description 1
- 238000012805 post-processing Methods 0.000 description 1
- 230000010349 pulsation Effects 0.000 description 1
- 210000001747 pupil Anatomy 0.000 description 1
- 238000011158 quantitative evaluation Methods 0.000 description 1
- 238000011160 research Methods 0.000 description 1
- 230000029058 respiratory gaseous exchange Effects 0.000 description 1
- 238000010845 search algorithm Methods 0.000 description 1
- 229910052710 silicon Inorganic materials 0.000 description 1
- 239000010703 silicon Substances 0.000 description 1
- NTHWMYGWWRZVTN-UHFFFAOYSA-N sodium silicate Chemical compound [Na+].[Na+].[O-][Si]([O-])=O NTHWMYGWWRZVTN-UHFFFAOYSA-N 0.000 description 1
- 238000010561 standard procedure Methods 0.000 description 1
- 238000003860 storage Methods 0.000 description 1
- 238000000547 structure data Methods 0.000 description 1
- 238000001356 surgical procedure Methods 0.000 description 1
- 230000002195 synergetic effect Effects 0.000 description 1
- 238000012360 testing method Methods 0.000 description 1
Images


Classifications
-
- G—PHYSICS
- G06—COMPUTING; CALCULATING OR COUNTING
- G06T—IMAGE DATA PROCESSING OR GENERATION, IN GENERAL
- G06T11/00—2D [Two Dimensional] image generation
- G06T11/003—Reconstruction from projections, e.g. tomography
- G06T11/006—Inverse problem, transformation from projection-space into object-space, e.g. transform methods, back-projection, algebraic methods
-
- A—HUMAN NECESSITIES
- A61—MEDICAL OR VETERINARY SCIENCE; HYGIENE
- A61B—DIAGNOSIS; SURGERY; IDENTIFICATION
- A61B3/00—Apparatus for testing the eyes; Instruments for examining the eyes
- A61B3/10—Objective types, i.e. instruments for examining the eyes independent of the patients' perceptions or reactions
- A61B3/102—Objective types, i.e. instruments for examining the eyes independent of the patients' perceptions or reactions for optical coherence tomography [OCT]
-
- A—HUMAN NECESSITIES
- A61—MEDICAL OR VETERINARY SCIENCE; HYGIENE
- A61B—DIAGNOSIS; SURGERY; IDENTIFICATION
- A61B3/00—Apparatus for testing the eyes; Instruments for examining the eyes
- A61B3/0016—Operational features thereof
- A61B3/0025—Operational features thereof characterised by electronic signal processing, e.g. eye models
-
- G—PHYSICS
- G06—COMPUTING; CALCULATING OR COUNTING
- G06T—IMAGE DATA PROCESSING OR GENERATION, IN GENERAL
- G06T7/00—Image analysis
- G06T7/20—Analysis of motion
- G06T7/246—Analysis of motion using feature-based methods, e.g. the tracking of corners or segments
- G06T7/248—Analysis of motion using feature-based methods, e.g. the tracking of corners or segments involving reference images or patches
-
- G—PHYSICS
- G06—COMPUTING; CALCULATING OR COUNTING
- G06T—IMAGE DATA PROCESSING OR GENERATION, IN GENERAL
- G06T7/00—Image analysis
- G06T7/30—Determination of transform parameters for the alignment of images, i.e. image registration
-
- G—PHYSICS
- G06—COMPUTING; CALCULATING OR COUNTING
- G06T—IMAGE DATA PROCESSING OR GENERATION, IN GENERAL
- G06T2207/00—Indexing scheme for image analysis or image enhancement
- G06T2207/10—Image acquisition modality
- G06T2207/10072—Tomographic images
- G06T2207/10101—Optical tomography; Optical coherence tomography [OCT]
-
- G—PHYSICS
- G06—COMPUTING; CALCULATING OR COUNTING
- G06T—IMAGE DATA PROCESSING OR GENERATION, IN GENERAL
- G06T2207/00—Indexing scheme for image analysis or image enhancement
- G06T2207/30—Subject of image; Context of image processing
- G06T2207/30004—Biomedical image processing
- G06T2207/30041—Eye; Retina; Ophthalmic
Landscapes
- Engineering & Computer Science (AREA)
- Health & Medical Sciences (AREA)
- Life Sciences & Earth Sciences (AREA)
- Physics & Mathematics (AREA)
- Theoretical Computer Science (AREA)
- General Physics & Mathematics (AREA)
- General Health & Medical Sciences (AREA)
- Ophthalmology & Optometry (AREA)
- Biomedical Technology (AREA)
- Heart & Thoracic Surgery (AREA)
- Medical Informatics (AREA)
- Molecular Biology (AREA)
- Surgery (AREA)
- Animal Behavior & Ethology (AREA)
- Biophysics (AREA)
- Public Health (AREA)
- Veterinary Medicine (AREA)
- Computer Vision & Pattern Recognition (AREA)
- Radiology & Medical Imaging (AREA)
- Nuclear Medicine, Radiotherapy & Molecular Imaging (AREA)
- Algebra (AREA)
- Mathematical Analysis (AREA)
- Mathematical Optimization (AREA)
- Mathematical Physics (AREA)
- Pure & Applied Mathematics (AREA)
- Signal Processing (AREA)
- Multimedia (AREA)
- Eye Examination Apparatus (AREA)
- Investigating Or Analysing Materials By Optical Means (AREA)
Abstract
【課題】ヒトの目のOCT走査などのオブジェクトの画像は、オブジェクトと画像取得装置との相対的な動きに起因する歪みやデータギャップを含み得る。そのような歪みおよびデータギャップを補正する方法およびシステムを提供する。
【解決手段】動き補正済データは、撮像されたオブジェクトの少なくとも部分的に重なる領域を表す入力3次元データセットに、3次元変換を適用することによって達成される。これらの3次元変換は、変換された3次元データセットと撮像器具に対するオブジェクトの推定された動きとの間の類似の度合いを計算する目的関数に基づき、計算される。
【選択図】図13An image of an object, such as an OCT scan of a human eye, may include distortions and data gaps due to relative movement between the object and an image acquisition device. Methods and systems for correcting such distortions and data gaps are provided.
Motion-corrected data is achieved by applying a three-dimensional transformation to an input three-dimensional data set that represents an area that at least partially overlaps the imaged object. These three-dimensional transformations are calculated based on an objective function that calculates the degree of similarity between the transformed three-dimensional data set and the estimated motion of the object relative to the imaging device.
[Selection] Figure 13
Description
[政府支援]
本発明は、全体的または部分的に、NIHからの助成金R01−EY011289−24およびR01−CA075289−13、空軍科学研究局からの契約FA9550−07−1−0101およびFA9550−07−1−0014の支援を受けている。米国政府は本発明の一定の権利を有する。
[Government support]
The present invention, in whole or in part, includes grants R01-EY011289-24 and R01-CA075289-13 from NIH, contracts FA9550-07-1-0101 and FA9550-07-1-0014 from the Air Force Scientific Research Office. Is receiving support. The United States government has certain rights in this invention.
本出願は、2010年4月29日に出願された米国仮出願第61/329,347号の利益を請求する。上記出願の全ての教示は、参照により本明細書に援用したものとする。 This application claims the benefit of US Provisional Application No. 61 / 329,347, filed April 29, 2010. All the teachings of the above application are incorporated herein by reference.
本発明は、光コヒーレンストモグラフィのための動き補正および画像改善に関する。 The present invention relates to motion correction and image improvement for optical coherence tomography.
光コヒーレンストモグラフィ(OCT)とは、オブジェクト材料または生物組織(例えばヒトの目)の内部からの後方散乱または後方反射された光のエコー時間遅延および大きさを測定することにより、断面画像および体積データ(ボリュメトリックデータ)セットを得るものである。オブジェクトとデータ収集装置との相対的な動きは、収集された画像に歪みおよび誤差を引き起こす。 Optical coherence tomography (OCT) refers to cross-sectional images and volumes by measuring the echo time delay and magnitude of backscattered or back-reflected light from the interior of object material or biological tissue (eg, the human eye). A data (volumetric data) set is obtained. The relative movement of the object and the data collection device causes distortion and errors in the collected image.
本発明の一例示の実施形態は、データセットを処理する方法である。本方法は、目的関数の値に基づいて1つ以上の3次元変換を計算することであって、各3次元変換はそれぞれの3次元データセットと関連付けられており、上記3次元データセットはオブジェクト(対象)の少なくとも部分的に重なる領域を表しており、上記計算することは、上記目的関数を評価することを含む。本実施形態において、上記目的関数は、(a)(i)変換後の状態における2つ以上の3次元データセット間、または(ii)該変換後の状態における2つ以上の前処理された3次元データセット間の類似度を算出すること、および(b)撮像器具に対する上記オブジェクトの動きを推定することによって評価される。上記方法はさらに、少なくとも1つの3次元変換を、そのそれぞれの3次元データセットに、または該それぞれの3次元データセットに対応する導関数3次元データセット(3次元微分データセット)に適用して、少なくとも1つの動き補正済データセットを得ることを含む。 One exemplary embodiment of the present invention is a method for processing a data set. The method is to calculate one or more three-dimensional transformations based on the value of the objective function, each three-dimensional transformation being associated with a respective three-dimensional data set, said three-dimensional data set being an object Represents an area of at least a partial overlap of (object), and the calculating includes evaluating the objective function. In this embodiment, the objective function is (a) (i) between two or more three-dimensional data sets in the transformed state, or (ii) two or more preprocessed 3 in the transformed state. It is evaluated by calculating the similarity between the dimensional data sets and (b) estimating the motion of the object relative to the imaging device. The method further applies at least one three-dimensional transformation to its respective three-dimensional data set or to a derivative three-dimensional data set (three-dimensional differential data set) corresponding to the respective three-dimensional data set. Obtaining at least one motion-corrected data set.
本発明の他の例示の実施形態は、データセットを処理するためのシステムであって、目的関数の値に基づいて1つ以上の3次元変換を計算するように構成された計算モジュールであって、各3次元変換はそれぞれ3次元データセットに関連付けられており、上記3次元データセットはオブジェクトの少なくとも部分的に重なる領域を表しており、上記計算することは、上記目的関数を評価することを含む。本実施形態において、上記目的関数は、(a)(i)変換後の状態における2つ以上の3次元データセット間、または(ii)該変換後の状態における2つ以上の前処理された3次元データセット間の類似度を算出すること、および(b)撮像器具に対する上記オブジェクトの動きを推定することによって評価される。上記システムはさらに、少なくとも1つの3次元変換を、そのそれぞれの3次元データセットに、または該それぞれの3次元データセットに対応する導関数3次元データセットに適用して、少なくとも1つの動き補正済データセットを得るように構成された動き補正モジュールを含む。 Another exemplary embodiment of the present invention is a system for processing a data set, a calculation module configured to calculate one or more three-dimensional transforms based on the value of an objective function. , Each three-dimensional transformation is associated with a three-dimensional data set, said three-dimensional data set representing at least partly overlapping areas of the object, and said calculating means evaluating said objective function Including. In this embodiment, the objective function is (a) (i) between two or more three-dimensional data sets in the transformed state, or (ii) two or more preprocessed 3 in the transformed state. It is evaluated by calculating the similarity between the dimensional data sets and (b) estimating the motion of the object relative to the imaging device. The system further applies at least one three-dimensional transform to its respective three-dimensional data set or to a derivative three-dimensional data set corresponding to the respective three-dimensional data set to provide at least one motion corrected A motion compensation module configured to obtain the data set is included.
本発明の他の例示の実施形態は、一連の命令を記録した非一時的コンピュータ読み取り可能媒体であって、該命令はプロセッサによって実行されるときに、該プロセッサに、目的関数の値に基づいて1つ以上の3次元変換を計算させることであって、各3次元変換はそれぞれの3次元データセットに関連付けられており、上記3次元データセットはオブジェクトの少なくとも部分的に重なる領域を表しており、上記プロセッサに上記1つ以上の3次元変換を計算させる上記命令は、上記プロセッサに上記目的関数を評価させる命令を含む。本実施形態において、上記目的関数は、(a)(i)変換後の状態における2つ以上の3次元データセット間、または(ii)該変換後の状態における2つ以上の前処理された3次元データセット間の類似度を算出すること、および(b)撮像器具に対する上記オブジェクトの動きを推定することによって評価される。上記一連の命令は、プロセッサによって実行されるときに、該プロセッサにさらに、少なくとも1つの3次元変換を、上記それぞれの3次元データセットまたは導関数3次元データセットに適用して、少なくとも1つの動き補正済データセットを取得する。 Another exemplary embodiment of the present invention is a non-transitory computer readable medium having a series of instructions recorded thereon, the instructions being executed by the processor based on the value of the objective function. Calculating one or more three-dimensional transformations, each three-dimensional transformation being associated with a respective three-dimensional data set, said three-dimensional data set representing an at least partly overlapping region of objects The instructions that cause the processor to calculate the one or more three-dimensional transforms include instructions that cause the processor to evaluate the objective function. In this embodiment, the objective function is (a) (i) between two or more three-dimensional data sets in the transformed state, or (ii) two or more preprocessed 3 in the transformed state. It is evaluated by calculating the similarity between the dimensional data sets and (b) estimating the motion of the object relative to the imaging device. When the series of instructions is executed by a processor, the processor further applies at least one three-dimensional transformation to the respective three-dimensional data set or derivative three-dimensional data set to at least one motion. Obtain a corrected data set.
本発明のさらなる他の実施形態は、OCTデータセットを処理する方法であって、オブジェクトの少なくとも部分的に重なる領域を表す2つ以上の3次元OCTデータセットを収集することであって、少なくとも1つのデータセットが、少なくとも1つの他のデータセットの走査パターンに対して相補的な走査パターンを使用して収集される、収集することと、目的関数を使用して各データセットのための3次元変換を計算することとを含む。本実施形態において、上記目的関数は、(a)変換後の状態における上記3次元データセット間の計算された類似度にフェイバを与え(類似の度合いを優位にし)、(b)撮像器具に対する上記オブジェクトの動きにペナルティを与える(罰則を付ける)。上記方法はさらに、少なくとも1つの3次元変換をそのそれぞれのデータセットに適用して、少なくとも1つの動き補正済データセットを取得することを含む。 Yet another embodiment of the invention is a method of processing an OCT data set, collecting two or more three-dimensional OCT data sets representing at least partially overlapping regions of an object, comprising at least one One data set is collected using a scan pattern complementary to the scan pattern of at least one other data set, and a three-dimensional for each data set using an objective function Calculating the transformation. In the present embodiment, the objective function gives (a) a favour to the calculated similarity between the three-dimensional data sets in the transformed state (makes similarity similar), and (b) the above for the imaging device Penalize the movement of objects. The method further includes applying at least one three-dimensional transform to the respective data set to obtain at least one motion corrected data set.
前述の説明は、添付の図面にて示したように、本発明の例示の実施形態についての以下のより詳細な説明から明らかとなるであろう。添付の図面では、同一の参照符号は、異なる図面を通して同一の部分を指すものとする。図面は必ずしも正しい縮尺ではなく、本発明の実施形態を説明するために強調されている。 The foregoing description will become apparent from the following more detailed description of exemplary embodiments of the invention, as illustrated in the accompanying drawings. In the accompanying drawings, the same reference numerals refer to the same parts throughout the different drawings. The drawings are not necessarily to scale, emphasis instead being placed upon illustrating embodiments of the invention.
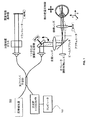
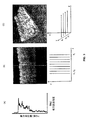
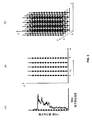
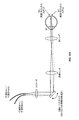
光コヒーレンストモグラフィ(OCT)は、オブジェクト材料または生物組織の内部から後方散乱または後方反射された光のエコー時間遅延および大きさを測定することによって、断面画像および体積データセット(ボリュメトリックデータセット)を得る。眼科用OCT撮像装置の例を図1および図2に示す。深さに対する構造についての、軸方向走査すなわちA走査の情報は、オブジェクト材料上または組織上に光ビームを方向付けることと、後方散乱または後方反射された光のエコー時間遅延を測定することとによって測定できる。図3(A)は、軸方向走査信号の一例を示す。図3(A)において、軸方向走査は、z方向の信号対深さ情報を測定する。 Optical coherence tomography (OCT) is a cross-sectional image and volumetric data set (volumetric data set) by measuring the echo time delay and magnitude of light backscattered or reflected back from inside an object material or biological tissue. Get. An example of an ophthalmic OCT imaging apparatus is shown in FIGS. Axial or A-scan information about the structure to depth is obtained by directing the light beam over the object material or tissue and by measuring the echo time delay of the backscattered or backreflected light. It can be measured. FIG. 3A shows an example of the axial scanning signal. In FIG. 3A, the axial scan measures signal vs. depth information in the z direction.
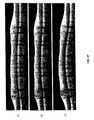
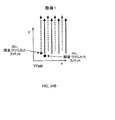
断面画像またはB走査は、オブジェクト材料または組織に対して光ビームを横断方向に走査し、連続して軸方向走査(A走査)測定を行なうことにより生成できる。図3(B)は、横断方向であるx方向にビームを走査し、連続して位置x1、x2などで軸方向走査測定を行った、2次元のOCT走査像の例である。これにより、オブジェクト材料または組織のx−z平面における後方散乱または後方反射を表す2次元アレイが生成される。この2次元の情報は、擬似色またはグレースケール画像として表示できる。 Cross-sectional images or B-scans can be generated by scanning a beam of light across an object material or tissue in a transverse direction and performing continuous axial scan (A-scan) measurements. FIG. 3B is an example of a two-dimensional OCT scan image in which a beam is scanned in the x direction, which is the transverse direction, and axial scan measurement is continuously performed at positions x1, x2, and the like. This creates a two-dimensional array that represents backscatter or backreflection in the xz plane of the object material or tissue. This two-dimensional information can be displayed as a pseudo color or gray scale image.
ボリュメトリック(すなわち3次元の)3D OCTすなわち3次元OCTのデータセットは、例えばラスタタイプの走査パターンを使用して異なる横断面の連続した横断方向(横方向)のB走査を行うことによって、生成できる。図3(C)は、y方向y1、y2、などの位置のずれた異なる位置で行われたx方向(B走査)に沿った一連の横断方向の走査から生成された、3D OCTボリュメトリックデータセットの一例を示す。この例は、ラスタ走査パターンの一連の横断方向の走査によって収集された3次元データセットを示す。 Volumetric (ie 3D) 3D OCT or 3D OCT data sets are generated, for example, by performing successive transverse (lateral) B-scans of different cross sections using a raster-type scan pattern it can. FIG. 3C shows 3D OCT volumetric data generated from a series of transverse scans along the x-direction (B-scan) performed at different positions shifted in the y-direction y1, y2, etc. An example of a set is shown. This example shows a three-dimensional data set collected by a series of transverse scans of a raster scan pattern.
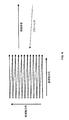
図4は、低速方向および高速方向を有する典型的走査パターンの例を示す。しかし、3D OCTボリュメトリックデータを得るためには、多くの他の走査パターンおよび方法があることは言うまでもない。一般に、3次元OCTデータセットは、A走査データを記録しながらオブジェクト上にビームを掃引することによって、生成される。ビームは、走査パターンによって定義される軌道に従って掃引される。走査パターンは、A走査データが連続的に記録される各時点において、撮像オブジェクトの各位置にビーム位置付ける。通常、OCTデータセットは、図5(A)〜5(C)に示すように、1D、2Dまたは3Dのデータセット内の個々のピクセルまたはボクセルから構成される。図5(A)は、軸上の位置の関数として後方散乱強度をプロットしたものであり、z方向に沿った1次元の軸方向データを表す。図5(B)は、軸方向(Z)および横断方向(X)を有する2次元のデータセットの概略図であり、位置xiの各アレイは、1つのA走査を表す。図5(C)は、軸方向(Z)と2つの横断方向(XおよびY)を有する、3次元データセットの概略図である。3次元データセットの要素は、従来よりボクセルと称される。 FIG. 4 shows an example of a typical scan pattern having a slow direction and a fast direction. However, it will be appreciated that there are many other scan patterns and methods for obtaining 3D OCT volumetric data. In general, a three-dimensional OCT data set is generated by sweeping a beam over an object while recording A-scan data. The beam is swept according to a trajectory defined by the scanning pattern. The scanning pattern positions the beam at each position of the imaging object at each time point when the A-scan data is continuously recorded. Typically, an OCT data set is composed of individual pixels or voxels in a 1D, 2D or 3D data set, as shown in FIGS. 5 (A) -5 (C). FIG. 5A is a plot of backscatter intensity as a function of position on the axis and represents one-dimensional axial data along the z direction. FIG. 5 (B) is a schematic view in the axial direction (Z) and two-dimensional data set having a transverse (X), each array location x i represents one A scan. FIG. 5C is a schematic diagram of a three-dimensional data set having an axial direction (Z) and two transverse directions (X and Y). Elements of a three-dimensional data set are conventionally referred to as voxels.
さらに、OCTについての当業者は、一般に、OCTデータセットが、振幅、強度、位相、偏光、分光情報およびドップラーシフトなどの複数のデータチャネルを含み得ることがわかるであろう。3次元データセットは、これらのデータチャネルからのデータ値を、3次元OCT装置または器具座標系における位置に関連付ける。 Further, those skilled in the art of OCT will generally appreciate that an OCT data set may include multiple data channels such as amplitude, intensity, phase, polarization, spectral information, and Doppler shift. A three-dimensional data set associates data values from these data channels with positions in a three-dimensional OCT apparatus or instrument coordinate system.
<OCTの具体例>
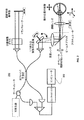
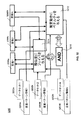
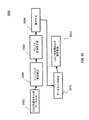
OCTは、以下の1)〜3)を含む具体例を使用して行うことができる:1)広帯域光源および走査用光学参照遅延ラインを有する干渉計(時間領域検出として公知である)、2)広帯域光源および信号検出用分光計(フーリエ/スペクトル領域OCT、スペクトルレーダーなどの名称で知られている)を有する干渉計、または、3)周波数掃引光源を有する干渉計(波長掃引型/フーリエ領域OCT、光学周波数領域イメージングなどの名称で知られている)。図1は、コンピュータ102を含む、例示のスペクトル/フーリエ領域OCT撮像装置100を示す。図2は、コンピュータ202を含む、例示の波長掃引型/フーリエ領域撮像装置200を示す。これらのフーリエ領域検出の具体例は、極めて高速な収集速度という効果を有し、3D OCTボリュメトリック撮像に好適である。
<Specific examples of OCT>
OCT can be performed using specific examples including 1) to 3) below: 1) Interferometer with broadband light source and scanning optical reference delay line (known as time domain detection), 2) An interferometer with a broadband light source and a signal detection spectrometer (known as Fourier / spectral domain OCT, spectral radar, etc.), or 3) an interferometer with a frequency swept source (wavelength swept / Fourier domain OCT) , Known by names such as optical frequency domain imaging). FIG. 1 shows an exemplary spectral / Fourier domain
<OCT撮像における動きの影響>
3D OCT画像またはボリュメトリックデータセットは、単一の時点で収集されず、横断方向の走査パターンにおいて行われる複数のA走査を連続して収集することで構成される。各A走査は異なる時間に順次収集され、単一または複数の連続的な収集の間には、OCT走査装置とオブジェクトとの相対的な動きが起こり得る。
<Influence of motion in OCT imaging>
A 3D OCT image or volumetric data set is not acquired at a single point in time but is constructed by continuously acquiring multiple A scans performed in a transverse scan pattern. Each A-scan is collected sequentially at different times, and relative movement between the OCT scanner and the object can occur during single or multiple successive acquisitions.
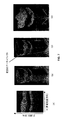
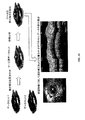
図6(A)および図6(B)は、OCT走査パターン(図6(A))が目の動き(図6(B))によって影響を受ける、目の網膜のOCT撮像の一例を示す。図6(A)は、3次元データセット(zが固定値であるXY−平面)の2次元のサブセットを示す。この図6(A)では、スキャナがデータを収集した点をスキャナ座標において概略的に重畳している。図6(B)は、ヒトの網膜のOCT画像である。図6(B)には、スキャナがデータを収集した点をオブジェクト座標において概略的に重畳している。この図から明らかなように、動きによって、撮像中のオブジェクト上のOCTビーム位置が、OCT走査装置で決められた所望のビーム位置からずれている。この動きは、x−y平面におけるビームの横断方向の位置に影響を及ぼす。さらに、動きは、軸方向すなわちz方向にも起こり得る。ヒトの目のOCT撮像(眼科用OCT)は、OCT技術の主な臨床応用である。眼科用OCTにおいて、軸方向の動きは、眼内圧の変動を生じさせる鼓動(心拍)の結果として起こり得る。横断方向の動きは、患者の凝視の方向の変化からくる、目の震え、ドリフトまたはサッケード(急速な動き)から生じ得る。動きはまた、収集中に起こる被験者(患者)の頭部や身体の動きに起因して、X、YおよびZ方向にも起こり得る。 FIGS. 6A and 6B show an example of OCT imaging of the retina of an eye, where the OCT scan pattern (FIG. 6A) is affected by eye movement (FIG. 6B). FIG. 6A shows a two-dimensional subset of a three-dimensional data set (XY-plane where z is a fixed value). In FIG. 6A, the points at which the scanner has collected data are roughly superimposed on the scanner coordinates. FIG. 6B is an OCT image of the human retina. In FIG. 6B, the points at which the scanner collects data are roughly superimposed on the object coordinates. As is apparent from this figure, the OCT beam position on the object being imaged is shifted from the desired beam position determined by the OCT scanning device due to the movement. This movement affects the transverse position of the beam in the xy plane. Furthermore, movement can also occur in the axial or z-direction. OCT imaging of the human eye (Ophthalmic OCT) is the main clinical application of OCT technology. In ophthalmic OCT, axial movement can occur as a result of a beating (beat) that causes variations in intraocular pressure. Transverse movements can result from eye tremors, drifts or saccades (rapid movements) resulting from changes in the direction of the patient's gaze. Movement can also occur in the X, Y, and Z directions due to subject or patient head or body movements occurring during collection.
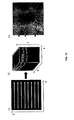
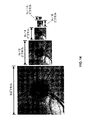
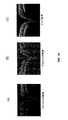
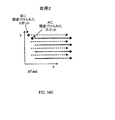
図7(A)〜図7(D)は、3D OCTボリュメトリックデータセットにおけるトポグラフィの歪みとして見られる軸方向の目の動きの影響を示す。図7(A)は、OCT装置によって収集したx方向に沿った単一の断面を示す。図7(B)は、3次元XFASTデータセットがどのようにこれら複数のx方向断面から構成され得るかを示す。図7(C)は、データセットの立方体の外側平面を示す。この図は、y方向に沿って見える軸方向の動きがあることを示す。図7(D)は、上記データセットの3D描写である。 FIGS. 7A-7D illustrate the effect of axial eye movement seen as topographic distortion in the 3D OCT volumetric data set. FIG. 7A shows a single cross section along the x-direction collected by the OCT apparatus. FIG. 7B shows how a three-dimensional XFAST data set can be constructed from these multiple x-direction cross sections. FIG. 7C shows the outer plane of the cube of the data set. This figure shows that there is an axial movement visible along the y direction. FIG. 7D is a 3D depiction of the data set.
図7(A)から図7(D)に示す例は、図6(A)および図6(B)に示した走査パターンを使用して、x方向の高速走査によって収集したボリュメトリックOCTデータセットを示す。断面画像は、3D OCTボリュメトリックデータセットから抽出してもよい。高速走査の方向に対応するx方向に沿って抽出した断面画像は、動きのアーティファクトが最小限であり、より正確に網膜構造およびトポグラフィを表す。対照的に、y方向に沿って抽出した断面画像は、軸方向のかなりの動きのアーティファクトを有する。網膜像が波を打ったように見えるのは、網膜の真の輪郭を表しているのではなく、軸方向の動きによる歪みのアーティファクトである。このようなことが起こるのは、この走査パターンが使われるときに、y方向に沿った軸方向走査はx方向におけるよりも大きい時間間隔で収集されるからである。この例では、x方向は、隣接したA走査間の時間間隔がより小さいラスタ走査の方向に沿っている。この方向は、高速方向または高速軸と称される。y方向は、x方向に対して垂直であり、隣接したA走査間の時間間隔がより大きいため、低速方向と称される。一般に、軸方向の動きは、軸方向走査が時間間隔をあけられる方向に沿ってボリュメトリックデータセットから抽出される断面OCT画像においてトポグラフィを歪ませて歪みを生成することによって、3D OCTボリュメトリックデータセットの完全性を損なう。 The example shown in FIGS. 7A to 7D is a volumetric OCT data set acquired by high-speed scanning in the x direction using the scanning patterns shown in FIGS. 6A and 6B. Indicates. Cross-sectional images may be extracted from the 3D OCT volumetric data set. Cross-sectional images extracted along the x-direction corresponding to the fast scan direction have minimal motion artifacts and more accurately represent retinal structure and topography. In contrast, cross-sectional images extracted along the y direction have significant axial motion artifacts. What the retinal image appears to wave is not a true outline of the retina, but is an artifact of distortion due to axial movement. This occurs because when this scan pattern is used, axial scans along the y direction are collected at larger time intervals than in the x direction. In this example, the x direction is along the direction of raster scanning where the time interval between adjacent A scans is smaller. This direction is referred to as the high speed direction or the high speed axis. The y direction is perpendicular to the x direction and is referred to as the slow direction because the time interval between adjacent A scans is larger. In general, axial motion is generated by distorting the topography in a cross-sectional OCT image extracted from the volumetric data set along the direction in which the axial scan is spaced apart, thereby generating 3D OCT volumetric data. Impairs the integrity of the set.
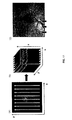
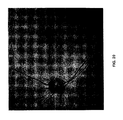
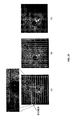
軸方向の動きとともに、横断方向の動きは一般にデータ収集中に起こる。図8(A)および図8(B)は、横断方向の動きの影響を示す。図8(A)は、3D OCTボリュメトリックデータセット内のピクセルを軸方向に合計(A走査に沿って合計)することによって得られた、ヒトの目の画像である。この画像は、アンファス画像(en face画像:3次元データを前方から俯瞰した画像)、OCT眼底画像または合計ボクセル投影と称される。軸方向のOCT強度信号を合計する処理は、本質的には、後方散乱または後方反射された光の全てを収集し、網膜の写真に類似した画像を生成する。図8(A)のアンファス画像は、被験者が凝視の方向を変えた場合における、サッケードとして知られる急速な横断方向の目の動きの影響を示す。図8(A)の矢印によって示されるように、これらの急速な横断方向の動きはアンファスOCT眼底画像における不連続として見てとれる。これが生じるのは、OCT器具の走査座標系によって定められるOCTビームの予期される横断方向の位置と、オブジェクトまたは網膜の座標系によって定められる網膜の真の位置とに差があるからである。この影響を図8(B)に示す。図8(B)では、3D OCTボリュメトリックデータセットから得られるアンファスOCT眼底画像の複数の部分が、オブジェクトまたは網膜の座標系における網膜の真の位置に位置合わせされている。サッケードによって生じた急速な横断方向の目の動きにより、OCTビームが網膜の重なる領域を走査したり、網膜のいくつかの領域を走査し損なったりすることがあり得、そのため、未走査の領域すなわちデータセット内のギャップを生じてしまう。 Along with axial movement, transverse movement generally occurs during data collection. 8A and 8B show the effect of transverse movement. FIG. 8A is an image of the human eye obtained by summing the pixels in the 3D OCT volumetric data set in the axial direction (summing along the A scan). This image is referred to as an unfaced image (en face image: an image obtained by looking down on three-dimensional data from the front), an OCT fundus image, or a total voxel projection. The process of summing the axial OCT intensity signals essentially collects all of the backscattered or backreflected light and produces an image similar to a photograph of the retina. The ampus image in FIG. 8A shows the effect of rapid transverse eye movement, known as saccade, when the subject changes his gaze direction. As shown by the arrows in FIG. 8A, these rapid transverse movements can be seen as discontinuities in the Amphas OCT fundus image. This occurs because there is a difference between the expected transverse position of the OCT beam defined by the scanning coordinate system of the OCT instrument and the true position of the retina as defined by the object or retina coordinate system. This effect is shown in FIG. In FIG. 8B, multiple portions of the ampus OCT fundus image obtained from the 3D OCT volumetric data set are aligned with the true position of the retina in the object or retina coordinate system. The rapid transverse eye movement caused by the saccade can cause the OCT beam to scan overlapping areas of the retina or fail to scan some areas of the retina, so unscanned areas, i.e. Create gaps in the data set.
この例は、目の迅速な不連続な動きの影響を示すが、より小さく、低速かつ連続した運き(例えば震えまたはドリフト)もあり得ることが理解される。これらによって、OCTボリュメトリックデータセットおよび対応するアンファスOCT眼底画像の歪みが生じるであろう。この歪みはまた、軸方向および横断方向にも起こり得る。OCT器具と撮像中のオブジェクトとの相対的な動きは、例えば、手術におけるOCT顕微鏡法、体内OCT撮像、生体試料の撮像、または携帯型OCT撮像器具を使用する際など、広範囲にわたる応用例で起こり得る。 This example shows the effects of a quick discontinuous movement of the eye, but it is understood that there may be smaller, slower and continuous movements (eg tremor or drift). These will result in distortion of the OCT volumetric data set and the corresponding ampus OCT fundus image. This distortion can also occur in the axial and transverse directions. Relative movement between the OCT instrument and the object being imaged occurs in a wide range of applications, for example when using OCT microscopy in surgery, in-vivo OCT imaging, imaging of biological samples, or portable OCT imaging instruments. obtain.
したがって、OCT器具と撮像中のオブジェクト材料または組織との相対的な動きは、OCT画像または3D OCTボリュメトリックデータセットの完全性を損なうおそれがあり、撮像中のオブジェクト材料または組織の真の構造を正確に表さなくなる。これは、例えばOCTドップラー法を使用した血流測定のような機能測定および構造もしくは外形計測の定量測定の再現性を減じ得る。動きのアーティファクトはまた、異なる時点における撮像測定を繰り返し正確に行ったり、経時的に得られたデータを比較したりする能力を損ない得る。経時的に正確な撮像測定を行う能力は、診断や疾患進行の追跡を含むOCTの多くの臨床応用にとって重要である。 Thus, relative movement between the OCT instrument and the object material or tissue being imaged may compromise the integrity of the OCT image or 3D OCT volumetric data set, and may affect the true structure of the object material or tissue being imaged. It will not be represented correctly. This can reduce the reproducibility of functional measurements such as blood flow measurements using the OCT Doppler method and quantitative measurements of structural or contour measurements. Motion artifacts can also impair the ability to repeatedly and accurately perform imaging measurements at different time points and to compare data obtained over time. The ability to make accurate imaging measurements over time is important for many clinical applications of OCT, including diagnosis and tracking disease progression.
<OCT撮像における動き補正のための既存技術>
動きの歪みを補償するために、確立されたOCT器具の中には、アクティブトラッキングハードウェアを採用するものもある。これらの器具は、別個のトラッキングハードウェアサブシステムを有する。このシステムは、撮像中のオブジェクト組織の位置を測定し、オブジェクトの動きがある場合でもオブジェクト組織上の所望の位置が走査されるようにOCTビームの走査パターンを修正する。しかし、トラッキングハードウェアは、OCTシステムに、コスト増および複雑さを加える。さらに、特定の状況下では、トラッキングハードウェアを使用した画像収集時間が、それを使用しない場合に比べて極めて長くなることがある。
<Existing technology for motion correction in OCT imaging>
Some established OCT instruments employ active tracking hardware to compensate for motion distortion. These instruments have a separate tracking hardware subsystem. This system measures the position of the object tissue being imaged and modifies the scanning pattern of the OCT beam so that the desired position on the object tissue is scanned even when there is movement of the object. However, tracking hardware adds cost and complexity to the OCT system. Furthermore, under certain circumstances, the image acquisition time using tracking hardware can be significantly longer than when not using it.
動き補正のための他の方法は、ソフトウェアに基づくものであり、3D OCTボリュメトリックデータセットを、撮像中のオブジェクトまたは組織の写真のような動きのない参照画像と比較することに依存する。眼科学において、この写真は、網膜眼底写真と呼ばれ、標準の眼科用診断法である。この写真は、単一の時点で収集されかつオブジェクト組織のアンファス画像を生成するので、この写真は組織の横断方向の特徴を正確に表す。しかし、動きのない参照画像を使用して3D OCTボリュメトリックデータセット内の動きを補正するソフトウェアは、3D情報よりむしろ参照画像の2D画像情報を使用することに限定されている。これにより、動き補正の精度が制限される。また、これらの技術だけでは、3D OCTボリュメトリックデータセットの軸方向動きを補正することができない。したがって、動きを補正する3D OCTデータの改良された方法が必要である。また、さらなる器具ハードウェアを必要とせず、軸方向および横方向の両方の動きを効果的に補正する方法が望まれる。ただし、特定の実施形態では、さらなる情報源を使用することが可能である。たとえば、動きの補正および位置合わせのための計算時間を低減するために、動きの初期推定を提供することができる。 Another method for motion correction is software based and relies on comparing the 3D OCT volumetric data set to a motionless reference image such as a photograph of the object or tissue being imaged. In ophthalmology, this photograph is called a retinal fundus photograph and is a standard ophthalmic diagnostic method. Since this photo is collected at a single point in time and produces an affus image of the object tissue, this photo accurately represents the transverse characteristics of the tissue. However, software that uses motionless reference images to correct for motion in the 3D OCT volumetric data set is limited to using 2D image information of the reference image rather than 3D information. This limits the accuracy of motion correction. Also, these techniques alone cannot correct the axial motion of the 3D OCT volumetric data set. Therefore, there is a need for an improved method of 3D OCT data that corrects motion. It would also be desirable to have a method that effectively compensates for both axial and lateral movement without the need for additional instrument hardware. However, in certain embodiments, additional information sources can be used. For example, an initial estimate of motion can be provided to reduce computation time for motion correction and alignment.
本明細書では、光コヒーレンストモグラフィ(OCT)走査の間に生じる、動きのアーティファクトを補償する方法および装置を記載する。例示の実施形態は、動きのアーティファクトのないデータセットを生成し、撮像中のオブジェクトの真の構造を正確に表す、動き補正されたOCTボリュメトリックデータセットの正確かつ再現性のある位置合わせを提供する。例示の方法は、動きのない参照画像の使用を必要としない。複数の動き補正済ボリュメトリックデータセットをマージして、個々のボリュメトリックデータセットと比較して改善された品質とSN比とを有する、ボリュメトリックデータセットを得ることができる。いくつかの実施形態では、収集中の動きによって欠測したデータが補償され、動き補正およびマージを行わない場合に比べて、大きなデータセットの収集および長い収集時間を可能にする。 Described herein is a method and apparatus for compensating for motion artifacts that occur during optical coherence tomography (OCT) scanning. The illustrative embodiment generates a data set free of motion artifacts and provides accurate and reproducible alignment of motion-corrected OCT volumetric data sets that accurately represent the true structure of the object being imaged To do. The exemplary method does not require the use of a motionless reference image. Multiple motion-corrected volumetric data sets can be merged to obtain a volumetric data set with improved quality and signal-to-noise ratio compared to individual volumetric data sets. In some embodiments, the missing data is compensated for by the motion being collected, allowing for a larger data set collection and longer collection time than without motion correction and merging.
本明細書では、器具とオブジェクト材料または組織との相対的な動きに起因する3D OCTボリュメトリックデータセットの動き歪みを補正できる方法および装置を記載する。例示の実施形態はまた、複数の2Dおよび3DのOCTデータセットを位置合わせおよび結合もしくはマージして、改善された画質および完全性を有するデータセットを生成する。例示の方法は、まず、収集データの部分集合において相補的な走査パターンを使用して、複数の2Dおよび3D OCTボリュメトリックデータセットを得ることによって機能する。収集したデータセットのうちの少なくとも1つは、3D OCTボリュメトリックデータセットである。収集した各データセットには、動きのアーティファクトが含まれる可能性がある。異なる方向または軌道に沿って迅速に走査することによってオブジェクト材料または組織の特徴をより正確に測定するように設計された、異なる相補的な走査パターンを使用する。例示の方法は、位置合わせ済データセット間の類似度にフェイバを与える一方で位置合わせ変換によって示唆される動きにペナルティを与えるように、データセットを変換することによって、複数の2Dおよび3D OCTデータセットを互いに位置合わせする。結果として生成された位置合わせ済3D OCTボリュメトリックデータセットは、動きが補正され、撮像中のオブジェクト組織の真の構造を正確に表す。 Described herein is a method and apparatus that can correct for motion distortion of a 3D OCT volumetric data set due to relative motion between an instrument and object material or tissue. The exemplary embodiment also aligns and combines or merges multiple 2D and 3D OCT data sets to generate a data set with improved image quality and integrity. The exemplary method works by first obtaining multiple 2D and 3D OCT volumetric data sets using complementary scanning patterns in a subset of the acquired data. At least one of the collected data sets is a 3D OCT volumetric data set. Each collected data set may contain motion artifacts. Use different complementary scanning patterns designed to more accurately measure object material or tissue characteristics by rapidly scanning along different directions or trajectories. An exemplary method is to convert a plurality of 2D and 3D OCT data by transforming the data set to give a flavor to the similarity between the registered data sets while penalizing the motion suggested by the registration transform. Align the sets with each other. The resulting aligned 3D OCT volumetric data set is motion corrected and accurately represents the true structure of the object tissue being imaged.
さらに、例示の実施形態は、複数の位置合わせ済OCTデータセットを結合またはマージして、改善された品質のデータセットを生成できる。結合またはマージされたデータセットは、改善された信号−雑音比、低減されたスペックル雑音、および構造的特徴の改善された連続性を有する。データセット画質のこれらの改善により、定量評価を必要とする応用例において、構造的特徴の改善されたセグメンテーションまたは自動測定が可能になる。 Further, the exemplary embodiment may combine or merge multiple aligned OCT data sets to generate an improved quality data set. The combined or merged data set has an improved signal-to-noise ratio, reduced speckle noise, and improved continuity of structural features. These improvements in dataset quality allow for improved segmentation or automatic measurement of structural features in applications requiring quantitative evaluation.
前述したように、走査されたデータセットの収集中のオブジェクト組織の動きは、オブジェクトの未走査の領域に起因するギャップ(図8(A)および図8(B))を生じさせる。異なるデータセットを位置合わせして結合またはマージする例示の方法は、個々の収集されたデータセットにデータが欠けている場合でも、実質的に完全なデータセットを生成できる。なお、動き補正済データのマージは不要である。補正済みではあるがマージされていない動きデータセットを、本明細書において記載する方法を使用して生成し、データのトポロジ的情報、構造的情報、機能的情報、および形態学的情報における改善された精度を達成することができる。 As described above, the movement of the object tissue during the collection of the scanned data set creates a gap (FIGS. 8A and 8B) due to the unscanned area of the object. An exemplary method for aligning or merging or merging different data sets can produce a substantially complete data set even if the individual collected data sets are missing data. It is not necessary to merge motion corrected data. A corrected but unmerged motion data set is generated using the methods described herein to improve data topological, structural, functional, and morphological information Accuracy can be achieved.
多くの応用例において、3D OCTボリュメトリックデータセットの大きさは、画像収集時間と同様に、OCTスキャナに対するオブジェクトの相対的な動きによって制限される。この相対的な動きは、走査されたオブジェクトの動きであったり、器具が安定していない場合や携帯型OCT装置用の場合のようにOCT装置自体の動きであったり、動きに先行する諸原因が組み合わさったことが原因であったりして生じ得る。この動きによって、画像の歪み、ならびにオブジェクトの未走査の領域からの不完全なデータセットが生じ得る。例えば、眼科では、データセット収集時間は、患者の目の動きや瞬きのために典型的には2、3秒に限られている。いくつかの実施形態によって、ボリュメトリックデータセットの動き補正および位置合わせ、ならびに複数のデータセット収集からの実質的に完全なデータセットの生成が可能になる。これらの特徴により、極めて大きいデータセットを収集でき、有用なデータが得られる撮像時間を大幅に増大することができる。 In many applications, the size of the 3D OCT volumetric data set is limited by the relative movement of the object relative to the OCT scanner, as well as the image acquisition time. This relative movement may be the movement of the scanned object, the movement of the OCT apparatus itself, such as when the instrument is not stable or for a portable OCT apparatus, and other causes that precede the movement. This may be caused by the combination of. This movement can result in image distortion as well as incomplete data sets from unscanned areas of the object. For example, in ophthalmology, data set collection time is typically limited to a few seconds due to patient eye movements and blinks. Some embodiments allow for motion correction and registration of the volumetric data set and generation of a substantially complete data set from multiple data set collections. With these features, extremely large data sets can be collected and the imaging time for obtaining useful data can be greatly increased.
多くの臨床応用では、3D OCTボリュメトリックデータセットにおける特徴の定量測定が必要とされる。眼科では、網膜神経線維層の厚さ、網膜の厚さ、または神経節細胞層の厚さの定量測定が、緑内障、緑内障の進行、または処置に対する反応の兆候として有用である。結晶腔、網膜下液または脈絡膜新生血管膜などの病変を含む、病変構造や大きさのような、他の特徴の定量測定は、加齢黄斑変性の重要な指標である。 Many clinical applications require quantitative measurements of features in 3D OCT volumetric data sets. In ophthalmology, quantitative measurement of retinal nerve fiber layer thickness, retinal thickness, or ganglion cell layer thickness is useful as an indication of glaucoma, progression of glaucoma, or response to treatment. Quantitative measurements of other features, such as lesion structure and size, including lesions such as crystal cavities, subretinal fluid or choroidal neovascular membranes are important indicators of age-related macular degeneration.
定量測定の精度および再現性は、3D OCTボリュメトリックデータセットの精度および品質によって制限される。3D OCTボリュメトリックデータセットがオブジェクト組織の真の構造を表す精度は、重要である。なぜなら、真の構造に対するボリュメトリックデータセットの歪みは、定量測定が誤った場所で行われることを意味するからである。さらに、動きおよび結果として生じる歪みは、ボリュメトリックデータセットごとに異なり、定量測定の再現性を低下させることになる。動き補正および真の組織構造の正確なボリュメトリック撮像を可能にすることによって、かつ、動きがある場合に完全なデータセットの収集を可能にすることによって、例示の実施形態は、定量測定の改善された精度および再現性を可能にする。さらに、画質を改善することにより、定量測定の性能および精度が、改善される。 The accuracy and reproducibility of quantitative measurements is limited by the accuracy and quality of the 3D OCT volumetric data set. The accuracy with which the 3D OCT volumetric data set represents the true structure of the object organization is important. This is because the distortion of the volumetric data set with respect to the true structure means that quantitative measurements are made in the wrong place. Furthermore, the motion and resulting distortion will vary from volumetric data set and will reduce the reproducibility of quantitative measurements. The exemplary embodiment improves quantitative measurements by enabling motion correction and accurate volumetric imaging of true tissue structure and by allowing the collection of complete data sets in the presence of motion. Allow accurate accuracy and reproducibility. Furthermore, by improving the image quality, the performance and accuracy of quantitative measurement is improved.
多くの臨床応用では、複数の時点での撮像を必要とする。例えば、異なる時間に異なる検査を行い、次いで、これらの異なる時点にわたってボリュメトリックデータセット情報を量的に比較する。これらの応用例には、疾患進行や治療に対する反応を追跡することが含まれる。さらに、小動物モデルの撮像は、創薬や薬の発見のために重要な手法である。小さな変化を経時的により正確に追跡できると、より小さな変化を改善された統計的有意性をもって正確に測定できるので、研究のために必要な動物の数を減らしたり必要な時間を減少したりでき、それによって、これらの研究の効率を改善することができる。例示の実施形態では、異なる時点で収集した3D OCTボリュメトリックデータセットを互いに位置合わせできる。異なる時点のボリュメトリックデータを位置合わせすることにより、データセット間でボリュメトリックデータセットを正確に比較したり、データセット間の変化を正確に定量測定したりできる。なお、この応用例では、異なる時点からのデータセットは、真の組織構造に対して位置合わせできるだけでなく、互いに対しても位置合わせできる。ただし、異なる時点からのデータセットは、必ずしもマージまたは結合されるわけではなく、むしろ、変化を測定する定量測定技術に対する入力として使用される。これらの変化は、疾患進行または治療に対する反応を示す。 Many clinical applications require imaging at multiple time points. For example, different tests are performed at different times, and then volumetric data set information is compared quantitatively over these different time points. These applications include tracking disease progression and response to treatment. Furthermore, imaging of small animal models is an important technique for drug discovery and drug discovery. The ability to track small changes more accurately over time enables you to accurately measure smaller changes with improved statistical significance, reducing the number of animals required for the study and reducing the time required. Thereby improving the efficiency of these studies. In an exemplary embodiment, 3D OCT volumetric data sets collected at different times can be aligned with each other. By aligning volumetric data at different times, volumetric data sets can be accurately compared between data sets, and changes between data sets can be accurately measured quantitatively. Note that in this application, data sets from different time points can be aligned with each other as well as with respect to the true tissue structure. However, data sets from different time points are not necessarily merged or combined, but rather used as input to a quantitative measurement technique that measures changes. These changes are indicative of disease progression or response to treatment.
例示の実施形態は、収集処理中のオブジェクトまたは器具の動きが原因で光コヒーレンストモグラフィ(OCT)収集の際に生じる動きのアーティファクトを補償する、方法および装置を含む。例示の実施形態はまた、複数のボリューム(物体)走査からのデータをマージする方法および装置を含む。例示の実施形態は、眼科用OCT撮像について記載しているが、これらが他の応用例に使用され得ることは言うまでもない。 Exemplary embodiments include methods and apparatus that compensate for motion artifacts that occur during optical coherence tomography (OCT) acquisition due to object or instrument motion during the acquisition process. Exemplary embodiments also include methods and apparatus for merging data from multiple volume (object) scans. While the exemplary embodiments describe ophthalmic OCT imaging, it will be appreciated that they can be used in other applications.
一般に、走査撮像装置(例えばOCT)は、一挙にデータを収集しない。その代わりに、データは、オブジェクトまたはターゲットのサンプリングを連続して行い、異なる時間に順次軸方向走査すなわちA走査を収集することで収集される。ヒトの目または網膜のインヴィヴォ(生体内)での走査の場合、器具に対する目の動きは、収集中によく見られる。この動きが原因で、オブジェクト領域は、均一にサンプリングされない(図6(A)および図6(B))。その結果、動きのアーティファクトが、その構造(図7(A)〜図7(D))および収集データ(図8(A)および図8(B))の完全性に影響を及ぼす。 In general, a scanning imaging apparatus (for example, OCT) does not collect data at once. Instead, data is collected by continuously sampling the object or target and sequentially collecting axial or A scans at different times. In the case of in vivo scanning of the human eye or retina, eye movement relative to the instrument is common during collection. Due to this movement, the object area is not sampled uniformly (FIGS. 6A and 6B). As a result, motion artifacts affect the integrity of the structure (FIGS. 7A-7D) and collected data (FIGS. 8A and 8B).
いくつかの実施形態によれば以下の(i)および(ii)が可能である。(i)ほぼ同一のオブジェクト領域ではあるが変動するサンプリングまたは走査パターンの、2つ以上の動き歪みのある収集物を使用し、これらの動きのアーティファクトを補償すること。(ii)補正済データをマージして、強化されたデータ品質および形態学的精度を有するデータを得ること。 According to some embodiments, the following (i) and (ii) are possible. (I) Use two or more motion-distorted collections of nearly identical object regions but varying sampling or scanning patterns to compensate for these motion artifacts. (Ii) Merging the corrected data to obtain data with enhanced data quality and morphological accuracy.
図9は、本発明の方法900の例示の実施形態を示すフローチャートである。例えば、方法900は、図1に示す装置100のコンピュータ102または図2に示す装置200のコンピュータ202によって実行できる。
FIG. 9 is a flowchart illustrating an exemplary embodiment of the
方法900は、少なくとも以下の動作を含む:
902:画像収集;
904:データ前処理;
906:動き推定;
908:位置合わせ済(動き補正済)データセットの生成;および
910:データの結合(マージ)。
The
902: Image collection;
904: data preprocessing;
906: motion estimation;
908: generation of a registered (motion corrected) data set; and 910: data merging.
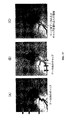
本明細書に記載する動き補正の有用な実施形態は、入力ボリュームのデータの空間的相関および/または時間構造を利用して、歪みを検出し、オブジェクトとスキャナとの相対的な動きを推定するものである。次いで、この動き情報を使用して、個々のボリュームの歪みのない視野またはデータセットを構築する。次いで、これらの歪みのないデータセットまたはボリュームを結合またはマージして、動きのアーティファクトがなく、改善された画質を有する単一ボリュームにすることができる。図10(A)および図11(A)に示す3次元データセットを用いて、2つのデータセットの動き補正およびマージ操作の概要を図12に示す。動き補正およびマージは3つ以上のデータセットに一般化できることは言うまでもない。 Useful embodiments of motion correction described herein utilize spatial correlation and / or temporal structure of input volume data to detect distortion and estimate relative motion between an object and a scanner. Is. This motion information is then used to construct an undistorted field of view or data set for the individual volumes. These undistorted data sets or volumes can then be combined or merged into a single volume that has no motion artifacts and improved image quality. FIG. 12 shows an outline of motion correction and merging operations for two data sets using the three-dimensional data sets shown in FIGS. 10 (A) and 11 (A). Of course, motion correction and merging can be generalized to more than two data sets.
<画像収集>
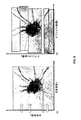
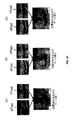
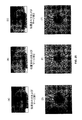
ボリュームに生じている目の動きを推定し補償するために、ならびに、個々のデータセットにおけるギャップを埋めるために、2つ以上のボリュームを収集する。このとき、そのボリュームのうちの少なくとも1つは、他のボリュメトリックデータセットに関連付けられた少なくとも1つの走査パターンに相補的であるとみなされる、走査パターンを有する。ラスタ走査を用いてデータを収集する例示の実施形態において、2つのラスタ操作のうちの一方のラスタ走査の高速走査方向が他方のラスタ走査の高速走査方向に対して90°またはそれに近い角度であり、それらの高速走査方向が実質的に直角である場合、2つのラスタ走査パターンは、相補的であるとみなされる。ここで「実質的」とは、90°の角度からの絶対値差が10°を上回らないことをいう。図10(A)には、ラスタ走査の高速走査方向がx方向である走査パターン(XFast走査パターンと称される)を示す。図11(A)には、ラスタ走査の高速走査方向がy方向である相補的な走査パターン(YFast走査パターンと称される)を示す。この例では、各ボリュームの高速走査方向は、OCT装置の座標系において互いに実質的に直交した状態で収集される。このようにして収集された相補的な互いに直交するボリュームは、動きによって受ける影響がそれぞれ異なり、これによって動き補正が改善される。なお、高速走査方向は、OCT装置座標系のxおよびy方向と必ずしも一致する必要はなく、OCT装置座標系の横断面において任意の角度だけ回転していてもよい。この特定の例示の実施例において、各ボリュームの走査パターンと関連付けられたOCT装置の中心座標系におけるA走査サンプリング位置の集合は、同一位置のグリッドにあるか、または、同一位置のグリッドに容易にマッピング可能である。サンプリング位置の容易にマッピング可能な集合の例としては、走査座標系の同一領域をカバーするが高速および低速方向において異なる数のA走査を有する走査パターンを含む、2つの直交するラスタ走査がある。臨床診療において使用される走査パターンは、サンプリング密度と収集時間およびデータセットの大きさとのバランスをとるために、低速方向よりも高速方向においてより多くのA走査を含むことが多い。A走査の数が高速走査方向と低速走査方向とで異なる場合、処理中に、再サンプリングまたは中間ステップを補間することによって、データを共通位置のグリッドにマッピングできる。例えば、低速方向よりも高速方向に多くのA走査があるという特定の場合には、高速方向のサンプリング点の結果として生じる数が、低速方向のサンプリング点の数と同じになるように、OCTデータを高速方向に沿って再サンプリングすることができる。
<Image collection>
Two or more volumes are collected to estimate and compensate for eye movement occurring in the volume, as well as to fill gaps in individual data sets. At this time, at least one of the volumes has a scan pattern that is considered complementary to at least one scan pattern associated with another volumetric data set. In an exemplary embodiment using raster scan to collect data, the fast scan direction of one raster scan of two raster operations is at an angle of 90 ° or close to the fast scan direction of the other raster scan. If the fast scan directions are substantially perpendicular, the two raster scan patterns are considered complementary. Here, “substantially” means that an absolute value difference from an angle of 90 ° does not exceed 10 °. FIG. 10A shows a scanning pattern (referred to as an XFast scanning pattern) in which the high-speed scanning direction of raster scanning is the x direction. FIG. 11A shows a complementary scanning pattern (referred to as a YFast scanning pattern) in which the high-speed scanning direction of raster scanning is the y direction. In this example, the high-speed scanning direction of each volume is collected in a state substantially orthogonal to each other in the coordinate system of the OCT apparatus. The complementary mutually orthogonal volumes collected in this way are each affected differently by motion, which improves motion compensation. Note that the high-speed scanning direction does not necessarily coincide with the x and y directions of the OCT apparatus coordinate system, and may be rotated by an arbitrary angle in the cross section of the OCT apparatus coordinate system. In this particular exemplary embodiment, the set of A-scan sampling positions in the central coordinate system of the OCT apparatus associated with each volume's scan pattern is either in the same position grid or easily in the same position grid. Mapping is possible. An example of an easily mappable set of sampling locations is two orthogonal raster scans that include scan patterns that cover the same region of the scan coordinate system but have different numbers of A scans in the fast and slow directions. Scan patterns used in clinical practice often include more A scans in the high speed direction than in the low speed direction to balance sampling density with acquisition time and data set size. If the number of A scans is different in the fast scan direction and the slow scan direction, the data can be mapped to a grid at a common location by resampling or interpolating intermediate steps during processing. For example, in the specific case where there are more A scans in the high speed direction than in the low speed direction, the OCT data is such that the number resulting from the sampling points in the high speed direction is the same as the number of sampling points in the low speed direction. Can be resampled along the high speed direction.
任意の所与の走査パターンに対して、各A走査は、装置の中心座標系と、A走査が撮像されるおおよその時刻とに関連付けられている。A走査が撮像される時刻は、例えば、ボリュームの収集の開始の基準とされてもよく、あるいは、他のいかなる基準時点とされてもよい。例示の実施形態では、A走査が収集された時刻の知識を使用する。しかし、時刻情報は、OCT装置自体によって提供される必要はなく、A走査タイムスタンプの明確なサポートを有するOCT装置を使用せずにA走査パターンについての知識から算出できる。したがって、A走査の明確なタイムスタンピングは、本明細書に記載する方法および装置を実施するための要件ではないことが理解される。 For any given scan pattern, each A-scan is associated with the central coordinate system of the device and the approximate time at which the A-scan is imaged. The time at which the A-scan is imaged may be, for example, a reference for the start of volume collection, or any other reference time. In the exemplary embodiment, knowledge of the time at which the A scan was collected is used. However, the time information need not be provided by the OCT device itself, and can be calculated from knowledge of the A-scan pattern without using an OCT device with explicit support for A-scan time stamps. Thus, it is understood that a clear time stamping of the A scan is not a requirement for implementing the methods and apparatus described herein.
例示の実施形態において、走査パターンのうちの少なくとも2つが相補的な場合に、3Dデータセットが収集される。したがって、サンプリング位置が横断されるシーケンスは、入力データセットの走査パターンのうちの少なくとも2つの間で異なる。ここに記載する方法および装置は、動き補正を改善するために、走査パターンに関連する情報を利用する。 In the exemplary embodiment, a 3D data set is collected when at least two of the scan patterns are complementary. Thus, the sequence over which the sampling positions are traversed differs between at least two of the scan patterns of the input data set. The methods and apparatus described herein utilize information related to scan patterns to improve motion correction.
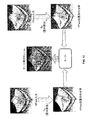
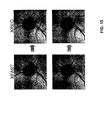
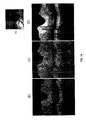
入力データセットの例を図10(B)および図11(B)に示す。図10(B)および図11(B)は、それぞれ、x方向の走査を優先して収集したデータと、y方向の走査を優先して収集したデータを示す。両方のボリュームは、それぞれ、高速軸に沿った歪みが少なく、低速の軸または方向に沿った歪みが比較的大きい、真のオブジェクト構造およびトポグラフィの歪んだ図を示す。時間が短ければ短いほど、動きによる歪みの影響が小さくなるため、認識可能な動きの特徴と走査方向との相関が生じる。2つの相補的なデータセット(図10(C)および図11(C))についてのOCT眼底画像において、データの不連続またはギャップが見られる。不連続は、急速な動きがある場合に生じ得、その結果、オブジェクトの同じ領域を再走査するか、またはオブジェクト全体で欠測領域が生じる。 Examples of input data sets are shown in FIGS. 10B and 11B. FIG. 10B and FIG. 11B show data collected with priority given to scanning in the x direction and data collected with priority given to scanning in the y direction, respectively. Both volumes each show a distorted view of the true object structure and topography with less strain along the fast axis and relatively greater strain along the slow axis or direction. The shorter the time, the less the influence of distortion due to motion, so that a correlation between a recognizable motion feature and the scanning direction occurs. In the OCT fundus images for two complementary data sets (FIGS. 10C and 11C), data discontinuities or gaps are seen. Discontinuities can occur when there is rapid movement, resulting in rescanning the same area of the object or missing areas throughout the object.
OCTデータがこの処理中の少なくとも1つのステップで収集されることが示唆される。本明細書に記載するシステムおよび方法は、先に収集したOCTデータを処理することもできる。 It is suggested that OCT data is collected in at least one step during this process. The systems and methods described herein can also process previously collected OCT data.
<データ処理>
最初にボリュームを収集した後、いくつかの随意の前処理ステップをデータに対して適用してもよい。前処理は、動き補正結果の品質を高めるだけでなく、計算時間を低減することもできる。
<Data processing>
After initially collecting the volume, some optional preprocessing steps may be applied to the data. The pre-processing can not only increase the quality of the motion correction result but also reduce the calculation time.
通常、ボリュームによってカバーされる領域の一部のみが、関連する構造的情報を含む。例えば、ほとんどの場合、全軸方向範囲の部分範囲のみが撮像中のオブジェクト組織からの画像情報を含み、この領域の外では区別される組織の特徴は見えない。なぜなら、オブジェクトはOCT装置の軸方向範囲の一部しかカバーしないからである。したがって、動き補正の関心領域は、オブジェクト情報が含まれる部分範囲内にある。オブジェクト情報が存在する対象領域の外側の領域は、データサイズおよび計算時間もしくは複雑さを低減するために、軸方向に切り取ってもよい。 Usually, only a part of the area covered by the volume contains relevant structural information. For example, in most cases, only a partial range of the entire axial range includes image information from the object tissue being imaged, and no distinct tissue features are visible outside this region. This is because the object covers only a part of the axial range of the OCT apparatus. Accordingly, the region of interest for motion correction is within the partial range including the object information. A region outside the target region where the object information exists may be cut off in the axial direction in order to reduce the data size and calculation time or complexity.
計算の速度を上げ、かつ必要メモリを低減するために、データはまた、ボリュームを軸方向にダウンサンプリングすることによって低減されてもよい。例示の実施形態において、ダウンサンプリングは、ガウス還元法を使用して行われる。ただし、他の方法が用いられてもよいことは言うまでもない。ダウンサンプリングは、複数回適用されてもよい。横断方向の解像度は、このステップによって影響されない。このステップは任意であり、極めて微細な軸方向解像度が所望される応用例では省略されてもよいことは言うまでもない。 In order to increase the speed of computation and reduce the required memory, the data may also be reduced by down-sampling the volume axially. In the exemplary embodiment, downsampling is performed using a Gaussian reduction method. However, it goes without saying that other methods may be used. Downsampling may be applied multiple times. Transverse resolution is not affected by this step. Of course, this step is optional and may be omitted in applications where very fine axial resolution is desired.
OCT画像に存在するスペックル雑音は、画像類似度測定の精度を低下させる可能性がある。したがって、効果的に雑音抑圧を行えば、よりよい品質の結果につながり得る。サッケード眼球運動が存在するボリューム位置でのアーティファクトを雑音除去するために、3D技術を使用する代わりに、メディアンフィルタリングが、別々に各B走査に適用される。典型的には、例示の実施形態において、サイズ3または5の2次メディアン窓(quadratic median window)が使用される。ただし、例えば1Dもしくは3のDメディアンフィルタリング、または1D、2Dもしくは3Dの異方性拡散のような方法などの、異なる雑音低減法も使用できることを、理解されたい。
Speckle noise present in the OCT image may reduce the accuracy of the image similarity measurement. Therefore, effective noise suppression can lead to better quality results. Instead of using 3D techniques, median filtering is applied to each B-scan separately to denoise artifacts at volume locations where saccade eye movement is present. Typically, in the exemplary embodiment, a
画像データの強度正規化もまた、行うことができる。例示の実施形態では、平均値が0で分散が1のデータを生成する、平均−分散正規化を使用する。ただし、他の正規化方法が用いられてもよく、正規化がデータの振幅や強度などの量的特徴に対して行われてもよいことは、言うまでもない。この操作は、全ボリュームに対して行うことができる。あるいは、データはA走査毎のベースで正規化でき、ボリュームを通じて輝度に不均一な変化がある場合に有用である。これは、OCT器具において軸方向の距離の感度に有意な変動がある場合に、起こり得る。ビネットアーティファクトがOCTデータセットにある場合、輝度、信号強度またはデータ値の変動もまた、起こり得る。ビネットアーティファクトは、網膜撮像中に、OCTビームが虹彩または目の瞳孔を取り囲む組織によって少なくとも部分的に妨げられると、起こり得る。感度に対する深さの既知の較正に基づく、A走査データ値の補正もまた、随意に適用できる。 Image data intensity normalization can also be performed. In the exemplary embodiment, average-variance normalization is used, which produces data with a mean value of 0 and a variance of 1. However, it will be appreciated that other normalization methods may be used and normalization may be performed on quantitative features such as data amplitude and intensity. This operation can be performed on all volumes. Alternatively, the data can be normalized on a per-A-scan basis, which is useful when there is an uneven change in brightness throughout the volume. This can occur when there is a significant variation in the sensitivity of the axial distance in the OCT instrument. If the vignette artifact is in the OCT data set, variations in brightness, signal strength or data values can also occur. Vignette artifacts can occur during retinal imaging when the OCT beam is at least partially blocked by tissue surrounding the iris or eye pupil. Correction of A-scan data values based on a known calibration of depth to sensitivity can also be optionally applied.
OCTデータが、この処理の間、少なくとも1つのステップで随意に前処理されることが、示唆される。本明細書に記載するシステムおよび方法はまた、先に前処理したデータに作用することができ、このデータを処理できる。 It is suggested that the OCT data is optionally preprocessed in at least one step during this process. The systems and methods described herein can also operate on previously preprocessed data and can process this data.
<動き推定>
例示の実施形態は、位置合わせ処理を用いて、走査手順の間に、オブジェクトとOCTシステムとの相対的な動きを推定する。目的関数は最適化される(公式に従って最小化または最大化される)。目的関数は、2つ以上の入力データセットボリュームの間の類似度を考慮する。入力データの空間−時間的な構造もまた、考慮される。位置合わせ処理は、いくつかの変換または変位場を、各ボリュームに対して1つずつ、生成する。各変位場の各個別のベクトルは、オブジェクト座標系、またはオブジェクト空間、または共通の動き補正済空間内の2Dグリッド上のある位置に関連付けられる。この状況において、2Dグリッドとは、グリッド点自体が3次元座標を有しながら、これらのグリッド点が平面を形成することを意味する。したがって、グリッド内には自由度2しかない。位置のこのグリッドは、動き補正済空間にマッピングされた、OCT装置座標系内のサンプリング位置の共通集合に対応する。各変換または変位場は、この2Dオブジェクト空間グリッド上の3次元ベクトルからなり、x、yおよびzの変位を表す。各ボリュームおよびオブジェクト空間のグリッド点に対して、対応する変位ベクトルがオフセットとして使用されて、関連付けられたデータセットのデータ(これは、当該オブジェクト空間グリッド点に対応するOCT装置座標系の位置を基準としたOCT装置座標系において定められる)をサンプリングし、その結果、補間されたA走査の等価物を生成する。このため、その変位に対する適切な値が見つかった場合には、当該変位場は、画像再サンプリング技術と共に使用されて、OCTデータセットに関連付けられたデータを、未補正のOCT装置座標系から共通の動き補正オブジェクト座標系にマッピングできる。したがって、収集したOCTデータセットに存在する動きを補正するという目標は、関連付けられた変位場ごとの上記適切な値を見つけることによって達成できる。
<Motion estimation>
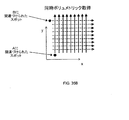
The illustrative embodiment uses an alignment process to estimate the relative motion of the object and the OCT system during the scanning procedure. The objective function is optimized (minimized or maximized according to the formula). The objective function considers the similarity between two or more input data set volumes. The spatial-temporal structure of the input data is also considered. The registration process generates several transformation or displacement fields, one for each volume. Each individual vector of each displacement field is associated with a position on the 2D grid in the object coordinate system, or object space, or common motion corrected space. In this situation, 2D grid means that the grid points themselves have a three-dimensional coordinate, but these grid points form a plane. Therefore, there are only two degrees of freedom in the grid. This grid of positions corresponds to a common set of sampling positions in the OCT device coordinate system mapped to the motion corrected space. Each transformation or displacement field consists of a three-dimensional vector on this 2D object space grid and represents x, y and z displacements. For each volume and object space grid point, the corresponding displacement vector is used as an offset to correlate the data in the associated data set (this is relative to the position of the OCT device coordinate system corresponding to that object space grid point. Defined in the OCT apparatus coordinate system), and as a result, the equivalent of an interpolated A-scan is generated. Thus, if an appropriate value for that displacement is found, the displacement field is used in conjunction with image resampling techniques to retrieve the data associated with the OCT data set from the uncorrected OCT instrument coordinate system. Can be mapped to the motion compensation object coordinate system. Thus, the goal of correcting the motion present in the collected OCT data set can be achieved by finding the appropriate value for each associated displacement field.
目的関数およびその最適化
上記変換(データボリュームの歪みをなくすための変位場)を計算するために、位置合わせの目標を表わす目的関数が生成され、数値計算技術によって最適化される。図13に示すように、目的関数自体は、複数の変位場推定値(そのそれぞれは、1つの収集されたデータセットと一意に関連付けられている)の集合をパラメータとして用い、単一の実数の値を出力として生成する。
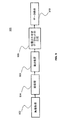
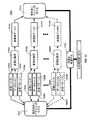
Objective function and its optimization To compute the transformation (displacement field to eliminate distortion of the data volume), an objective function representing the alignment goal is generated and optimized by numerical computation techniques. As shown in FIG. 13, the objective function itself uses a set of multiple displacement field estimates (each of which is uniquely associated with one collected data set) as a parameter, and is a single real number Generate a value as output.
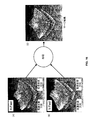
図13は、本発明の方法によって採用される例示の目的関数を評価する処理1300を示すフローチャートである。ステップ1302a、1304aおよび1306aのそれぞれにおいて、変換1、データセット1および走査パターン1が、それぞれ入力として使用される。ステップ1308aにおいて、変換1がデータセット1に適用され、変換後データ1が得られる。ステップ1302b、1304bおよび1306bのそれぞれにおいて、変換2、データセット2および走査パターン2が、それぞれ入力として使用される。ステップ1308bにおいて、変換2がデータセット2に適用され、変換後データ2が得られる。ステップ1312において、変換1、データセット1および走査パターン1が、変換2、データセット2および走査パターン2とそれぞれ比較され、オブジェクトと走査器具との間の推定された動きにペナルティを与える(推定された動きがあれば、マイナスする)。ステップ1314において、変換後データ1と変換後データ2が比較され、2つの変換後データセット間の類似度にフェイバを与える(類似性があれば、プラスとする)。ステップ1316において、目的関数は、動き推定のペナルティと類似度との相対的強さを査定することによって、評価される。
FIG. 13 is a flowchart illustrating a
処理1300は、変換c〜N、データセットc〜N、および走査パターンc〜Nに作用する、さらなるステップを含むことができる。
本実施形態では、最適化という状況において、より低い目的関数値がより良好であると定義するが、これで一般性が損なわれることはない。したがって、最適化処理は、1つの目的関数値を生じる変位場の適切な集合を見つけることからなり、ここでは、より小さな値が変位場のより適切な集合を示す。目的関数には、以下の(1)および(2)の2つの目標がある:(1)変換されたボリューム間の高い類似度にフェイバを与えることと、(2)変位場または変換によってモデル化されるような動きにはペナルティを与えること。 In this embodiment, it is defined that a lower objective function value is better in the situation of optimization, but this does not impair generality. Thus, the optimization process consists of finding an appropriate set of displacement fields that yields one objective function value, where a smaller value indicates a more appropriate set of displacement fields. The objective function has the following two goals (1) and (2): (1) Give a high degree of similarity between transformed volumes, and (2) Model by displacement field or transformation Give penalties to such movements.
図5に示すように、収集された各データセットは、OCT装置の中心座標系におけるデータ点の離散グリッド上に定められる、おそらくは複数であるデータチャネルからなる。元のOCTデータセットまたは前処理されたOCTデータセットからのデータ値に変位場が適用される際には、通常、その変換からのオフセットは、入力データセットからのデータがマッピングされる元の座標を、離散グリッド位置自体の上に厳密に置くのではなく、グリッド位置同士の間に置く。このため、任意の位置がデータからサンプリングされ得るように、画像補間技術を使用して、グリッド位置に関連付けられた値の間を補間する。例示の実施形態では、キュービックエルミートスプライン補間を採用してもよい。この補間スキームは、依然として計算処理上安価に行え、平滑な1次導関数の計算を可能にする。この1次導関数は、後に行われる非線形最適化にとって有利である。応用例の計算速度や性能の要求事項によっては、他の補間技術を使用してもよいことは、言うまでもない。 As shown in FIG. 5, each collected data set consists of possibly multiple data channels defined on a discrete grid of data points in the central coordinate system of the OCT apparatus. When a displacement field is applied to data values from the original or preprocessed OCT data set, the offset from the transformation is usually the original coordinates to which the data from the input data set is mapped. Are not placed exactly on the discrete grid positions themselves, but between the grid positions. Thus, image interpolation techniques are used to interpolate between the values associated with the grid positions so that any position can be sampled from the data. In the illustrated embodiment, cubic Hermite spline interpolation may be employed. This interpolation scheme is still computationally inexpensive and allows the calculation of smooth first derivatives. This first derivative is advantageous for later nonlinear optimization. Of course, other interpolation techniques may be used depending on the computational speed and performance requirements of the application.
入力または前処理されたボリュームからの、強度データのような構造データが、適切な値を有する変位場を使用して共通の動き補正済オブジェクト空間にマッピングされると、結果として生じるマッピングされた個々のデータセットは、互いに類似する傾向がある。これに対して、変位場が適切に算出されない場合、複数のデータセット間のマッピングされた構造データは、類似度が低くなる傾向がある。したがって、目的関数の一部は、変換後の構造ボリュームデータの集合の間の高い類似度にフェイバを与えるものである。変換されかつ類似度を試験されるデータは、入力データセットから直接もたらされてもよい。1つ以上の前処理ステップを入力データセットに適用して、前処理されたデータセットを生成する場合には、変換の適用および類似度の査定もまた、前処理されたデータセットに対して行うことができる。ボリュームデータは、目的関数へ入力される、それぞれの変位場を使用して、収集したデータセットに関連付けられた構造データ値をマッピングすることによって、変換される。各グリッド位置については、マッピングされたA走査データ間の累進的に高い類似度に対して、より低くなる値が計算され、全てのグリッド位置にわたって合計される。例示の実施形態において、差の二乗和(SSD)の手法が、これらの値を計算するために使用される。収集したボリュームが2つしかない場合には、これらの2つのボリューム間で同様にマッピングされたデータは、減算され、直接二乗されて、類似度指標を形成する。ボリュームが3つ以上ある場合には、マッピングされたボリューム間でそれぞれペアが組まれ、各ペアについてSSDが算出され、全てのペアのそれらの値が合計される。ペアは、全てのボリュームが少なくとも結び付けられるように、ペアによって形成されるリンクを有するグラフ構造があるように選択される。これは、いずれのボリュームから始めても、ボリューム間のペアを横断することによって他のいずれかのボリュームに到達できることを意味する。 When structural data, such as intensity data, from an input or preprocessed volume is mapped to a common motion corrected object space using a displacement field with appropriate values, the resulting mapped individual The data sets tend to be similar to each other. On the other hand, when the displacement field is not properly calculated, the structure data mapped between the plurality of data sets tends to have a low similarity. Therefore, a part of the objective function gives a favour to a high degree of similarity between sets of structured volume data after conversion. Data that is transformed and tested for similarity may come directly from the input data set. If one or more preprocessing steps are applied to the input data set to generate a preprocessed data set, transformation application and similarity assessment are also performed on the preprocessed data set. be able to. The volume data is transformed by mapping the structural data values associated with the collected data set using the respective displacement fields that are input to the objective function. For each grid position, a lower value is calculated for the progressively higher similarity between the mapped A-scan data and summed over all grid positions. In the illustrated embodiment, a difference sum of squares (SSD) approach is used to calculate these values. If there are only two volumes collected, data mapped similarly between these two volumes is subtracted and directly squared to form a similarity measure. When there are three or more volumes, a pair is formed between the mapped volumes, an SSD is calculated for each pair, and the values of all pairs are summed. The pairs are selected such that there is a graph structure with links formed by the pairs so that all volumes are at least connected. This means that any volume can be reached by traversing a pair between volumes, starting with any volume.
一般に、収集中に相対的な動きが生じると、オブジェクト上で走査された位置は、動きがない場合の位置とは異なり、伴っている特定の動きに依存する。ただし、相対的な動きの速度や加速には限度があり、その位置は、速度を時間で積分することにより決定される。この関係により、スキャナとオブジェクトとの間の位置の変化の予期される大きさは、異なるデータサンプルを収集する間に経過した時間の長さに関係する。いくつかの実施形態では、動き補正を改善するために走査パターンに関する情報が組み込まれる。 In general, when relative movement occurs during acquisition, the position scanned on the object depends on the particular movement involved, as opposed to the position when there is no movement. However, there is a limit to the speed and acceleration of relative movement, and the position is determined by integrating the speed with time. Due to this relationship, the expected magnitude of the change in position between the scanner and the object is related to the length of time that has elapsed between collecting different data samples. In some embodiments, information about the scan pattern is incorporated to improve motion correction.
器具とオブジェクトとの相対的な動きは、限られた、範囲、速度、加速度および周波数を有すると仮定できる。相対位置は、相対速度を時間で積分したものであり、一定の時間枠内での相対位置の変化には物理的な限度がある。動き推定の第2の目標は、データ収集処理が順次行われるという構成に伴う、空間−時間的な構造を考慮に入れて、推定される変換が確実に見つかるようにすることを目的とする。したがって、動きは時間の面からみてスムーズでなければならない。例示の実施形態の場合、動きは、時間構造情報に対する変位場の導関数として表すことができる。例示の実施形態は、モデル化された動きにペナルティを与える収集処理についての予めの知識を含めるために、いわゆる正則化項(regularizer)を目的関数に加える。この正則化項は、各変位場における、時間に対する変位場ベクトルの導関数のL2ノルムの二乗を、全てのグリッド点および全てのボリュームにわたって合計する。この導関数は、有限差分のような既知の方法を使用して概算できる。横断方向および軸方向の動きを異なるように扱う係数が導入される。この係数は、上記L2ノルムの二乗を適用する前に時間導関数の軸方向の大きさをスケーリング(拡大縮小)する。なお、本明細書に記載する方法およびシステムはまた、モデル化された動きにペナルティを与える他の正則化項式を採用できる。 It can be assumed that the relative movement of the instrument and the object has a limited range, velocity, acceleration and frequency. The relative position is obtained by integrating the relative speed with time, and there is a physical limit to the change of the relative position within a certain time frame. The second goal of motion estimation is to ensure that the estimated transformation is found, taking into account the spatio-temporal structure associated with the configuration where the data collection process is performed sequentially. Therefore, the movement must be smooth in terms of time. In the illustrated embodiment, the motion can be expressed as a derivative of the displacement field with respect to temporal structure information. The exemplary embodiment adds a so-called regularizer to the objective function to include prior knowledge about the collection process that penalizes the modeled movement. This regularization term sums the L2 norm square of the derivative of the displacement field vector over time for each displacement field over all grid points and all volumes. This derivative can be approximated using known methods such as finite differences. Factors are introduced that treat transverse and axial motion differently. This coefficient scales (scales) the axial magnitude of the time derivative before applying the L2 norm square. It should be noted that the methods and systems described herein can also employ other regularization terms that penalize the modeled movement.
良好な動き補正の結果を達成するために、上述した2つの目的、すなわち、構造類似度およびスムーズな動きという目標は、別々に考慮すべきではない。両方の目標のバランスがとれていることが好ましい。この2つの項(それぞれが1つの目標を表す)から目的関数を構築する1つの方法は、2つの目的(目標または測定値)を合計することである。合計の前に正の係数を目的のうちの1つに適用して、相対的な重み付けをすることができる。この係数は、最適性能のために調整でき、一般には、入力ボリュームおよび他の設定値の具体的なセットに依存する。しかし、実際には、結果として生じる動き補正の品質は、広範囲にわたる正則化項重み係数を通じてむしろ安定している。 In order to achieve good motion compensation results, the two objectives described above, namely structural similarity and smooth motion goals, should not be considered separately. It is preferable that both goals are balanced. One way to construct an objective function from these two terms (each representing one goal) is to sum the two goals (goals or measurements). A positive factor can be applied to one of the objectives prior to the sum to give a relative weight. This factor can be adjusted for optimal performance, and generally depends on the input volume and the specific set of other settings. However, in practice, the quality of the resulting motion correction is rather stable through a wide range of regularization term weighting factors.
動き推定値を見つけるために、目的関数は、ボリュームの変位場に対して最適化されなければならない。例示の実施形態は、例えばlimited memory Broyden-Fletcher-Goldfarb-Shannon技術のような、直線探索に基づく準ニュートン非線形オプティマイザを使用してもよい。ただし、多くの他の最適化技術を使用してもよいことは言うまでもない。なお、最適化自体は、例えば実行時間による理由や、現在の推定が十分に良好であるか、または最適値に近いと考えられるなどの理由で、いつでも終了することができる。他の終了判断基準もまた、本明細書に記載する方法および装置を実践するために使用できる。 In order to find a motion estimate, the objective function must be optimized for the displacement field of the volume. Exemplary embodiments may use a quasi-Newton nonlinear optimizer based on line search, such as limited memory Broyden-Fletcher-Goldfarb-Shannon technology. However, it will be appreciated that many other optimization techniques may be used. Note that the optimization itself can be terminated at any time, for example, due to execution time, or because the current estimate is sufficiently good or considered close to the optimal value. Other termination criteria can also be used to practice the methods and apparatus described herein.
一般に、これらの非線形オプティマイザは、起点周辺の領域内のローカルな最適値に収束するにすぎない。グローバルな最適値に近い解を見つけて計算時間を低減するために、多重解像度手法が利用される。目的関数の複雑度は、レベルと称される各多重解像度式によって、一定回数低減される。実際には、5多重解像度レベルを使用すれば十分であることが多いが、これは特定のパラメータおよび入力データセットの特徴に依存する。1つのレベルからより複雑なレベルへ変位場推定値をマッピングする変換が、公式化される。計算のために、各ボリュームの変位場に関連付けられたデータは、オブジェクト座標系の共通のグリッド上で3チャネル2D画像(変位ベクトルの各ディメンションに対して1チャネル)として扱われる。その後、標準の画像補間技術を使用して、この変位場の、より高い解像度表現が生成される。元の最適化問題は、最も複雑なレベルである。データセット自体を再サンプリングすることによって複雑度低減が実行され、かつ、関連付けられた時間構造情報も、より少ない数のグリッド点になる。画像データに連続するデータ削減を行うことで、図14に示すようないわゆる解像度ピラミッドというものになる。 In general, these non-linear optimizers only converge to a local optimum in the area around the origin. Multi-resolution techniques are used to find solutions close to the global optimum and reduce computation time. The complexity of the objective function is reduced a certain number of times by each multi-resolution equation called level. In practice, it is often sufficient to use 5 multi-resolution levels, but this depends on the particular parameters and characteristics of the input data set. A transformation is formulated that maps the displacement field estimates from one level to a more complex level. For calculation, the data associated with the displacement field of each volume is treated as a 3 channel 2D image (1 channel for each dimension of the displacement vector) on a common grid in the object coordinate system. A higher resolution representation of this displacement field is then generated using standard image interpolation techniques. The original optimization problem is the most complex level. Complexity reduction is performed by resampling the data set itself, and the associated temporal structure information also results in a smaller number of grid points. By performing continuous data reduction on the image data, a so-called resolution pyramid as shown in FIG. 14 is obtained.
最適化は、まず最も粗いピラミッドレベルで行われ、最適値に達するか、または一定数の反復が行われるか、またはより良いパラメータが見つからなくなるまで、行われる。次いで、その解が、アップサンプリングを使用することによって、より高い複雑度の次のレベルにマッピングされる。完了したレベルからの結果は、次の多重解像度レベル最適化ステップのための初期化を構成する。最適化は、この新しいレベルおよび初期化とともに進行する。一旦この処理が終わると、その結果は次の適切な多重解像度レベルにマッピングされる。元の解像度最適化処理が終わるまで、この処理が繰り返される。 Optimization is first done at the coarsest pyramid level, until it reaches an optimal value, a certain number of iterations are performed, or no better parameters are found. The solution is then mapped to the next level of higher complexity by using upsampling. The result from the completed level constitutes an initialization for the next multi-resolution level optimization step. Optimization proceeds with this new level and initialization. Once this process is complete, the result is mapped to the next appropriate multi-resolution level. This process is repeated until the original resolution optimization process is completed.
完了した最適化処理の結果、変位場の集合(各ボリュームに対して1つの変位場)ができる。この集合は、ボリュームの動き推定値とも考えることができる。 As a result of the completed optimization process, a set of displacement fields (one displacement field for each volume) is created. This set can also be considered as a volume motion estimation value.
<位置合わせ済(動き補正済)データセットの生成>
変換または変位場が推定された後、1つ以上の動き補正済データセットが構築される。動き補正済データは、対応する算出された変位を、特定の応用例に従って、入力データセットのデータチャネル(例えば強度、ドップラーシフトまたはそれらの前処理されたものなど)の1つ以上に適用することによって生成される。
<Generation of aligned (motion corrected) data set>
After the transformation or displacement field is estimated, one or more motion corrected data sets are constructed. Motion corrected data applies the corresponding calculated displacement to one or more of the data channels (eg, intensity, Doppler shift or their preprocessed ones) of the input data set according to the particular application. Generated by.
位置合わせ済データセットを明示的に構築する代わりに、データはまた、変換をデータセットに適用することによって、オンデマンドで部分的に構築することもできる。 Instead of explicitly building a registered data set, the data can also be partially built on demand by applying transformations to the data set.
これらの動き補正済データセットは、以下のセクションで記載するデータマージステップで、随意に使用できる。データセットのマージは必ずしも必要ではなく、マージには画質を改善する効果はあるものの、マージせずに動き補正済データセットを使用してもよい。 These motion corrected data sets can optionally be used in the data merging step described in the following section. It is not always necessary to merge the data sets. Although the merge has an effect of improving the image quality, the motion-corrected data set may be used without merging.
<データ結合(マージ)>
先行する動き補償では、収集した各ボリュームのための変位場を算出する。変位場は、収集中のターゲットの動きをモデル化する。各変位場をそれに関連付けられた歪んだデータセットに適用することで、共通空間内の動き補償済データセットが生成される。次いで、いくつかの例示の実施形態は、これらの独立のデータセットを結合して、より高品質のデータセットを生成する。位置合わせ済ボリューム内のデータサンプルの相対的な品質は、この処理中に考慮される。図15は、2つのボリューム位置合わせの例を使用する本発明の例示のマージ処理の概略図である。詳細には、図15は、直交する低速方向および高速方向を採用する走査、すなわちXFAST走査およびYFAST走査、によって得られた、ヒトの目の複数のOCT画像を重畳したものである。次いで、各走査は位置合わせされ(すなわち、オブジェクトの位置の走査装置とは独立して、画像の解剖学的特徴に絶対座標を割り当てる)、位置合わせ済走査XREGおよびYREGが生成される。最後に、本明細書に記載するように、位置合わせ済走査がマージされる。
<Data join (merge)>
In the preceding motion compensation, a displacement field for each collected volume is calculated. The displacement field models the movement of the target during acquisition. By applying each displacement field to the distorted data set associated with it, a motion compensated data set in the common space is generated. Some example embodiments then combine these independent data sets to produce a higher quality data set. The relative quality of the data samples within the aligned volume is taken into account during this process. FIG. 15 is a schematic diagram of an exemplary merge process of the present invention using two volume alignment examples. Specifically, FIG. 15 is a superposition of a plurality of OCT images of the human eye obtained by scanning employing the low-speed direction and the high-speed direction orthogonal to each other, that is, XFAST scanning and YFAST scanning. Each scan is then aligned (i.e., assigning absolute coordinates to the anatomical features of the image, independent of the object position scanner), and aligned scans XREG and YREG are generated. Finally, the aligned scans are merged as described herein.
動き推定値から、入力ボリュームが変換されて、位置合わせ済ボリュームが生成される。次いで、これらのボリュームは、それらの間のボクセル単位の加重和を使用して結合される。いくつかの例示の実施形態はこの技術を使用するが、データを結合またはマージする他の技術も使用可能であることは言うまでもない。 From the motion estimation value, the input volume is converted to generate a registered volume. These volumes are then combined using a weighted sum of voxels between them. Although some exemplary embodiments use this technique, it will be appreciated that other techniques for combining or merging data may be used.
収集中に器具とオブジェクトとの間に相対的な動きがあり、かつ、サンプリングが順次行われるため、オブジェクトは、様々な範囲でサンプリングされる。オブジェクトの複数の領域は、数回走査される(オーバーサンプリングされる)ことも、全く走査されない(アンダーサンプリングされる)こともあり得る。このケースは、図8(B)で例示される。アンダーサンプリングされた領域の場合、動き補償中に生じるギャップは、データを共通のオブジェクト空間にマッピングする際に、入力ボリューム内の隣接するA走査から補間される。したがって、これらの強度値は、実際に収集されたデータを表さず、隣接領域からの情報を表す。しかし、複数のボリュームが結合またはマージされる場合には、アンダーサンプリングされた(すなわち未走査の)領域は、大幅に減少する。なぜなら、他のボリュームからのデータが、単一ボリューム内の大部分の未走査の領域にわたって利用できる傾向にあるからである。 Because there is relative movement between the instrument and the object during acquisition and sampling is done sequentially, the object is sampled in various ranges. Multiple regions of an object may be scanned several times (oversampled) or not scanned at all (undersampled). This case is illustrated in FIG. In the case of undersampled regions, gaps that occur during motion compensation are interpolated from adjacent A scans in the input volume when mapping data to a common object space. Therefore, these intensity values do not represent actually collected data, but represent information from adjacent regions. However, when multiple volumes are merged or merged, the undersampled (ie, unscanned) area is greatly reduced. This is because data from other volumes tends to be available across most unscanned areas within a single volume.
直接平均化を行うことによって、すなわち、N個のボリュームをマージするには重みを1/Nに設定することによって、動き補償済ボリュームを結合できる。しかし、オブジェクト空間グリッドにおけるある位置にマッピングされて入力ボリューム内の対応する隙間を埋めたボクセルは、真のターゲットデータを含むA走査と比較して同一の寄与をもたらすであろう。この手法は、画質のローカルな劣化をもたらし得る。 Motion-compensated volumes can be combined by performing direct averaging, ie, by setting the weight to 1 / N to merge N volumes. However, a voxel that is mapped to a position in the object space grid to fill the corresponding gap in the input volume will provide the same contribution compared to an A scan that contains true target data. This approach can result in local degradation of image quality.
データ内の隙間(ボイド(空所))を検出する1つの方法は、最終位置合わせ済ボリュームを生成する間に、他の領域よりも高頻度でサンプリングされた、元のボリューム内の領域を探すことである。この測定値は、位置合わせ済ボリュームの各A走査内で同一であるが、サンプリング密度と称される。相対的に高いサンプリング密度は、入力ボリュームからのその領域が位置合わせ済ボリューム内のギャップを埋めるために使用されたことを示す。サンプル品質を第2に示すものは、位置合わせ済ボリューム内のボクセルが当該入力ボリューム領域の完全な外側または部分的な外側をサンプリングすることによって生成されたか否か、を査定することによって求められる。この測定値は、サンプル妥当性と称される。 One way to detect gaps (voids) in the data is to look for regions in the original volume that were sampled more frequently than other regions while generating the final aligned volume. That is. This measurement is the same within each A scan of the aligned volume, but is referred to as sampling density. A relatively high sampling density indicates that the region from the input volume has been used to fill a gap in the aligned volume. A second indication of sample quality is determined by assessing whether the voxels in the aligned volume were generated by sampling the entire outside or partial outside of the input volume region. This measurement is referred to as sample validity.
サンプリング密度の推定値を計算する1つの方法は、まず、対応するボリュームのx/yサイズの何倍か(例えば4倍)のサイズを有する2D画像を生成し、その画像の全てのピクセルを極めて小さい正の値に初期化する。この大きい方の画像を使用して、ある程度のサブピクセル精度が達成される。例えば、4倍なら、さらに2ビットの精度が与えられる。この画像は、A走査の2次元のグリッドに対応する元のボリュームの2次元の領域を表す。推定は、位置合わせ結果を生成するために取得された各サンプルに対して、カー
ネル、例えば切り捨てガウシアン、をこの画像にさらに描画することによって行われる。描画自体は、サンプルが取得された位置にカーネルの中心を合わせ、カーネル値を密度推定画像値に加えることによって、行われる。カーネルが部分的にその画像の外側にある場合、それらの値を最も近いエッジピクセルにおいてさらに加えて、その挙動をボリュームサンプリングルーチンに反映させることができる。
One way to calculate an estimate of the sampling density is to first generate a 2D image with a size that is several times (for example, 4 times) the x / y size of the corresponding volume, Initialize to a small positive value. Using this larger image, some sub-pixel accuracy is achieved. For example, if it is 4 times, the accuracy of 2 bits is given further. This image represents a two-dimensional region of the original volume corresponding to a two-dimensional grid of A scan. The estimation is done by further drawing a kernel, eg, a truncated Gaussian, on this image for each sample acquired to generate the registration result. Drawing itself is done by centering the kernel at the location where the sample was obtained and adding the kernel value to the density estimated image value. If the kernel is partially outside the image, those values can be further added at the nearest edge pixel to reflect its behavior in the volume sampling routine.
これらの推定画像を重み計算に使用するために、これらの推定画像は、共通のオブジェクト空間にマッピングされなければならない。これは、3次元の場合と同様に変位場の横断方向の成分を上記画像値に適用するが、軸方向(z)の変位情報は使用しないことによって、行うことができる。この処理は、サンプリング密度を推定しかつ共通のオブジェクト座標系の2次元グリッド上に存在する、2次元画像の集合(マージされるボリュームごとに1つ)を導く。 In order to use these estimated images for weight calculation, these estimated images must be mapped to a common object space. This can be done by applying the transverse component of the displacement field to the image value as in the three-dimensional case, but not using displacement information in the axial direction (z). This process estimates the sampling density and leads to a set of two-dimensional images (one for each merged volume) that exist on a two-dimensional grid in a common object coordinate system.
サンプル妥当性値は、ボクセルを生成したデータマッピング処理が当該領域の外側からマッピングされたボリュームデータをサンプリングしたか否かをチェックすることによって、マージしようとする各ボクセルに対応して生成できる。この場合、サンプル妥当性には極めて低い正の値が割り当てられる。あるいは、例示の実施形態は、サンプル妥当性として値1を割り当てる。
The sample validity value can be generated for each voxel to be merged by checking whether the data mapping process that generated the voxel has sampled the volume data mapped from outside the area. In this case, the sample validity is assigned a very low positive value. Alternatively, the exemplary embodiment assigns the
例示の実施形態は、先に言及したローカルな品質劣化を回避するために、推定されたサンプリング密度およびサンプル妥当性に従って、収集されたボリュームを結合する。重みは、サンプリング密度とサンプル妥当性とから生成され、これらは最終的にマージされたデータセット内の各データセットの各ボクセルの影響を制御する。例えば、重みは、以下の方法で各位置合わせ済ボリュームの各所与のデータボクセルに割り当てることができる:関連付けられたサンプル妥当性を、1+関連付けられたサンプリング密度の量(この量の、例えば8乗)で割ることによって、仮の重みをボクセルに割り当てる。この指数パラメータは調整され、サンプリング密度値およびサンプル妥当性値の値範囲および分布に依存する。このステップの後に、正規化ステップが続く。このステップは、結合するデータ値の集合と関連付けられた重みを、これらの重みの合計を1とする共通因数によってスケーリングする。さらに、等分よりもはるかに低い重みは随意にゼロにすることができ、残りの重みは再正規化される。この処理は、当該サンプリング密度が他のサンプリング密度と比較して相対的に低いときに、より高い重みを導く。サンプル妥当性が相対的に高い場合にも、重みは高くなる。このスキームにより、元に収集されたボリュームのサンプリングにおけるギャップを埋めるために動き補正済オブジェクト空間の特定の位置にマッピングのみされた、データサンプルの影響が低くなり、したがって、マージされた出力の品質を高める。 The exemplary embodiment combines the collected volumes according to the estimated sampling density and sample validity to avoid the local quality degradation referred to above. Weights are generated from sampling density and sample validity, which control the impact of each voxel in each data set in the final merged data set. For example, weights can be assigned to each given data voxel of each aligned volume in the following manner: the associated sample validity is 1 + the amount of the associated sampling density (of this amount, e.g. ) To assign a temporary weight to the voxel. This index parameter is adjusted and depends on the value range and distribution of sampling density values and sample validity values. This step is followed by a normalization step. This step scales the weights associated with the set of data values to be combined by a common factor with the sum of these weights as 1. In addition, weights much lower than equal can optionally be zero, and the remaining weights are renormalized. This process leads to a higher weight when the sampling density is relatively low compared to other sampling densities. The weight is also high when the sample validity is relatively high. This scheme reduces the impact of data samples that are only mapped to specific locations in the motion-corrected object space to fill gaps in the sampling of the originally collected volume, thus reducing the quality of the merged output. Increase.
ボクセルの加重和が全ての値について算出された後、最終的な随意の後処理ステップが、マージされた動き補正済データセットに対して、しきい値処理および範囲変換を行うことができる。 After the voxel weighted sum has been calculated for all values, the final optional post-processing step can perform thresholding and range conversion on the merged motion corrected data set.
動き補正の原理の概要
以下のセクションでは、動き補正の一般的原理を記載する。示されるステップは、必ずしも順次実行される必要はなく、可能な場合には並行して実行されてもよい。図12は、例示の方法の高レベルのフローチャートである。最初に、少なくとも2つのOCTデータセットを収集する。データセットの少なくとも1つは、横断面の領域を高密度走査したものであるべきである。次いで、データには、例示の方法の性能ならびに実行速度を改善するように設計された、1つ以上の随意の前処理ステップが施される。次いで、前処理されたデータは、実際の動き推定ステップのために使用される。このステップは、データセット収集中の動きによって生じた歪みを補正し、かつ動きを補正するために共通空間にデータセットを変換する、変換を、各入力データセットのために見つける。一旦これらの変換が見つかると、これらのうちの1つ以上には、推定処理の間に使用されるのと同一のデータチャネルに適用されるか、または同一のデータセットからの異なるデータチャネルに適用されて、その結果、1つ以上の動き補正済データセットを生成することができる。最後に、これらの動き補正済データセットは、動きのアーティファクトがなくデータ品質も改善された、単一のセットへと結合され得る。
Overview of motion compensation principles The following sections describe the general principles of motion compensation. The steps shown need not be performed sequentially but may be performed in parallel if possible. FIG. 12 is a high level flowchart of an exemplary method. First, collect at least two OCT data sets. At least one of the data sets should be a high density scan of a cross-sectional area. The data is then subjected to one or more optional preprocessing steps designed to improve the performance of the exemplary method as well as the speed of execution. The preprocessed data is then used for the actual motion estimation step. This step finds a transform for each input data set that corrects distortions caused by motion during data set collection and transforms the data set to a common space to compensate for motion. Once these transforms are found, one or more of these may be applied to the same data channel used during the estimation process, or applied to different data channels from the same data set. As a result, one or more motion corrected data sets can be generated. Finally, these motion-corrected data sets can be combined into a single set with no motion artifacts and improved data quality.
<データセット収集(取得)>
例示の実施形態は、2Dおよび3DのOCTボリュメトリックデータセットに関して記載しているが、これは、異なる時間に、サンプル材料または組織の異なる位置で画像情報を収集する走査データ収集処理によって特徴づけられる、他の画像診断法に適用できることは言うまでもない。多次元OCTデータセットは、特定の走査パターンに従って収集されるデータサンプルで構成される。データセットの収集は、3次元の器具走査座標系を使用して記述できる。この座標系は、原点と3つの直交の基底ベクトルによって画定される。最初の2つの基底ベクトルは、OCT装置の横断面に延びる。第3の基底ベクトルは、最初の2つの基底ベクトルに対して垂直であり、軸方向(図3)を指す。上記2つの横断方向のそれぞれにおけるOCTビームの走査範囲は、走査軌道または走査パターンによって定められ、撮像中のオブジェクト材料または組織の横断方向の領域を決定する。OCT器具の軸方向すなわち深さ方向の測定範囲は、撮像中のオブジェクトの深さ範囲を決定する。
<Data set collection (acquisition)>
Exemplary embodiments are described with respect to 2D and 3D OCT volumetric data sets, which are characterized by a scanning data collection process that collects image information at different locations of sample material or tissue at different times. Needless to say, the present invention can be applied to other diagnostic imaging methods. A multidimensional OCT data set consists of data samples collected according to a specific scan pattern. Data set collection can be described using a three-dimensional instrument scan coordinate system. This coordinate system is defined by an origin and three orthogonal basis vectors. The first two basis vectors extend in the cross section of the OCT device. The third basis vector is perpendicular to the first two basis vectors and points in the axial direction (FIG. 3). The scanning range of the OCT beam in each of the two transverse directions is defined by the scanning trajectory or scanning pattern and determines the transverse region of the object material or tissue being imaged. The measurement range in the axial direction or depth direction of the OCT instrument determines the depth range of the object being imaged.
多次元OCTデータセットが構成される各サンプルの位置は、上記基底に対して特定される。その位置は、走査立方体内の上記データサンプルの位置を特定する3次元座標ベクトルによって、定義される。開始からのおおよその絶対時間、または取り込まれた最後のデータサンプルに対するおおよその時間差が既知である。なぜなら、ビームを位置付けるための走査機構を制御するのに使用される、軌道に関連付けられた時間情報があるからである。データサンプルと特定の画像の収集の起点との相対的な時間情報が既知であれば、絶対タイミング情報、すなわち、その特定の画像の最初の撮像サンプルから経過した総時間も構築できる。この情報を使用することにより、収集された画像データは、当該収集の開始時刻とタプル(すなわち要素の順序リスト)の集合とによって、完全に記述することができる。この集合のサイズは、当該画像のために取り込まれたデータサンプルの合計数に等しい。図28は、単一のデータサンプルと座標系との関係の概略図である。各タプルs=<xs,ys,zs,ts,data>は、サンプル自体のデータ内容と、OCT走査座標系上の位置に関する3次元座標と、当該位置がサンプリングされた時刻値tsとからなる。 The position of each sample that constitutes the multidimensional OCT data set is specified with respect to the base. Its position is defined by a three-dimensional coordinate vector that specifies the position of the data sample in the scan cube. The approximate absolute time from the start or the approximate time difference with respect to the last data sample taken is known. This is because there is time information associated with the trajectory that is used to control the scanning mechanism for positioning the beam. If the relative time information between the data sample and the starting point of the collection of a particular image is known, absolute timing information, i.e. the total time elapsed since the first imaging sample of that particular image, can also be constructed. By using this information, the collected image data can be completely described by the collection start time and a set of tuples (ie, an ordered list of elements). The size of this set is equal to the total number of data samples captured for the image. FIG. 28 is a schematic diagram of the relationship between a single data sample and a coordinate system. Each tuple s = <xs, ys, zs, ts, data> is composed of the data content of the sample itself, three-dimensional coordinates relating to the position on the OCT scanning coordinate system, and a time value ts at which the position is sampled.
図29は、複数の位置を順次サンプリングしてデータセットを構成する例を示す。ここでは、複数のデータサンプルs1、s2〜snが収集される。この例は順次走査を示しているため、データサンプルと関連付けられた時刻は、1つのデータサンプルから次のデータサンプルに移るに従って、順次増加している。 FIG. 29 shows an example in which a data set is constructed by sequentially sampling a plurality of positions. Here, a plurality of data samples s1, s2 to sn are collected. Since this example shows a sequential scan, the time associated with a data sample increases sequentially as it moves from one data sample to the next.
(フーリエ領域OCTの場合のように、)OCT装置が実質的に瞬時に個々のA走査を収集する場合、各A走査は、同時に異なる軸方向深さの複数のデータサンプルを収集すると考えることができる。ここでいう「実質的に瞬時に」とは、各A走査が1ミリ秒未満で収集されることを意味する。各A走査の軸方向に沿ったサンプルは、器具座標系の同一の横断方向の座標で得られる。A走査のデータサンプルの軸方向座標は、器具座標系のz方向において等間隔で離れている。いくつかの実施形態では、主に、瞬時に個々のA走査を収集するシステムとともに使用されることを想定している。ただし、一般には、データセットのデータサンプルには、互いに対してこの特別な関係がない。また、光屈折の影響に起因して、軸方向がz軸に必ずしも整列しないような、OCTビームの方向に変化が生じてもよいことは言うまでもない。これらの場合は、屈折を補償するためにOCT画像データセットを前処理することによって対処することができ、また、例示の実施形態によってもサポートされている。 If the OCT apparatus collects individual A scans substantially instantaneously (as in the case of Fourier domain OCT), each A scan may be considered to collect multiple data samples of different axial depths simultaneously. it can. As used herein, “substantially instantaneously” means that each A-scan is collected in less than 1 millisecond. Samples along the axial direction of each A-scan are obtained with the same transverse coordinates in the instrument coordinate system. The axial direction coordinates of the A scan data samples are equally spaced in the z direction of the instrument coordinate system. Some embodiments are primarily intended for use with systems that acquire individual A-scans instantaneously. However, in general, the data samples of a data set do not have this special relationship with each other. It goes without saying that the direction of the OCT beam may change so that the axial direction is not necessarily aligned with the z-axis due to the influence of light refraction. These cases can be addressed by preprocessing the OCT image data set to compensate for refraction, and are also supported by the exemplary embodiment.
さらに、画像収集を記述するこのモデルは、複数の撮像ビームを使用して一度に複数のデータサンプルまたはA走査を同時に集める装置にも適用される。この場合、関連付けられた時刻値はまた、並行して記録されたデータサンプルについて、同一になるであろう。複数の撮像ビームを使用すると、データ収集速度を大きくでき、複数のビームが独立して走査される場合には、複数のデータセットの各時間構造間の相関を高めることができ、これにより位置合わせ性能が改善されることになる。 In addition, this model describing image acquisition also applies to an apparatus that uses multiple imaging beams to collect multiple data samples or A-scans simultaneously. In this case, the associated time value will also be the same for data samples recorded in parallel. Using multiple imaging beams can increase the data acquisition rate, and if multiple beams are scanned independently, can increase the correlation between each time structure of multiple data sets, thereby aligning Performance will be improved.
相補的走査パターンの概念は、器具座標系の各データサンプルの3D位置を時間の関数または関係として扱うことによって、数学的に説明できる。これは、各時刻が1つ以上のサンプリング位置と関連付けられることを意味する。時間が進むにつれ、時間的に次の対応するデータサンプルを指す各データサンプルのベクトルである、勾配のような概念を定義することができる。ここでいう「対応する」とは、各サンプルが、同一の撮像ビームによって記録され、および/または、A走査ベースの系の場合には同一の軸方向走査指標上にあることを意味する。結果として生じるベクトル場は、特定の走査パターンにとって一意である。2つの走査パターンは、これらのベクトル場が、異なるか無相関の場合に、相補的であるという。相補的走査パターンの基本的な例は、直交する高速軸を有するラスタタイプの走査パターンである(図10(A)〜10(C)、図11(A)〜11(C))。一般に、動き補正は、使用する走査パターンのセットが有意に相補的であるパターンを含む場合に、最も良く機能する。 The concept of complementary scanning patterns can be mathematically explained by treating the 3D position of each data sample in the instrument coordinate system as a function or relationship of time. This means that each time is associated with one or more sampling positions. As time progresses, a concept like a gradient can be defined, which is a vector of each data sample that points to the next corresponding data sample in time. “Corresponding” here means that each sample is recorded by the same imaging beam and / or on the same axial scan index in the case of an A-scan based system. The resulting vector field is unique for a particular scan pattern. Two scan patterns are said to be complementary if their vector fields are different or uncorrelated. A basic example of a complementary scanning pattern is a raster type scanning pattern having orthogonal high-speed axes (FIGS. 10A to 10C and FIGS. 11A to 11C). In general, motion correction works best when the set of scan patterns used includes patterns that are significantly complementary.
器具スキャナ座標系に加えて、走査中のオブジェクト材料または組織上に座標系を定義することもできる。相対的な動きがない場合、器具座標とオブジェクト座標には互いに固定された関係があり、3D OCTボリュメトリックデータセットは、正確にオブジェクト材料または組織の特徴を表す。しかし、データセット収集中における、オブジェクト材料または組織の動きは、器具の動きと共に、データセットの歪みの一因となり得る。なぜなら、オブジェクト座標系で表されるオブジェクト材料または組織上のOCTビームの実際の位置は、器具スキャナ座標系によって表されるOCTビームの所望の位置とは異なるからである。 In addition to the instrument scanner coordinate system, a coordinate system can also be defined on the object material or tissue being scanned. In the absence of relative movement, instrument coordinates and object coordinates have a fixed relationship to each other, and the 3D OCT volumetric data set accurately represents object material or tissue characteristics. However, movement of object material or tissue during data set collection can contribute to distortion of the data set as well as instrument movement. This is because the actual position of the OCT beam on the object material or tissue represented in the object coordinate system is different from the desired position of the OCT beam represented by the instrument scanner coordinate system.
図10(A)〜図10(C)は、OCT装置が軸方向の走査を瞬時に収集する標準的な場合に使用される、ラスタビーム走査パターンの例を示す。ラスタパターンでは、軸方向走査データは、OCTビームを所与の横断方向(図10(A)または図10(B)のx方向)に沿って高速走査し、垂直方向(図10(A)または図10(B)のy方向)に沿って走査の位置を次第にずらしながら高速横断方向走査を繰り返すことによって、順次収集される。ビームは、フライバック(すなわち、図4に示すように次の横断方向走査の原点へのビームの迅速な走査)によって各順次高速走査の先頭に再配置される。この例では、軸方向走査OCTデータは、フライバックの時間中は収集されない。ラスタ走査は、断面画像の集合(すなわち図10(B)で示すB走査)を収集するものと考えることができる。さらに一般的にいえば、異なる平面位置でのB走査の集まり、すなわち、オブジェクト材料または組織の横断方向の領域からの軸方向走査データの集まりが、3D OCTボリュメトリックデータセットを構成する。 FIGS. 10A-10C show examples of raster beam scanning patterns used in the standard case where the OCT apparatus instantly collects axial scans. In a raster pattern, the axial scan data scans the OCT beam at high speed along a given transverse direction (x direction in FIG. 10 (A) or FIG. 10 (B)) and in the vertical direction (FIG. 10 (A) or Data are sequentially collected by repeating high-speed transverse scanning while gradually shifting the scanning position along the y direction in FIG. The beam is repositioned to the beginning of each sequential fast scan by flyback (ie, a rapid scan of the beam to the origin of the next transverse scan as shown in FIG. 4). In this example, axial scan OCT data is not collected during the flyback time. Raster scanning can be thought of as collecting a set of cross-sectional images (ie, B scanning shown in FIG. 10B). More generally speaking, a collection of B-scans at different planar positions, i.e. a collection of axial scan data from transverse regions of the object material or tissue, constitutes the 3D OCT volumetric data set.
ラスタ走査パターンは、オブジェクトの横断方向の領域をカバーする正方形または矩形のグリッドに沿って間隔をとった複数の点において、軸方向走査データを得る。OCT器具の軸方向走査収集速度およびOCTビーム走査の速度に応じて、軸方向走査は、x横断方向およびy横断方向において、異なる軸方向走査間隔で収集されてもよい。動き補正位置合わせおよびマージの例示の実施形態は、xおよびyの横断方向において間隔を等しく取った、軸方向走査位置を使用する。これは、y方向に沿って迅速な走査を行う相補的走査パターンが、x方向に沿って迅速に走査する走査パターンと同じ間隔を有する軸方向走査データを有するからである。 A raster scan pattern obtains axial scan data at a plurality of points spaced along a square or rectangular grid covering a transverse region of the object. Depending on the axial scan acquisition speed of the OCT instrument and the speed of the OCT beam scan, axial scans may be acquired at different axial scan intervals in the x-transverse direction and the y-transverse direction. The exemplary embodiment of motion compensation alignment and merging uses axial scan positions that are equally spaced in the x and y transverse directions. This is because a complementary scan pattern that performs a quick scan along the y direction has axial scan data that has the same spacing as a scan pattern that scans rapidly along the x direction.
図30(A)〜図30(G)は、OCTビーム走査パターンおよび相補的なパターンの例を示す。標準的なラスタパターンおよびその相補的なパターンが、図30(A)のパターン(XFastおよびYFastを示す)で示される。極めて高速な走査が必要な場合、双方向ラスタパターン(図30(B)および図30(E))を使用できる。双方向ラスタは、標準ラスタ(図30(A))におけるような走査フライバックを使用せず、順および逆の走査方向において実質的に等しい速度でビームを走査する。本明細書では、速度の2つの値が「実質的に等しい」とは、その2つの値の差が10%未満であることをいう。双方向ラスタは、順方向および逆方向の走査の両方のデータを収集し、これによって、所与の測定時間内において得ることができる軸方向走査データの量を最適化する。双方向ラスタパターンは、走査に対して垂直な方向に様々な間隔を有し得る、軸方向走査データを収集する。図30(E)の左のパターンに示すx方向に迅速な走査を行う例では、軸方向走査の間隔には、y方向におけるわずかな変動がある。 FIGS. 30A to 30G show examples of OCT beam scanning patterns and complementary patterns. A standard raster pattern and its complementary pattern are shown in the pattern of FIG. 30A (indicating XFast and YFast). When extremely high speed scanning is required, a bidirectional raster pattern (FIG. 30B and FIG. 30E) can be used. The bi-directional raster does not use a scanning flyback as in the standard raster (FIG. 30A) and scans the beam at substantially equal speeds in the forward and reverse scan directions. As used herein, two values of speed are “substantially equal” means that the difference between the two values is less than 10%. A bi-directional raster collects both forward and reverse scan data, thereby optimizing the amount of axial scan data that can be obtained within a given measurement time. A bi-directional raster pattern collects axial scan data that may have various spacings in a direction perpendicular to the scan. In the example in which rapid scanning is performed in the x direction shown in the left pattern of FIG. 30E, the axial scanning interval has slight variations in the y direction.
図30(C)、(D)、(F)および(G)は、OCTビーム走査パターンの他の例を示す。これらの例には、オブジェクト材料または組織の矩形の横断方向の領域を走査すること;円筒状環形を走査すること;または大きな領域と、この大きな領域に包含されるか、もしくはこれと部分的に重なっている相補的なより小さな領域とを走査することが含まれる。 30C, 30D, 30F, and 30G show other examples of the OCT beam scanning pattern. Examples of these include scanning a rectangular transverse region of the object material or tissue; scanning a cylindrical annulus; or a large region and included in or partially with this large region. Scanning overlapping smaller smaller areas is included.
図30(D)は、x方向に迅速に走査される大きな正方形または矩形状領域、およびy方向に迅速に走査される、より狭い領域からなる相補的な走査パターンの例を示す。この相補的な走査パターンは、最初の走査パターンの全y範囲を走査するが、x範囲の一部しか走査しない。この種の走査パターンは、同一の領域を実質的にカバーする2つの相補的なパターンを走査するには時間が足りない場合に使用され得る。この種のパターンはまた、2つの等しい領域からのデータが、その全ボリュメトリックデータセットが位置合わせに使用され得るほどの十分な品質を有さない場合に、使用され得る。この場合、図30(D)に示す領域に対応するデータの部分集合を抽出して使用することもできる。図30(A)〜図30(G)に示す走査パターンは例であって、多くの他の走査パターンが可能であることは言うまでもない。また、2つ以上の相補的な走査パターンを、所与の走査パターンに使用することができることも、言うまでもない。 FIG. 30D shows an example of a complementary scan pattern consisting of a large square or rectangular area that is rapidly scanned in the x direction and a narrower area that is rapidly scanned in the y direction. This complementary scan pattern scans the entire y range of the first scan pattern, but scans only a portion of the x range. This type of scan pattern can be used when there is not enough time to scan two complementary patterns that substantially cover the same area. This type of pattern can also be used when data from two equal regions does not have sufficient quality that the entire volumetric data set can be used for registration. In this case, a subset of data corresponding to the area shown in FIG. 30D can be extracted and used. The scanning patterns shown in FIGS. 30A to 30G are examples, and it goes without saying that many other scanning patterns are possible. It will also be appreciated that more than one complementary scan pattern can be used for a given scan pattern.
例示の実施形態において、複数の3D OCTボリュメトリックデータセットは、相補的な走査パターンを使用して収集される。しかし、複数のOCT走査ビームを有するOCT器具を使用して、類似または相補的な走査パターンを有する、複数の3D OCTボリュメトリックデータセットを、同一の時間間隔で収集することもまた、可能である。複数の走査ビームを有するOCT器具は、高速データ収集を可能にする。なぜなら、複数の軸方向走査データがオブジェクト材料または組織上の異なる位置から同時に収集されるからである。例えば眼科などの臨床撮像の応用例では、安全組織曝露量によって所与の位置における許容入射露光量が制限され、このため、信号と雑音のトレードオフによる最大データ収集速度が制限される。複数のビームを使用することで、より高いデータレートが可能となる。さらに、相補的な走査パターンからデータを同時に収集できるので、複数のビームを使用することによって画像収集も可能である。これは、動き補正、位置合わせおよびマージの性能を高める効果がある。これらの実施形態については、後のセクションでさらに詳細に記述する。 In the exemplary embodiment, multiple 3D OCT volumetric data sets are collected using complementary scan patterns. However, it is also possible to collect multiple 3D OCT volumetric data sets with similar or complementary scanning patterns at the same time interval using an OCT instrument with multiple OCT scanning beams. . An OCT instrument with multiple scanning beams allows high speed data collection. This is because multiple axial scan data are collected simultaneously from different locations on the object material or tissue. In clinical imaging applications such as ophthalmology, the safe tissue exposure limits the allowable incident exposure at a given location, thus limiting the maximum data collection rate due to signal / noise tradeoffs. By using multiple beams, higher data rates are possible. Furthermore, since data can be collected simultaneously from complementary scanning patterns, image collection is also possible by using multiple beams. This has the effect of enhancing motion compensation, alignment and merging performance. These embodiments are described in more detail in later sections.
3D OCTボリュメトリックデータセット内の各軸方向走査に関連付けられた時刻情報は、動き補正および位置合わせに対する入力として使用されるので、重要なパラメータである。OCT器具とオブジェクト材料または組織との相対的な動きは、振幅、速度、加速度または周波数の一定の限度内に制限される。許容可能な動きに対するこれらの制限は、動き補正処理の間、ボリュメトリックデータ類似度の測定とともに使用される。 The time information associated with each axial scan in the 3D OCT volumetric data set is an important parameter because it is used as input for motion correction and alignment. The relative movement between the OCT instrument and the object material or tissue is limited to within certain limits of amplitude, velocity, acceleration or frequency. These limits on acceptable motion are used in conjunction with volumetric data similarity measurements during the motion compensation process.
以下のセクションでは、各データセットが、撮像器具座標系の3D位置と、関連付けられた時刻と、実際のデータとで構成されたタプルの集合からなるという、一般的な場合を想定する。ある記述が、瞬時的なA走査に基づくデータセットのより特定のケースを指す場合には、このことは明確に言及される。 In the following sections, the general case is assumed where each data set consists of a set of tuples composed of 3D positions in the imaging instrument coordinate system, associated times, and actual data. This is explicitly mentioned when a description refers to a more specific case of a data set based on an instantaneous A-scan.
<データ前処理>
データセットの前処理は、動き補正により適した形式に入力データを変換するために、いくつかのステップからなることができる。以下のセクションにおいて、これらのステップを説明する。実装する場合には、これらのステップのうちのいかなるサブセットも前処理として行うことができる。可能な場合、複数のステップを並行して実行できる。以下のセクションにおいて詳述するステップが、説明で与えられたのと必ずしも同じ順番で行われる必要はない。
<Data pre-processing>
The preprocessing of the data set can consist of several steps to convert the input data into a form more suitable for motion compensation. These steps are described in the following sections. If implemented, any subset of these steps can be performed as pre-processing. If possible, multiple steps can be performed in parallel. The steps detailed in the following sections do not necessarily have to be performed in the same order as given in the description.
《データ選択》
前処理の1段階は、入って来るデータセットのどの部分を、動き補正のために(特に、変換後の状態において類似度を評価するために)、使用するかを選択することである。使用するデータは、異なる時刻のステップで同じ位置でデータサンプルが取り込まれたときには類似しており、データサンプルがオブジェクト座標系の異なる位置で記録されたときには類似していない、という情報を含むべきである。さらに、選択されたデータは、さらなる前処理とともに、処理に十分に適しているべきである。その詳細は、データセットの実際のデータ間の類似度目標が、特定の実施形態においてどのように表されるかに依存する。
<Data selection>
One stage of preprocessing is to select which part of the incoming data set to use for motion correction (especially to evaluate similarity in the transformed state). The data used should contain information that is similar when data samples are captured at the same location at different time steps and not similar when data samples are recorded at different locations in the object coordinate system. is there. Furthermore, the selected data should be well suited for processing, with further preprocessing. The details depend on how the similarity goal between the actual data in the data set is represented in a particular embodiment.
OCTデータは、フーリエ領域検出からの出力である干渉データ、場の振幅データ、複合場データ、線形強度データ、ログ強度データとして、あるいは他の形式で表すことができる。深さに関して有意の光減衰がある材料または組織の撮像応用例では、OCTデータは、通常、ログ強度で、または画像の可視ダイナミックレンジを拡大する他の圧縮形態で見る。OCT測定値から、例えば、ドップラーフロー、パワードップラー、偏光感度、複屈折、偏光度不均一性、分光などの種類のデータを収集することも可能である。例示の実施形態では、処理のために選択する1つの典型的な種類のデータは、OCT強度データである。強度データは、線形スケールであってもよく、対数のような圧縮スケールに変換されてもよい。さらに、データには、さらなる標準のOCT処理ステップ(例えば、雑音を低減する強度しきい値処理、または表現のフルダイナミックレンジを占めるための再スケーリングなど)を適用してもよい。また、2種類以上の入力データを、次の処理ステップのベースとして使用することもできる。例えば、ログ強度データは、動き補正および位置合わせを行うために使用でき、その一方、動き補正変換についての情報は、OCT測定から収集される他のデータ(ドップラーフロー、パワードップラー、偏光感度、複屈折、偏光度均一性、または分光分析データなど)の動き補正および位置合わせを行うために、使用できる。 The OCT data can be represented as interference data, field amplitude data, composite field data, linear intensity data, log intensity data, or other forms of output from Fourier domain detection. In material or tissue imaging applications where there is significant light attenuation with respect to depth, OCT data is typically viewed in log intensity or other compressed form that expands the visible dynamic range of the image. From the OCT measurement value, for example, it is also possible to collect data of types such as Doppler flow, power Doppler, polarization sensitivity, birefringence, polarization degree nonuniformity, and spectroscopy. In the illustrated embodiment, one typical type of data that is selected for processing is OCT intensity data. The intensity data may be a linear scale or may be converted to a compression scale such as logarithm. In addition, additional standard OCT processing steps (eg, intensity thresholding to reduce noise or rescaling to occupy the full dynamic range of the representation) may be applied to the data. Two or more types of input data can also be used as a base for the next processing step. For example, log intensity data can be used to perform motion compensation and alignment, while information about motion compensation transformations can be used to collect other data collected from OCT measurements (Doppler flow, power Doppler, polarization sensitivity, complex sensitivity). Can be used to perform motion correction and alignment (such as refraction, polarization degree uniformity, or spectroscopic data).
《雑音低減》
一般に、入力OCTデータは、背景雑音ならびにスペックル雑音を有する。次の動き補正および位置合わせ処理ステップに応じて、ボリュメトリックデータセットの雑音レベルを下げる画像処理ステップを行うことができる。雑音低減は、各A走査を独立に処理すること、時間と空間の両方に関して近い複数のA走査の集合を処理すること、または器具座標系から参照されるようなデータセットの空間的近さに従って処理を行うこと、によって行うことができる。強度データに作用できる雑音低減の1例は、適切なウィンドサイズを有する1D、2Dまたは3Dでのメディアンフィルタリングである。ただし、広範囲にわたる他の雑音除去技術も使用できる。
《Noise reduction》
Generally, input OCT data has background noise as well as speckle noise. Depending on the next motion correction and alignment processing step, an image processing step can be performed to reduce the noise level of the volumetric data set. Noise reduction can be done by processing each A-scan independently, by processing a set of A-scans that are close in both time and space, or according to the spatial proximity of the data set as referenced from the instrument coordinate system. This can be done by performing processing. One example of noise reduction that can affect intensity data is median filtering in 1D, 2D, or 3D with an appropriate window size. However, a wide range of other denoising techniques can be used.
《データセットの再スケーリング》
高速処理を達成し、実行時間制限に取り組むためには、1つ以上の方向にデータセットを再スケールすることが、有利であり得る。一般のデータセットの場合では、「再スケールする」とは、器具座標系の1つ以上のディメンションに従ってデータサンプルの間隔が変わるように、タプルの数を増加または減少させることを意味する。1例としては、各データセットの軸方向または横断方向の解像度を低減することであろう。これによって、それ以降のステップで処理すべきデータ量が削減される。他の例は、軸方向のピクセル間の間隔が入力データセット間で異なる場合に起こる。データは、軸方向間隔が全てのデータセットで等しくなるように再サンプリングすることによって、1つ以上のデータセットの軸方向解像度を増減することにより、用意できる。これと同様の処理は、走査座標系のサンプル点同士の間隔によって与えられる入力データセット画像のピクセル解像度が等しくない場合に、横断方向において行うことができる。ラスタタイプの走査の場合、横断方向の再スケーリングは、サンプリング点間の時間差が最小である軸に沿って行うことが好ましい。
《Rescaling the data set》
To achieve high speed processing and address execution time limitations, it may be advantageous to rescale the data set in one or more directions. In the case of a general data set, “rescaling” means increasing or decreasing the number of tuples so that the spacing of the data samples varies according to one or more dimensions of the instrument coordinate system. One example would be to reduce the axial or transverse resolution of each data set. As a result, the amount of data to be processed in subsequent steps is reduced. Another example occurs when the axial pixel spacing is different between the input data sets. Data can be prepared by increasing or decreasing the axial resolution of one or more data sets by re-sampling so that the axial spacing is equal for all data sets. Similar processing can be performed in the transverse direction when the pixel resolution of the input data set image given by the spacing between the sample points in the scanning coordinate system is not equal. For raster type scans, transverse rescaling is preferably performed along an axis that minimizes the time difference between sampling points.
《特徴の演算》
動き推定を直接の目的とする前処理の間に選択されたデータチャネルを使用せずに、特徴を演算するステップを行うことができる。このステップの目的は、使用する具体的な類似度測定とともに、動き補正ステップの性能を高めることでもあり得る。他の利点は、出力データの次元数(dimensionality)を入力次元数に対して低減でき、その一方で、オブジェクトの異なる位置からのデータを区別できる情報を、保てることである。これは、完全に無関係な情報が廃棄されるので、動き推定の間の必要な計算を減少させることができると共に、動き推定結果を改善できる。
《Feature calculation》
The step of computing the features can be performed without using the data channel selected during the preprocessing intended directly for motion estimation. The purpose of this step can be to enhance the performance of the motion correction step as well as the specific similarity measure used. Another advantage is that the dimensionality of the output data can be reduced with respect to the input dimensionality, while maintaining information that can distinguish data from different positions of the object. This can reduce the required computation during motion estimation and improve the motion estimation results as completely irrelevant information is discarded.
《データ正規化》
データセットのデータ内容を定義された範囲に収め、データ範囲のグローバルな差(汎用的な差)を補正するために、正規化が適用できる。1例としては、強度データが使用される場合の輝度差がある。このような差は、標準的なOCT画像処理のために使用される異なるパラメータや、順次収集のために走査されたオブジェクトまでのOCT装置の距離の差によって生じ得る。この影響は、OCT撮像システムに典型的に見られる、軸方向走査の深さに従って平均信号レベルを低下させる、いわゆる感度ロールオフによって生じ得る。ビネットのような影響によってもまた、ビームに対するデータサンプルの横断方向の位置に依存した輝度差が生じることがある。
<Data normalization>
Normalization can be applied to fit the data content of the data set into a defined range and correct for global differences in data range (general differences). One example is a luminance difference when intensity data is used. Such differences can be caused by different parameters used for standard OCT image processing and differences in the distance of the OCT device to the scanned object for sequential acquisition. This effect can be caused by so-called sensitivity roll-off, which is typically seen in OCT imaging systems and reduces the average signal level according to the axial scan depth. Vignette-like effects can also cause brightness differences that depend on the transverse position of the data sample relative to the beam.
データ正規化の1例は、平均強度、または正規化後の他の構造データ値がゼロで、強度の分散が1となるように、各データセットの強度分布を正規化することである。これと同様に全データセットを正規化する類似の正規化でも、全データセットに対して強度分布について同様のことを行うであろう。最後に、平均および分散に基づく正規化を、各A走査対して個々に行うことができる。このようにして、輝度の変化をもたらす影響もまた、効果的に補償できる。 One example of data normalization is normalizing the intensity distribution of each data set so that the average intensity or other structured data value after normalization is zero and the intensity variance is one. Similarly, a similar normalization that normalizes the entire data set will do the same for the intensity distribution for the entire data set. Finally, normalization based on mean and variance can be done individually for each A-scan. In this way, the effects that cause changes in brightness can also be compensated effectively.
《データサンプルの選択》
動き補正のための例示の実施形態に対する入力として複数のデータセットを使用する際には、1または複数の入力データセットのための走査パターンが、他の入力に比べて、器具走査座標系の極めて大きい領域をカバーする場合があり得る。動き補正を行う対象である走査座標系の実際の対象領域もまた、各入力データセットのための元のOCTサンプリングパターンによってカバーされた領域の部分領域であるかもしれない。
《Select data sample》
When using multiple data sets as input to the exemplary embodiment for motion correction, the scan pattern for one or more input data sets is much more of the instrument scan coordinate system than the other inputs. It may cover a large area. The actual target area of the scanning coordinate system that is the target for motion correction may also be a partial area of the area covered by the original OCT sampling pattern for each input data set.
この場合、3Dの対象領域は、ユーザ入力によってまたは自動的に定義され得る。例えば、自動での対象領域生成は、サンプリングパターンによって与えられる全ての入力サンプリング領域の共通部分をとることによって、行うことができる。対象領域を表す1つの特定の方法は、器具座標系において、向きを定められた1つ以上のバウンディングボックスとして表すものである。あるいは、ほぼ円形またはほぼ楕円の走査パターンに、より適した形状が使用できる。 In this case, the 3D region of interest may be defined by user input or automatically. For example, automatic target area generation can be performed by taking the common part of all input sampling areas given by the sampling pattern. One particular way of representing a region of interest is to represent it as one or more bounding boxes that are oriented in the instrument coordinate system. Alternatively, a more suitable shape can be used for an approximately circular or approximately elliptical scanning pattern.
対象領域を定義する際、全てのデータサンプルは、それらの走査位置が対象領域の中にあるか否かを認識するために試験することができる。これが特定のサンプルに当てはまらない場合には、それはさらなる処理から除外される。このようにして、重要な領域に随意
に処理を集中させることができる。これによって、同一領域をカバーするOCT画像間の最適化された動き補正が可能になる(このとき、画像の一部はそれよりも極めて大きい領域または極めて小さい領域をカバーしている)。図31は、この原理に基づく網膜撮像における例を示し、ここでは、1つのデータセットが、その他のデータセットよりも、器具空間の極めて大きい領域をカバーしている。これらの領域の共通部分の中にあるデータサンプルは、さらなる処理のために両方のデータセットから選択できる。
In defining the target area, all data samples can be tested to see if their scan position is within the target area. If this is not the case for a particular sample, it is excluded from further processing. In this way, processing can be concentrated arbitrarily on important areas. This allows an optimized motion correction between OCT images covering the same area (where part of the image covers a much larger or very small area). FIG. 31 shows an example of retinal imaging based on this principle, where one data set covers a much larger area of instrument space than the other data set. Data samples that fall within the intersection of these regions can be selected from both data sets for further processing.
《調整不良の補償》
眼科などのOCT撮像の特定の応用例では、撮像ビームは、目の角膜およびレンズなどのレンズ様物体を通過してから、網膜などの実際の対象オブジェクトに当たる。この場合、この生物学的レンズが、実際にOCTビームを網膜に集める。このような状況では、OCTビームが角膜に中央で当たった場合に、OCT画像は網膜の表面の比較的均一な(平坦な)ビュー(像)を映すであろう。一方、ビームが角膜に中央で当たらなかった場合には、横断方向の走査範囲の両端で相対的な光路長の差が生じる。これらの長さの差によって、網膜上のビューは、ビームが中央位置で角膜に当たった場合と比較して傾いているであろう。相対的な調整におけるこのような変化は、特に順次データセット収集中に生じ得るので、その表面は、一方のデータセットではまっすぐに見え、他方のデータセットでは傾いて見えることになる。この影響は強調される。なぜなら、OCTデータは、関心のある特徴をよりよく表示するために、データセットの異なるディメンションが伸ばされたり圧縮されたりする、非―均一な縦横比でしばしば表示されることが多いからである。眼科では、OCT画像は、網膜の薄い構造をよりよく表示するために、典型的には軸方向に拡大されて表示される。
<Compensation for poor adjustment>
In certain applications of OCT imaging such as ophthalmology, the imaging beam passes through a lens-like object such as the cornea and lens of the eye and then hits an actual target object such as the retina. In this case, the biological lens actually collects the OCT beam on the retina. In such situations, when the OCT beam hits the cornea in the middle, the OCT image will show a relatively uniform (flat) view of the retina surface. On the other hand, when the beam does not hit the cornea at the center, a relative optical path length difference occurs at both ends of the scanning range in the transverse direction. Due to these length differences, the view on the retina will be tilted compared to when the beam hits the cornea at a central location. Such changes in relative adjustments can occur especially during sequential data set collection, so that the surface will appear straight in one data set and tilted in the other data set. This effect is emphasized. This is because OCT data is often displayed with a non-uniform aspect ratio, where different dimensions of the data set are stretched or compressed to better display the features of interest. In ophthalmology, OCT images are typically displayed enlarged in the axial direction to better display the thin structure of the retina.
この傾斜の影響は、動き推定に問題を引き起こす。なぜなら、動き推定は、この傾斜を強い軸方向動きとして処理し、その強い軸方向動きは、モデル化された動きの目標によってペナルティを与えられるからである。そのため、このような調整不良が深刻な場合には、動き推定ができない。 This tilt effect causes problems in motion estimation. This is because motion estimation treats this tilt as a strong axial motion, and the strong axial motion is penalized by the modeled motion goal. For this reason, when such an adjustment failure is serious, motion estimation cannot be performed.
この傾斜の影響に伴う問題を回避するために、例えば平面をデータセットに当てはめることによって傾斜を推定する、処理ステップを加えることができる。この平面は、各A走査に沿った輝度情報の重心のような、最初に遭遇した高散乱物質などの特徴、または測定値、に当てはめることができる。 In order to avoid the problems associated with this tilt effect, a processing step can be added that estimates the tilt, for example by fitting a plane to the data set. This plane can be applied to features or measurements such as the first highly scattered material encountered, such as the centroid of luminance information along each A scan.
平面が各データセットに当てはめられたら、データが調整されて算出された平面が平坦になるように、データを補正できる。補正は、測定された平面と上記平坦な平面との距離に従って、軸方向にデータを移動させることによって達成できる。傾斜を補償する他の方法もまた使用できることは、言うまでもない。 Once a plane is applied to each data set, the data can be adjusted so that the calculated plane is flattened by adjusting the data. Correction can be achieved by moving the data in the axial direction according to the distance between the measured plane and the flat plane. Of course, other methods of compensating for tilt can also be used.
<動き推定>
《変換のパラメータ化》
本明細書に記載する動き補正の基本的な考えは、変換の集合を見つけることである。入力データセットごとに、1つの独自の変換がある。これらの変換は、各データセット収拾中に記録されたデータを、1つの単一の共通の座標系にマッピングするために使用される。全体としての概念は、この共通空間にマッピングされたデータは、各収集中の動きによって生じた歪み影響がない、ということである。概念的には、これは、データサンプルをスキャナ座標系から走査中のオブジェクトの座標系へ移動することである、と考えられる。また、上記オブジェクト座標系は、スキャナとオブジェクトとの相対的な動きの影響が3つのディメンション全てにおいて補償されたOCTビーム器具座標系である、と考えられる。この単一の座標系を、位置合わせ済または動き補正済の空間または座標系と称する。
<Motion estimation>
<Parameterization of conversion>
The basic idea of motion correction described here is to find a set of transformations. There is one unique transformation for each input data set. These transformations are used to map the data recorded during each data set collection into one single common coordinate system. The overall concept is that the data mapped to this common space is free from distortion effects caused by movement during each acquisition. Conceptually, this can be thought of as moving a data sample from the scanner coordinate system to the coordinate system of the object being scanned. The object coordinate system is considered to be an OCT beam instrument coordinate system in which the influence of the relative movement between the scanner and the object is compensated in all three dimensions. This single coordinate system is referred to as a registered or motion-corrected space or coordinate system.
この状況において、主に2次元のデータセットを収集する走査パターンは、高密度の3Dサンプリングパターンを収集する走査パターンから区別される。2Dタイプのパターンは、横断面において真の2D領域の高密度サンプリングを有さない。3Dタイプのパターンは、器具座標系の横断方向の主に2次元の領域をカバーする。この区別は、入力データセットごとのサンプリングパターンを分析することによって自動的に、またはユーザもしくは走査パターンの設計者によってなされ得る。また、その決定が任意になされ得る境界的な場合もある。基本的に、データセットは、データ点のサンプリングが3D領域をカバーしており、かつデータ補間技術を上手く使用して器具座標系における隣接サンプル間を補間できるほど十分に高密度である場合には、3Dタイプであるとみなされる。例えば、高密度のラスタ走査は3Dタイプ走査とみなされる一方、器具座標系の横断方向の同一の線をカバーしながら繰り返される断面は、2Dタイプ走査とみなされる。 In this situation, scan patterns that primarily collect two-dimensional data sets are distinguished from scan patterns that collect high-density 3D sampling patterns. 2D type patterns do not have high density sampling of true 2D regions in cross section. The 3D type pattern covers a mainly two-dimensional region in the transverse direction of the instrument coordinate system. This distinction can be made automatically by analyzing the sampling pattern for each input data set or by the user or the designer of the scan pattern. In other cases, the decision may be arbitrary. Basically, if the data set is sufficiently dense that the sampling of data points covers the 3D region and can be interpolated between adjacent samples in the instrument coordinate system using data interpolation techniques well. It is considered a 3D type. For example, high density raster scans are considered 3D type scans, while repeated cross-sections covering the same line across the instrument coordinate system are considered 2D type scans.
3Dタイプ走査パターンから2Dタイプを区別する、上記定義に基づき、変換の必要条件を以下に記述する。2Dタイプ走査では、1つの変位ベクトルは、問題の画像の全てのデータサンプルに関連付けられている。一般的な場合、この変位ベクトルは3Dである。全ての入力画像が同一走査パターンを有する2Dタイプのものである場合、横断方向の1つのディメンションを変位ベクトルから省略でき、その結果、2D変位ベクトルとなる。 Based on the above definition that distinguishes 2D types from 3D type scan patterns, the conversion requirements are described below. In 2D type scanning, one displacement vector is associated with all data samples of the image in question. In the general case, this displacement vector is 3D. If all input images are of the 2D type with the same scan pattern, one dimension in the transverse direction can be omitted from the displacement vector, resulting in a 2D displacement vector.
入力データセットの3Dタイプのデータセットの集合から、動き補正済空間におけるサンプル位置の共通集合が選択される。1例として、これらの位置は、器具座標系における対象領域にわたって規則正しく間隔をとったグリッドとして選択できる。3Dタイプの全てのデータセットが規則正しく間隔をとったサンプル点の同一の集合を含むという特別な場合では、この集合は、直接選択できる。この条件は、サンプリング点が既に互いに合っているので、いずれでも満たされ得る。このような場合はまた、複数のパターンが異なる領域およびカバー範囲を有する場合にも起こり得る。サンプル点の異なる間隔が、前処理ステップ、データサンプリングの選択、およびデータセットの再スケーリングを通じて適応できる。 A common set of sample positions in the motion corrected space is selected from a set of 3D type data sets of the input data set. As an example, these positions can be selected as a regularly spaced grid across the region of interest in the instrument coordinate system. In the special case where all 3D type data sets contain the same set of regularly spaced sample points, this set can be selected directly. This condition can be satisfied in any case since the sampling points already match each other. Such a case can also occur when a plurality of patterns have different areas and coverage areas. Different spacings of sample points can be accommodated through preprocessing steps, data sampling selection, and data set rescaling.
各3Dタイプのデータセットに関連付けられた変換は、2Dまたは3Dの変位ベクトルを、(これもまたシフトが変わらないことに依存するが)、動き補正済座標系で選択された少なくとも各サンプル点に、関連付けることが可能であるべきである。概念的には、これらの変換のそれぞれは、その関連付けられたデータセットからのデータをその走査座標系からオブジェクト座標系にマッピングする。 The transformation associated with each 3D type data set converts a 2D or 3D displacement vector (although again depending on the shift not changing) to at least each sample point selected in the motion corrected coordinate system. Should be possible to associate. Conceptually, each of these transforms maps data from its associated data set from its scanned coordinate system to the object coordinate system.
動き補正において使用する変換のそれぞれは、多くの異なる方法でパラメータ化できる。その例には以下が含まれるが、これに限定されるものではない:変位ベクトルの集合としての直接的パラメータ化、多次元多項式を使用するパラメータ化、スプライン、b−スプラインもしくはサンプル時間における同様のパラメータ化、または2Dおよび3Dのリジッド変換もしくはアフィン変換。変換が評価されるべき位置の集合の部分集合については、他の互いに素な部分集合のためのものとは異なるパラメータ化を使用できる。選択の仕方によってはさらに良い結果になることがあるが、一般には、先に特定された位置で評価され得る変換は、いかなるものも、動き補正のために使用できる。 Each of the transforms used in motion compensation can be parameterized in many different ways. Examples include, but are not limited to: direct parameterization as a set of displacement vectors, parameterization using multidimensional polynomials, spline, b-spline or similar in sample time Parameterization or 2D and 3D rigid or affine transformation. For a subset of the set of positions for which the transformation is to be evaluated, a different parameterization can be used than for other disjoint subsets. In general, any transformation that can be evaluated at the previously specified positions can be used for motion correction, although some choices may yield better results.
先の説明で記述した変換の扱い方とは異なり、変換を設定する他の主要な方法が存在する。この別法において、3Dタイプのデータセットのための変換は、2Dタイプのセットの場合と同様に扱われる。これは、他の領域についても、主にデータセット類似度計算に関して、当てはまる。この別法を使用すると、データセット類似度測定は、基礎となる走査パターンが規則的なグリッド上にあったときでさえも、不規則なグリッド上でサンプリングを常に行わなければならない。なお、変換を設定するこの別法は、本明細書に記載する方法およびシステムによって使用され得る。 Unlike the conversion handling described above, there are other major ways to set up the conversion. In this alternative, the transformation for a 3D type data set is handled in the same way as for a 2D type set. This is also true for other regions, mainly with respect to dataset similarity calculations. Using this alternative, the dataset similarity measure must always be sampled on an irregular grid, even when the underlying scan pattern was on the regular grid. It should be noted that this alternative method of setting up transformations can be used by the methods and systems described herein.
《データ補間》
データセット値を共通のオブジェクト座標系にマッピングするために、データ補間技術が必要である。データの値は、そのデータのみが点の有限集合においてのみ定義される、任意の位置において生成されなければならない。このデータは、例えば、器具座標系における一定の複数の座標点で定義される強度データであってよい。また、各データサンプルに関連付けられた時刻は、ここでは、器具座標系におけるデータサンプル位置ごとでのデータ値と考えられる。
<Data interpolation>
Data interpolation techniques are required to map data set values to a common object coordinate system. The value of the data must be generated at any position where only that data is defined only in a finite set of points. This data may be intensity data defined by a plurality of coordinate points in the instrument coordinate system, for example. In addition, the time associated with each data sample is considered as a data value at each data sample position in the instrument coordinate system.
一般に、各入力データセットの器具座標系におけるデータセットのサンプリング点の位置、およびその関連付けられた時刻情報、ならびに位置合わせ座標系における、選択されたサンプル位置の集合によって、データサンプルの不規則な2Dまたは3Dのグリッドが構成される。このようなグリッド上に、クリギング(kriging)補間や逆距離加重法(inverse distance weighting)など、種々の既知の技術を使用して、データが補間され得る。データ点位置の集合が少なくとも一部のデータについて規則的な2Dまたは3Dのグリッドを特定する特有の場合には、例えば最近隣法、バイリニア、トリリニア、キュービックもしくはより高次のスプラインまたはb−スプライン補間などの、標準的な技術を使用できる。 In general, the random 2D of a data sample depends on the position of the sampling point of the data set in the instrument coordinate system of each input data set, and its associated time information, and the set of selected sample positions in the alignment coordinate system. Or a 3D grid is constructed. On such a grid, data can be interpolated using various known techniques, such as kriging interpolation and inverse distance weighting. In the specific case where the set of data point locations identifies a regular 2D or 3D grid for at least some data, eg nearest neighbor, bilinear, trilinear, cubic or higher order splines or b-spline interpolation Standard techniques can be used.
《グローバルな目的関数》
動き補正方法は、最適化スキームの各ステップにおいて全ての利用可能な情報を考慮に入れることが可能な、目的ベースの手法を使用して、上述した変換を推定する。これらの目的または目標を以下に記述する。これらの目的を組み合わせる方法の例も示す。
《Global objective function》
The motion correction method estimates the transform described above using an objective-based approach that can take into account all available information at each step of the optimization scheme. These objectives or goals are described below. An example of how to combine these objectives is also presented.
《画像類似度目標》
個別に見ると、動き補正の1つの目標は、動き補正済空間に画像データを移動する変換を適用した後に、入力または前処理されたデータセットのいくつかのペアの間の類似度が最大化されるような、変換を見つけることである。本目的または目標は以下の段落に別途記載するが、この目的または目標は、動きを考慮する後述の他のカウンターバランス目標(釣り合わせる目標)とともに評価されなければならないことは、言うまでもない。
《Image similarity target》
Viewed separately, one goal of motion correction is to maximize the similarity between several pairs of input or preprocessed data sets after applying a transform that moves the image data into the motion corrected space. Is to find a transformation. This purpose or goal is described separately in the following paragraphs, but it goes without saying that this purpose or goal must be evaluated along with other counterbalance goals (balanced goals) that will be discussed below.
考慮する特定のデータセットのペアに従って、手法は異なってもよい。3Dタイプの2つのデータセットを比較する場合、各データセットについての現在の変換推定値を使用して、各画像からの画像データを動き補正済空間へと変換する。3Dタイプのデータセットごとにデータ点の同一の集合が選択されるので、これによって、当該ペアの各データセットについて、動き補正済空間における共通の位置にデータサンプルの集合が生成される。次いで、これら変換後の画像は、同一のサンプリング位置からのデータ値のペア、または同一位置からの各データ点ペアの周囲の空間の近傍部の値を勘案して、類似度に関して評価され得る。この情報に適用される特定の類似度測定が両サイドを対称に扱うことを条件として、3Dタイプの2つのデータセット間の類似度の全体評価は対称になる。 Depending on the particular data set pair to be considered, the approach may vary. When comparing two 3D type data sets, the current transformation estimate for each data set is used to transform the image data from each image into a motion corrected space. Since the same set of data points is selected for each 3D type data set, this generates a set of data samples at a common position in the motion corrected space for each data set of the pair. These transformed images can then be evaluated for similarity considering a pair of data values from the same sampling location, or a value in the vicinity of the space around each data point pair from the same location. The overall evaluation of the similarity between two 3D type data sets is symmetric, provided that the specific similarity measure applied to this information treats both sides symmetrically.
3Dタイプのデータセットが2Dタイプのデータセットとペアになっている場合には、その3Dタイプのデータセットは前述の場合と同様に変換される。次いで、2Dタイプのデータセットのデータサンプル位置ごとに、データ補間ステップが行われる。このデータ補間ステップは、動き補正済空間に位置する3Dタイプのデータセットの潜在的に不規則なグリッドを、2Dデータセットからの各データサンプルが位置合わせ済空間にマッピングされる位置において、サンプリングする。その結果、2Dタイプのデータセットからの各データサンプルに匹敵するデータサンプルと、器具座標系における2Dタイプのデータセットのサンプリングパターンから生じる空間近傍値が生成される。2Dタイプのデータセットと3Dタイプのデータセットとの類似度を比較するために生成されたデータサンプルのペアは、同一である。 When a 3D type data set is paired with a 2D type data set, the 3D type data set is converted in the same manner as described above. A data interpolation step is then performed for each data sample position of the 2D type data set. This data interpolation step samples a potentially irregular grid of 3D type data sets located in motion compensated space at the location where each data sample from the 2D data set is mapped to the aligned space. . As a result, data samples comparable to each data sample from the 2D type data set and spatial neighborhood values resulting from the sampling pattern of the 2D type data set in the instrument coordinate system are generated. The pairs of data samples generated to compare the similarity between the 2D type data set and the 3D type data set are identical.
次いで、おそらく近傍情報を含むデータペアの全体集合が、これら2つの画像の間の類似度評価および最大化のために使用できる。使用できる類似度測定の例には、以下のものが含まれる:差の二乗和(SSD)、相互相関、相互情報(mutual information)および領域相互情報(region mutual information)などの方法。一般性を損なうことなく、この類似度測定は、問題の2つのデータセット間の類似度が高ければ高いほど大きい実数値の値をもたらすと想定される。 The entire set of data pairs, possibly including neighborhood information, can then be used for similarity evaluation and maximization between these two images. Examples of similarity measures that can be used include: methods such as sum of squares of differences (SSD), cross-correlation, mutual information, and region mutual information. Without loss of generality, this similarity measure is assumed to yield a higher real value as the similarity between the two data sets in question is higher.
データセットのペアに作用する類似度値に加えて、同一タイプの3セット以上を一度に勘案する測定も使用できる。この1例は、オブジェクト空間内の対応する位置におけるデータセット値の分散にペナルティを与えるというものである。 In addition to similarity values acting on pairs of data sets, measurements that take into account three or more sets of the same type at once can also be used. One example of this is penalizing the variance of data set values at corresponding positions in the object space.
《画像ペアリングスキーム》
使用する類似度測定がデータセットのペア間の類似度測定をサポートするだけの場合、関心対象である一定の類似度を測定するために、特定のペアリングスキーム(対にする技法)が使用される。最も単純かつ可能なスキームは、利用可能なデータセット間の全ての可能な組み合わせを測定することである。これは、N個の異なるデータセットごとにN×N個という程度の多くの測定につながる。
《Image pairing scheme》
If the similarity measure used only supports similarity measures between pairs of data sets, a specific pairing scheme (pairing technique) is used to measure a certain similarity of interest. The The simplest and possible scheme is to measure all possible combinations between available data sets. This leads to as many measurements as N × N for every N different data sets.
2よりも膨大に多い数のデータセットを位置合わせするためには、これらの測定値を評価するためのコストが、計算の観点から高くつきすぎることがある。このため、利用可能性を有する部分集合のみをペアにする他のスキームが、使用可能である。この状況では、同一または類似した走査パターンを有するデータセットをペアにするよりも、実質的に相補的な走査パターンを有するデータセットをペアにする方を優先させるのが有利である。 In order to align a huge number of data sets than two, the cost of evaluating these measurements may be too high from a computational point of view. Thus, other schemes can be used that only pair with a subset that has availability. In this situation, it is advantageous to pair data sets having substantially complementary scan patterns over pairs of data sets having identical or similar scan patterns.
《変換によってモデル化される制限された動きという目標》
動き補正の他の目的は、再度個別に認識した場合、以下のとおりである。すなわち、推定されるべき変換によってモデル化されるような、データセット収集中の時間に関するOCTスキャナとオブジェクトとの相対的な動きが、何らかの定義によって低減される場合、補正問題に対する解はより良好になる、というものである。本目的または目標は以下の段落に別途記載するが、この目的または目標は、変換後の状態における類似度を考慮する先述したカウンターバランス目標とともに評価されなければならないことは言うまでもない。
《Target of limited movement modeled by transformation》
The other purpose of motion correction is as follows when it is individually recognized again. That is, the solution to the correction problem is better if the relative motion between the OCT scanner and the object with respect to time during data set collection as modeled by the transformation to be estimated is reduced by some definition It will be. This purpose or goal is described separately in the following paragraphs, but it goes without saying that this purpose or goal must be evaluated with the counterbalance goal described above that takes into account the similarity in the converted state.
変換は、3Dタイプのデータセットのためのオブジェクト空間でも、2Dタイプのデータセットのための走査座標系でも、複数の一定のサンプリング点で評価可能に定義されることを想起されたい。これらのサンプリング点に関連付けられているのは、時刻値である。2Dタイプのデータセットにおいて、時刻値は、評価可能な点が元のサンプリング点である場合には直接関連付けられるか、または、必要な位置で元の時間構造情報を補間することによって生成される。3Dタイプのデータセットの場合、時刻情報は、器具座標系における評価可能な点の座標でのデータセットのサンプリングパターンによって与えられるような、元の時間構造をサンプリングすることによって生成できる。 Recall that the transformation is defined such that it can be evaluated at a plurality of constant sampling points, either in object space for 3D type datasets or in a scanning coordinate system for 2D type datasets. Associated with these sampling points are time values. In a 2D type data set, the time value is directly associated if the evaluable point is the original sampling point, or is generated by interpolating the original time structure information at the required position. For 3D type data sets, time information can be generated by sampling the original time structure, as given by the data set's sampling pattern at the coordinates of the evaluable points in the instrument coordinate system.
変換を評価すべきすべての点において利用可能なおおよその時刻情報が現在あるので、変換の集合は、2Dまたは3Dにおける変位ベクトルをある時点に関連付ける関係である、とみなすことができる。ここで、「時刻(時点)」とは絶対時刻を意味し、単一のデータセット収集での時間ではない。これは、マルチビーム収集の場合をサポートするのに必要である。マルチビーム走査が行われない場合は、例えば各データセット収集の開始に対する相対時刻で十分である。一般に、おおよその時刻はまた、OCT装置自体がこの情報を直接提供しない場合には、例えば走査面積、走査サンプリング、装置の収集速度などの、走査パターンおよび装置に関する一般に利用可能な情報から算出できる。いかに変換が設定されるかについての推論から、時刻が等しい場合には、全ての変換は同一の変位ベクトルを生成する、という制約が生まれる。また、この制約により、マッピングを時間に関する2Dまたは3Dの関数として扱うことができる。 Since there is currently approximate time information available at all points where the transformation should be evaluated, the set of transformations can be considered as a relationship that associates a displacement vector in 2D or 3D with a point in time. Here, “time (point in time)” means absolute time, not the time for collecting a single data set. This is necessary to support the case of multi-beam acquisition. If multi-beam scanning is not performed, for example, a relative time relative to the start of each data set acquisition is sufficient. In general, the approximate time can also be calculated from commonly available information about the scan pattern and the device, such as, for example, scan area, scan sampling, device collection rate, etc., if the OCT device itself does not provide this information directly. From the reasoning about how the transformations are set, the constraint arises that if the times are equal, all transformations produce the same displacement vector. This constraint also allows the mapping to be treated as a 2D or 3D function over time.
例えば有限差分法を使用することにより、数値近似を使用して、時間についてのこの関数の勾配を推定できる。変換の変位ベクトルが、ある時点でのスキャナとオブジェクトとの相対位置をモデル化するので、勾配は、相対位置の変化を表し、このため、動きを表す。 For example, by using a finite difference method, a numerical approximation can be used to estimate the slope of this function over time. Since the displacement vector of the transformation models the relative position of the scanner and the object at a point in time, the gradient represents the change in the relative position and thus represents the movement.
撮像装置も走査されたオブジェクトも、ゼロでない質量を有すると考えられる。これは、両方の物体の相対速度には上限があること、および一定時間枠内の相対位置の変化には物理的な制限があることを示唆する。通常、相対速度に対しては、さらなる仮定がなされ得る。この仮定も、一定時間枠内のスキャナとオブジェクトとの相対位置の予想される変化を制限する。眼科撮像の場合、サッケードからの目の動きは、極めて迅速に起こり、時間的に不連続な動きを生じる可能性がある。しかし、複数のサッケードは次から次へは起こらないため、動きは一定の限界内にある。モデル化された動きを考慮する第2の目的は、動きの限界を表すこれらの事実を考慮に入れるように、推定される変換が見つけられることを、確実にすることである。 Both the imaging device and the scanned object are considered to have a non-zero mass. This suggests that there is an upper limit on the relative speed of both objects and that there is a physical limit on the relative position change within a certain time frame. Usually, further assumptions can be made about the relative velocity. This assumption also limits the expected change in the relative position of the scanner and the object within a certain time frame. In the case of ophthalmic imaging, eye movement from a saccade can occur very quickly and can result in temporally discontinuous movement. However, since multiple saccades do not occur from one to the next, movement is within certain limits. The second purpose of considering modeled motion is to ensure that the estimated transformation is found to take into account these facts representing the limits of motion.
データ収集全体におけるトータルな動きを測定する最も基本的な方法は、全収集時間の最初から最後までの上記勾配にノルムを積分することである。この積分を評価する1つのおおよその方法は、サンプル点間の時間差によって重み付けしたノルムを適用した結果として生じる値を、合計することによる。さらに、所望の効果は、例えば、各加算部の、各勾配ベクトルの個々の成分に任意の単調増加関数を適用することによって、ノルム適用の結果に任意の単調増加関数を適用することによって、および時間差重み係数に任意の単調増加関数を適用することによって、維持できる。 The most basic way to measure the total movement in the entire data collection is to integrate the norm into the gradient from the beginning to the end of the total acquisition time. One approximate way to evaluate this integral is by summing the values that result from applying a norm weighted by the time difference between the sample points. Further, the desired effect can be achieved, for example, by applying an arbitrary monotonically increasing function to the individual components of each gradient vector of each adder, by applying an arbitrary monotonically increasing function to the result of norm application, and It can be maintained by applying an arbitrary monotonically increasing function to the time difference weighting factor.
このようにして、測定値を生成することができ、その最小化は、全収集時間の間、変換によってモデル化される動きを最小化する。この測定値に任意の単調減少関数を適用すると、最大化問題につながる。この結果として生じる測定値を、以下のセクションでは正則化項値と称する。 In this way, measurements can be generated and their minimization minimizes the movement modeled by the transformation during the entire acquisition time. Applying an arbitrary monotonically decreasing function to this measurement leads to a maximization problem. This resulting measurement is referred to as a regularization term value in the following sections.
≪目的の組み合わせ≫
良好な動き補正結果に到達可能にするためには、これら2つの前述した目的を、個別に考慮すべきではない。代わりに、この2つのおそらく相反する目標のバランスを見つけるべきである。
≪Combination of purpose≫
In order to be able to reach a good motion correction result, these two aforementioned objectives should not be considered individually. Instead, you should find a balance between these two possibly conflicting goals.
そのための1つの直接的な方法は、これら目的の評価から生じる2つの測定値を合計することである。他の例示の手法には、両測定値の商をとることである。両方の目標の間の相対的な重み付けを提供するために、合計の前に、測定値のうちの1つによって乗算される正の係数を導入する。一般性を損なうことなく、この係数は、正則化項測定に適用でき、このため、正則化項重み係数と称する。 One direct way to do this is to sum the two measurements resulting from these objective assessments. Another exemplary approach is to take the quotient of both measurements. In order to provide a relative weighting between both goals, we introduce a positive factor multiplied by one of the measurements before the sum. Without loss of generality, this coefficient can be applied to regularization term measurements and is therefore referred to as a regularization term weighting factor.
図32は、本発明の方法によって使用される例示の目的関数を評価する処理3200を示すフローチャートである。ステップ3202a、3204aおよび3206aのそれぞれにおいて、変換1、データセット1および走査パターン1がそれぞれ入力として用いられる。ステップ3202b、3204bおよび3206bのそれぞれにおいて、変換2、データセット2および走査パターン2がそれぞれ入力として用いられる。ステップ3212では、変換1および走査パターン1が、変換2および走査パターン2と比較されて、オブジェクトと走査器具との間の推定された動きにペナルティが与えられる。ステップ3214では、変換1およびデータセット1が、それぞれ変換2およびデータセット2と比較されて、2つの変換と2つのデータセットとの間の類似度にフェイバが与えられる。ステップ3216では、動き推定ペナルティと類似度との相対的強弱度を査定することによって、目的関数が評価される。
FIG. 32 is a flowchart illustrating a
処理3200は、変換c〜N、データセットc〜N、および走査パターンc〜Nに作用するさらなるステップを含むことができる。
図32を参照して、類似度を最大化または最適化する目標は、画像データセットを読み込み、対応する変換をそのセットに適用する。次いで、補間されたセット間の類似度が、評価され最大化され得る。同時に、動きを制限する目標または動きにペナルティを与える目標は、各データセットの収集のために使用されたサンプリングパターンの形式での入力データと、各セットのための現在の変換とを使用する。両方の目標の組み合わせにより、各データセットの収集中の相対的な動きを正確にモデル化するであろう変換の集合を見つけることができる。この組み合わせはまた、両方の目標の間で折り合いをつけることを示唆する。なぜなら、各目標を単独で考慮したのでは満足な解が得られそうにないからである。 Referring to FIG. 32, the goal of maximizing or optimizing similarity reads an image data set and applies the corresponding transformation to that set. The similarity between the interpolated sets can then be evaluated and maximized. At the same time, the goal to limit or penalize motion uses the input data in the form of the sampling pattern used for the collection of each data set and the current transformation for each set. The combination of both goals can find a set of transformations that will accurately model the relative movement during the collection of each data set. This combination also suggests a compromise between both goals. This is because a satisfactory solution is unlikely to be obtained if each target is considered alone.
なお、目的関数はまた、上述したように、2つの主な目的以外にさらなる目標を組み込むことができる。例えば、別の項を使用して、変換後の状態におけるデータ値の空間的連続性にフェイバを与えることができる。これは、入力データセットの少なくとも1つが、あるオブジェクト領域の高密度サンプリングまたはオーバーサンプリングを有する3Dタイプデータセットである場合に、有用である。この高密度サンプリングにより、正しく動き補正されたデータセットの構造情報は、ローカルには空間的に滑らかであるはずである。ラスタ走査の場合、例えば、変換後の状態の隣接するB走査間の高い類似度には、フェイバを与えることができる。画像類似度の目標とモデル化された動きの目標とを組み合わせたのと同様のやり方で、さらなる項を目的関数に組み込むことができる。なお、本明細書に記載する方法およびシステムはこの目標や他のさらなる目標を使用できる。 It should be noted that the objective function can also incorporate additional goals in addition to the two main objectives, as described above. For example, another term can be used to give a flavor to the spatial continuity of the data values in the transformed state. This is useful when at least one of the input data sets is a 3D type data set with high density sampling or oversampling of an object region. Due to this high-density sampling, the structure information of the data set that has been correctly motion-corrected should be locally spatially smooth. In the case of raster scanning, for example, a fiber can be given to a high degree of similarity between adjacent B scans in a converted state. Additional terms can be incorporated into the objective function in a manner similar to the combination of the image similarity goal and the modeled motion goal. It should be noted that the methods and systems described herein can use this goal and other additional goals.
≪多重解像度最適化≫
目的関数の勾配ベクトルは、分析的に、または有限差分のような近似法を使用することによって、算出できる。これらの算出は、変換パラメータ化、データセットの類似度測定、動き最小化目標の公式、および他の要素の特定の選択に依存する。
≪Multi-resolution optimization≫
The gradient vector of the objective function can be calculated analytically or by using an approximation method such as finite difference. These calculations depend on transformation parameterization, data set similarity measurements, motion minimization goal formulas, and specific choices of other factors.
利用可能な情報に基づいて、目的関数は、特定の目的関数の公式に依存して、最適化(すなわち、最小化または最大化)できる。この最適化を行うために、種々の反復的非線形オプティマイザが使用できる。このオプティマイザには、非線形共役勾配法、Limited memory Broyden-Fletcher-Goldfarb-Shannoとしても知られるL-BFGSなどのニュートンおよび準ニュートン法などが含まれる。なお、目的関数の勾配の評価を必要としない他の最適化法を使用することもまた、本明細書に記載する方法および装置によって採用され得る。 Based on the available information, the objective function can be optimized (ie, minimized or maximized) depending on the particular objective function formula. Various iterative non-linear optimizers can be used to perform this optimization. This optimizer includes nonlinear conjugate gradient methods, Newton and quasi-Newton methods such as L-BFGS, also known as Limited memory Broyden-Fletcher-Goldfarb-Shanno. It should be noted that the use of other optimization methods that do not require evaluation of the gradient of the objective function can also be employed by the methods and apparatus described herein.
最適化の初めに、パラメータ空間の起点が選択される。変換を初期化する1つの方法は、相対的な動きが画像取得中に生じなかったことを示唆する点から始めることによる。これは、結果として生じる全ての変位ベクトルに零ベクトルが割り当てられるように、変換を初期化することを示唆する。初期化の他の可能性としては、異なる設定で行われた前の動き推定の結果を使用する。例えば、初期化は、特に、異なるデータセット類似度測定設定または異なるデータセット変換などを有する推定処理からの解をマッピングすることによって、行うことができるであろう。この枠組を使用することにより、リジッド変換のみを使用した動き補正結果が、大まかな推定に用いられることができる。これにより、次の推定処理の結果を改善できる。この処理はまた、数回行うことができる。計算すべき変換を初期化する他の方法は、収集中に生じた1つ以上のディメンションにおけるオブジェクトとスキャナとの相対的な動きの少なくとも大まかな推定を提供するのに適した、さらなるデータ源を利用する。例えば、OCT装置に組み込まれた眼底カメラを使用して、撮像中のオブジェクトの2次元の画像を記録することができる。ここで、相対的な横断方向の動きがあれば、眼底カメラによって撮像される領域が、収集中に動かされるであろう。1つのフレームから次のフレームへと起こる撮像された領域内のこれらのシフトは、連続した眼底画像にリジッド画像位置合わせ技術を使用して推定できる。これらのシフトは、あるビデオフレームに対応する点において同時に取り込まれたOCTデータセットの変換を初期化するために、使用できる。一般にOCTのA走査速度はビデオ速度に比べて極めて速いため、データ補間技術を使用して、ビデオフレーム時点に対応する時点間の変位値を補間して、完全に初期化された変換を提供することができる。この補間を含む補助の動き測定システムは、動き補正の処理時間の低減に役立ち、その精度を高める。なぜなら、初期化によって、その方法が、動きについてのさらなる情報を利用できるようになるからである。なお、同様の初期化スキームが、ビデオ眼底カメラ以外のデータ源とともに使用できる。 At the beginning of the optimization, the starting point of the parameter space is selected. One way to initialize the transformation is by starting from a point that suggests that no relative movement occurred during image acquisition. This suggests initializing the transformation so that all resulting displacement vectors are assigned a zero vector. Another possibility for initialization is to use the results of previous motion estimation performed with different settings. For example, initialization could be done by mapping solutions from estimation processes that have different data set similarity measure settings or different data set transformations, among others. By using this framework, a motion correction result using only rigid transformation can be used for rough estimation. Thereby, the result of the next estimation process can be improved. This process can also be performed several times. Other methods of initializing the transformation to be calculated provide additional data sources suitable for providing at least a rough estimate of the relative movement of the object and the scanner in one or more dimensions that occurred during the acquisition. Use. For example, a fundus camera built into the OCT apparatus can be used to record a two-dimensional image of the object being imaged. Here, if there is relative transverse movement, the region imaged by the fundus camera will be moved during acquisition. These shifts in the imaged region that occur from one frame to the next can be estimated using a rigid image registration technique on successive fundus images. These shifts can be used to initialize the conversion of the OCT data set captured at the same time at a point corresponding to a video frame. Since the OCT A scan rate is typically much faster than the video rate, data interpolation techniques are used to interpolate the displacement values between the time points corresponding to the video frame time points to provide a fully initialized transform. be able to. This auxiliary motion measurement system including interpolation helps reduce the processing time of motion correction and increases its accuracy. This is because the initialization allows the method to use more information about the movement. Note that a similar initialization scheme can be used with data sources other than video fundus cameras.
一般に、非凸関数に対する非線形最適化は、開始位置のある領域(いわゆる吸引領域(region of attraction))内のローカルな最適値を見つけるだけであろう。この問題を緩和し、必要な計算を低減できる可能性のある1つの方法は、いわゆる多重解像度最適化を使用する。概念的には、前の推定を次の最適化の初期化に使用することに似ているが、この実施形態は、動き推定作業の複数の表現に作用する。減少していく複雑度を有する一定数の表現が、最終結果の所望の複雑度を有する1つの元表現から生成される。ここで、複雑度とは、所与のレベルでデータセット変換を記述するのに使用される、パラメータの数または自由度を指す。作用対象のデータ量もまた、この技術によって低減できる。 In general, non-linear optimization for non-convex functions will only find local optimal values in a region with a starting position (so-called region of attraction). One method that could alleviate this problem and reduce the required computation uses so-called multi-resolution optimization. Conceptually, it is similar to using the previous estimate to initialize the next optimization, but this embodiment operates on multiple representations of motion estimation tasks. A fixed number of representations with decreasing complexity is generated from one original representation with the desired complexity of the final result. Here, complexity refers to the number of parameters or degrees of freedom used to describe a dataset transformation at a given level. The amount of data to be acted upon can also be reduced by this technique.
複雑度を低減する例としては、3Dタイプのデータセットの集合のための位置合わせ座標系において、連続的に共通性が小さいサンプル点を選択する方法があるが、これに限らない。2Dタイプのデータセットの場合、推定に使用されるデータ点の数もまた、連続的に低減できる。これは、スペクトル型または波長掃引型のOCTの場合には、サンプリング時間の増加によって与えられる方向と軸方向との両方でデータセットをダウンサンプリングすることによって行われる。サンプリング点の数とともに、例えば変位場として直接パラメータ化を使用するなど、個々の変換に使用されるパラメータの数は、一定の場合には、低減される。これは、変換を行わなければならないデータ点が、より少ないからである。さらに、複雑度レベルごとに、動き補正最適化手順のための構成パラメータの別箇の集合を有してもよい。 As an example of reducing the complexity, there is a method of continuously selecting sample points having a low commonality in an alignment coordinate system for a set of 3D type data sets, but is not limited thereto. For 2D type data sets, the number of data points used for estimation can also be reduced continuously. This is done by down-sampling the data set in both the axial and axial directions given by increasing the sampling time in the case of spectral or wavelength-swept OCT. Along with the number of sampling points, the number of parameters used for each transformation, for example using direct parameterization as a displacement field, is reduced in certain cases. This is because there are fewer data points to be converted. In addition, each complexity level may have a separate set of configuration parameters for the motion correction optimization procedure.
多重解像度最適化を行うための1つの必要条件は、異なる複雑度レベルに対して同一のデータセットに関連付けられた変換、変換パラメータ化、および他の設定が、別の複雑度レベルの変換にマッピング可能であることである。その他の複雑度レベルもまた、おそらく、異なる基礎の変換パラメータ化のタイプを有する。これを達成する1つの方法は、まず、変換を、その入力構成から、同一の複雑度レベルの直接パラメータ化に移行する。これは、変換の評価が可能な点の集合において当該変換を評価することによって行うことができる。結果として生じる変位ベクトルの集合は、直接パラメータ化を構成する。以下では、この直接パラメータ化は、移行先複雑度レベルにおけるサンプリング点の集合のための直接パラメータ化に、マッピングすることができる。これは、直接パラメータ化を、一般に不規則なグリッドに結び付けられた、2または3のチャネルデータセットとして扱うことにより、達成できる。データ補間技術を使用してこのデータセットを目標複雑度レベルによって定義されるサンプリング点でサンプリングすることにより、目標複雑度での直接にパラメータ化された近似変換を得ることができる。最終ステップとして、この直接変換は、例えば最小二乗法手法を使用して、目標パラメータ化に投影できる。具体的な場合では、この手順のいくつかのステップは、不要かもしれず、あるいは結合してもよい。 One requirement for multi-resolution optimization is that transformations, transformation parameterizations, and other settings associated with the same data set for different complexity levels map to transformations at different complexity levels It is possible. Other complexity levels also probably have different basic transformation parameterization types. One way to achieve this is to first move the transformation from its input configuration to direct parameterization at the same complexity level. This can be done by evaluating the transformation on a set of points where the transformation can be evaluated. The resulting set of displacement vectors constitutes a direct parameterization. In the following, this direct parameterization can be mapped to a direct parameterization for a set of sampling points at the destination complexity level. This can be achieved by treating direct parameterization as two or three channel data sets, typically tied to an irregular grid. By sampling this data set at a sampling point defined by the target complexity level using data interpolation techniques, a direct parameterized approximate transformation at the target complexity can be obtained. As a final step, this direct transformation can be projected onto the target parameterization using, for example, a least squares approach. In specific cases, some steps of this procedure may be unnecessary or may be combined.
異なる複雑度レベルを前もって生成したり、必要なサブデータをオンデマンドで計算したりすることができる。次いで、典型的な多重解像度手順が以下のように進行する。変換の初期化集合が与えられると、その集合は、最も低い複雑度レベルにマッピングされる。次いで、反復的数値最適化が、先述した技術またはその他の技術のうちの1つを用いて、最も低い複雑度レベルで行われる。典型的には、反復の一定最大数が最適化のために特定され、その後、最後のパラメータ集合が、結果として使用される。あるいは、最適化をこれより前に中止してもよい。例えば、目的関数値、または目的関数の勾配ベクトル上のあるノルムに単調増加関数を適用した結果として生じる値が、ある反復から次の反復へ移っても、もはや有意に変化しない場合などである。また、他の終了判断基準を適用してもよい。現在のレベルでの最適化が終わった後、結果として生じる変換は、次の選択されたレベルの対応する変換の複雑度およびパラメータ化にマッピングされる。典型的には、選択される次のレベルは、次に高い複雑度を有するものである。しかし、より複雑なレベルのための解が、より複雑でないレベルの初期化に再度マッピングされてもよい。この処理は、元の問題の複雑度についての解に達するまで、複数回繰り返えされることができる。 Different complexity levels can be generated in advance or the necessary sub-data can be calculated on demand. A typical multi-resolution procedure then proceeds as follows. Given an initial set of transforms, that set is mapped to the lowest complexity level. An iterative numerical optimization is then performed at the lowest complexity level using one of the techniques described above or other techniques. Typically, a fixed maximum number of iterations is identified for optimization, and then the last parameter set is used as a result. Alternatively, the optimization may be stopped before this. For example, the objective function value, or the value resulting from applying a monotonically increasing function to a norm on the gradient vector of the objective function, no longer changes significantly from one iteration to the next. Further, other end determination criteria may be applied. After optimization at the current level, the resulting transform is mapped to the corresponding transform complexity and parameterization at the next selected level. Typically, the next level chosen is the one with the next highest complexity. However, solutions for more complex levels may be remapped to less complex levels of initialization. This process can be repeated multiple times until a solution for the complexity of the original problem is reached.
《解補正ステップ》
行うことのできる任意の処理ステップは、解補正ステップである。これは、各数値最適化反復の後、および/または、いくつかの多重解像度レベルが最適化を完了した後、および/または、入力データセットおよび構成設定値の所与の集合のための最終変換が見つかった後に、適用できる。一般に、前のセクションで説明したような動き補正問題に対する解には、自由度3が組み込まれている。自由度は、全ての変換に共通な可変並進部(variable translational part)としてモデル化でき、これにより、全てのデータセットデータサンプルを、オブジェクト空間において固定量分シフトする可能性がある。典型的には、並進ベクトルが零ベクトルに近い場合に、この影響はあまり強く現れない。しかし、この影響は望ましくない場合がある。その場合、各変換のパラメータは、全ての変換の結果として生じる共通の並進部が零ベクトルとなるように、動き補正ステップの間にいくつかのポイントにおいて補正できる。これを行う1つの方法は、全ての変換の平均並進部を算出して、この平均成分がなくなるように各変換のパラメータを更新する。
《Solution correction step》
An optional processing step that can be performed is a solution correction step. This is the final transformation for each numerical optimization iteration and / or after several multi-resolution levels have completed the optimization and / or for a given set of input data sets and configuration settings Can be applied after found. In general, the solution to the motion correction problem as described in the previous section incorporates 3 degrees of freedom. The degrees of freedom can be modeled as a variable translational part common to all transformations, which can shift all data set data samples by a fixed amount in the object space. Typically, this effect is not very strong when the translation vector is close to the zero vector. However, this effect may be undesirable. In that case, the parameters of each transformation can be corrected at several points during the motion correction step so that the common translation resulting from all transformations is a zero vector. One way to do this is to calculate the average translation of all transformations and update the parameters of each transformation so that this average component is gone.
<解変換の適用>
一旦動き推定処理が解を見つけると、位置合わせ済空間におけるデータセットの最終的な集合が生成できる。これには、各データセットに変換を適用することが伴う。一般に、このデータは、動き推定処理自体のために使用されたのと同一のデータである必要はない。例えば、強度情報または他の構造データが、変換後の状態の類似度を評価するために、好ましくは使用される。代わりに、変換を、同一のデータセット収集から算出される異なるデータチャネルに適用することもできる。このようなデータには、線形、対数、およびその他のスケールによる強度データの様々な精度表現が含まれ得るが、これらに限定されるわけではない。変換はまた、ドップラーOCTなどを行うことによって得られる位相シフト情報などの、機能的撮像情報に適用できる。これらは、OCTデータに由来するデータセットの例である。導関数データセットは、データチャネルの異なるセットを含んでもよく、また、そのデータは、入力データセットとは異なるように処理されたものでもよい。
<Application of solution conversion>
Once the motion estimation process finds a solution, a final set of data sets in the aligned space can be generated. This involves applying a transformation to each data set. In general, this data need not be the same data that was used for the motion estimation process itself. For example, intensity information or other structural data is preferably used to assess the similarity of the transformed state. Alternatively, the transformation can be applied to different data channels calculated from the same data set collection. Such data can include, but is not limited to, various precision representations of intensity data by linear, logarithmic, and other scales. The transformation can also be applied to functional imaging information, such as phase shift information obtained by performing Doppler OCT or the like. These are examples of data sets derived from OCT data. The derivative data set may include a different set of data channels, and the data may have been processed differently than the input data set.
変換の適用は、目的関数値の評価中に使用された方法と同様の方法で行うことができる。あるいは、異なるデータ補間技術を使用してもよい。その結果、各入力データセットからの位置合わせ済データセットが、動き補正済空間の一般に不規則なグリッド上に位置づけられる。3Dタイプ画像データの場合、オブジェクト空間に存在するデータセットのサンプリング点の位置の集合は、各データセットに対して同じである。 The transformation can be applied in a manner similar to that used during evaluation of the objective function value. Alternatively, different data interpolation techniques may be used. As a result, a registered data set from each input data set is positioned on a generally irregular grid in the motion corrected space. In the case of 3D type image data, the set of sampling point positions of the data set present in the object space is the same for each data set.
<画像改善のためのデータ結合(マージ)の説明>
動き補正を行い、結果として生じた変換を対象のデータチャネルに適用した後、同一の動き補正済空間に存在するデータセットの集合が得られる。3Dタイプデータセットの場合、これらの集合はまた、共通のサンプリング点の位置でも定義される。動き補正がうまく行われた場合、各データセットからの対応するデータサンプルは、オブジェクトの同一の位置からの撮像データを含む。
<Explanation of data merging (merging) for image improvement>
After performing motion correction and applying the resulting transform to the target data channel, a set of data sets present in the same motion corrected space is obtained. In the case of 3D type data sets, these sets are also defined by the location of common sampling points. If the motion correction is successful, the corresponding data sample from each data set contains imaging data from the same position of the object.
使用した撮像データの(強度情報などの)特定のタイプによっては、これらの位置合わせ済データセットを単一のデータセットに結合しようとすることは、望ましいことが多い。例えば、OCT強度データを使用する場合がそうである。この場合、雑音が低減できるので、結合することによって、よりよい画質を生成することができるであろう。他の例は、血流量を測定するために使用できるドップラーOCT位相シフトデータである。同一位置から異なる時刻に収集された複数のサンプルを結合することによっても、雑音レベルを低減することができる。ドップラーデータを使用して血流量を測定する際には、異なる時点から複数の速度測定値を結合すると、拍動が低下し得る。これにより、脈によって誘導される短時間の影響に依存しにくい、よりよい測定(分単位の流量など)近似値である、血流量測定値が生成できる。 Depending on the particular type of imaging data used (such as intensity information), it is often desirable to attempt to combine these aligned data sets into a single data set. This is the case, for example, when using OCT intensity data. In this case, noise can be reduced and, by combining, better image quality could be generated. Another example is Doppler OCT phase shift data that can be used to measure blood flow. The noise level can also be reduced by combining a plurality of samples collected from the same position at different times. When measuring blood flow using Doppler data, pulsation can be reduced by combining multiple velocity measurements from different points in time. This makes it possible to generate a blood flow measurement value that is an approximation of a better measurement (such as a flow rate in minutes) that is less dependent on the short-term effects induced by the pulse.
結合したデータセットを自然に生成する方法は、対応するサンプリング点の位置からのデータを単に平均することである。分散タイプの測定値の算出はまた、例えばドップラーOCTデータの場合には、興味深いものになり得る。しかし、動きによって誘発された歪みは、あるソースデータセットに存在するいくつかの領域が、他のセットにおいて全くサンプリングされないかもしれない、ということを招く可能性がある。そのような場合、平均はよい手法とはいえない。なぜなら、ある領域が存在しなかったデータセットからのデータは、隣接する領域からの代替データで埋められるだろうからである。そうでななく、この場合のマージされたボリュームには、その領域が実際に存在したデータセットからのデータを主に使用する技術を採用できる。 A natural way to generate a combined data set is to simply average the data from the corresponding sampling point locations. The calculation of the dispersion type measurement can also be interesting, for example in the case of Doppler OCT data. However, motion-induced distortion can lead to some regions present in one source data set not being sampled at all in the other set. In such cases, averaging is not a good technique. This is because data from a data set in which a certain area did not exist will be filled with alternative data from an adjacent area. Rather, the merged volume in this case can employ a technique that mainly uses data from the data set in which the area actually existed.
各位置からの利用可能なデータサンプル平均して最終的なデータセットを生成する代わりに、位置合わせ済データサンプルの凸加重和(convex weighted sum)を使用して、データを結合する。このスキームでは、特定位置の異なるデータセットの各サンプルは、それに関連付けられた正の実数の値を有する。さらに、凸結合を形成するために、重みのいずれもゼロより小さい値ではなく、全ての画像に対するこれらの重みの合計は、1であるべきである。他の結合スキームもまた、使用できる。 Instead of averaging the available data samples from each location to produce the final data set, the data is combined using a convex weighted sum of the aligned data samples. In this scheme, each sample of a different data set at a particular location has a positive real value associated with it. Further, to form a convex combination, none of the weights is less than zero, and the sum of these weights for all images should be 1. Other coupling schemes can also be used.
重みづけをすることの基本的な考えは、以下の事実に基づく:ある領域がAというデータセットに存在せず、データセットBには存在する場合、元のAセットの他の領域が代用され、その結果、Aの位置合わせ結果が生成されると、元のセットのこの代替領域は2回以上サンプリングされることになる。対照的に、Bからの元の領域は、一度しかサンプリングされないであろう。 The basic idea of weighting is based on the following facts: if an area does not exist in the dataset A and exists in dataset B, other areas in the original A set are substituted. As a result, when an A alignment result is generated, this alternative region of the original set will be sampled more than once. In contrast, the original region from B will be sampled only once.
図33は、本明細書に記載する方法による、データセットをマージする処理3300の例示的実施形態を示す。方法3300は、例えば、図1に示す装置100のコンピュータ102、または図2に示す装置200のコンピュータ202によって、実行され得る。
FIG. 33 illustrates an exemplary embodiment of a
《サンプリング密度の推定》
重みを生成するために、サンプリング密度は、元のデータセットにおいて推定される。サンプリング密度は、元のセットのある領域が、対応する位置合わせ結果を生成するために何回サンプリングされたかを表す。
<< Estimation of sampling density >>
In order to generate weights, the sampling density is estimated in the original data set. The sampling density represents how many times an area of the original set has been sampled to produce a corresponding alignment result.
特定のデータセットの各データサンプルのサンプリング密度を推定する1つの方法は、2ステップの処理からなる。まず、各データセットの元の走査座標系における位置合わせ済結果を生成するためにサンプリング位置の密度を推定する、いわゆるParzen推定ステップが行われる。この密度を推定するために、他の技術もまた、使用できる。第2のステップにおいて、位置合わせ済のセットを生成するため、元のデータセットがサンプリングされる際に、生成された密度がサンプリングされる。結果として生じる値は、位置合わせ済データセット内の特定のサンプルを生成するためにサンプリングされた特定の領域が、その位置合わせ済のセット全体を生成する際に合計何回使用されたか、を示す。この値が、ある位置合わせ済データセットからのサンプルについて、他のセットからの同一のサンプルよりも大きい場合、先のサンプルは、先のデータセットのサンプリングにおける隙間を埋めるために使用された可能性が高いと見なされる。その後、これが実際の重み生成において使用される。 One method for estimating the sampling density of each data sample of a particular data set consists of a two-step process. First, a so-called Parzen estimation step is performed in which the density of sampling positions is estimated in order to generate a registered result in the original scanning coordinate system of each data set. Other techniques can also be used to estimate this density. In the second step, the generated density is sampled when the original data set is sampled to generate a registered set. The resulting value indicates how many times a particular region sampled to generate a particular sample in the aligned data set has been used to generate the entire aligned set . If this value is greater for a sample from one aligned dataset than the same sample from another set, the previous sample may have been used to fill a gap in the sampling of the previous dataset Is considered high. This is then used in actual weight generation.
《サンプル妥当性値の生成》
重みを生成するために使用される他の情報源は、サンプル妥当性と称される。データセット補間では、補間された結果を生成する際に、複数のサンプルが考慮される。このフットプリントのサンプルの一部または全部が、データ点のグリッドによって定義される実際のボリュームデータの外側にある場合、サンプルの妥当性は、全てのサンプルがボリューム内にあった場合よりも低いと考えられる。サンプルの全が、それぞれのソースグリッドの内側にある場合には1と定義され、外側にある場合にはゼロに定義される値が、全てのデータサンプルに関連付けられる。サンプルが部分的に元のサンプルグリッドの外側にあると考えられる場合、1と0の間の値が与えられるべきである。サンプルのより多くがより外側にあると考えられるほど、この妥当性値はより低くなる。他の方法が、データセット補間のサンプル妥当性を評価するために使用できることも言うまでもない。
<< Generation of sample validity values >>
Another source of information used to generate weights is called sample validity. In data set interpolation, multiple samples are taken into account when generating the interpolated result. If some or all of the samples in this footprint are outside the actual volume data defined by the grid of data points, the sample is less valid than if all samples were in volume. Conceivable. A value defined as 1 if all of the samples are inside each source grid and defined as zero if they are outside is associated with every data sample. If the sample is considered to be partially outside the original sample grid, a value between 1 and 0 should be given. The more the sample is considered to be outside, the lower this validity value. It goes without saying that other methods can be used to evaluate the sample validity of the dataset interpolation.
《重み係数の計算および適用》
データセットを結合するために使用する最終的な重みを計算するために、異なる位置合わせ済データセットからのサンプルの各集合は、独立して考慮できる。重みは、考慮したサンプル間でサンプリング密度およびサンプル妥当性に差がないときは、等しい重みが各サンプルに割り当てられるように、算出できる。したがって、N個のサンプルの場合、各重みは1/Nに設定される。
《Calculation and application of weighting factor》
Each set of samples from different registered data sets can be considered independently to calculate the final weights used to combine the data sets. The weights can be calculated so that equal weights are assigned to each sample when there is no difference in sampling density and sample validity between the considered samples. Therefore, for N samples, each weight is set to 1 / N.
これらの値に差がある一般の場合は、以下の規則が適用される。あるサンプルが、サンプリング密度の等分よりも大きいサンプリング密度を有する場合、その重みは、等分した重みよりも低くなければならない。また、あるサンプルがより低いサンプル妥当性を有する場合、その重みもまた、より低くなる。しかし、全体では、重みは合計して1となるべきであり、いずれの重みも負の値であってはならない。 In the general case where these values are different, the following rules apply: If a sample has a sampling density greater than an equal fraction of the sampling density, its weight must be lower than the equal weight. Also, if a sample has a lower sample validity, its weight will also be lower. However, overall, the weights should sum to 1 and none of the weights can be negative.
このようにして、これらの測定値に関してサンプルの間で差がない場合、等しい重みは、雑音を低減する平均化の効果をもたらすであろう。個々のサンプルが、他のサンプルに比べて、データセット内のギャップを埋めるために使用された可能性が高そうな場合や、またはより高い程度でソースデータセットの外からサンプリングされた場合は、それらに割当てられる重みは、より低くなるであろう。これによって、最終的に結合された結果を生成する際に、このサンプルを比較的または完全に除外でき、したがって、おそらくアーティファクトを除去できる。 In this way, equal weights will have the effect of averaging to reduce noise if there is no difference between samples for these measurements. If individual samples are likely to have been used to fill gaps in a dataset compared to other samples, or are sampled from outside the source dataset to a greater extent, The weight assigned to them will be lower. This allows this sample to be removed relatively or completely in generating the final combined result, and thus possibly removing artifacts.
次いで、結合された画像の最終的構築は、対応するデータサンプルの加重和を行うことによって行われる。これに加えて、データはまた、この加重和の前に正規化して、例えば、強度データを使用する際の輝度の差を補償してもよい。 The final construction of the combined image is then done by performing a weighted sum of the corresponding data samples. In addition, the data may also be normalized before this weighted sum to compensate for differences in brightness, for example when using intensity data.
例えば、ドップラーシフト値とは異なり、強度情報などの、結合されたデータの内容にとって適切なさらなる論理を、重み生成処理に組み込むことができる。例えば、ドップラーシフトデータをマージするときは、複素領域に位相シフトを変換することは意味がある。そこで、加重和を行うことができ、また位相シフトへ戻せる。また、重み生成処理は、目のデータセット収集中の瞬きなどの特別な撮像シナリオを扱うようにすることもできる。例えば、瞬きは、強度値の軸方向合計に注目することと、軸方向投影が非常に暗い場合にはより低い重みをサンプルに割り当てることとによって、検出できる。なぜなら、瞬きが起こると、瞬きの間に取り込まれたA走査はいかなる構造も示さないからであり、これによって暗くなる。なお、本明細書に記載する方法および装置はまた、サンプリング密度およびサンプル妥当性を使用せずに、単にデータ値を結合する方法を採用することもできる。1つの例は、データ値を平均することであろう。また、データセット自体の、または位置合わせ済データセットを生成するために使用した変換のさらなる特性を、結合処理に使用してもよい。 For example, unlike Doppler shift values, additional logic appropriate to the content of the combined data, such as intensity information, can be incorporated into the weight generation process. For example, when merging Doppler shift data, it is meaningful to convert the phase shift to the complex domain. Therefore, a weighted sum can be performed and the phase shift can be restored. The weight generation process can also handle special imaging scenarios such as blinking during eye data set collection. For example, blinking can be detected by noting the sum of the intensity values in the axial direction and assigning a lower weight to the sample if the axial projection is very dark. This is because when a blink occurs, the A-scan captured during the blink does not show any structure, which darkens. It should be noted that the methods and apparatus described herein can also employ a method of simply combining data values without using sampling density and sample validity. One example would be to average data values. Also, additional properties of the dataset itself or of the transformation used to generate the aligned dataset may be used for the merge process.
《雑音低減》
加重和結合の平均化効果によって達成される雑音低減効果に加えて、さらなる雑音低減法を任意に採用することができる。これらは、個々の位置合わせ済データセットにでも最終的な結合済データセットにでも適用できる。さらに、より良好な雑音低減効果を達成するために、データサンプルとその周辺近傍との依存性および相関を分析する、複雑な雑音低減法を採用できる。
《Noise reduction》
In addition to the noise reduction effect achieved by the averaging effect of the weighted sum combination, further noise reduction methods can optionally be employed. They can be applied to individual aligned data sets or to the final combined data set. Furthermore, in order to achieve a better noise reduction effect, it is possible to employ a complicated noise reduction method that analyzes the dependency and correlation between the data sample and the vicinity thereof.
《しきい値処理および範囲変換》
最終的に結合されて位置合わせされたデータセットの出力形式によっては、中間の計算のために使用したデータ形式と最終的な出力データ形式との変換を行う必要がある場合がある。積分データタイプにマッピングする例では、浮動小数点データのデータ範囲を出力形式に合わせるために、最小/最大マッピングを行うことができる。
<Threshold processing and range conversion>
Depending on the output format of the finally combined and aligned data set, it may be necessary to convert between the data format used for the intermediate calculations and the final output data format. In the example of mapping to an integral data type, minimum / maximum mapping can be performed to match the data range of floating point data to the output format.
これとは独立して、しきい値処理をデータに行い、データ範囲の両端の異常値を除去できる。 Independently of this, threshold processing can be performed on the data to remove abnormal values at both ends of the data range.
マルチスポット走査装置
従来のOCT器具は、図1および図2に示すように、単一のOCTビームと1つのスポットによって撮像する。しかし、これらの図は、眼科用OCT撮像用装置を説明するものであって、本セクションの概念は、他のOCT撮像応用例に適用できることは言うまでもない。1例として、オブジェクト組織に複数のOCTビームおよび複数のスポットを使用することと、画像収集を並行して行うこととにより、撮像速度を効果的に上げることができる。図34Aは、2つのファイバ端部を、コリメーティングレンズの焦点面の中あるいは近くに配置することによって、網膜上に2つのスポットを投影する装置を示す。
Multi-spot scanning device Conventional OCT instruments image with a single OCT beam and one spot, as shown in FIGS. However, these figures illustrate an ophthalmic OCT imaging device, and it should be understood that the concepts in this section can be applied to other OCT imaging applications. As an example, the imaging speed can be effectively increased by using a plurality of OCT beams and a plurality of spots for the object tissue and performing image acquisition in parallel. FIG. 34A shows an apparatus that projects two spots on the retina by placing two fiber ends in or near the focal plane of the collimating lens.
あるいは、2つの別々のファイバおよびコリメータを使用し、コリメートされた光ビームの軸が非平行となるように、配置することもできる。1つまたは複数のコリメータからの光は、2軸ビームステアリング機構から反射して患者のインタフェース光学素子に入る。ビームステアリングは、単一の2軸ミラー、複数の単軸ステアリングミラー(例えば検流計)、ピエゾステアリング素子、または電磁ステアリング素子などを用いて行うことができる。複数のスポット配置が可能である。図34Bは、2つの撮像スポットを使用し、y方向を高速走査(YFastと呼ぶ)とする、ラスタ走査を示す。図34Cは、2つの撮像スポットを使用し、x方向を高速走査(XFastと呼ぶ)とする、ラスタ走査を示す。図34Bおよび図34Cに示す具体例では、スポットは、XおよびY走査方向に対して45度の角度でずれている。このスポット配置によって、XFastデータセットが得られ、YFastデータセットが得られ、および/または他の走査パターンが実行でき、関連データが得られる。撮像中、オブジェクト組織から後方反射または後方散乱された光がファイバに戻り、各OCTビームについて別々の撮像または検出チャネルを有する干渉計へと進む。1つの手法では、スポットの動きは、両スポットが同一の走査パターンで動くように連動される。複数の順次データセットが取得でき、これには、1ボリュームにつき必要な全撮像時間が低減されるという利点がある。第2の利点は、両方のデータセットに影響を与える動きが相関していることである。動き相関情報を位置合わせルーチンに組み込むことにより、収束速度および位置合わせの精度が改善される。この概念は、3つ以上のスポットを有する画像に一般化できる。 Alternatively, two separate fibers and collimators can be used and positioned so that the collimated light beam axes are non-parallel. Light from one or more collimators is reflected from the biaxial beam steering mechanism and enters the patient interface optics. Beam steering can be performed using a single two-axis mirror, a plurality of single-axis steering mirrors (for example, a galvanometer), a piezo steering element, or an electromagnetic steering element. Multiple spot arrangements are possible. FIG. 34B shows raster scanning using two imaging spots and setting the y direction to high speed scanning (referred to as YFast). FIG. 34C shows raster scanning using two imaging spots and setting the x direction to high speed scanning (referred to as XFast). In the specific examples shown in FIGS. 34B and 34C, the spots are shifted by an angle of 45 degrees with respect to the X and Y scanning directions. With this spot arrangement, an XFast data set is obtained, a YFast data set is obtained, and / or other scan patterns can be performed to obtain relevant data. During imaging, light back-reflected or back-scattered from the object tissue returns to the fiber and travels to an interferometer with a separate imaging or detection channel for each OCT beam. In one approach, spot movements are linked so that both spots move with the same scan pattern. Multiple sequential data sets can be acquired, which has the advantage of reducing the total imaging time required per volume. The second advantage is that the movements affecting both data sets are correlated. Incorporating motion correlation information into the alignment routine improves convergence speed and alignment accuracy. This concept can be generalized to images with more than two spots.
図35Aは、独立して制御可能な2つのビームを走査でき、かつ組織オブジェクト上に2つのスポットを投影できる撮像装置を示す。 FIG. 35A shows an imaging device that can scan two independently controllable beams and project two spots onto a tissue object.
独立して制御可能な2つ以上のビームステアリング機構からの光が患者のインタフェースで結合され得るように、ビームスプリッタまたは同様の多重化装置が光路内に配置される。第1の干渉計(A)からの光は、第1のコリメータによってコリメートされ、第1のビームステアリング機構で反射して、ビームスプリッタまたは同様のビーム結合装置を通って患者のインタフェース光学素子に入る。ビームステアリングは、単一の2軸ミラー、複数の単軸ステアリングミラー(例えば検流計)、ピエゾステアリング素子、または電磁ステアリング素子などを用いて行うことができる。第2の干渉計(B)からの光は、第2のコリメータによってコリメートされ、第2のビームステアリング機構で反射し、先に言及したビームスプリッタまたは同様のビーム結合装置を通って患者のインタフェース光学素子に入る。これらの干渉計は、光源などのサブシステム(これらが2つのスポットからのOCTデータの独立した検出を可能にする場合)を共有してもよいことは言うまでもない。 A beam splitter or similar multiplexing device is placed in the optical path so that light from two or more independently controllable beam steering mechanisms can be combined at the patient interface. The light from the first interferometer (A) is collimated by the first collimator, reflected by the first beam steering mechanism, and enters the patient interface optics through a beam splitter or similar beam combiner. . Beam steering can be performed using a single two-axis mirror, a plurality of single-axis steering mirrors (for example, a galvanometer), a piezo steering element, or an electromagnetic steering element. The light from the second interferometer (B) is collimated by the second collimator, reflected by the second beam steering mechanism, and passes through the beam splitter or similar beam combiner mentioned above to the patient interface optics. Enter the element. It will be appreciated that these interferometers may share a subsystem such as a light source (if they allow independent detection of OCT data from the two spots).
組織上の各スポット位置は、走査パターンを実行するために独立して制御できる。単一スポット走査OCTシステムまたは結合された動きマルチスポット走査装置と比較して、この独立して制御されるマルチビーム、すなわち、マルチスポット走査手法では、2つの独立かつ並行して走査されたデータセットが並行して収集できる。図35Bは、スポットAでYFastデータセットを収集し、スポットBでXFastデータセットを収集する、例示の走査パターンを示す。1つの利点は、2つの相補的なデータセットを得るために1つの画像収集しか行わなくてよいことである。第2の利点は、両方のデータセットに影響を与える動きが相関していることである。動き相関情報を位置合わせルーチンに組み込むことにより、収束速度および動き補正の精度が改善される。独立して制御されるマルチスポット走査装置の第3の利点は、データセット間のオブジェクト組織の位置は、別々のデータセットが順番に収集された場合と比べてより似通っているはずであり、収束および最終的な位置合わせの結果が改善される、ということである。この概念は、3つ以上のビームおよび3つ以上のスポットを有する画像に一般化できる。 Each spot position on the tissue can be controlled independently to perform a scanning pattern. In this independently controlled multi-beam, ie multi-spot scanning approach, compared to a single spot scanning OCT system or a combined motion multi-spot scanning device, two independent and parallel scanned data sets Can be collected in parallel. FIG. 35B shows an exemplary scan pattern that collects a YFast data set at spot A and an XFast data set at spot B. FIG. One advantage is that only one image acquisition needs to be performed to obtain two complementary data sets. The second advantage is that the movements affecting both data sets are correlated. By incorporating motion correlation information into the alignment routine, convergence speed and accuracy of motion correction are improved. A third advantage of independently controlled multi-spot scanning devices is that the position of the object tissue between the data sets should be more similar than if the separate data sets were collected in sequence and converged. And the final alignment result is improved. This concept can be generalized to images with more than two beams and more than two spots.
記述したマルチビーム走査手法は、上述したデータ処理および動き補正に対して相乗的かつ相補的である。しかし、上述したデータ処理および動き補正は、マルチビーム走査とは別に実施できる。同様に、マルチビーム走査は、上述したデータ処理法、動き補正法およびマージ法とは別に実施できる。 The described multi-beam scanning technique is synergistic and complementary to the data processing and motion correction described above. However, the data processing and motion correction described above can be performed separately from multi-beam scanning. Similarly, multi-beam scanning can be performed separately from the data processing method, motion correction method, and merge method described above.
したがって、本発明の例示の実施形態は、データセットを処理する方法である。上記方法は、目的関数の値に基づいて1つ以上の3次元変換を計算することを含み、各3次元変換はそれぞれの3次元データセットと関連付けられており、上記3次元データセットはオブジェクトの少なくとも部分的に重なる領域を表す。計算することは、(a)(i)変換後の状態における2つ以上の3次元データセット間、または(ii)該変換後の状態における2つ以上の前処理された3次元データセット間の類似度を算出すること、および(b)撮像器具に対する上記オブジェクトの動きを推定することによって上記目的関数を評価することを含む。上記方法はさらに、少なくとも1つの3次元変換を、そのそれぞれの3次元データセットに、または該それぞれの3次元データセットに対応する導関数3次元データセットに適用して、少なくとも1つの動き補正済データセットを得ることを含む。 Thus, an exemplary embodiment of the invention is a method for processing a data set. The method includes calculating one or more three-dimensional transformations based on the value of the objective function, each three-dimensional transformation being associated with a respective three-dimensional dataset, wherein the three-dimensional dataset is an object's Represents a region that overlaps at least partially. Calculating may include (a) (i) between two or more 3D datasets in the transformed state, or (ii) between two or more preprocessed 3D datasets in the transformed state Calculating similarity, and (b) evaluating the objective function by estimating the movement of the object relative to the imaging device. The method further applies at least one three-dimensional transform to the respective three-dimensional data set or to a derivative three-dimensional data set corresponding to the respective three-dimensional data set to provide at least one motion corrected Including obtaining a data set.
一例示の実施形態において、上記目的関数を評価することは、(i)上記変換後の状態における上記2つ以上の3次元データセット間、または(ii)上記変換後の状態における上記2つ以上の前処理された3次元データセット間の類似度にフェイバを与えることを含む。 In one exemplary embodiment, evaluating the objective function comprises (i) between the two or more three-dimensional data sets in the transformed state, or (ii) the two or more in the transformed state. Providing a similarity to the similarity between the preprocessed three-dimensional data sets.
他の例示の実施形態において、各3次元データセットは、上記オブジェクトの領域から収集される信号の値の集合であり、上記変換後の状態における上記2つ以上の3次元データセット間の類似度にフェイバを与えることは、信号値間の差にペナルティを与えることを含む。 In another exemplary embodiment, each three-dimensional data set is a set of signal values collected from the region of the object, and the similarity between the two or more three-dimensional data sets in the transformed state. Giving the favour includes penalizing the difference between the signal values.
他の例示の実施形態において、上記目的関数を評価することは、撮像器具に対する上記オブジェクトの動きにペナルティを与えることを含む。 In another exemplary embodiment, evaluating the objective function includes penalizing the movement of the object relative to the imaging tool.
他の例示の実施形態において、上記計算することは第1および第2の3次元変換を含み、上記適用することは、上記第1の3次元変換を第1の3次元データセットに適用し、上記第2の3次元変換を第2の3次元データセットに適用して、それぞれ、第1および第2の動き補正済データセットを得ることを含み、上記第1および第2の動き補正済データセットのデータ要素を結合して、上記第1または第2の動き補正済データセット個々に対して改善された信号品質を有する、マージされた動き補正済データセットを得ることをさらに含む。 In another exemplary embodiment, the calculating includes first and second three-dimensional transformations, and the applying applies the first three-dimensional transformation to a first three-dimensional data set; Applying the second three-dimensional transform to a second three-dimensional data set to obtain first and second motion-corrected data sets, respectively, the first and second motion-corrected data The method further includes combining the data elements of the set to obtain a merged motion corrected data set having improved signal quality for each of the first or second motion corrected data sets.
他の例示の実施形態において、上記データ要素を結合することは、上記第1および上記第2の3次元変換の少なくとも1つの特性に基づいて、上記第1および第2の動き補正済データセットのデータ要素の、上記マージされた動き補正済データセットに対する寄与を調整することをさらに含む。 In another exemplary embodiment, combining the data elements is based on at least one characteristic of the first and second three-dimensional transformations of the first and second motion corrected data sets. Further adjusting the contribution of data elements to the merged motion corrected data set.
他の例示の実施形態において、上記第1または上記第2の3次元変換の上記少なくとも1つの特性は、サンプリング密度である。 In another exemplary embodiment, the at least one characteristic of the first or second three-dimensional transform is a sampling density.
他の例示の実施形態において、寄与を調整することは、上記第1および第2の動き補正済データセットの上記データ要素の加重和を計算することをさらに含む。 In another exemplary embodiment, adjusting the contribution further includes calculating a weighted sum of the data elements of the first and second motion corrected data sets.
他の例示の実施形態において、上記方法は、第1の走査パターンを使用して第1の3次元データセットを収集することと、第2の走査パターンを使用して第2の3次元データセットを収集することとをさらに含み、上記第1および上記第2の走査パターンは相補的である。 In another exemplary embodiment, the method includes collecting a first three-dimensional data set using a first scan pattern and using the second scan pattern to a second three-dimensional data set. Collecting the first and second scan patterns are complementary.
他の例示の実施形態において、上記相補的な走査パターンはラスタ走査である。 In another exemplary embodiment, the complementary scan pattern is a raster scan.
他の例示の実施形態において、上記ラスタ走査は直交する。 In another exemplary embodiment, the raster scan is orthogonal.
他の例示の実施形態において、上記方法は、上記1つ以上の3次元変換を反復的に計算することをさらに含む。 In another exemplary embodiment, the method further includes iteratively calculating the one or more three-dimensional transforms.
他の例示の実施形態において、上記方法は、上記目的関数に数値最適化法を使用して上記1つ以上の3次元変換を計算することをさらに含む。 In another exemplary embodiment, the method further includes calculating the one or more three-dimensional transforms using a numerical optimization method on the objective function.
他の例示の実施形態において、上記方法は、上記1つ以上の3次元変換を計算することは、多重解像度数値最適化法を使用して計算されることをさらに含む。 In another exemplary embodiment, the method further comprises calculating the one or more three-dimensional transforms using a multi-resolution numerical optimization method.
他の例示の実施形態において、上記オブジェクトは、目、網膜、中心窩、視神経乳頭、または角膜からなる群から選択される。 In another exemplary embodiment, the object is selected from the group consisting of eyes, retina, fovea, optic disc, or cornea.
他の例示の実施形態において、上記方法は、第1の時点と関連付けられた第1の動き補正済データセットを得ることと、第2の時点と関連付けられた第2の動き補正済データセットを得ることと、上記第1および上記第2の動き補正済データセットを比較して、上記第1および上記第2の時点間の変化を量的に追跡することと、をさらに含む。 In another exemplary embodiment, the method obtains a first motion corrected data set associated with a first time point and a second motion corrected data set associated with a second time point. Further comprising: comparing the first and second motion corrected data sets to quantitatively track the change between the first and second time points.
上記オブジェクトは、患者に付随したオブジェクトであってよい。 The object may be an object associated with a patient.
他の例示の実施形態において、上記第1および上記第2の時点は、それぞれ、上記患者による医療プロバイダへの第1および第2の訪問に対応する。他の例示の実施形態において、上記第1および上記第2の時点は、それぞれ、上記オブジェクトを走査するための上記患者による第1および第2の行動に対応する。 In another exemplary embodiment, the first and second time points correspond to first and second visits to the health care provider by the patient, respectively. In another exemplary embodiment, the first and second time points correspond to first and second actions by the patient to scan the object, respectively.
上記患者によるそのような行動の1例は、医療プロバイダと同一または類似の行動を行うことであってよい。そのような行動は家で行われてもよい。走査機器は医療プロバイダによって使用される機器と同様のもの、または家での使用に適合させた患者によって操作される機器であってよい。例えば、スキャナがデスクトップまたはラップトップコンピュータに操作可能に接続されてもよく、または、携帯型装置に統合または接続されさえしてもよい。そのような携帯型装置の1例は携帯電話である。 One example of such behavior by the patient may be performing the same or similar behavior as a health care provider. Such an action may be performed at home. The scanning device may be similar to the device used by a medical provider, or a device operated by a patient adapted for home use. For example, a scanner may be operably connected to a desktop or laptop computer, or may be integrated or even connected to a portable device. One example of such a portable device is a mobile phone.
他の例示の実施形態において、上記3次元データセットは、A走査を経て取り込まれ、さらに、上記1つ以上の3次元変換は、3次元変位を各A走査に関連付けるものである。 In another exemplary embodiment, the three-dimensional data set is acquired via an A scan, and the one or more three-dimensional transforms associate a three-dimensional displacement with each A scan.
他の例示の実施形態において、上記方法はさらに、画像再サンプリング、雑音低減、A走査特徴生成、傾斜補償、およびロールオフ補償からなる群から選択される方法によって上記3次元データセットを前処理することを含む。 In another exemplary embodiment, the method further preprocesses the three-dimensional data set by a method selected from the group consisting of image resampling, noise reduction, A-scan feature generation, tilt compensation, and roll-off compensation. Including that.
上記3次元データセットは、強度データ、ドップラーシフトデータ、または偏光データの少なくとも1つを含んでよい。 The three-dimensional data set may include at least one of intensity data, Doppler shift data, or polarization data.
他の例示の実施形態において、上記導関数3次元データセットは、ドップラーシフトデータまたは偏光データの少なくとも1つを含む。 In another exemplary embodiment, the derivative 3D data set includes at least one of Doppler shift data or polarization data.
本発明の他の例示の実施形態は、本明細書に記載する方法のステップを行うように構成されたモジュールを含むシステムである。 Another exemplary embodiment of the present invention is a system that includes modules configured to perform the method steps described herein.
本発明の他の例示の実施形態は、一連の命令を記録した非一時的コンピュータ読み取り可能媒体であって、該命令はプロセッサによって実行されるときに、該プロセッサに、目的関数の値に基づいて1つ以上の3次元変換を計算させることであって、各3次元変換はそれぞれの3次元データセットに関連付けられており、上記3次元データセットはオブジェクトの少なくとも部分的に重なる領域を表しており、上記プロセッサに上記1つ以上の3次元変換を計算させる上記命令は、
(a)(i)変換後の状態における2つ以上の3次元データセット間、または(ii)該変換後の状態における2つ以上の前処理された3次元データセット間の類似度を算出すること、および
(b)撮像器具に対する上記オブジェクトの動きを推定することによって、上記プロセッサに上記目的関数を評価させる命令を含む。上記一連の命令は、プロセッサによって実行されるときに、該プロセッサにさらに、少なくとも1つの3次元変換を、上記それぞれの3次元データセットに、または導関数3次元データセットに適用して、少なくとも1つの動き補正済データセットを得させる。
Another exemplary embodiment of the present invention is a non-transitory computer readable medium having a series of instructions recorded thereon, the instructions being executed by the processor based on the value of the objective function. Calculating one or more three-dimensional transformations, each three-dimensional transformation being associated with a respective three-dimensional data set, said three-dimensional data set representing an at least partly overlapping region of objects The instruction that causes the processor to calculate the one or more three-dimensional transformations is:
(A) (i) calculating similarity between two or more three-dimensional data sets in the transformed state, or (ii) between two or more preprocessed three-dimensional data sets in the transformed state. And (b) instructions for causing the processor to evaluate the objective function by estimating the movement of the object relative to the imaging tool. The sequence of instructions, when executed by a processor, further applies to the processor at least one three-dimensional transform to the respective three-dimensional data set or to the derivative three-dimensional data set. Get two motion-corrected data sets.
本発明の他の例示の実施形態は、OCTデータセットを処理する方法である。本方法は、オブジェクトの少なくとも部分的に重なる領域を表す2つ以上の3次元OCTデータセットを収集することであって、少なくとも1つのデータセットが、少なくとも1つの他のデータセットの走査パターンに対して相補的な走査パターンを使用して収集される、収集することと、目的関数を使用して各データセットのための3次元変換を計算することとを含む。上記目的関数は、
(a)変換後の状態における上記3次元データセット間の計算された類似度にフェイバを与え、(b)撮像器具に対する上記オブジェクトの動きにペナルティを与える。上記方法はさらに、少なくとも1つの3次元変換をそのそれぞれのデータセットに適用して、少なくとも1つの動き補正済データセットを得ることを含む。
Another exemplary embodiment of the invention is a method of processing an OCT data set. The method collects two or more three-dimensional OCT data sets representing at least partially overlapping areas of an object, wherein at least one data set is relative to a scan pattern of at least one other data set. Collecting using a complementary scanning pattern and calculating a three-dimensional transform for each data set using an objective function. The objective function is
(A) Gives the calculated similarity between the three-dimensional data sets in the transformed state, and (b) gives a penalty to the movement of the object relative to the imaging device. The method further includes applying at least one three-dimensional transform to the respective data set to obtain at least one motion corrected data set.
他の例示の実施形態において、上記類似度は、強度データ、振幅データ、位相データまたは偏光データの少なくとも1つに基づいて計算される。 In another exemplary embodiment, the similarity is calculated based on at least one of intensity data, amplitude data, phase data, or polarization data.
他の例示の実施形態において、類似度を計算するために使用される上記データは、雑音抑圧、傾斜補償、OCT信号ロールオフ補正、データ削減、データ正規化、またはその組み合わせを使用して、前処理される。 In other exemplary embodiments, the data used to calculate the similarity may be calculated using noise suppression, slope compensation, OCT signal roll-off correction, data reduction, data normalization, or a combination thereof. It is processed.
他の例示の実施形態において、上記3次元変換は、強度データ、振幅データ、位相データ、または偏光データの少なくとも1つを変換することによって、そのそれぞれの3次元データセットに適用される。 In another exemplary embodiment, the three-dimensional transformation is applied to its respective three-dimensional data set by transforming at least one of intensity data, amplitude data, phase data, or polarization data.
他の例示の実施形態において、上記変換後の状態における上記3次元データセット間の上記計算された類似度にフェイバを与えることは、上記変換後の状態における上記3次元データセットから選択されるデータ値間の差にペナルティを与えることを含む。 In another exemplary embodiment, giving the calculated similarity between the three-dimensional data sets in the transformed state is data selected from the three-dimensional data set in the transformed state Including penalizing the difference between values.
他の例示の実施形態において、データ値間の上記差にペナルティを与えることは、差の二乗和、分散、差の絶対値の和、またはその組み合わせを使用することを含む。 In another exemplary embodiment, penalizing the difference between data values includes using a sum of squared differences, a variance, a sum of absolute differences, or a combination thereof.
他の例示の実施形態において、第1の3次元変換が第1の3次元データセットに適用され、第2の3次元変換が第2の3次元データセットに適用されて、それぞれ、第1および第2の動き補正済データセットを得る。上記方法は、上記第1および第2の動き補正済データセットからのデータ要素を結合することによって上記第1および上記第2の動き補正済データセットをマージして、上記第1または第2の動き補正済データセット個々に対して改善された信号品質を有する、マージされた動き補正済データセットを得ることをさらに含む。 In another exemplary embodiment, a first three-dimensional transformation is applied to the first three-dimensional data set and a second three-dimensional transformation is applied to the second three-dimensional data set, respectively, A second motion corrected data set is obtained. The method merges the first and second motion corrected data sets by combining data elements from the first and second motion corrected data sets to produce the first or second motion corrected data set. It further includes obtaining a merged motion corrected data set having improved signal quality for each motion corrected data set.
他の例示の実施形態において、上記第1および上記第2の3次元変換は特性を有し、上記第1および上記第2の動き補正済データセットをマージすることは、上記第1および上記第2の3次元変換の少なくとも1つの特性に基づいて、上記マージされた動き補正済データセットに対するデータ要素の寄与を調整することをさらに含む。上記第1または上記第2の3次元変換の上記少なくとも1つの特性はサンプリング密度を含んでよい。 In another exemplary embodiment, the first and second three-dimensional transformations have characteristics, and merging the first and second motion-corrected data sets is the first and second And further adjusting the contribution of data elements to the merged motion corrected data set based on at least one characteristic of the two-dimensional transformation of two. The at least one characteristic of the first or second three-dimensional transformation may include a sampling density.
他の例示の実施形態において、上記第1および上記第2の動き補正済データセットをマージすることは、上記第1および第2の動き補正済データセットの上記データ要素の加重和を計算することを含む。 In another exemplary embodiment, merging the first and second motion corrected data sets calculates a weighted sum of the data elements of the first and second motion corrected data sets. including.
他の例示の実施形態において、上記相補的な走査パターンはラスタ走査である。上記ラスタ走査は直交してよい。 In another exemplary embodiment, the complementary scan pattern is a raster scan. The raster scan may be orthogonal.
他の例示の実施形態において、上記方法は、上記3次元変換を反復的に計算することをさらに含む。 In another exemplary embodiment, the method further includes iteratively calculating the three-dimensional transform.
他の例示の実施形態において、上記方法は、多重解像度数値最適化法を使用して上記3次元変換を計算することをさらに含む。他の例示の実施形態において、上記オブジェクトは、目、網膜、中心窩、視神経乳頭、および角膜からなる群から選択される。 In another exemplary embodiment, the method further includes calculating the three-dimensional transform using a multi-resolution numerical optimization method. In another exemplary embodiment, the object is selected from the group consisting of eyes, retina, fovea, optic disc, and cornea.
他の例示の実施形態において、第1の時点からの少なくとも第1および第2のデータセットが処理されて、該第1の時点と関連付けられた第1の動き補正済データセットが得られ、第2の時点からの少なくとも第3および第4のデータセットが処理されて、該第2の時点と関連付けられた第2の動き補正済データセットが得られ、上記方法は、上記動き補正済データセットまたは上記動き補正済データセットからの測定値を比較して、複数の時点にわたる変化を量的に追跡することをさらに含む。 In another exemplary embodiment, at least a first and second data set from a first time point is processed to obtain a first motion corrected data set associated with the first time point, At least the third and fourth data sets from the second time point are processed to obtain a second motion corrected data set associated with the second time point, the method comprising: Or further comparing the measurements from the motion corrected data set to quantitatively track changes over multiple time points.
他の例示の実施形態において、上記3次元データセットはA走査を含み、さらに、各3次元データセットは、強度、振幅、位相、ドップラーシフト、または偏光信号の少なくとも1つを含むデータチャネルのセットを含み、上記方法は、データチャネルの上記セットを上記OCTデータセットからの各A走査に関連付けることさらに含む。 In another exemplary embodiment, the three-dimensional data set includes an A-scan, and each three-dimensional data set further includes a set of data channels including at least one of an intensity, amplitude, phase, Doppler shift, or polarization signal. And the method further includes associating the set of data channels with each A-scan from the OCT data set.
他の例示の実施形態において、上記3次元データセットはA走査を含み、さらに、上記3次元変換は3次元変位を各A走査に関連付けるものである。 In another exemplary embodiment, the three-dimensional data set includes A scans, and the three-dimensional transformation associates a three-dimensional displacement with each A scan.
(実施例1)
ヒトの網膜の視神経乳頭の2つの相補的なOCTボリュームを、図16(A)〜図16(C)に示すように収集、位置合わせ、およびマージした。図16(A)および図16(B)はそれぞれ、2つの直交する走査方向を使用して得られた同一のボリュームの3次元OCT画像を示す。図16(C)は、本明細書に記載する方法の例示の実施形態を使用して2つの画像をマージした結果を示す。
Example 1
Two complementary OCT volumes of the human retinal optic nerve head were collected, aligned, and merged as shown in FIGS. 16 (A) -16 (C). FIGS. 16A and 16B each show a three-dimensional OCT image of the same volume obtained using two orthogonal scan directions. FIG. 16C shows the result of merging two images using an exemplary embodiment of the method described herein.
101kHzの軸方向走査速度を有するプロトタイプスペクトル/フーリエドメインOCTシステムを使用して、6×6mmの領域を400×400の軸方向走査で横断方向に走査し、ボリュームを収集した。各ボリュームは、ほぼ2秒で収集された。第1のボリュメトリックデータセットは、x方向を高速走査とする(XFastと称する)ラスタ走査を使用して収集した。第2のボリュメトリックデータセットは、y方向を高速走査とする(YFastと称する)ラスタ走査を使用して収集した。第1および第2のボリュメトリックデータセットはともに網膜の実質的に同一の領域において収集されたが、収集中の目の動きにより軸方向および横断方向の両方に歪みが生じた。例示の実施形態の適用により、動き補正され歪みのない真の網膜形態を表す、最終的にマージされたデータセットが生成された。標準のデスクトップコンピュータにグラフィックカード(ATI Radeon 5850)加速コードを使用し、このデータセットにかかった処理時間は、ほぼ3分であった。眼科用撮像に使用される現在市販されているOCTシステムは、25〜50kHzの軸方向走査速度を有し、横断方向に200×200の軸方向走査からなるデータセットを収集する。したがって、処理時間は、これらのより小さなデータセットではより速くなるであろう。さらに、処理時間は、グラフィックカードおよびコンピュータ技術の発達により急速に高速化されることが期待される。 Using a prototype spectral / Fourier domain OCT system with an axial scan speed of 101 kHz, a 6 × 6 mm region was scanned transversely with a 400 × 400 axial scan and the volume was collected. Each volume was collected in approximately 2 seconds. The first volumetric data set was collected using a raster scan with a fast scan in the x direction (referred to as XFast). The second volumetric data set was collected using a raster scan with a fast scan in the y direction (referred to as YFast). Both the first and second volumetric data sets were collected in substantially the same region of the retina, but eye movement during collection caused distortion in both the axial and transverse directions. Application of the exemplary embodiment produced a final merged data set that represents a true retinal shape that is motion corrected and undistorted. Using a graphics card (ATI Radeon 5850) acceleration code on a standard desktop computer, the processing time for this data set was approximately 3 minutes. Currently commercially available OCT systems used for ophthalmic imaging have an axial scan rate of 25-50 kHz and collect a data set consisting of 200 × 200 axial scans in the transverse direction. Thus, processing time will be faster with these smaller data sets. Furthermore, the processing time is expected to increase rapidly with the development of graphic card and computer technology.
図17(A)〜図17(C)は、本明細書に記載する方法を適用した結果を示す。具体的には、図17(A)および図17(B)はそれぞれ、直交方向の走査によって得られた2つのボリュメトリックOCTデータセットからのOCT眼底視野を示す。図17(C)は、本明細書に記載する例示の方法によって2つのOCT画像をマージした結果を示す。OCT眼底視野は、画像の各横断方向のピクセルにつき、各A走査に沿って軸方向強度を合計することによって生成した。101kHzの軸方向走査速度を有するプロトタイプスペクトル/フーリエドメインOCTシステムを使用して、6×6mmの領域を400×400の軸方向走査で横断方向に走査し、ボリュームを収集した。各ボリュームは、ほぼ2秒で収集された。第1のボリュメトリックデータセットは、x方向を高速走査とする(XFast走査)ラスタ走査を使用して収集され、図17(A)に示される。目および頭の動きに起因する動きのアーティファクトは、データセット内の水平方向不連続として見える。第2のボリュメトリックデータセットは、y方向を高速走査とする(YFast走査)ラスタ走査を使用して収集され、図17(B)に示される。目および頭の動きに起因する動きのアーティファクトは、データセットの垂直方向不連続として見える。動き補償を適用することにより、動き補正され最終的にマージされたデータセットが生成された。動き補正済データセットから生成されたOCT眼底視野が、図17(C)に示され、歪みのない真の網膜構造を表す。元の未補正の入力データセットに存在するデータ内のギャップは、そのデータが入力データセットの少なくとも1つの中に存在する限りにおいて、位置合わせおよびマージが施されたデータセットで埋められた。最後に、目の動きは携帯型OCT撮像器具ではより強調され得るため、本明細書に記載する例示の実施形態は、動き歪みの補正、データセットの位置合わせ、および複数のデータセットのマージを行うために、携帯型OCT器具で使用できる。 FIGS. 17A to 17C show the results of applying the method described herein. Specifically, FIGS. 17A and 17B each show an OCT fundus visual field from two volumetric OCT data sets obtained by orthogonal scanning. FIG. 17 (C) shows the result of merging two OCT images by the exemplary method described herein. The OCT fundus field was generated by summing the axial intensity along each A scan for each transverse pixel of the image. Using a prototype spectral / Fourier domain OCT system with an axial scan speed of 101 kHz, a 6 × 6 mm region was scanned transversely with a 400 × 400 axial scan and the volume was collected. Each volume was collected in approximately 2 seconds. The first volumetric data set is collected using a raster scan with a fast scan in the x direction (XFast scan) and is shown in FIG. Motion artifacts due to eye and head motion appear as horizontal discontinuities in the data set. The second volumetric data set is collected using a raster scan with a fast scan in the y direction (YFast scan) and is shown in FIG. Motion artifacts due to eye and head motion appear as vertical discontinuities in the data set. By applying motion compensation, a motion corrected and finally merged data set was generated. The OCT fundus visual field generated from the motion corrected data set is shown in FIG. 17C and represents a true retinal structure without distortion. Gaps in the data present in the original uncorrected input data set were filled with the aligned and merged data set as long as the data was present in at least one of the input data sets. Finally, because eye movement can be more emphasized with a portable OCT imaging instrument, the exemplary embodiments described herein provide for motion distortion correction, dataset alignment, and merging of multiple datasets. Can be used with portable OCT instruments to do.
図18(A)〜図18(C)は、3次元(3D)OCTボリュームから抽出した2次元(2D)断面画像を示す。x方向を高速走査として収集した3D OCTボリュームの低速軸走査方向に沿って抽出した2D画像(図18(A))を、図18(A)に示す。収集中の有意の目の動きによって、結果として生じた2D画像に網膜構造の歪みが生じた。y方向を高速走査として収集した3D OCTボリュームの低速軸走査方向に沿って抽出した2D構造画像(図18(B))を、図18(B)に示す。図18(C)は、本明細書に記載する例示の方法によって2つの画像をマージした結果を示す。 18A to 18C show two-dimensional (2D) cross-sectional images extracted from a three-dimensional (3D) OCT volume. FIG. 18A shows a 2D image (FIG. 18A) extracted along the slow axis scanning direction of the 3D OCT volume collected as the high speed scanning in the x direction. Significant eye movements during acquisition caused distortion of the retinal structure in the resulting 2D image. FIG. 18B shows a 2D structure image (FIG. 18B) extracted along the slow axis scanning direction of the 3D OCT volume collected as the fast scanning in the y direction. FIG. 18C shows the result of merging two images by the exemplary method described herein.
収集中の有意の目の動きによって、結果として生じた2D画像に網膜構造の歪みが生じた。第1(図18(A))および第2(図18(B))のデータセットからの強度データを位置合わせおよびマージすることにより、位置合わせおよびマージが施された3Dデータセットを生成した。位置合わせおよびマージが施された3Dデータセットから抽出した2D断面構造画像を、図18(C)に示す。目の動きを修正した網膜形態を示すことに加えて、位置合わせおよびマージが施された3Dデータセットから抽出した2D断面画像は、改善されたコントラストおよび信号−雑音比を示した。入力ボリュームのランダムなスペックル雑音もまた、低減された。 Significant eye movements during acquisition caused distortion of the retinal structure in the resulting 2D image. By aligning and merging the intensity data from the first (FIG. 18 (A)) and second (FIG. 18 (B)) data sets, a registered and merged 3D data set was generated. FIG. 18C shows a 2D cross-sectional structure image extracted from the 3D data set subjected to alignment and merging. In addition to showing retinal morphology with corrected eye movement, 2D cross-sectional images extracted from the aligned and merged 3D data set showed improved contrast and signal-to-noise ratio. Random speckle noise in the input volume was also reduced.
2D断面画像を、曲線状の走査軌道に沿って3D OCTボリュームから抽出できる。図19(B)〜図19(D)は、図19(A)に示す円形の軌道に沿って抽出した2Dデータセットを示す。図19(A)は、右上OCT眼底画像において、視神経乳頭の周りに描画された円を示す。 A 2D cross-sectional image can be extracted from the 3D OCT volume along a curved scanning trajectory. 19 (B) to 19 (D) show 2D data sets extracted along the circular trajectory shown in FIG. 19 (A). FIG. 19A shows a circle drawn around the optic disc in the upper right OCT fundus image.
図19(B)および図19(C)は、直交方向の走査によって得られた2Dの円形の画像を示す。図19(D)は、本明細書に記載する例示の方法によって得られた、結果として生じたマージされた画像を示す。 FIGS. 19B and 19C show 2D circular images obtained by scanning in the orthogonal direction. FIG. 19 (D) shows the resulting merged image obtained by the exemplary method described herein.
動き補正および位置合わせの前に、左および中央の画像に示すように、目の動きは、網膜形態を歪ませ、不連続を導入した。左および中央の画像は、x方向を高速走査方向として得られた第1の3D OCTボリューム、およびy方向を高速走査方向として得られた第2の3D OCTボリュームからそれぞれ抽出された、2Dの円形のデータを示す。図19(D)に示すように、動き補正しマージした3D OCTデータセットから抽出された2Dデータセットは、データの連続性、動き補正、ならびに改善されたコントラストおよび信号−雑音比を示した。眼科用診断および緑内障の管理において、視神経乳頭のまわりの円形走査(いわゆる乳頭周囲走査)は、標準のOCT走査パターンである。図19(A)〜図19(D)から分かるように、仮想円形走査の画質は、複数ボリュームの位置合わせおよびマージ処理によって向上した。仮想走査は3次元の動き歪みを補償し、信号を改善し、スペックル雑音を低減し、層の連続性を改善した。画質のこの改善は、ボリュメトリックデータセットからの自動抽出する際に乳頭周囲走査の位置を決定するために使用された自動位置合わせを、更に改善するであろう。位置合わせされ結合されたデータセットはまた、神経線維層などの網膜層を識別し定量測定する、セグメンテーションなどの自動形態計測分析を使用して、処理することができる。データセット品質の改善は、自動セグメンテーションや他の形態計測の再現性を改善するであろう。例示の実施形態は、例えば結晶腔、網膜下液または脈絡叢新生血管膜などの病変を含む、病変構造や大きさなどの特徴の定量測定にとともに使用して、加齢黄斑変性や糖尿病性網膜症の診断および疾患進行のモニタリングを行うことができる。 Prior to motion correction and alignment, eye movement distorted retinal morphology and introduced discontinuities, as shown in the left and middle images. The left and center images are 2D circles extracted from a first 3D OCT volume obtained with the x direction as the fast scan direction and a second 3D OCT volume obtained with the y direction as the fast scan direction, respectively. The data is shown. As shown in FIG. 19 (D), the 2D dataset extracted from the motion compensated and merged 3D OCT dataset showed data continuity, motion compensation, and improved contrast and signal-to-noise ratio. In ophthalmic diagnosis and glaucoma management, a circular scan around the optic nerve head (so-called peripapillary scan) is a standard OCT scan pattern. As can be seen from FIGS. 19A to 19D, the image quality of the virtual circular scanning is improved by the alignment and merge processing of a plurality of volumes. Virtual scanning compensated for three-dimensional motion distortion, improved signal, reduced speckle noise, and improved layer continuity. This improvement in image quality will further improve the automatic registration used to determine the position of the peripapillar scan when automatically extracting from the volumetric data set. Aligned and combined data sets can also be processed using automated morphometric analysis, such as segmentation, to identify and quantitatively measure retinal layers, such as nerve fiber layers. Improvements in dataset quality will improve the reproducibility of automatic segmentation and other morphometric measurements. Exemplary embodiments are used in conjunction with quantitative measurements of features such as lesion structure and size, including lesions such as crystal cavities, subretinal fluid or choroid plexus neovascular membranes, and age-related macular degeneration and diabetic retina. Diagnosis of disease and monitoring of disease progression.
1100×1100の横断方向のピクセルを有する12mm×12mmのヒトの網膜の大きなデータセットを、図20に示す。1050nmで作動し、軸方向解像度約5μmを有する、200kHz軸方向走査速度の波長掃引型/フーリエ領域OCT撮像システムを使用して、複数の3D OCTボリュメトリックデータセットを得た。目の動きや瞬きが収集時間を制限するため、ほぼ6.4秒という収集時間は、眼科適用で典型的に使用されるものよりは長かった。図21(A)に示すように、x方向を高速走査とするラスタ走査によって得られた第1の3Dデータセットは、収集中に目の瞬きが起こったことを示した。目の瞬きは、OCT眼底画像の網膜データにおけるギャップと関連付けられる長い暗領域として現れた。図21(B)に示すように、y方向を高速走査とするラスタ走査によって得られた第2の3Dデータセットでは、小さな画像歪みが見られた。図21(C)に示すように、例示の実施形態を適用することによって動き補正済ボリュームが生成され、網膜像において第1のボリューム(XFastラスタ)のギャップは、相補的な走査パターン(YFastラスタ)の第2のボリュームからのデータで埋められて、適切に再構築されかつ動き補正されたデータセットが生成された。例示の実施形態により、データセット内の欠測データまたはギャップならびに動き歪み効果を補償することによって、以前可能であったよりも大きなデータセットの収集とより長い収集時間の使用が可能なった。 A large data set of a 12 mm × 12 mm human retina with 1100 × 1100 transverse pixels is shown in FIG. Multiple 3D OCT volumetric data sets were obtained using a 200 kHz axial scan speed wavelength swept / Fourier domain OCT imaging system operating at 1050 nm and having an axial resolution of about 5 μm. The collection time of approximately 6.4 seconds was longer than that typically used in ophthalmic applications because eye movements and blinks limit the collection time. As shown in FIG. 21A, the first 3D data set obtained by raster scanning with high speed scanning in the x direction showed that blinking of the eyes occurred during acquisition. Eye blinks appeared as long dark areas associated with gaps in the retinal data of the OCT fundus image. As shown in FIG. 21B, a small image distortion was seen in the second 3D data set obtained by raster scanning with the y-direction being high-speed scanning. As shown in FIG. 21C, a motion-corrected volume is generated by applying the exemplary embodiment, and the gap of the first volume (XFast raster) in the retinal image is a complementary scanning pattern (YFast raster). ) To generate a properly reconstructed and motion-corrected data set filled with data from the second volume. By way of example embodiments, compensation for missing data or gaps and motion distortion effects in the data set allowed the collection of larger data sets and the use of longer acquisition times than previously possible.
例示の実施形態を使用して、3つ以上のデータセットを位置合わせおよびマージすることもできる。図22(A)は、1100×1100の軸方向走査で横断方向に走査した、12mm×12mmの3D OCTデータセットから抽出された2D断面画像を示す。有意の目の動きおよびデータセットの不連続が、未補正のOCT眼底画像の例に見られる。3つのXFastおよび3つのYFastラスタ走査パターンからなる合計6つのボリュームを順番に収集した。例示の実施形態を適用することにより、全6つのデータセットからの情報を同時に組み込んだ動き補正およびマージした3Dデータセットを生成した。図22(B)は、動き補正およびマージしたものから抽出した2D断面画像を示す。結果として生じた画像は、真の網膜の輪郭を示し、データのギャップを埋め、著しく改善されたコントラストおよび信号−雑音比を示す。これらのデータセットの処理時間は、グラフィックカード(GPU)を使用して90分であった。データセットのOCT眼底画像は、視神経乳頭および中心窩の両方をカバーする包括的構造情報を、1つのマージされたボリュームによって提供できることを示す。 The exemplary embodiment can also be used to align and merge more than two data sets. FIG. 22A shows a 2D cross-sectional image extracted from a 12 mm × 12 mm 3D OCT data set scanned in the transverse direction with an axial scan of 1100 × 1100. Significant eye movements and data set discontinuities are seen in the example of uncorrected OCT fundus images. A total of 6 volumes consisting of 3 XFast and 3 YFast raster scan patterns were collected in sequence. By applying the exemplary embodiment, a motion compensated and merged 3D dataset was created that simultaneously incorporated information from all six datasets. FIG. 22B shows a 2D cross-sectional image extracted from the motion-corrected and merged one. The resulting image shows true retinal contours, fills in data gaps, and exhibits significantly improved contrast and signal-to-noise ratio. The processing time for these data sets was 90 minutes using a graphics card (GPU). The OCT fundus image of the data set shows that comprehensive structural information covering both the optic disc and fovea can be provided by one merged volume.
上述した結果は、任意の軌道に沿って、かつ潜在的には任意の向きで、3Dデータセットから2D画像を抽出できることを示す。2D画像を抽出することに加えて、3Dデータの部分集合もまた、より大きなボリュームから抽出できる。データセットに含まれる特徴に基づいて抽出する領域を定義することが、有用な場合がある。 The results described above show that 2D images can be extracted from a 3D data set along any trajectory and potentially in any orientation. In addition to extracting 2D images, a subset of 3D data can also be extracted from a larger volume. It may be useful to define the region to extract based on features included in the data set.
図23は、2つの3D OCTデータセット(データセット1およびデータセット2)を収集、動き補正、およびマージする処理を説明するフローチャートである。関心特徴、すなわち視神経乳頭が、動き補正およびマージが施されたデータセット内で識別される。識別された、1つまたは複数の特徴の位置および/または向きから、抽出するデータの部分集合が定義される。セグメンテーションを含む、抽出されたデータの分析または処理を行うことができる。図23の右下に示すように、例えば神経線維層厚さ測定などの、データまたは処理済みデータの定量的解析を行うことができる。神経線維層厚さ測定は、緑内障のモニタリングの診断のために使用される。
FIG. 23 is a flowchart illustrating a process of collecting, motion correcting, and merging two 3D OCT data sets (
目の動きによる測定値の変動が、現在、例えば網膜神経線維層厚さなどの形態計測値の有意の誤差源であるため、この例示の実施形態は、疾患診断および疾患進行の追跡の感度を改善する。位置合わせおよびマージはまた、加齢黄斑変性や糖尿病性網膜症などの、他の主要な眼疾患の形態的特徴の評価とともに使用できる。これにより、動き歪みのない真の網膜構造を表すデータセットの作成が可能となり、また、網膜の特徴に対するデータセットの繰り返し位置合わせが可能となる。この繰り返し位置合わせにより、複数の検査に関して、特徴の評価および経時変化の比較が可能になる。 This exemplary embodiment increases the sensitivity of disease diagnosis and tracking of disease progression, as measurement variation due to eye movement is currently a significant source of morphological measurements, such as retinal nerve fiber layer thickness. Improve. Registration and merging can also be used in conjunction with the assessment of morphological characteristics of other major eye diseases such as age-related macular degeneration and diabetic retinopathy. This makes it possible to create a data set representing a true retinal structure without motion distortion, and to repeatedly align the data set with respect to retinal features. This repeated alignment makes it possible to evaluate features and compare changes over time for multiple inspections.
図24(A)〜図24(C)は、3対の独立した3Dデータセットからの、入力データ(上)と動き補正およびマージが施された結果(下)とを示す。各データセット対(すなわち図24(A)、図24(B)および図24(C))は、X高速ラスタ走査およびY高速ラスタ走査のデータセットを含む。この3Dデータセットの3対は、順次に同一の目から収集した。 24 (A) to 24 (C) show input data (upper) and results of motion correction and merging (lower) from three pairs of independent 3D data sets. Each data set pair (ie, FIGS. 24A, 24B, and 24C) includes a data set for X fast raster scan and Y fast raster scan. Three pairs of this 3D data set were collected sequentially from the same eye.
図25(A)〜図25(C)に示すように、マージ後、視神経乳頭の位置が識別され、乳頭周囲の2D画像が3Dデータセットから抽出された。図25(A)、図25(B)および図25(C)は、入力データセットの互いに素な集合からの、位置合わせおよびマージが施された3Dデータセットの3D描画を示す。図25(D)、図25(E)および図25(F)は、これらのデータセットのそれぞれから仮想乳頭周囲円形走査を抽出したものを示す。円の中にアンファス眼底が投影されているのがわかる。 As shown in FIGS. 25 (A) to 25 (C), after merging, the position of the optic disc was identified, and a 2D image around the nipple was extracted from the 3D data set. 25A, 25B, and 25C illustrate 3D rendering of a 3D data set that has been aligned and merged from a disjoint set of input data sets. FIGS. 25 (D), 25 (E) and 25 (F) show the virtual papillary circular scan extracted from each of these data sets. It can be seen that the Amphus fundus is projected in the circle.
関連付けられた未位置合わせの入力データセットから抽出した2Dデータを図26(A)〜図26(C)に示し、動き補正およびマージが施されたデータから抽出した同一のデータを図27(A)〜図27(C)に示す。図26(A)、図26(B)および図26(C)は、図24(A)、図24(B)および図24(C)に示すXFASTデータセットに対応する、抽出した仮想乳頭周囲走査を示す。図27(A)、図27(B)および図27(C)は、図24(A)、図24(B)および図24(C)に示す位置合わせおよびマージが施されたデータセットに対応する、抽出した仮想乳頭周囲走査を示す。位置合わせおよびマージが施されたデータセットから抽出した走査は、XFAST入力データセットから抽出した走査と比較して、3つの走査間で少ない分散を示す。これは、本方法によって再現性が改善できることを示している。 26A to 26C show 2D data extracted from the associated unaligned input data set, and the same data extracted from the data subjected to motion correction and merging is shown in FIG. ) To FIG. 27 (C). 26 (A), 26 (B), and 26 (C) show the extracted virtual papillary circumference corresponding to the XFAST data set shown in FIGS. 24 (A), 24 (B), and 24 (C). Indicates a scan. 27 (A), 27 (B), and 27 (C) correspond to the data sets subjected to the alignment and merging shown in FIGS. 24 (A), 24 (B), and 24 (C). The extracted virtual teat perimeter scan is shown. Scans extracted from the aligned and merged data set show less variance between the three scans compared to scans extracted from the XFAST input data set. This indicates that reproducibility can be improved by this method.
動き補正およびマージ(図26(A)〜図26(C))する前は、データ内には、多くの動きアーティファクトおよびギャップがある。なお、画像に描画された垂直線は、当該画像内の血管の相対的位置関係を示すのに役立つ。血管はあまり揃っていないが、これは、目の動きに起因して画像の所望の位置に誤差が生じていることを示している。動き補正およびマージ(図27(A)〜図27(C))後、データセットは真の網膜形態を示し、コントラストが強調され、信号−雑音比が改善されている。なお、画像に描画された垂直線は、血管の相対的位置関係を示すのに役立つ。動き補正済画像の血管はよく揃っており、網膜構造に関する位置合わせが改善され、OCTデータセット間の再現性が改善されたことを示している。 Prior to motion correction and merging (FIGS. 26A-26C), there are many motion artifacts and gaps in the data. The vertical line drawn on the image is useful for showing the relative positional relationship of the blood vessels in the image. Although the blood vessels are not so aligned, this indicates that there is an error in the desired position of the image due to eye movement. After motion correction and merging (FIGS. 27A-27C), the data set shows true retinal morphology, with enhanced contrast and improved signal-to-noise ratio. The vertical line drawn in the image is useful for showing the relative positional relationship between blood vessels. The blood vessels in the motion-corrected image are well aligned, indicating improved alignment with respect to the retinal structure and improved reproducibility between OCT data sets.
(実施例2)
本実施例は、直交のラスタ走査パターンを使用して収集した、1対の3次元OCTデータセットの動き補正およびマージを行う場合の例である。動き補正のための例示の方法を、目的関数の構築、変換の算出、および動き補正済み3D OCTデータセットのマージを含み、数学的に詳細に記述する。正則化、多重解像度法、前処理およびグラフィックカードを使用した加速化の例も示す。
(Example 2)
This embodiment is an example of performing motion correction and merging of a pair of three-dimensional OCT data sets collected using orthogonal raster scan patterns. Exemplary methods for motion correction are described in mathematical detail, including construction of objective functions, calculation of transformations, and merging of motion corrected 3D OCT data sets. Examples of regularization, multi-resolution methods, preprocessing and acceleration using a graphics card are also shown.
1.1 基本動作
時間領域OCTでは、深さ走査は、参照ビームを反射する鏡を動かすことによって行われる。参照アーム鏡が離れている度合いに依存して、組織の深さプロファイルの異なる部分を、検出器を使用して再構築できる。したがって、時間領域OCTは、ある範囲に対して参照アーム鏡を高速に掃引して深さすなわち軸方向走査を生成することを伴う。一方、フーリエまたは周波数領域OCTでは、深さ走査は、広帯域干渉を使用することにより、直ちに得ることができる。検出器アレイおよび分散素子が、干渉波のスペクトルを記録するために使用される。これらから、深さ走査情報を再構築することができる。フーリエ領域OCTの場合には参照アーム鏡を動かす必要がないため、走査速度を大幅に改善できる。掃引レーザーを使用する波長掃引型OCTシステムも、同様の特徴を有しかつ高速度で動作する。
1.1 Basic Operation In time domain OCT, depth scanning is performed by moving a mirror that reflects the reference beam. Depending on the degree to which the reference arm mirror is separated, different portions of the tissue depth profile can be reconstructed using the detector. Thus, time domain OCT involves rapidly sweeping the reference arm mirror over a range to produce a depth or axial scan. On the other hand, in Fourier or frequency domain OCT, a depth scan can be obtained immediately by using broadband interference. A detector array and a dispersive element are used to record the spectrum of the interference wave. From these, depth scan information can be reconstructed. In the case of Fourier domain OCT, it is not necessary to move the reference arm mirror, so that the scanning speed can be greatly improved. Wavelength swept OCT systems that use a swept laser have similar characteristics and operate at high speeds.
単一の軸方向走査すなわちA走査の走査は、位置 A single axial or A-scan scan is
![]()
![]()
および時間tの関数として、モデル化できる And can be modeled as a function of time t
![]()
![]()
ここで、 here,
![]()
![]()
はA走査が含む値の数である。返されたA走査は、走査装置に対する座標において、 Is the number of values that the A scan contains. The returned A-scan is in coordinates relative to the scanning device
![]()
![]()
から From
![]()
![]()
までの範囲の1次元のプロファイルの離散化バージョンを表す。
ここで、rangezは、OCT装置の侵入度に関し、Z方向に撮像される範囲を示す。
Represents a discretized version of a one-dimensional profile ranging up to
Here, range z indicates a range in which an image is captured in the Z direction with respect to the degree of penetration of the OCT apparatus.
周波数領域OCT装置の最新バージョンは、1秒につき最高300,000のA走査を走査できる(Potsaid, B. and Gorczynska, I. and Srinivasan, V.J. and Chen, Y. and Jiang, J. and Cable, A. and Fujimoto, J.G. Ultrahigh speed spectral/Fourier domain OCT ophthalmic imaging at 70,000 to 312,500 axial scans per second. Opt. Express, 16:15149--15169, 2008.)。これにより、軸方向走査からの3Dボリュームデータの高密度サンプリングがわずか数秒で行える。 The latest version of the frequency domain OCT system can scan up to 300,000 A scans per second (Potsaid, B. and Gorczynska, I. and Srinivasan, VJ and Chen, Y. and Jiang, J. and Cable, A and Fujimoto, JG Ultrahigh speed spectral / Fourier domain OCT ophthalmic imaging at 70,000 to 312,500 axial scans per second. Opt. Express, 16: 15149--15169, 2008.). This enables high-density sampling of 3D volume data from axial scanning in just a few seconds.
1.2 ボリューム走査処理
ボリュームは、以下のように画像として記述できる。
1.2 Volume Scan Processing Volume can be described as an image as follows.
![]()
![]()
ここで、i、jおよびkは、3つの空間ディメンションの別々の指標である。w(V)はx方向のサンプル数を指し、h(V)はy方向のサンプル数を指し、d(V)は同様にz方向のサンプル数を指す。3Dボリュームをサンプリングする最も簡単な方法は、これもまた本実施例で使用するが、2次元のグリッド上のA走査をサンプリングすることである。グリッドは、2つの互いに直交するベクトル Here, i, j and k are separate indicators of the three spatial dimensions. w (V) indicates the number of samples in the x direction, h (V) indicates the number of samples in the y direction, and d (V) similarly indicates the number of samples in the z direction. The simplest way to sample a 3D volume is to sample an A scan on a two-dimensional grid, which is also used in this example. The grid is two orthogonal vectors

および and
を使用して定義できる。 Can be defined using
次いで、このボリュームデータの収集は以下のように作用する。グリッドは、まず、いわゆる高速軸 The collection of volume data then operates as follows. The grid is the so-called high-speed axis
![]()
![]()
に沿ってw(V)A走査することで横断される。1つのA走査を走査してから次のA走査位置に位置付けるまでの時間は、 Is traversed by scanning w (V) A along The time from scanning one A scan to positioning to the next A scan position is:
![]()
![]()
と表される。この線形走査から生じる2次元のデータは、それがA走査で構成されることから、B走査と称される。B走査が完了すると、光ビームは、 It is expressed. The two-dimensional data resulting from this linear scanning is called B scanning because it consists of A scanning. When the B-scan is complete, the light beam is
![]()
![]()
に沿って開始位置へ戻り、同時に、 At the same time,
![]()
![]()
に沿って1ユニットを移動させて次のB走査を走査するための開始位置に着かせる。フライバック時間と称されるこの時間は、 Is moved to the start position for scanning the next B scan. This time, called flyback time,
![]()
![]()
秒である。その後、この処理は、全グリッドがサンプリングされるまで、h(V)回繰り返される。 Seconds. This process is then repeated h (V) times until the entire grid has been sampled.
サンプリング処理の時間構造についての情報は、時刻をサンプリンググリッド上の位置(i,j)に関連付ける Information about the time structure of the sampling process associates the time with the position (i, j) on the sampling grid.
![]()
![]()
と称される2次元の画像を使用して、簡潔に表せる。この画像は、以下のように定義できる。 It can be expressed succinctly using a two-dimensional image called This image can be defined as follows.
![]()
![]()
ここで、 here,
![]()
![]()
そして、第1のサンプルの時刻 And the time of the first sample
![]()
![]()
は Is
であると仮定する。 Assume that
この式から、 From this formula:
![]()
![]()
と When
![]()
![]()
との違いが明白になる。ボリュームの第1の指標およびサンプル時間画像にマッピングされる高速軸 The difference is clear. Fast axis mapped to volume first indicator and sample time image
![]()
![]()
に沿って、隣接するサンプル同士は、 Along adjacent samples,
![]()
![]()
しか時間的に離れていない。一方、第2の指標になる However, they are not separated in time. On the other hand, it becomes the second indicator
![]()
![]()
に沿っては、隣接する要素は、 Along the adjacent elements
![]()
![]()
離れている。このことは、収集中のスキャナとサンプルとの間の動きをセクション3で考慮する際に、重要になる。
is seperated. This is important when considering the movement between the scanner and sample being collected in
したがって、3つの指標(i,j,k)における結果として生じるボリュームデータは、一般に次のように表すことができる。 Accordingly, the resulting volume data at the three indices (i, j, k) can generally be expressed as:
![]()
![]()
このとき、最初のサンプリング位置は At this time, the first sampling position is
である。 It is.
は、AScan関数によって生成されるベクトルのk番目の成分を選択するためにここで使用されるk番目のユニット基底ベクトルを表す。 Represents the kth unit basis vector used here to select the kth component of the vector generated by the AScan function.
1.3 動きのアーティファクト
最新のOCT技術を使用してボリュームを走査する典型的な時間は、数秒程度である(Potsaid, B. and Gorczynska, I. and Srinivasan, V.J. and Chen, Y. and Jiang, J. and Cable, A. and Fujimoto, J.G. Ultrahigh speed spectral/Fourier domain OCT ophthalmic imaging at 70,000 to 312,500 axial scans per second. Opt. Express, 16:15149--15169, 2008.)。OCT装置自体はこの間に静止していると仮定する。しかし、生きている人間の網膜背景を走査する具体的な場合においては、様々な動きの源は回避できない。第1の動きの成分は、患者の呼吸によって生じる。それは、主にz方向において、比較的ゆっくりとしたスムーズで流れるような動きとして現れる。
1.3 Motion Artifacts Typical time to scan a volume using the latest OCT technology is on the order of seconds (Potsaid, B. and Gorczynska, I. and Srinivasan, VJ and Chen, Y. and Jiang, J. and Cable, A. and Fujimoto, JG Ultrahigh speed spectral / Fourier domain OCT ophthalmic imaging at 70,000 to 312,500 axial scans per second. Opt. Express, 16: 15149--15169, 2008.). Assume that the OCT apparatus itself is stationary during this time. However, in the specific case of scanning the living human retinal background, various sources of motion cannot be avoided. The first movement component is caused by patient breathing. It appears as a relatively slow, smooth and flowing movement, mainly in the z direction.
一方、随意にせよ不随意にせよ目自体の動きがある。目の動きには多くの異なる理由や対応するタイプがあるが、この実施例では、それらは、低速の流れるような動きと高速の大規模な動きとに分けることができる。大規模な動きは、主に、いわゆるサッケードによって生じる。これらのタイプの動きは両方とも目の角度的動きとして起こり、xおよびy方向の動きにほぼマッピングされる。 On the other hand, there are movements of the eyes themselves, either voluntarily or involuntarily. There are many different reasons and corresponding types of eye movements, but in this embodiment they can be divided into slow flowing movements and fast large movements. Large scale movements are mainly caused by so-called saccades. Both of these types of movements occur as angular movements of the eye and are roughly mapped to movements in the x and y directions.
OCTボリュームデータの走査は時間の単一の固定点では起こらないので、収集中の動きは、例えば正確な診断を行うという医学的場面において必要な、空間的に一貫したデータをサンプリングすることに課題を残す。 Since scanning of OCT volume data does not occur at a single fixed point in time, movement during acquisition is a challenge in sampling the spatially consistent data required in medical situations, for example, in making accurate diagnoses. Leave.
動きのアーティファクトの問題を詳細に説明するために、収集中に起こる動きをまずモデル化する。このために、関数AScanは、時間の1つの固定点において全グリッドについてサンプリングされ得ると仮定する。この固定点は任意に選択され、その時点をt=0とする。当然、動きが生じるには時間の経過が必要なため、ある固定時点のみでサンプリングされた想像上のボリュームは、いかなる動きも有さない。したがって、ある位置 To explain in detail the problem of motion artifacts, we first model the motion that occurs during acquisition. For this, it is assumed that the function Asscan can be sampled for the entire grid at one fixed point in time. This fixed point is arbitrarily selected, and that time is set to t = 0. Of course, an imaginary volume sampled only at a fixed point in time does not have any movement, because it takes time for movement to occur. Therefore, a certain position
![]()
![]()
および時間 And time
![]()
![]()
におけるAScanを、t=0における当該関数に対して以下のように、定義できる。 Can be defined for the function at t = 0 as follows:
![]()
![]()
これは、固定時t=0におけるオブジェクトの位置に対し、時間tで走査されるオブジェクトの、空間における位置をモデル化する関数 This is a function that models the position in space of an object scanned at time t with respect to the position of the object at fixed time t = 0.
![]()
![]()
を導入することによってなされる。例えばオブジェクトが収集中に全く動かない場合、変位は、常に同一のベクトルとなる。さらにオブジェクトが時間t=0から収集開始まで動かなかった場合、変位は常に零ベクトルとなる。 Is made by introducing For example, if the object does not move at all during acquisition, the displacement will always be the same vector. Further, if the object does not move from time t = 0 to the start of collection, the displacement is always a zero vector.
しかし、目のトラッキングまたは同様のハードウェアを採用していないため、サンプリング位置でのdisp(V)の値は分からない。しかし、disp(V)(t)は識別可能であり、一定の平滑度を阻害すると仮定する。この平滑度は、変位関数の勾配P∇disp(V)(t)Pのノルムと未知であるが固定の定数csmoothを使用して、以下のように表すことができる。 However, since eye tracking or similar hardware is not employed, the value of disp (V) at the sampling position is unknown. However, it is assumed that disp (V) (t) is identifiable and inhibits a certain smoothness. This smoothness can be expressed as follows using the norm of the gradient P 関 数 disp (V) (t) P of the displacement function and the unknown but fixed constant c smooth .
![]()
![]()
この平滑度の仮定は、物理的に解釈すれば合理的である:それはオブジェクトの速度が上限を有することを意味するからである。オブジェクトの動きは、動きが起こらなかった場合のボリュームの見え方に対し、歪んだボリュームをもたらす。具体的には、オブジェクトのいくつかの領域は複数回サンプリングされるかもしれず、一方で、他の領域は全くサンプリングされないかもしれない。一般に、ボリュームのボクセルは、オブジェクトの期待された領域から取り出されたサンプルに、対応しないことがある。 This smoothness assumption is reasonable from a physical point of view because it means that the speed of the object has an upper bound. The movement of the object results in a distorted volume relative to how the volume appears when no movement occurs. In particular, some areas of the object may be sampled multiple times while other areas may not be sampled at all. In general, a voxel of a volume may not correspond to a sample taken from the expected area of the object.
また、動きは時間的にある平滑度を有すると考えられるため、歪みは、高速軸および低速軸に沿って異なって現れる。 Also, since the motion is considered to have a certain degree of smoothness in time, the distortion appears differently along the fast axis and the slow axis.
ラスタ走査を見ると、画像データは、高速走査方向に沿ってスライスで見たときには、一般に、比較的完全である。しかし、直交する低速方向では、低速方向において、動きのアーティファクトは、はるかにはっきりと現れる。 Looking at raster scans, the image data is generally relatively complete when viewed in slices along the fast scan direction. However, in the orthogonal slow direction, motion artifacts appear much more clearly in the slow direction.
この差は、高速軸および低速軸に沿った隣接するサンプル間の時間差を、動きの平滑度の仮定とともに見ることによって、説明できる。一般に、ある時点t0+δtでの変位関数d(V)(t)の値は、次のように表せる。 This difference can be explained by looking at the time difference between adjacent samples along the fast and slow axes, along with the assumption of motion smoothness. In general, the value of the displacement function d (V) (t) at a certain time point t 0 + δt can be expressed as follows.
式(9)の平滑度仮定を採用することによって、時間δt内の変位の変化のノルムは、以下によって制限できる。 By adopting the smoothness assumption of equation (9), the norm of the change in displacement within time δt can be limited by:
![]()
![]()
低速軸δtslow(式6を参照)に沿った1つのグリッドサンプル点から次のグリッドサンプル点までにかかる時間は、高速軸δtfastに沿ったそれぞれの時間よりも典型的には何倍も長い(例えば約500倍)ので、式11から、変位の変化、そしてこれによって、歪みもまた低速軸に沿って非常に大きくなることができる。 The time taken from one grid sample point along the slow axis δt slow (see Equation 6) to the next grid sample point is typically many times longer than the respective time along the fast axis δt fast. (E.g., about 500 times), from Equation 11, the change in displacement, and thereby the distortion, can also be very large along the slow axis.
1.4 提供されたデータ
提供されたデータに反映される基本的な考えは、互いに直交する高速軸方向でサンプリングされた2つのボリュームを使用して、動きのアーティファクトを補正するということである。上述から分かるように、高速軸に沿った歪みは低いと思われる。これらの高速軸、したがって小さい歪みが空間において異なる向きを有する、ボリュームが2つ存在するということと組み合わせて、このことは、変位関数によって表されるような歪みを見つけるために使用される。その後、この変位情報を使用して、この2つの歪んだバージョンから1つの動き補正済ボリュームが再構築される。
1.4 Provided Data The basic idea reflected in the provided data is to correct motion artifacts using two volumes sampled in a fast axis direction orthogonal to each other. As can be seen from the above, the strain along the fast axis appears to be low. In combination with the presence of two volumes, where these fast axes and thus small strains have different orientations in space, this is used to find the strain as represented by the displacement function. This displacement information is then used to reconstruct a motion corrected volume from the two distorted versions.
XFASTと称されるボリュームの第1のタイプは、上に詳述したように、その高速軸方向を The first type of volume, called XFAST, has its fast axis direction as detailed above.
とし、低速方向を And the low speed direction
として、サンプリングされるボリュームであり、 As the volume being sampled,
w(XFAST)およびh(XFAST)は、それらの等価物をセクション2で記述した、
w (XFAST) and h (XFAST) described their equivalents in
wおよびhに有する。rangexyは、ワールド座標においてxおよびyの両方向に走査が行われる範囲である。 w and h. Range xy is a range in which scanning is performed in both x and y directions in world coordinates.
同様に、ボリュームYFASTの2つの方向は、 Similarly, the two directions of volume YFAST are:
および and
であり、これによって、2つのボリュームが空間内で直交する高速軸方向を有するように向きが定められる。 Thus, the two volumes are oriented so that they have fast axis directions that are orthogonal in space.
OCTボリューム走査に関連した部分を詳細に見てきたが、以下では、動きのアーティファクト補正という課題を解決するために使用する方法を記載する。 Having looked at the details related to OCT volume scanning, the following describes a method used to solve the problem of motion artifact correction.
2. 方法
本セクションでは、動きのアーティファクトを低減するという問題を解決するために開発した方法を中心に述べる。この問題を1種の特別な位置合わせの問題として扱う基本概念は、以下のセクション2.1で導き出される。目的関数(2.2)、問題の多重解像度表現(2.3)、最適化戦略(2.4)および位置合わせ結果のマージ(2.5)を以下のセクションで扱う。最後に、前処理(セクション2.6)、ボリューム補間(セクション2.7)、およびOpenGLを使用する加速化(セクション2.8)の実際的な構成を扱う。
2. Methods This section focuses on methods developed to solve the problem of reducing motion artifacts. The basic concept of treating this problem as a kind of special alignment problem is derived in section 2.1 below. The objective function (2.2), the multiresolution representation of the problem (2.3), the optimization strategy (2.4) and the merge of the alignment results (2.5) are dealt with in the following sections. Finally, the practical configuration of preprocessing (section 2.6), volume interpolation (section 2.7), and acceleration using OpenGL (section 2.8) is addressed.
2.1 演繹
入力として、上述した2つのボリュームXFASTi,j,kおよびYFASTi,j,kが収集される。さらに、両走査の走査処理の時間情報は分かっている。時刻を走査グリッドの各サンプルに関連付けるこの情報は、2つの画像
2.1 Deduction The two volumes XFAST i, j, k and YFAST i, j, k described above are collected as inputs. Furthermore, the time information of the scanning process for both scans is known. This information, which associates the time with each sample of the scan grid,
![]()
![]()
および and
![]()
![]()
によって、各ボリュームに1つずつ(式(3)および(4)を参照)、伝えられる。 , One for each volume (see equations (3) and (4)).
同一のオブジェクトが走査されるので、この2つのボリュームのボクセルは、同一の関数 Since the same object is scanned, these two volume voxels have the same function
![]()
![]()
(式(7)を参照)を使用して表すことができ、この関数は、2つの未知の変位関数disp(XFAST)(t)およびdisp(YFAST)(t)(式(8)を参照)を採用することによって固定時点 (See equation (7)), which can be expressed as two unknown displacement functions disp (XFAST) (t) and disp (YFAST) (t) (see equation (8)) By adopting fixed time
![]()
![]()
における値に縮小できる。別の言い方をすると、以下のようになる。 Can be reduced to In other words:
および and
トランスポジション(transposition)およびフリッピング(flipping)演算をボリュームならびにSTIME画像(セクション2.6を参照)に対して使用することで、YFASTの指標の意味を変えてXFASTと同じベースに関連付けることができる。結果として生じるボリュームおよび時間係数は、YFASTRと呼ばれ、サンプリング時間画像は、 Transposition and flipping operations can be used on volumes and STIME images (see section 2.6) to change the meaning of the YFAST index and associate it with the same base as XFAST. The resulting volume and time factor is called YFASTR and the sampling time image is
![]()
![]()
と称される。そして、これらの式は、 It is called. And these equations are
および and
となる。 It becomes.
ここで、XFASTおよびYFASTRはグリッド点で定義されるだけでなく、ボリュームデータを補間しAScan関数と同じ座標系を使用する2つの関数 Here, XFAST and YFASTR are not only defined by grid points, but also two functions that interpolate volume data and use the same coordinate system as the Ascan function.
![]()
![]()
および and
![]()
![]()
がある、と仮定する。 Suppose that there is.
![]()
![]()
について、
上記式は、
about,
The above formula is
![]()
![]()
および and
![]()
![]()
となる。変数置換を使用することにより、変位関数は、式の左辺へ移動することができ、 It becomes. By using variable substitution, the displacement function can be moved to the left side of the expression,
![]()
![]()
および and
![]()
![]()
となる。これらの置換によって、関数XintおよびYintはもはや、ボリュームの元のグリッド点上にまさにある位置から必ずしもサンプリングするわけではなくなるので、2つの未知のエラーベクトル It becomes. Because of these substitutions, the functions Xint and Yint no longer always sample from a certain location on the original grid point of the volume, so two unknown error vectors
および and
が導入される。これらのエラーベクトルは、その特定の点でAScan関数をサンプリングできた場合にはどのような結果になるかに照らし合わせて、提供されたボリュームデータの補間の差をモデル化する。これらの式の両方の右辺が等しいので、以下によって、グリッド点(i,j)における差すなわち残差ベクトル Is introduced. These error vectors model the difference in interpolation of the provided volume data in the light of what would result if the AScan function could be sampled at that particular point. Since the right sides of both of these equations are equal, the difference at grid point (i, j), ie the residual vector, is
を調べることができる。 Can be examined.
グリッド点(i,j)における両方の変位関数値が分かれば、XintおよびYintによって補間された値は、似たような値になるはずである。なぜなら、それらは、同一の時刻と位置における本質的に同一のAScan関数値の、雑音が多いバージョンとなるだろうからである。この残差の、ベクトル長のようないかなる測定値も、2つの変位関数の正しい値を得るためには最小でなければならないという考えから、2つの雑音成分εxおよび得εyは、XintおよびYintの実際のデータ成分に比べて小さく、結果を相殺する傾向があると仮定する。 If both displacement function values at grid point (i, j) are known, the values interpolated by Xint and Yint should be similar. This is because they will be noisy versions of essentially the same Ascan function value at the same time and location. From the idea that any measurement of this residual, such as the vector length, must be minimal to obtain the correct value of the two displacement functions, the two noise components ε x and ε y are given by Xint and Assume that it is small compared to the actual data component of Yint and tends to cancel the result.
全てのグリッド点をまとめて考慮すると、変位場を見つけるための第1のバージョンは、次のように公式化できる。 Considering all grid points together, the first version for finding the displacement field can be formulated as follows:
ここで、 here,
![]()
![]()
は何らかの種類の距離測定値(セクション2.2を参照)である。 Is some type of distance measurement (see section 2.2).
この式に足りないものは、変位関数は時間的に平滑である(式(9)を参照)と、考えられるという点である。このために、時間に関して変位関数の高勾配にペナルティを与えることによって平滑な変位関数にフェイバを与える正則化項を、この式に加える。 What is lacking in this equation is that the displacement function is considered to be smooth in time (see equation (9)). For this purpose, a regularization term is added to the equation that gives a smooth displacement function a favour by penalizing the high gradient of the displacement function with respect to time.
に対応して、すべてのグリッド点は、2つの勾配(各変位関数につき1つ)に関連付けることができる。これらは、XFASTボリュームについては Corresponding to, all grid points can be associated with two gradients (one for each displacement function). These are for XFAST volumes
![]()
![]()
YFASTRについては、 About YFASTR
![]()
![]()
となる。これらのベクトルは、距離測定値 It becomes. These vectors are distance measurements
![]()
![]()
に再度入れられる。また、この式のボリューム距離部と正則化項部の間の相対的な重要度の調整ができるように、正則化項重み係数 Re-entered. In addition, the regularization term weighting factor can be adjusted so that the relative importance between the volume distance part and the regularization term part can be adjusted.
![]()
![]()
が導入される。次に、最適化作業は、 Is introduced. Next, the optimization work is
となり、
ここで、目的関数を最小化する連続関数が求められる。
And
Here, a continuous function that minimizes the objective function is obtained.
しかし、目的関数を評価するためには、グリッド点に対応する有限数の時間ステップにおける変位関数のための値がありさえすればよい。したがって、グリッド点における値としての変位場の直接パラメータ化を、この例において使用する。すると、ボリュームVのための変位場は、 However, in order to evaluate the objective function, it is only necessary to have a value for the displacement function at a finite number of time steps corresponding to the grid points. Therefore, a direct parameterization of the displacement field as a value at the grid points is used in this example. Then, the displacement field for volume V is
となり、ここで、 Where
は指標ペア(i,j)における方程式STIMEi.jで定義されるサンプル時間画像であり、 Is the sample time image defined by the equation STIME ij in the index pair (i, j),
は元の連続変位関数である。このパラメータ化を使用することにより、ボリューム残差は次のように表すことができる。 Is the original continuous displacement function. By using this parameterization, the volume residual can be expressed as:
変位場の有限パラメータ化のために、式(27)および(28)にて説明したように、時間に沿った場の勾配は、グリッド点間の有限差分を使用して表される。式は、 Due to the finite parameterization of the displacement field, the field gradient over time is expressed using finite differences between grid points, as described in equations (27) and (28). ceremony,
および and
となる。ここで、2つの関数Nexti(i)およびNextj(j)は、(i,j)のサンプルの次のサンプルが位置するグリッドの指標を見つける方法を提供する。このような関数は、例えば、サンプル時間画像の時刻値をソートし、その時刻に関連付けられた指標ペアを記憶することによって、容易に前もって生成できる。完璧にするために、現在の指標が最後のサンプルに対応する場合には、両勾配を零ベクトルに定義する。こうすることで、次の位置は定義されない。 It becomes. Here, the two functions Next (i) and Nextj (j) provide a way to find the index of the grid where the next sample of the samples of (i, j) is located. Such a function can be easily generated in advance, for example, by sorting the time values of the sample time image and storing the index pair associated with that time. For completeness, if the current index corresponds to the last sample, both slopes are defined as zero vectors. In this way, the next position is not defined.
これらの変化をまとめると、最適化作業は、 Summing up these changes, the optimization work is
となり、この公式を、本実施例の以下全てにわたって使用する。なお、新しい係数1/whが、異なるパラメータ数およびボリュームサイズを有する目的関数のバージョン間で結果を比較する方法を提供するために加えられている。これは、マルチ解像度最適化(セクション2.3を参照)において好ましい。
And this formula is used throughout all of the following examples. Note that a
2.2 目的関数
本セクションでは、目的関数およびその最適化に関する実際的な詳細を中心に述べる。
2.2 Objective Function This section focuses on practical details about the objective function and its optimization.
2.2.1 時間モデリング
まず、
2.2.1 Time modeling First,
![]()
![]()
で表わされる処理の時間構造を考える。式(4) Consider the time structure of the process represented by Formula (4)
![]()
![]()
を見ると、時間w(V)tAscan(フライバックを含まない1つのB走査を行うのに必要な時間)が1と等しくなるように正規化されるよう、スケーリング(拡大縮小)がtAscanとtflybackに対して行われる。このようにして、時間構造はサンプリング座標系に直接関連し、そこではボリュームの一端から他端までの距離も1である(セクション2.7を参照)。また、B走査の時間に対してフライバックにかかる相対時間をスケーリングする方法を提供する , The scaling (scaling) is t Ascan so that the time w (V) t Ascan (the time required to perform one B scan without flyback) is equal to 1. And t flyback . In this way, the time structure is directly related to the sampling coordinate system, where the distance from one end of the volume to the other is also 1 (see section 2.7). Also provided is a method for scaling the relative time taken for flyback with respect to the time of B-scan.
![]()
![]()
と称される係数が導入される。この係数の標準的な設定は、元の状態に対して変化が生じないように、facflyback=1である。しかし、この係数を変えることにより、B走査間の変位の多少の変化に対してゆとりが与えられて、位置合わせ処理、特に正則化項、を調整する方法が提供される。 A coefficient called is introduced. The standard setting for this coefficient is fac flyback = 1 so that no change occurs with respect to the original state. However, changing this factor provides room for some change in displacement between B-scans and provides a way to adjust the alignment process, especially the regularization term.
2.2.2 距離測定値
式(34)
2.2.2 Distance measurement value Formula (34)
を再考すると、距離測定値 Rethinking the distance measurement
![]()
![]()
ならびに具体的な正則化関数(regularizing function) And a specific regularizing function
![]()
![]()
はまだ定義されていない。 Is not yet defined.
両ボリュームからのデータが同一の走査処理から生じるので、単峰型の位置合わせが存在する場合がある。この場合の一般的に用いられる距離測定値は、差の二乗和すなわちSSD測定値である。それは、次のように定義される。 Since the data from both volumes comes from the same scanning process, there may be a single-peak alignment. A commonly used distance measurement in this case is the sum of squares of the difference, or SSD measurement. It is defined as follows:
![]()
![]()
最適化のために必要な関数の勾配は、 The gradient of the function required for optimization is
![]()
![]()
である。 It is.
2.2.3 正則化
正則化関数
2.2.3 Regularization Regularization function
![]()
![]()
の目的は、高い出力値を生成する、時間に関する変位場の高勾配にペナルティを与えることである。一般の正則化項重み係数あるαに加え、x/y方向とz方向との動きの違いを考慮する係数 The purpose of is to penalize the high gradient of the displacement field over time, producing a high output value. In addition to the regular regularization term weight coefficient α, a coefficient that takes into account the difference in motion between the x / y direction and the z direction
![]()
![]()
が加えられる。係数1は、全方向に同一のペナルティを与えることになる。この係数の値を上げるとz方向の動きによりペナルティを与えることができ、この係数の値を下げると、より多くの自由が与えられる。 Is added. A factor of 1 will give the same penalty in all directions. Increasing the value of this coefficient can give a penalty by movement in the z direction, and lowering the value of this coefficient gives more freedom.
2.2.3.1 SSD正則化項
第1の正則化関数もまた、SSD距離測定値と同様に、ベクトルの二乗長さを使用する。この関数は、
2.2.3.1 SSD regularization term The first regularization function also uses the square length of the vector, similar to the SSD distance measurement. this function is,
![]()
![]()
であり、
勾配は
And
The slope is
![]()
![]()
である。この関数の1つの重要な特性は、ノルムでないということである。具体的には、スカラースケーリングファクタ(scalar scaling factor)の下での線形性が、係数 It is. One important property of this function is that it is not a norm. Specifically, the linearity under the scalar scaling factor is the factor
![]()
![]()
に関して Regarding
![]()
![]()
とならない。このため、この関数は、ノルムが与えるよりも、高勾配にペナルティを与える。これにより、変位場としてより平滑な解を与える傾向が生まれる。なぜなら、正則化項は、増加の全体の大きさは同じになるようにして、変位の単一の大きな増加に比べて変位の多くの小さな増加に対してフェイバを与えるからである。 Not. For this reason, this function penalizes higher gradients than does norm. This creates a tendency to give a smoother solution as the displacement field. This is because the regularization term gives the favour for many small increases in displacement compared to a single large increase in displacement, such that the overall magnitude of the increase is the same.
2.2.3.2 L1正則化項
この作業に使用する第2の正則化項は、L1ノルムに基づいており、この場合のように3次元ベクトルに対しては、以下のように定義される。
2.2.3.2 L1 regularization term The second regularization term used for this work is based on the L1 norm and, as in this case, is defined as The
![]()
![]()
残念ながら、絶対値関数の導関数は平滑ではなく、2次導関数は定義さえされていない。したがって、L1ノルムを直接使用すれば、標準の勾配に基づく技術を使用して目的関数を最適化する際に、深刻な問題が起こるであろう。 Unfortunately, the derivative of the absolute value function is not smooth and the second derivative is not even defined. Therefore, the direct use of the L1 norm will cause serious problems when optimizing the objective function using standard gradient based techniques.
この問題を迂回するために、L1ノルムは、パラメータ To circumvent this problem, the L1 norm is a parameter
![]()
![]()
に基づく平滑な関数で近似される。結果として生じる正則化項は、次の通りである。 Is approximated by a smooth function based on The resulting regularization term is:
ここで、導関数は、 Where the derivative is
である。εl1regが小さければ小さいほど、正則化関数は真のL1ノルムに近づくが、導関数の平滑度が減少するので、最適化がより難しくなる。実際には、εl1regは0.05とされる。 It is. The smaller ε l1reg, the closer the regularization function is to the true L1 norm, but the more difficult the optimization is because the smoothness of the derivative decreases. Actually, ε l1reg is set to 0.05.
SSD正則化項とは対照的に、このバージョンは、線形以上に(真のL1の場合)異常値にペナルティを与えず、(イプシロンバージョンでは)それほど強くは異常値にペナルティを与えない。この結果、正則化項に対するカウンターウェイト、すなわち、距離測定値が平滑な解にフェイバを与える場合にのみ、解は平滑になるであろう。この点において、それはよりデータ駆動型であり、例えばサッケードから生じる不連続をより容易にモデル化できる。一方では、この関数は、より非線形であり、一般に最適化がより難しい。 In contrast to the SSD regularization term, this version does not penalize outliers beyond linear (in the case of true L1) and does not penalize outliers as strongly (in the epsilon version). As a result, the solution will be smooth only if the counterweight for the regularization term, i.e., the distance measurement gives a smoother solution. In this respect, it is more data driven and can more easily model discontinuities arising from, for example, saccades. On the one hand, this function is more non-linear and generally more difficult to optimize.
2.3 多重解像度表現
ここで示す最適化作業は、非線形最適化という問題である。この問題もまた大規模であり、例えばそれぞれ400×400のA走査を行う2つのボリュームを位置合わせするときには、パラメータ空間の次元数は、400・400・2・3=960000である。一般に、このような問題のための標準の最適化手法は、目的関数の局所的最小点にすぎない解を出す(Nocedal, J. and Wright, S.J. Numerical optimization. Springer, 1999.)。最適化の起点が大域的最小点に十分に近い場合にのみ、良好な解に達することができる。
2.3 Multi-resolution representation The optimization work shown here is a problem of nonlinear optimization. This problem is also large-scale. For example, when aligning two volumes each performing A scan of 400 × 400, the number of dimensions of the parameter space is 400 · 400 · 2 · 3 = 960000. In general, standard optimization techniques for such problems yield solutions that are only local minimums of the objective function (Nocedal, J. and Wright, SJ Numerical optimization. Springer, 1999.). A good solution can only be reached if the starting point of the optimization is sufficiently close to the global minimum.
解のグローバル性を改善しかつアルゴリズムランニングタイムを改善する1つの方法は、例えば、Lu, W. and Chen, M.L. and Olivera, G.H. and Ruchala, K.J. and Mackie, T.R. Fast free-form deformable registration via calculus of variations. Physics in Medicine and Biology, 49(14):3067--3087, 2004に使用されるような最適化問題の多重解像度表現を採用することである。ここでは、複雑度が増加する最適化問題の複数のバージョンが使用される。また、より低い複雑度の解の結果をより高い複雑度の初期化にマッピングする方法も定義しなければならない。その後、最適化が比較的容易な問題の簡単なバージョンから、最適化が始まる。次いで、この簡単な問題の結果は、次のより難しい問題のための初期化として使用され、これがまた最適化される。元の問題が最適化されるまで、この処理が繰り返される。 One way to improve the globality of the solution and improve the algorithm running time is, for example, Lu, W. and Chen, ML and Olivera, GH and Ruchala, KJ and Mackie, TR Fast free-form deformable registration via calculus of variations. Physics in Medicine and Biology, 49 (14): 3067--3087, 2004. Adopting a multi-resolution representation of the optimization problem. Here, multiple versions of the optimization problem with increasing complexity are used. It must also define how to map the results of lower complexity solutions to higher complexity initializations. Thereafter, optimization begins with a simple version of the problem that is relatively easy to optimize. The result of this simple problem is then used as an initialization for the next more difficult problem, which is also optimized. This process is repeated until the original problem is optimized.
この技術の有用な局面は、粗い問題の解は、この問題のためのグローバルな最適値に既に近い、次のより難しい問題のための初期化に容易にマッピングされるはずだということである。このようにして、最終的に、元の複雑な最適化問題のための良好な解に達することができる。この例の最適化問題のためには、元の問題の直接解法は通常可能でなく、したがって、多重解像度技術が常に採用される。 A useful aspect of this technique is that the solution of the coarse problem should be easily mapped to the initialization for the next more difficult problem that is already close to the global optimum for this problem. In this way, finally a good solution for the original complex optimization problem can be reached. For the optimization problem of this example, a direct solution of the original problem is usually not possible and therefore multi-resolution techniques are always employed.
2.3.1 解像度ピラミッド生成
最適化問題の連続した単純化の1つの構成要素は、目的関数が作用するデータ量の低減である。このために、一定数Npyramidのレベルの解像度ピラミッドが、両ボリュームについて生成される。指標0を有するベースレベルは、元のXFASTおよびYFASTRボリュームからなる。レベルNpyramid−1に達するまで、前のレベルからのボリュームを各方向に1/2倍にダウンサンプリングすることによって、次のレベルのボリュームが生成される。このダウンサンプリングは、簡単な2×2×2ボックスフィルタを使用して行うことができる。
2.3.1 Resolution Pyramid Generation One component of the continuous simplification of optimization problems is the reduction in the amount of data on which the objective function operates. For this, a fixed number of N pyramid levels of resolution pyramids are generated for both volumes. The base level with index 0 consists of the original XFAST and YFASTR volumes. The next level volume is generated by downsampling the volume from the previous level by a factor of 1/2 in each direction until level N pyramid −1 is reached. This downsampling can be done using a simple 2 × 2 × 2 box filter.
元のボリュームが生成された仕方のために、この均一なスケーリング演算には、サンプリング理論的観点からみると、実際には問題がある。ボックスフィルタは、2つの隣接したB走査からの値を平均するであろう。それらのサンプル間のサンプル時間差が大きく、またそれらの間に大きな変位が結果として起こり得るため、これらのサンプルは、空間的に必ずしも近くにある必要はない。この問題は、例えば、高速軸の方向のピクセル数のみが低減されるように、ボリュームに対して不均一なダウンサンプリングを行うことによって、回避できるであろう。しかしこの方法は、均一のダウンサンプリングの場合の1/8倍と比較して、あるレベルから次のレベルへ1/4倍にしかデータを低減しない。このため、実際には均一なバージョンの方が、理論的にはより正しい不均一なバージョンよりも、良好に作用する。 Due to the way the original volume was generated, this uniform scaling operation is actually problematic from a sampling theoretical point of view. The box filter will average the values from two adjacent B scans. These samples do not necessarily have to be spatially close because the sample time difference between them is large and large displacements can result between them. This problem could be avoided, for example, by performing non-uniform downsampling on the volume so that only the number of pixels in the direction of the fast axis is reduced. However, this method only reduces the data by a factor of 1/4 from one level to the next, compared to 1/8 times with uniform downsampling. For this reason, a uniform version actually works better than a theoretically correct non-uniform version.
2.3.2 時間モデリング
ボリュームデータをダウンサンプリングすることに対応して、
2.3.2 Time modeling In response to downsampling volume data,
![]()
![]()
および and
![]()
![]()
画像によって表されるように、走査処理の時間構造のより粗いバージョンが与えられる。これらの画像は、連続してバイリニアリ(bi linearly)に元のサンプル時間画像をダウンサンプリングすることによって生成される。これは、解像度ピラミッドが構築される際にボリュームデータ自体がスケールダウンされる仕方に対応する。他の利点は、この方法は、走査プロトコルの主要なタイプはどのようであったか(例えば一まとまりの線形走査)についての知識なしに行うことができ、したがって、非常に柔軟度が高いことである。 As represented by the image, a coarser version of the temporal structure of the scanning process is given. These images are generated by successively down-sampling the original sample time image bilinearly. This corresponds to how the volume data itself is scaled down when the resolution pyramid is constructed. Another advantage is that this method can be done without knowledge of what the main type of scanning protocol was (eg, a batch of linear scans) and is therefore very flexible.
2.3.3 目的関数の適合
位置合わせ処理の調整にさらなる余裕を与えるために、各マルチ解像度レベルの目的関数に、別々の正則化項重み係数αiを関連付けることができる。最も粗いレベル
2.3.3 Adaptation of Objective Function In order to provide additional margin for adjusting the alignment process, a separate regularization term weighting factor α i can be associated with the objective function at each multi-resolution level. Coarsest level
![]()
![]()
の重み係数を与えられると、より細かい係数が、成長係数growalphaを以下のように適用することによって、生成される。 Given a weighting factor, a finer factor is generated by applying the growth factor grow alpha as follows:
![]()
![]()
2.3.4 レベル間の結果のマッピング
最も粗いレベルでは、変位場は、本実施例では全てゼロに初期化され、これによって、2つの走査されたボリュームによって与えられたような元の状態で、最適化が開始される。
2.3.4 Mapping results between levels At the coarsest level, the displacement field is initialized to all zeros in this example, so that it is in its original state as given by the two scanned volumes. The optimization is started.
最適化が指標i+1のレベルで終わったと仮定すると、その解は、レベルiのより高い次元のパラメータ空間にマッピングされなければならない。ボリュームのサンプリング座標系はスケールが変わらない(セクション2.7を参照)ので、解を形成する変位ベクトル自体は、修正なしでより細かいレベルに直接使用できる。したがって、より細かい初期化は、単に、低い解像度からの変位画像をより細かい解像度へとバイリニアリに再サンプリングするだけで、行われる。 Assuming that the optimization ends at the level of index i + 1, the solution must be mapped to a higher dimensional parameter space at level i. Since the volume sampling coordinate system does not change scale (see section 2.7), the displacement vector itself that forms the solution can be used directly at a finer level without modification. Therefore, finer initialization is performed simply by resampling the displacement image from a lower resolution to a finer resolution bilinearly.
2.4 最適化戦略
本セクションでは、各多重解像度レベルのため、および最終的には元の目的関数のために行う必要のある、実際の最適化を中心に述べる。
2.4 Optimization Strategies This section focuses on the actual optimization that needs to be done for each multi-resolution level and ultimately for the original objective function.
2.4.1 一般
一般性を損なうことなく、最適化問題は、次の形で表すことができる。
2.4.1 General Without loss of generality, the optimization problem can be expressed in the following form.
![]()
![]()
ここで、目的関数は関数 Where the objective function is a function
![]()
![]()
にマッピングされており、xは次元数Nparamを有する変数のベクトルである。これは、元の目的関数の2つの変位場画像をどのようにパラメータベクトル Where x is a vector of variables having dimension number N param . This is how the two displacement field images of the original objective function
![]()
![]()
にマッピングするかという順序付けを定義することによって、例えば辞書式順序付けを使用することによって、容易に達成できる。最適化アルゴリズムの開始位置は、 Can be easily achieved, for example, by using a lexicographic ordering. The starting position of the optimization algorithm is
![]()
![]()
である。 It is.
位置合わせのための最適化問題は、非線形、非制限、かつ連続的な最適化問題として分類できる。非線形というのは、目的関数値自体がパラメータに線形に依存しないからである。非制限というのは、可能な解がパラメータ空間の一定の部分空間に制限されず、解が全 Optimization problems for alignment can be classified as nonlinear, unrestricted, and continuous optimization problems. Nonlinear is because the objective function value itself does not depend linearly on the parameters. Unrestricted means that the possible solutions are not restricted to a certain subspace of the parameter space,
![]()
![]()
内にあり得るからである。最後に、この問題が連続的であるというのは、可能な解が、例えば解ベクトルのための固定数の整数値に制限されず、解の各成分が全 Because it can be within. Finally, the problem is continuous because possible solutions are not limited to a fixed number of integer values, for example, for the solution vector, and each component of the solution
![]()
![]()
内にあり得るからである。さらに、少なくとも元の最適化問題は、本例示のデータについて、パラメータ数Nparam=960000で大規模に考慮されなければならない。 Because it can be within. Furthermore, at least the original optimization problem must be considered on a large scale with the number of parameters N param = 960000 for the example data.
このような種類の問題に対しては、解析的解法は、自明な場合以外には与えられ得ない。これが、最適化が反復的数値アルゴリズムを使用して行われる理由である。一般に、これらのアルゴリズムは、ミニマイザのための一次必要条件を満たそうとするだけなので、関数の局所的極値を見つけられるというだけであり、したがって関数の勾配は零ベクトルである。言い方を変えると、
それらは、以下を満たす解
For these types of problems, analytical solutions cannot be given except in the obvious case. This is why optimization is performed using an iterative numerical algorithm. In general, these algorithms can only find the local extrema of the function because they only try to satisfy the first-order requirement for the minimizer, so the gradient of the function is a zero vector. In other words,
They are solutions that satisfy
![]()
![]()
を探す。 Search for.
![]()
![]()
最適化アルゴリズムは、どの基本戦略を使用するかによって、2つのクラスに分けることができる。第1の戦略は、直線探索と称される。ここで、アルゴリズムは、探索方向 Optimization algorithms can be divided into two classes depending on which basic strategy is used. The first strategy is called line search. Where the algorithm is the search direction
![]()
![]()
を選択し、現在の反復 Select the current iteration
![]()
![]()
からの線に沿って当該探索方向の方向に探索する。この探索は、以下の問題をほぼ解くことになるステップの長さαstep,itを見つけることとして、記述できる。 Search in the direction of the search direction along the line from. This search can be described as finding the step length α step, it that will almost solve the following problem.
![]()
![]()
そして、反復の結果は And the result of the iteration is
![]()
![]()
となり、これが次の反復の起点として使用される。この戦略では、定まった方向が選択され、ステップの長さが探索される。 And this is used as the starting point for the next iteration. In this strategy, a fixed direction is selected and the length of the step is searched.
これに対して、いわゆる信頼領域法は、現在値の近くの目的関数のモデルを使用する。このモデルは、現在値からある一定距離まで信頼できる。そして、次の反復が、信用領域に定義された距離を見ながらモデルを最小化する方向を探すことによって、生成される(Nocedal, J. and Wright, S.J. Numerical optimization. Springer, 1999)。 In contrast, the so-called trust region method uses a model of the objective function near the current value. This model can be trusted to a certain distance from the current value. The next iteration is then generated by looking for the direction that minimizes the model while looking at the distance defined in the trust domain (Nocedal, J. and Wright, S.J. Numerical optimization. Springer, 1999).
複数のオプティマイザを、手元にある最適化問題に対するそれらの適合性に関して試験した。まず、Lu, W. and Chen, M.L. and Olivera, G.H. and Ruchala, K.J. and Mackie, T.R. Fast free-form deformable registration via calculus of variations. Physics in Medicine and Biology, 49(14):3067--3087, 2004にあるようなローカルニュートン法を試したが、収束が遅すぎることがわかった。勾配降下および非線形共役勾配の標準の直線探索アルゴリズム(Nocedal, J. and Wright, S.J. Numerical optimization. Springer, 1999)の方がはるかに優れていたが、最終的には、limited memory BFGSが最も速く、また試験したオプティマイザの中で最も頑強であることがわかった。 Multiple optimizers were tested for their suitability for the optimization problem at hand. First, Lu, W. and Chen, ML and Olivera, GH and Ruchala, KJ and Mackie, TR Fast free-form deformable registration via calculus of variations.Physics in Medicine and Biology, 49 (14): 3067--3087, 2004 I tried the local Newton method, but found that the convergence was too slow. The standard line search algorithm for gradient descent and nonlinear conjugate gradient (Nocedal, J. and Wright, SJ Numerical optimization. Springer, 1999) was much better, but ultimately limited memory BFGS is the fastest, It was also found to be the most robust optimizer tested.
2.4.2 Limited Memory BFGS
Limited memory Broyden-Flechter-Goldfarb-Shannoまたはshort L-BFGSは、直線探索に基づくアルゴリズムであり、さらに準ニュートンアルゴリズムとして分類できる。元のBFGSアルゴリズムにおいて、全ての前の評価の勾配情報が、ヘッセ行列
2.4.2 Limited Memory BFGS
Limited memory Broyden-Flechter-Goldfarb-Shanno or short L-BFGS is an algorithm based on a line search and can be further classified as a quasi-Newton algorithm. In the original BFGS algorithm, the gradient information of all previous evaluations is the Hessian matrix
![]()
![]()
の推定値を構築するために使用される。この推定値を使用して、ニュートン法を採用することにより、探索方向 Used to build an estimate of. By using this estimate and adopting the Newton method, the search direction
![]()
![]()
が線形システムの解として以下のように構築され、 Is constructed as a solution of a linear system as
![]()
![]()
直線探索に使用される。規模が大きいという問題については、全ての前の勾配またはヘッセ行列の高密度の推定値を格納するための必要メモリを用意することは、難しい。というのは、次元数Nparam=960000を有する400×400の問題で、単一の勾配ベクトルが、既にほぼ8MBのメモリ空間を使用しているからである。 Used for line search. For the problem of large scale, it is difficult to provide the necessary memory to store a high density estimate of all previous gradients or Hessian matrices. This is a 400 × 400 problem with dimensionality N param = 960000, and a single gradient vector already uses approximately 8 MB of memory space.
Limited memory BFGSは、そこからヘッセ近似値が算出されるごく限られた少ない数の勾配を格納することによって、この問題に対処する。この実施例で使用するVNL Libraryの実装では、この記憶パラメータは5に設定する。しかしこの方法には依然として、超一次収束性という利点がある。 Limited memory BFGS addresses this problem by storing a very small number of gradients from which the Hessian approximation is calculated. In the implementation of the VNL Library used in this embodiment, this storage parameter is set to 5. However, this method still has the advantage of super first order convergence.
本方法の他の利点は、構造上、探索方向 Another advantage of this method is that the search direction is structurally
![]()
![]()
は、ほとんどの場合うまくスケーリングされることである。「うまくスケーリングされる」とは、スケーリングを行わずに現在の反復に加えられた探索方向を直接使用することで、目的関数を十分に減少させるWolfe条件を満たす反復が得られることを意味する(Nocedal, J. and Wright, S.J. Numerical optimization. Springer, 1999.)。このため、直線探索は、いかなる探索も全く行わずして既に成功していることが多い。この事実によって、目的関数を最適化するために必要な関数および勾配の評価の数が著しく低減できる。 Is scaled well in most cases. “Successfully scaled” means that using the search direction applied to the current iteration directly without scaling results in an iteration that satisfies the Wolfe condition that reduces the objective function sufficiently ( Nocedal, J. and Wright, SJ Numerical optimization. Springer, 1999.). For this reason, line searches are often successful without any search at all. This fact can significantly reduce the number of function and gradient evaluations required to optimize the objective function.
実際には、多重解像度最適化の各レベルにおいて行ってもよい、関数および勾配の評価の数を制限することによって最適化を行うのに費やされる時間の量は、限られている。この量を制御するパラメータはMaxEvalslvlと呼ばれ、lvlは多重解像度レベルの指標である。他の実際的な局面は、間違った探索方向が選択されたり、数が不正確であったりしたために、最適化が失敗することがあり得ることである。この場合、最適化は、評価の予算が使い果たされておらず、収束に達しておらず、各再開によって目的関数値の有意の改善が依然としてもたらされる場合に限り、再開される。 In practice, the amount of time spent performing optimization by limiting the number of function and gradient evaluations that may be performed at each level of multi-resolution optimization is limited. The parameter that controls this amount is called MaxEvals lvl , where lvl is an indicator of the multi-resolution level. Another practical aspect is that the optimization may fail because the wrong search direction is selected or the number is inaccurate. In this case, the optimization is resumed only if the evaluation budget has not been exhausted, has not reached convergence, and each resumption still results in a significant improvement in the objective function value.
2.5 ボリュームマージ
2.5.1 基本モデル
位置合わせ自体が終わると、XREGおよびYREGと称される2つの位置合わせ結果ボリュームは、単に解の変位場を元のボリュームデータに適用するだけで、生成される。結果として生じるボリュームデータは、
2.5 Volume merge 2.5.1 Basic model Once the alignment itself is finished, the two alignment result volumes, called XREG and YREG, simply apply the displacement field of the solution to the original volume data, Generated. The resulting volume data is
![]()
![]()
および and
![]()
![]()
である。黙示的に、両ボリュームは、目的関数で使用された残差の一部として既に使用されている(式(25)を参照)。これらは、目的関数のボリューム残差部に現れる。このため、位置合わせ自体がうまくいった場合には、両ボリュームは似たものになると考えることができる。 It is. Implicitly, both volumes are already used as part of the residual used in the objective function (see equation (25)). These appear in the volume residual part of the objective function. For this reason, if the positioning itself is successful, the two volumes can be considered to be similar.
したがって、マージされたボリュームを生成する自然な方法は、ボリュームデータを単に平均することであろう。しかし、歪みにより、あるボリュームに存在するいくつかの領域が、他のボリュームでは全くサンプリングされないということが起こりうる。これが当てはまる場合には、特定の領域が存在しなかったボリュームからのデータは、隣接する領域からの代替データで埋められるため、平均化は良い手法でない。そうではなく、マージされたボリュームには、その領域が実際に存在したボリュームからのデータを主に使用することが提案される。 Thus, the natural way to generate a merged volume would be to simply average the volume data. However, due to distortion, some regions that exist in one volume may not be sampled at all in other volumes. If this is the case, averaging from a volume for which a specific area did not exist is filled with alternative data from an adjacent area, so averaging is not a good technique. Instead, it is suggested that the merged volume primarily use data from the volume where the region actually existed.
この決定処理は、マージされたボリュームMERGEDのためのデータを、2つの位置合わせ結果の凸加重和として以下のように生成することにより、モデル化される。 This determination process is modeled by generating data for the merged volume MERGED as a convex weighted sum of the two alignment results as follows.
![]()
![]()
ここで、各ボクセルについて2つのボリュームをどのように合計するかを決定する、重み関数 Here, a weight function that determines how the two volumes are summed for each voxel
![]()
![]()
が使用される。 Is used.
重みを生成する基本的な考えは、次の事実に基づく。すなわち、ある領域がボリュームAに存在せずボリュームBに存在するとき、元のAボリュームの他の領域が代用されるため、Aの位置合わせ結果が生成されたときには、元のボリュームのこの代替領域は、2回以上サンプリングされることになる、ということである。これに対し、Bからの元の領域は、一度しかサンプリングされない可能性が高い。 The basic idea of generating weights is based on the following facts. That is, when an area does not exist in volume A but exists in volume B, the other area of the original A volume is substituted, so when the alignment result of A is generated, this alternative area of the original volume Means that it will be sampled more than once. In contrast, the original region from B is likely to be sampled only once.
2.5.2 サンプリング密度推定
この事実を利用して重みを生成するために、元のボリュームのサンプリング密度、すなわち、元のボリュームのある領域が、対応する位置合わせ結果を生成するために何度サンプリングされたか、を推定する。このために、有限支持(finite support)を有する一種の2次元離散化parzenウインドウ推定を使用する。
2.5.2 Sampling Density Estimation In order to generate weights using this fact, the sampling density of the original volume, i.e. a region of the original volume, can be used several times to generate the corresponding alignment result. Estimate whether it was sampled. For this, a kind of two-dimensional discretized parsen window estimation with finite support is used.
対応するボリュームのx/yサイズの何倍か(例えば4倍)のサイズを有する画像を生成し、極めて小さい正の値εparazenに初期化する。この大きい方の画像を使用して、あるサブピクセル精度を達成する。例えば、4倍なら2ビットが提供される。この画像は、A走査の2次元のグリッドに対応する元のボリュームの2次元の領域を表す。推定は、位置合わせ結果を生成するためにとられた各サンプルについて、さらにカーネルをこの画像に描画することによって、行われる。 An image having a size several times (for example, 4 times) the x / y size of the corresponding volume is generated and initialized to a very small positive value ε parazen . This larger image is used to achieve some subpixel accuracy. For example, if it is 4 times, 2 bits are provided. This image represents a two-dimensional region of the original volume corresponding to a two-dimensional grid of A scan. The estimation is done by drawing a kernel on this image for each sample taken to generate the registration result.
カーネルとして、標準偏差σparazenおよび有限の半分の大きさ(finite half size)のhsparazenを有する2次元のガウスカーネルを使用する。ここで、この両方の定数は元の画像のピクセルサイズに対応する。カーネルの全てのグリッド点について正規分布を評価し、その後、カーネルの全ての値の合計が1に等しくなるようにスケーリングする。 As a kernel, a two-dimensional Gaussian kernel with standard deviation σ parazen and finite half size hs parazen is used. Here, both of these constants correspond to the pixel size of the original image. The normal distribution is evaluated for all grid points in the kernel, and then scaled so that the sum of all values in the kernel is equal to one.
描画自体は、サンプルがとられた位置にカーネルの中心を置き、カーネル値を密度推定画像値に加えることによって、行われる。カーネルが部分的に画像の外にある場合、それらの値を最も近いエッジピクセルにおいてさらに加え、ボリュームサンプリングルーチン自体に挙動を反映させる。 The rendering itself is done by placing the kernel center at the location where the sample was taken and adding the kernel value to the density estimated image value. If the kernel is partially outside the image, those values are further added at the nearest edge pixel to reflect the behavior in the volume sampling routine itself.
2.5.3 共通空間への密度のマッピング
2つのボリュームの推定されたサンプリング密度を関連付けできるようにするために、密度推定値を、共通の位置合わせ空間に持ってこなければならない。このために、2つの画像XDESTおよびYDESTを生成する。グリッド点(i,j)におけるこの画像データは、元位置合わせ結果を生成するためにデータがサンプリングされた位置に対応する位置のparzen推定画像を、バイリニアリにサンプリングすることによって、生成される。
2.5.3 Mapping the density to a common space In order to be able to relate the estimated sampling densities of two volumes, the density estimate must be brought into a common alignment space. For this purpose, two images XDEST and YDEST are generated. This image data at the grid point (i, j) is generated by bilinearly sampling a parzen estimated image at a position corresponding to the position at which the data was sampled to generate the original alignment result.
2.5.4 サンプル妥当性
重みを生成するために使用する他の情報源は、いわゆるサンプル妥当性である。ボリューム補間では、補間した結果を生成する際に、複数のボクセルが考慮される。ここで、このフットプリントのボクセルの一部または全部が、データ点のグリッドによって定義される実際のボリュームデータの外にある場合、サンプルの妥当性は、全てのサンプルがボリュームデータの内にある場合よりも低いと考えられる。補間フットプリントの全てのボクセルに、ボクセルがグリッドの内側にある場合には1、外側にある場合にはゼロと定義される値を関連付けることによって、位置合わせ結果の各グリッド点(i,j,k)の妥当性を、補間のために使用したフットプリント全体にわたるこの値の平均値として定義できる。このデータは、XREGおよびYREGについて、それぞれXVALおよびYVALというボリュームに含まれる。
2.5.4 Sample Validity Another source of information used to generate weights is so-called sample validity. In volume interpolation, a plurality of voxels are taken into account when generating the interpolated result. Here, if some or all of the voxels in this footprint are outside the actual volume data defined by the grid of data points, the validity of the sample is when all samples are within the volume data Is considered to be lower. By associating every voxel of the interpolation footprint with a value defined as 1 if the voxel is inside the grid and zero if it is outside, each grid point (i, j, The validity of k) can be defined as the average value of this value across the footprint used for interpolation. This data is included in the volumes XVAL and YVAL for XREG and YREG, respectively.
2.5.5 重み生成
サンプリング密度および妥当性を用いて、位置(i,j,k)におけるXREGボリュームの重みは、次のように生成できる。
2.5.5 Weight Generation Using sampling density and validity, the weight of the XREG volume at location (i, j, k) can be generated as follows.
この関数の効果は、2つの位置合わせ結果の間でサンプル妥当性およびサンプリング密度に差がない場合、結果として生じる重みは0.5であり、これによって、ボリュームデータが平均化され、これによりまたスペックル雑音が低減されることである。しかし、一方のボリュームについてサンプリング密度がより高い場合、または妥当性がより低い場合、他方のボリュームのための重みが増すであろう。このようにして、マージされたボリューム内の不良サンプルの影響は、効果的に低減される。 The effect of this function is that if there is no difference in sample validity and sampling density between the two alignment results, the resulting weight is 0.5, which averages the volume data, and also Speckle noise is reduced. However, if the sampling density is higher for one volume or is less relevant, the weight for the other volume will increase. In this way, the impact of bad samples in the merged volume is effectively reduced.
2.6 前処理
前処理では、その目標は、位置合わせ処理により適したボリュームを生成するために、OCTスキャナによって提供される生データに対して演算を行うことである。入力として、XFASTRAWおよびYFASTRAWと称される2つの生ボリュームが与えられる。これらの2つのボリュームは、以下において説明する一連の段階を経て供給される。ここでの概念は、1つの前処理演算の出力(ボリュームである)が次の段階のための入力になる、ということである。具体的な段階では、入力は、XFAST、YFASTにそれぞれ対応して、XINまたはYINと表される。両方のボリュームタイプについて処置が対称になされる場合、入力はVINと称される。ある段階の出力はXOUT、YOUTまたはVOUTと称される。そして、最終段階の出力は、セクション1にて説明したように、ボリュームXFASTおよびYFASTRである。
2.6 Preprocessing In preprocessing, the goal is to perform operations on the raw data provided by the OCT scanner in order to generate a volume that is more suitable for alignment processing. As inputs, two raw volumes called XFASTRAW and YFASTRAW are given. These two volumes are supplied through a series of steps described below. The concept here is that the output (volume) of one preprocessing operation becomes the input for the next stage. In a specific stage, the input is represented as XIN or YIN corresponding to XFAST and YFAST, respectively. If treatment is done symmetrically for both volume types, the input is referred to as VIN. The output at one stage is called XOUT, YOUT or VOUT. The output at the final stage is the volumes XFAST and YFASTR as described in
z方向においてカバーされる範囲の一部しか興味深い情報を含まないため、各ボリュームは、軸方向に切り取られる。しかし、結果として生じる軸方向寸法が両方のボリュームで等しくなるよう、注意しなければならない。生の強度データは、その高いダイナミックレンジを低減するために、ログ変換される。また、最小/最大範囲変換およびしきい値処理が適用される。各ボリュームの全てのボクセル(i,j,k)について、出力は、以下のように定義できる。 Each volume is clipped in the axial direction because only a part of the range covered in the z direction contains interesting information. However, care must be taken that the resulting axial dimensions are equal for both volumes. The raw intensity data is log converted to reduce its high dynamic range. Also, minimum / maximum range conversion and thresholding are applied. For all voxels (i, j, k) of each volume, the output can be defined as follows:
ここで、min(XIN,YIN)およびmax(XIN,YIN)は、ログ関数適用後の両ボリュームの全てのボクセルデータの最小値および最大値である。このようにして、データは、ログ変換後に範囲[0;1]へ移動される。その後、threshminおよびthreshmaxを使用してしきい値処理演算を行い、強度異常値を除去する。最後に、データはまた、間隔[0,1]に移動される。なお、全てのデータからの最低値および最大値を計算することによって、全く同じ演算が全ての値に行われる。 Here, min (XIN, YIN) and max (XIN, YIN) are the minimum and maximum values of all voxel data of both volumes after the log function is applied. In this way, the data is moved to the range [0; 1] after log conversion. Thereafter, threshold processing is performed using thresh min and thresh max to remove an abnormal intensity value. Finally, the data is also moved to the interval [0, 1]. Note that by calculating the minimum and maximum values from all data, exactly the same operation is performed on all values.
生のOCTデータに存在するスペックル雑音を低減するために、サイズNmedianの1次元のメディアンフィルタ(例えばNiemann, H. Klassifikation von Mustern. SpringerVerlag, Berlin, 1983を参照)をボリュームの各A走査に独立して適用する。このようにして、複数のA走査を使用した場合に歪みから生じ得るいかなる負の効果も、スペックル雑音レベルを低減しつつ、回避できる。 To reduce speckle noise present in raw OCT data, a one-dimensional median filter of size N median (see, for example, Niemann, H. Klassifikation von Mustern. SpringerVerlag, Berlin, 1983) for each A scan of the volume Apply independently. In this way, any negative effect that can result from distortion when using multiple A-scans can be avoided while reducing the speckle noise level.
さらなる雑音低減ならびに必要メモリおよび必要処理電力の両方の低減のために使用できる他の前処理ステップは、軸方向における両ボリュームのダウンサンプリングである。この処理は任意であり、両ボリュームに対してNzscaledown回行われる。出力ボリュームのサイズは、z方向に半分にされる以外、同じである。 Another pre-processing step that can be used for further noise reduction and reduction of both required memory and required processing power is downsampling of both volumes in the axial direction. This process is arbitrary and is performed N zscaledown times for both volumes. The size of the output volume is the same except that it is halved in the z direction.
ボリュームデータ自体は、ボックスフィルタを用いて単にz方向の2つの値を平均するだけで、生成できる。 The volume data itself can be generated by simply averaging two values in the z direction using a box filter.
データの正規化は、独立して、各ボリュームに対していわゆるZ変換を行うことによって行われる。ボリュームデータは、結果として生じるボクセルの平均値がゼロであり分散が1になるように、変換される。このために、入力ボリュームボクセル強度の平均μ(VIN)および分散var(VIN)が計算される。そして、出力ボリュームデータは、以下のようになる。 Data normalization is performed independently by performing so-called Z conversion on each volume. The volume data is transformed so that the resulting voxel average is zero and the variance is one. For this, the average μ (VIN) and variance var (VIN) of the input volume voxel intensity are calculated. The output volume data is as follows.
この変換によって、ボリュームデータが、定義された範囲に入り、2つのボリューム間の全体的な輝度の差も補正できる。 This conversion allows the volume data to enter a defined range and correct the overall luminance difference between the two volumes.
位置合わせの前に、xおよびy方向の指標(i,j)がXFASTと同じベースに関連付けられるように、まず、YFASTボリュームおよび対応するサンプル時間画像 Before registration, first the YFAST volume and the corresponding sample time image so that the index (i, j) in the x and y directions is associated with the same base as XFAST.
![]()
![]()
を変換しなければならない。これは、ボリュームデータならびにサンプル時間画像を用いて行われる2つのステップによって達成できる。まず、トランスポジションが行われる。すなわち、指標iとjとが入れ替わる。第2のステップは、y方向のデータをフリップ(flip)させることからなる。 Must be converted. This can be achieved by two steps performed using volume data as well as sample time images. First, transposition is performed. That is, the indices i and j are interchanged. The second step consists of flipping the data in the y direction.
2.7 ボリューム補間
作用する位置合わせアルゴリズムの1つの有用な部分は、ボリューム補間関数
2.7 Volume Interpolation One useful part of the working registration algorithm is the volume interpolation function.
![]()
![]()
および and
![]()
![]()
を実施することである。これらは、それぞれXFASTおよびYFASTRボリュームのボリュームデータを補間することになっている(式(21)、(22)を参照)。補間の方法は両ボリュームで同じであるため、Vi,j,kと称されるボリュームが、以下の関数で補間されると仮定する。 Is to implement. These are to interpolate the volume data of the XFAST and YFASTR volumes, respectively (see equations (21) and (22)). Since the interpolation method is the same for both volumes, it is assumed that a volume called V i, j, k is interpolated with the following function.
ここで、 here,
![]()
![]()
は特別な補間座標系のベクトルである。 Is a vector of special interpolated coordinate systems.
![]()
![]()
は返されたベクトルの次元数である。なお、この補間関数は、単に1つの場所でボリュームをサンプリングするのではなく、z方向の Is the number of dimensions of the returned vector. Note that this interpolation function does not just sample the volume in one place,
![]()
![]()
の異なる位置でサンプルリングし、A走査の補間された等価物を生成する。したがって、 Are sampled at different positions to produce an interpolated equivalent of the A scan. Therefore,
![]()
![]()
によって行われた補間は、z方向の線に沿ってボリュームデータを補間する複数の演算に分解できる。この処理は、位置 Can be decomposed into a plurality of operations for interpolating the volume data along the z-direction line. This process is
![]()
![]()
でボリュームデータを補間し単一の強度値を生成する関数 Function to interpolate volume data and generate a single intensity value
![]()
![]()
を導入することによって、記述できる。この考えを用いて、 Can be described by introducing Using this idea,
![]()
![]()
からの結果ベクトルのi番目の成分は、以下のように定義できる。 The i-th component of the result vector from can be defined as:
![]()
![]()
ここで、開始ベクトル Where start vector
![]()
![]()
をサンプリング座標系に定義し、サンプリング増分ベクトル Defined in the sampling coordinate system and the sampling increment vector
![]()
![]()
を結果ベクトルの1つの成分から次の成分へのz方向の増加を定義するものと定義する。 Is defined as defining the increase in the z direction from one component of the result vector to the next.
2.7.1 サンプリング座標系
ボリュームデータを補間するために使用する座標系は、前に使用したような物的単位に基づくワールド座標系ではない。その代わりに、ボリュームデータが[0,1]単位立方体内にあるスケール不変系が好ましい。そのような座標系の1つが、OpenGLの座標系である(Segal, M. and Akeley, K. The OpenGL graphics system: A specification (version 2.0). Silicon Graphics, Mountain View, CA, 2004.)。ここでそれが選択された理由は、広く使われており、よく定義されているだけでなく、具体的なプログラム実施においてOpenGLがボリューム補間処理を加速するために使用されるからである。スケール不変性も、多重解像度手法に対する利点がある(セクション2.3を参照)。
2.7.1 Sampling coordinate system The coordinate system used to interpolate volume data is not a world coordinate system based on physical units as used previously. Instead, a scale invariant system with volume data in the [0,1] unit cube is preferred. One such coordinate system is the OpenGL coordinate system (Segal, M. and Akeley, K. The OpenGL graphics system: A specification (version 2.0). Silicon Graphics, Mountain View, CA, 2004.). The reason it was selected here is not only widely used and well defined, but also because OpenGL is used to accelerate the volume interpolation process in a specific program implementation. Scale invariance also has advantages over multi-resolution approaches (see section 2.3).
OpenGLの座標系では、指標(i,j,k)のボクセルVi,j,kの中央の座標は、 In the OpenGL coordinate system, the coordinates of the center of the voxel V i, j, k of the index (i, j, k) are
である。補間関数の結果ベクトルの成分のうちの1つがそのようなボクセル中央におけるサンプリングからきている場合、結果は、まさに指標(i,j,k)における元の個別ボリュームの強度データであるはずである。別の言い方をすると、 It is. If one of the components of the result vector of the interpolation function comes from such a voxel center sampling, the result should be exactly the original individual volume intensity data at index (i, j, k). In other words,
![]()
![]()
は、いかなる具体的な補間関数VSampleによっても、満たされるはずである。 Should be satisfied by any specific interpolation function VSSample.
式(57)を見ると、z方向のまさに1ピクセルを移動するための式(56)からの増分ベクトル Looking at equation (57), the incremental vector from equation (56) to move exactly one pixel in the z direction
![]()
![]()
は、 Is
となるはずであることが分かる。 You can see that it should be.
最適化問題を解くためには、補間関数は、単に[0,1]の単位立方体におけるだけでなく To solve the optimization problem, the interpolation function is not just in the unit cube of [0,1]
![]()
![]()
の全てにおいて定義されなければならない。サンプル点 Must be defined in all. Sample point
![]()
![]()
が任意の座標における単位立方体の外にある場合、結果は、まるで、サンプルの位置が、その特定の方向の単位立方体内に移動して、この方向の単位立方体の端に最も近いピクセル中央に直接位置したかようになるであろう。OpenGLでは、テクスチャをサンプリングする際のこの挙動は、GL_CLAMP_TO_EDGE識別子と関連付けられる。 Is outside the unit cube in any coordinate, the result is as if the position of the sample is moved into the unit cube in that particular direction and directly into the center of the pixel closest to the end of the unit cube in this direction As if it were located. In OpenGL, this behavior when sampling a texture is associated with a GL_CLAMP_TO_EDGE identifier.
通常、補間関数はA走査等価物を生成するはずなので、補間されたベクトル Usually the interpolation function should produce an A-scan equivalent, so the interpolated vector
![]()
![]()
の次元数は、d(V)に等しくなるはずである。しかし、サンプルの最小および最大のz座標に対応して、開始および終了位置で結果として生じるベクトルを対称に切り取ることによって、計算効果ならびに単位立方体の外でのサンプリングから生じる効果を低減することができる。両側で除去すべき補間されたベクトルの元の次元数の割合を特定する The number of dimensions of should be equal to d (V) . However, corresponding to the minimum and maximum z-coordinates of the sample, the computational effect as well as the effect resulting from sampling outside the unit cube can be reduced by symmetrically cutting the resulting vector at the start and end positions. . Identifies the percentage of the original dimension number of the interpolated vector that should be removed on both sides
![]()
![]()
と称される係数を導入することによって、結果として生じるベクトルの大きさは、 By introducing a coefficient called, the resulting vector magnitude is
となる。
また、式(56)からの開始サンプリング位置は、外側のサンプリング関数
It becomes.
Also, the starting sampling position from equation (56) is the outer sampling function
![]()
![]()
および以下のサンプリング境界情報の入力から生成される。 And the following sampling boundary information input.
これは、第1のサンプルが正のz方向へ This is because the first sample is in the positive z direction
![]()
![]()
サンプル分移動することを示す。実際には、典型的な設定は、両端でサンプルの5パーセントを除去するものであり、したがって、 Indicates that the sample moves. In practice, a typical setting is one that removes 5 percent of the sample at both ends, so
![]()
![]()
である。 It is.
2.7.2 補間法
具体的な補間法として、トリリニアならびにキュービックスプライン補間を実施した。トリリニア補間は、ボリューム補間のために広く使用されている。これは、この方法の相対速度、単純性および頑強性によるものと考えられる。トリリニア異型の1次元の基礎である直線補間では、補間は、2つのデータ点間の直線をつなぐことによって行われる。この補間法は、補間値は、2つのデータ点によって与えられる範囲内にあることが保証されるという利点を有する。
2.7.2 Interpolation method As a specific interpolation method, trilinear and cubic spline interpolation were performed. Trilinear interpolation is widely used for volume interpolation. This is believed to be due to the relative speed, simplicity and robustness of the method. In linear interpolation, which is a one-dimensional basis of the trilinear variant, interpolation is performed by connecting straight lines between two data points. This interpolation method has the advantage that the interpolated value is guaranteed to be within the range given by the two data points.
トリリニア補間は、直線補間を3次元に拡張したものである。これは、補間点に最も近い8つのサンプルによって定義される立方体内において複数の1次元補間を行うことによって行うことができる。軸方向走査等価物を補間する具体的なサンプリングパターンでは、この処理は、まずz方向に沿った全ての値についてx/y方向の2次元の補間を行うことにより、最適化できる。次いで、結果として生じる線の値は、z方向のフラクショナル座標(fractional coordinate)に従って線形に補間できる。このようにして、処理すべきボクセル値の償却された数は、8から4まで低減される。 Trilinear interpolation is an extension of linear interpolation to three dimensions. This can be done by performing multiple one-dimensional interpolations within the cube defined by the eight samples closest to the interpolation point. For a specific sampling pattern that interpolates the axial scan equivalent, this process can be optimized by first performing two-dimensional interpolation in the x / y direction for all values along the z direction. The resulting line values can then be linearly interpolated according to a fractional coordinate in the z direction. In this way, the depreciated number of voxel values to be processed is reduced from 8 to 4.
目的関数を最適化できるためには、ボリューム補間関数の偏導関数が提供されなければならない。残念ながら、トリリニア補間スキームは連続導関数を提供しない。なぜなら、線分の傾きである導関数は、ピクセル中央で1つの値からもう1つの値まで飛べるからである。このため、導関数は有限差分法を使用することで近似される。この関数の詳細な情報を得るために、中心差分スキームが前方差分スキームよりも好まれる。定数εcentraldiffを使用して、サンプル点 In order to be able to optimize the objective function, a partial derivative of the volume interpolation function must be provided. Unfortunately, trilinear interpolation schemes do not provide continuous derivatives. This is because the derivative, which is the slope of the line segment, can fly from one value to another at the center of the pixel. For this reason, the derivative is approximated using a finite difference method. To obtain detailed information on this function, the central difference scheme is preferred over the forward difference scheme. Sample points using the constant ε centraldiff
![]()
![]()
における偏導関数は以下のように近似できる。 The partial derivative at can be approximated as follows:
ここで、 here,
![]()
![]()
は、指標dimが示すディメンションのユニット基底ベクトルを意味する。εcentraldiffは、最良の近似を提供するように、理想的にはできるだけ小さくなるように選択される。しかし、あまりに小さい定数を選択することから生じる数値精度の問題は、考慮しなければならない。実際には、イプシロンは、1ピクセルの中央から次までの距離の0.01に等しくなるよう選択される。 Means a unit basis vector of the dimension indicated by the index dim. εcentraldiff is ideally chosen to be as small as possible to provide the best approximation. However, the numerical accuracy issues arising from selecting too small constants must be considered. In practice, epsilon is selected to be equal to 0.01, the distance from the center of one pixel to the next.
導関数に関連した直線補間の問題があるため、キュービックエルミートスプラインを使用する第2の補間スキームを実施した。この方法は、平滑な導関数を分析的に計算する方法を提供する。再度、この方法は1次元の場合を参照しながら説明できる。キュービックスプラインについては、サポート、すなわち、補間時に考慮するピクセル数は、線形の場合の2と比べて、4である。 Because of the linear interpolation problem associated with the derivative, a second interpolation scheme using cubic Hermite splines was implemented. This method provides a method for analytically calculating a smooth derivative. Again, this method can be described with reference to the one-dimensional case. For cubic splines, the support, ie the number of pixels considered during interpolation, is 4 compared to 2 for the linear case.
この補間法の1つの不利な点は、直線補間とは対照的に、補間値が、データ点によって与えられる値の範囲の外にあり得ることである。これらのいわゆるオーバーシュート効果は、例えばスペックル雑音の場合のように、高周波数成分がデータ内に存在する場合に、もたらされ得る。したがって、本実施例では、スプライン補間は雑音低減法とともにのみ使用する。 One disadvantage of this interpolation method is that, in contrast to linear interpolation, the interpolated value can be outside the range of values given by the data points. These so-called overshoot effects can be brought about when high frequency components are present in the data, for example in the case of speckle noise. Therefore, in this embodiment, spline interpolation is used only with the noise reduction method.
2.8 グラフィックハードウェアを使用した加速化
この動きのアーティファクト補正アルゴリズムの実際的な使いやすさの1つの有用な局面は、実行速度である。本アルゴリズムの主要部分である最適化のために、目的関数およびその勾配は、繰り返し評価されなければならない。これは、特に元の複雑度レベルについては、主に2つのOCTボリュームを補間する際に、多くの計算を必要とする。目的関数自体を見ると、それは、独立した式の集まりで構成されることが分かる。
2.8 Acceleration Using Graphics Hardware One useful aspect of the practical ease of use of this motion artifact correction algorithm is execution speed. For optimization, which is the main part of the algorithm, the objective function and its gradient must be evaluated repeatedly. This requires a lot of computation, especially when interpolating between two OCT volumes, especially for the original complexity level. Looking at the objective function itself, it can be seen that it consists of an independent collection of expressions.
利点は、ボリューム補間と勾配を含む残りの計算とをグラフィックカードに移し、正則化項の部分は柔軟性のためにCPU側に残すという、並列化が可能な点である。トリリニアならびにキュービックスプライン補間の両方がサポートされる。実装には、OpenGL Shading LanguageとともにOpenGLを使用する。したがって、コードは、ベンダならびにオペレーティングシステムインディペンデントである。ATI Radeon 4850を使用して加速化したバージョンの速度と2.16GhzのIntel Core 2 Duoでの標準バージョンとを比較すると、約60倍の最適化処理のスピードアップが得られる。これによって、アルゴリズム全体ために必要とされる時間が劇的に短縮され、したがって、実用臨床使用のための実行可能性が増大される。
The advantage is that the volume interpolation and the remaining calculation including the gradient are transferred to the graphic card, and the regularization term part is left on the CPU side for flexibility. Both trilinear and cubic spline interpolation are supported. For the implementation, OpenGL is used together with OpenGL Shading Language. Thus, the code is vendor as well as operating system independent. Comparing the speed of the accelerated version using ATI Radeon 4850 with the standard version with 2.16
なお、いくつかの実施形態またはその部分をハードウェア、ファームウェアまたはソフトウェアに実装してもよい。ソフトウェアに実装する場合、当該ソフトウェアは、プロセッサを本明細書に記載した実施形態またはその等価物を行えるように構成する、いかなる言語でもあってもよい。このソフトウェアは、実行可能命令の形であってよく、また、汎用または特別仕様のプロセッサによってロードされ実行され得るいかなる非一時的コンピュータ読み取り可能な媒体にも保存してよい。 Note that some embodiments or parts thereof may be implemented in hardware, firmware, or software. When implemented in software, the software may be in any language that enables a processor to perform the embodiments described herein or equivalents thereof. This software may be in the form of executable instructions and may be stored on any non-transitory computer readable medium that can be loaded and executed by a general purpose or special purpose processor.
本明細書に記載した方法および装置を特に示し、その例示の実施形態を参照することによって記載したが、当業者によって形式および詳細のさまざまな変更が行われ得ることを理解されたい。 Although the method and apparatus described herein are specifically illustrated and described with reference to exemplary embodiments thereof, it should be understood that various changes in form and detail may be made by those skilled in the art.
Claims (65)
目的関数の値に基づいて1つ以上の3次元変換を演算する工程であって、各3次元変換は、それぞれ3次元データセットに対応付けられ、前記3次元データセットはオブジェクトの少なくとも部分的に重なる領域を表しており、
(a)(i)変換後の状態にある2つ以上の3次元データセット間、または(ii)前記変換後の状態にある2つ以上の前処理された3次元データセット間の類似の度合いを計算すること、および
(b)撮像器具に対する前記オブジェクトの動きを推定することによって、前記目的関数を評価する、評価工程を有する、3次元変換演算工程と、
少なくとも1つの動き補正済データセットを取得するように、少なくとも1つの3次元変換を、対応付けられた3次元データセット、または前記対応付けられた3次元データセットに対応する導関数3次元データセットに適用する3次元変換適用工程とを備えた、データセット処理方法。 A method of processing a dataset,
Calculating one or more three-dimensional transformations based on the value of the objective function, each three-dimensional transformation being associated with a respective three-dimensional data set, wherein said three-dimensional data set is at least partially of an object Represents the overlapping area,
(A) (i) the degree of similarity between two or more three-dimensional data sets in the transformed state, or (ii) between two or more preprocessed three-dimensional data sets in the transformed state And (b) a three-dimensional transformation operation step having an evaluation step of evaluating the objective function by estimating the movement of the object with respect to the imaging device;
At least one three-dimensional transformation is associated with an associated three-dimensional data set or a derivative three-dimensional data set corresponding to the associated three-dimensional data set so as to obtain at least one motion-corrected data set A data set processing method comprising: a three-dimensional conversion application step applied to the method.
さらに、前記第1または第2の動き補正済データセットの個々に対して改善された信号品質を有する、マージされた動き補正済データセットを取得するように、前記第1および第2の動き補正済データセットのデータ要素を結合するデータ要素結合工程を備えた、データセット処理方法。 2. The data set processing method according to claim 1, wherein the three-dimensional conversion calculation step includes first and second three-dimensional conversions, and the three-dimensional conversion application step acquires the first motion-corrected data set. Applying the first three-dimensional transformation to the first three-dimensional data set, and obtaining the second motion-corrected data set by applying the second three-dimensional transformation to the second Including applying to a three-dimensional dataset,
Further, the first and second motion corrections to obtain a merged motion corrected data set having improved signal quality for each of the first or second motion corrected data sets. A data set processing method comprising a data element combining step of combining data elements of a completed data set.
前記データ要素結合工程は、さらに、前記第1および前記第2の3次元変換の少なくとも1つの特性に基づいて、前記第1および第2の動き補正済データセットのデータ要素の寄与であって、前記マージされた動き補正済データセットに対する寄与を調整するデータ要素寄与調整工程を有する、データセット処理方法。 The data set processing method according to claim 5,
The data element combining step is further a contribution of data elements of the first and second motion corrected data sets based on at least one characteristic of the first and second three-dimensional transformations; A data set processing method comprising a data element contribution adjustment step of adjusting a contribution to the merged motion corrected data set.
第1の走査パターンを用いて第1の3次元データセットを収集する工程と、
第2の走査パターンを用いて第2の3次元データセットを収集する工程とを備え、
前記第1の走査パターンと前記第2の走査パターンは相補的である、データセット処理方法。 The data set processing method according to claim 1, further comprising:
Collecting a first three-dimensional data set using a first scan pattern;
Collecting a second three-dimensional data set using a second scan pattern,
The data set processing method, wherein the first scan pattern and the second scan pattern are complementary.
前記1つ以上の3次元変換を反復的に演算する反復演算工程を備えた、データセット処理方法。 The data set processing method according to claim 1, further comprising:
A data set processing method comprising an iterative operation step of repeatedly calculating the one or more three-dimensional transformations.
前記目的関数に対して数値最適化法を使用して、前記1つ以上の3次元変換を演算する、数値最適化法演算工程を備えた、データセット処理方法。 The data set processing method according to claim 1, further comprising:
A data set processing method comprising a numerical optimization method calculating step of calculating the one or more three-dimensional transformations using a numerical optimization method for the objective function.
多重解像度数値最適化法を使用して、前記1つ以上の3次元変換を演算する、多重解像度数値最適化法演算工程を備えた、データセット処理方法。 The data set processing method according to claim 1, further comprising:
A data set processing method comprising a multi-resolution numerical optimization method calculation step of calculating the one or more three-dimensional transformations using a multi-resolution numerical optimization method.
第1の時点の第1の動き補正済データセットを取得する第1の動き補正済データセット取得工程と、
第2の時点の第2の動き補正済データセットを取得する第2の動き補正済データセット取得工程と、
前記第1の時点および前記第2の時点の間の変化を量的に追跡するように、前記第1の動き補正済データセットと前記第2の動き補正済データセットを比較する、動き補正済データセット比較工程とを備えた、データセット処理方法。 The data set processing method according to claim 1, further comprising:
A first motion-corrected data set acquisition step of acquiring a first motion-corrected data set at a first time;
A second motion corrected data set acquisition step of acquiring a second motion corrected data set at a second time point;
A motion-compensated comparing the first motion-corrected data set and the second motion-corrected data set so as to quantitatively track the change between the first time point and the second time point A data set processing method comprising: a data set comparison step.
画像再サンプリング、雑音低減、A走査特徴生成、傾斜補償、およびロールオフ補償からなる群から選択される手法によって、前記3次元データセットを前処理する、3次元データセット前処理工程を備えた、データセット処理方法。 The data set processing method according to claim 1, further comprising:
Comprising a three-dimensional data set pre-processing step of pre-processing the three-dimensional data set by a technique selected from the group consisting of image resampling, noise reduction, A-scan feature generation, tilt compensation, and roll-off compensation; Data set processing method.
目的関数の値に基づいて1つ以上の3次元変換を演算する演算モジュールであって、各3次元変換は、それぞれ3次元データセットに対応付けられ、前記3次元データセットはオブジェクトの少なくとも部分的に重なる領域を表しており、
(a)(i)変換後の状態にある2つ以上の3次元データセット間、または(ii)前記変換後の状態にある2つ以上の前処理された3次元データセット間の類似の度合いを計算すること、および
(b)撮像器具に対する前記オブジェクトの動きを推定することによって、前記目的関数を評価する、演算モジュールと、
少なくとも1つの動き補正済データセットを取得するように、少なくとも1つの3次元変換を、対応付けられた3次元データセット、または対応付けられた3次元データセットに対応する導関数3次元データセットに適用する動き補正モジュールとを備えた、データセット処理システム。 A system for processing datasets,
An arithmetic module for computing one or more three-dimensional transformations based on the value of an objective function, each three-dimensional transformation being associated with a respective three-dimensional data set, said three-dimensional data set being at least a partial object Represents the area that overlaps
(A) (i) the degree of similarity between two or more three-dimensional data sets in the transformed state, or (ii) between two or more preprocessed three-dimensional data sets in the transformed state And (b) a computing module that evaluates the objective function by estimating the movement of the object relative to the imaging tool;
At least one three-dimensional transformation is applied to an associated three-dimensional data set or a derivative three-dimensional data set corresponding to the associated three-dimensional data set to obtain at least one motion-corrected data set. A data set processing system comprising a motion compensation module to be applied.
さらに、前記動き補正モジュールは、前記第1または第2の動き補正済データセットの個々に対して改善された信号品質を有する、マージされた動き補正済データセットを取得するように、前記第1および第2の動き補正済データセットのデータ要素を結合する、データセット処理システム。 25. The data set processing system of claim 24, wherein the computing module computes first and second three-dimensional transforms, and the motion compensation module obtains a first motion compensated dataset. Applying the first three-dimensional transformation to the first three-dimensional data set and applying the second three-dimensional transformation to the second three-dimensional data set to obtain a second motion-corrected data set; ,
Further, the motion correction module is configured to obtain a merged motion corrected data set having improved signal quality for each of the first or second motion corrected data sets. And a data set processing system that combines the data elements of the second motion corrected data set.
第1の走査パターンを用いて第1の3次元データセットを収集し、第2の走査パターンを用いて第2の3次元データセットを収集するデータ収集モジュールを備え、
前記第1の走査パターンと前記第2の走査パターンは相補的である、データセット処理システム。 The data set processing system of claim 24, further comprising:
A data collection module for collecting a first three-dimensional data set using a first scan pattern and collecting a second three-dimensional data set using a second scan pattern;
The data set processing system, wherein the first scan pattern and the second scan pattern are complementary.
第1の時点の第1の動き補正済データセットと、第2の時点の第2の動き補正済データセットとを比較して、前記第1の時点および前記第2の時点の間の変化を量的に追跡する、時間比較モジュールを備えた、データセット処理システム。 The data set processing system of claim 24, further comprising:
The first motion corrected data set at the first time point is compared with the second motion corrected data set at the second time point, and the change between the first time point and the second time point is determined. A dataset processing system with a time comparison module that tracks quantitatively.
画像再サンプリング、雑音低減、A走査特徴生成、傾斜補償、およびロールオフ補償からなる群から選択される手法によって、前記3次元データセットを前処理する、前処理モジュールを備えた、データセット処理システム。 The data set processing system of claim 24, further comprising:
A data set processing system comprising a preprocessing module for preprocessing the three-dimensional data set by a method selected from the group consisting of image resampling, noise reduction, A-scan feature generation, tilt compensation, and roll-off compensation .
目的関数の値に基づいて1つ以上の3次元変換を演算させる手順であって、各3次元変換は、それぞれ3次元データセットに対応付けられ、前記3次元データセットはオブジェクトの少なくとも部分的に重なる領域を表しており、
(a)(i)変換後の状態にある2つ以上の3次元データセット間、または(ii)前記変換後の状態にある2つ以上の前処理された3次元データセット間の類似の度合いを計算すること、および
(b)撮像器具に対する前記オブジェクトの動きを推定することによって、前記プロセッサに前記目的関数を評価させる命令を有する、3次元変換演算手順と、
少なくとも1つの動き補正済データセットを取得するように、少なくとも1つの3次元変換を、対応付けられた3次元データセット、または前記対応付けられた3次元データセットに対応する導関数3次元データセットに適用する手順とを実行させる、非一時的コンピュータ読み取り可能媒体。 A non-transitory computer readable medium having a sequence of instructions recorded thereon, said instructions being executed by a processor,
A procedure for computing one or more three-dimensional transformations based on the value of an objective function, each three-dimensional transformation being associated with a respective three-dimensional data set, said three-dimensional data set being at least partially of an object Represents the overlapping area,
(A) (i) the degree of similarity between two or more three-dimensional data sets in the transformed state, or (ii) between two or more preprocessed three-dimensional data sets in the transformed state And (b) a three-dimensional transformation operation procedure having instructions that cause the processor to evaluate the objective function by estimating the movement of the object relative to the imaging tool;
At least one three-dimensional transformation is associated with an associated three-dimensional data set or a derivative three-dimensional data set corresponding to the associated three-dimensional data set so as to obtain at least one motion-corrected data set A non-transitory computer-readable medium for executing the procedure applied to the computer.
オブジェクトの少なくとも部分的に重なる領域を表す2つ以上の3次元OCTデータセットを収集する工程であって、少なくとも1つのデータセットが、少なくとも1つの他のデータセットの走査パターンに対して相補的な走査パターンを使用して収集される、OCTデータセット収集工程と、
目的関数を使用して各データセットのための3次元変換を演算する工程であって、前記目的関数は、
(a)変換後の状態にある前記3次元データセット間の演算された類似の度合いを優位にし、
(b)撮像器具に対する前記オブジェクトの動きに罰則を付ける、3次元変換演算工程と、
少なくとも1つの動き補正済データセットを取得するように、少なくとも1つの3次元変換を各データセットに適用する工程とを備えた、OCTデータセット処理方法。 A method for processing an OCT data set comprising:
Collecting two or more three-dimensional OCT data sets representing at least partially overlapping areas of an object, wherein at least one data set is complementary to a scan pattern of at least one other data set An OCT data set collection process collected using a scan pattern;
Calculating a three-dimensional transformation for each data set using an objective function, the objective function comprising:
(A) predominate the degree of similarity calculated between the three-dimensional data sets in the transformed state;
(B) a three-dimensional conversion operation step of penalizing the movement of the object relative to the imaging device;
Applying at least one three-dimensional transform to each data set to obtain at least one motion corrected data set.
さらに、前記第1または第2の動き補正済データセットの個々に対して改善された信号品質を有する、マージされた動き補正済データセットを取得するように、前記第1および第2の動き補正済データセットからのデータ要素を結合することによって、前記第1および前記第2の動き補正済データセットをマージするマージ工程を備えた、OCTデータセット処理方法。 49. The OCT data set processing method of claim 48, wherein a first three-dimensional transform is applied to the first three-dimensional data set to obtain a first motion-corrected data set, and a second motion correction is performed. A second three-dimensional transformation is applied to the second three-dimensional data set to obtain a completed data set;
Further, the first and second motion corrections to obtain a merged motion corrected data set having improved signal quality for each of the first or second motion corrected data sets. A method of processing an OCT data set, comprising a merging step of merging the first and second motion corrected data sets by combining data elements from the completed data sets.
前記3次元変換を反復的に演算する反復演算工程を備えた、OCTデータセット処理方法。 The OCT data set processing method according to claim 48, further comprising:
An OCT data set processing method comprising an iterative operation step of repeatedly calculating the three-dimensional transformation.
多重解像度数値最適化法を使用して、前記3次元変換を演算する、多重解像度数値最適化法演算工程を備えた、OCTデータセット処理方法。 45. The OCT data set processing method of claim 44, further comprising:
An OCT data set processing method comprising a multi-resolution numerical optimization method calculation step of calculating the three-dimensional transformation using a multi-resolution numerical optimization method.
第1の時点の第1の動き補正済データセットを取得するように、前記第1の時点における少なくとも第1および第2のデータセットが処理され、
第2の時点の第2の動き補正済データセットを取得するように、前記第2の時点における少なくとも第3および第4のデータセットが処理され、
さらに、複数の時点にわたる変化を量的に追跡するように、前記動き補正済データセットまたは前記動き補正済データセットからの測定値を比較する比較工程を備えた、OCTデータセット処理方法。 49. The OCT data set processing method according to claim 48, wherein:
At least the first and second data sets at the first time point are processed to obtain a first motion corrected data set at a first time point;
At least the third and fourth data sets at the second time point are processed to obtain a second motion corrected data set at a second time point;
A method of processing an OCT data set, further comprising a comparison step of comparing the motion corrected data set or measurements from the motion corrected data set so as to quantitatively track changes over a plurality of time points.
さらに、各3次元データセットは、強度、振幅、位相、ドップラーシフトおよび偏光信号の少なくとも1つを含むデータチャネルのセットで構成され、
さらに、データチャネルの前記セットを前記OCTデータセットからの各A走査に対応付ける関連付け工程を備えた、OCTデータセット処理方法。 49. The OCT data set processing method according to claim 48, wherein the three-dimensional data set includes an A-scan,
Furthermore, each three-dimensional data set is composed of a set of data channels including at least one of intensity, amplitude, phase, Doppler shift and polarization signal;
An OCT data set processing method further comprising the step of associating the set of data channels with each A-scan from the OCT data set.
Applications Claiming Priority (3)
| Application Number | Priority Date | Filing Date | Title |
|---|---|---|---|
| US32934710P | 2010-04-29 | 2010-04-29 | |
| US61/329,347 | 2010-04-29 | ||
| PCT/US2011/034572 WO2011139895A1 (en) | 2010-04-29 | 2011-04-29 | Method and apparatus for motion correction and image enhancement for optical coherence tomography |
Publications (3)
| Publication Number | Publication Date |
|---|---|
| JP2013525035A true JP2013525035A (en) | 2013-06-20 |
| JP2013525035A5 JP2013525035A5 (en) | 2014-04-24 |
| JP5832523B2 JP5832523B2 (en) | 2015-12-16 |
Family
ID=44342931
Family Applications (1)
| Application Number | Title | Priority Date | Filing Date |
|---|---|---|---|
| JP2013508283A Active JP5832523B2 (en) | 2010-04-29 | 2011-04-29 | Method and apparatus for motion correction and image improvement for optical coherence tomography |
Country Status (7)
| Country | Link |
|---|---|
| US (2) | US9269144B2 (en) |
| EP (1) | EP2563206B1 (en) |
| JP (1) | JP5832523B2 (en) |
| CN (1) | CN103025229A (en) |
| CA (1) | CA2797725A1 (en) |
| PL (1) | PL2563206T3 (en) |
| WO (1) | WO2011139895A1 (en) |
Cited By (18)
| Publication number | Priority date | Publication date | Assignee | Title |
|---|---|---|---|---|
| JP2014038043A (en) * | 2012-08-17 | 2014-02-27 | Olympus Corp | Spectral measurement method |
| WO2015125311A1 (en) * | 2014-02-24 | 2015-08-27 | オリンパス株式会社 | Spectroscopic measurement method |
| JP2016040005A (en) * | 2015-12-21 | 2016-03-24 | 株式会社トプコン | Blood flow information generation apparatus, blood flow information generation method, and program |
| JP2016523583A (en) * | 2013-04-30 | 2016-08-12 | アイディーエックス,エルエルシー | Parallel optical coherence tomography apparatus, system, and related methods |
| JP2016205999A (en) * | 2015-04-22 | 2016-12-08 | 日本電信電話株式会社 | Signal processor |
| JP2017074112A (en) * | 2015-10-13 | 2017-04-20 | 株式会社吉田製作所 | Optical coherence tomographic image generation device |
| JP2017522066A (en) * | 2014-06-10 | 2017-08-10 | カール ツァイス メディテック インコーポレイテッドCarl Zeiss Meditec Inc. | Imaging system and method with improved frequency domain interferometry |
| JP2018038611A (en) * | 2016-09-07 | 2018-03-15 | 株式会社ニデック | Ophthalmologic analyzer and ophthalmologic analysis program |
| JP2018139716A (en) * | 2017-02-27 | 2018-09-13 | 株式会社トプコン | Ophthalmologic system |
| JP2018527993A (en) * | 2015-09-24 | 2018-09-27 | カール ツァイス メディテック インコーポレイテッドCarl Zeiss Meditec Inc. | High-sensitivity flow visualization method |
| JP2018153611A (en) * | 2017-03-17 | 2018-10-04 | キヤノン株式会社 | Information processor, image generation method and program |
| JP2019171220A (en) * | 2019-07-23 | 2019-10-10 | 株式会社トプコン | Ophthalmological photographing apparatus |
| JP2020048772A (en) * | 2018-09-26 | 2020-04-02 | 株式会社トプコン | Ophthalmologic apparatus and control method thereof |
| JP2020162886A (en) * | 2019-03-29 | 2020-10-08 | 株式会社ニデック | Medical image processing apparatus, oct apparatus, and medical image processing program |
| JP2021079144A (en) * | 2018-05-11 | 2021-05-27 | オプトス ピーエルシー | Oct retina image data rendering method and oct retina image data rendering apparatus |
| JP2021515244A (en) * | 2018-05-23 | 2021-06-17 | ハーグ—ストレイト アーゲーHaag−Streit Ag | OCT system and OCT method |
| JP2021168929A (en) * | 2015-05-28 | 2021-10-28 | シライト プロプライエタリー リミテッド | High resolution 3d spectral region optical imaging device and method |
| JP2022507811A (en) * | 2018-11-21 | 2022-01-18 | ユニバーシティ オブ ワシントン | Systems and methods for retinal template matching in remote ophthalmology |
Families Citing this family (141)
| Publication number | Priority date | Publication date | Assignee | Title |
|---|---|---|---|---|
| US8356900B2 (en) | 2006-01-20 | 2013-01-22 | Clarity Medical Systems, Inc. | Large diopter range real time sequential wavefront sensor |
| US9050026B2 (en) * | 2006-01-20 | 2015-06-09 | Clarity Medical Systems, Inc. | Apparatus and method for operating a real time large diopter range sequential wavefront sensor |
| US8100530B2 (en) | 2006-01-20 | 2012-01-24 | Clarity Medical Systems, Inc. | Optimizing vision correction procedures |
| US9101292B2 (en) * | 2006-01-20 | 2015-08-11 | Clarity Medical Systems, Inc. | Apparatus and method for operating a real time large dipoter range sequential wavefront sensor |
| EP2563206B1 (en) | 2010-04-29 | 2018-08-29 | Massachusetts Institute of Technology | Method and apparatus for motion correction and image enhancement for optical coherence tomography |
| JP6039156B2 (en) * | 2010-06-08 | 2016-12-07 | キヤノン株式会社 | Image processing apparatus, image processing method, and program |
| JP5610884B2 (en) | 2010-07-09 | 2014-10-22 | キヤノン株式会社 | Optical tomographic imaging apparatus and optical tomographic imaging method |
| US9050027B2 (en) * | 2010-07-30 | 2015-06-09 | Adventus Technologies, Inc. | Intraoperative imaging system and apparatus |
| US8425037B2 (en) * | 2010-07-30 | 2013-04-23 | Adventus Technologies, Inc. | Intraoperative imaging system and apparatus |
| WO2012026597A1 (en) * | 2010-08-27 | 2012-03-01 | ソニー株式会社 | Image processing apparatus and method |
| US8801187B1 (en) * | 2010-12-23 | 2014-08-12 | Carl Zeiss Meditec, Inc. | Methods to reduce variance in OCT analysis of the macula |
| EP2508842B1 (en) * | 2011-04-06 | 2014-08-13 | Agfa HealthCare N.V. | System and method for optical coherence tomography |
| US10362963B2 (en) | 2011-04-14 | 2019-07-30 | St. Jude Medical, Atrial Fibrillation Division, Inc. | Correction of shift and drift in impedance-based medical device navigation using magnetic field information |
| US10918307B2 (en) * | 2011-09-13 | 2021-02-16 | St. Jude Medical, Atrial Fibrillation Division, Inc. | Catheter navigation using impedance and magnetic field measurements |
| US9901303B2 (en) | 2011-04-14 | 2018-02-27 | St. Jude Medical, Atrial Fibrillation Division, Inc. | System and method for registration of multiple navigation systems to a common coordinate frame |
| US8857988B2 (en) * | 2011-07-07 | 2014-10-14 | Carl Zeiss Meditec, Inc. | Data acquisition methods for reduced motion artifacts and applications in OCT angiography |
| KR101251445B1 (en) * | 2011-07-13 | 2013-04-05 | 주식회사 쓰리디시스템즈코리아 | Apparatus and Method of automatically extracting sweep/extrude/revolve feature shape from atypical digital data |
| JP2013075035A (en) * | 2011-09-30 | 2013-04-25 | Canon Inc | Ophthalmic apparatus, ophthalmic image processing method, and recording medium |
| WO2013059303A1 (en) * | 2011-10-17 | 2013-04-25 | University Of Washington Through Its Center For Commercialization | Methods and systems for imaging tissue motion using optical coherence tomography |
| JP5926533B2 (en) * | 2011-10-27 | 2016-05-25 | キヤノン株式会社 | Ophthalmic equipment |
| US8930166B1 (en) * | 2011-12-06 | 2015-01-06 | Lockheed Martin Corporation | Method and apparatus for efficient extraction of information from signals |
| US9101294B2 (en) * | 2012-01-19 | 2015-08-11 | Carl Zeiss Meditec, Inc. | Systems and methods for enhanced accuracy in OCT imaging of the cornea |
| JP5988772B2 (en) | 2012-01-20 | 2016-09-07 | キヤノン株式会社 | Image processing apparatus and image processing method |
| JP5936368B2 (en) | 2012-01-20 | 2016-06-22 | キヤノン株式会社 | Optical coherence tomography apparatus and method for operating the same |
| JP6039185B2 (en) | 2012-01-20 | 2016-12-07 | キヤノン株式会社 | Imaging device |
| JP6061554B2 (en) * | 2012-01-20 | 2017-01-18 | キヤノン株式会社 | Image processing apparatus and image processing method |
| JP6146951B2 (en) | 2012-01-20 | 2017-06-14 | キヤノン株式会社 | Image processing apparatus, image processing method, photographing apparatus, and photographing method |
| JP2013148509A (en) | 2012-01-20 | 2013-08-01 | Canon Inc | Image processing device and image processing method |
| JP5987355B2 (en) * | 2012-02-29 | 2016-09-07 | 株式会社ニデック | Ophthalmic tomographic imaging system |
| US9795292B2 (en) * | 2012-02-29 | 2017-10-24 | Nidek Co., Ltd. | Method for taking tomographic image of eye |
| JP6025349B2 (en) * | 2012-03-08 | 2016-11-16 | キヤノン株式会社 | Image processing apparatus, optical coherence tomography apparatus, image processing method, and optical coherence tomography method |
| EA020939B1 (en) * | 2012-05-31 | 2015-02-27 | Закрытое акционерное общество научно-исследовательская производственная компания "Электрон" (ЗАО НИПК "Электрон") | Method for determination of sensor geometrical shifts in flat panel x-ray image detector |
| EP2692284A1 (en) * | 2012-07-30 | 2014-02-05 | Canon Kabushiki Kaisha | Method and apparatus for geometric correction of OCT data representing a scan obtained by means of optical coherence tomography imaging of a sample |
| US20150223681A1 (en) * | 2012-08-30 | 2015-08-13 | The Board Of Regents Of The University Of Texas Systems | Method and Apparatus for Ultrafast Multi-Wavelength Photothermal Optical Coherence Tomography (OCT) |
| US9115974B2 (en) | 2012-09-14 | 2015-08-25 | The Johns Hopkins University | Motion-compensated optical coherence tomography system |
| WO2014062529A1 (en) * | 2012-10-15 | 2014-04-24 | Josh Hogan | Enhanced oct measurement and imaging apparatus and method |
| EP4201304A1 (en) * | 2012-10-24 | 2023-06-28 | Nidek Co., Ltd. | Ophthalmic analysis apparatus |
| TWI538656B (en) * | 2012-11-07 | 2016-06-21 | 克萊提醫學系統公司 | Apparatus and method for operating a real time large diopter range sequential wavefront sensor |
| JP6075755B2 (en) * | 2012-11-19 | 2017-02-08 | 株式会社トプコン | Optical image measuring device |
| KR102070778B1 (en) * | 2012-11-23 | 2020-03-02 | 엘지전자 주식회사 | Rgb-ir sensor with pixels array and apparatus and method for obtaining 3d image using the same |
| US9107610B2 (en) * | 2012-11-30 | 2015-08-18 | Kabushiki Kaisha Topcon | Optic neuropathy detection with three-dimensional optical coherence tomography |
| US9677869B2 (en) * | 2012-12-05 | 2017-06-13 | Perimeter Medical Imaging, Inc. | System and method for generating a wide-field OCT image of a portion of a sample |
| US9025159B2 (en) * | 2012-12-10 | 2015-05-05 | The Johns Hopkins University | Real-time 3D and 4D fourier domain doppler optical coherence tomography system |
| US9207062B2 (en) * | 2012-12-10 | 2015-12-08 | The Johns Hopkins University | Distortion corrected optical coherence tomography system |
| GB2509131B (en) * | 2012-12-21 | 2017-05-17 | Optos Plc | Improvements in and relating to ophthalmoscopes |
| JP2014155694A (en) * | 2013-01-16 | 2014-08-28 | Canon Inc | Ophthalmologic apparatus and ophthalmologic method |
| JP6460618B2 (en) | 2013-01-31 | 2019-01-30 | キヤノン株式会社 | Optical coherence tomography apparatus and control method thereof |
| WO2014160116A1 (en) * | 2013-03-13 | 2014-10-02 | University Of Washington Through Its Center For Commercialization | Methods and systems for imaging tissue motion using optical coherence tomography |
| PT2999392T (en) * | 2013-05-21 | 2019-09-12 | Neurovision Imaging Inc | System and method for imaging a patient user's body part |
| CN105050483B (en) * | 2013-05-29 | 2017-05-10 | 视乐有限公司 | Apparatus for optical coherence tomography of eye and method for optical coherence tomography of eye |
| JP6184231B2 (en) * | 2013-07-31 | 2017-08-23 | キヤノン株式会社 | Image processing apparatus and image processing method |
| JP6184232B2 (en) * | 2013-07-31 | 2017-08-23 | キヤノン株式会社 | Image processing apparatus and image processing method |
| US9814384B2 (en) | 2013-09-30 | 2017-11-14 | Carl Zeiss Meditec, Inc. | High temporal resolution doppler OCT imaging of retinal blood flow |
| US20160231452A1 (en) * | 2013-10-11 | 2016-08-11 | Analogic Corporation | Tomosynthesis imaging |
| US9008391B1 (en) | 2013-10-22 | 2015-04-14 | Eyenuk, Inc. | Systems and methods for processing retinal images for screening of diseases or abnormalities |
| AU2013273657B2 (en) * | 2013-12-18 | 2016-11-10 | Canon Kabushiki Kaisha | Ophthalmic reference image selection |
| CN103700077B (en) * | 2013-12-30 | 2017-01-04 | 北京理工大学 | A kind of method for adaptive image enhancement based on human-eye visual characteristic |
| US10188808B2 (en) | 2014-01-24 | 2019-01-29 | The Johns Hopkins University | Fiber optic distal sensor controlled drug injector |
| US9291500B2 (en) * | 2014-01-29 | 2016-03-22 | Raytheon Company | Configurable combination spectrometer and polarizer |
| JP6480104B2 (en) * | 2014-03-11 | 2019-03-06 | 国立大学法人 筑波大学 | Optical coherence tomography apparatus and displacement measurement method using optical coherence tomography |
| CA2945095A1 (en) | 2014-04-07 | 2015-10-15 | Mimo Ag | Method for the analysis of image data representing a three-dimensional volume of biological tissue |
| US9907696B2 (en) | 2014-04-18 | 2018-03-06 | The Johns Hopkins University | Fiber optic distal sensor controlled micro-manipulation systems and methods |
| CN105011900B (en) * | 2014-04-30 | 2018-02-02 | 卡尔蔡司医疗技术公司 | Method and apparatus for generating wide visual field optical coherence body tomographic map |
| WO2015168700A1 (en) * | 2014-05-02 | 2015-11-05 | The Board Of Trustees Of The Leland Stanford Junior University | Method and apparatus for tracing motion using radio frequency signals |
| US9506741B2 (en) | 2014-06-09 | 2016-11-29 | The Johns Hopkins University | Optical coherence tomography systems and methods with magnitude and direction tracking of transverse motion |
| US20160022484A1 (en) * | 2014-07-25 | 2016-01-28 | Novartis Ag | Optical coherence tomography-augmented surgical instruments and systems and methods for correcting undesired movement of surgical instruments |
| US9759544B2 (en) * | 2014-08-08 | 2017-09-12 | Carl Zeiss Meditec, Inc. | Methods of reducing motion artifacts for optical coherence tomography angiography |
| CN104146681B (en) * | 2014-08-15 | 2015-11-18 | 深圳市斯尔顿科技有限公司 | A kind of eye ground OCT method for correcting image |
| KR101802993B1 (en) | 2015-02-12 | 2017-12-28 | 남한석 | Unlimited movable marking system and marking method thereof |
| US9679356B2 (en) * | 2015-03-19 | 2017-06-13 | Xerox Corporation | Vectorized two stage tile-based scaling |
| ES2767054T3 (en) | 2015-04-15 | 2020-06-16 | Alcon Inc | An apparatus for modeling eye structures |
| EP4035586A1 (en) | 2015-04-16 | 2022-08-03 | Gentuity LLC | Micro-optic probes for neurology |
| CN104958061B (en) * | 2015-07-28 | 2016-09-14 | 北京信息科技大学 | The optical fundus OCT image method of binocular stereo vision three-dimensional imaging and system thereof |
| JP6502791B2 (en) * | 2015-08-26 | 2019-04-17 | 株式会社トプコン | Blood flow measuring device |
| JP6981967B2 (en) | 2015-08-31 | 2021-12-17 | ジェンテュイティ・リミテッド・ライアビリティ・カンパニーGentuity, LLC | Imaging system including imaging probe and delivery device |
| US10402965B1 (en) * | 2015-11-12 | 2019-09-03 | Carl Zeiss Meditec, Inc. | Systems and methods for reducing artifacts in OCT angiography images |
| US10194866B2 (en) | 2016-02-19 | 2019-02-05 | Optovue, Inc. | Methods and apparatus for reducing artifacts in OCT angiography using machine learning techniques |
| US20170287131A1 (en) * | 2016-03-31 | 2017-10-05 | Bio-Tree Systems, Inc. | Methods Of Obtaining 3D Retinal Blood Vessel Geometry From Optical Coherent Tomography Images And Methods Of Analyzing Same |
| JP2019518936A (en) * | 2016-04-06 | 2019-07-04 | ケアストリーム・デンタル・テクノロジー・トプコ・リミテッド | Intraoral OCT by compressed sensing |
| US11245593B2 (en) * | 2016-04-25 | 2022-02-08 | Vmware, Inc. | Frequency-domain analysis of data-center operational and performance metrics |
| CN105759274B (en) * | 2016-04-26 | 2017-12-08 | 南京信息工程大学 | A kind of typhoon pays close attention to area's radar precipitation estimating and measuring method |
| CN105825488B (en) * | 2016-05-30 | 2018-08-21 | 天津大学 | It is a kind of angiocarpy in optical coherence tomography image enchancing method |
| US11452442B2 (en) * | 2016-06-15 | 2022-09-27 | Oregon Health & Science University | Systems and methods for automated widefield optical coherence tomography angiography |
| US10521657B2 (en) | 2016-06-17 | 2019-12-31 | Li-Cor, Inc. | Adaptive asymmetrical signal detection and synthesis methods and systems |
| US9971936B2 (en) * | 2016-06-17 | 2018-05-15 | Li-Cor, Inc. | Adaptive signal detection and synthesis on trace data |
| US10151781B2 (en) | 2016-06-17 | 2018-12-11 | Li-Cor, Inc. | Spectral response synthesis on trace data |
| JP6165935B2 (en) * | 2016-07-08 | 2017-07-19 | 株式会社トプコン | Optical image measuring device |
| US10555669B2 (en) * | 2016-11-09 | 2020-02-11 | Amo Wavefront Sciences, Llc | Optical coherence tomography systems and methods with dispersion compensation |
| CN106372765B (en) * | 2016-11-29 | 2019-11-12 | 东南大学 | A kind of expressway weather station data recovery method based on fused data |
| JP7019700B2 (en) | 2016-12-21 | 2022-02-15 | アキュセラ インコーポレイテッド | Optical coherence tomography (OCT) system for measuring retina thickness |
| US10839515B2 (en) | 2017-04-28 | 2020-11-17 | Massachusetts Institute Of Technology | Systems and methods for generating and displaying OCT angiography data using variable interscan time analysis |
| WO2018204748A1 (en) | 2017-05-05 | 2018-11-08 | Massachusetts Institute Of Technology | Systems and methods for generating and displaying oct blood flow speeds by merging mutiple integrated spatial samplings government license rights |
| KR101853127B1 (en) * | 2017-05-19 | 2018-04-27 | 주식회사 랜도르아키텍쳐 | Movable Marking System, Controlling Method For Movable Marking Apparatus and Computer Readable Recording Medium |
| CN107341824B (en) * | 2017-06-12 | 2020-07-28 | 西安电子科技大学 | Comprehensive evaluation index generation method for image registration |
| WO2019014767A1 (en) | 2017-07-18 | 2019-01-24 | Perimeter Medical Imaging, Inc. | Sample container for stabilizing and aligning excised biological tissue samples for ex vivo analysis |
| CN109387170B (en) * | 2017-08-14 | 2020-09-01 | 宏碁股份有限公司 | Distance detection device and distance detection method thereof |
| JP7027076B2 (en) | 2017-09-07 | 2022-03-01 | キヤノン株式会社 | Image processing equipment, alignment method and program |
| JP2019047841A (en) | 2017-09-07 | 2019-03-28 | キヤノン株式会社 | Image processing device, image processing method, and program |
| JP7102112B2 (en) | 2017-09-07 | 2022-07-19 | キヤノン株式会社 | Image processing equipment, image processing methods and programs |
| JP2019047839A (en) * | 2017-09-07 | 2019-03-28 | キヤノン株式会社 | Image processing device, positioning method, and program |
| AU2018348778B2 (en) * | 2017-10-11 | 2023-06-08 | OncoRes Medical Pty Ltd | A method of volumetric imaging of a sample |
| WO2019075376A1 (en) | 2017-10-13 | 2019-04-18 | The Research Foundation For The State University Of New York | Wavelength-division-multiplexing swept-source optical doppler tomography |
| US10482634B2 (en) * | 2017-10-24 | 2019-11-19 | General Electric Company | Systems and methods for imaging with anisotropic voxels |
| JP7160935B2 (en) | 2017-11-28 | 2022-10-25 | ジェンテュイティ・リミテッド・ライアビリティ・カンパニー | Imaging system |
| DE102017221924B3 (en) * | 2017-12-05 | 2019-05-02 | Siemens Healthcare Gmbh | Method for merging an analysis data set with an image data record, positioning device and computer program |
| CN108254395B (en) * | 2017-12-28 | 2023-10-13 | 清华大学 | Scanned image correction device, method and mobile scanning equipment |
| US11397840B1 (en) | 2018-03-14 | 2022-07-26 | Synopsys, Inc. | Edge placement errors for optical lithography |
| EP3779427A4 (en) * | 2018-03-30 | 2021-04-14 | Shimadzu Corporation | Imaging data processing unit and imaging data processing program |
| CN108629744B (en) * | 2018-04-09 | 2021-07-30 | 北京无线电计量测试研究所 | Image enhancement method |
| JP7344881B2 (en) * | 2018-04-18 | 2023-09-14 | カール ツァイス メディテック インコーポレイテッド | Post-processing methods to improve LSO-based tracking in OCT |
| RU2681348C1 (en) * | 2018-04-19 | 2019-03-06 | Общество С Ограниченной Ответственностью "Биомедицинские Технологии" | Method of three-dimensional visualization of the internal structure of the investigated object in real time |
| US10769307B2 (en) | 2018-05-30 | 2020-09-08 | Bank Of America Corporation | Processing system using natural language processing for performing dataset filtering and sanitization |
| EP3809948A4 (en) | 2018-06-20 | 2022-03-16 | Acucela Inc. | Miniaturized mobile, low cost optical coherence tomography system for home based ophthalmic applications |
| WO2020028896A1 (en) * | 2018-08-03 | 2020-02-06 | Neurologica Corporation | Ai-based rendered volume auto-correction for fixed and mobile x-ray imaging modalities and other imaging modalities |
| EP4321922A2 (en) * | 2019-01-28 | 2024-02-14 | The General Hospital Corporation | Speckle-based image distortion correction for laser scanning microscopy |
| US11000413B2 (en) * | 2019-02-15 | 2021-05-11 | Amo Development, Llc | Ophthalmic laser surgical system and method implementing simultaneous laser treatment and OCT measurement |
| US11024013B2 (en) | 2019-03-08 | 2021-06-01 | International Business Machines Corporation | Neural network based enhancement of intensity images |
| DE102019203448A1 (en) * | 2019-03-14 | 2020-09-17 | Carl Zeiss Microscopy Gmbh | Process for reducing image artifacts |
| ES2892477T3 (en) * | 2019-04-04 | 2022-02-04 | Optos Plc | medical imaging device |
| US11854281B2 (en) | 2019-08-16 | 2023-12-26 | The Research Foundation For The State University Of New York | System, method, and computer-accessible medium for processing brain images and extracting neuronal structures |
| JP7367433B2 (en) * | 2019-09-30 | 2023-10-24 | 株式会社ニデック | Ophthalmology imaging device |
| US11544903B2 (en) | 2019-12-13 | 2023-01-03 | Sony Group Corporation | Reducing volumetric data while retaining visual fidelity |
| WO2021134087A1 (en) | 2019-12-26 | 2021-07-01 | Acucela Inc. | Optical coherence tomography patient alignment system for home based ophthalmic applications |
| CN111449667B (en) * | 2020-03-30 | 2023-07-18 | 上海联影医疗科技股份有限公司 | Automatic recovery method and device for scanning interruption and computer equipment |
| CN111476888B (en) * | 2020-04-09 | 2023-05-12 | 山东财经大学 | Medical image interlayer interpolation method, device and readable storage medium based on three-dimensional space body fitting |
| DE102020111584A1 (en) * | 2020-04-28 | 2021-10-28 | Carl Zeiss Meditec Ag | Method for obtaining data using surgical microscopy systems |
| US10959613B1 (en) | 2020-08-04 | 2021-03-30 | Acucela Inc. | Scan pattern and signal processing for optical coherence tomography |
| CA3188255A1 (en) | 2020-08-14 | 2022-02-17 | Ryo Kubota | System and method for optical coherence tomography a-scan decurving |
| CN112043242B (en) * | 2020-08-31 | 2022-11-11 | 中国科学院苏州生物医学工程技术研究所 | Signal processing method and system for OCT imaging, and storage medium |
| US11393094B2 (en) | 2020-09-11 | 2022-07-19 | Acucela Inc. | Artificial intelligence for evaluation of optical coherence tomography images |
| EP4221565A1 (en) | 2020-09-30 | 2023-08-09 | Acucela Inc. | Myopia prediction, diagnosis, planning, and monitoring device |
| CN112504836B (en) * | 2020-10-30 | 2022-11-18 | 天津大学 | OCT (optical coherence tomography) tensile test device and test method |
| US11727534B2 (en) | 2020-12-08 | 2023-08-15 | International Business Machines Corporation | Normalizing OCT image data |
| CN113040701A (en) * | 2021-03-11 | 2021-06-29 | 视微影像(河南)科技有限公司 | Three-dimensional eye movement tracking system and tracking method thereof |
| CN113040700A (en) * | 2021-03-11 | 2021-06-29 | 视微影像(河南)科技有限公司 | Eye movement tracking system and tracking method thereof |
| US11497396B2 (en) | 2021-03-24 | 2022-11-15 | Acucela Inc. | Axial length measurement monitor |
| CN113253295B (en) * | 2021-06-22 | 2021-09-24 | 中国人民解放军国防科技大学 | Laser reflection tomography multi-angle laser echo registration method |
| CN114913199B (en) * | 2022-01-07 | 2023-10-13 | 电子科技大学 | OCT-based depth analysis transverse plane motion tracking method |
| CN114916910B (en) * | 2022-04-29 | 2024-04-09 | 无锡市华焯光电科技有限公司 | Pulse classification method, classification model training method, classification device, and storage medium |
| WO2023239174A1 (en) * | 2022-06-09 | 2023-12-14 | 경북대학교 산학협력단 | Multi-resolution-based optical interferometric tomographic imaging device and method for automated bacteria identification using tomographic images |
| CN117423051B (en) * | 2023-10-18 | 2024-03-26 | 广州元沣智能科技有限公司 | Information monitoring and analyzing method based on place moving object |
Citations (9)
| Publication number | Priority date | Publication date | Assignee | Title |
|---|---|---|---|---|
| JP2001238877A (en) * | 2000-01-18 | 2001-09-04 | Koninkl Philips Electronics Nv | Method of producing x-ray image and its equipment |
| US20060164653A1 (en) * | 2005-01-21 | 2006-07-27 | Everett Matthew J | Method of motion correction in optical coherence tomography imaging |
| EP1775545A2 (en) * | 2005-10-12 | 2007-04-18 | Kabushiki Kaisha TOPCON | Optical image measuring device, optical image measuring program, fundus observation device, and fundus observation program |
| JP2008508068A (en) * | 2004-08-03 | 2008-03-21 | カール ツァイス メディテック アクチエンゲゼルシャフト | Eye Fourier domain OCT ray tracing method |
| WO2008139799A1 (en) * | 2007-05-02 | 2008-11-20 | Canon Kabushiki Kaisha | Image forming method and optical coherence tomograph apparatus using optical coherence tomography |
| EP2044879A1 (en) * | 2007-10-04 | 2009-04-08 | Canon Kabushiki Kaisha | Optical coherence tomographic apparatus |
| US20090103049A1 (en) * | 2007-10-19 | 2009-04-23 | Oti Ophthalmic Technologies Inc. | Method for correcting patient motion when obtaining retina volume using optical coherence tomography |
| US20090257636A1 (en) * | 2008-04-14 | 2009-10-15 | Optovue, Inc. | Method of eye registration for optical coherence tomography |
| JP2011156035A (en) * | 2010-01-29 | 2011-08-18 | Canon Inc | Optical imaging apparatus, controlling method thereof, program thereof, and recording medium |
Family Cites Families (6)
| Publication number | Priority date | Publication date | Assignee | Title |
|---|---|---|---|---|
| US7724943B2 (en) * | 2004-04-21 | 2010-05-25 | Siemens Medical Solutions Usa, Inc. | Rapid and robust 3D/3D registration technique |
| KR100677142B1 (en) * | 2004-08-13 | 2007-02-02 | 경희대학교 산학협력단 | Motion estimation and compensation for panorama image |
| CN101084498A (en) * | 2004-12-31 | 2007-12-05 | 富士通株式会社 | Search method of 3d model and device thereof |
| US8004517B1 (en) * | 2005-06-24 | 2011-08-23 | Geomagic, Inc. | Methods, apparatus and computer program products that model three-dimensional surface structures |
| JP5355074B2 (en) | 2008-12-26 | 2013-11-27 | キヤノン株式会社 | 3D shape data processing apparatus, 3D shape data processing method and program |
| EP2563206B1 (en) | 2010-04-29 | 2018-08-29 | Massachusetts Institute of Technology | Method and apparatus for motion correction and image enhancement for optical coherence tomography |
-
2011
- 2011-04-29 EP EP11726243.6A patent/EP2563206B1/en active Active
- 2011-04-29 PL PL11726243T patent/PL2563206T3/en unknown
- 2011-04-29 CA CA2797725A patent/CA2797725A1/en not_active Abandoned
- 2011-04-29 JP JP2013508283A patent/JP5832523B2/en active Active
- 2011-04-29 WO PCT/US2011/034572 patent/WO2011139895A1/en active Application Filing
- 2011-04-29 CN CN2011800305625A patent/CN103025229A/en active Pending
- 2011-04-29 US US13/097,785 patent/US9269144B2/en active Active
-
2015
- 2015-12-28 US US14/980,466 patent/US9978159B2/en active Active
Patent Citations (16)
| Publication number | Priority date | Publication date | Assignee | Title |
|---|---|---|---|---|
| JP2001238877A (en) * | 2000-01-18 | 2001-09-04 | Koninkl Philips Electronics Nv | Method of producing x-ray image and its equipment |
| US20010043671A1 (en) * | 2000-01-18 | 2001-11-22 | Michael Grass | Method of and device for forming X-ray images |
| JP2008508068A (en) * | 2004-08-03 | 2008-03-21 | カール ツァイス メディテック アクチエンゲゼルシャフト | Eye Fourier domain OCT ray tracing method |
| US20080284981A1 (en) * | 2004-08-03 | 2008-11-20 | Adolf Friedrich Fercher | Fourier-Domain Oct Ray-Tracing On The Eye |
| US20060164653A1 (en) * | 2005-01-21 | 2006-07-27 | Everett Matthew J | Method of motion correction in optical coherence tomography imaging |
| JP2008528954A (en) * | 2005-01-21 | 2008-07-31 | カール ツァイス メディテック アクチエンゲゼルシャフト | Motion correction method in optical coherence tomography imaging |
| EP1775545A2 (en) * | 2005-10-12 | 2007-04-18 | Kabushiki Kaisha TOPCON | Optical image measuring device, optical image measuring program, fundus observation device, and fundus observation program |
| JP2007130403A (en) * | 2005-10-12 | 2007-05-31 | Topcon Corp | Optical image measuring device, optical image measuring program, fundus observation device, and fundus observation program |
| WO2008139799A1 (en) * | 2007-05-02 | 2008-11-20 | Canon Kabushiki Kaisha | Image forming method and optical coherence tomograph apparatus using optical coherence tomography |
| JP2008298767A (en) * | 2007-05-02 | 2008-12-11 | Canon Inc | Image forming method using optical interference tomograph meter, and optical interference tomogram |
| EP2044879A1 (en) * | 2007-10-04 | 2009-04-08 | Canon Kabushiki Kaisha | Optical coherence tomographic apparatus |
| JP2009103688A (en) * | 2007-10-04 | 2009-05-14 | Canon Inc | Optical coherence tomographic apparatus |
| US20090103049A1 (en) * | 2007-10-19 | 2009-04-23 | Oti Ophthalmic Technologies Inc. | Method for correcting patient motion when obtaining retina volume using optical coherence tomography |
| US20090257636A1 (en) * | 2008-04-14 | 2009-10-15 | Optovue, Inc. | Method of eye registration for optical coherence tomography |
| JP2011516235A (en) * | 2008-04-14 | 2011-05-26 | オプトビュー,インコーポレーテッド | Optical coherence tomography eye registration method |
| JP2011156035A (en) * | 2010-01-29 | 2011-08-18 | Canon Inc | Optical imaging apparatus, controlling method thereof, program thereof, and recording medium |
Non-Patent Citations (1)
| Title |
|---|
| 田島 裕一郎他: "3次元位相限定相関法に基づく高精度ボリュームレジストレーション", FIT2009 第8回情報科学技術フォーラム 講演論文集, vol. 第2分冊, JPN6015007838, 20 August 2009 (2009-08-20), pages 95 - 102, ISSN: 0003160152 * |
Cited By (29)
| Publication number | Priority date | Publication date | Assignee | Title |
|---|---|---|---|---|
| JP2014038043A (en) * | 2012-08-17 | 2014-02-27 | Olympus Corp | Spectral measurement method |
| JP2016523583A (en) * | 2013-04-30 | 2016-08-12 | アイディーエックス,エルエルシー | Parallel optical coherence tomography apparatus, system, and related methods |
| US10317336B2 (en) | 2014-02-24 | 2019-06-11 | Olympus Corporation | Spectral measurement method |
| WO2015125311A1 (en) * | 2014-02-24 | 2015-08-27 | オリンパス株式会社 | Spectroscopic measurement method |
| US10799111B2 (en) | 2014-06-10 | 2020-10-13 | Carl Zeiss Meditec, Inc. | Frequency-domain interferometric based imaging systems and methods |
| US11890052B2 (en) | 2014-06-10 | 2024-02-06 | Carl Zeiss Meditec, Inc. | Frequency-domain interferometric based imaging systems and methods |
| JP2017522066A (en) * | 2014-06-10 | 2017-08-10 | カール ツァイス メディテック インコーポレイテッドCarl Zeiss Meditec Inc. | Imaging system and method with improved frequency domain interferometry |
| JP2016205999A (en) * | 2015-04-22 | 2016-12-08 | 日本電信電話株式会社 | Signal processor |
| JP7258082B2 (en) | 2015-05-28 | 2023-04-14 | シライト プロプライエタリー リミテッド | High resolution 3D spectral domain optical imaging apparatus and method |
| US11471039B2 (en) | 2015-05-28 | 2022-10-18 | Cylite Pty Ltd | High resolution 3-D spectral domain optical imaging apparatus and method |
| JP2021168929A (en) * | 2015-05-28 | 2021-10-28 | シライト プロプライエタリー リミテッド | High resolution 3d spectral region optical imaging device and method |
| JP2018527993A (en) * | 2015-09-24 | 2018-09-27 | カール ツァイス メディテック インコーポレイテッドCarl Zeiss Meditec Inc. | High-sensitivity flow visualization method |
| JP2017074112A (en) * | 2015-10-13 | 2017-04-20 | 株式会社吉田製作所 | Optical coherence tomographic image generation device |
| JP2016040005A (en) * | 2015-12-21 | 2016-03-24 | 株式会社トプコン | Blood flow information generation apparatus, blood flow information generation method, and program |
| JP2018038611A (en) * | 2016-09-07 | 2018-03-15 | 株式会社ニデック | Ophthalmologic analyzer and ophthalmologic analysis program |
| JP2022036302A (en) * | 2016-09-07 | 2022-03-04 | 株式会社ニデック | Ophthalmologic analysis device and ophthalmologic analysis program |
| JP2018139716A (en) * | 2017-02-27 | 2018-09-13 | 株式会社トプコン | Ophthalmologic system |
| JP2018153611A (en) * | 2017-03-17 | 2018-10-04 | キヤノン株式会社 | Information processor, image generation method and program |
| JP2022033344A (en) * | 2018-05-11 | 2022-02-28 | オプトス ピーエルシー | Oct retina image data rendering method and oct retina image data rendering device |
| JP2021079144A (en) * | 2018-05-11 | 2021-05-27 | オプトス ピーエルシー | Oct retina image data rendering method and oct retina image data rendering apparatus |
| JP7251028B2 (en) | 2018-05-11 | 2023-04-04 | オプトス ピーエルシー | OCT retinal image data rendering method and OCT retinal image data rendering device |
| US11236986B2 (en) | 2018-05-23 | 2022-02-01 | Haag-Streit Ag | OCT system and OCT method |
| JP2021515244A (en) * | 2018-05-23 | 2021-06-17 | ハーグ—ストレイト アーゲーHaag−Streit Ag | OCT system and OCT method |
| JP7052960B2 (en) | 2018-05-23 | 2022-04-12 | ハーグ―ストレイト アーゲー | OCT system and OCT method |
| JP2020048772A (en) * | 2018-09-26 | 2020-04-02 | 株式会社トプコン | Ophthalmologic apparatus and control method thereof |
| JP2022507811A (en) * | 2018-11-21 | 2022-01-18 | ユニバーシティ オブ ワシントン | Systems and methods for retinal template matching in remote ophthalmology |
| JP2020162886A (en) * | 2019-03-29 | 2020-10-08 | 株式会社ニデック | Medical image processing apparatus, oct apparatus, and medical image processing program |
| US11602276B2 (en) | 2019-03-29 | 2023-03-14 | Nidek Co., Ltd. | Medical image processing device, oct device, and non-transitory computer-readable storage medium storing computer-readable instructions |
| JP2019171220A (en) * | 2019-07-23 | 2019-10-10 | 株式会社トプコン | Ophthalmological photographing apparatus |
Also Published As
| Publication number | Publication date |
|---|---|
| US9269144B2 (en) | 2016-02-23 |
| EP2563206B1 (en) | 2018-08-29 |
| JP5832523B2 (en) | 2015-12-16 |
| CA2797725A1 (en) | 2011-11-10 |
| US20170140560A1 (en) | 2017-05-18 |
| EP2563206A1 (en) | 2013-03-06 |
| PL2563206T3 (en) | 2018-12-31 |
| CN103025229A (en) | 2013-04-03 |
| US9978159B2 (en) | 2018-05-22 |
| US20110267340A1 (en) | 2011-11-03 |
| WO2011139895A1 (en) | 2011-11-10 |
Similar Documents
| Publication | Publication Date | Title |
|---|---|---|
| JP5832523B2 (en) | Method and apparatus for motion correction and image improvement for optical coherence tomography | |
| US11170258B2 (en) | Reducing noise in an image | |
| Baghaie et al. | State-of-the-art in retinal optical coherence tomography image analysis | |
| US9418423B2 (en) | Motion correction and normalization of features in optical coherence tomography | |
| CN103356162B (en) | Image processing equipment and image processing method | |
| JP5289219B2 (en) | Imaging apparatus and control method thereof | |
| EP2692284A1 (en) | Method and apparatus for geometric correction of OCT data representing a scan obtained by means of optical coherence tomography imaging of a sample | |
| RU2637851C2 (en) | Image processing device and method for image processing device control | |
| JP7419042B2 (en) | Medical image processing device, optical coherence tomography device, medical image processing method, and program | |
| Sánchez Brea et al. | Review on retrospective procedures to correct retinal motion artefacts in OCT imaging | |
| JP2021529622A (en) | Method and computer program for segmentation of light interference tomography images of the retina | |
| JP7102112B2 (en) | Image processing equipment, image processing methods and programs | |
| JP5669885B2 (en) | Image processing apparatus and image processing method | |
| US20210030269A1 (en) | Post-processing method to improve lso-based tracking in oct | |
| JP2019063446A (en) | Image processing apparatus, image processing method, and program | |
| Kraus | Motion correction and signal enhancement in optical coherence tomography | |
| JP2023552394A (en) | Use of multiple subvolumes, thicknesses, and curvatures for OCT/OCTA data alignment and retinal landmark detection | |
| Eichel | Statistical Model-Based Corneal Reconstruction | |
| Jiao et al. | Development and Application of Advanced Ophthalmic Imaging Technology to Enhance Military Ocular Health Capabilities | |
| Lee et al. | End-to-End Pipeline for Fourier Domain Optical Coherence Tomography of Human Optic Nerve Head |
Legal Events
| Date | Code | Title | Description |
|---|---|---|---|
| A521 | Request for written amendment filed |
Free format text: JAPANESE INTERMEDIATE CODE: A523 Effective date: 20140307 |
|
| A621 | Written request for application examination |
Free format text: JAPANESE INTERMEDIATE CODE: A621 Effective date: 20140307 |
|
| A977 | Report on retrieval |
Free format text: JAPANESE INTERMEDIATE CODE: A971007 Effective date: 20150120 |
|
| A131 | Notification of reasons for refusal |
Free format text: JAPANESE INTERMEDIATE CODE: A131 Effective date: 20150303 |
|
| A601 | Written request for extension of time |
Free format text: JAPANESE INTERMEDIATE CODE: A601 Effective date: 20150515 |
|
| A521 | Request for written amendment filed |
Free format text: JAPANESE INTERMEDIATE CODE: A523 Effective date: 20150831 |
|
| TRDD | Decision of grant or rejection written | ||
| A01 | Written decision to grant a patent or to grant a registration (utility model) |
Free format text: JAPANESE INTERMEDIATE CODE: A01 Effective date: 20150929 |
|
| A61 | First payment of annual fees (during grant procedure) |
Free format text: JAPANESE INTERMEDIATE CODE: A61 Effective date: 20151027 |
|
| R150 | Certificate of patent or registration of utility model |
Ref document number: 5832523 Country of ref document: JP Free format text: JAPANESE INTERMEDIATE CODE: R150 |
|
| R250 | Receipt of annual fees |
Free format text: JAPANESE INTERMEDIATE CODE: R250 |
|
| R250 | Receipt of annual fees |
Free format text: JAPANESE INTERMEDIATE CODE: R250 |
|
| R250 | Receipt of annual fees |
Free format text: JAPANESE INTERMEDIATE CODE: R250 |
|
| R250 | Receipt of annual fees |
Free format text: JAPANESE INTERMEDIATE CODE: R250 |
|
| R250 | Receipt of annual fees |
Free format text: JAPANESE INTERMEDIATE CODE: R250 |
|
| R250 | Receipt of annual fees |
Free format text: JAPANESE INTERMEDIATE CODE: R250 |