JP2004534975A5 - - Google Patents
Download PDFInfo
- Publication number
- JP2004534975A5 JP2004534975A5 JP2002540013A JP2002540013A JP2004534975A5 JP 2004534975 A5 JP2004534975 A5 JP 2004534975A5 JP 2002540013 A JP2002540013 A JP 2002540013A JP 2002540013 A JP2002540013 A JP 2002540013A JP 2004534975 A5 JP2004534975 A5 JP 2004534975A5
- Authority
- JP
- Japan
- Prior art keywords
- patient
- data
- box
- health care
- display
- Prior art date
- Legal status (The legal status is an assumption and is not a legal conclusion. Google has not performed a legal analysis and makes no representation as to the accuracy of the status listed.)
- Pending
Links
- 230000036541 health Effects 0.000 description 83
- NOESYZHRGYRDHS-UHFFFAOYSA-N insulin Chemical compound N1C(=O)C(NC(=O)C(CCC(N)=O)NC(=O)C(CCC(O)=O)NC(=O)C(C(C)C)NC(=O)C(NC(=O)CN)C(C)CC)CSSCC(C(NC(CO)C(=O)NC(CC(C)C)C(=O)NC(CC=2C=CC(O)=CC=2)C(=O)NC(CCC(N)=O)C(=O)NC(CC(C)C)C(=O)NC(CCC(O)=O)C(=O)NC(CC(N)=O)C(=O)NC(CC=2C=CC(O)=CC=2)C(=O)NC(CSSCC(NC(=O)C(C(C)C)NC(=O)C(CC(C)C)NC(=O)C(CC=2C=CC(O)=CC=2)NC(=O)C(CC(C)C)NC(=O)C(C)NC(=O)C(CCC(O)=O)NC(=O)C(C(C)C)NC(=O)C(CC(C)C)NC(=O)C(CC=2NC=NC=2)NC(=O)C(CO)NC(=O)CNC2=O)C(=O)NCC(=O)NC(CCC(O)=O)C(=O)NC(CCCNC(N)=N)C(=O)NCC(=O)NC(CC=3C=CC=CC=3)C(=O)NC(CC=3C=CC=CC=3)C(=O)NC(CC=3C=CC(O)=CC=3)C(=O)NC(C(C)O)C(=O)N3C(CCC3)C(=O)NC(CCCCN)C(=O)NC(C)C(O)=O)C(=O)NC(CC(N)=O)C(O)=O)=O)NC(=O)C(C(C)CC)NC(=O)C(CO)NC(=O)C(C(C)O)NC(=O)C1CSSCC2NC(=O)C(CC(C)C)NC(=O)C(NC(=O)C(CCC(N)=O)NC(=O)C(CC(N)=O)NC(=O)C(NC(=O)C(N)CC=1C=CC=CC=1)C(C)C)CC1=CN=CN1 NOESYZHRGYRDHS-UHFFFAOYSA-N 0.000 description 78
- 102000004877 Insulin Human genes 0.000 description 39
- 108090001061 Insulin Proteins 0.000 description 39
- 206010012601 Diabetes mellitus Diseases 0.000 description 22
- 238000003745 diagnosis Methods 0.000 description 16
- 238000010586 diagram Methods 0.000 description 16
- 206010020772 Hypertension Diseases 0.000 description 15
- WQZGKKKJIJFFOK-GASJEMHNSA-N D-Glucose Natural products OC[C@H]1OC(O)[C@H](O)[C@@H](O)[C@@H]1O WQZGKKKJIJFFOK-GASJEMHNSA-N 0.000 description 10
- 230000036772 blood pressure Effects 0.000 description 10
- 239000008103 glucose Substances 0.000 description 10
- 238000000034 method Methods 0.000 description 9
- 201000010099 disease Diseases 0.000 description 8
- 239000003814 drug Substances 0.000 description 8
- 235000012054 meals Nutrition 0.000 description 7
- 210000004369 Blood Anatomy 0.000 description 6
- 206010067584 Type 1 diabetes mellitus Diseases 0.000 description 6
- 239000008280 blood Substances 0.000 description 6
- 238000002651 drug therapy Methods 0.000 description 5
- 208000001072 Type 2 Diabetes Mellitus Diseases 0.000 description 4
- 230000037213 diet Effects 0.000 description 4
- 235000005911 diet Nutrition 0.000 description 4
- 229940079593 drugs Drugs 0.000 description 4
- 235000020828 fasting Nutrition 0.000 description 4
- 239000000463 material Substances 0.000 description 4
- 238000005259 measurement Methods 0.000 description 4
- 230000037361 pathway Effects 0.000 description 4
- 238000002560 therapeutic procedure Methods 0.000 description 4
- 125000002066 L-histidyl group Chemical group [H]N1C([H])=NC(C([H])([H])[C@](C(=O)[*])([H])N([H])[H])=C1[H] 0.000 description 3
- 210000002381 Plasma Anatomy 0.000 description 3
- 230000004044 response Effects 0.000 description 3
- 206010013700 Drug hypersensitivity Diseases 0.000 description 2
- 206010020993 Hypoglycaemia Diseases 0.000 description 2
- 206010046577 Urinary tract infection Diseases 0.000 description 2
- 210000002700 Urine Anatomy 0.000 description 2
- 201000005661 acute cystitis Diseases 0.000 description 2
- 238000009530 blood pressure measurement Methods 0.000 description 2
- 230000000875 corresponding Effects 0.000 description 2
- 201000005311 drug allergy Diseases 0.000 description 2
- 230000002218 hypoglycaemic Effects 0.000 description 2
- 150000002576 ketones Chemical class 0.000 description 2
- 239000000203 mixture Substances 0.000 description 2
- 206010063409 Acarodermatitis Diseases 0.000 description 1
- 206010058108 Dyslipidaemia Diseases 0.000 description 1
- 210000003414 Extremities Anatomy 0.000 description 1
- 208000004104 Gestational Diabetes Diseases 0.000 description 1
- 108009000020 Glucose Homeostasis Proteins 0.000 description 1
- 102000001554 Hemoglobins Human genes 0.000 description 1
- 108010054147 Hemoglobins Proteins 0.000 description 1
- 206010061227 Lipid metabolism disease Diseases 0.000 description 1
- 102100000630 SAMD4B Human genes 0.000 description 1
- 101710023320 SAMD4B Proteins 0.000 description 1
- 208000005687 Scabies Diseases 0.000 description 1
- 241000447727 Scabies Species 0.000 description 1
- 210000003491 Skin Anatomy 0.000 description 1
- 206010047513 Vision blurred Diseases 0.000 description 1
- 238000004458 analytical method Methods 0.000 description 1
- 230000036760 body temperature Effects 0.000 description 1
- 238000004364 calculation method Methods 0.000 description 1
- 238000002648 combination therapy Methods 0.000 description 1
- 238000001514 detection method Methods 0.000 description 1
- 238000011156 evaluation Methods 0.000 description 1
- 230000001605 fetal Effects 0.000 description 1
- 235000013305 food Nutrition 0.000 description 1
- 230000014101 glucose homeostasis Effects 0.000 description 1
- 201000010238 heart disease Diseases 0.000 description 1
- 230000001771 impaired Effects 0.000 description 1
- 238000007726 management method Methods 0.000 description 1
- 230000004048 modification Effects 0.000 description 1
- 238000006011 modification reaction Methods 0.000 description 1
- 230000000422 nocturnal Effects 0.000 description 1
- 235000016709 nutrition Nutrition 0.000 description 1
- 230000035764 nutrition Effects 0.000 description 1
- 230000035935 pregnancy Effects 0.000 description 1
- 230000002265 prevention Effects 0.000 description 1
- 230000001225 therapeutic Effects 0.000 description 1
Images


Description
本発明は、データと指針を自動的に統合してその指針とデータを含む表示をするためのシステムと方法に関する。さらに具体的には、本発明は、患者データ、統計データなどのデータを、ローカルまたは遠隔の位置から受信し、データベース内のデータを医療提供者 (medical provider) によって使用される治療指針と一緒に統合することを可能にするデータベースを採用し、データとの統合によって強化された指針を含む表示を生成して、指針に関する情報とその指針に従うときの推薦を提供するようにしたシステムと方法に関する。 The present invention relates to a system and method for automatically integrating data and pointers to provide a display including the pointers and data. More specifically, the present invention receives data such as patient data, statistical data, etc. from a local or remote location and uses the data in the database along with the treatment guidelines used by the medical provider. The present invention relates to a system and method that employs a database that enables integration and generates a display that includes guidelines enhanced by integration with data to provide information about the guidelines and recommendations when following those guidelines.
米国の人口は、特に高齢者の間で増加を続けており、その増加に伴って、病院や個人医者などの、従来の医療提供者が効果的に治療を提供する能力がますます問われている。さらに、人口の平均年齢が増加を続けるのに伴い、心臓病や糖尿病のように、長期の医療を必要とする人の数も増加している。 The U.S. population continues to increase, especially among older people, and with that increase, the ability of traditional health care providers, such as hospitals and individual doctors, to provide effective treatment is increasingly questioned Yes. Furthermore, as the average age of the population continues to increase, the number of people who need long-term medical care, such as heart disease and diabetes, has also increased.
それに応じて、上記のように増加しつつある医療ニーズに応えるために、従来の保健医療提供に代わる代替策が開発されようとしている。また、患者を治療し、または監視するために必要な医療関係者の数を減らす試みとして、もっと効果的で、効率的なシステムも開発されようとしている。具体的には、患者が患者自身または訪問看護士などによって、自分の状態が自宅で監視されることを可能にし、血圧測定、体温、体重、血糖値 (blood glucose level) などの、種々のテストに関するデータを中央のデータベースに送ることを可能にするシステムが開発されようとしている。これらのシステムは、データを適切な方法で編成し、そのデータを医師などの医療提供者(healthcare provider)に適切なフォーマット(書式)で提供する機能を備えているので、医療提供者はデータを調査し、患者のケアプラン(医療介護計画、健康管理計画)が十分であるか、あるいは修正の必要があるかを判断することができる。 In response, alternatives to traditional health care provisions are being developed to meet the increasing medical needs as described above. Also, more effective and efficient systems are being developed in an attempt to reduce the number of medical personnel needed to treat or monitor patients. Specifically, it allows the patient to be monitored at home, such as by the patient or a visiting nurse, and various tests such as blood pressure measurements, body temperature, weight, blood glucose level, etc. A system is being developed that allows data about to be sent to a central database. These systems have the ability to organize the data in an appropriate way and provide the data in a suitable format to a health care provider such as a doctor, so that the provider can Research can be done to determine whether the patient's care plan (medical care plan, health care plan) is sufficient or needs to be modified.
医療データの操作・解析システムの例としては、特許文献1に記載されているものがあるが、その全内容は引用により本明細書の一部になっている。特許文献1のシステムによれば、看護士などの医療提供者は、例えば、患者の自宅にいる患者を訪問している間にデータを取得することができる。この患者データはデータベースに入力され、データベース内のデータは特定の患者の病気に対する治療指針と比較され、その患者の望ましい治療法が得られるようにしている。この種のシステムの別の例としては、特許文献2と特許文献3に記載されているものがあるが、これら2特許の全内容は引用により本明細書の一部になっている。
An example of a medical data manipulation / analysis system is described in
上記に引用した特許に記載されているシステムは、患者データを収集・解析して、なんらかの望ましい治療プランを提供することを試みているが、これらのシステムは、患者ケアのいくつかのいろいろな選択肢(オプション)の概略を図で示す構成になっていない。また、これらのシステムは、患者データの変化に基づいて追従できる、他の種々ケアプラン間の比較をイラスト化して医療提供者に示す点でも効果的でない。従って、医療提供者がこの種のシステムに不満に思っているのは、これらのシステムからは、特定の患者のテストデータ(検診データ)に基づいたその患者の1つの特定の結果しか得られず、テストデータが変化するような場合に、患者に提供できるいろいろな異なる選択肢が用意されていないからである。 Although the systems described in the patents cited above attempt to collect and analyze patient data to provide some desirable treatment plan, these systems offer several different options for patient care. The outline of (option) is not shown in the figure. In addition, these systems are not effective in that a comparison between various other care plans that can be followed based on changes in patient data is illustrated and shown to a healthcare provider. Therefore, healthcare providers are dissatisfied with this type of system because they can only obtain one specific result for that patient based on that patient's test data. This is because there are no different options available to the patient when the test data changes.
ステージ別糖尿病管理 (Staged Diabetes Management SDM) と呼ばれる手法が存在しているが、この手法によれば、図表 (diagram) または判定経路 (decision path) を使用して、糖尿病患者に対するいろいろな異なる治療方針を医療提供者に分かりやすく示している。ステージ別糖尿病管理手法の例は、非特許文献1に記載されている。なお、この文献の全内容は引用により本明細書の一部になっている。この文献に記載されているステージ別糖尿病管理手法は、システムアプローチで糖尿病ケア(治療介護)を提供することを目的とし、平均グリコシル化ヘモグロビン (average glycosylated hemoglobin) AICを大幅に減少し、全体的に四肢切断を減少し、タイプ1糖尿病と妊娠に関連する胎児期 (fetal) と出生前 (prenatal) の悪影響を減少することを可能にしている。SDMによると、糖尿病とその合併症の予防、検出および治療に関する科学的根拠のある指針を提供する包括的プログラムが得られ、糖尿病の標準的治療方法と比べたとき患者ケアの質を向上することが実証されている。
There is a technique called Staged Diabetes Management SDM, which uses a diagram or decision path to treat different treatment strategies for diabetics. Is clearly shown to health care providers. An example of stage-specific diabetes management techniques is described in
具体的に説明すると、SDM手法は、判定経路 (decision path) と呼ばれる図表を使用し、この図表には、タイプ1糖尿病、タイプ2糖尿病、および妊娠期の糖尿病の調査・研究の成果が取り入れられており、その図表を標準的治療法(clinical practice)に役立つ手法に翻訳している。この10年以上、このプログラムは、世界各国の200箇所の糖尿病治療センタで10,000人以上の開業医によって応用され、成功を収めている。
Specifically, the SDM technique uses a diagram called a decision path that incorporates the results of research and research on
SDM手法は、以上のように大きな成功を収めているが、患者データをSDM指針と手作業で統合化する必要があるため、実用面で実施化することが若干困難になっている。すなわち、医療提供者がこの公知のSDM手法を使用するとき、医療提供者は、テスト測定などの患者データを、判定経路に明示されている質問および基準と手作業で比較しなければならない。この比較に基づき、医療提供者は、判定経路に概要が明示されている指針に照らして、患者に提供すべき治療の進め方を手作業で判断している。この場合も、この手法は初期の結果を達成する上で成功を収めているが、医療提供者が実用面で使用するには若干困難になっている。 Although the SDM technique has been very successful as described above, it is necessary to integrate patient data manually with the SDM guideline, which makes it difficult to implement in practice. That is, when a health care provider uses this known SDM technique, the health care provider must manually compare patient data, such as test measurements, with the questions and criteria specified in the decision path. Based on this comparison, the health care provider manually determines how to proceed with the treatment to be provided to the patient in the light of the guidelines outlined in the determination path. Again, this approach has been successful in achieving the initial results, but is somewhat difficult for healthcare providers to use in practice.
以上のように、患者データとSDM指針を統合して、全体的に改良されたSDM手法が得られるようにしたシステムと方法が要望されている。 As described above, there is a need for a system and method that integrates patient data and SDM guidelines to obtain an overall improved SDM technique.
本発明の目的は、データと指針を自動的に統合して、その指針とデータを含む表示をするシステムと方法を提供することにある。 SUMMARY OF THE INVENTION An object of the present invention is to provide a system and method for automatically integrating data and guidelines and displaying the guidelines and data.
本発明の他の目的は、患者データと治療指針を統合して、医師などの医療提供者が患者に治療を提供するのを支援する自動化システムと方法を提供することにある。 It is another object of the present invention to provide an automated system and method that integrates patient data and treatment guidelines to assist a healthcare provider, such as a physician, to provide treatment to a patient.
本発明のさらに別の目的は、患者データ、統計データなどのデータをローカルまたは遠隔の位置から受け取って、データベースに置かれたそのデータを、医療提供者によって使用される治療指針などの指針と一緒に統合して、データとの統合によって強化された指針を含む表示を生成し、指針とその指針に従うときの推薦に関する情報を提供するようにしたシステムと方法を提供することにある。 Yet another object of the present invention is to receive data, such as patient data, statistical data, etc., from a local or remote location and combine that data in a database with guidelines such as treatment guidelines used by health care providers. To provide a system and method for generating a display that includes guidelines enhanced by integration with data, and providing information regarding the guidelines and recommendations when following those guidelines.
本発明の別の目的は、患者データとステージ別疾病管理手法とを自動的に一体化して、患者データと治療のための判定経路とを統合したものを診療提供者に提供するシステムと方法を提供することにある。 Another object of the present invention is to provide a system and method for automatically providing patient data and stage-specific disease management techniques to a medical provider by integrating patient data and a judgment path for treatment. It is to provide.
上記およびその他の目的は、指針とデータを統合するシステムと方法によって実質的に達成される。このシステムと方法の各々はデータ記憶コンポーネントを採用しており、このデータ記憶コンポーネントは、実体(entity)の状態を評価するときの指針を表している指針データとその実体に対して処置をとるときの指針、またはその両者を記憶するよう構成されていると共に、実体の少なくとも1つの特徴を表している特徴データを記憶するように構成されている。さらに、このシステムと方法は、指針データを表している図表を出力するように構成された出力装置を採用している。この図表は、特徴データの少なくとも一部と指針データの少なくとも一部との関係を表している少なくとも1つの成分を含んでいる。出力装置の具体例としては、図表を表示するように構成された表記装置、または図表を印刷するように構成された印刷装置がある。実体は人にすることができ、その場合には、特徴データは人の少なくとも1つの身体的な状態を表すことができ、指針データは医療情報を表すことができる。 These and other objectives are substantially achieved by a system and method for integrating guidelines and data. Each of the systems and methods employs a data storage component that takes action on pointer data representing the guidelines for evaluating the state of the entity and the entity. Are configured to store at least one characteristic of the entity and at least one characteristic of the entity. In addition, the system and method employs an output device configured to output a chart representing the pointer data. The chart includes at least one component representing a relationship between at least a part of the feature data and at least a part of the pointer data. Specific examples of the output device include a notation device configured to display a chart or a printing apparatus configured to print a chart. The entity can be a person, in which case the feature data can represent at least one physical condition of the person and the guideline data can represent medical information.
本発明の上記およびその他の目的、利点および新規の特徴の理解を容易にするために、以下では、添付図面を参照して本発明の好適実施形態について詳しく説明することにする。 In order to facilitate the understanding of the above and other objects, advantages and novel features of the invention, preferred embodiments of the invention will be described in detail below with reference to the accompanying drawings.
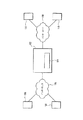
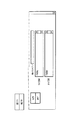
図1は、本発明の一実施形態に従って、患者データなどのデータと医療指針などの指針を統合するシステムと方法に採用したネットワーク100を示す図である。ネットワーク100は、以下で詳しく説明するように、患者に関する情報を医療指針と一緒に記憶しておくデータベース104を装備した集中型コンピュータネットワーク102を採用している。ネットワーク100は、さらに、複数のワークステーション106を含み、これらのワークステーションは、この例では、医療提供ワークステーション (healthcare provider workstation) になっている。このようなワークステーション106としては、例えば、インターネット (the Internet) 108を通して、あるいは他の適切な方式で、集中型コンピュータネットワーク102とデータベース104にアクセスすることができるデスクトップ型コンピュータ端末などがある。
FIG. 1 is a diagram illustrating a
ネットワーク100は、さらに、例えば、個々の患者またはホームケア(在宅医療)看護士などの医療提供者が、生体統計(vital statistics)、テスト結果などの患者データを記録し、集中型データベース104に入力するときに使用できる複数の患者端末110を含んでいる。患者端末110は、例えば、インターネットを通して、あるいは他の適切な方式で集中型データベース104にアクセスして、集中型データベース104にデータを入力することができる。集中型データベース104の詳細は図2に示されている。
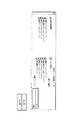
The
具体的に説明すると、データベース104は、患者明細のデータ入力セット112を、患者端末110を通してまたは他の適切な方法によって受け入れることができる。すなわち、患者は自身の生命徴候(バイタルサイン;血圧や拍数などのこと)を取得し、血糖値 (blood glucose level) などを測定するといった、自己管理テストを行い、その情報を自身の患者端末110からオンラインで入力することができる。別の方法として、このデータは、訪問看護士、検査技師(technician)などが取得することもできる。また、このデータは、患者端末110から入力するのではなく、例えば、データベース104が置かれている施設の別のワークステーション経由で、あるいは他の適切な方法でこのデータを手作業で取得し、それをデータベース104に入力することもできる。さらに、血圧計 (sphygmomanometer) や血糖値 (blood glucose) 測定デバイスなどの計器を患者端末110に結合すると、患者の読取値や測定値を患者端末110に直接に入力できるので、患者、看護士などが手作業で、あるいは電子的方法で入力しないで済むことになる。従って、この端末110を使用すれば、上述したいずれかの方法でそのデータをデータベース104に入力することができる。
Specifically, the
なお、当然に理解されるように、データベース104は、指針と患者データに関するデータなどの、上述したデータを格納するために集中型データベースとして構成されている必要はない。例えば、指針データと患者データは、ワークステーション106と患者端末110のそれぞれにローカルに記憶しておき、以下で詳しく説明する適切な方法で統合することができる。さらに、指針データと患者データが別々のデータベースやデータ記憶位置(storage locations)に記憶されている場合であっても、これらの別々のデータベースやデータ記憶位置は、データ記憶コンポーネントと総称することができる。
Of course, as will be appreciated, the
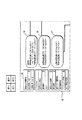
さらに図2に示すように、また以下で詳しく説明するように、ネットワーク102はステージ別疾病管理経路 (stage disease management pathway)114を生成し、これらの経路は判定データセット (decision data set)116および患者明細データ(patient specific data) を含む参照コンテンツ (reference content)118と統合されて、診療判定経路 (clinical decision pathway)120が生成される。また、図2に示すように、また以下で詳しく説明するように、データベース104は、教材(education material)122と、患者明細データを考慮に入れた結果レポートとを生成するようにコンピュータネットワーク102によって制御可能になっている。
As further shown in FIG. 2 and described in detail below, the
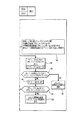
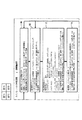
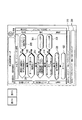
図3と図4は、図1と図2に示すデータベース104、ワークステーション106および患者端末110が係わりを持つオペレーションが、上記の「背景技術」の個所で説明した従来のステージ別疾病管理手法に関連する課題にどのように取り組んで、解決しているかの例を示している。例えば、データ入力セットは、患者ワークステーション110からのキーボード入力によって与えることができる。また、データ入力セットは、データシートを手作業で完成し、電子フォーマットになるようにスキャン(走査)したあとで、データベース104に転送することによってデータベース104に入力することも可能である。また、データ入力セットは、なんらかの方法で遠隔からダウンロードすることも可能であり、データをデータベース104に入力するエレクトロニックメディカルレコード (electronic medical record EMR:電子医療記録) インタフェースを含むことも可能である。
3 and 4 show that the operation involving the
さらに図3と図4に示すように、判定データセットは、以下で詳しく説明するように、現在の患者の状態を経路モデルと突き合わせて比較するのを容易化している。経路は操作可能なリンクであるので、医療提供者に使いやすくなっている。参照コンテンツはハイパリンクで経路およびデータシートと結ばれているので、医療提供者によるタイムリなアクセスを容易化している。データベース104の診療判定態様によれば、医療提供者によって使用できる結果報告機能(outcomes reporting capability)が提供され、教材態様によれば、患者がインターネットにアクセスし、あるいは臨床医作成資料にアクセスして患者自身の状態に関する情報を調べることを可能にしている。
Further, as shown in FIGS. 3 and 4, the decision data set facilitates comparing the current patient condition against the path model, as will be described in detail below. Since the route is an operable link, it is easy for medical providers to use. Since the reference content is linked to the route and the data sheet by a hyperlink, it facilitates timely access by the health care provider. According to the medical judgment aspect of the
以下では、本発明の一実施形態によるシステムと方法の例がどのような働き方をするかについて、図1、図2および図5から図24A、図24Bを参照して説明することにする。具体的に説明すると、患者情報が上述したいずれかの方法でデータベース104に入力されたあと、ネットワーク102は、その特定患者のデータを考慮に入れた治療、経路または指針を生成するように制御され、医療提供者が患者を診断し、その治療を処方できるようにする。医療提供者が、例えば、医療提供者ワークステーション106からデータベース104にアクセスするとき、コンピュータ102はデータベース104にアクセスし、ワークステーション106にデータを送り、ワークステーション106が図5に示すディスプレイスクリーン(表示画面)からディスプレイ(表示)130を生成できるようにする。この例では、生成される指針と経路は、糖尿病の診断と治療に関係している。なお、当然に理解されるように、このタイプのシステムと方法は、どのタイプの疾病に関する治療経路と指針でも提供するように採用することができ、また他の、どのような医療または非医療分野にも応用可能である。
In the following, how the example system and method according to an embodiment of the present invention works will be described with reference to FIGS. 1, 2 and 5 to 24A and 24B. Specifically, after patient information is entered into the
図5に示すように、ディスプレイ130には、患者の名前がアルファベット順にリストされている。この例では、患者の名前は二人しか示されていないが、データベース104がサポートできる限りの患者の名前をリストアップすることが可能である。
As shown in FIG. 5, the
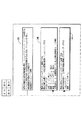
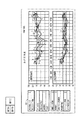
医療提供者がこのシステムと方法を使用して、”Sandra Dee” (サンドラ ディー)という患者の診断と治療方法に関する情報を得ることに関心がある場合、医療提供者は、例えば、自分のワークステーション106でマウスを使用して、”Sandra Dee”の名前をクリックすることができる。クリックすると、ワークステーション106上で稼動しているWebブラウザは必要なデータをネットワーク102に与える。これを受けて、ネットワーク102は該当データをデータベース104から取り出し、そのデータをワークステーション110上のWebブラウザに送り返す。図6A,図6B、図6Cに示すように、このデータを受けると、ワークステーション110は、患者”Sandra Dee”の診察と診断経路を図示しているディスプレイ132を生成する。この経路は図表 (diagram) と総称することができ、そこには、図示のような絵図のディスプレイ(表示)を含めることができる。しかし、「図表」という用語は、スプレッドシート(表計算)タイプのディスプレイ、指針を含む情報リスト、などのように、他のタイプの指針情報ディスプレイを指すこともある。
If the provider is interested in using this system and method to get information on how to diagnose and treat a patient called “Sandra Dee”, the provider can, for example, Using the mouse at 106, the name "Sandra Dee" can be clicked. When clicked, the web browser running on the
この例では、ディスプレイ132は、以下で詳しく説明するように、医療提供者が種々のディスプレイを生成できるようにするボタンカラム(押しボタン欄)133を含んでいる。
In this example, the
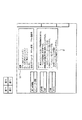
例えば、医療提供者が「診察および診断データ(Screening & Diagnosis Data)」と名付けられたボタンをクリックすると、いくつかの異なる指針を示している種々のボックスまたはコンポーネントが表示されるので、医療提供者は、患者”Sandra Dee”がなんらかの形態の糖尿病になっているか否かを、”Sandra Dee”に関してデータベース104に入力されたデータに基づいて判断できるようになっている。例えば、ボックス134には、糖尿病の危険因子 (risk factor) のタイプが、患者”Sandra Dee”がかかっている症状および患者がなんらかの形態の糖尿病にかかっていることを示す毛管血糖 (blood glucose BG) 読取値と一緒に表示されている。ボックス134に示すように、そこには、患者”Sandra Dee”が直面している危険因子が含まれている。例えば、異常脂血症 (dyslipidemia)、民族(人種)および家族歴に関係する危険因子が含まれている。また、視力障害 (blurred vision)、UTI(尿路感染症)、乾燥皮膚/疥癬皮膚などの症状も含まれている。さらに、空腹時血糖値テストの結果が100 mg/dLを超えていることが強調表示(ハイライト表示)されている。
For example, when a health care provider clicks on a button named “Screening & Diagnosis Data”, various boxes or components showing several different guidelines are displayed, so the health care provider Can determine whether the patient “Sandra Dee” has some form of diabetes based on the data input to the
さらに図6A,図6B、図6Cに示すように、ボックス136には、実施されたテスト(検査)が、平常時血糖値 (casual plasma glucose CPG) の読み取りではなく、空腹時血糖値 (fasting plasma glucose FPG) の読み取りであったことが医療提供者に強調表示されている。ボックス138には、患者に対して実施された診断テストが医療提供者に強調表示され、患者が糖尿病の一種にかかっているおそれがあることを知らせている。
Further, as shown in FIGS. 6A, 6B, and 6C, the box 136 indicates that the performed test is not a fasting plasma glucose (CPG) reading, but a fasting plasma glucose (fasting plasma glucose CPG) reading. It was highlighted to health care providers that it was reading glucose FPG). In
ボックス140、142および144にも、同じように、患者のテストの結果に応じて診断でとることができる異なる経路が示されている。例えば、ボックス144には、患者のFPGが2000年10月10日に149と測定されたことが示されているため、ボックス144のこの部分は強調表示されている。ボックス144は強調表示されているので、医療提供者はこの経路をボックス146までたどって行くと、尿ケトン (urine ketone)に関する読取値を見ることができる。ボックス146に示すように、そこには、尿ケトンの結果が2000年10月11日にマイナスであったことが示されている。従って、医療提供者は、ボックス148に進んで、数日後にFPGテストをもう一度実施するように指示される。医療提供者は、ボックス160に進んで、タイプ1糖尿病の診断を行うようには指示されない。
さらに図6A,図6B、図6Cに示すように、経路のボックス151は、患者のFPGテストの結果が2000年10月11日に160 mg/dLであったこと、この値は指針の126 mg/dLを超えていることを医療提供者に示している。従って、ボックス152の経路から、医療提供者はタイプ2糖尿病患者を診断すべきことを知ることになる。この場合も、FGPレベルがボックス150に示された指針を超えていたので、医療提供者は、ボックス154に進んで、ブドウ糖ホメオスタシス障害 (impaired glucose homeostasis) の患者を診断するようには指示されない。また、患者のFPGレベルはボックス144に示されている指針以下にあるので、経路は、ボックス144の後に続くボックスに沿って進むように医療提供者を指示している。医療提供者は、糖尿病がないものとして患者を診断するように指示しているボックス141に進むようには指示されない。
Further, as shown in FIGS. 6A, 6B, and 6C, the
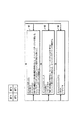
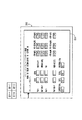
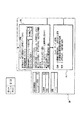
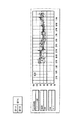
ボックス152では、医療提供者は、患者のマスタ判定経路を生成するように指示される。自分のワークステーション110でマウスを使用して「タイプ2マスタ判定経路(Type 2 master decision path)」と名づけた個所をクリックすると、Webブラウザはデータをネットワーク102に送信し、これを受けてネットワーク102は該当データをデータベース104から取り出し、そのデータをワークステーション110上のWebブラウザに送り返す。これを受けて、ワークステーション110は図7A、図7B、図7C、図7Dに示すようにディスプレイスクリーン160を表示する。ディスプレイスクリーン160内のボックスには、食事療法、運動および投薬に関するさまざまな推薦が医療提供者のために示されている。例えば、ボックス162には、FPGの基準が200 mg/dL以下であることが示されている。患者のFPGは2000年10月11日に160 mg/dLであることが示されているので、ボックス162は、ボックス164に進むように医療提供者に指示している。そこでは、医療提供者は、患者のための食事プラン(食事計画)と運動を処方するように指示される。ボックス164の「食事プランと運動ステージ(food plan and exercise stage)」と名づけられた個所をクリックすると、医療提供者は該当データをデータベース104から取り出す指示をネットワーク102に与えるようにWebブラウザを制御することができる。ワークステーション110はこのデータをネットワークから受け取ると、図8A、図8B、図8C、図8Dに示すようにWebブラウザにディスプレイ186を表示させる。
In box 152, the health care provider is instructed to generate a patient master decision path. When the user clicks on a location named “
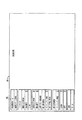
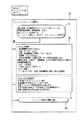
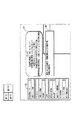
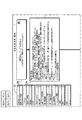
さらに図8A、図8B、図8C、図8Dに示すように、ディスプレイ186にはボックス188−204があり、これらのボックスは、食事療法と運動に関する推薦を医療提供者に示している。例えば、診断ボックス188からはボックス190に進み、そこでは、患者の医療訪問の記録を調査することを医療提供者に指示している。医療提供者は、ボックス190内の「医療訪問(medical visit)」と名づけられた個所をクリックすると、ワークステーション110上のWebブラウザが図9に示すように医療訪問ディスプレイスクリーン191を表示するので、医療訪問記録を調査することができ、ディスプレイスクリーン191に患者の医療訪問に関する情報を入力することができる。さらに図8A、図8B、図8C、図8Dに示すように、ボックス192には、登録栄養士を得るための情報が医療提供者に示され、ホワイルボックス(while box)194には、一日の異なるステージにおける患者のSMBG(血糖自己測定)目標値が示されている。
In addition, as shown in FIGS. 8A, 8B, 8C, and 8D,
ボックス190の後に続くボックス196にも、患者のための食事療法と運動に関する情報が示され、ホワイルボックス198には、医療栄養療法指針が示されている。ボックス200は、患者の病状を調査するときの時間帯と患者の推奨食事療法をいつ調査(レビュー)すべきかを、医療提供者に示している。ボックス202には、患者に対して処方できるサンプル食事プランが示されている。ボックス200の後に続くボックス204を使用すると、医療提供者は、患者に対して処方された食事プランと運動を、ボックス200で推奨されているフォローアップ(追跡調査)を実施したあとで必要と判断されたとき調整することができる。
次に図7A、図7B、図7C、図7Dに戻って説明すると、同図に示すように、診断ボックス166と170がワークステーション110から医療提供者に表示されるので、医療提供者は、患者が経口ステージまでに達したか、インシュリンステージまでに達したかを判断することができる。例えば、患者のFPGがボックス166で提示している指針の範囲内にあれば、ボックス168の経路は、患者の糖尿病治療のために医療提供者が患者のために経口薬剤を処方すべきことを示している。ボックス172は、患者に対して処方できる経口薬剤の併用を示している。さらに、ボックス170は、医療提供者が患者治療のためにインシュリンを処方するときのFPGの指針を示している。すなわち、ボックス176は、患者に対して経口薬剤とインシュリンの併用を処方するときの推奨値と指針を示している。ボックス180−184には、患者の糖尿病のステージに応じた異なるインシュリン投与量の推奨値が示されている。ボックス174と178には、処方される代表的な投薬のタイプが示されると共に、医療提供者に対するコメントも示されている。
Next, referring back to FIGS. 7A, 7B, 7C, and 7D, as shown in the figure, since the
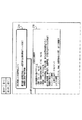
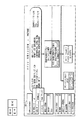
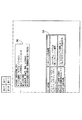
推奨値ボックス170に基づき、患者がボックス180に示されたインシュリンステージ2までに達したと医療提供者が判断したときは、医療提供者は、ボックス180の「インシュリンステージ2」と名づけられた個所をクリックすると、図10A、図10B、図10C、図10Dに示すようなインシュリンステージ2開始スクリーン(画面)が表示される。インシュリンステージ2開始スクリーン210にはボックス212−226があり、そこには、患者に対するインシュリンを処方するときの指針と推奨値が示されている。例えば、ボックス212には、診断時の患者のFPGに関する指針が示され、ボックス214には、経口薬剤または併用療法を受けている患者に対する指針が示されている。ボックス212と214に示された上記条件を満たしていれば、ボックス216の経路は、患者の医療歴を調べることを医療提供者に勧告する。医療提供者は、ボックス216で「医療訪問」の個所をクリックすると、ワークステーション110のWebブラウザは図9に示すような医療訪問ディスプレイスクリーンを表示するので、そこで医療歴を調べることができる。
When the health care provider determines that the patient has reached the
図10A、図10B、図10C、図10Dに示すディスプレイスクリーン210にも、医療提供者が診断を行うのを支援するSMBG目標値がボックス218に示されている。ボックス216のあとに続くボックス220には、医療提供者が患者の体重に基づいて推奨インシュリン量を処方できるようにする投与量計算表が示されている。すなわち、ボックス220には、患者の体重(つまり、61.36 kg)とその体重のときの推奨投与量(つまり、0.3 U/kg)が示されている。ボックス221にも、推奨投与量が示され、ボックス220の残り部分には、患者の推奨投与量が朝、昼および夜別に示され、患者の一日の総投与量が得られるようにしている。なお、推奨投与量が、例えば、0.4 U/kgに変わった場合は、医療提供者はボックス221内の矢印を使用して投与量を調整すると、そのあとに続くボックス内の時刻別の投与量と一日の総投与量が変わることになる。
Also on the
図10A、図10B、図10C、図10Dのボックス222には、医療提供者が調査できるLP考慮事項が示されている。ボックス220のあとに続くボックス224には、患者の病状などをフォローアップするときの推薦が示されている。ボックス224のあとに続くボックス224を使用すると、医療提供者は、ボックス224でのフォローアップから必要と判断したとき、インシュリンステージの投与量を調整することができる。
The
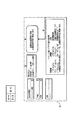
すなわち、インシュリンステージを調整すべきと医療提供者が判断したときは、医療提供者は自分のワークステーション110でマウスを使用して、ボックス226の「インシュリンステージ2」調整の個所をクリックすることができる。そうすると、ワークステーション110のWebブラウザは、図11A、図11B、図11C、図11Dに示すようなステージ2調整スクリーン230を表示する。ステージ2調整スクリーン230にはボックス232−252があり、そこには、医療提供者が一定の条件に基づいてインシュリンを変更するときの推奨値が示されている。
That is, when the health care provider determines that the insulin stage should be adjusted, the health care provider can use the mouse at his / her
例えば、ボックス234では、患者の中間履歴と身体的な状態が、検査結果と共に考慮されており、ホワイルボックス236には、異なるインシュリンステージを考慮するときの推薦が示されている。ボックス238では、患者のSMBGが目標値範囲内にあるかどうかが考慮される。範囲内にあれば、ボックス240には、患者はインシュリン投与ステージを維持すべきとの推奨が示される。ボックス242では、患者の毎月の管理が評価され、改善が見られていれば、ボックス244の推薦に従うべきことを示している。改善が見られなければ、患者の毎日の管理を評価すべきことを推奨する指針がボックス246に示され、ボックス248には、患者の投与量が十分であるかどうかを判断するための指針が示されている。ボックス250を使用すると、医療提供者は、患者のインシュリン投与量を推奨投与量に調整することができる。ボックス252には、インシュリンステージ3またはインシュリンステージ4の推薦に従うように患者の投与量を変更するときの推薦が示されている。
For example, in
図7A、図7B、図7C、図7Dに戻って説明すると、患者にインシュリンステージ3Aの投与量を与えるべきであると、医療提供者がボックス170での診断から判断したときは、医療提供者は、自分のワークステーション110でマウスを使用して、ボックス182の「インシュリンステージ3A」の個所をクリックすることができる。そうすると、ワークステーション110上のブラウザは、図12A、図12B、図12Cに示すようなインシュリンステージ3Aディスプレイスクリーン260を表示する。ディスプレイスクリーン250にはボックス262−276があり、これらのボックスは、図10A、図10B、図10C、図10Dに示すディスプレイスクリーン210のボックス212−226と似ているので、ここで詳しく説明することは省略する。図7A、図7B、図7C、図7Dに戻って説明すると、患者はインシュリンステージ4Aに入るべきであると、医療提供者がボックス170に示されている指針から判断したときは、医療提供者は自分のワークステーション110でマウスを使用して、ボックス184の「インシュリンステージ4A」の個所をクリックすると、図13A、図13B、図13Cに示すようなインシュリンステージ開始スクリーン280が表示される。スクリーン280にはボックス282−296があり、これらのボックスは、図12A、図12B、図12Cに示すボックス262−276および図10A、図10B、図10C、図10Dに示すディスプレイスクリーン210のボックス212−226と似ているので、ここで詳しく説明することは省略する。また、図12A、図12B、図12Cのボックス276と図13A、図13B、図13Cのボックス296を使用すると、医療提供者は、図11A、図11B、図11C、図11Dに示すディスプレイスクリーン230に図示されているインシュリンステージ2Aの調整と同じように、それぞれインシュリンステージ4Aの調整とインシュリンステージ4Aの調整を行うことができる。
Returning to FIGS. 7A, 7B, 7C, and 7D, when the health care provider determines from the diagnosis in
また、当然に理解されるように、ワークステーション110のディスプレイスクリーンから表示される、上述したディスプレイ上のボタンカラム133にある種々のボタンを使用すると、患者に関する追加のディスプレイスクリーンを生成することができる。例えば、医療提供者が総合患者データボタンをクリックすると、追加のボタン群が図14A、図14B、図14Cに示すように表示される。そこで、医療提供者がこれらの追加ボタンをクリックすると、ワークステーション110はスクリーンを表示し、そこには、例えば、患者の現在の病気履歴 (history in present illness HPI) が、図15A、図15B、図15Cのディスプレイスクリーン300に示すような歩行時血圧 (ambulatory blood pressure BP) および図16に示すようなディスプレイスクリーン302に入力できる患者の薬物アレルギー情報と一緒に示されている。また、医療提供者がデータ入力ボタンをクリックすると、ワークステーションは、図17に示すような患者データ入力スクリーン304を表示する。また、医療提供者が他のボタンのいずれかをクリックすると、追加のタスクを実行するためのスクリーンが表示される。
Also, as will be appreciated, the various buttons in
例えば、医療提供者が「結果レポート」ボタンをクリックすると、患者進展状況に関するレポートが表示される。具体的に説明すると、「結果レポート」ボタンをクリックすると、NCQA、HEDISまたはJCAHOレポートのように、種々形態の認可を取得し、維持する上で医療団体にとって非常に重要で、これらの医療団体に提供できる異なる患者データを編集したものを示している住民データレポートを表示することができる。医療提供者は指図と照会 (orders and referrals) ボタンをクリックすると、患者に与えられた医療指図と照会を見ることができる。これらの指図と照会には、患者データと診断データがシステムによって自動的にそこに入力されるテンプレートやレターを含めることができるので、臨床医は余分のドキュメンテーションを行わないで済むことになる。すなわち、照会が栄養士などの、ある種の専門家への照会レターであれば、患者診断(例えば、タイプ2糖尿病)と患者データ(例えば、SBGL読取値)は、患者または症病状態を管理する目的で経路スクリーンを操作している間にユーザが処置をとるだけで、自動的にレターに挿入されるようにすることができる。
For example, when the health care provider clicks the “result report” button, a report on the patient progress is displayed. Specifically, clicking on the “Result Report” button is very important for medical organizations in obtaining and maintaining various forms of approval, such as NCQA, HEDIS or JCAHO reports. A resident data report can be displayed showing a compilation of different patient data that can be provided. The health care provider can view the medical instructions and referrals given to the patient by clicking the orders and referrals button. These instructions and queries can include templates and letters into which patient data and diagnostic data are automatically entered by the system, so clinicians do not have to do extra documentation. That is, if the referral is a referral letter to some specialist, such as a dietitian, patient diagnosis (eg,
また、医療提供者はボタンカラム133の他のボタンのいずれかをクリックすると、必要とするディスプレイスクリーンを表示することができる。例えば、患者資料ボタンをクリックすると、患者のチャート(カルテ)にあるデータのような、患者情報が表示される。スクリーンおよび診断ボタンをクリックすると、図6A,図6B、図6Cに示すようなスクリーンおよび診断スクリーン132が表示され、食事プランと運動開始ボタンをクリックすると、図8A、図8B、図8C、図8Dに示すような食事プランと運動ディスプレイスクリーン186が表示される。インシュリン開始ディスプレイスクリーンボタンをクリックすると、医療提供者は、図10A、図10B、図10C、図10D、図12A、図12B、図12Cおよび図13A、図13B、図13Cに示すようなインシュリン選択ディスプレイスクリーンを表示することができ、インシュリン調整ディスプレイスクリーンをクリックすると、図11A、図11B、図11C、図11Dに示すようなインシュリン調整ディスプレイスクリーンが表示される。経口開始ボタンまたはポンプ開始/管理ボタンをクリックすると、図10A、図10B、図10C、図10D、図12A、図12B、図12Cおよび図13A、図13B、図13Cに示すものと似ているが、経口またはポンプ管理投薬に関係する該当経路が表示される。SOAP(subjective objective assessment and plan−主観的客観的評価とプラン)ボタンをクリックすると、ディスプレイスクリーンが表示されるので、医療提供者は、この分野の精通者ならば理解されるように、ユーザがシステムを使用しているときにシステムによって自動的に生成される注記のほかに、追加のSOAP注記を入力することができる。療法選択ボタンをクリックすると、図7A、図7B、図7C、図7Dに示すようなマスタ経路が表示される。印刷ボタンをクリックすると、医療提供者は表示されているスクリーン(画面)を印刷することができ、ホームボタンをクリックすると、ディスプレイは、図5に示すディスプレイに戻される。
In addition, when the health care provider clicks any of the other buttons in the
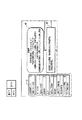
さらに、教育ボタンのような該当ボタンをクリックすると、図18A、図18Bに示すような自己管理・順守評価ディスプレイスクリーン310が表示され、そこには、患者に対する質問と患者に対する推奨事項を示し、その質問を処理できるボックス312−334が含まれている。さらに、医療提供者は合併症 (complications) ボタンをクリックすると、患者に合併症が起こっているかどうかを診断することが可能になり、そのあと、治療経路をたどって行くと、その治療のためのガイダンスを得ることができる。例えば、合併症ボタンをクリックすると、ワークステーション110から図19A、図19Bに示すような高血圧診断ディスプレイスクリーン340が表示される。この高血圧診断ディスプレイスクリーン340には、患者が高血圧を引き起こすかどうかを医療提供者が判断するのを支援するボックス342−362がある。例えば、ボックス342は、タイプ1またはタイプ2糖尿病患者が、高血圧を引き起こす可能性があることを示し、その後に続くボックスは、医療提供者が血圧を測定し、以前の血圧値を調査することを指示している。ボックス346は血圧測定指針を示している。さらに、医療提供者がボックス346でボックス”R”をクリックしていれば、図20A、図20Bに示すように正常血圧範囲と糖尿病血圧範囲を示しているドロップダウンボックス(dropdown box)がワークステーションから表示される。
Furthermore, when a corresponding button such as an education button is clicked, a self-management / compliance
ディスプレイスクリーン340の追加ボックスは、同じように医療提供者に質問をして、医療提供者が診断を行うのを支援している。医療提供者がボックス362にまで達すると、患者を高血圧として診断することを勧められる。そこで、医療提供者がボックス362の高血圧治療開始の個所をクリックすると、図21A、図21B、図21C、図21Dに示すような高血圧薬剤療法開始ディスプレイスクリーン370が表示される。高血圧薬剤療法開始ディスプレイスクリーン370にはボックス372−384があり、そこには、高血圧療法治療のための推薦が医療提供者に示されている。また、医療提供者がボックス380で高血圧薬剤療法調整の個所をクリックすると、高血圧療法薬剤と治療を調整するための高血圧薬剤療法調整スクリーン(図示せず)がワークステーション110から表示される。
An additional box on the display screen 340 similarly questions the health care provider and assists the health care provider in making a diagnosis. When the health care provider reaches
図6A,図6B、図6Cに戻って説明すると、ボタンカラム133を使用すると、医療提供者は、図22に示すような診断スクリーン、図23A、図23Bに示すような患者基本摂取量スクリーン、および図24A、図24Bに示すような印刷スクリーンを表示することもできる。
Returning to FIGS. 6A, 6B, and 6C, using the
図25と図26A、図26Bは、本発明の別実施形態によるシステムと方法において、上述した情報と経路が異なるように配置されているディスプレイスクリーンを表示するためにワークステーション110がどのように制御されるかを示す変形図である。例を示して説明すると、医療提供者が、例えば、医療提供者ワークステーション106からデータベース104にアクセスするとき、コンピュータ102はデータベース104にアクセ研究所の結果スし、ワークステーション106が図25に示すようなディスプレイ400をディスプレイスクリーンから生成できるようにするデータをワークステーション106に与えることができる。
FIGS. 25, 26A and 26B illustrate how the
図5に示すディスプレイ130と同じように、ディスプレイ400には、患者名のリストが含まれている。しかし、ディスプレイ130とは異なり、ディスプレイ400に表示される名前は、予約時間の時間順にリストされている。さらに、ディスプレイには、患者の名前に関連する、ある種の患者情報が表示される。例えば、患者のHbA1c、血圧およびLDL読取値(分かっている場合)が、患者が喫煙者であるかどうかの通知と共に表示される。ディスプレイ400は、該当すると判断されたものであれば、他の患者関連情報を含むように構成することができる。
Similar to display 130 shown in FIG. 5, display 400 includes a list of patient names. However, unlike the
スクリーン130の場合と同じように、医療提供者がシステムと方法を使用して特定の患者のための診断と治療を得ることに関心がある場合は、医療提供者は、例えば、自分のワークステーション106でマウスを使用して関心のある名前をクリックすることができる。この行為により、Webブラウザは、図26A、図26Bに示すように患者の診察と診断経路を示しているディスプレイ402を生成する。この例では、ディスプレイ402には「タイプ2インシュリン調整」経路が示されているが、これは単なる例示である。しかし、当然に理解されるように、このシステムと方法は、Webブラウザが、例えば、診察および診断ディスプレイスクリーンまたは他の適切なタイプのディスプレイと経路を最初に表示するように構成することも可能である。
As with the
図示のように、ディスプレイ402には経路セクション404があり、この経路セクションには、上述した他の経路と同じように、医療提供者が患者を治療するのを支援する指針を示している複数のボックス406−422を含む経路が含まれている。また、上述した他の経路と同じように、経路セクション404は、患者データに基づき患者の状態を強調表示している。言い換えれば、経路セクション404も、患者データと指針を統合している。例えば、患者は夜間低血糖症 (nocturnal hypoglycemia) であるので、「夜間低血糖症」という用語が、スクリーンの左側に表示されたSMBGデータの結果として、ボックス406に強調表示の長方形で囲まれている。同様に、患者のSMGBおよび/またはHbA1cは目標値範囲内にあるので、「目標値範囲内」という用語が、ボックス412にハイライト表示の長方形で囲まれている。従って、医療提供者は指針における情報と実際値を連結すると、上述したように患者の治療の進め方を判断することができる。 As shown, the display 402 has a path section 404 that, like the other paths described above, includes a plurality of guidelines that help the healthcare provider treat the patient. A route including boxes 406-422 is included. Also, like the other routes described above, the route section 404 highlights the patient's condition based on patient data. In other words, the path section 404 also integrates patient data and guidelines. For example, because the patient has nocturnal hypoglycemia, the term “night hypoglycemia” is surrounded by a highlighted rectangle in box 406 as a result of the SMBG data displayed on the left side of the screen. Yes. Similarly, because the patient's SMGB and / or HbA1c is within the target value range, the term “within target value range” is enclosed in a box 412 with a highlighted rectangle. Therefore, the health care provider can determine how to proceed with the treatment of the patient as described above by connecting the information in the guideline and the actual value.
さらに、ディスプレイ402には、患者データセクション408があり、そこには、患者のHbA1c読取値、血圧 (blood pressure BP) 読取値などの患者データが表示される。また、ディスプレイ402には、データビューセクション410があり、そこには、データビューセクション412に現在表示されているデータビューのタイプが示される。この例では、表示されているデータビューは、図示のように、30日のSMBG様式 (Modal) になっている。医療提供者は、データビューセクション410で「7日日誌」などの、他の選択肢の1つをクリックすると、患者に関する7日日誌がデータビューセクション412に表示される。診断および経路セクション414は、経路セクション404に表示されている経路のタイプを示している。このケースでは、図示のようにタイプ2インシュリン調整経路が表示されている。医療提供者は、診断および経路セクション414で該当の用語をクリックすると、「合併症1」経路などの異なる経路を選択して表示することができる。現在の療法セクション416は、患者が受けている療法のタイプ(例えば、インシュリン)を示している。
In addition, display 402 includes a patient data section 408 that displays patient data such as the patient's HbA1c reading, blood pressure BP reading, and the like. The display 402 also includes a data view section 410 that indicates the type of data view currently displayed in the data view section 412. In this example, the displayed data view is in the 30-day SMBG format (Modal) as shown. When the health care provider clicks on one of the other options, such as “7-day diary” in the data view section 410, the 7-day diary for the patient is displayed in the data view section 412. The diagnostic and route section 414 shows the type of route displayed in the route section 404. In this case, the
さらに図26A、図26Bに示すように、ディスプレイ402には、「タイプ1糖尿病」、「妊娠期間(gestational)」などの言葉を含むボタンがあり、これらのボタンは、経路セクション404の反対側に縦方向に並んでいる。上述したボタンカラム133のボタンの場合と同様に、医療提供者は、これらのボタンのいずれかをクリックすると、選択されたボタンに示されている言葉に関係する経路が表示される。例えば、医療提供者が「タイプ1糖尿病」ボタンをクリックすると、ディスプレイ402には、タイプ1糖尿病を治療するための指針を示している経路が表示される。この場合、診断および経路セクション414に表示されている言葉も、経路セクション404に表示されている経路を反映するように変更される。さらに、左スクリーンの半分に表示されているデータ変数も、アクセスされる新フローチャート経路に関係するものに変更される。
Further, as shown in FIGS. 26A and 26B, the display 402 includes buttons that include words such as “
さらに図26A、図26Bに示すように、ディスプレイ402には、教育チェックリストセクション418があり、そこには、任意の経路のとき任意の患者に受けさせたい教育のリスト(目録)を含めることが可能になっている。例えば、タイプ2インシュリン調整経路が経路セクション404に表示されている場合には、医療提供者は教育チェックリストセクション418をクリックすると、自己監視教育などのように、その特定経路に対する推奨の患者教育を示しているドロップダウンメニューが表示される。ディスプレイ402には、主観的−客観的評価とプラン (subjective-objective assessment and plan SOAP) セクションもあり、そこには、医療提供者が入力した注記が、患者データなどと一緒に表示可能になっている。
Further, as shown in FIGS. 26A and 26B, the display 402 has an education checklist section 418 that may contain a list of education that any patient wants to receive on any route. It is possible. For example, if a
上述したように、上記システムと方法は糖尿病の治療だけに限定されるものではなく、この分野の精通者ならば当然に理解されるように、どのような医学的治療にも応用可能である。 As noted above, the systems and methods are not limited to treating diabetes, but can be applied to any medical treatment, as will be appreciated by those skilled in the art.
本発明のいくつかの例示実施形態だけを詳しく上述してきたが、この分野の精通者ならば理解されるように、本発明の新規の教示事項と利点を出発点として、例示実施形態は種々態様に変更が可能である。従って、かかる変更のすべては、請求項に明確化されている本発明の範囲内に属するものである。 Although only a few exemplary embodiments of the present invention have been described in detail above, as will be appreciated by those skilled in the art, the exemplary embodiments may have various aspects, starting with the novel teachings and advantages of the present invention. Can be changed. Accordingly, all such modifications are within the scope of this invention as defined in the claims.
Applications Claiming Priority (2)
| Application Number | Priority Date | Filing Date | Title |
|---|---|---|---|
| US24484500P | 2000-11-01 | 2000-11-01 | |
| PCT/US2001/042888 WO2002037337A2 (en) | 2000-11-01 | 2001-11-01 | A system and method for integrating data with guidelines to generate displays containing the guidelines and data |
Publications (2)
| Publication Number | Publication Date |
|---|---|
| JP2004534975A JP2004534975A (en) | 2004-11-18 |
| JP2004534975A5 true JP2004534975A5 (en) | 2005-05-26 |
Family
ID=22924354
Family Applications (1)
| Application Number | Title | Priority Date | Filing Date |
|---|---|---|---|
| JP2002540013A Pending JP2004534975A (en) | 2000-11-01 | 2001-11-01 | System and method for integrating data and guidelines and providing a display including the guidelines and data |
Country Status (6)
| Country | Link |
|---|---|
| US (2) | US20030167185A1 (en) |
| EP (1) | EP1358615A2 (en) |
| JP (1) | JP2004534975A (en) |
| AU (1) | AU2002224472A1 (en) |
| CA (1) | CA2427739A1 (en) |
| WO (1) | WO2002037337A2 (en) |
Families Citing this family (22)
| Publication number | Priority date | Publication date | Assignee | Title |
|---|---|---|---|---|
| CA2413845A1 (en) * | 2000-06-20 | 2001-12-27 | Sdgi Holdings, Inc. | Electronic patient healthcare system and method |
| US8224663B2 (en) * | 2002-05-24 | 2012-07-17 | Becton, Dickinson And Company | System and method for assessment and corrective action based on guidelines |
| US20050027569A1 (en) * | 2003-07-31 | 2005-02-03 | Sohrab Gollogly | Systems and methods for documentation of encounters and communications regarding same |
| US8275631B2 (en) | 2003-09-15 | 2012-09-25 | Idx Systems Corporation | Executing clinical practice guidelines |
| US20050246203A1 (en) * | 2004-04-30 | 2005-11-03 | Narayan M S Laxmi | Crucial and significant (C&S) patient information management and display |
| US20060106647A1 (en) * | 2004-11-18 | 2006-05-18 | Brummel Anthony C | Method and apparatus for determining pharmacy order parameters based on patient context data |
| US8165899B2 (en) * | 2006-01-13 | 2012-04-24 | Medrule Business Solutions, Inc. | System and method for managing form-generated data |
| US8924159B2 (en) * | 2008-05-30 | 2014-12-30 | Abbott Diabetes Care Inc. | Method and apparatus for providing glycemic control |
| KR20140117698A (en) * | 2008-07-07 | 2014-10-07 | 아가매트릭스, 인코포레이티드 | Integrated blood glucose measurement device |
| US8930490B2 (en) | 2009-01-27 | 2015-01-06 | Apple Inc. | Lifestream annotation method and system |
| US8645383B2 (en) * | 2009-01-27 | 2014-02-04 | Stephen J. Brown | Content management system using sources of experience data and modules for quantification and visualization |
| US20100249965A1 (en) * | 2009-03-31 | 2010-09-30 | Agamatrix, Inc. | Integrated Blood Glucose Measurement Device |
| EP2435978A4 (en) * | 2009-05-28 | 2013-11-27 | Refill Man Systems Llc | Medication refill advisor system and method |
| US20110166886A1 (en) * | 2009-11-24 | 2011-07-07 | Vincent Zeringue | Bariatric Treatment Management System and Method |
| CN104053396B (en) * | 2011-12-15 | 2016-12-21 | 贝克顿·迪金森公司 | For the explanation of physiological data improved and the system presented of physiological situation management information |
| US20150058040A1 (en) * | 2012-03-30 | 2015-02-26 | Koninklijke Philips N.V. | Method for synchronizing the state of a computer interpretable guideline engine with the state of patient care |
| JP6297571B2 (en) * | 2012-09-10 | 2018-03-20 | コーニンクレッカ フィリップス エヌ ヴェKoninklijke Philips N.V. | Support for clinical decisions |
| CN104969251A (en) * | 2013-01-31 | 2015-10-07 | 惠普发展公司,有限责任合伙企业 | Synthetic healthcare data generation |
| US20160239619A1 (en) * | 2013-10-14 | 2016-08-18 | Koninklijke Philips N.V. | A unique methodology combining user roles and context aware algorithms for presenting clinical information, audio, video and communication controls to safely capture caregiver attention, reduce information overload, and optimize workflow and decision support |
| US10704944B2 (en) | 2014-09-14 | 2020-07-07 | Becton, Dickinson And Company | System and method for capturing dose information |
| US10971260B2 (en) | 2014-09-14 | 2021-04-06 | Becton, Dickinson And Company | System and method for capturing dose information |
| WO2021104324A1 (en) * | 2019-11-25 | 2021-06-03 | 京东方科技集团股份有限公司 | Medical information processing method, medical information acquisition method and medical information exchange method |
Family Cites Families (10)
| Publication number | Priority date | Publication date | Assignee | Title |
|---|---|---|---|---|
| US5732397A (en) * | 1992-03-16 | 1998-03-24 | Lincoln National Risk Management, Inc. | Automated decision-making arrangement |
| EP0600081A4 (en) * | 1992-06-22 | 1995-03-01 | Health Risk Management Inc | Health care management system. |
| US5574828A (en) * | 1994-04-28 | 1996-11-12 | Tmrc | Expert system for generating guideline-based information tools |
| US5974124A (en) * | 1997-01-21 | 1999-10-26 | Med Graph | Method and system aiding medical diagnosis and treatment |
| US6126596A (en) * | 1997-06-02 | 2000-10-03 | Freedman; Joshua | Apparatus and method for evaluating a client's condition and the concordance of a clinician's treatment with treatment guidelines |
| CA2294294A1 (en) * | 1997-07-14 | 1999-01-28 | Abbott Laboratories | Telemedicine |
| US6230142B1 (en) * | 1997-12-24 | 2001-05-08 | Homeopt, Llc | Health care data manipulation and analysis system |
| US20030178031A1 (en) * | 1999-05-07 | 2003-09-25 | Du Pen, Inc. | Method for cancer pain treatment |
| CA2328545A1 (en) * | 2000-05-30 | 2001-11-30 | Visualmed Clinical Systems Corporation | Hospital informatics system |
| US20020091687A1 (en) * | 2000-09-29 | 2002-07-11 | Thor Eglington | Decision support system |
-
2001
- 2001-11-01 AU AU2002224472A patent/AU2002224472A1/en not_active Abandoned
- 2001-11-01 US US09/985,173 patent/US20030167185A1/en not_active Abandoned
- 2001-11-01 JP JP2002540013A patent/JP2004534975A/en active Pending
- 2001-11-01 CA CA002427739A patent/CA2427739A1/en not_active Abandoned
- 2001-11-01 WO PCT/US2001/042888 patent/WO2002037337A2/en not_active Application Discontinuation
- 2001-11-01 EP EP01992954A patent/EP1358615A2/en not_active Withdrawn
-
2008
- 2008-09-25 US US12/232,907 patent/US10290070B2/en not_active Expired - Fee Related
Similar Documents
| Publication | Publication Date | Title |
|---|---|---|
| US10290070B2 (en) | System and method for integrating data with guidelines to generate displays containing the guidelines and data | |
| Laurant et al. | Nurses as substitutes for doctors in primary care | |
| JP2004534975A5 (en) | ||
| US10790063B2 (en) | Computer-aided multiple standard-based functional evaluation and medical reporting system | |
| Coon et al. | Adherence to American Diabetes Association standards of care by rural health care providers | |
| Flum et al. | Has misdiagnosis of appendicitis decreased over time?: a population-based analysis | |
| US7962348B2 (en) | Apparatus, method and software for developing electronic documentation of imaging modalities, other radiological findings and physical examinations | |
| JP5317496B2 (en) | HEALTH DISEASE MANAGEMENT SUPPORT DEVICE AND METHOD, AND MEDICAL NETWORK SYSTEM | |
| US20080249804A1 (en) | Method for Managing Medical Information Online | |
| US20020035486A1 (en) | Computerized clinical questionnaire with dynamically presented questions | |
| US20050065813A1 (en) | Online medical evaluation system | |
| US20090177453A1 (en) | Medical diagnosis support computer system, computer program, and server computer | |
| WO2005122033A1 (en) | Medical total information apparatus and medical total information system | |
| US20030120515A1 (en) | Method and system for managing health | |
| Redeker | Health beliefs and adherence in chronic illness | |
| US20070136090A1 (en) | System and method for macro-enhanced clinical workflow | |
| JP2002024409A (en) | Health care system for patient | |
| US20100063845A1 (en) | Systems and Methods for Allowing Patient Access to a Patient Electronic Health Records | |
| US20050060199A1 (en) | System and method for managing diseases according to standard protocols and linking patients to medication samples and related benefits | |
| WO2020017291A1 (en) | Medical questionnaire generation assist device, method and program | |
| JP7238705B2 (en) | Medical care support method, medical care support system, learning model generation method, and medical care support program | |
| TWI352301B (en) | Electronic chart system | |
| JP2004013219A (en) | Medical process control method | |
| Hicks | The potential of claims data to support the measurement of health care quality | |
| US20110161103A1 (en) | Systems and methods for electronic medical support |