EP3798629A1 - Processing system, processing method, and storage medium - Google Patents
Processing system, processing method, and storage medium Download PDFInfo
- Publication number
- EP3798629A1 EP3798629A1 EP20195259.5A EP20195259A EP3798629A1 EP 3798629 A1 EP3798629 A1 EP 3798629A1 EP 20195259 A EP20195259 A EP 20195259A EP 3798629 A1 EP3798629 A1 EP 3798629A1
- Authority
- EP
- European Patent Office
- Prior art keywords
- detector
- processing device
- detection result
- determination
- welding object
- Prior art date
- Legal status (The legal status is an assumption and is not a legal conclusion. Google has not performed a legal analysis and makes no representation as to the accuracy of the status listed.)
- Pending
Links
- 238000012545 processing Methods 0.000 title claims abstract description 216
- 238000003672 processing method Methods 0.000 title claims description 4
- 238000001514 detection method Methods 0.000 claims abstract description 101
- 238000003466 welding Methods 0.000 claims abstract description 67
- 238000007689 inspection Methods 0.000 claims description 39
- 238000004364 calculation method Methods 0.000 claims description 23
- 238000000034 method Methods 0.000 claims description 14
- 239000000284 extract Substances 0.000 claims description 13
- 238000012935 Averaging Methods 0.000 claims description 12
- 230000007246 mechanism Effects 0.000 claims description 11
- 238000001228 spectrum Methods 0.000 claims description 10
- 239000002184 metal Substances 0.000 description 31
- 230000001902 propagating effect Effects 0.000 description 14
- 238000003384 imaging method Methods 0.000 description 9
- 230000004048 modification Effects 0.000 description 8
- 238000012986 modification Methods 0.000 description 8
- 239000011248 coating agent Substances 0.000 description 7
- 238000000576 coating method Methods 0.000 description 7
- 238000001914 filtration Methods 0.000 description 7
- 230000008859 change Effects 0.000 description 5
- 230000001066 destructive effect Effects 0.000 description 5
- 238000010586 diagram Methods 0.000 description 4
- 230000006870 function Effects 0.000 description 4
- 238000000605 extraction Methods 0.000 description 3
- 230000008569 process Effects 0.000 description 3
- 238000004891 communication Methods 0.000 description 2
- 230000002349 favourable effect Effects 0.000 description 2
- 238000002844 melting Methods 0.000 description 2
- 230000008018 melting Effects 0.000 description 2
- 230000000737 periodic effect Effects 0.000 description 2
- 239000011347 resin Substances 0.000 description 2
- 229920005989 resin Polymers 0.000 description 2
- 239000000523 sample Substances 0.000 description 2
- 239000007787 solid Substances 0.000 description 2
- 238000010183 spectrum analysis Methods 0.000 description 2
- 230000007723 transport mechanism Effects 0.000 description 2
- 230000005540 biological transmission Effects 0.000 description 1
- 239000003086 colorant Substances 0.000 description 1
- 239000000356 contaminant Substances 0.000 description 1
- 230000007423 decrease Effects 0.000 description 1
- 230000001419 dependent effect Effects 0.000 description 1
- 230000000694 effects Effects 0.000 description 1
- 239000000463 material Substances 0.000 description 1
- 239000011159 matrix material Substances 0.000 description 1
- 238000002156 mixing Methods 0.000 description 1
- 230000003287 optical effect Effects 0.000 description 1
- 239000004065 semiconductor Substances 0.000 description 1
- 238000006467 substitution reaction Methods 0.000 description 1
Images


Classifications
-
- G—PHYSICS
- G01—MEASURING; TESTING
- G01N—INVESTIGATING OR ANALYSING MATERIALS BY DETERMINING THEIR CHEMICAL OR PHYSICAL PROPERTIES
- G01N29/00—Investigating or analysing materials by the use of ultrasonic, sonic or infrasonic waves; Visualisation of the interior of objects by transmitting ultrasonic or sonic waves through the object
- G01N29/04—Analysing solids
- G01N29/11—Analysing solids by measuring attenuation of acoustic waves
-
- B—PERFORMING OPERATIONS; TRANSPORTING
- B23—MACHINE TOOLS; METAL-WORKING NOT OTHERWISE PROVIDED FOR
- B23K—SOLDERING OR UNSOLDERING; WELDING; CLADDING OR PLATING BY SOLDERING OR WELDING; CUTTING BY APPLYING HEAT LOCALLY, e.g. FLAME CUTTING; WORKING BY LASER BEAM
- B23K9/00—Arc welding or cutting
- B23K9/095—Monitoring or automatic control of welding parameters
- B23K9/0953—Monitoring or automatic control of welding parameters using computing means
-
- B—PERFORMING OPERATIONS; TRANSPORTING
- B23—MACHINE TOOLS; METAL-WORKING NOT OTHERWISE PROVIDED FOR
- B23K—SOLDERING OR UNSOLDERING; WELDING; CLADDING OR PLATING BY SOLDERING OR WELDING; CUTTING BY APPLYING HEAT LOCALLY, e.g. FLAME CUTTING; WORKING BY LASER BEAM
- B23K31/00—Processes relevant to this subclass, specially adapted for particular articles or purposes, but not covered by only one of the preceding main groups
- B23K31/12—Processes relevant to this subclass, specially adapted for particular articles or purposes, but not covered by only one of the preceding main groups relating to investigating the properties, e.g. the weldability, of materials
- B23K31/125—Weld quality monitoring
-
- B—PERFORMING OPERATIONS; TRANSPORTING
- B23—MACHINE TOOLS; METAL-WORKING NOT OTHERWISE PROVIDED FOR
- B23K—SOLDERING OR UNSOLDERING; WELDING; CLADDING OR PLATING BY SOLDERING OR WELDING; CUTTING BY APPLYING HEAT LOCALLY, e.g. FLAME CUTTING; WORKING BY LASER BEAM
- B23K9/00—Arc welding or cutting
- B23K9/095—Monitoring or automatic control of welding parameters
- B23K9/0956—Monitoring or automatic control of welding parameters using sensing means, e.g. optical
-
- G—PHYSICS
- G06—COMPUTING; CALCULATING OR COUNTING
- G06T—IMAGE DATA PROCESSING OR GENERATION, IN GENERAL
- G06T7/00—Image analysis
- G06T7/0002—Inspection of images, e.g. flaw detection
- G06T7/0004—Industrial image inspection
-
- G—PHYSICS
- G01—MEASURING; TESTING
- G01N—INVESTIGATING OR ANALYSING MATERIALS BY DETERMINING THEIR CHEMICAL OR PHYSICAL PROPERTIES
- G01N2291/00—Indexing codes associated with group G01N29/00
- G01N2291/04—Wave modes and trajectories
- G01N2291/044—Internal reflections (echoes), e.g. on walls or defects
-
- G—PHYSICS
- G01—MEASURING; TESTING
- G01N—INVESTIGATING OR ANALYSING MATERIALS BY DETERMINING THEIR CHEMICAL OR PHYSICAL PROPERTIES
- G01N2291/00—Indexing codes associated with group G01N29/00
- G01N2291/10—Number of transducers
- G01N2291/106—Number of transducers one or more transducer arrays
-
- G—PHYSICS
- G01—MEASURING; TESTING
- G01N—INVESTIGATING OR ANALYSING MATERIALS BY DETERMINING THEIR CHEMICAL OR PHYSICAL PROPERTIES
- G01N2291/00—Indexing codes associated with group G01N29/00
- G01N2291/26—Scanned objects
- G01N2291/267—Welds
-
- G—PHYSICS
- G06—COMPUTING; CALCULATING OR COUNTING
- G06T—IMAGE DATA PROCESSING OR GENERATION, IN GENERAL
- G06T2207/00—Indexing scheme for image analysis or image enhancement
- G06T2207/10—Image acquisition modality
- G06T2207/10132—Ultrasound image
Definitions
- Embodiments described herein relate generally to a processing system, a processing method and a storage medium.
- portions of two or more members are joined to each other by melting.
- the welded members are inspected for whether or not the welded portion (hereinbelow, called the weld portion) is joined appropriately.
- a human an inspector that grips a detector causes the detector to contact the weld portion.
- An ultrasonic wave is transmitted from the detector toward the weld portion, and the existence or absence of the joint is inspected based on the reflected wave.
- a reflected wave that reflects the state of the weld portion cannot be detected if the detector does not contact the weld portion appropriately. Accordingly, when inspecting, it is desirable for the detector to appropriately contact the weld portion.
- a processing system includes a processing device.
- the processing device performs at least a first determination of determining whether or not a detector contacts a welding object.
- the detector includes a plurality of detection elements arranged in a first direction.
- the detector transmits an ultrasonic wave toward the welding object and detects a reflected wave.
- the first determination is based on a detection result when the reflected wave is detected by the detector.
- FIG. 1 is a block diagram illustrating a configuration of a processing system according to an embodiment.
- the processing system 100 includes a processing device 110 and a memory device 120.
- the memory device 120 stores data relating to a weld inspection.
- the processing device 110 processes the data relating to the weld inspection.
- the processing system 100 illustrated in FIG. 1 further includes a detector 130, an input device 140, and a display device 150.
- the detector 130 transmits an ultrasonic wave toward an object and detects (receives) a reflected wave.
- the detector 130 includes, for example, a probe.
- probing the transmission of the ultrasonic wave and the detection of the reflected wave by the detector 130 is called probing.
- the processing device 110 performs various processing based on the detected reflected wave.
- the processing device 110 causes the display device 150 to display a user interface.
- the user easily can confirm data obtained by the processing via the user interface displayed by the display device 150.
- the user can input data to the processing device 110 via the user interface by using the input device 140.
- a non-destructive inspection of the weld portion is performed in the weld inspection.
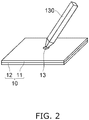
- FIG. 2 is a schematic view illustrating a state of the non-destructive inspection.
- the detector 130 includes multiple detection elements for inspecting the weld portion.
- the detector 130 has a configuration that can be gripped by the hand of a human as illustrated in FIG. 2 .
- the human that grips the detector 130 inspects the weld portion 13 by causing the tip of the detector 130 to contact the weld portion 13.
- a human grips the detector 130 and performs a weld inspection is called the user.
- FIG. 3 is a schematic view illustrating the internal structure of the detector tip.
- an element array 131 that includes multiple detection elements 132 is provided inside the detector 130 tip.
- the detection elements 132 are, for example, transducers.
- the element array 131 emits an ultrasonic wave of a frequency of not less than 1 MHz and not more than 100 MHz.
- the multiple detection elements 132 may be arranged in a line configuration in one direction or may be arranged in a matrix configuration in two directions crossing each other. In the example illustrated in FIG. 3 , the multiple detection elements 132 are arranged in an X-direction (a first direction) and a Y-direction (a second direction) that are orthogonal to each other.
- the element array 131 is covered with a hard propagating member 133.
- the hard propagating member 133 is positioned between the element array 131 and the weld portion 13 when the tip of the detector 130 contacts the weld portion 13.
- the hard propagating member 133 includes a resin material or the like through which an ultrasonic wave propagates easily.
- the hard propagating member 133 By providing the hard propagating member 133 to correspond to the shape of the weld portion 13 surface, the ultrasonic wave easily propagates into the weld portion 13.
- deformation, damage, etc., of the element array 131 can be suppressed by the hard propagating member 133 when the detector 130 contacts the weld portion 13.
- the hard propagating member 133 has a hardness sufficient to suppress the deformation, the damage, etc., when contacting the weld portion 13.
- FIG. 2 and FIG. 3 illustrate a state of inspecting a member 10 as the welding object.
- the member 10 is made by spot-welding a metal plate 11 (a first member) and a metal plate 12 (a second member) at the weld portion 13.
- a solidified portion 14 is formed at the weld portion 13 by a portion of the metal plate 11 and a portion of the metal plate 12 melting, mixing, and solidifying.
- a couplant 15 is coated onto the surface of the object when inspecting so that the ultrasonic wave propagates easily between the object and the detector 130.
- Each of the detection elements 132 transmits an ultrasonic wave US toward the member 10 coated with the couplant 15 and receives reflected waves RW from the member 10.
- a soft propagating member through which an ultrasonic wave propagates easily may be provided at the tip of the detector 130.
- the soft propagating member is softer than the hard propagating member 133.
- the soft propagating member deforms along the shape of the surface of the weld portion 13 when contacting the weld portion 13.
- the soft propagating member includes, for example, a gel resin.
- one detection element 132 transmits the ultrasonic wave US toward the weld portion 13. A portion of the ultrasonic wave US is reflected by the upper surface or the lower surface of the member 10, etc.
- the multiple detection elements 132 each receive (detect) the reflected waves RW.
- the detection elements 132 sequentially transmit the ultrasonic wave US, and the reflected waves RW are received by the multiple detection elements 132.
- the processing device 110 determines whether or not the detector 130 contacts the welding object based on the detection result of the obtained reflected waves.
- the processing device 110 may calculate the tilt with respect to the weld portion 13 and inspect the weld portion 13 based on the detection result of the obtained reflected waves. For example, the processing device 110 stores the determination result of the contact, the calculation result of the tilt, the inspection result of the weld portion 13, etc., in the memory device 120.
- the angle between the normal direction of the surface of the weld portion 13 and the direction of the detector 130 is called the tilt.
- the direction of the detector 130 corresponds to a Z-direction perpendicular to the arrangement direction of the detection elements 132.
- the tilt is zero when the detector 130 contacts the surface of the weld portion 13 perpendicularly.
- the processing device 110 is connected to the memory device 120, the detector 130, the input device 140, and the display device 150 via wired communication, wireless communication, or a network.
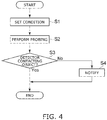
- FIG. 4 is a flowchart illustrating the flow of a contact determination of the detector using the processing system according to the embodiment.
- a condition for determining whether or not the detector 130 contacts the welding object is set (step S1).
- the user moves the detector 130 so that the detector 130 contacts the weld portion 13.
- the user uses the detector 130 to perform probing (step S2).
- a button for performing probing is provided in the detector 130. The user can use the detector 130 to perform probing by operating the button. Or, the user may use the detector 130 to perform probing via the user interface displayed by the display device 150.
- the processing device 110 When the reflected wave is detected by the probing, the processing device 110 performs a first determination of determining whether or not the detector 130 contacts the welding object (step S3). The processing device 110 performs the first determination based on the detected reflected wave and the condition set in step S1.
- the processing device 110 When it is determined that the detector 130 does not contact the welding object as a result of the first determination, for example, the processing device 110 notifies the user (step S4).
- the method of the notification is arbitrary.
- the detector 130 may emit a sound or light toward the user.
- the display of the display device 150 may be changed. For example, an error message may be displayed in the display device 150.
- the detector 130 When the detector 130 does not contact the welding object, a detection result that reflects the state of the weld portion 13 is not obtained. If the calculation of the tilt or the inspection is performed using the detection result when the detector 130 is not in contact, there is a possibility that a mistaken result may be output. By performing the first determination, the calculation of the tilt or the inspection by using the detection result when the detector 130 is not in contact can be suppressed.
- the determination of whether or not the detector 130 contacts the welding object is the determination of whether or not the detection result of an appropriate reflected wave is obtained.
- the detector 130 may not directly contact the welding object and may contact via a couplant. In such a case, the ultrasonic wave propagates sufficiently between the detector 130 and the welding object via the couplant. Therefore, a detection result that is suited to the calculation of the tilt or the inspection is obtained. Even when the detector 130 directly contacts the welding object, there is a possibility that an appropriate detection result may not be obtained if the couplant is not filled sufficiently between the detector 130 and the welding object.
- the determination based on the detection result of the reflected waves that the detection result is usable in the calculation of the tilt or the inspection is called the detector 130 being in contact with the welding object.
- the detector 130 even when the detector 130 appears to contact the welding object, there are cases where foreign matter such as a contaminant, residue when processing, or the like actually exists between the detector 130 and the welding object. Also, when there is a recess or a protrusion in the surface of the welding object, there are cases where a gap occurs between the detector 130 and the welding object. According to the embodiment, in such a case, the user is notified when the ultrasonic wave does not propagate sufficiently between the detector 130 and the welding object even via the couplant. Thereby, the user can know whether or not the detector 130 appropriately contacts the welding object even in cases where it is difficult to determine the contact of the detector 130 by the naked eye.
- step S1 The setting of the condition in step S1 and the first determination of step S3 will now be described in detail.
- step S1 probing is performed in a state in which the detector 130 contacts the member and a state in which the detector 130 is separated from the member.
- the processing device 110 sets a first threshold by using the detection result of the reflected waves (a first detection result) when the detector 130 contacts the member and the detection result of the reflected waves (a second detection result) when the detector 130 is separated from the member.
- FIG. 5 is a schematic view illustrating the state of probing using the detector.
- the ultrasonic wave US When the ultrasonic wave US is transmitted from the detector 130, a portion of the ultrasonic wave US is reflected by an upper surface 11a of the metal plate 11 or an upper surface 13a of the weld portion 13 as illustrated in FIG. 5 . Another portion of the ultrasonic wave US enters the member 10 and is reflected by a lower surface 11b of the metal plate 11, a lower surface 13b of the weld portion 13, etc.
- the detector 130 detects the intensity of the reflected waves from the surfaces.
- the intensity of the reflected wave may be represented in any form.
- the reflected wave intensity that is output from the detection element 132 may include positive values and negative values according to the phase.
- Various processing may be performed based on the reflected wave intensity including the positive values and the negative values.
- the reflected wave intensity that includes the positive values and the negative values may be converted into absolute values.
- the average value of the reflected wave intensities may be subtracted from the reflected wave intensity at each time.
- the weighted average value, the weighted moving average value, or the like of the reflected wave intensities may be subtracted from the reflected wave intensity at each time.
- the various processing described herein can be performed even when the results of such processing applied to the reflected wave intensity are used.
- FIG. 6 is a schematic view of an image of the detection result of the reflected waves.
- FIG. 6 illustrates the detection result when the detector 130 contacts the member 10 which is the welding object as illustrated in FIG. 5 .
- FIG. 6 illustrates the state of the welding object in the X-Z cross section.
- the points where the intensity of the reflected wave is high are illustrated using white.
- the binarized intensity of the reflected wave is illustrated schematically.
- the position in the Z-direction corresponds to the time from emitting the ultrasonic wave until the reflected wave is received.
- the white lines that extend along the X-direction or the Y-direction illustrate the surfaces of the member.
- multiple white lines that exist at the center in the X-direction or the Y-direction are based on the reflected waves from the upper surface 13a and the lower surface 13b of the weld portion 13.
- the multiple white lines that exist at the end side in the X-direction or the Y-direction are based on the reflected waves from the upper surface 11a of the metal plate 11, the lower surface 11b of the metal plate 11, and a lower surface 12b of the metal plate 12.
- Three or more white lines exist in the Z-direction in FIG. 6 This shows that the ultrasonic wave US undergoes multiple reflections between the upper surface and the lower surface of each portion of the member 10 as illustrated in FIG. 5 .
- a white line WL1 is based on the reflected wave from the upper surface 13a of the weld portion 13.
- a white line WL2 is based on the reflected wave from the lower surface 13b of the weld portion 13.
- a white line WL3 is based on a multiple-reflection wave reflected between the upper surface 13a and the lower surface 13b.
- a white line WL4 is based on the reflected wave from the upper surface 11a of the metal plate 11.
- a white line WL5 is based on the reflected wave from the lower surface 11b of the metal plate 11.
- a white line WL6 is based on a multiple-reflection wave reflected between the upper surface 11a and the lower surface 11b and the reflected wave from the lower surface 12b of the metal plate 12.
- a white line WL0 is based on the reflected wave from the surface of the hard propagating member 133.
- the lower surface 11b of the metal plate 11 contacts an upper surface 12a of the metal plate 12, and a space does not exist between these surfaces.
- the thickness of the metal plate 11 is the same as the thickness of the metal plate 12. Therefore, the reflected wave from the upper surface 12a of the metal plate 12 is not included in the detection result illustrated in FIG. 6 .
- the spacing is substantially the same between the white lines based on the reflected waves from the upper surface 11a, the lower surface 11b, and the lower surface 12b.
- the processing device 110 When setting the condition, the processing device 110 averages or sums the intensities of at least a portion of the detected reflected waves.
- the processing device 110 calculates a first reference value by averaging the intensities of at least a portion of the reflected waves included in the first detection result.
- the processing device 110 calculates a second reference value by averaging the intensities of at least a portion of the reflected waves included in the second detection result.
- the processing device 110 may calculate the first reference value by summing the intensities of at least a portion of the reflected waves included in the first detection result.
- the processing device 110 may calculate the second reference value by summing the intensities of at least a portion of the reflected waves included in the second detection result.
- the processing device 110 may convert the intensities of the reflected waves into absolute values. Or, the processing device 110 may apply prescribed processing to the intensities so that the intensities have the same sign. The processing device 110 sets a value between the first reference value and the second reference value as the first threshold.
- the reflected waves are weaker when the detector 130 is separated from the object than when the detector 130 contacts the object.
- the second reference value is less than the first reference value when the positive value of the intensity increases as the reflected wave becomes stronger.
- the processing device 110 sets an intermediate value of the first reference value and the second reference value as the first threshold.
- the processing device 110 may set the first threshold by adding or subtracting, to the first reference value or the second reference value, a value corresponding to the difference between the first reference value and the second reference value.
- the processing device 110 stores the condition in the memory device 120.
- the processing device 110 performs the first determination by using the condition. Specifically, the processing device 110 calculates the first determination value by using the intensities of at least a portion of the reflected waves detected by the probing of step S2.
- the first determination value similarly is calculated by averaging the intensities.
- the first determination value is calculated by summing the intensities.
- the processing device 110 compares the first determination value and the first threshold. For example, when the positive value of the intensity increases as the reflected wave becomes stronger, the processing device 110 determines whether or not the first determination value is greater than the first threshold. When the first determination value is greater than the first threshold, the processing device 110 determines that the detector 130 contacts the welding object. When the first determination value is not more than the first threshold, the processing device 110 determines that the detector 130 is separated from the welding object.
- the intensities of all of the detected reflected waves may be used, or the intensities of a portion of the detected reflected waves may be used.
- the first reference value and the second reference value similarly are calculated using the intensities of a portion of the reflected waves included respectively in the first detection result and the second detection result.
- FIG. 7 is a graph illustrating the intensity distribution of the reflected waves.
- FIG. 7 illustrates the horizontal axis is the position in the Z-direction, and the vertical axis is the intensity of the reflected wave.
- FIG. 7 illustrates the intensity distribution of the reflected waves in the Z-direction in one X-Z cross section.
- FIG. 7 illustrates the results in which the reflected wave intensities are converted into absolute values.
- a peak Pe0 is based on the reflected wave from the interface between the hard propagating member 133 and the couplant 15.
- a peak Pe1 is based on the reflected wave from the upper surface 13a of the weld portion 13.
- a peak Pe2 is based on the reflected wave from the lower surface 13b of the weld portion 13.
- a peak Pe3 and the subsequent periodic multiple peaks are based on multiple-reflection waves between the upper surface 13a and the lower surface 13b.
- the white lines WL0 to WL3 illustrated in FIG. 6 correspond respectively to the peaks Pe0 to Pe3.
- the multiple peaks having smaller intensities than the peaks Pe0 to Pe3 are based on the reflected waves and the multiple-reflection waves from the upper surfaces and the lower surfaces of the metal plates 11 and 12 other than the weld portion 13.
- the peak Pe0 is based on the reflected wave from the interface between the hard propagating member 133 and the couplant 15. Therefore, the peak Pe0 is detected regardless of whether or not the detector 130 contacts the object. Also, the position of the peak Pe0 is constant regardless of whether or not the detector 130 contacts the object. Other than the peak Pe0, the intensities change according to whether or not the detector 130 contacts the welding object. Accordingly, when averaging or summing the intensities of the reflected waves, it is favorable to use the intensities of the detected reflected waves after the peak Pe0.
- the ultrasonic wave is reflected by the lower surface 13b of the weld portion 13 and undergoes multiple reflections between the upper surface 13a and the lower surface 13b.
- the intensities of the reflected waves change greatly according to whether or not the detector 130 contacts the welding object.
- the processing device 110 uses at least one of the intensity in a portion P1 in which the reflected wave from the lower surface 13b of the weld portion 13 is detected or the intensity in a portion P2 in which the multiple-reflection wave between the upper surface 13a and the lower surface 13b is detected. Thereby, in the first determination, the contact of the detector 130 with the welding object can be determined with higher accuracy.
- the ranges of the portion P1 and the portion P2 may be preset. Other than the peak Pe0, the intervals of the peaks are dependent on the thickness of the weld portion 13. When the thickness of the weld portion 13 is known, the ranges of the portion P1 and the portion P2 can be set based on the thickness.
- the portion P2 may be set to include the peak Pe3 and all subsequent peaks, or may be set to include only a portion of the peak Pe3 and the subsequent peaks as illustrated in FIG. 7 .
- the processing device 110 extracts a first portion in which the multiple-reflection waves are detected from the first detection result, and averages or sums the intensities of the reflected waves in the first portion to calculate the first reference value.
- the processing device 110 extracts a second portion in which the multiple-reflection waves are detected from the second detection result, and averages or sums the intensities of the reflected waves in the second portion to calculate the second reference value.
- FIG. 6 and FIG. 7 illustrate the detection result in one X-Z cross section.
- the first determination value may be calculated based on the intensity distribution in one X-Z cross section, or may be calculated based on the intensity distribution in one X-Z cross section and one Y-Z cross section.
- the processing device 110 may generate the intensity distribution by averaging or summing the intensities in at least a portion of the X-Y plane for each of multiple points in the Z-direction and may calculate the first determination value based on the intensity distribution.
- the processing device 110 may set the range used to calculate the first determination value in the X-Y plane based on the diameter of the weld portion 13.
- the diameter of the weld portion 13 is the length of the weld portion 13 in a direction perpendicular to the direction in which the metal plates 11 and 12 are overlaid.
- the calculation amount can be reduced by using only the intensities of a portion of the X-Y plane.
- the user may be able to designate the range of the detection result used to calculate the first determination value, the first reference value, and the second reference value via the user interface displayed by the display device 150.
- FIG. 8 is an example of the user interface displayed by the display device.
- the processing device 110 causes the display device 150 to display the user interface 900 illustrated in FIG. 8 .
- a first image 910, a second image 920, and a third image 930 are displayed in the user interface 900.
- the first to third images 910 to 930 illustrate the intensity of the reflected wave for each of multiple points.
- the points where the intensity of the reflected wave is high are illustrated using white.
- the binarized intensity of the reflected wave is illustrated schematically.
- the first image 910 illustrates the result of summing the intensities of the reflected waves in the Z-direction for each of the multiple points of the X-Y plane.
- the second image 920 illustrates the intensity of the reflected wave in the X-Z cross section at the Y-direction center of the first image 910.
- the third image 930 illustrates the intensity of the reflected wave in the Y-Z cross section at the X-direction center of the first image 910.
- the user can draw a frame F1 or F2 in the second image 920 or the third image 930 by operating a pointer 901 by using the input device 140.
- the other of the frame F1 or F2 is set automatically at the same position in the Z-direction as the one of the frame F1 or F2.
- the size of the frame F1, the position in the X-direction of the frame F1, the size of the frame F2, and the position in the Y-direction of the frame F2 can be set freely by the user.
- the X-direction center of the frame F1 may be fixed to the X-direction center of the second image 920
- the Y-direction center of the frame F2 may be fixed to the Y-direction center of the third image 930.
- the size of the other of the frame F1 or F2 may change conjunctively.
- the user can adjust the size of the frames F1 and F2 by operating the pointer 901 to drag and drop the frames F1 and F2.
- the processing device 110 stores the positions of the changed frames F1 and F2.
- the processing device 110 calculates the first reference value based on the intensities of the reflected waves included in the frames F1 and F2 in the first detection result.
- the processing device 110 calculates the second reference value based on the intensities of the reflected waves included in the frames F1 and F2 in the second detection result.
- the processing device 110 calculates the first determination value based on the intensities of the reflected waves included in the frames F1 and F2 in the detection result obtained by the probing in step S2.
- the processing device 110 may set a first range based on the first reference value and the second reference value.
- the processing device 110 may set the first threshold in addition to the first range.
- the lower limit and the upper limit of the first range are set to be between the first reference value and the second reference value.
- the processing device 110 calculates a first intermediate value of the first reference value and the second reference value.
- the processing device 110 sets an intermediate value between the first intermediate value and the first reference value as the upper limit of the first range.
- the processing device 110 sets an intermediate value between the first intermediate value and the second reference value as the lower limit of the first range.
- the processing device 110 sets an intermediate value between the first intermediate value and the first reference value as the first threshold.
- the first threshold may be set outside the first range.
- the processing device 110 stores the first threshold and the first range that are set in the memory device 120.
- the processing device 110 determines whether or not the first determination value is within the first range when the first determination value is not more than the first threshold.
- the processing device 110 determines that the detector 130 is separated from the object when the first determination value is outside the first range (less than the lower limit of the first range).
- the processing device 110 determines that the state of the detector 130 cannot be designated when the first determination value is not less than the lower limit and not more than the upper limit of the first range.
- the processing device 110 notifies the user in step S4 when determining in step S3 that the detector 130 is separated from the object or the state of the detector 130 cannot be designated.
- FIGS. 9A and 9B are graphs illustrating the intensity distribution of the reflected waves.
- FIG. 9A and FIG. 9B illustrate the intensity of the reflected wave for each of multiple points in the Z-direction in one X-Z cross section.
- the processing device 110 may set the condition relating to the intervals or the positions of the peaks in step S1.
- the member 10 that has the same structure as the object that is actually inspected is used in step S1.
- the detector 130 is caused to contact the weld portion 13, and probing is performed.
- the processing device 110 generates the intensity distribution of the reflected waves in the Z-direction from the detection result obtained when the detector 130 contacts the weld portion 13.
- the processing device 110 detects the peaks existing in the intensity distribution. For example, the processing device 110 extracts the peaks Pe0 to Pe4 that exceed a preset threshold TH1 from the detected peaks as illustrated in FIG. 9A .
- the processing device 110 removes the first peak Pe0 in the Z-direction, and only the peaks Pe1 to Pe4 caused by the reflected waves from the member 10 remain.
- the threshold TH1 may be preset by the user or may be set based on an average value of at least a portion of the intensity distribution, etc.
- the processing device 110 calculates the average of intervals In1 to In3 between the peaks Pe1 to Pe4.
- the processing device 110 uses the average value as a reference to set the condition relating to the intervals of the peaks.
- the processing device 110 may set the condition relating to the positions of the peaks by using the positions of the peaks Pe1 to Pe4 as a reference.
- the processing device 110 sets ranges PRa1 to PRa4 of the peaks based on the peaks Pe1 to Pe4.
- the positions of the centers of the ranges PRa1 to PRa4 correspond respectively to the positions of the maximum intensities of the peaks Pe1 to Pe4.
- the size of the range of the peaks may be preset by the user or may be set based on the full widths at half maximum of the detected peaks, etc.
- the processing device 110 stores the condition relating to the intervals or the positions of the peaks in the memory device 120.
- the processing device 110 extracts the peaks having intensities not less than the threshold TH1 from the intensity distribution of the detected reflected wave.
- the processing device 110 determines whether or not the intervals of the extracted peaks satisfy the condition relating to the intervals of the peaks set in step S1. For example, the processing device 110 determines that the condition is satisfied when the intervals of the extracted peaks are not less than (1 - x ) times and not more than (1 + x ) times an average value AVG of the intervals of the peaks calculated in step S1.
- x is preset by the user. Or, x may be set based on the standard deviation of the intervals of the peaks, etc.
- the processing device 110 determines whether or not the positions of the extracted peaks satisfy the condition relating to the positions of the peaks set in step S1. For example, the processing device 110 determines whether or not the positions of the extracted peaks each are within the ranges PRa1 to PRa4 set in step S1. In the first determination, the processing device 110 determines that the condition is satisfied when the peaks are positioned in the ranges PRa1 to PRa4.
- the processing device 110 may perform the first determination by using both the condition relating to the intervals of the peaks and the condition relating to the positions of the peaks.
- the processing device 110 may determine the contact of the detector 130 based on the spectrum of the reflected wave intensity.
- step S1 the member 10 that has the same structure as the object that is actually inspected is used.
- the detector 130 is caused to contact the weld portion 13, and probing is performed.
- the processing device 110 generates the intensity distribution of the reflected waves in the Z-direction from the detection result obtained when the detector 130 contacts the weld portion 13.
- the processing device 110 performs spectral analysis of the intensity distribution and generates the spectrum of the relationship between the reflected wave intensity and the reciprocal of the thickness (mm) of the member. A Fourier transform is used in the spectral analysis.
- FIG. 10 is a graph illustrating the spectrum.
- the horizontal axis is the reciprocal of the thickness (mm) of the member
- the vertical axis is the intensity of the reflected waves corresponding to the components of the horizontal axis.
- the ultrasonic wave undergoes multiple reflections at the metal plate 11, the metal plate 12, or the weld portion 13. Therefore, the intensity of the reflected wave has a periodicity corresponding to the thickness of the metal plate 11, the thickness of the metal plate 12, and the thickness of the weld portion 13.
- the thickness of the metal plate 11 and the thickness of the metal plate 12 are the same, an intense peak appears at the reciprocal of the thickness of the metal plates 11 and 12 and the reciprocal of the thickness of the weld portion 13 as illustrated in FIG. 10 .
- the processing device 110 When the spectrum is generated in step S1, the processing device 110 extracts peaks having intensities that are not less than a threshold TH2 as illustrated in FIG. 10 .
- the processing device 110 sets the condition by using a value V1 of the reciprocal of the thickness where each peak appears as a reference. Subsequently, when the spectrum is generated in the first determination, the processing device 110 extracts the peaks that have intensities not less than the threshold TH2.
- the processing device 110 determines whether or not a value V2 of the reciprocal of the thickness where each peak appears satisfies the condition.
- the processing device 110 determines that the condition is satisfied when the value V2 of the reciprocal of the thickness where the peak appears is not less than (1 - y ) times and not more than (1 + y ) times the value V1.
- y is preset by the user. Or, y may be set based on the standard deviation of the intervals, etc.
- the intervals of the peaks, the positions of the peaks, or the positions of the peaks in the spectrum are unique values of the welding object.
- the contact of the detector 130 can be determined with higher accuracy by using these values for the condition of the first determination.
- the calculation of the tilt of the detector 130 or the inspection of the weld portion 13 may be performed when it is determined that the detector 130 contacts the welding object. Also, the processing system 100 may set the range of the detection result used to calculate the tilt.
- FIG. 11 is a flowchart illustrating the flow of the inspection using the processing system according to the embodiment.
- Steps S1 to S4 are performed similarly to the flowchart illustrated in FIG. 4 .
- the processing device 110 determines whether or not the estimation of the range corresponding to the reflected waves from the weld portion 13 in the detection result is complete (step S5).
- the processing device 110 estimates the range (step S6).
- the ultrasonic wave is reflected also from surfaces other than the weld portion 13.
- the processing device 110 estimates the range corresponding to the reflected waves from the weld portion 13 and subsequently calculates the tilt based on the reflected waves included in this range. The necessary calculation amount can be reduced thereby. Also, the accuracy of the calculated tilt can be increased.
- the processing device 110 calculates the tilt of the detector 130 based on the detection result of the reflected waves within the estimated range (step S7). It is determined whether or not the calculated tilt is within a tolerance range (step S8). The determination may be performed by the user or may be performed by the processing device 110. When the processing device 110 performs the determination, the tolerance range may be preset by the user or may be set based on the history of previous inspection results.
- the processing device 110 when performing the inspection of the weld portion 13, the processing device 110 also measures the diameter of the weld portion 13 based on the detection result.
- the diameter of the weld portion 13 corresponds to the lengths in the X-direction and the Y-direction of the portion in which the reflected waves from the upper surface and the lower surface of the weld portion 13 are detected. For example, if the tilt of the detector 130 is too large, the diameter of the weld portion 13 that is calculated is less than the actual value. The calculated diameter of the weld portion 13 increases as the tilt of the detector 130 decreases. When the tilt of the detector 130 is sufficiently small, the calculated diameter of the weld portion 13 substantially no longer changes.
- Such relationships between the tilt of the detector 130 and the diameter of the weld portion 13 calculated previously are stored in the memory device 120.
- the processing device 110 determines a boundary value so that the change of the diameter of the weld portion 13 with respect to the change of the tilt of the detector 130 becomes small.
- the processing device 110 sets the size of the tolerance range based on the boundary value. For example, the processing device 110 sets the boundary value as the size of the tolerance range. Or, to increase the accuracy of the inspection, the processing device 110 may set, as the tolerance range, a value that is less than the value calculated based on the boundary value.
- the probing by the detector 130 may be re-performed when performing steps S6 and S7.
- the detection result that is used in the first determination of step S3 is used when performing steps S6 and S7.
- the number of times of performing the probing can be reduced, and the calculation amount of the processing device 110 and the detector 130 can be reduced.
- step S9 the user adjusts the tilt of the detector 130 (step S9).
- the processing device 110 performs step S8, the user may be notified that the tilt is not within the tolerance range.
- step S2 is re-performed using the tilt after the adjustment. As a result, it is redetermined whether or not the detector 130 contacts the welding object after adjusting the tilt as well. Thereby, the recalculation of the tilt can be suppressed by using the detection result when the detector 130 is not in contact after the adjustment of the tilt.
- step S3 may be omitted.
- step S3 before adjusting the tilt it has been determined that the detector 130 contacts the welding object. Accordingly, after adjusting the tilt, likelihood of the detector 130 being separated from the welding object is low. By omitting step S3, the calculation amount of the processing device 110 can be reduced.
- the inspection is performed when the tilt is within the tolerance range (step S10).
- the user compares the tilt and the tolerance range, the user causes the processing device 110 to perform the inspection when the tilt is within the tolerance range.
- the processing device 110 compares the tilt and the tolerance range, the processing device 110 automatically performs the inspection when the tilt is within the tolerance range.
- the processing device 110 outputs the result of the inspection to the display device 150 (step S11).
- the inspection result includes the information indicating whether or not the weld is joined, the diameter of the weld portion, the minimum diameter of the weld portion, the maximum diameter of the weld portion, etc.
- Step S6 will now be described in detail with reference to FIG. 12A to FIG. 19 .
- the detection result of the reflected waves is illustrated two-dimensionally.
- the detection result of the reflected waves may be illustrated three-dimensionally.
- the member 10 is illustrated by multiple voxels. Coordinates in the X-direction, the Y-direction, and the Z-direction are set for each of the voxels.
- a reflected wave intensity is associated with each of the voxels based on the detection result of the reflected waves.
- the processing device 110 estimates a range (a group of voxels) corresponding to the weld portion 13 for the multiple voxels.
- the number of voxels and the size of each voxel that are set may be determined automatically or may be set by the user via the user interface 900.
- FIG. 12A and FIG. 12B are graphs illustrating the intensity distribution of the reflected waves in the Z-direction for one cross section.
- FIG. 13 is a graph illustrating the intensity distribution of the reflected waves in the Z-direction.
- the processing device 110 generates the intensity distribution of the reflected waves in the Z-direction based on the detection result of the reflected waves.
- FIG. 12A and FIG. 12B are such examples. When the intensity distribution already has been generated, the intensity distribution may be used when determining the contact of the detector 130.
- the horizontal axis is the position in the Z-direction
- the vertical axis is the intensity of the reflected wave.
- FIG. 12A illustrates the intensity distribution of the reflected waves in the Z-direction in one X-Z cross section.
- FIG. 12B illustrates the intensity distribution of the reflected waves in the Z-direction in one Y-Z cross section.
- FIG. 12A and FIG. 12B illustrate the results in which the reflected wave intensities are converted into absolute values.
- the processing device 110 may generate the intensity distribution of the reflected waves in the Z-direction by summing the reflected wave intensities in the X-Y plane for each of multiple points in the Z-direction.
- FIG. 13 is such an example.
- the horizontal axis is the position in the Z-direction and the vertical axis is the intensity of the reflected wave.
- FIG. 13 illustrates the results of converting the reflected wave intensities into absolute values and subtracting the average value of the reflected wave intensities from the reflected wave intensity for each of the multiple points in the Z-direction.
- the intensity distribution of the reflected waves in the Z-direction includes components reflected by the upper surface 13a and the lower surface 13b of the weld portion 13 and components reflected by the upper surface and the lower surface of other portions.
- the processing device 110 extracts only the components reflected by the upper surface 13a and the lower surface 13b of the weld portion 13 from the intensity distribution of the reflected waves by filtering. For example, values that correspond to integer multiples of half of the thickness in the Z-direction (the distance between the upper surface 13a and the lower surface 13b) of the weld portion 13 are preset.
- the processing device 110 extracts only the periodic components of the values by referring to the values.
- a band-pass filter, a zero-phase filter, a low-pass filter, a high-pass filter, threshold determination of the intensity after the filtering, etc., can be used as the filtering.
- FIG. 14 is a graph illustrating the results of filtering the intensity distribution of the reflected waves.
- the horizontal axis is the position in the Z-direction
- the vertical axis is the intensity of the reflected waves.
- the processing device 110 estimates the range of the weld portion in the Z-direction based on the extraction results. For example, the processing device 110 detects peaks included in the extraction results. The processing device 110 detects the position in the Z-direction of a first peak and the position in the Z-direction of a second peak. For example, the processing device 110 uses these positions as a reference to estimate a range Ra1 illustrated in FIG. 14 as the range of the weld portion in the Z-direction.
- the processing device 110 may detect a peak of one of positive or negative and another peak of the other of positive or negative.
- the processing device 110 uses the positions of these peaks as references to estimate the range of the weld portion in the Z-direction. Also, according to the processing of the reflected wave intensity, there are cases where the reflected wave intensity has only positive values or negative values.
- the range of the weld portion in the Z-direction may be estimated based on the positions of multiple peaks, may be estimated based on the positions of the peak and the bottom, or may be estimated based on the positions of multiple bottoms.
- the processing device 110 uses the reflected wave intensity after the filtering to estimate the range of the weld portion in the Z-direction based on the positions of multiple extrema.
- the processing device 110 calculates the average, the weighted average, the weighted moving average, or the like of the multiple estimation results and estimates the calculation result to be the range of the entire weld portion in the Z-direction.
- the processing device 110 may estimate the range of the weld portion in the Z-direction based on the intensity distribution of the reflected waves for one of the X-Z cross section or the Y-Z cross section and use the estimation result as the range of the entire weld portion in the Z-direction.
- the processing device 110 may estimate the range of the weld portion in the Z-direction based on the intensity distribution of the reflected waves for a portion in the X-direction and a portion in the Y-direction and use the estimation result as the range of the entire weld portion in the Z-direction.
- the calculation amount necessary for the generation of the intensity distribution of the reflected waves can be reduced by such processing.
- the position in the Z-direction of the lower limit of the range Ra1 is set by subtracting a prescribed value from the position in the Z-direction of the first peak.
- the position in the Z-direction of the upper limit of the range Ra1 is set by adding a prescribed value to the position in the Z-direction of the second peak.
- the processing device 110 estimates the range of the weld portion in the X-direction and the range of the weld portion in the Y-direction.
- FIG. 15 and FIG. 17 are schematic views illustrating the detection result of the reflected waves.
- a region R is the entire region where the detection result of the reflected waves is obtained by the element array 131.
- One cross section of the region R includes the components of the reflected waves of the upper surface and the lower surface of the weld portion and the components of the reflected waves of the upper surface and the lower surface of the other portions.
- the processing device 110 generates the intensity distribution of the reflected waves in the X-Y plane for each of multiple points in the Z-direction.
- the processing device 110 may generate the intensity distribution within a preset range in the Z-direction. The calculation amount can be reduced thereby. Or, the processing device 110 may generate the intensity distribution within the estimated range in the Z-direction. Thereby, the reflected wave component being outside the lower surface of the weld portion when generating the intensity distribution of the reflected waves in the X-Y plane can be suppressed while reducing the calculation amount.
- FIG. 16A to FIG. 16C are examples of the intensity distribution of the reflected waves in the X-Y plane.
- the binarized intensity of the reflected wave is illustrated schematically in FIG. 15 , FIG. 16A to FIG. 16C , and FIG. 17 .
- the processing device 110 calculates the centroid position of the intensity distribution of the reflected waves in the X-Y plane for each of the multiple points in the Z-direction.
- the centroid position of the intensity distribution is obtained by calculating the centroid position of an image of the intensity distribution. For example, as illustrated in FIG. 16A to FIG. 16C , the processing device 110 calculates centroid positions C1 to C350 of the images.
- the average position of the centroids in the X-direction and the average position of the centroids in the Y-direction are obtained thereby.
- an average position AP illustrates the average position of the centroids in the X-direction and the average position of the centroids in the Y-direction.
- the processing device 110 uses prescribed ranges in the X-direction and the Y-direction from the average position AP at the center as a range Ra2 of the weld portion in the X-direction and a range Ra3 of the weld portion in the Y-direction.
- a value V that indicates the diameter of the detector 130 (the element array 131) is preset to estimate the range Ra2 and the range Ra3.
- the processing device 110 uses the ranges of AP - V /2 to AP + V /2 as the range Ra2 and the range Ra3 respectively in the X-direction and the Y-direction.
- the estimated range in the X-Y plane is quadrilateral.
- the estimated range is not limited to the example; the estimated range in the X-Y plane may have a polygonal shape having five or more corners, a circular shape, etc.
- the shape of the estimated range in the X-Y plane is modifiable as appropriate according to the shape of the weld portion.
- the range Ra2 and the range Ra3 may be determined using another value based on the value V.
- a value that indicates the diameter of the detector 130 may be preset. This is because the diameter of the weld portion corresponds to the diameter of the detector 130.
- the value that indicates the diameter of the weld portion can be considered to be a value that substantially indicates the diameter of the detector 130.
- step S7 illustrated in FIG. 11 is performed based on the detection result of the reflected waves in the estimated ranges.
- FIG. 18 is a flowchart illustrating the flow of the estimation of the range of the processing system according to the embodiment.
- the processing device 110 generates the intensity distribution of the reflected waves in the Z-direction based on the detection result of the reflected waves by the detector 130 (step S601).
- the processing device 110 filters the intensity distribution based on a value of the thickness of the weld portion (step S602). Thereby, only the reflected wave components of the weld portion 13 are extracted from the intensity distribution.
- the processing device 110 estimates the range of the weld portion in the Z-direction (step S603).
- the processing device 110 calculates the centroid position of the reflected wave intensity in the X-Y plane for each of multiple points in the Z-direction (step S604).
- the processing device 110 calculates the average position by averaging the multiple calculated centroid positions (step S605). Based on the average position and the diameter of the detector 130, the processing device 110 estimates the range in each of the X-direction and the Y-direction (step S606).
- the estimate of the range in the Z-direction may be performed after estimating the ranges in the X-direction and the Y-direction.
- steps S601 to S603 may be performed after steps S604 to S606 in the flowchart illustrated in FIG. 18 .
- the processing device 110 may calculate the intensity distribution of the reflected waves in the Z-direction within the estimated ranges in the X-direction and the Y-direction. The calculation amount can be reduced thereby.
- FIG. 19 is an image illustrating a detection result of the reflected waves.
- whiter colors show that the intensity of the reflected wave is greater at that point.
- the processing device 110 performs the operation illustrated in FIG. 18 for the detection result illustrated in FIG. 19 . As a result, a range Ra is estimated.
- FIG. 20 is a drawing for describing the processing according to the processing system according to the embodiment.
- FIG. 21 and FIGS. 22A to 22C are examples of images obtained by the processing system according to the embodiment.
- FIG. 21 is three-dimensional volume data depicted based on the detection result of the reflected waves.
- FIG. 22A illustrates the surface of the weld portion 13 in the volume data illustrated in FIG. 21 .
- FIG. 22B illustrates the Y-Z cross section at the weld portion 13 vicinity in the volume data illustrated in FIG. 21 .
- FIG. 22C illustrates the X-Z cross section at the weld portion 13 vicinity in the volume data illustrated in FIG. 21 .
- the upper side is the surface of the weld portion, and the data downward in the depth direction is shown.
- the portions where the luminance is high are portions where the reflection intensity of the ultrasonic wave is large. The ultrasonic wave is reflected strongly by the bottom surface of the weld portion 13, a surface between the members not joined to each other, etc.
- the tilt of the detector 130 corresponds to the angle between a direction 13d perpendicular to the weld portion 13 and a direction 130a of the detector 130 illustrated in FIG. 20 .
- This angle is expressed as an angle ⁇ x around the X-direction and an angle ⁇ y around the Y-direction.
- the direction 130a of the detector 130 is perpendicular to the arrangement direction of the detection elements 132.
- the angle ⁇ x is calculated based on the detection result in the Y-Z cross section as illustrated in FIG. 22B .
- the angle ⁇ y is calculated based on the detection result in the X-Z cross section as illustrated in FIG. 22C .
- the processing device 110 calculates the average of the three-dimensional luminance gradients in the cross sections as the angles ⁇ x and ⁇ y.
- the processing device 110 stores the calculated angles ⁇ x and ⁇ y in the memory device 120 as the tilt of the detector 130.
- the processing device 110 may cause the display device 150 to display the calculated tilt.
- FIG. 23A is a schematic view for describing the inspection method according to the processing system according to the embodiment.
- a portion of the ultrasonic wave US is reflected by the upper surface 11a of the metal plate 11 or the upper surface 13a of the weld portion 13.
- Another portion of the ultrasonic wave US enters the member 10 and is reflected by the lower surface 11b of the metal plate 11 or the lower surface 13b of the weld portion 13.
- the positions in the Z-direction of the upper surface 11a, the upper surface 13a, the lower surface 11b, and the lower surface 13b are different from each other. In other words, the distance in the Z-direction between the detection element 132 and these surfaces are different from each other.
- the peaks of the intensities of the reflected waves are detected when the detection element 132 receives the reflected waves from these surfaces. Which surface reflected the ultrasonic wave US can be verified by calculating the time until each peak is detected after transmitting the ultrasonic wave US.
- FIG. 23B and FIG. 23C are graphs illustrating the relationship between the time after transmitting the ultrasonic wave US and the intensity of the reflected wave RW.
- the vertical axis is the elapsed time after transmitting the ultrasonic wave US.
- the horizontal axis is the intensity of the detected reflected wave RW.
- the intensity of the reflected wave RW is illustrated as an absolute value.
- the graph of FIG. 23B illustrates the detection result of the reflected waves RW from the upper surface 11a and the lower surface 11b of the metal plate 11.
- the graph of FIG. 23C illustrates the detection result of the reflected waves RW from the upper surface 13a and the lower surface 13b of the weld portion 13.
- a peak Pe11 occurring first is based on the reflected wave RW from the upper surface 11a.
- a peak Pe12 occurring second is based on the reflected wave RW from the lower surface 11b.
- the times when the peak Pe11 and the peak Pe12 are detected correspond respectively to the positions in the Z-direction of the upper surface 11a and the lower surface 11b of the metal plate 11.
- a time difference TD1 between the time when the peak Pe11 is detected and the time when the peak Pe12 is detected corresponds to a distance Di1 in the Z-direction between the upper surface 11a and the lower surface 11b.
- a peak Pe13 occurring first is based on the reflected wave RW from the upper surface 13a.
- a peak Pe14 occurring second is based on the reflected wave RW from the lower surface 13b.
- the times when the peak Pe13 and the peak Pe14 are detected correspond respectively to the positions in the Z-direction of the upper surface 13a and the lower surface 13b of the weld portion 13.
- a time difference TD2 between the time when the peak Pe13 is detected and the time when the peak Pe14 is detected corresponds to a distance Di2 in the Z-direction between the upper surface 13a and the lower surface 13b.
- the processing device 110 determines whether or not the time difference between the peaks corresponds to the thickness of the weld portion 13 for each of multiple points in the X-Y plane. When the time difference between the peaks is determined to correspond to the thickness of the weld portion 13, it is determined that the weld is joined at that point. A cluster of points where it is determined that the weld is joined corresponds to the weld portion 13. Therefore, the diameter of the weld portion 13 can be calculated based on the size of the cluster of points. For example, the processing device 110 determines the goodness of the weld by comparing the calculated diameter of the weld portion 13 to a preset threshold.
- the ultrasonic wave US it is desirable for the ultrasonic wave US to be transmitted along a direction that is perpendicular on average to the upper surface 13a or the lower surface 13b. Thereby, the ultrasonic wave can be reflected more strongly at the upper surface 13a and the lower surface 13b, and the accuracy of the inspection can be increased.
- the inspection of the weld portion described above may be performed automatically by a robot.
- FIG. 24 is a schematic view illustrating a configuration of a processing system according to a modification of the embodiment.
- FIG. 25 is a perspective view illustrating a portion of the processing system according to the modification of the embodiment.
- the processing system 100a illustrated in FIG. 24 includes the processing device 110 and a robot 160.
- the robot 160 includes the detector 130, an imaging device 161, a coating apparatus 162, an arm 163, and a control device 164.
- the imaging device 161 acquires an image by imaging the welded member.
- the imaging device 161 extracts a weld mark from the image and detects roughly the position of the weld portion 13.
- the coating apparatus 162 coats a couplant onto the upper surface of the weld portion 13.
- the detector 130, the imaging device 161, and the coating apparatus 162 are provided at the tip of the arm 163 as illustrated in FIG. 25 .
- the arm 163 is, for example, a 6-DOF (Degree of Freedom) vertical articulated robot including multiple links and multiple rotation axes.
- the arm 163 includes multiple actuators (for example, motors). The multiple actuators respectively drive the multiple rotation axes.
- the detector 130, the imaging device 161, and the coating apparatus 162 can be displaced by driving the arm 163.
- the control device 164 controls the operations of the components (the detector 130, the imaging device 161, the coating apparatus 162, and the arm 163) of the robot 160.
- FIG. 26 is a flowchart illustrating an operation of the processing system according to the modification of the embodiment.
- a condition for determining the contact of the detector 130 with the welding object is preset.
- the method for setting the condition is as described above.
- the processing device 110 transmits the coordinates of the weld portion 13 stored in the memory device 120 to the control device 164.
- the control device 164 moves the tip of the arm toward the received coordinates by driving the arm 163 (step S21).
- the imaging device 161 images the member 10, and the detailed position of the weld portion 13 is detected from the acquired image (step S22).
- the control device 164 moves the coating apparatus 162 to the vicinity of the detected position by driving the arm 163 (step S23).
- the coating apparatus 162 coats the couplant onto the weld portion 13 (step S24).
- the control device 164 drives the arm 163 and moves the detector 130 so that the tip of the detector 130 contacts the weld portion 13 coated with the couplant (step S25).
- steps S2 to S11 are performed similarly to steps S2 to S11 of the flowchart illustrated in FIG. 11 .
- the processing system 100a may perform an operation other than a notification. For example, the processing system 100a may move the tip of the detector 130 further toward the weld portion imaged in step S22. There is a possibility that erroneous detection of the position of the weld portion may occur due to how the light strikes the weld portion when imaging. There is a possibility that the tip of the detector 130 may contact the weld portion appropriately by moving the tip of the detector 130. Or, the processing system 100a may re-perform step S22.
- the processing system 100a may modify the condition of the image processing, the condition of the position detection of the weld portion, etc., from the directly-previous condition. Thereby, the position of the weld portion may be detected more accurately. After the position of the weld portion is detected, for example, step S23 and subsequent steps are re-performed. In addition to these operations, the processing system 100a also may perform a notification.
- the movable mechanism includes an actuator.
- the probe 130 is attached to the movable mechanism.
- the movable mechanism includes at least one selected from a 6-DOF parallel link mechanism, a 6-DOF horizontal articulated mechanism, and a 2-DOF gonio head.
- the control device 164 controls and drives the movable mechanism. By driving the movable mechanism, the tilt of the detector 130 changes.
- the DOF of the movable mechanism is less than 6-DOF, the member 10 is preferably transported by a transport mechanism (not shown) so as to come into contact with the detector 130. The operation of the transport mechanism may be controlled based on the result of the first determination.
- FIG. 27 is a block diagram illustrating a hardware configuration of the system.
- the processing device 110 of the processing system 100 is a computer and includes ROM (Read Only Memory) 111, RAM (Random Access Memory) 112, a CPU (Central Processing Unit) 113, and a HDD (Hard Disk Drive) 114.
- ROM Read Only Memory
- RAM Random Access Memory
- CPU Central Processing Unit
- HDD Hard Disk Drive
- the ROM 111 stores programs controlling the operations of the computer.
- the ROM 111 stores programs necessary for causing the computer to realize the processing described above.
- the RAM 112 functions as a memory region where the programs stored in the ROM 111 are loaded.
- the CPU 113 includes a processing circuit.
- the CPU 113 reads a control program stored in the ROM 111 and controls the operation of the computer according to the control program. Also, the CPU 113 loads various data obtained by the operation of the computer into the RAM 112.
- the HDD 114 stores data necessary for reading and data obtained in the reading process. For example, the HDD 114 functions as the memory device 120 illustrated in FIG. 1 .
- the processing device 110 may include an eMMC (embedded Multi Media Card), a SSD (Solid State Drive), a SSHD (Solid State Hybrid Drive), etc.
- eMMC embedded Multi Media Card
- SSD Solid State Drive
- SSHD Solid State Hybrid Drive
- the processing and the functions of the processing device 110 may be realized by collaboration between more computer.
- the input device 140 includes at least one of a mouse, a keyboard, or a touchpad.
- the display device 150 includes at least one of a monitor or a projector. A device such as a touch panel that functions as both the input device 140 and the display device 150 may be used.
- the weld portion 13 that is spot-welded by the processing system 100 or 100a is inspected.
- the welding method is not limited to the example; a member that is welded using another method may be inspected by the processing system 100 or 100a.
- the processing system 100 or 100a may inspect a member that is subjected to arc welding, laser welding, or seam welding. A non-destructive inspection that uses the detector 130 is possible for members welded by these methods as well.
- the contact of the detector with the welding object can be determined with higher accuracy.
- the accuracy of the calculation of the tilt or the inspection performed subsequently can be increased.
- similar effects can be obtained by using a program for causing a computer to operate as the processing system.
- the processing of the various data recited above may be recorded in a magnetic disk (a flexible disk, a hard disk, etc.), an optical disk (CD-ROM, CD-R, CD-RW, DVD-ROM, DVD ⁇ R, DVD ⁇ RW, etc.), semiconductor memory, or another recording medium as a program that can be executed by a computer.
- a magnetic disk a flexible disk, a hard disk, etc.
- an optical disk CD-ROM, CD-R, CD-RW, DVD-ROM, DVD ⁇ R, DVD ⁇ RW, etc.
- semiconductor memory or another recording medium as a program that can be executed by a computer.
- the data that is recorded in the recording medium can be read by a computer (or an embedded system).
- the recording format (the storage format) of the recording medium is arbitrary.
- the computer reads the program from the recording medium and causes a CPU to execute the instructions recited in the program based on the program.
- the acquisition (or the reading) of the program may be performed via a network.
Landscapes
- Engineering & Computer Science (AREA)
- Physics & Mathematics (AREA)
- Mechanical Engineering (AREA)
- Quality & Reliability (AREA)
- Theoretical Computer Science (AREA)
- Plasma & Fusion (AREA)
- General Physics & Mathematics (AREA)
- Computer Vision & Pattern Recognition (AREA)
- Acoustics & Sound (AREA)
- Health & Medical Sciences (AREA)
- Life Sciences & Earth Sciences (AREA)
- Chemical & Material Sciences (AREA)
- Analytical Chemistry (AREA)
- Biochemistry (AREA)
- General Health & Medical Sciences (AREA)
- Immunology (AREA)
- Pathology (AREA)
- Investigating Or Analyzing Materials By The Use Of Ultrasonic Waves (AREA)
Abstract
Description
- Embodiments described herein relate generally to a processing system, a processing method and a storage medium.
- In welding, portions of two or more members are joined to each other by melting. The welded members are inspected for whether or not the welded portion (hereinbelow, called the weld portion) is joined appropriately. For example, in a non-destructive inspection, a human (an inspector) that grips a detector causes the detector to contact the weld portion. An ultrasonic wave is transmitted from the detector toward the weld portion, and the existence or absence of the joint is inspected based on the reflected wave.
- In the inspection, a reflected wave that reflects the state of the weld portion cannot be detected if the detector does not contact the weld portion appropriately. Accordingly, when inspecting, it is desirable for the detector to appropriately contact the weld portion.
-
-
FIG. 1 is a block diagram illustrating a configuration of a processing system according to an embodiment; -
FIG. 2 is a schematic view illustrating a state of the non-destructive inspection; -
FIG. 3 is a schematic view illustrating the internal structure of the detector tip; -
FIG. 4 is a flowchart illustrating the flow of a contact determination of the detector using the processing system according to the embodiment; -
FIG. 5 is a schematic view illustrating the state of probing using the detector; -
FIG. 6 is a schematic view of an image of the detection result of the reflected waves; -
FIG. 7 is a graph illustrating the intensity distribution of the reflected waves; -
FIG. 8 is an example of the user interface displayed by the display device; -
FIGS. 9A and 9B are graphs illustrating the intensity distribution of the reflected waves; -
FIG. 10 is a graph illustrating the spectrum; -
FIG. 11 is a flowchart illustrating the flow of the inspection using the processing system according to the embodiment; -
FIG. 12A and FIG. 12B are graphs illustrating the intensity distribution of the reflected waves in the Z-direction for one cross section; -
FIG. 13 is a graph illustrating the intensity distribution of the reflected waves in the Z-direction; -
FIG. 14 is a graph illustrating the results of filtering the intensity distribution of the reflected waves; -
FIG. 15 is a schematic view illustrating the detection result of the reflected waves; -
FIGS. 16A to 16C are examples of the intensity distribution of the reflected waves in the X-Y plane; -
FIG. 17 is a schematic view illustrating the detection result of the reflected waves; -
FIG. 18 is a flowchart illustrating the flow of the estimation of the range of the processing system according to the embodiment; -
FIG. 19 is an image illustrating a detection result of the reflected waves; -
FIG. 20 is a drawing for describing the processing according to the processing system according to the embodiment; -
FIG. 21 is an example of images obtained by the processing system according to the embodiment; -
FIGS. 22A to 22C are examples of images obtained by the processing system according to the embodiment; -
FIGS. 23A to 23C are schematic views for describing the inspection method according to the processing system according to the embodiment; -
FIG. 24 is a schematic view illustrating a configuration of a processing system according to a modification of the embodiment; -
FIG. 25 is a perspective view illustrating a portion of the processing system according to the modification of the embodiment; -
FIG. 26 is a flowchart illustrating an operation of the processing system according to the modification of the embodiment; and -
FIG. 27 is a block diagram illustrating a hardware configuration of the system. - According to one embodiment, a processing system includes a processing device. The processing device performs at least a first determination of determining whether or not a detector contacts a welding object. The detector includes a plurality of detection elements arranged in a first direction. The detector transmits an ultrasonic wave toward the welding object and detects a reflected wave. The first determination is based on a detection result when the reflected wave is detected by the detector.
- Various embodiments are described below with reference to the accompanying drawings.
- The drawings are schematic and conceptual; and the relationships between the thickness and width of portions, the proportions of sizes among portions, etc., are not necessarily the same as the actual values. The dimensions and proportions may be illustrated differently among drawings, even for identical portions.
- In the specification and drawings, components similar to those described previously or illustrated in an antecedent drawing are marked with like reference numerals, and a detailed description is omitted as appropriate.
-
FIG. 1 is a block diagram illustrating a configuration of a processing system according to an embodiment. - As illustrated in
FIG. 1 , theprocessing system 100 according to the embodiment includes aprocessing device 110 and amemory device 120. Thememory device 120 stores data relating to a weld inspection. Theprocessing device 110 processes the data relating to the weld inspection. - The
processing system 100 illustrated inFIG. 1 further includes adetector 130, aninput device 140, and adisplay device 150. Thedetector 130 transmits an ultrasonic wave toward an object and detects (receives) a reflected wave. Thedetector 130 includes, for example, a probe. Hereinafter, the transmission of the ultrasonic wave and the detection of the reflected wave by thedetector 130 is called probing. - The
processing device 110 performs various processing based on the detected reflected wave. For example, theprocessing device 110 causes thedisplay device 150 to display a user interface. The user easily can confirm data obtained by the processing via the user interface displayed by thedisplay device 150. Also, the user can input data to theprocessing device 110 via the user interface by using theinput device 140. - Here, the weld inspection will be described in detail. A non-destructive inspection of the weld portion is performed in the weld inspection.
-
FIG. 2 is a schematic view illustrating a state of the non-destructive inspection. - The
detector 130 includes multiple detection elements for inspecting the weld portion. For example, thedetector 130 has a configuration that can be gripped by the hand of a human as illustrated inFIG. 2 . The human that grips thedetector 130 inspects theweld portion 13 by causing the tip of thedetector 130 to contact theweld portion 13. Here, an example will be described in which a human grips thedetector 130 and performs a weld inspection. Hereinafter, the human (e.g., the inspector) that grips thedetector 130 and performs the weld inspection is called the user. -
FIG. 3 is a schematic view illustrating the internal structure of the detector tip. - As illustrated in
FIG. 3 , anelement array 131 that includesmultiple detection elements 132 is provided inside thedetector 130 tip. Thedetection elements 132 are, for example, transducers. For example, theelement array 131 emits an ultrasonic wave of a frequency of not less than 1 MHz and not more than 100 MHz. Themultiple detection elements 132 may be arranged in a line configuration in one direction or may be arranged in a matrix configuration in two directions crossing each other. In the example illustrated inFIG. 3 , themultiple detection elements 132 are arranged in an X-direction (a first direction) and a Y-direction (a second direction) that are orthogonal to each other. - For example, the
element array 131 is covered with a hard propagatingmember 133. The hard propagatingmember 133 is positioned between theelement array 131 and theweld portion 13 when the tip of thedetector 130 contacts theweld portion 13. The hard propagatingmember 133 includes a resin material or the like through which an ultrasonic wave propagates easily. By providing the hard propagatingmember 133 to correspond to the shape of theweld portion 13 surface, the ultrasonic wave easily propagates into theweld portion 13. Also, deformation, damage, etc., of theelement array 131 can be suppressed by the hard propagatingmember 133 when thedetector 130 contacts theweld portion 13. The hard propagatingmember 133 has a hardness sufficient to suppress the deformation, the damage, etc., when contacting theweld portion 13. -
FIG. 2 andFIG. 3 illustrate a state of inspecting amember 10 as the welding object. Themember 10 is made by spot-welding a metal plate 11 (a first member) and a metal plate 12 (a second member) at theweld portion 13. As illustrated inFIG. 3 , a solidifiedportion 14 is formed at theweld portion 13 by a portion of themetal plate 11 and a portion of themetal plate 12 melting, mixing, and solidifying. - A
couplant 15 is coated onto the surface of the object when inspecting so that the ultrasonic wave propagates easily between the object and thedetector 130. Each of thedetection elements 132 transmits an ultrasonic wave US toward themember 10 coated with thecouplant 15 and receives reflected waves RW from themember 10. - Or, instead of the
couplant 15, a soft propagating member through which an ultrasonic wave propagates easily may be provided at the tip of thedetector 130. The soft propagating member is softer than the hard propagatingmember 133. The soft propagating member deforms along the shape of the surface of theweld portion 13 when contacting theweld portion 13. The soft propagating member includes, for example, a gel resin. - For example, as illustrated in
FIG. 3 , onedetection element 132 transmits the ultrasonic wave US toward theweld portion 13. A portion of the ultrasonic wave US is reflected by the upper surface or the lower surface of themember 10, etc. Themultiple detection elements 132 each receive (detect) the reflected waves RW. Thedetection elements 132 sequentially transmit the ultrasonic wave US, and the reflected waves RW are received by themultiple detection elements 132. - The
processing device 110 determines whether or not thedetector 130 contacts the welding object based on the detection result of the obtained reflected waves. Theprocessing device 110 may calculate the tilt with respect to theweld portion 13 and inspect theweld portion 13 based on the detection result of the obtained reflected waves. For example, theprocessing device 110 stores the determination result of the contact, the calculation result of the tilt, the inspection result of theweld portion 13, etc., in thememory device 120. - Here, the angle between the normal direction of the surface of the
weld portion 13 and the direction of thedetector 130 is called the tilt. For example, the direction of thedetector 130 corresponds to a Z-direction perpendicular to the arrangement direction of thedetection elements 132. The tilt is zero when thedetector 130 contacts the surface of theweld portion 13 perpendicularly. - The
processing device 110 is connected to thememory device 120, thedetector 130, theinput device 140, and thedisplay device 150 via wired communication, wireless communication, or a network. -
FIG. 4 is a flowchart illustrating the flow of a contact determination of the detector using the processing system according to the embodiment. - First, a condition for determining whether or not the
detector 130 contacts the welding object is set (step S1). After the condition is set, the user moves thedetector 130 so that thedetector 130 contacts theweld portion 13. When the user determines that the tip of thedetector 130 contacts theweld portion 13, the user uses thedetector 130 to perform probing (step S2). For example, a button for performing probing is provided in thedetector 130. The user can use thedetector 130 to perform probing by operating the button. Or, the user may use thedetector 130 to perform probing via the user interface displayed by thedisplay device 150. - When the reflected wave is detected by the probing, the
processing device 110 performs a first determination of determining whether or not thedetector 130 contacts the welding object (step S3). Theprocessing device 110 performs the first determination based on the detected reflected wave and the condition set in step S1. - When it is determined that the
detector 130 does not contact the welding object as a result of the first determination, for example, theprocessing device 110 notifies the user (step S4). The method of the notification is arbitrary. Thedetector 130 may emit a sound or light toward the user. The display of thedisplay device 150 may be changed. For example, an error message may be displayed in thedisplay device 150. When it is determined that thedetector 130 contacts the welding object, for example, the calculation of the tilt of thedetector 130 or the inspection of the welding object is performed. - When the
detector 130 does not contact the welding object, a detection result that reflects the state of theweld portion 13 is not obtained. If the calculation of the tilt or the inspection is performed using the detection result when thedetector 130 is not in contact, there is a possibility that a mistaken result may be output. By performing the first determination, the calculation of the tilt or the inspection by using the detection result when thedetector 130 is not in contact can be suppressed. - In other words, the determination of whether or not the
detector 130 contacts the welding object is the determination of whether or not the detection result of an appropriate reflected wave is obtained. For example, thedetector 130 may not directly contact the welding object and may contact via a couplant. In such a case, the ultrasonic wave propagates sufficiently between thedetector 130 and the welding object via the couplant. Therefore, a detection result that is suited to the calculation of the tilt or the inspection is obtained. Even when thedetector 130 directly contacts the welding object, there is a possibility that an appropriate detection result may not be obtained if the couplant is not filled sufficiently between thedetector 130 and the welding object. Here, the determination based on the detection result of the reflected waves that the detection result is usable in the calculation of the tilt or the inspection is called thedetector 130 being in contact with the welding object. - For example, even when the
detector 130 appears to contact the welding object, there are cases where foreign matter such as a contaminant, residue when processing, or the like actually exists between thedetector 130 and the welding object. Also, when there is a recess or a protrusion in the surface of the welding object, there are cases where a gap occurs between thedetector 130 and the welding object. According to the embodiment, in such a case, the user is notified when the ultrasonic wave does not propagate sufficiently between thedetector 130 and the welding object even via the couplant. Thereby, the user can know whether or not thedetector 130 appropriately contacts the welding object even in cases where it is difficult to determine the contact of thedetector 130 by the naked eye. - The setting of the condition in step S1 and the first determination of step S3 will now be described in detail.
- In step S1, probing is performed in a state in which the
detector 130 contacts the member and a state in which thedetector 130 is separated from the member. Theprocessing device 110 sets a first threshold by using the detection result of the reflected waves (a first detection result) when thedetector 130 contacts the member and the detection result of the reflected waves (a second detection result) when thedetector 130 is separated from the member. -
FIG. 5 is a schematic view illustrating the state of probing using the detector. - When the ultrasonic wave US is transmitted from the
detector 130, a portion of the ultrasonic wave US is reflected by anupper surface 11a of themetal plate 11 or anupper surface 13a of theweld portion 13 as illustrated inFIG. 5 . Another portion of the ultrasonic wave US enters themember 10 and is reflected by alower surface 11b of themetal plate 11, alower surface 13b of theweld portion 13, etc. Thedetector 130 detects the intensity of the reflected waves from the surfaces. - The intensity of the reflected wave may be represented in any form. For example, the reflected wave intensity that is output from the
detection element 132 may include positive values and negative values according to the phase. Various processing may be performed based on the reflected wave intensity including the positive values and the negative values. The reflected wave intensity that includes the positive values and the negative values may be converted into absolute values. The average value of the reflected wave intensities may be subtracted from the reflected wave intensity at each time. Or, the weighted average value, the weighted moving average value, or the like of the reflected wave intensities may be subtracted from the reflected wave intensity at each time. The various processing described herein can be performed even when the results of such processing applied to the reflected wave intensity are used. -
FIG. 6 is a schematic view of an image of the detection result of the reflected waves. -
FIG. 6 illustrates the detection result when thedetector 130 contacts themember 10 which is the welding object as illustrated inFIG. 5 .FIG. 6 illustrates the state of the welding object in the X-Z cross section. - In
FIG. 6 , the points where the intensity of the reflected wave is high are illustrated using white. Here, the binarized intensity of the reflected wave is illustrated schematically. The position in the Z-direction corresponds to the time from emitting the ultrasonic wave until the reflected wave is received. The white lines that extend along the X-direction or the Y-direction illustrate the surfaces of the member. - In
FIG. 6 , multiple white lines that exist at the center in the X-direction or the Y-direction are based on the reflected waves from theupper surface 13a and thelower surface 13b of theweld portion 13. The multiple white lines that exist at the end side in the X-direction or the Y-direction are based on the reflected waves from theupper surface 11a of themetal plate 11, thelower surface 11b of themetal plate 11, and alower surface 12b of themetal plate 12. Three or more white lines exist in the Z-direction inFIG. 6 . This shows that the ultrasonic wave US undergoes multiple reflections between the upper surface and the lower surface of each portion of themember 10 as illustrated inFIG. 5 . - For example, a white line WL1 is based on the reflected wave from the
upper surface 13a of theweld portion 13. A white line WL2 is based on the reflected wave from thelower surface 13b of theweld portion 13. A white line WL3 is based on a multiple-reflection wave reflected between theupper surface 13a and thelower surface 13b. Similarly, a white line WL4 is based on the reflected wave from theupper surface 11a of themetal plate 11. A white line WL5 is based on the reflected wave from thelower surface 11b of themetal plate 11. A white line WL6 is based on a multiple-reflection wave reflected between theupper surface 11a and thelower surface 11b and the reflected wave from thelower surface 12b of themetal plate 12. A white line WL0 is based on the reflected wave from the surface of the hard propagatingmember 133. - In the
member 10 illustrated inFIG. 5 , thelower surface 11b of themetal plate 11 contacts anupper surface 12a of themetal plate 12, and a space does not exist between these surfaces. The thickness of themetal plate 11 is the same as the thickness of themetal plate 12. Therefore, the reflected wave from theupper surface 12a of themetal plate 12 is not included in the detection result illustrated inFIG. 6 . The spacing is substantially the same between the white lines based on the reflected waves from theupper surface 11a, thelower surface 11b, and thelower surface 12b. - When setting the condition, the
processing device 110 averages or sums the intensities of at least a portion of the detected reflected waves. - Specifically, the
processing device 110 calculates a first reference value by averaging the intensities of at least a portion of the reflected waves included in the first detection result. Theprocessing device 110 calculates a second reference value by averaging the intensities of at least a portion of the reflected waves included in the second detection result. Or, theprocessing device 110 may calculate the first reference value by summing the intensities of at least a portion of the reflected waves included in the first detection result. Theprocessing device 110 may calculate the second reference value by summing the intensities of at least a portion of the reflected waves included in the second detection result. - When averaging or summing the intensities, the
processing device 110 may convert the intensities of the reflected waves into absolute values. Or, theprocessing device 110 may apply prescribed processing to the intensities so that the intensities have the same sign. Theprocessing device 110 sets a value between the first reference value and the second reference value as the first threshold. - The reflected waves are weaker when the
detector 130 is separated from the object than when thedetector 130 contacts the object. For example, the second reference value is less than the first reference value when the positive value of the intensity increases as the reflected wave becomes stronger. For example, theprocessing device 110 sets an intermediate value of the first reference value and the second reference value as the first threshold. Theprocessing device 110 may set the first threshold by adding or subtracting, to the first reference value or the second reference value, a value corresponding to the difference between the first reference value and the second reference value. - When the condition (the first threshold) is set in step S1, the
processing device 110 stores the condition in thememory device 120. In step S3, theprocessing device 110 performs the first determination by using the condition. Specifically, theprocessing device 110 calculates the first determination value by using the intensities of at least a portion of the reflected waves detected by the probing of step S2. When calculating the first determination value, the same calculation as when calculating the first reference value and the second reference value is used. Namely, when the first reference value and the second reference value are calculated by averaging the intensities, the first determination value similarly is calculated by averaging the intensities. When the first reference value and the second reference value are calculated by summing the intensities, the first determination value is calculated by summing the intensities. - The
processing device 110 compares the first determination value and the first threshold. For example, when the positive value of the intensity increases as the reflected wave becomes stronger, theprocessing device 110 determines whether or not the first determination value is greater than the first threshold. When the first determination value is greater than the first threshold, theprocessing device 110 determines that thedetector 130 contacts the welding object. When the first determination value is not more than the first threshold, theprocessing device 110 determines that thedetector 130 is separated from the welding object. - In the calculation of the first determination value, the intensities of all of the detected reflected waves may be used, or the intensities of a portion of the detected reflected waves may be used. To reduce the calculation amount and shorten the time necessary for the determination, it is favorable to calculate the first determination value by using only the intensities of a portion of the reflected waves. When calculating the first determination value by using only the intensities of a portion of the reflected waves, the first reference value and the second reference value similarly are calculated using the intensities of a portion of the reflected waves included respectively in the first detection result and the second detection result.
-
FIG. 7 is a graph illustrating the intensity distribution of the reflected waves. - In
FIG. 7 , the horizontal axis is the position in the Z-direction, and the vertical axis is the intensity of the reflected wave.FIG. 7 illustrates the intensity distribution of the reflected waves in the Z-direction in one X-Z cross section.FIG. 7 illustrates the results in which the reflected wave intensities are converted into absolute values. - Multiple peaks appear in the intensity distribution illustrated in
FIG. 7 . A peak Pe0 is based on the reflected wave from the interface between the hard propagatingmember 133 and thecouplant 15. A peak Pe1 is based on the reflected wave from theupper surface 13a of theweld portion 13. A peak Pe2 is based on the reflected wave from thelower surface 13b of theweld portion 13. A peak Pe3 and the subsequent periodic multiple peaks are based on multiple-reflection waves between theupper surface 13a and thelower surface 13b. The white lines WL0 to WL3 illustrated inFIG. 6 correspond respectively to the peaks Pe0 to Pe3. The multiple peaks having smaller intensities than the peaks Pe0 to Pe3 are based on the reflected waves and the multiple-reflection waves from the upper surfaces and the lower surfaces of themetal plates weld portion 13. - The peak Pe0 is based on the reflected wave from the interface between the hard propagating
member 133 and thecouplant 15. Therefore, the peak Pe0 is detected regardless of whether or not thedetector 130 contacts the object. Also, the position of the peak Pe0 is constant regardless of whether or not thedetector 130 contacts the object. Other than the peak Pe0, the intensities change according to whether or not thedetector 130 contacts the welding object. Accordingly, when averaging or summing the intensities of the reflected waves, it is favorable to use the intensities of the detected reflected waves after the peak Pe0. - In particular, in the inspection of the
weld portion 13, the ultrasonic wave is reflected by thelower surface 13b of theweld portion 13 and undergoes multiple reflections between theupper surface 13a and thelower surface 13b. The intensities of the reflected waves change greatly according to whether or not thedetector 130 contacts the welding object. As illustrated inFIG. 7 , to calculate the first determination value, theprocessing device 110 uses at least one of the intensity in a portion P1 in which the reflected wave from thelower surface 13b of theweld portion 13 is detected or the intensity in a portion P2 in which the multiple-reflection wave between theupper surface 13a and thelower surface 13b is detected. Thereby, in the first determination, the contact of thedetector 130 with the welding object can be determined with higher accuracy. - The ranges of the portion P1 and the portion P2 may be preset. Other than the peak Pe0, the intervals of the peaks are dependent on the thickness of the
weld portion 13. When the thickness of theweld portion 13 is known, the ranges of the portion P1 and the portion P2 can be set based on the thickness. The portion P2 may be set to include the peak Pe3 and all subsequent peaks, or may be set to include only a portion of the peak Pe3 and the subsequent peaks as illustrated inFIG. 7 . - For example, the
processing device 110 extracts a first portion in which the multiple-reflection waves are detected from the first detection result, and averages or sums the intensities of the reflected waves in the first portion to calculate the first reference value. Theprocessing device 110 extracts a second portion in which the multiple-reflection waves are detected from the second detection result, and averages or sums the intensities of the reflected waves in the second portion to calculate the second reference value. -
FIG. 6 andFIG. 7 illustrate the detection result in one X-Z cross section. The first determination value may be calculated based on the intensity distribution in one X-Z cross section, or may be calculated based on the intensity distribution in one X-Z cross section and one Y-Z cross section. Theprocessing device 110 may generate the intensity distribution by averaging or summing the intensities in at least a portion of the X-Y plane for each of multiple points in the Z-direction and may calculate the first determination value based on the intensity distribution. - For example, when the diameter of the
weld portion 13 is known, theprocessing device 110 may set the range used to calculate the first determination value in the X-Y plane based on the diameter of theweld portion 13. The diameter of theweld portion 13 is the length of theweld portion 13 in a direction perpendicular to the direction in which themetal plates - The user may be able to designate the range of the detection result used to calculate the first determination value, the first reference value, and the second reference value via the user interface displayed by the
display device 150. -
FIG. 8 is an example of the user interface displayed by the display device. - For example, the
processing device 110 causes thedisplay device 150 to display theuser interface 900 illustrated inFIG. 8 . For example, afirst image 910, asecond image 920, and athird image 930 are displayed in theuser interface 900. The first tothird images 910 to 930 illustrate the intensity of the reflected wave for each of multiple points. The points where the intensity of the reflected wave is high are illustrated using white. Here, the binarized intensity of the reflected wave is illustrated schematically. - The
first image 910 illustrates the result of summing the intensities of the reflected waves in the Z-direction for each of the multiple points of the X-Y plane. Thesecond image 920 illustrates the intensity of the reflected wave in the X-Z cross section at the Y-direction center of thefirst image 910. Thethird image 930 illustrates the intensity of the reflected wave in the Y-Z cross section at the X-direction center of thefirst image 910. - For example, the user can draw a frame F1 or F2 in the
second image 920 or thethird image 930 by operating apointer 901 by using theinput device 140. For example, when one of the frame F1 or F2 is set, the other of the frame F1 or F2 is set automatically at the same position in the Z-direction as the one of the frame F1 or F2. The size of the frame F1, the position in the X-direction of the frame F1, the size of the frame F2, and the position in the Y-direction of the frame F2 can be set freely by the user. Or, the X-direction center of the frame F1 may be fixed to the X-direction center of thesecond image 920, and the Y-direction center of the frame F2 may be fixed to the Y-direction center of thethird image 930. For example, when the user changes the size of one of the frame F1 or F2, the size of the other of the frame F1 or F2 may change conjunctively. - For example, the user can adjust the size of the frames F1 and F2 by operating the
pointer 901 to drag and drop the frames F1 and F2. When the sizes of the frames F1 and F2 are changed, theprocessing device 110 stores the positions of the changed frames F1 and F2. Theprocessing device 110 calculates the first reference value based on the intensities of the reflected waves included in the frames F1 and F2 in the first detection result. Theprocessing device 110 calculates the second reference value based on the intensities of the reflected waves included in the frames F1 and F2 in the second detection result. Theprocessing device 110 calculates the first determination value based on the intensities of the reflected waves included in the frames F1 and F2 in the detection result obtained by the probing in step S2. - The
processing device 110 may set a first range based on the first reference value and the second reference value. Theprocessing device 110 may set the first threshold in addition to the first range. The lower limit and the upper limit of the first range are set to be between the first reference value and the second reference value. When the positive value of the intensity increases as the reflected wave becomes stronger, the lower limit and the upper limit of the first range are greater than the second reference value and less than the first reference value. For example, theprocessing device 110 calculates a first intermediate value of the first reference value and the second reference value. Theprocessing device 110 sets an intermediate value between the first intermediate value and the first reference value as the upper limit of the first range. Theprocessing device 110 sets an intermediate value between the first intermediate value and the second reference value as the lower limit of the first range. - For example, the
processing device 110 sets an intermediate value between the first intermediate value and the first reference value as the first threshold. The first threshold may be set outside the first range. Theprocessing device 110 stores the first threshold and the first range that are set in thememory device 120. - In the case where the first threshold and the first range are set, the
processing device 110 determines whether or not the first determination value is within the first range when the first determination value is not more than the first threshold. Theprocessing device 110 determines that thedetector 130 is separated from the object when the first determination value is outside the first range (less than the lower limit of the first range). Theprocessing device 110 determines that the state of thedetector 130 cannot be designated when the first determination value is not less than the lower limit and not more than the upper limit of the first range. - The
processing device 110 notifies the user in step S4 when determining in step S3 that thedetector 130 is separated from the object or the state of thedetector 130 cannot be designated. -
FIGS. 9A and 9B are graphs illustrating the intensity distribution of the reflected waves. - Similarly to
FIG. 7 ,FIG. 9A and FIG. 9B illustrate the intensity of the reflected wave for each of multiple points in the Z-direction in one X-Z cross section. Theprocessing device 110 may set the condition relating to the intervals or the positions of the peaks in step S1. - The
member 10 that has the same structure as the object that is actually inspected is used in step S1. Thedetector 130 is caused to contact theweld portion 13, and probing is performed. Theprocessing device 110 generates the intensity distribution of the reflected waves in the Z-direction from the detection result obtained when thedetector 130 contacts theweld portion 13. Theprocessing device 110 detects the peaks existing in the intensity distribution. For example, theprocessing device 110 extracts the peaks Pe0 to Pe4 that exceed a preset threshold TH1 from the detected peaks as illustrated inFIG. 9A . Theprocessing device 110 removes the first peak Pe0 in the Z-direction, and only the peaks Pe1 to Pe4 caused by the reflected waves from themember 10 remain. The threshold TH1 may be preset by the user or may be set based on an average value of at least a portion of the intensity distribution, etc. - For example, as illustrated in
FIG. 9A , theprocessing device 110 calculates the average of intervals In1 to In3 between the peaks Pe1 to Pe4. Theprocessing device 110 uses the average value as a reference to set the condition relating to the intervals of the peaks. Or, theprocessing device 110 may set the condition relating to the positions of the peaks by using the positions of the peaks Pe1 to Pe4 as a reference. For example, as illustrated inFIG. 9B , theprocessing device 110 sets ranges PRa1 to PRa4 of the peaks based on the peaks Pe1 to Pe4. For example, the positions of the centers of the ranges PRa1 to PRa4 correspond respectively to the positions of the maximum intensities of the peaks Pe1 to Pe4. The size of the range of the peaks may be preset by the user or may be set based on the full widths at half maximum of the detected peaks, etc. Theprocessing device 110 stores the condition relating to the intervals or the positions of the peaks in thememory device 120. - In the first determination, the
processing device 110 extracts the peaks having intensities not less than the threshold TH1 from the intensity distribution of the detected reflected wave. - The
processing device 110 determines whether or not the intervals of the extracted peaks satisfy the condition relating to the intervals of the peaks set in step S1. For example, theprocessing device 110 determines that the condition is satisfied when the intervals of the extracted peaks are not less than (1 - x) times and not more than (1 + x) times an average value AVG of the intervals of the peaks calculated in step S1. x is preset by the user. Or, x may be set based on the standard deviation of the intervals of the peaks, etc. - Or, the
processing device 110 determines whether or not the positions of the extracted peaks satisfy the condition relating to the positions of the peaks set in step S1. For example, theprocessing device 110 determines whether or not the positions of the extracted peaks each are within the ranges PRa1 to PRa4 set in step S1. In the first determination, theprocessing device 110 determines that the condition is satisfied when the peaks are positioned in the ranges PRa1 to PRa4. - The
processing device 110 may perform the first determination by using both the condition relating to the intervals of the peaks and the condition relating to the positions of the peaks. - Or, the
processing device 110 may determine the contact of thedetector 130 based on the spectrum of the reflected wave intensity. In step S1, themember 10 that has the same structure as the object that is actually inspected is used. Thedetector 130 is caused to contact theweld portion 13, and probing is performed. Theprocessing device 110 generates the intensity distribution of the reflected waves in the Z-direction from the detection result obtained when thedetector 130 contacts theweld portion 13. Theprocessing device 110 performs spectral analysis of the intensity distribution and generates the spectrum of the relationship between the reflected wave intensity and the reciprocal of the thickness (mm) of the member. A Fourier transform is used in the spectral analysis. -
FIG. 10 is a graph illustrating the spectrum. - In
FIG. 10 , the horizontal axis is the reciprocal of the thickness (mm) of the member, and the vertical axis is the intensity of the reflected waves corresponding to the components of the horizontal axis. As illustrated inFIG. 5 , the ultrasonic wave undergoes multiple reflections at themetal plate 11, themetal plate 12, or theweld portion 13. Therefore, the intensity of the reflected wave has a periodicity corresponding to the thickness of themetal plate 11, the thickness of themetal plate 12, and the thickness of theweld portion 13. For example, when the thickness of themetal plate 11 and the thickness of themetal plate 12 are the same, an intense peak appears at the reciprocal of the thickness of themetal plates weld portion 13 as illustrated inFIG. 10 . - When the spectrum is generated in step S1, the
processing device 110 extracts peaks having intensities that are not less than a threshold TH2 as illustrated inFIG. 10 . Theprocessing device 110 sets the condition by using a value V1 of the reciprocal of the thickness where each peak appears as a reference. Subsequently, when the spectrum is generated in the first determination, theprocessing device 110 extracts the peaks that have intensities not less than the threshold TH2. Theprocessing device 110 determines whether or not a value V2 of the reciprocal of the thickness where each peak appears satisfies the condition. For example, theprocessing device 110 determines that the condition is satisfied when the value V2 of the reciprocal of the thickness where the peak appears is not less than (1 - y) times and not more than (1 + y) times the value V1. y is preset by the user. Or, y may be set based on the standard deviation of the intervals, etc. - The intervals of the peaks, the positions of the peaks, or the positions of the peaks in the spectrum are unique values of the welding object. The contact of the
detector 130 can be determined with higher accuracy by using these values for the condition of the first determination. - In the
processing system 100, the calculation of the tilt of thedetector 130 or the inspection of theweld portion 13 may be performed when it is determined that thedetector 130 contacts the welding object. Also, theprocessing system 100 may set the range of the detection result used to calculate the tilt. -
FIG. 11 is a flowchart illustrating the flow of the inspection using the processing system according to the embodiment. - Steps S1 to S4 are performed similarly to the flowchart illustrated in
FIG. 4 . When it is determined that thedetector 130 contacts the welding object in step S3, theprocessing device 110 determines whether or not the estimation of the range corresponding to the reflected waves from theweld portion 13 in the detection result is complete (step S5). When the range is not yet estimated, theprocessing device 110 estimates the range (step S6). - For example, as illustrated in
FIG. 5 ,FIG. 6 , andFIG. 8 , the ultrasonic wave is reflected also from surfaces other than theweld portion 13. Theprocessing device 110 estimates the range corresponding to the reflected waves from theweld portion 13 and subsequently calculates the tilt based on the reflected waves included in this range. The necessary calculation amount can be reduced thereby. Also, the accuracy of the calculated tilt can be increased. - The
processing device 110 calculates the tilt of thedetector 130 based on the detection result of the reflected waves within the estimated range (step S7). It is determined whether or not the calculated tilt is within a tolerance range (step S8). The determination may be performed by the user or may be performed by theprocessing device 110. When theprocessing device 110 performs the determination, the tolerance range may be preset by the user or may be set based on the history of previous inspection results. - For example, when performing the inspection of the
weld portion 13, theprocessing device 110 also measures the diameter of theweld portion 13 based on the detection result. The diameter of theweld portion 13 corresponds to the lengths in the X-direction and the Y-direction of the portion in which the reflected waves from the upper surface and the lower surface of theweld portion 13 are detected. For example, if the tilt of thedetector 130 is too large, the diameter of theweld portion 13 that is calculated is less than the actual value. The calculated diameter of theweld portion 13 increases as the tilt of thedetector 130 decreases. When the tilt of thedetector 130 is sufficiently small, the calculated diameter of theweld portion 13 substantially no longer changes. Such relationships between the tilt of thedetector 130 and the diameter of theweld portion 13 calculated previously are stored in thememory device 120. Based on the data stored in thememory device 120, theprocessing device 110 determines a boundary value so that the change of the diameter of theweld portion 13 with respect to the change of the tilt of thedetector 130 becomes small. Theprocessing device 110 sets the size of the tolerance range based on the boundary value. For example, theprocessing device 110 sets the boundary value as the size of the tolerance range. Or, to increase the accuracy of the inspection, theprocessing device 110 may set, as the tolerance range, a value that is less than the value calculated based on the boundary value. - The probing by the
detector 130 may be re-performed when performing steps S6 and S7. Favorably, the detection result that is used in the first determination of step S3 is used when performing steps S6 and S7. Thereby, the number of times of performing the probing can be reduced, and the calculation amount of theprocessing device 110 and thedetector 130 can be reduced. - When the tilt is not within the tolerance range, the user adjusts the tilt of the detector 130 (step S9). When the
processing device 110 performs step S8, the user may be notified that the tilt is not within the tolerance range. After step S9, step S2 is re-performed using the tilt after the adjustment. As a result, it is redetermined whether or not thedetector 130 contacts the welding object after adjusting the tilt as well. Thereby, the recalculation of the tilt can be suppressed by using the detection result when thedetector 130 is not in contact after the adjustment of the tilt. - Or, after adjusting the tilt and performing the probing of step S2, step S3 may be omitted. In step S3 before adjusting the tilt, it has been determined that the
detector 130 contacts the welding object. Accordingly, after adjusting the tilt, likelihood of thedetector 130 being separated from the welding object is low. By omitting step S3, the calculation amount of theprocessing device 110 can be reduced. - The inspection is performed when the tilt is within the tolerance range (step S10). When the user compares the tilt and the tolerance range, the user causes the
processing device 110 to perform the inspection when the tilt is within the tolerance range. When theprocessing device 110 compares the tilt and the tolerance range, theprocessing device 110 automatically performs the inspection when the tilt is within the tolerance range. Theprocessing device 110 outputs the result of the inspection to the display device 150 (step S11). The inspection result includes the information indicating whether or not the weld is joined, the diameter of the weld portion, the minimum diameter of the weld portion, the maximum diameter of the weld portion, etc. - An example of the specific processing of the estimation of the range, the calculation of the tilt, and the inspection will now be described.
- Step S6 will now be described in detail with reference to
FIG. 12A to FIG. 19 . - For example, in
FIG. 6 , the detection result of the reflected waves is illustrated two-dimensionally. The detection result of the reflected waves may be illustrated three-dimensionally. For example, themember 10 is illustrated by multiple voxels. Coordinates in the X-direction, the Y-direction, and the Z-direction are set for each of the voxels. A reflected wave intensity is associated with each of the voxels based on the detection result of the reflected waves. Theprocessing device 110 estimates a range (a group of voxels) corresponding to theweld portion 13 for the multiple voxels. - The number of voxels and the size of each voxel that are set may be determined automatically or may be set by the user via the
user interface 900. -
FIG. 12A and FIG. 12B are graphs illustrating the intensity distribution of the reflected waves in the Z-direction for one cross section. -
FIG. 13 is a graph illustrating the intensity distribution of the reflected waves in the Z-direction. - The
processing device 110 generates the intensity distribution of the reflected waves in the Z-direction based on the detection result of the reflected waves.FIG. 12A and FIG. 12B are such examples. When the intensity distribution already has been generated, the intensity distribution may be used when determining the contact of thedetector 130. InFIG. 12A and FIG. 12B , the horizontal axis is the position in the Z-direction, and the vertical axis is the intensity of the reflected wave.FIG. 12A illustrates the intensity distribution of the reflected waves in the Z-direction in one X-Z cross section.FIG. 12B illustrates the intensity distribution of the reflected waves in the Z-direction in one Y-Z cross section.FIG. 12A and FIG. 12B illustrate the results in which the reflected wave intensities are converted into absolute values. - Or, the
processing device 110 may generate the intensity distribution of the reflected waves in the Z-direction by summing the reflected wave intensities in the X-Y plane for each of multiple points in the Z-direction.FIG. 13 is such an example. InFIG. 13 , the horizontal axis is the position in the Z-direction and the vertical axis is the intensity of the reflected wave.FIG. 13 illustrates the results of converting the reflected wave intensities into absolute values and subtracting the average value of the reflected wave intensities from the reflected wave intensity for each of the multiple points in the Z-direction. - The intensity distribution of the reflected waves in the Z-direction includes components reflected by the
upper surface 13a and thelower surface 13b of theweld portion 13 and components reflected by the upper surface and the lower surface of other portions. Theprocessing device 110 extracts only the components reflected by theupper surface 13a and thelower surface 13b of theweld portion 13 from the intensity distribution of the reflected waves by filtering. For example, values that correspond to integer multiples of half of the thickness in the Z-direction (the distance between theupper surface 13a and thelower surface 13b) of theweld portion 13 are preset. Theprocessing device 110 extracts only the periodic components of the values by referring to the values. - A band-pass filter, a zero-phase filter, a low-pass filter, a high-pass filter, threshold determination of the intensity after the filtering, etc., can be used as the filtering.
-
FIG. 14 is a graph illustrating the results of filtering the intensity distribution of the reflected waves. - In
FIG. 14 , the horizontal axis is the position in the Z-direction, and the vertical axis is the intensity of the reflected waves. In the results of the filtering as illustrated inFIG. 14 , only the components reflected by the upper surface and the lower surface of the weld portion are extracted. - The
processing device 110 estimates the range of the weld portion in the Z-direction based on the extraction results. For example, theprocessing device 110 detects peaks included in the extraction results. Theprocessing device 110 detects the position in the Z-direction of a first peak and the position in the Z-direction of a second peak. For example, theprocessing device 110 uses these positions as a reference to estimate a range Ra1 illustrated inFIG. 14 as the range of the weld portion in the Z-direction. - There are cases where the sign (positive or negative) of the reflected wave intensity from the upper surface of the weld portion and the sign of the reflected wave intensity from the lower surface of the weld portion are reversed due to the structure of the weld portion, the configuration of the
element array 131, etc. In such a case, theprocessing device 110 may detect a peak of one of positive or negative and another peak of the other of positive or negative. Theprocessing device 110 uses the positions of these peaks as references to estimate the range of the weld portion in the Z-direction. Also, according to the processing of the reflected wave intensity, there are cases where the reflected wave intensity has only positive values or negative values. In such a case, the range of the weld portion in the Z-direction may be estimated based on the positions of multiple peaks, may be estimated based on the positions of the peak and the bottom, or may be estimated based on the positions of multiple bottoms. In other words, theprocessing device 110 uses the reflected wave intensity after the filtering to estimate the range of the weld portion in the Z-direction based on the positions of multiple extrema. - When the intensity distribution of the reflected waves is generated for each of the X-Z cross section and the Y-Z cross section, the range in the Z-direction based on the intensity distribution in the X-Z cross section and the range in the Z-direction based on the intensity distribution in the Y-Z cross section are estimated. For example, the
processing device 110 calculates the average, the weighted average, the weighted moving average, or the like of the multiple estimation results and estimates the calculation result to be the range of the entire weld portion in the Z-direction. - Or, the
processing device 110 may estimate the range of the weld portion in the Z-direction based on the intensity distribution of the reflected waves for one of the X-Z cross section or the Y-Z cross section and use the estimation result as the range of the entire weld portion in the Z-direction. Theprocessing device 110 may estimate the range of the weld portion in the Z-direction based on the intensity distribution of the reflected waves for a portion in the X-direction and a portion in the Y-direction and use the estimation result as the range of the entire weld portion in the Z-direction. The calculation amount necessary for the generation of the intensity distribution of the reflected waves can be reduced by such processing. - In the example of
FIG. 14 , the position in the Z-direction of the lower limit of the range Ra1 is set by subtracting a prescribed value from the position in the Z-direction of the first peak. The position in the Z-direction of the upper limit of the range Ra1 is set by adding a prescribed value to the position in the Z-direction of the second peak. Thereby, the second peak can be suppressed from being outside the range in the Z-direction of the weld portion at some point in the X-Y plane if the upper surface and the lower surface of the weld portion are tilted with respect to the arrangement direction of thedetection elements 132. - After estimating the range of the weld portion in the Z-direction, the
processing device 110 estimates the range of the weld portion in the X-direction and the range of the weld portion in the Y-direction. -
FIG. 15 andFIG. 17 are schematic views illustrating the detection result of the reflected waves. - In
FIG. 15 andFIG. 17 , a region R is the entire region where the detection result of the reflected waves is obtained by theelement array 131. One cross section of the region R includes the components of the reflected waves of the upper surface and the lower surface of the weld portion and the components of the reflected waves of the upper surface and the lower surface of the other portions. - The
processing device 110 generates the intensity distribution of the reflected waves in the X-Y plane for each of multiple points in the Z-direction. Theprocessing device 110 may generate the intensity distribution within a preset range in the Z-direction. The calculation amount can be reduced thereby. Or, theprocessing device 110 may generate the intensity distribution within the estimated range in the Z-direction. Thereby, the reflected wave component being outside the lower surface of the weld portion when generating the intensity distribution of the reflected waves in the X-Y plane can be suppressed while reducing the calculation amount. -
FIG. 16A to FIG. 16C are examples of the intensity distribution of the reflected waves in the X-Y plane.FIG. 16A illustrates the intensity distribution of the reflected waves in the X-Y plane at the coordinate of Z = 1.FIG. 16B illustrates the intensity distribution of the reflected waves in the X-Y plane at the coordinate of Z = 2.FIG. 16C illustrates the intensity distribution of the reflected waves in the X-Y plane at the coordinate of Z = 350. The binarized intensity of the reflected wave is illustrated schematically inFIG. 15 ,FIG. 16A to FIG. 16C , andFIG. 17 . - The
processing device 110 calculates the centroid position of the intensity distribution of the reflected waves in the X-Y plane for each of the multiple points in the Z-direction. Here, the centroid position of the intensity distribution is obtained by calculating the centroid position of an image of the intensity distribution. For example, as illustrated inFIG. 16A to FIG. 16C , theprocessing device 110 calculates centroid positions C1 to C350 of the images.FIG. 17 illustrates the results of a line segment L connecting all of the centroid positions from Z = 0 to Z = 350. - The
processing device 110 averages the centroid positions from Z = 0 to Z = 350. The average position of the centroids in the X-direction and the average position of the centroids in the Y-direction are obtained thereby. InFIG. 17 , an average position AP illustrates the average position of the centroids in the X-direction and the average position of the centroids in the Y-direction. Theprocessing device 110 uses prescribed ranges in the X-direction and the Y-direction from the average position AP at the center as a range Ra2 of the weld portion in the X-direction and a range Ra3 of the weld portion in the Y-direction. - For example, a value V that indicates the diameter of the detector 130 (the element array 131) is preset to estimate the range Ra2 and the range Ra3. The
processing device 110 uses the ranges of AP - V/2 to AP + V/2 as the range Ra2 and the range Ra3 respectively in the X-direction and the Y-direction. In such a case, the estimated range in the X-Y plane is quadrilateral. The estimated range is not limited to the example; the estimated range in the X-Y plane may have a polygonal shape having five or more corners, a circular shape, etc. The shape of the estimated range in the X-Y plane is modifiable as appropriate according to the shape of the weld portion. - The range Ra2 and the range Ra3 may be determined using another value based on the value V. Instead of the value indicating the diameter of the
detector 130, a value that indicates the diameter of the weld portion may be preset. This is because the diameter of the weld portion corresponds to the diameter of thedetector 130. The value that indicates the diameter of the weld portion can be considered to be a value that substantially indicates the diameter of thedetector 130. - The range Ra1 in the Z-direction, the range Ra2 in the X-direction, and the range Ra3 in the Y-direction of the weld portion are estimated by the processing described above. After the ranges are estimated, step S7 illustrated in
FIG. 11 is performed based on the detection result of the reflected waves in the estimated ranges. -
FIG. 18 is a flowchart illustrating the flow of the estimation of the range of the processing system according to the embodiment. - The
processing device 110 generates the intensity distribution of the reflected waves in the Z-direction based on the detection result of the reflected waves by the detector 130 (step S601). Theprocessing device 110 filters the intensity distribution based on a value of the thickness of the weld portion (step S602). Thereby, only the reflected wave components of theweld portion 13 are extracted from the intensity distribution. Based on the extraction results, theprocessing device 110 estimates the range of the weld portion in the Z-direction (step S603). Theprocessing device 110 calculates the centroid position of the reflected wave intensity in the X-Y plane for each of multiple points in the Z-direction (step S604). Theprocessing device 110 calculates the average position by averaging the multiple calculated centroid positions (step S605). Based on the average position and the diameter of thedetector 130, theprocessing device 110 estimates the range in each of the X-direction and the Y-direction (step S606). - The estimate of the range in the Z-direction may be performed after estimating the ranges in the X-direction and the Y-direction. For example, steps S601 to S603 may be performed after steps S604 to S606 in the flowchart illustrated in
FIG. 18 . In such a case, theprocessing device 110 may calculate the intensity distribution of the reflected waves in the Z-direction within the estimated ranges in the X-direction and the Y-direction. The calculation amount can be reduced thereby. -
FIG. 19 is an image illustrating a detection result of the reflected waves. - In
FIG. 19 , whiter colors show that the intensity of the reflected wave is greater at that point. Theprocessing device 110 performs the operation illustrated inFIG. 18 for the detection result illustrated inFIG. 19 . As a result, a range Ra is estimated. - One specific example of a method for calculating the tilt in the range Ra will now be described.
-
FIG. 20 is a drawing for describing the processing according to the processing system according to the embodiment. -
FIG. 21 andFIGS. 22A to 22C are examples of images obtained by the processing system according to the embodiment. -
FIG. 21 is three-dimensional volume data depicted based on the detection result of the reflected waves.FIG. 22A illustrates the surface of theweld portion 13 in the volume data illustrated inFIG. 21 .FIG. 22B illustrates the Y-Z cross section at theweld portion 13 vicinity in the volume data illustrated inFIG. 21 .FIG. 22C illustrates the X-Z cross section at theweld portion 13 vicinity in the volume data illustrated inFIG. 21 . InFIG. 22B and FIG. 22C , the upper side is the surface of the weld portion, and the data downward in the depth direction is shown. The portions where the luminance is high are portions where the reflection intensity of the ultrasonic wave is large. The ultrasonic wave is reflected strongly by the bottom surface of theweld portion 13, a surface between the members not joined to each other, etc. - The tilt of the
detector 130 corresponds to the angle between adirection 13d perpendicular to theweld portion 13 and adirection 130a of thedetector 130 illustrated inFIG. 20 . This angle is expressed as an angle θx around the X-direction and an angle θy around the Y-direction. Thedirection 130a of thedetector 130 is perpendicular to the arrangement direction of thedetection elements 132. - The angle θx is calculated based on the detection result in the Y-Z cross section as illustrated in
FIG. 22B . The angle θy is calculated based on the detection result in the X-Z cross section as illustrated inFIG. 22C . Theprocessing device 110 calculates the average of the three-dimensional luminance gradients in the cross sections as the angles θx and θy. Theprocessing device 110 stores the calculated angles θx and θy in thememory device 120 as the tilt of thedetector 130. Theprocessing device 110 may cause thedisplay device 150 to display the calculated tilt. -
FIG. 23A is a schematic view for describing the inspection method according to the processing system according to the embodiment. - As illustrated in
FIG. 23A , a portion of the ultrasonic wave US is reflected by theupper surface 11a of themetal plate 11 or theupper surface 13a of theweld portion 13. Another portion of the ultrasonic wave US enters themember 10 and is reflected by thelower surface 11b of themetal plate 11 or thelower surface 13b of theweld portion 13. - The positions in the Z-direction of the
upper surface 11a, theupper surface 13a, thelower surface 11b, and thelower surface 13b are different from each other. In other words, the distance in the Z-direction between thedetection element 132 and these surfaces are different from each other. The peaks of the intensities of the reflected waves are detected when thedetection element 132 receives the reflected waves from these surfaces. Which surface reflected the ultrasonic wave US can be verified by calculating the time until each peak is detected after transmitting the ultrasonic wave US. -
FIG. 23B and FIG. 23C are graphs illustrating the relationship between the time after transmitting the ultrasonic wave US and the intensity of the reflected wave RW. InFIG. 23B and FIG. 23C , the vertical axis is the elapsed time after transmitting the ultrasonic wave US. The horizontal axis is the intensity of the detected reflected wave RW. Here, the intensity of the reflected wave RW is illustrated as an absolute value. The graph ofFIG. 23B illustrates the detection result of the reflected waves RW from theupper surface 11a and thelower surface 11b of themetal plate 11. The graph ofFIG. 23C illustrates the detection result of the reflected waves RW from theupper surface 13a and thelower surface 13b of theweld portion 13. - In the graph of
FIG. 23B , a peak Pe11 occurring first is based on the reflected wave RW from theupper surface 11a. A peak Pe12 occurring second is based on the reflected wave RW from thelower surface 11b. The times when the peak Pe11 and the peak Pe12 are detected correspond respectively to the positions in the Z-direction of theupper surface 11a and thelower surface 11b of themetal plate 11. A time difference TD1 between the time when the peak Pe11 is detected and the time when the peak Pe12 is detected corresponds to a distance Di1 in the Z-direction between theupper surface 11a and thelower surface 11b. - Similarly, in the graph of
FIG. 23C , a peak Pe13 occurring first is based on the reflected wave RW from theupper surface 13a. A peak Pe14 occurring second is based on the reflected wave RW from thelower surface 13b. The times when the peak Pe13 and the peak Pe14 are detected correspond respectively to the positions in the Z-direction of theupper surface 13a and thelower surface 13b of theweld portion 13. A time difference TD2 between the time when the peak Pe13 is detected and the time when the peak Pe14 is detected corresponds to a distance Di2 in the Z-direction between theupper surface 13a and thelower surface 13b. - The
processing device 110 determines whether or not the time difference between the peaks corresponds to the thickness of theweld portion 13 for each of multiple points in the X-Y plane. When the time difference between the peaks is determined to correspond to the thickness of theweld portion 13, it is determined that the weld is joined at that point. A cluster of points where it is determined that the weld is joined corresponds to theweld portion 13. Therefore, the diameter of theweld portion 13 can be calculated based on the size of the cluster of points. For example, theprocessing device 110 determines the goodness of the weld by comparing the calculated diameter of theweld portion 13 to a preset threshold. - Also, there are cases where the
upper surface 13a and thelower surface 13b of theweld portion 13 are tilted with respect to theupper surface 11a of themetal plate 11. This is due to theweld portion 13 including the solidifiedportion 14, shape deformation in the welding process, etc. In such a case, it is desirable for the ultrasonic wave US to be transmitted along a direction that is perpendicular on average to theupper surface 13a or thelower surface 13b. Thereby, the ultrasonic wave can be reflected more strongly at theupper surface 13a and thelower surface 13b, and the accuracy of the inspection can be increased. - The inspection of the weld portion described above may be performed automatically by a robot.
-
FIG. 24 is a schematic view illustrating a configuration of a processing system according to a modification of the embodiment. -
FIG. 25 is a perspective view illustrating a portion of the processing system according to the modification of the embodiment. - The
processing system 100a illustrated inFIG. 24 includes theprocessing device 110 and arobot 160. Therobot 160 includes thedetector 130, animaging device 161, acoating apparatus 162, anarm 163, and acontrol device 164. - The
imaging device 161 acquires an image by imaging the welded member. Theimaging device 161 extracts a weld mark from the image and detects roughly the position of theweld portion 13. Thecoating apparatus 162 coats a couplant onto the upper surface of theweld portion 13. - The
detector 130, theimaging device 161, and thecoating apparatus 162 are provided at the tip of thearm 163 as illustrated inFIG. 25 . Thearm 163 is, for example, a 6-DOF (Degree of Freedom) vertical articulated robot including multiple links and multiple rotation axes. Thearm 163 includes multiple actuators (for example, motors). The multiple actuators respectively drive the multiple rotation axes. Thedetector 130, theimaging device 161, and thecoating apparatus 162 can be displaced by driving thearm 163. Thecontrol device 164 controls the operations of the components (thedetector 130, theimaging device 161, thecoating apparatus 162, and the arm 163) of therobot 160. -
FIG. 26 is a flowchart illustrating an operation of the processing system according to the modification of the embodiment. - First, before the operation of the
processing system 100a, a condition for determining the contact of thedetector 130 with the welding object is preset. The method for setting the condition is as described above. After setting of the condition, theprocessing device 110 transmits the coordinates of theweld portion 13 stored in thememory device 120 to thecontrol device 164. Thecontrol device 164 moves the tip of the arm toward the received coordinates by driving the arm 163 (step S21). When thedetector 130 is moved to the vicinity of the received coordinates, theimaging device 161 images themember 10, and the detailed position of theweld portion 13 is detected from the acquired image (step S22). Thecontrol device 164 moves thecoating apparatus 162 to the vicinity of the detected position by driving the arm 163 (step S23). Thecoating apparatus 162 coats the couplant onto the weld portion 13 (step S24). Thecontrol device 164 drives thearm 163 and moves thedetector 130 so that the tip of thedetector 130 contacts theweld portion 13 coated with the couplant (step S25). Hereinafter, steps S2 to S11 are performed similarly to steps S2 to S11 of the flowchart illustrated inFIG. 11 . - When it is determined that the
detector 130 does not contact the welding object as a result of the first determination of step S3, theprocessing system 100a may perform an operation other than a notification. For example, theprocessing system 100a may move the tip of thedetector 130 further toward the weld portion imaged in step S22. There is a possibility that erroneous detection of the position of the weld portion may occur due to how the light strikes the weld portion when imaging. There is a possibility that the tip of thedetector 130 may contact the weld portion appropriately by moving the tip of thedetector 130. Or, theprocessing system 100a may re-perform step S22. At this time, theprocessing system 100a may modify the condition of the image processing, the condition of the position detection of the weld portion, etc., from the directly-previous condition. Thereby, the position of the weld portion may be detected more accurately. After the position of the weld portion is detected, for example, step S23 and subsequent steps are re-performed. In addition to these operations, theprocessing system 100a also may perform a notification. - In the
processing system 100a according to the modified example, instead of thearm 163, another movable mechanism having two or more DOF may be provided. The movable mechanism includes an actuator. Theprobe 130 is attached to the movable mechanism. For example, the movable mechanism includes at least one selected from a 6-DOF parallel link mechanism, a 6-DOF horizontal articulated mechanism, and a 2-DOF gonio head. Thecontrol device 164 controls and drives the movable mechanism. By driving the movable mechanism, the tilt of thedetector 130 changes. When the DOF of the movable mechanism is less than 6-DOF, themember 10 is preferably transported by a transport mechanism (not shown) so as to come into contact with thedetector 130. The operation of the transport mechanism may be controlled based on the result of the first determination. -
FIG. 27 is a block diagram illustrating a hardware configuration of the system. - For example, the
processing device 110 of theprocessing system 100 according to the embodiment is a computer and includes ROM (Read Only Memory) 111, RAM (Random Access Memory) 112, a CPU (Central Processing Unit) 113, and a HDD (Hard Disk Drive) 114. - The
ROM 111 stores programs controlling the operations of the computer. TheROM 111 stores programs necessary for causing the computer to realize the processing described above. - The
RAM 112 functions as a memory region where the programs stored in theROM 111 are loaded. TheCPU 113 includes a processing circuit. TheCPU 113 reads a control program stored in theROM 111 and controls the operation of the computer according to the control program. Also, theCPU 113 loads various data obtained by the operation of the computer into theRAM 112. TheHDD 114 stores data necessary for reading and data obtained in the reading process. For example, theHDD 114 functions as thememory device 120 illustrated inFIG. 1 . - Instead of the
HDD 114, theprocessing device 110 may include an eMMC (embedded Multi Media Card), a SSD (Solid State Drive), a SSHD (Solid State Hybrid Drive), etc. - The processing and the functions of the
processing device 110 may be realized by collaboration between more computer. - The
input device 140 includes at least one of a mouse, a keyboard, or a touchpad. Thedisplay device 150 includes at least one of a monitor or a projector. A device such as a touch panel that functions as both theinput device 140 and thedisplay device 150 may be used. - In the example described above, the
weld portion 13 that is spot-welded by theprocessing system processing system processing system detector 130 is possible for members welded by these methods as well. - By using the processing system and the processing method according to the embodiments described above, the contact of the detector with the welding object can be determined with higher accuracy. By performing the contact determination of the detector with the welding object, the accuracy of the calculation of the tilt or the inspection performed subsequently can be increased. Also, similar effects can be obtained by using a program for causing a computer to operate as the processing system.
- The processing of the various data recited above may be recorded in a magnetic disk (a flexible disk, a hard disk, etc.), an optical disk (CD-ROM, CD-R, CD-RW, DVD-ROM, DVD±R, DVD±RW, etc.), semiconductor memory, or another recording medium as a program that can be executed by a computer.
- For example, the data that is recorded in the recording medium can be read by a computer (or an embedded system). The recording format (the storage format) of the recording medium is arbitrary. For example, the computer reads the program from the recording medium and causes a CPU to execute the instructions recited in the program based on the program. In the computer, the acquisition (or the reading) of the program may be performed via a network.
- While certain embodiments have been described, these embodiments have been presented by way of example only, and are not intended to limit the scope of the inventions. Indeed, the novel embodiments described herein may be embodied in a variety of other forms; furthermore, various omissions, substitutions and changes in the form of the embodiments described herein may be made without departing from the spirit of the inventions. The accompanying claims and their equivalents are intended to cover such forms or modifications as would fall within the scope and spirit of the invention. The above embodiments can be practiced in combination with each other.
Claims (19)
- A processing system (100) including a processing device (110),
the processing device performing at least a first determination of determining whether or not a detector (130) contacts a welding object (10), the detector including a plurality of detection elements (131) arranged in a first direction (X), the detector transmitting an ultrasonic wave (US) toward the welding object and detecting a reflected wave (RW), the first determination being based on a detection result when the reflected wave is detected by the detector. - The system (100) according to claim 1, wherein
when determining that the detector (130) contacts the welding object (10), the processing device (110) calculates a tilt (θx) of the detector with respect to the welding object or inspects the welding object based on the detection result. - The system (100) according to claim 1, wherein
when determining that the detector (130) contacts the welding object (10), the processing device (110) calculates a tilt of the detector with respect to the welding object or inspects the welding object based on the detection result used in the first determination. - The system (100) according to any one of claims 1 to 3, wherein
the processing device (110) extracts a portion (P2) from the detection result in which a multiple-reflection wave is detected, and performs the first determination based on the reflected wave (RW) in the extracted portion. - The system (100) according to claim 4, wherein
the processing device (110) performs the first determination by comparing a first determination value to a first threshold (TH1), the first threshold being preset, the first determination value being calculated by summing or averaging intensities of reflected waves (RW) in the extracted portion (P2). - The system (100) according to claim 5, wherein
the processing device (110) extracts a first portion from a first detection result in which a multiple-reflection wave is detected and calculates a first reference value by averaging or summing the intensities of the reflected waves (RW) in the first portion, the first detection result being of the reflected waves when the detector (130) is caused to contact a member (10),
the processing device extracts a second portion from a second detection result in which a multiple-reflection wave is detected and calculates a second reference value by averaging or summing the intensities of the reflected waves in the second portion, the second detection result being of the reflected waves when the detector is separated from the member, and
the processing device sets the first threshold (TH1) to be between the first reference value and the second reference value. - The system (100) according to any one of claims 1 to 3, wherein
the processing device (110) performs the first determination by comparing an interval of a peak, a position of a peak, or a position of a spectrum of a reflected wave (RW) included in the detection result to a condition, the condition being preset. - The system (100) according to any one of claims 1 to 7, wherein
the processing device (110) notifies a user when the detector (130) is determined not to contact the welding object (10). - The system (100) according to any one of claims 1 to 8, further comprising:the detector (130);a movable mechanism (163) including an actuator, the detector being attached to the movable mechanism; anda control device (164) controlling the detector and the arm.
- The system (100) according to any one of claims 1 to 9, further comprising:
a display device (150) displaying a user interface (900) including an image (910,920,930) of the detection result. - The system (100) according to claim 10, wherein
the processing device (110) accepts a designation of a range input by a user for the image in the user interface (900), and
the processing device performs the first determination by comparing a first determination value to a first threshold (TH1), the first threshold being preset, the first determination value being calculated by summing or averaging intensities of reflected waves (RW) in the designated range. - A processing method, comprising:
performing at least a first determination of determining whether or not a detector (130) contacts a welding object (10), the detector including a plurality of detection elements (131) arranged in a first direction (X), the detector transmitting an ultrasonic wave (US) toward the welding object and detecting a reflected wave (RW), the first determination being based on a detection result when the reflected wave is detected by the detector. - The method according to claim 12, wherein
when the detector (130) is determined to be contacting the welding object (10), a calculation of a tilt of the detector with respect to the welding object or an inspection of the welding object is performed based on the detection result. - The method according to claim 12 or 13, wherein
a portion (P2) is extracted from the detection result in which a multiple-reflection wave is detected, and the first determination is performed based on the reflected wave (RW) in the extracted portion. - The method according to claim 12 or 13, wherein
the first determination is performed by comparing an interval of a peak, a position of a peak, or a position of a spectrum of a reflected wave (RW) included in the detection result to a condition, the condition being preset. - A storage medium storing a program,
the program causing a computer to:
perform at least a first determination of determining whether or not a detecto detector (130)r contacts a welding object (10), the detector including a plurality of detection elements (131) arranged in a first direction (X), the detector transmitting an ultrasonic wave (US) toward the welding object and detecting a reflected wave (RW), the first determination being based on a detection result when the reflected wave is detected by the detector. - The storage medium according to claim 16, wherein
when the detector is determined to be contacting the welding object (10), the program causes the computer to calculate a tilt of the detector with respect to the welding object or an inspection of the welding object based on the detection result. - The storage medium according to claim 16 or 17, wherein
the program causes the computer to:extract a portion (P2) from the detection result in which a multiple-reflection wave is detected; andperform the first determination based on the reflected wave (RW) in the extracted portion. - The storage medium according to claim 16 or 17, wherein
the program causes the computer to perform the first determination by comparing an interval of a peak, a position of a peak, or a position of a spectrum of a reflected wave (RW) included in the detection result to a condition, the condition being preset.
Applications Claiming Priority (2)
| Application Number | Priority Date | Filing Date | Title |
|---|---|---|---|
| JP2019173466 | 2019-09-24 | ||
| JP2020136918A JP6982667B2 (en) | 2019-09-24 | 2020-08-14 | Processing systems, processing methods, programs, and storage media |
Publications (1)
| Publication Number | Publication Date |
|---|---|
| EP3798629A1 true EP3798629A1 (en) | 2021-03-31 |
Family
ID=72432839
Family Applications (1)
| Application Number | Title | Priority Date | Filing Date |
|---|---|---|---|
| EP20195259.5A Pending EP3798629A1 (en) | 2019-09-24 | 2020-09-09 | Processing system, processing method, and storage medium |
Country Status (2)
| Country | Link |
|---|---|
| US (1) | US11980975B2 (en) |
| EP (1) | EP3798629A1 (en) |
Families Citing this family (1)
| Publication number | Priority date | Publication date | Assignee | Title |
|---|---|---|---|---|
| JP2023014869A (en) * | 2021-07-19 | 2023-01-31 | 株式会社東芝 | Data processing apparatus, data processing system, data processing method, program, and storage medium |
Citations (6)
| Publication number | Priority date | Publication date | Assignee | Title |
|---|---|---|---|---|
| JPS56164953A (en) * | 1980-05-26 | 1981-12-18 | Toyota Central Res & Dev Lab Inc | Ultrasonic inspecting device for junction part |
| JPH02132368A (en) * | 1988-11-14 | 1990-05-21 | Fuji Electric Co Ltd | Coupling check method for ultrasonic wave probe |
| JPH11153583A (en) * | 1997-11-18 | 1999-06-08 | Kubota Corp | Method for diagnosing welded state and apparatus therefor |
| JP2009145229A (en) * | 2007-12-14 | 2009-07-02 | Toyota Motor Corp | Method and device for testing interface |
| JP2016008845A (en) * | 2014-06-23 | 2016-01-18 | 日立Geニュークリア・エナジー株式会社 | Ultrasonic flaw detection device and ultrasonic flaw detection method |
| US20170276651A1 (en) * | 2014-09-29 | 2017-09-28 | Renishaw Plc | Measurement probe |
Family Cites Families (54)
| Publication number | Priority date | Publication date | Assignee | Title |
|---|---|---|---|---|
| US3678736A (en) | 1970-08-03 | 1972-07-25 | Gen Electric | Machine with improved operating head traversing workpieces with curved surfaces |
| JPS5269683A (en) * | 1975-12-08 | 1977-06-09 | Mitsubishi Electric Corp | Method and device for ultrasonic inspection of resistance welding |
| DE2632674B2 (en) * | 1976-07-16 | 1978-06-08 | Karl Deutsch Pruef- Und Messgeraetebau, 5600 Wuppertal | Electronic device for cyclic acquisition, evaluation and evaluation of impulses in non-destructive ultrasonic material testing |
| JPH05172791A (en) * | 1991-12-24 | 1993-07-09 | Mitsubishi Heavy Ind Ltd | Fatigue crack detection method for corner joint |
| JPH10216955A (en) | 1996-12-06 | 1998-08-18 | Mazda Motor Corp | Method and device for setting electrode angle in spot welding |
| JP3629908B2 (en) * | 1997-07-30 | 2005-03-16 | Jfeスチール株式会社 | Line focus type ultrasonic flaw detection method and apparatus |
| JPH11211701A (en) * | 1998-01-26 | 1999-08-06 | Hitachi Constr Mach Co Ltd | Ultrasonic inspection device |
| JP2000338091A (en) * | 1999-05-27 | 2000-12-08 | Mitsubishi Heavy Ind Ltd | Method and apparatus for ultrasonic inspection |
| JP3606132B2 (en) * | 1999-10-14 | 2005-01-05 | Jfeエンジニアリング株式会社 | Ultrasonic flaw detection method and apparatus |
| JP3456953B2 (en) * | 2000-06-28 | 2003-10-14 | 財団法人理工学振興会 | Ultrasonic flaw detector |
| JP4552309B2 (en) * | 2000-11-02 | 2010-09-29 | 株式会社Ihi | Ultrasonic flaw detection method and apparatus |
| JP2002323481A (en) * | 2001-04-27 | 2002-11-08 | Kawasaki Steel Corp | Ultrasonic flaw detection method and device |
| KR100572236B1 (en) * | 2001-11-14 | 2006-04-19 | 가부시끼가이샤 도시바 | Ultrasonic Examination Devices, Ultrasonic Transducers, and Ultrasound Imaging Devices |
| JP2003262624A (en) * | 2002-03-11 | 2003-09-19 | Hitachi Kenki Fine Tech Co Ltd | Ultrasonic inspection system |
| JP2003322646A (en) | 2002-04-30 | 2003-11-14 | Hitachi Kenki Fine Tech Co Ltd | Ultrasonic image apparatus |
| US7789286B2 (en) * | 2003-06-04 | 2010-09-07 | Chrysler Group Llc | Method and apparatus for assessing the quality of spot welds |
| JP3886014B2 (en) | 2005-02-14 | 2007-02-28 | 株式会社エクセディ | Automatic ultrasonic inspection apparatus, inspection method thereof, and manufacturing method using the inspection method |
| GB0518153D0 (en) | 2005-09-07 | 2005-10-12 | Rolls Royce Plc | Apparatus for measuring wall thicknesses of objects |
| JP4728838B2 (en) | 2006-02-28 | 2011-07-20 | Jfeスチール株式会社 | Ultrasonic spot weld evaluation method and apparatus |
| JP4837425B2 (en) | 2006-04-05 | 2011-12-14 | 川崎重工業株式会社 | Inspection method and apparatus for spot welds |
| EP2015064B1 (en) * | 2006-04-11 | 2017-07-05 | Kawasaki Jukogyo Kabushiki Kaisha | Method and device for inspecting object formed by friction stir joining |
| JP2008051645A (en) | 2006-08-24 | 2008-03-06 | Toshiba Corp | Ultrasonic inspection device |
| JP5155692B2 (en) | 2008-02-26 | 2013-03-06 | 東芝プラントシステム株式会社 | Ultrasonic inspection equipment |
| US8215173B2 (en) | 2008-08-05 | 2012-07-10 | Roger Spencer | UT method of identifying a stuck joint |
| GB0903232D0 (en) * | 2009-02-25 | 2009-04-08 | Saipem Spa | A method for testing pipeline welds |
| JP5618529B2 (en) | 2009-12-04 | 2014-11-05 | 株式会社東芝 | 3D ultrasonic inspection equipment |
| JP2011203126A (en) | 2010-03-25 | 2011-10-13 | Toyota Motor Corp | Method for inspecting spot welded part |
| US9037419B2 (en) * | 2011-05-10 | 2015-05-19 | Edison Welding Institute, Inc. | Portable matrix phased array spot weld inspection system |
| JP5662873B2 (en) | 2011-05-26 | 2015-02-04 | 日立Geニュークリア・エナジー株式会社 | Ultrasonic flaw detection method |
| JP2012251842A (en) | 2011-06-02 | 2012-12-20 | Aisin Seiki Co Ltd | Ultrasonic measuring device and ultrasonic measuring method |
| RU2592044C1 (en) * | 2012-07-17 | 2016-07-20 | ДжФЕ СТИЛ КОРПОРЕЙШН | Method for ultrasonic measurement and ultrasonic measuring device |
| JP6261939B2 (en) * | 2013-10-23 | 2018-01-17 | 三菱重工業株式会社 | Portable ultrasonic flaw detector and ultrasonic flaw detector method |
| JP2017509873A (en) * | 2014-02-19 | 2017-04-06 | エジソン・ウェルディング・インスティチュート,インコーポレーテッド | Portable matrix phased array spot weld inspection system |
| JP6235508B2 (en) * | 2015-03-18 | 2017-11-22 | 株式会社Subaru | Ultrasonic flaw detection system, ultrasonic flaw detection method, and aircraft part manufacturing method |
| EP3281005A4 (en) | 2015-04-07 | 2018-09-12 | Edison Welding Institute, Inc. | Phased array system for inspection of laser welds |
| US10539539B2 (en) * | 2016-05-10 | 2020-01-21 | Invensense, Inc. | Operation of an ultrasonic sensor |
| CN108024795A (en) * | 2016-07-05 | 2018-05-11 | 株式会社日立制作所 | Frequency spectrum resolver, frequency spectrum analytic method and ultrasonic imaging apparatus |
| JP6658603B2 (en) * | 2017-02-21 | 2020-03-04 | トヨタ自動車株式会社 | Weld inspection system |
| JP6896489B2 (en) * | 2017-04-03 | 2021-06-30 | 株式会社東芝 | Ultrasonic flaw detector, ultrasonic flaw detection method and product manufacturing method |
| JP2019082403A (en) | 2017-10-30 | 2019-05-30 | オリンパス株式会社 | Inspection apparatus and inspection method |
| JP6570600B2 (en) | 2017-11-15 | 2019-09-04 | 株式会社東芝 | Inspection system, control device, angle adjustment method, program, and storage medium |
| JP2021081189A (en) | 2018-02-01 | 2021-05-27 | 株式会社神戸製鋼所 | Defect detection method |
| JP6926011B2 (en) * | 2018-02-07 | 2021-08-25 | 株式会社東芝 | Ultrasonic flaw detector and ultrasonic flaw detection method |
| DE102018109574A1 (en) * | 2018-04-20 | 2019-10-24 | Rosen Swiss Ag | Device and method for determining the extent of defects by means of V-transmission |
| JP6629393B1 (en) * | 2018-07-10 | 2020-01-15 | 株式会社東芝 | Control method, inspection system, program, and storage medium |
| JP7120917B2 (en) * | 2018-12-27 | 2022-08-17 | 日立Geニュークリア・エナジー株式会社 | Ultrasonic flaw detection method and apparatus |
| KR102157337B1 (en) * | 2019-01-22 | 2020-09-18 | 나우 주식회사 | Apparatus for auto examination using ultrasonics wave and image |
| JP7217798B2 (en) * | 2019-03-08 | 2023-02-03 | 富士フイルム株式会社 | ULTRASOUND DIAGNOSTIC SYSTEM AND CONTROL METHOD OF ULTRASOUND DIAGNOSTIC SYSTEM |
| JP6805289B2 (en) * | 2019-05-14 | 2020-12-23 | 株式会社東芝 | Estimator, inspection system, estimation method, angle adjustment method, inspection method, program, and storage medium |
| US11911213B2 (en) * | 2019-06-03 | 2024-02-27 | General Electric Company | Techniques for determining ultrasound probe motion |
| CN110231410B (en) * | 2019-06-12 | 2022-01-28 | 武汉市工程科学技术研究院 | Intelligent interpretation method for nondestructive testing data of anchor rod |
| CN110514744B (en) * | 2019-08-20 | 2020-05-05 | 珠海市一微半导体有限公司 | Correction method and detection method for judgment threshold of ground medium |
| US11561204B2 (en) * | 2019-08-28 | 2023-01-24 | Kabushiki Kaisha Toshiba | Display control system, inspection control system, display control method, and storage medium |
| CN113176338B (en) * | 2021-04-28 | 2023-01-24 | 国能锅炉压力容器检验有限公司 | Method for detecting bonding quality of bearing bush alloy material by ultrasonic guided wave |
-
2020
- 2020-09-09 EP EP20195259.5A patent/EP3798629A1/en active Pending
- 2020-09-10 US US17/017,308 patent/US11980975B2/en active Active
Patent Citations (6)
| Publication number | Priority date | Publication date | Assignee | Title |
|---|---|---|---|---|
| JPS56164953A (en) * | 1980-05-26 | 1981-12-18 | Toyota Central Res & Dev Lab Inc | Ultrasonic inspecting device for junction part |
| JPH02132368A (en) * | 1988-11-14 | 1990-05-21 | Fuji Electric Co Ltd | Coupling check method for ultrasonic wave probe |
| JPH11153583A (en) * | 1997-11-18 | 1999-06-08 | Kubota Corp | Method for diagnosing welded state and apparatus therefor |
| JP2009145229A (en) * | 2007-12-14 | 2009-07-02 | Toyota Motor Corp | Method and device for testing interface |
| JP2016008845A (en) * | 2014-06-23 | 2016-01-18 | 日立Geニュークリア・エナジー株式会社 | Ultrasonic flaw detection device and ultrasonic flaw detection method |
| US20170276651A1 (en) * | 2014-09-29 | 2017-09-28 | Renishaw Plc | Measurement probe |
Also Published As
| Publication number | Publication date |
|---|---|
| US20210086282A1 (en) | 2021-03-25 |
| US11980975B2 (en) | 2024-05-14 |
Similar Documents
| Publication | Publication Date | Title |
|---|---|---|
| US11480549B2 (en) | Estimation device, inspection system, estimation method, and storage medium | |
| US20220314354A1 (en) | Processing system, processing method, and storage medium | |
| EP3798629A1 (en) | Processing system, processing method, and storage medium | |
| JP2018522240A (en) | Method for measuring artifacts | |
| EP3786633A1 (en) | Display control system, inspection control system, display control method, and storage medium | |
| JP6982667B2 (en) | Processing systems, processing methods, programs, and storage media | |
| WO2018034236A1 (en) | Gas detection system and gas detection method | |
| US20220244220A1 (en) | Processing system, processing method, and storage medium | |
| JP5507050B2 (en) | 3D sensor | |
| US20230104515A1 (en) | Processing device, processing system, processing method, and storage medium | |
| JP6982666B2 (en) | Display control system, inspection management system, display control method, program, and storage medium | |
| US20230020518A1 (en) | Processing system, robot system, control device, teaching method, and storage medium | |
| US20230366856A1 (en) | Detection device, detection system, propagation member, fixture, and storage medium | |
| US20240149380A1 (en) | Processing device, detecting system, processing method, inspection method, and storage medium | |
| WO2023182503A1 (en) | Processing system, processing device, processing method, program, and storage medium | |
| Ren et al. | Research on 2D laser distance sensor | |
| JP2005249495A (en) | Surface inspection method and device for flat plate body |
Legal Events
| Date | Code | Title | Description |
|---|---|---|---|
| PUAI | Public reference made under article 153(3) epc to a published international application that has entered the european phase |
Free format text: ORIGINAL CODE: 0009012 |
|
| STAA | Information on the status of an ep patent application or granted ep patent |
Free format text: STATUS: REQUEST FOR EXAMINATION WAS MADE |
|
| 17P | Request for examination filed |
Effective date: 20200909 |
|
| AK | Designated contracting states |
Kind code of ref document: A1 Designated state(s): AL AT BE BG CH CY CZ DE DK EE ES FI FR GB GR HR HU IE IS IT LI LT LU LV MC MK MT NL NO PL PT RO RS SE SI SK SM TR |
|
| AX | Request for extension of the european patent |
Extension state: BA ME |
|
| STAA | Information on the status of an ep patent application or granted ep patent |
Free format text: STATUS: EXAMINATION IS IN PROGRESS |
|
| 17Q | First examination report despatched |
Effective date: 20230630 |
|
| GRAP | Despatch of communication of intention to grant a patent |
Free format text: ORIGINAL CODE: EPIDOSNIGR1 |
|
| STAA | Information on the status of an ep patent application or granted ep patent |
Free format text: STATUS: GRANT OF PATENT IS INTENDED |
|
| RIC1 | Information provided on ipc code assigned before grant |
Ipc: B23K 31/12 20060101ALI20240422BHEP Ipc: B23K 11/25 20060101ALI20240422BHEP Ipc: G01N 29/11 20060101AFI20240422BHEP |