EP2963418B1 - Urine sample analysis device and urine sample analysis method - Google Patents
Urine sample analysis device and urine sample analysis method Download PDFInfo
- Publication number
- EP2963418B1 EP2963418B1 EP14756669.9A EP14756669A EP2963418B1 EP 2963418 B1 EP2963418 B1 EP 2963418B1 EP 14756669 A EP14756669 A EP 14756669A EP 2963418 B1 EP2963418 B1 EP 2963418B1
- Authority
- EP
- European Patent Office
- Prior art keywords
- fluorescence
- measurement sample
- blood cells
- aliquot
- scattered light
- Prior art date
- Legal status (The legal status is an assumption and is not a legal conclusion. Google has not performed a legal analysis and makes no representation as to the accuracy of the status listed.)
- Active
Links
- 210000002700 urine Anatomy 0.000 title claims description 69
- 238000004458 analytical method Methods 0.000 title claims description 55
- 238000012284 sample analysis method Methods 0.000 title 1
- 238000005259 measurement Methods 0.000 claims description 196
- 239000002245 particle Substances 0.000 claims description 79
- 210000004027 cell Anatomy 0.000 claims description 62
- 210000003743 erythrocyte Anatomy 0.000 claims description 51
- 210000000265 leukocyte Anatomy 0.000 claims description 50
- 230000010365 information processing Effects 0.000 claims description 44
- 102000039446 nucleic acids Human genes 0.000 claims description 42
- 108020004707 nucleic acids Proteins 0.000 claims description 42
- 150000007523 nucleic acids Chemical class 0.000 claims description 42
- 230000035945 sensitivity Effects 0.000 claims description 41
- 241000894006 Bacteria Species 0.000 claims description 34
- 210000002919 epithelial cell Anatomy 0.000 claims description 31
- 241000233866 Fungi Species 0.000 claims description 24
- 238000010186 staining Methods 0.000 claims description 11
- 230000002949 hemolytic effect Effects 0.000 claims description 8
- 238000002156 mixing Methods 0.000 claims description 5
- 238000012545 processing Methods 0.000 description 79
- 238000001514 detection method Methods 0.000 description 55
- 230000003287 optical effect Effects 0.000 description 43
- 238000010586 diagram Methods 0.000 description 41
- 238000006243 chemical reaction Methods 0.000 description 30
- 239000000975 dye Substances 0.000 description 21
- 238000000034 method Methods 0.000 description 20
- 206010034960 Photophobia Diseases 0.000 description 19
- 208000013469 light sensitivity Diseases 0.000 description 19
- 239000000243 solution Substances 0.000 description 19
- 241000224527 Trichomonas vaginalis Species 0.000 description 17
- 230000003321 amplification Effects 0.000 description 16
- 239000013078 crystal Substances 0.000 description 16
- 238000007865 diluting Methods 0.000 description 16
- 210000003097 mucus Anatomy 0.000 description 16
- 238000003199 nucleic acid amplification method Methods 0.000 description 16
- 239000012192 staining solution Substances 0.000 description 15
- 238000009826 distribution Methods 0.000 description 13
- 101100446726 Caenorhabditis elegans flh-2 gene Proteins 0.000 description 11
- 239000007788 liquid Substances 0.000 description 10
- 238000004590 computer program Methods 0.000 description 8
- 101100446725 Caenorhabditis elegans flh-1 gene Proteins 0.000 description 7
- 238000007405 data analysis Methods 0.000 description 7
- DZBUGLKDJFMEHC-UHFFFAOYSA-N acridine Chemical compound C1=CC=CC2=CC3=CC=CC=C3N=C21 DZBUGLKDJFMEHC-UHFFFAOYSA-N 0.000 description 6
- 239000000138 intercalating agent Substances 0.000 description 6
- 210000000170 cell membrane Anatomy 0.000 description 5
- 239000000203 mixture Substances 0.000 description 5
- 238000002360 preparation method Methods 0.000 description 5
- 238000011895 specific detection Methods 0.000 description 5
- 238000012360 testing method Methods 0.000 description 5
- 101000829171 Hypocrea virens (strain Gv29-8 / FGSC 10586) Effector TSP1 Proteins 0.000 description 4
- 238000001914 filtration Methods 0.000 description 4
- 239000007850 fluorescent dye Substances 0.000 description 4
- XMBWDFGMSWQBCA-UHFFFAOYSA-N hydrogen iodide Chemical compound I XMBWDFGMSWQBCA-UHFFFAOYSA-N 0.000 description 4
- 239000012528 membrane Substances 0.000 description 4
- 230000003204 osmotic effect Effects 0.000 description 4
- 108090000623 proteins and genes Chemical group 0.000 description 4
- 102000004169 proteins and genes Human genes 0.000 description 4
- -1 red blood cells Chemical class 0.000 description 4
- ANRHNWWPFJCPAZ-UHFFFAOYSA-M thionine Chemical compound [Cl-].C1=CC(N)=CC2=[S+]C3=CC(N)=CC=C3N=C21 ANRHNWWPFJCPAZ-UHFFFAOYSA-M 0.000 description 4
- 239000003153 chemical reaction reagent Substances 0.000 description 3
- 238000004891 communication Methods 0.000 description 3
- 150000002632 lipids Chemical group 0.000 description 3
- 239000004065 semiconductor Substances 0.000 description 3
- LWWWYHFXRJVZBL-UHFFFAOYSA-M 3-propyl-2-[3-(3-propyl-1,3-benzoxazol-3-ium-2-yl)prop-2-enylidene]-1,3-benzoxazole;iodide Chemical compound [I-].O1C2=CC=CC=C2[N+](CCC)=C1/C=C/C=C1/N(CCC)C2=CC=CC=C2O1 LWWWYHFXRJVZBL-UHFFFAOYSA-M 0.000 description 2
- FIZZUEJIOKEFFZ-UHFFFAOYSA-M C3-oxacyanine Chemical compound [I-].O1C2=CC=CC=C2[N+](CC)=C1C=CC=C1N(CC)C2=CC=CC=C2O1 FIZZUEJIOKEFFZ-UHFFFAOYSA-M 0.000 description 2
- 239000003093 cationic surfactant Substances 0.000 description 2
- JVXZRNYCRFIEGV-UHFFFAOYSA-M dilC18(3) dye Chemical compound [O-]Cl(=O)(=O)=O.CC1(C)C2=CC=CC=C2N(CCCCCCCCCCCCCCCCCC)C1=CC=CC1=[N+](CCCCCCCCCCCCCCCCCC)C2=CC=CC=C2C1(C)C JVXZRNYCRFIEGV-UHFFFAOYSA-M 0.000 description 2
- 230000000694 effects Effects 0.000 description 2
- 238000000605 extraction Methods 0.000 description 2
- 239000012535 impurity Substances 0.000 description 2
- 239000012128 staining reagent Substances 0.000 description 2
- ACOJCCLIDPZYJC-UHFFFAOYSA-M thiazole orange Chemical compound CC1=CC=C(S([O-])(=O)=O)C=C1.C1=CC=C2C(C=C3N(C4=CC=CC=C4S3)C)=CC=[N+](C)C2=C1 ACOJCCLIDPZYJC-UHFFFAOYSA-M 0.000 description 2
- 210000000626 ureter Anatomy 0.000 description 2
- PRDFBSVERLRRMY-UHFFFAOYSA-N 2'-(4-ethoxyphenyl)-5-(4-methylpiperazin-1-yl)-2,5'-bibenzimidazole Chemical compound C1=CC(OCC)=CC=C1C1=NC2=CC=C(C=3NC4=CC(=CC=C4N=3)N3CCN(C)CC3)C=C2N1 PRDFBSVERLRRMY-UHFFFAOYSA-N 0.000 description 1
- ZLQJJALHJYCWSH-UHFFFAOYSA-N 3,3'-dipentyloxacarbocyanine Chemical compound O1C2=CC=CC=C2[N+](CCCCC)=C1C=CC=C1N(CCCCC)C2=CC=CC=C2O1 ZLQJJALHJYCWSH-UHFFFAOYSA-N 0.000 description 1
- FWBHETKCLVMNFS-UHFFFAOYSA-N 4',6-Diamino-2-phenylindol Chemical compound C1=CC(C(=N)N)=CC=C1C1=CC2=CC=C(C(N)=N)C=C2N1 FWBHETKCLVMNFS-UHFFFAOYSA-N 0.000 description 1
- 101100173934 Pinus radiata FLL gene Proteins 0.000 description 1
- CGNLCCVKSWNSDG-UHFFFAOYSA-N SYBR Green I Chemical compound CN(C)CCCN(CCC)C1=CC(C=C2N(C3=CC=CC=C3S2)C)=C2C=CC=CC2=[N+]1C1=CC=CC=C1 CGNLCCVKSWNSDG-UHFFFAOYSA-N 0.000 description 1
- 230000002159 abnormal effect Effects 0.000 description 1
- DPKHZNPWBDQZCN-UHFFFAOYSA-N acridine orange free base Chemical compound C1=CC(N(C)C)=CC2=NC3=CC(N(C)C)=CC=C3C=C21 DPKHZNPWBDQZCN-UHFFFAOYSA-N 0.000 description 1
- 210000004369 blood Anatomy 0.000 description 1
- 239000008280 blood Substances 0.000 description 1
- 239000000298 carbocyanine Substances 0.000 description 1
- 239000003795 chemical substances by application Substances 0.000 description 1
- ZMMJGEGLRURXTF-UHFFFAOYSA-N ethidium bromide Chemical compound [Br-].C12=CC(N)=CC=C2C2=CC=C(N)C=C2[N+](CC)=C1C1=CC=CC=C1 ZMMJGEGLRURXTF-UHFFFAOYSA-N 0.000 description 1
- 229960005542 ethidium bromide Drugs 0.000 description 1
- 239000012634 fragment Substances 0.000 description 1
- 210000003734 kidney Anatomy 0.000 description 1
- 239000004973 liquid crystal related substance Substances 0.000 description 1
- XTYKPEMLMDLYKC-UHFFFAOYSA-N n,n,2-trimethyl-6-propan-2-ylaniline Chemical compound CC(C)C1=CC=CC(C)=C1N(C)C XTYKPEMLMDLYKC-UHFFFAOYSA-N 0.000 description 1
- 239000002736 nonionic surfactant Substances 0.000 description 1
- 230000035515 penetration Effects 0.000 description 1
- INAAIJLSXJJHOZ-UHFFFAOYSA-N pibenzimol Chemical compound C1CN(C)CCN1C1=CC=C(N=C(N2)C=3C=C4NC(=NC4=CC=3)C=3C=CC(O)=CC=3)C2=C1 INAAIJLSXJJHOZ-UHFFFAOYSA-N 0.000 description 1
- XJMOSONTPMZWPB-UHFFFAOYSA-M propidium iodide Chemical compound [I-].[I-].C12=CC(N)=CC=C2C2=CC=C(N)C=C2[N+](CCC[N+](C)(CC)CC)=C1C1=CC=CC=C1 XJMOSONTPMZWPB-UHFFFAOYSA-M 0.000 description 1
- 238000005070 sampling Methods 0.000 description 1
- 238000012216 screening Methods 0.000 description 1
- 125000005504 styryl group Chemical group 0.000 description 1
- 239000000758 substrate Substances 0.000 description 1
- 239000004094 surface-active agent Substances 0.000 description 1
- 210000001635 urinary tract Anatomy 0.000 description 1
Images


Classifications
-
- G—PHYSICS
- G01—MEASURING; TESTING
- G01N—INVESTIGATING OR ANALYSING MATERIALS BY DETERMINING THEIR CHEMICAL OR PHYSICAL PROPERTIES
- G01N21/00—Investigating or analysing materials by the use of optical means, i.e. using sub-millimetre waves, infrared, visible or ultraviolet light
- G01N21/62—Systems in which the material investigated is excited whereby it emits light or causes a change in wavelength of the incident light
- G01N21/63—Systems in which the material investigated is excited whereby it emits light or causes a change in wavelength of the incident light optically excited
- G01N21/64—Fluorescence; Phosphorescence
- G01N21/6486—Measuring fluorescence of biological material, e.g. DNA, RNA, cells
-
- G—PHYSICS
- G01—MEASURING; TESTING
- G01N—INVESTIGATING OR ANALYSING MATERIALS BY DETERMINING THEIR CHEMICAL OR PHYSICAL PROPERTIES
- G01N1/00—Sampling; Preparing specimens for investigation
- G01N1/28—Preparing specimens for investigation including physical details of (bio-)chemical methods covered elsewhere, e.g. G01N33/50, C12Q
- G01N1/30—Staining; Impregnating ; Fixation; Dehydration; Multistep processes for preparing samples of tissue, cell or nucleic acid material and the like for analysis
- G01N1/31—Apparatus therefor
-
- G—PHYSICS
- G01—MEASURING; TESTING
- G01N—INVESTIGATING OR ANALYSING MATERIALS BY DETERMINING THEIR CHEMICAL OR PHYSICAL PROPERTIES
- G01N15/00—Investigating characteristics of particles; Investigating permeability, pore-volume, or surface-area of porous materials
- G01N15/10—Investigating individual particles
- G01N15/14—Electro-optical investigation, e.g. flow cytometers
- G01N15/1456—Electro-optical investigation, e.g. flow cytometers without spatial resolution of the texture or inner structure of the particle, e.g. processing of pulse signals
- G01N15/1459—Electro-optical investigation, e.g. flow cytometers without spatial resolution of the texture or inner structure of the particle, e.g. processing of pulse signals the analysis being performed on a sample stream
-
- G—PHYSICS
- G01—MEASURING; TESTING
- G01N—INVESTIGATING OR ANALYSING MATERIALS BY DETERMINING THEIR CHEMICAL OR PHYSICAL PROPERTIES
- G01N21/00—Investigating or analysing materials by the use of optical means, i.e. using sub-millimetre waves, infrared, visible or ultraviolet light
- G01N21/01—Arrangements or apparatus for facilitating the optical investigation
- G01N21/03—Cuvette constructions
- G01N21/05—Flow-through cuvettes
-
- G—PHYSICS
- G01—MEASURING; TESTING
- G01N—INVESTIGATING OR ANALYSING MATERIALS BY DETERMINING THEIR CHEMICAL OR PHYSICAL PROPERTIES
- G01N33/00—Investigating or analysing materials by specific methods not covered by groups G01N1/00 - G01N31/00
- G01N33/48—Biological material, e.g. blood, urine; Haemocytometers
- G01N33/483—Physical analysis of biological material
- G01N33/487—Physical analysis of biological material of liquid biological material
- G01N33/493—Physical analysis of biological material of liquid biological material urine
-
- G—PHYSICS
- G01—MEASURING; TESTING
- G01N—INVESTIGATING OR ANALYSING MATERIALS BY DETERMINING THEIR CHEMICAL OR PHYSICAL PROPERTIES
- G01N33/00—Investigating or analysing materials by specific methods not covered by groups G01N1/00 - G01N31/00
- G01N33/48—Biological material, e.g. blood, urine; Haemocytometers
- G01N33/50—Chemical analysis of biological material, e.g. blood, urine; Testing involving biospecific ligand binding methods; Immunological testing
- G01N33/5005—Chemical analysis of biological material, e.g. blood, urine; Testing involving biospecific ligand binding methods; Immunological testing involving human or animal cells
- G01N33/5094—Chemical analysis of biological material, e.g. blood, urine; Testing involving biospecific ligand binding methods; Immunological testing involving human or animal cells for blood cell populations
-
- G01N2015/011—
-
- G01N2015/016—
-
- G—PHYSICS
- G01—MEASURING; TESTING
- G01N—INVESTIGATING OR ANALYSING MATERIALS BY DETERMINING THEIR CHEMICAL OR PHYSICAL PROPERTIES
- G01N15/00—Investigating characteristics of particles; Investigating permeability, pore-volume, or surface-area of porous materials
- G01N15/10—Investigating individual particles
- G01N2015/1006—Investigating individual particles for cytology
-
- G—PHYSICS
- G01—MEASURING; TESTING
- G01N—INVESTIGATING OR ANALYSING MATERIALS BY DETERMINING THEIR CHEMICAL OR PHYSICAL PROPERTIES
- G01N21/00—Investigating or analysing materials by the use of optical means, i.e. using sub-millimetre waves, infrared, visible or ultraviolet light
- G01N21/17—Systems in which incident light is modified in accordance with the properties of the material investigated
- G01N21/47—Scattering, i.e. diffuse reflection
- G01N21/49—Scattering, i.e. diffuse reflection within a body or fluid
- G01N21/53—Scattering, i.e. diffuse reflection within a body or fluid within a flowing fluid, e.g. smoke
-
- G—PHYSICS
- G01—MEASURING; TESTING
- G01N—INVESTIGATING OR ANALYSING MATERIALS BY DETERMINING THEIR CHEMICAL OR PHYSICAL PROPERTIES
- G01N21/00—Investigating or analysing materials by the use of optical means, i.e. using sub-millimetre waves, infrared, visible or ultraviolet light
- G01N21/62—Systems in which the material investigated is excited whereby it emits light or causes a change in wavelength of the incident light
- G01N21/63—Systems in which the material investigated is excited whereby it emits light or causes a change in wavelength of the incident light optically excited
- G01N21/64—Fluorescence; Phosphorescence
- G01N21/645—Specially adapted constructive features of fluorimeters
-
- G—PHYSICS
- G01—MEASURING; TESTING
- G01N—INVESTIGATING OR ANALYSING MATERIALS BY DETERMINING THEIR CHEMICAL OR PHYSICAL PROPERTIES
- G01N2201/00—Features of devices classified in G01N21/00
- G01N2201/06—Illumination; Optics
- G01N2201/061—Sources
- G01N2201/06113—Coherent sources; lasers
- G01N2201/0612—Laser diodes
Definitions
- the present invention relates to a urine specimen analysis device and a urine specimen analysis method for analyzing a urine specimen by measuring a measurement sample obtained by mixing the urine specimen and a reagent.
- specimen analysis that analyzes components contained in specimens, such as blood or urine, collected from living bodies is widely performed in the field of clinical tests, and, recently, specimen analysis devices that automatically perform specimen analysis are used.
- Patent Document 1 discloses an in-urine physical component analysis device for measuring physical components contained in urine.
- a sucked urine specimen is divided into two aliquots, wherein a diluting solution and a first staining reagent that stains membranes are mixed with one of the aliquots to prepare a measurement sample for measuring relatively large in-urine physical components, such as red blood cells, white blood cells, epithelial cells, and casts, and this measurement sample is subjected to optical measurement, so that red blood cells, white blood cells, epithelial cells, casts, and the like are analyzed, whereas a diluting solution and a second staining reagent that stains nucleic acids are mixed with the other aliquot to prepare a measurement sample for measuring bacteria that are smaller than other in-urine physical components, and this measurement sample is subjected to optical measurement, so that bacteria are analyzed.
- Patent Document 1 JP 2007-309728A
- the present invention was arrived at in view of the above-described problems, and it is an object thereof to provide a urine specimen analysis device and a urine specimen analysis method capable of precisely analyzing in-urine physical components.
- a first aspect of the present invention is directed to a urine specimen analysis device according to claim 1.
- Cells in urine may be damaged when passing through a glomerulus or may be deformed due to a change in the osmotic pressure when passing through a ureter. Thus, it is difficult to precisely analyze the cells in urine based on the cell forms.
- at least red blood cells are detected from the first measurement sample prepared using the first staining dye that stains red blood cells
- at least white blood cells are detected from the second measurement sample prepared using the second staining dye that stains nucleic acids
- particles and cells in urine can be precisely detected using the nucleic acid amount, the membrane stainability, and the like unique to each cell, without the influence of changes in the cell forms.
- the sample preparing portion is configured to prepare the first measurement sample without hemolyzing red blood cells contained in the first aliquot, and prepare the second measurement sample while hemolyzing red blood cells contained in the second aliquot. Accordingly, in the first measurement sample, particles in urine are stained in a state where red blood cells are not hemolyzed, and, thus, at least red blood cells in urine can be precisely detected based on the fluorescence. Furthermore, in the second measurement sample, red blood cells are hemolyzed, and, thus, detection errors due to the presence of red blood cells are prevented, and at least white blood cells can be more precisely detected.
- the information processing portion is configured to distinguishably detect red blood cells and other in-urine particles not containing nucleic acids contained in the first aliquot, based on the fluorescence of the first measurement sample.
- the stain level with a staining dye for staining red blood cells, between a red blood cell and any other particle containing no nucleic acid, contained in urine. Accordingly, with this configuration, these particles can be precisely detected.
- the information processing portion is configured to distinguishably detect white blood cells and other in-urine particles containing nucleic acids contained in the second aliquot, based on the fluorescence of the second measurement sample.
- the nucleic acid amount there is a difference in the nucleic acid amount between a white blood cell and any other particle containing a nucleic acid, contained in urine. Accordingly, with this configuration, white blood cells and other in-urine particles containing nucleic acids can be distinguishably detected with a high degree of accuracy using the fluorescence of the second measurement sample.
- even cells that are easily deformed or damaged, such as epithelial cells can be precisely detected based on the fluorescence of the second measurement sample.
- the measurement portion includes: a flow cell for allowing a measurement sample to flow therethrough; a light source for emitting light on the measurement sample that flows through the flow cell; a fluorescence receiving portion for receiving fluorescence emitted from a particle in the measurement sample, and outputting a fluorescence signal; and a scattered light receiving portion for receiving scattered light emitted from a particle in the measurement sample, and outputting a scattered light signal.
- the measurement portion can amplify a signal of fluorescence received by the fluorescence receiving portion at a plurality of sensitivities
- the information processing portion is configured to detect white blood cells contained in the second aliquot, based on a fluorescence signal amplified at a low sensitivity, and detect in-urine particles smaller than white blood cells contained in the second aliquot, based on a fluorescence signal amplified at a high sensitivity.
- Particles in urine have various sizes and different nucleic acid amounts according to their types. With this configuration, these particles in urine can be precisely classified using a fluorescence signal of a sensitivity according to the corresponding nucleic acid amount.
- the measurement portion can amplify a signal of fluorescence received by the fluorescence receiving portion at least at a first sensitivity, a second sensitivity higher than the first sensitivity, and a third sensitivity higher than the first and second sensitivities
- the information processing portion is configured to detect white blood cells in the second measurement sample based on a first fluorescence signal amplified at the first sensitivity, detect sperm or fungi in the second measurement sample based on a second fluorescence signal amplified at the second sensitivity, and detect bacteria in the second measurement sample based on a third fluorescence signal amplified at the third sensitivity.
- the measurement portion is configured to obtain the first and second fluorescence signals from the second measurement sample during a first period in which the measurement sample flows through the flow cell, and obtain the third fluorescence signal from the measurement sample during a second period that is before or after the first period.
- the information processing portion is configured to classify at least white blood cells and epithelial cells contained in the second aliquot based on the first fluorescence signal, and classify sperm and fungi contained in the second aliquot based on the second fluorescence signal.
- the information processing portion is configured to classify in-urine particles contained in the first aliquot into red blood cells and other in-urine particles not containing nucleic acids, based on the fluorescence signal of the first measurement sample obtained via the fluorescence receiving portion and the scattered light signal of the first measurement sample obtained via the scattered light receiving portion.
- the information processing portion is configured to distinguishably detect red blood cells and casts contained in the first aliquot, based on the fluorescence signal of the first measurement sample and the scattered light signal of the first measurement sample.
- the information processing portion is configured to distinguishably detect white blood cells and epithelial cells contained in the first aliquot, based on the fluorescence signal of the second measurement sample and the scattered light signal of the second measurement sample.
- the information processing portion can obtain at least a fluorescence intensity from the fluorescence signal, can obtain at least a scattered light intensity from the scattered light signal, and classifies, among particles in the first measurement sample, particles belonging to a first range determined by the fluorescence intensity and the scattered light intensity as red blood cells.
- the information processing portion can obtain at least a fluorescence pulse area and a fluorescence pulse width from the fluorescence signal, and classifies, among particles in the first measurement sample, particles belonging to a second range determined by the fluorescence pulse area and the fluorescence pulse width as casts.
- the information processing portion can obtain at least a fluorescence pulse area from the first fluorescence signal, can obtain at least a scattered light pulse width from the scattered light signal, and classifies, among particles in the second measurement sample, particles belonging to a third range determined by the fluorescence pulse area of the first fluorescence signal and the scattered light pulse width as white blood cells.
- the information processing portion classifies, among particles in the second measurement sample, particles belonging to a fourth range determined by the fluorescence pulse area of the first fluorescence signal and the scattered light pulse width as epithelial cells.
- the information processing portion can obtain at least a fluorescence intensity from the second fluorescence signal, can obtain at least a scattered light intensity from the scattered light signal, and classifies, among particles in the second measurement sample, particles belonging to a fifth range determined by the fluorescence intensity of the second fluorescence signal and the scattered light pulse width as sperm.
- the information processing portion classifies, among particles in the second measurement sample, particles belonging to a sixth range determined by the fluorescence intensity of the second fluorescence signal and the scattered light pulse width as fungi.
- the information processing portion can obtain at least a fluorescence intensity from the third fluorescence signal, can obtain at least a scattered light intensity from the scattered light signal output from the scattered light receiving portion, and classifies, among particles in the second measurement sample, particles belonging to a seventh range determined by the fluorescence intensity of the third fluorescence signal and the scattered light intensity as bacteria.
- a second aspect of the present invention is directed to a urine specimen analysis method according to claim 13.
- the urine specimen analysis device for analyzing in-urine physical components.
- the urine specimen analysis device allows a urine specimen to be loaded into the device, and analyzes in-urine physical components (red blood cells, white blood cells, epithelial cells, casts, bacteria, etc.).
- FIG. 1 is an external perspective view showing the configuration of the urine specimen analysis device according to this embodiment.
- a urine specimen analysis device 100 includes a measurement unit 10 and an information processing portion 13.
- the measurement unit 10 includes a sample preparing portion 2 for preparing a measurement sample, a rack table 4 for transferring a sample rack (test tube rack) 3, an optical detection portion 5 for detecting information on physical components from the measurement sample, and a circuit portion 14.
- a supporting stage 16 is arranged via an arm 15, and the information processing portion 13 is disposed on the supporting stage 16.
- the information processing portion 13 is data communicably connected to the circuit portion 14 of the measurement unit 10.
- FIG. 2 is a diagram showing a schematic functional configuration of the sample preparing portion 2 and the optical detection portion 5.
- a urine specimen placed in a test tube T is sucked by an unshown syringe pump through a suction tube 17.
- the sucked urine specimen is dispensed by a specimen drawing portion 1 into the sample preparing portion 2.
- the sample preparing portion 2 in this embodiment includes a reaction tank 2u and a reaction tank 2b.
- the specimen drawing portion 1 takes out a predetermined amount of urine specimen and distributes an aliquot to each of the reaction tank 2u and the reaction tank 2b.
- the distributed aliquot is mixed with a diluting solution 19u and a staining solution 18u. Accordingly, physical components in the specimen are stained by a dye contained in the staining solution 18u.
- the mixture prepared in the reaction tank 2u is used to analyze particles not having nucleic acids, such as red blood cells, casts, crystals, mucus threads, or the like in urine.
- the mixture prepared in the reaction tank 2u is referred to as a first measurement sample.
- particles basically not having nucleic acids, such as red blood cells, casts, crystals, mucus threads, and the like are referred to as non-nucleated components.
- the distributed aliquot is mixed with a diluting solution 19b and a staining solution 18b. Accordingly, physical components in the specimen are stained by a dye contained in the staining solution 18b.
- the mixture prepared in the reaction tank 2b is used to analyze cells having nucleic acids, such as white blood cells, epithelial cells, fungi, sperm, Trichomonas vaginalis, bacteria, or the like in urine.
- the mixture prepared in the reaction tank 2b is referred to as a second measurement sample.
- nucleated components in-urine particles basically having nucleic acids, such as white blood cells, epithelial cells, fungi, sperm, Trichomonas vaginalis, bacteria, and the like are referred to as nucleated components. Strictly speaking, bacteria and sperm do not have a nucleus, but they are also regarded as belonging to nucleated components because nucleic acids are contained.
- a tube extends from the reaction tanks 2u and 2b to a flow cell 51 of the optical detection portion 5, so that the measurement samples prepared in the reaction tanks 2u and 2b can be supplied to the flow cell 51.
- the first measurement sample in the reaction tank 2u is first sent to the optical detection portion 5, after which the second measurement sample in the reaction tank 2b is sent to the optical detection portion 5.
- Each of the first and second measurement samples sent to the optical detection portion 5 forms a thin flow enclosed in a sheath liquid in the flow cell 51, and the flow is irradiated with laser light. This operation is automatically performed by operating an unshown pump, solenoid valve, and the like under the control of a microcomputer 11 (control device), which will be described later.
- a fluorescent dye that is more easily bonded to lipids and proteins of cell membranes than to nucleic acids is selected.
- a dye is preferably a dye that does not affect the forms of red blood cells, among cyanine-based, styryl-based, and acridine-based dyes.
- the dye that stains non-nucleated physical components is preferably a lipid-soluble carbocyanine dye, particularly preferably an indocarbocyanine dye, an oxacarbocyanine dye, or the like.
- indocarbocyanine dye examples include DiI (1,1'-dioctadecyl-3,3,3',3' -tetramethylindocarbocyanine perchlorate), DiD (1,1'-dioctadecyl-3,3,3',3'-tetramethylindodicarbocyanine), DiR (1,1 '-dioctadecyltetramethyl indotricarbocyanine iodide), and the like.
- oxacarbocyanine dye examples include DiOC2(3) (3,3'-diethyloxacarbocyanine iodide), DiOC3(3) (3,3-dipropyloxacarbocyanine iodide), DiOC4(3) (3,3'-dibutyloxacarbocyanine iodide), DiOC5(3) (3,3-dipentyloxacarbocyanine iodide), and the like.
- the dye that stains non-nucleated components used in this embodiment is particularly preferably DiOC3(3) (3,3-dipropyloxacarbocyanine iodide).
- the diluting solution 19u is a reagent that consists primarily of buffer.
- the diluting solution 19u contains an osmotic pressure compensating agent in order to obtain stable fluorescence signals without hemolyzing red blood cells.
- the osmotic pressure of the diluting solution 19u is adjusted to 100 to 600 mOsm/kg so as to be suitable for classification and measurement.
- the staining solution 18b for staining nucleated components a fluorescent dye that is more easily bonded to nucleic acids than to lipids and proteins is selected. More specifically, the staining solution 18b contains an intercalator or a dye that can be bonded to minor grooves for specifically staining nucleic acids.
- the intercalator include known dyes such as cyanine-based, acridine-based, and phenanthridium-based dyes. Examples of the cyanine-based intercalator include SYBR Green I and Thiazole orange. Examples of the acridine-based intercalator include Acridinorange.
- the phenanthridium-based intercalator examples include propidium iodide and ethidium bromide.
- the dye that can be bonded to minor grooves examples include known dyes such as DAPI and Hoechst.
- Examples of the Hoechst dye that can be bonded to minor grooves include Hoechst 33342 and Hoechst 33258.
- the staining solution 18b preferably contains a cyanine-based intercalator, particularly preferably SYBR GreenI or Thiazole orange.
- the diluting solution 19b contains a cationic surfactant for facilitating membrane penetration of the staining solution 18b by damaging cell membranes, and for hemolyzing red blood cells and making impurities such as red blood cell fragments smaller.
- the diluting solution 19b may contain a nonionic surfactant instead of the cationic surfactant.
- the diluting solution 19b contains a surfactant having a hemolytic action. Accordingly, red blood cells contained in a urine specimen can be hemolyzed, and non-nucleated components can be precisely measured even in a urine specimen containing a large amount of red blood cells. Furthermore, in measurement of nucleated components, a reagent having a hemolytic action is used, so that cell membranes can be damaged, and nucleic acids can be efficiently stained. This aspect also contributes to improvement in the precision of measurement of nucleated components.
- the urine specimen analysis device 100 of this embodiment prepares, from one urine specimen, a first measurement sample for measuring non-nucleated components in urine and a second measurement sample for measuring nucleated components in urine.
- the urine specimen analysis device 100 measures non-nucleated components such as red blood cells using the first measurement sample, and measures nucleated cells such as white blood cells using the second measurement sample.
- the first measurement sample contains a fluorescent dye that easily stains lipids or proteins of cell membranes.
- the second measurement sample contains a fluorescent dye that easily stains nucleic acids.
- in-urine particles may be damaged when passing through a glomerulus or may be deformed due to a change in the osmotic pressure when passing through a ureter
- precise analysis can be performed using differences in the stainability, without the influence of changes in the particle forms.
- one optical detection portion 5 is used for both measurement of the first measurement sample and measurement of the second measurement sample. Accordingly, the device configuration can be simplified, and the device can be made smaller.
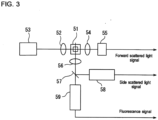
- FIG. 3 is a diagram showing the configuration of the optical detection portion 5.
- a condenser lens 52 converges laser light emitted from a semiconductor laser light source 53, on the flow cell 51.
- a converging lens 54 converges forward scattered light emitted from physical components in a measurement sample, on a first scattered light receiving portion 55 configured by a photodiode.
- Another converging lens 56 converges side scattered light and fluorescence emitted from the physical components, on a dichroic mirror 57.
- the dichroic mirror 57 reflects the side scattered light to a second scattered light receiving portion 58 configured by a photomultiplier tube, and allows the fluorescence to pass therethrough toward a fluorescence receiving portion 59 configured by a photomultiplier tube.
- the first scattered light receiving portion 55, the second scattered light receiving portion 58, and the fluorescence receiving portion 59 convert optical signals into electrical signals, and respectively output a forward scattered light signal (hereinafter, referred to as "FSC"), a side scattered light signal (hereinafter, referred to as "SSC"), and a fluorescence signal (hereinafter, referred to as "FL").
- FSC forward scattered light signal
- SSC side scattered light signal
- FL fluorescence signal
- the first scattered light receiving portion 55, the fluorescence receiving portion 59, and the second scattered light receiving portion 58 can switch the amplification factor at the time of photoelectric conversion, that is, the light sensitivity between a low sensitivity and a high sensitivity by switching the drive voltage.
- the light sensitivity is switched by a microcomputer 11, which will be described later.
- a gas laser light source also can be used instead of the semiconductor laser light source, but the semiconductor laser light source is preferably used because the cost is lower, the size is smaller, and the power consumption is lower.
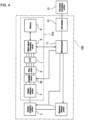
- FIG. 4 is a block diagram showing the configuration of the urine specimen analysis device 100.
- the measurement unit 10 includes the specimen drawing portion 1, the sample preparing portion 2, and the optical detection portion 5 described above, as well as an amplifier circuit 50 that amplifies an output signal of the optical detection portion 5, a filter circuit 6 that performs filtering processing on an output signal from the amplifier circuit 50, an A/D converter 7 that converts an output signal (analog signal) of the filter circuit 6 into a digital signal, a digital signal processing circuit 8 that performs predetermined waveform processing on the digital signal, a memory 9 that is connected to the digital signal processing circuit 8, the microcomputer 11 that is connected to the sample preparing portion 2, the amplifier circuit 50, and the digital signal processing circuit 8, and a LAN adapter 12 that is connected to the microcomputer 11.
- the information processing portion 13 is connected via the LAN adapter 12 to the measurement unit 10 through a LAN cable.
- the information processing portion 13 analyzes measurement data obtained by the measurement unit 10.
- the optical detection portion 5, the amplifier circuit 50, the filter circuit 6, the A/D converter 7, the digital signal processing circuit 8, and the memory 9 form a measurement portion 10a that measures a measurement sample, thereby generating measurement data.
- the optical detection portion 5 amplifies each of the FSC, SSC, and FL signals using a preamplifier.
- Each amplified signal is input via a signal channel to the amplifier circuit 50.
- An FSC signal channel is connected to a main amplifier (FSC amplifier) for amplifying FSC.
- An SSC signal channel is connected to a main amplifier (SSC amplifier) for amplifying SSC.
- An FL signal channel is branched into two channels between the preamplifier and the amplifier circuit 50. One of the signal channels is connected to a main amplifier with a high amplification factor of the amplifier circuit 50. The other signal channel is connected to a main amplifier with a low amplification factor.
- FLH amplified at a high amplification factor and FLL amplified at a low amplification factor are obtained from FL corresponding to one particle.
- the main amplifier with a high amplification factor is referred to as an FLH amplifier and FL input to the FLH amplifier is referred to as "FLH”.
- the main amplifier with a low amplification factor is referred to as an FLL amplifier, and FL input to the FLL amplifier is referred to as "FLL".
- the amplifier circuit 50 amplifies four types of signals consisting of FSC, SSC, FLH, and FLL, according to a set gain.
- the amplifier circuit 50 can set a plurality of different gains.
- the microcomputer 11 can individually adjust the gain of each preamplifier of the amplifier circuit 50 in a stepwise manner.
- the gain can be set among three levels consisting of low level, middle level, and high level. The high level has the highest gain, and the low level has the lowest gain.
- FIG. 5 is a block diagram showing the configuration of the information processing portion 13.
- the information processing portion 13 is configured by a personal computer, including a main unit 400, an input portion 408, and a display portion 409.
- the main unit 400 has a CPU 401, a ROM 402, a RAM 403, a hard disk 404, a reading device 405, an input/output interface 406, an image output interface 407, and a communication interface 410.
- the CPU 401 executes a computer program stored in the ROM 402 and a computer program loaded into the RAM 402.
- the RAM 403 is used to read a computer program stored in the ROM 402 and the hard disk 404.
- the RAM 403 is used also as a working area of the CPU 401 during execution of these computer programs.
- various computer programs that are to be executed by the CPU 401 and data that can be used to execute the computer programs, such as operating systems and application programs, are installed. That is to say, in the hard disk 404, computer programs for analyzing measurement data given from the measurement unit 10 and outputting analysis results are installed.
- the reading device 405 is configured by a CD drive, a DVD drive, or the like, and can read computer programs and data stored in a storage medium.
- the input/output interface 406 is connected to the input portion 408 including a mouse and a keyboard, and, when a user uses the input portion 408, data is input to the information processing portion 13.
- the image output interface 407 is connected to the display portion 409 configured by a liquid crystal panel or the like, and outputs video signals according to image data to the display portion 409.
- the display portion 409 displays an image based on the input video signals.
- the information processing portion 13 is connected via the communication interface 410 to the measurement unit 10, and can exchange data with the measurement unit 10 via the communication interface 410.
- FIG. 6 is a flowchart showing a procedure of specimen measurement processing of the urine specimen analysis device 100.
- an instruction to perform measurement is input by a user via the input portion 408 of the information processing portion 13 (Step S101).
- the CPU 401 Upon receiving this instruction, the CPU 401 transmits instruction data for giving the measurement unit 10 an instruction to start measurement (Step S102). If the measurement unit 10 receives the instruction data (Step S103), the microcomputer 11 performs measurement sample preparation processing (Step S104), non-nucleated component measurement processing (Step S105), and nucleated component measurement processing (Step S106).
- FIG. 7 is a flowchart showing a procedure of the measurement sample preparation processing.
- the microcomputer 11 controls the specimen drawing portion 1 so that a predetermined amount of urine specimen is sucked from the test tube T into the suction tube 17.
- the microcomputer 11 controls the specimen drawing portion 1 so that a predetermined amount of urine specimen aliquot is dispensed to each of the reaction tank 2u and the reaction tank 2b (Steps S201 and S202).
- the microcomputer 11 controls the sample preparing portion 2 so that the following steps S203 to S207 are performed.
- steps S203 and S204 a predetermined amount of diluting solution 19u and staining solution 18u are taken out and dispensed into the reaction tank 2u (Steps S203 and S204).
- steps S205 and S206 a predetermined amount of diluting solution 19b and staining solution 18b are taken out and dispensed into the reaction tank 2b (Steps S205 and S206).
- Each of the reaction tank 2u and the reaction tank 2b is heated by an unshown heater to a predetermined temperature, and, in this state, the mixture in each tank is stirred by a propeller-like stirrer (not shown) (Step S207).
- a first measurement sample for measuring non-nucleated components is prepared in the reaction tank 2u, and a second measurement sample for measuring nucleated components is prepared in the reaction tank 2b. If the process in step S207 ends, the microcomputer 11 returns the procedure to the main routine.
- FIG. 8 is a flowchart showing a procedure of non-nucleated component measurement processing.
- the microcomputer 11 sets the light sensitivity of the optical detection portion 5 and the gain of the amplifier circuit 50 to a first set value for measuring non-nucleated components (Step S301).
- Each of the first set value and a second and a third set value contains a value of the light sensitivity of each light receiving portion of the optical detection portion 5 and a value of the gain of the amplifier circuit 50.
- the values are distinguished from each other by referring to the former as “light sensitivity” and the latter as “gain”.
- the amplification factor of a signal is determined by the product of these values.
- a value determined by the product of the light sensitivity and the gain is referred to as an "amplification factor”.
- the light sensitivity of the optical detection portion 5 is set to the low sensitivity. Furthermore, the gain of the FSC amplifier is set to the middle level.
- the FLL amplifier is set to the middle level.
- the FLH amplifier is set to the low level.
- the FLH amplification factor determined by the first set value is lower than an FLH2 amplification factor determined by the third set value, which will be described later.
- the microcomputer 11 sends a sheath liquid to the flow cell 51 by driving an unshown compressor (Step S302). In a state where the sheath liquid is continuously supplied to the flow cell 51, the microcomputer 11 supplies the first measurement sample from the reaction tank 2u to the flow cell 51 (Step S303).
- the sheath liquid and the first measurement sample are simultaneously supplied to the flow cell 51, and a flow of the first measurement sample enclosed in the sheath liquid is formed in the flow cell 51.
- the thus formed sample flow is irradiated with a laser beam from the light source 53 (Step S304), and a beam spot is formed on the flow cell 51.
- the particles are irradiated with light from the light source 53, and forward scattered light, fluorescence, and side scattered light are generated from the particles.
- the forward scattered light, the fluorescence, and the side scattered light are respectively received by the first scattered light receiving portion 55, the fluorescence receiving portion 59, and the second scattered light receiving portion 58, and are converted into electrical signals (Step S305). Accordingly, each time particles pass through the flow cell 51, output signals of the first scattered light receiving portion 55, the second scattered light receiving portion 59, and the fluorescence receiving portion 58 change in a pulsed manner.
- the electrical signals corresponding to the light receiving levels of the first scattered light receiving portion 55 and the second scattered light receiving portion 58 are output as FSC and SSC.
- the electrical signals corresponding to the light receiving levels of the fluorescence receiving portion 59 are output as two signals consisting of FLH and FLL.
- FSC, SSC, FLH, and FLL are output at the light sensitivity (low sensitivity) determined by the first set value set in step S301.
- the output signals are amplified by the main amplifier of the amplifier circuit 50 at the gain determined by the first set value.
- FLL low-sensitivity fluorescence signal
- FLH high-sensitivity fluorescence signal
- FSC FSC
- SSC SSC
- the FSC, FLL, FLH, and SSC amplified by the amplifier circuit 50 set to the first set value are subjected to filtering processing by the filter circuit 6. These signals are converted by the A/D converter 7 into digital signals, and are subjected to predetermined signal processing by the digital signal processing circuit 8.
- the digital signal processing circuit 8 performs signal processing, thereby extracting parameters used in analysis processing, from the optical signals (FSC, SSC, FLL, and FLH).
- the analysis parameters include a forward scattered light intensity (hereinafter, referred to as "FSCP”), a pulse width of the forward scattered light (hereinafter, referred to as "FSCW”), a side scattered light intensity (hereinafter, referred to as "SSCP”), a low-sensitivity fluorescence intensity (hereinafter, referred to as "FLLP”), a pulse width of the low-sensitivity fluorescence signal (hereinafter, referred to as "FLLW”), a pulse area of the low-sensitivity fluorescence signal (hereinafter, referred to as "FLLA”), a high-sensitivity fluorescence intensity (hereinafter, referred to as "FLHP”), a pulse width of the high-sensitivity fluorescence signal (hereinafter, referred to as "FLHW”), and a pulse area of the high-sensitivity fluorescence signal (herein
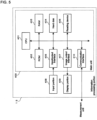
- FIGS. 9A to 9C There are three types of analysis parameters consisting of "intensity”, “pulse width”, and “pulse area” for each optical signal.
- the intensity is represented by P.
- the pulse width is represented by W.
- the pulse area is represented by A.
- each time particles pass through the flow cell 51 electrical signals output from the light receiving portions change in a pulsed manner according to the characteristics of the particles.
- Each of the intensities of the optical signals such as FSCP, SSCP, FLLP, and FLHP is obtained as a pulse peak height P as shown in FIG. 9A .
- Each of the pulse widths of the optical signals such as FSCW, FLLW, and FLHW is obtained as an interval W from a time T1 when a pulse exceeds a predetermined threshold to a time T2 when the pulse drops below the threshold as shown in FIG. 9B .
- Each of the pulse areas of the optical signals such as FLLA and FLHA is obtained as an area of a region PA (region indicated by diagonal lines in the diagram) defined by a signal pulse waveform line L1, straight lines L2 and L3 indicating the times when the optical signal intensity is at a predetermined threshold, on both sides of the pulse, and a straight line L4 at which the optical signal intensity is 0, as shown in FIG. 9C , that is, as the time integral value of the signal intensity.
- the pulse area may be an approximate as long as it is a value reflecting the area under the pulse time curve, and is not limited to the time integral value.
- the pulse area may be the product of the pulse width and the peak height, or may be the triangle area obtained from the pulse width and the peak height.
- the base when extracting the time integral value, may not be a straight line at which the intensity is 0, and may be set as appropriate.
- the base may be at the predetermined threshold shown in FIG. 9C , or may be at a reference value that can be determined at the pulse value obtained when only the sheath liquid flows through the flow cell 51.
- Step S306 The parameters extracted from the optical signals as described above are stored as measurement data in the memory 9 (Step S306).
- the microcomputer 11 returns the procedure to the main routine.
- FIG. 10 is a flowchart showing a procedure of nucleated component measurement processing.
- the microcomputer 11 sets the light sensitivity of the optical detection portion 5 and the gain of the amplifier circuit 50 to a second set value (Step S311).
- the second set value is a set value for measuring nucleated components such as white blood cells, epithelial cells, and fungi.
- the light sensitivity of the optical detection portion 5 is set to the low sensitivity. Furthermore, the FSC amplifier is set to the low level.
- the FLL amplifier is set to the low level.
- the FLH amplifier is set to the middle level.
- the FLH amplification factor determined by the second set value is lower than an FLH2 amplification factor determined by the third set value, which will be described later.
- the microcomputer 11 sends a sheath liquid to the flow cell 51 by driving an unshown compressor (Step S312).
- the microcomputer 11 supplies the second measurement sample from the reaction tank 2b to the flow cell 51 (Step S313).
- the sheath liquid and the second measurement sample are simultaneously supplied to the flow cell 51, and a flow of the second measurement sample enclosed in the sheath liquid is formed in the flow cell 51.
- the thus formed sample flow is irradiated with a laser beam from the light source 53 (Step S314). Accordingly, forward scattered light, fluorescence, and side scattered light are generated from the nucleated cells.
- the forward scattered light, the fluorescence, and the side scattered light are respectively received by the first scattered light receiving portion 55, the fluorescence receiving portion 59, and the second scattered light receiving portion 58, and are converted into electrical signals (Step S315).
- the optical detection portion 5 outputs FSC, FLH, FLL, and SSC at the light sensitivity determined by the second set value.
- the output signals are amplified by the amplifier circuit 50 at the gain determined by the second set value.
- FLL low-sensitivity fluorescence signal
- FLH1 first high-sensitivity fluorescence signal
- FSC FSC
- SSC SSC
- the amplified signals are subjected to filtering processing by the filter circuit 6. These signals are converted by the A/D converter 7 into digital signals, and are subjected to predetermined signal processing by the digital signal processing circuit 8. With this signal processing, an FSC peak value is extracted as FSCP. An FSC pulse width is extracted as FSCW. An SSC peak value is extracted as SSCP. An FLL peak value is extracted as FLLP. An FLL pulse width is extracted as FLLW. An FLL pulse area is extracted as FLLA. An FLH1 peak value is extracted as a first high-sensitivity fluorescence intensity (hereinafter, referred to as "FLHP 1").
- An FLH1 pulse width is extracted as a first high-sensitivity fluorescence pulse width (hereinafter, referred to as "FLHW1").
- An FLH1 pulse area is extracted as a first high-sensitivity fluorescence pulse area (hereinafter, referred to as "FLHA1 ").
- Data of the extracted parameters is stored as measurement data in the memory 9 (Step S316).
- the microcomputer 11 changes the light sensitivity of the optical detection portion 5 and the gain of the amplifier circuit 50 to a third set value (Step S317).
- the third set value is a set value for measuring bacteria.
- the light sensitivity of the optical detection portion 5 is set to the high sensitivity. Furthermore, the FSC amplifier is set to the high level. The FLH amplifier is set to the high level. The FLL amplifier is not used.
- the light sensitivity (high sensitivity) of the fluorescence receiving portion 59 at the third set value is five times the light sensitivity (low sensitivity) of the fluorescence receiving portion 59 at the second set value.
- the reason for this is that a bacterium has a size smaller than that of any other nucleated cell, and therefore has a fluorescence amount smaller than that in measurement of any other nucleated cell.
- the light sensitivity of the fluorescence receiving portion 59 at the third set value is set to be higher than the light sensitivity at the second set value, the light sensitivity becomes suitable for bacteria, and a trace amount of fluorescence emitted from bacteria can be precisely detected.
- the gain of the FSC amplifier at the third set value is set to the high level, very small bacteria can be precisely detected.
- the optical detection portion 5 In a state where the optical detection portion 5 and the amplifier circuit 50 is set to the third set value, the second measurement sample is measured (Step S318). Accordingly, the optical detection portion 5 outputs signals at the light sensitivity determined by the third set value, and the output signals are amplified by the amplifier circuit 50 at the gain determined by the third set value.
- the FLH output from the optical detection portion 5 when the third set value is set is amplified by the FLH amplifier of the amplifier circuit 50 and is obtained as a second high-sensitivity fluorescence signal (hereinafter, referred to as "FLH2").
- two types of optical signals consisting of a second high-sensitivity fluorescence signal FLH2 and FSC are obtained from each particle of the second measurement sample.
- the FSC and FLH2 amplified by the amplifier circuit 50 are subjected to filtering processing by the filter circuit 6, and are then converted by the A/D converter 7 into digital signals and subjected to predetermined signal processing by the digital signal processing circuit 8. With this signal processing, an FSC peak is extracted as FSCP. An FSC pulse width is extracted as FSCW. An SSC peak value is extracted as SSCP. FLH2 peak value is extracted as a second high-sensitivity fluorescence intensity (hereinafter, referred to as "FLHP2"). An FLH2 pulse width is extracted as a second high-sensitivity fluorescence pulse width (hereinafter, referred to as "FLHW2").
- FLH2 pulse area is extracted as a second high-sensitivity fluorescence pulse area (hereinafter, referred to as "FLHA2").
- Data of the extracted parameters is stored as measurement data in the memory 9 (Step S319).
- the microcomputer 11 returns the procedure to the main routine.
- the microcomputer 11 transmits the measurement data generated by the non-nucleated component measurement processing and the nucleated component measurement processing, to the information processing portion 13 (Step S107), and ends the procedure.
- FIG. 11 is a flowchart showing a procedure of measurement data analysis processing.
- the measurement data analysis processing includes first non-nucleated component classification processing (Step S401), second non-nucleated component classification processing (Step S402), first nucleated component classification processing (Step S403), second nucleated component classification processing (Step S404), and bacteria detection processing (Step S405).
- red blood cells and crystals are detected using the FSC and FLH obtained by measuring the first measurement sample, and the numbers thereof are counted. Red blood cells and crystals are detected using FLH, because each of them is less stainable than any of a cast, a mucus thread, and the like, and therefore has a smaller fluorescence amount.
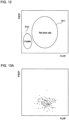
- FIG. 12 is a diagram showing distributions of red blood cells and crystals in FLHP-FSCP space. In FIG. 12 , the horizontal axis indicates FLHP, and the vertical axis indicates FSCP. As shown in the diagram, a difference is seen in FLHP between a red blood cell distribution region R11 and a crystal distribution region R12.
- red blood cells and crystals are classified based on FLHP.
- particles contained in the region R11 shown in the diagram are detected as red blood cells, and the number thereof is counted.
- particles contained in the region R12 shown in the diagram are detected as crystals, and the number thereof is counted.
- FIGS. 13A and 13B show specific detection results in the first non-nucleated component classification processing S401.
- FIG. 13A is a scattergram showing an exemplary detection result of red blood cells
- FIG. 13B is a scattergram showing an exemplary detection result of crystals.
- FIG. 13A shows a result obtained by measuring a specimen containing red blood cells
- FIG. 13B shows a result obtained by measuring a specimen containing crystals.
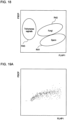
- FIG. 14 is a diagram showing distributions of casts and mucus threads in FLLW-FLLA space.
- the horizontal axis indicates FLLW
- the vertical axis indicates FLLA.
- casts and mucus threads appear in different regions R21 and R22.
- casts and mucus threads are classified based on FLLW and FLLA.
- particles contained in the region R21 shown in the diagram are detected as casts, and the number thereof is counted.
- particles contained in the region R22 shown in the diagram are detected as mucus threads, and the number thereof is counted.
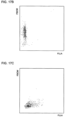
- FIGS. 15A and 15B show specific detection results in the second non-nucleated component classification processing S402.
- FIG. 15A is a scattergram showing an exemplary detection result of casts
- FIG. 15B is a scattergram showing an exemplary detection result of mucus threads.
- FIG. 15A shows a result obtained by measuring a specimen containing casts
- FIG. 15B shows a result obtained by measuring a specimen containing mucus threads.
- in-urine cells having nucleic acids are classified by the first nucleated component classification processing, the second nucleated component classification processing, and the bacteria detection processing.
- FIG. 16 is a diagram showing distributions of white blood cells, atypical cells, and epithelial cells in FLLA-FSCW space. In the diagram, the horizontal axis indicates FLLA, and the vertical axis indicates FSCW.
- a difference is seen in FLLA between white blood cells and epithelial cells, and atypical cells.
- the reason for this is that there is substantially no difference in the nucleic acid amount between a white blood cell and an epithelial cell, and an atypical cell has a nucleic acid amount larger than that of any of a white blood cell and an epithelial cell.
- a difference is seen in FSCW between white blood cells and epithelial cells. The reason for this is that an epithelial cell has a size larger than that of a white blood cell. Accordingly, white blood cells, epithelial cells, and atypical cells are classified based on FLLA and FSCW.
- particles contained in a region R31 shown in the diagram are detected as atypical cells, and the number thereof is counted. Furthermore, particles contained in a region R32 shown in the diagram are detected as white blood cells, and the number thereof is counted. Furthermore, particles contained in a region R33 shown in the diagram are detected as epithelial cells, and the number thereof is counted.
- FIGS. 17A to 17C show specific detection results in the first nucleated component classification processing S403.
- FIG. 17A is a scattergram showing an exemplary detection result of white blood cells
- FIG. 17B is a scattergram showing an exemplary detection result of epithelial cells
- FIG. 17C is a scattergram showing an exemplary detection result of atypical cells.
- FIG. 17A shows a result obtained by measuring a specimen containing white blood cells
- FIG. 17B shows a result obtained by measuring a specimen containing epithelial cells
- FIG. 17C shows a result obtained by measuring a specimen containing atypical cells.
- FIG. 18 is a diagram showing distributions of sperm, Trichomonas vaginalis, and fungi in FLHP1-FSCP space.
- Sperm, Trichomonas vaginalis, and fungi are detected using FLH1, because each of them has a nucleic acid amount smaller than that of any of a white blood cell, an epithelial cell, and an atypical cell, and therefore has a smaller fluorescence amount.
- the horizontal axis indicates FLHP1
- the vertical axis indicates FSCP.
- sperm, fungi, and Trichomonas vaginalis in FLHP 1-FSCP space are different.
- the reason for this is that there is a difference in the nucleic acid amount and in the size between a sperm, a fungus, and Trichomonas vaginalis. Accordingly, sperm, Trichomonas vaginalis, and fungi are classified based on FLHP1 and FSCP.
- particles contained in a region R41 shown in the diagram are detected as sperm, and the number thereof is counted.
- particles contained in a region R42 shown in the diagram are detected as fungi, and the number thereof is counted.
- particles contained in a region R43 shown in the diagram are detected as Trichomonas vaginalis, and the number thereof is counted.
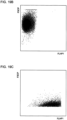
- FIGS. 19A to 19C show specific detection results in the second nucleated component classification processing S404.
- FIG. 19A is a scattergram showing an exemplary detection result of fungi
- FIG. 19B is a scattergram showing an exemplary detection result of Trichomonas vaginalis
- FIG. 19C is a scattergram showing an exemplary detection result of sperm.
- FIG. 19A shows a result obtained by measuring a specimen containing fungi
- FIG. 19B shows a result obtained by measuring a specimen containing Trichomonas vaginalis
- FIG. 19C shows a result obtained by measuring a specimen containing sperm.
- FIG. 20 is a diagram showing a distribution of bacteria in FLHP2-FSCP space.
- the horizontal axis indicates FLHP2, and the vertical axis indicates FSCP.
- bacteria appear in a predetermined region R5.
- Other nucleated cells such as white blood cells (not shown) appear in a region having a fluorescence intensity higher than that of the region R5.
- impurities not having nucleic acids appear in a region having a fluorescence intensity lower than that of the region R5.
- particles contained in the region R5 shown in the diagram are detected as bacteria, and the number thereof is counted.
- FIG. 21 shows a specific detection result in the bacteria detection processing S405.
- FIG. 21 is a scattergram showing an exemplary detection result of bacteria.
- FIG. 21 shows a result obtained by measuring a specimen containing bacteria.
- the CPU 401 returns the procedure to the main routine.
- the CPU 401 displays an analysis result obtained by this measurement data analysis processing, on the display portion 409 (Step S110), and ends the procedure.
- red blood cells, casts, crystals, and mucus threads are detected from the first measurement sample
- the present invention is not limited to this. Any configuration is possible as long as at least red blood cells are detected as particles not having nucleic acids.
- red blood cells, casts, crystals, or mucus threads may be optionally detected.
- the present invention is not limited to this. Any configuration is possible as long as at least white blood cells are detected as cells having nucleic acids.
- white blood cells epithelial cells, atypical cells, sperm, Trichomonas vaginalis, fungi, or bacteria may be optionally detected.
- fluorescence signals at three sensitivities consisting of FLL, FLH1, and FLH2 are obtained from the second measurement sample, and are used to classify cells having nucleic acids into white blood cells, epithelial cells, atypical cells, sperm, Trichomonas vaginalis, fungi, and bacteria
- the present invention is not limited to this.
- a configuration is possible in which fluorescence signals at two types of sensitivities are obtained and are used to classify cells having nucleic acids into a plurality of types, or in which one fluorescence signal is used to classify cells having nucleic acids into a plurality of types.
- the present invention is not limited to this.
- a configuration is possible in which fluorescence signals at a plurality of sensitivities are obtained by switching the sensitivity of the fluorescence receiving portion 59 without switching the amplification factor of the amplifier circuit 50, or in which fluorescence signals at a plurality of sensitivities are obtained by switching the amplification factor of the amplifier circuit 50 without switching the sensitivity of the fluorescence receiving portion 59.
- the present invention is not limited to this.
- a configuration is possible in which a predetermined amount of specimen is taken out through a sampling valve from a sucked specimen, and aliquots each in that predetermined amount are supplied to the reaction tank 2u and the reaction tank 2b.
- the foregoing embodiment described a configuration in which the measurement sample preparation processing, the non-nucleated component measurement processing, the nucleated component measurement processing, and the measurement data analysis processing are performed in this order, this order is merely an example, and the processing may be performed in other orders.
- a configuration is possible in which after the first measurement sample is prepared, the non-nucleated component measurement processing is performed, and, then, the first non-nucleated component classification processing and the second non-nucleated component classification processing are performed, after which the second measurement sample is prepared, and the nucleated component measurement processing is performed, and, then, the first nucleated component classification processing, the second nucleated component classification processing, and the bacteria detection processing are performed.
- the order in which the measurement of the second measurement sample using the second set value and the measurement of the second measurement sample using the third set value in the nucleated component measurement processing also can be changed.
- the present invention is not limited to this.
- a configuration is also possible in which the microcomputer 11 of the measurement unit 10 analyzes the measurement data.
Landscapes
- Health & Medical Sciences (AREA)
- Life Sciences & Earth Sciences (AREA)
- Chemical & Material Sciences (AREA)
- Engineering & Computer Science (AREA)
- Immunology (AREA)
- Physics & Mathematics (AREA)
- Biomedical Technology (AREA)
- Analytical Chemistry (AREA)
- Biochemistry (AREA)
- General Health & Medical Sciences (AREA)
- General Physics & Mathematics (AREA)
- Pathology (AREA)
- Molecular Biology (AREA)
- Urology & Nephrology (AREA)
- Hematology (AREA)
- Food Science & Technology (AREA)
- Medicinal Chemistry (AREA)
- Cell Biology (AREA)
- Biophysics (AREA)
- Dispersion Chemistry (AREA)
- Nuclear Medicine, Radiotherapy & Molecular Imaging (AREA)
- Ecology (AREA)
- Tropical Medicine & Parasitology (AREA)
- Biotechnology (AREA)
- Microbiology (AREA)
- Investigating Or Analysing Biological Materials (AREA)
- Investigating, Analyzing Materials By Fluorescence Or Luminescence (AREA)
Description
- The present invention relates to a urine specimen analysis device and a urine specimen analysis method for analyzing a urine specimen by measuring a measurement sample obtained by mixing the urine specimen and a reagent.
- Specimen analysis that analyzes components contained in specimens, such as blood or urine, collected from living bodies is widely performed in the field of clinical tests, and, recently, specimen analysis devices that automatically perform specimen analysis are used.
-
Patent Document 1 discloses an in-urine physical component analysis device for measuring physical components contained in urine. According to the in-urine physical component analysis device described inPatent Document 1, a sucked urine specimen is divided into two aliquots, wherein a diluting solution and a first staining reagent that stains membranes are mixed with one of the aliquots to prepare a measurement sample for measuring relatively large in-urine physical components, such as red blood cells, white blood cells, epithelial cells, and casts, and this measurement sample is subjected to optical measurement, so that red blood cells, white blood cells, epithelial cells, casts, and the like are analyzed, whereas a diluting solution and a second staining reagent that stains nucleic acids are mixed with the other aliquot to prepare a measurement sample for measuring bacteria that are smaller than other in-urine physical components, and this measurement sample is subjected to optical measurement, so that bacteria are analyzed. - Patent Document 1:
JP 2007-309728A - Analysis results of in-urine physical components are used to estimate which point in the kidneys and the urinary tract is abnormal, and analysis of in-urine physical components is widely performed as important screening tests. Accordingly, there is a demand for further improvement in the precision of analysis performed by in-urine physical component analysis devices.
- The present invention was arrived at in view of the above-described problems, and it is an object thereof to provide a urine specimen analysis device and a urine specimen analysis method capable of precisely analyzing in-urine physical components. Solution to Problem
- In order to solve the above-described problems, a first aspect of the present invention is directed to a urine specimen analysis device according to
claim 1. - Cells in urine may be damaged when passing through a glomerulus or may be deformed due to a change in the osmotic pressure when passing through a ureter. Thus, it is difficult to precisely analyze the cells in urine based on the cell forms. With the configuration as described above, at least red blood cells are detected from the first measurement sample prepared using the first staining dye that stains red blood cells, and at least white blood cells are detected from the second measurement sample prepared using the second staining dye that stains nucleic acids, and, thus, particles and cells in urine can be precisely detected using the nucleic acid amount, the membrane stainability, and the like unique to each cell, without the influence of changes in the cell forms.
- In the above-described aspect, it is possible that the sample preparing portion is configured to prepare the first measurement sample without hemolyzing red blood cells contained in the first aliquot, and prepare the second measurement sample while hemolyzing red blood cells contained in the second aliquot. Accordingly, in the first measurement sample, particles in urine are stained in a state where red blood cells are not hemolyzed, and, thus, at least red blood cells in urine can be precisely detected based on the fluorescence. Furthermore, in the second measurement sample, red blood cells are hemolyzed, and, thus, detection errors due to the presence of red blood cells are prevented, and at least white blood cells can be more precisely detected.
- In the above-described aspect, it is possible that the information processing portion is configured to distinguishably detect red blood cells and other in-urine particles not containing nucleic acids contained in the first aliquot, based on the fluorescence of the first measurement sample. There is a difference in the stain level with a staining dye for staining red blood cells, between a red blood cell and any other particle containing no nucleic acid, contained in urine. Accordingly, with this configuration, these particles can be precisely detected.
- In the above-described aspect, it is possible that the information processing portion is configured to distinguishably detect white blood cells and other in-urine particles containing nucleic acids contained in the second aliquot, based on the fluorescence of the second measurement sample. There is a difference in the nucleic acid amount between a white blood cell and any other particle containing a nucleic acid, contained in urine. Accordingly, with this configuration, white blood cells and other in-urine particles containing nucleic acids can be distinguishably detected with a high degree of accuracy using the fluorescence of the second measurement sample. Furthermore, even cells that are easily deformed or damaged, such as epithelial cells, can be precisely detected based on the fluorescence of the second measurement sample.
- In the above-described aspect, it is possible that the measurement portion includes: a flow cell for allowing a measurement sample to flow therethrough; a light source for emitting light on the measurement sample that flows through the flow cell; a fluorescence receiving portion for receiving fluorescence emitted from a particle in the measurement sample, and outputting a fluorescence signal; and a scattered light receiving portion for receiving scattered light emitted from a particle in the measurement sample, and outputting a scattered light signal.
- In the above-described aspect, it is possible that the measurement portion can amplify a signal of fluorescence received by the fluorescence receiving portion at a plurality of sensitivities, and the information processing portion is configured to detect white blood cells contained in the second aliquot, based on a fluorescence signal amplified at a low sensitivity, and detect in-urine particles smaller than white blood cells contained in the second aliquot, based on a fluorescence signal amplified at a high sensitivity. Particles in urine have various sizes and different nucleic acid amounts according to their types. With this configuration, these particles in urine can be precisely classified using a fluorescence signal of a sensitivity according to the corresponding nucleic acid amount.
- In the above-described aspect, it is possible that the measurement portion can amplify a signal of fluorescence received by the fluorescence receiving portion at least at a first sensitivity, a second sensitivity higher than the first sensitivity, and a third sensitivity higher than the first and second sensitivities, and the information processing portion is configured to detect white blood cells in the second measurement sample based on a first fluorescence signal amplified at the first sensitivity, detect sperm or fungi in the second measurement sample based on a second fluorescence signal amplified at the second sensitivity, and detect bacteria in the second measurement sample based on a third fluorescence signal amplified at the third sensitivity.
- In the above-described aspect, it is possible that the measurement portion is configured to obtain the first and second fluorescence signals from the second measurement sample during a first period in which the measurement sample flows through the flow cell, and obtain the third fluorescence signal from the measurement sample during a second period that is before or after the first period.
- In the above-described aspect, it is possible that the information processing portion is configured to classify at least white blood cells and epithelial cells contained in the second aliquot based on the first fluorescence signal, and classify sperm and fungi contained in the second aliquot based on the second fluorescence signal.
- In the above-described aspect, it is possible that the information processing portion is configured to classify in-urine particles contained in the first aliquot into red blood cells and other in-urine particles not containing nucleic acids, based on the fluorescence signal of the first measurement sample obtained via the fluorescence receiving portion and the scattered light signal of the first measurement sample obtained via the scattered light receiving portion.
- In the above-described aspect, it is possible that the information processing portion is configured to distinguishably detect red blood cells and casts contained in the first aliquot, based on the fluorescence signal of the first measurement sample and the scattered light signal of the first measurement sample.
- In the above-described aspect, it is possible that the information processing portion is configured to distinguishably detect white blood cells and epithelial cells contained in the first aliquot, based on the fluorescence signal of the second measurement sample and the scattered light signal of the second measurement sample.
- In the above-described aspect, it is possible that the information processing portion can obtain at least a fluorescence intensity from the fluorescence signal, can obtain at least a scattered light intensity from the scattered light signal, and classifies, among particles in the first measurement sample, particles belonging to a first range determined by the fluorescence intensity and the scattered light intensity as red blood cells.
- In the above-described aspect, it is possible that the information processing portion can obtain at least a fluorescence pulse area and a fluorescence pulse width from the fluorescence signal, and classifies, among particles in the first measurement sample, particles belonging to a second range determined by the fluorescence pulse area and the fluorescence pulse width as casts.
- In the above-described aspect, it is possible that the information processing portion can obtain at least a fluorescence pulse area from the first fluorescence signal, can obtain at least a scattered light pulse width from the scattered light signal, and classifies, among particles in the second measurement sample, particles belonging to a third range determined by the fluorescence pulse area of the first fluorescence signal and the scattered light pulse width as white blood cells.
- In the above-described aspect, it is possible that the information processing portion classifies, among particles in the second measurement sample, particles belonging to a fourth range determined by the fluorescence pulse area of the first fluorescence signal and the scattered light pulse width as epithelial cells.
- In the above-described aspect, it is possible that the information processing portion can obtain at least a fluorescence intensity from the second fluorescence signal, can obtain at least a scattered light intensity from the scattered light signal, and classifies, among particles in the second measurement sample, particles belonging to a fifth range determined by the fluorescence intensity of the second fluorescence signal and the scattered light pulse width as sperm.
- In the above-described aspect, it is possible that the information processing portion classifies, among particles in the second measurement sample, particles belonging to a sixth range determined by the fluorescence intensity of the second fluorescence signal and the scattered light pulse width as fungi.
- In the above-described aspect, it is possible that the information processing portion can obtain at least a fluorescence intensity from the third fluorescence signal, can obtain at least a scattered light intensity from the scattered light signal output from the scattered light receiving portion, and classifies, among particles in the second measurement sample, particles belonging to a seventh range determined by the fluorescence intensity of the third fluorescence signal and the scattered light intensity as bacteria.
- Furthermore, a second aspect of the present invention is directed to a urine specimen analysis method according to
claim 13. - Accordingly, effects similar to those obtained by the urine specimen analysis device according to the first aspect of the present invention are achieved.
- According to the present invention, it is possible to precisely analyze in-urine physical components according to characteristics of each component.
-
-
FIG. 1 is a perspective view showing the overall configuration of a urine specimen analysis device according to an embodiment. -
FIG. 2 is a diagram showing a schematic functional configuration of a sample preparing portion and an optical detection portion. -
FIG. 3 is a diagram showing the configuration of the optical detection portion. -
FIG. 4 is a block diagram showing the configuration of the urine specimen analysis device according to the embodiment. -
FIG. 5 is a block diagram showing the configuration of an information processing portion. -
FIG. 6 is a flowchart showing a procedure of specimen measurement processing of the urine specimen analysis device according to the embodiment. -
FIG. 7 is a flowchart showing a procedure of measurement sample preparation processing. -
FIG. 8 is a flowchart showing a procedure of non-nucleated component measurement processing. -
FIG. 9A is a schematic graph illustrating an intensity of an optical signal. -
FIG. 9B is a schematic graph illustrating a pulse width of an optical signal. -
FIG. 9C is a schematic graph illustrating a pulse area of an optical signal. -
FIG. 10 is a flowchart showing a procedure of nucleated component measurement processing. -
FIG. 11 is a flowchart showing a procedure of measurement data analysis processing. -
FIG. 12 is a diagram showing distributions of red blood cells and crystals in a fluorescence intensity-forward scattered light intensity region. -
FIG. 13A is a scattergram showing an exemplary detection result of red blood cells. -
FIG. 13B is a scattergram showing an exemplary detection result of crystals. -
FIG. 14 is a diagram showing distributions of casts and mucus threads in a fluorescence pulse width-fluorescence pulse area region. -
FIG. 15A is a scattergram showing an exemplary detection result of casts. -
FIG. 15B is a scattergram showing an exemplary detection result of mucus threads. -
FIG. 16 is a diagram showing distributions of white blood cells, atypical cells, and epithelial cells in a fluorescence pulse area-forward scattered light pulse width region. -
FIG. 17A is a scattergram showing an exemplary detection result of white blood cells. -
FIG. 17B is a scattergram showing an exemplary detection result of epithelial cells. -
FIG. 17C is a scattergram showing an exemplary detection result of atypical cells. -
FIG. 18 is a diagram showing distributions of sperm, Trichomonas vaginalis, and fungi in a fluorescence intensity-forward scattered light intensity region. -
FIG. 19A is a scattergram showing an exemplary detection result of fungi. -
FIG. 19B is a scattergram showing an exemplary detection result of Trichomonas vaginalis. -
FIG. 19C is a scattergram showing an exemplary detection result of sperm. -
FIG. 20 is a diagram showing a distribution of bacteria in a fluorescence intensity-forward scattered light intensity region. -
FIG. 21 is a scattergram showing an exemplary detection result of bacteria. - Hereinafter, a preferred embodiment of the present invention will be described with reference to the drawings.
- This embodiment will describe a urine specimen analysis device for analyzing in-urine physical components. The urine specimen analysis device according to this embodiment allows a urine specimen to be loaded into the device, and analyzes in-urine physical components (red blood cells, white blood cells, epithelial cells, casts, bacteria, etc.).
-
FIG. 1 is an external perspective view showing the configuration of the urine specimen analysis device according to this embodiment. InFIG. 1 , a urinespecimen analysis device 100 includes ameasurement unit 10 and aninformation processing portion 13. Themeasurement unit 10 includes asample preparing portion 2 for preparing a measurement sample, a rack table 4 for transferring a sample rack (test tube rack) 3, anoptical detection portion 5 for detecting information on physical components from the measurement sample, and acircuit portion 14. On a side face of the casing, a supportingstage 16 is arranged via anarm 15, and theinformation processing portion 13 is disposed on the supportingstage 16. Theinformation processing portion 13 is data communicably connected to thecircuit portion 14 of themeasurement unit 10. -
FIG. 2 is a diagram showing a schematic functional configuration of thesample preparing portion 2 and theoptical detection portion 5. In the diagram, a urine specimen placed in a test tube T is sucked by an unshown syringe pump through asuction tube 17. The sucked urine specimen is dispensed by aspecimen drawing portion 1 into thesample preparing portion 2. Thesample preparing portion 2 in this embodiment includes areaction tank 2u and areaction tank 2b. Thespecimen drawing portion 1 takes out a predetermined amount of urine specimen and distributes an aliquot to each of thereaction tank 2u and thereaction tank 2b. - In the
reaction tank 2u, the distributed aliquot is mixed with adiluting solution 19u and astaining solution 18u. Accordingly, physical components in the specimen are stained by a dye contained in thestaining solution 18u. The mixture prepared in thereaction tank 2u is used to analyze particles not having nucleic acids, such as red blood cells, casts, crystals, mucus threads, or the like in urine. Hereinafter, the mixture prepared in thereaction tank 2u is referred to as a first measurement sample. Furthermore, particles basically not having nucleic acids, such as red blood cells, casts, crystals, mucus threads, and the like are referred to as non-nucleated components. - Meanwhile, in the
reaction tank 2b, the distributed aliquot is mixed with a dilutingsolution 19b and astaining solution 18b. Accordingly, physical components in the specimen are stained by a dye contained in thestaining solution 18b. The mixture prepared in thereaction tank 2b is used to analyze cells having nucleic acids, such as white blood cells, epithelial cells, fungi, sperm, Trichomonas vaginalis, bacteria, or the like in urine. Hereinafter, the mixture prepared in thereaction tank 2b is referred to as a second measurement sample. Furthermore, in-urine particles basically having nucleic acids, such as white blood cells, epithelial cells, fungi, sperm, Trichomonas vaginalis, bacteria, and the like are referred to as nucleated components. Strictly speaking, bacteria and sperm do not have a nucleus, but they are also regarded as belonging to nucleated components because nucleic acids are contained. - A tube extends from the
reaction tanks flow cell 51 of theoptical detection portion 5, so that the measurement samples prepared in thereaction tanks flow cell 51. Of the two types of measurement samples prepared as described above, the first measurement sample in thereaction tank 2u is first sent to theoptical detection portion 5, after which the second measurement sample in thereaction tank 2b is sent to theoptical detection portion 5. Each of the first and second measurement samples sent to theoptical detection portion 5 forms a thin flow enclosed in a sheath liquid in theflow cell 51, and the flow is irradiated with laser light. This operation is automatically performed by operating an unshown pump, solenoid valve, and the like under the control of a microcomputer 11 (control device), which will be described later. - As the
staining solution 18u for staining non-nucleated components, a fluorescent dye that is more easily bonded to lipids and proteins of cell membranes than to nucleic acids is selected. Such a dye is preferably a dye that does not affect the forms of red blood cells, among cyanine-based, styryl-based, and acridine-based dyes. The dye that stains non-nucleated physical components is preferably a lipid-soluble carbocyanine dye, particularly preferably an indocarbocyanine dye, an oxacarbocyanine dye, or the like. Specific examples of the indocarbocyanine dye include DiI (1,1'-dioctadecyl-3,3,3',3' -tetramethylindocarbocyanine perchlorate), DiD (1,1'-dioctadecyl-3,3,3',3'-tetramethylindodicarbocyanine), DiR (1,1 '-dioctadecyltetramethyl indotricarbocyanine iodide), and the like. Examples of the oxacarbocyanine dye include DiOC2(3) (3,3'-diethyloxacarbocyanine iodide), DiOC3(3) (3,3-dipropyloxacarbocyanine iodide), DiOC4(3) (3,3'-dibutyloxacarbocyanine iodide), DiOC5(3) (3,3-dipentyloxacarbocyanine iodide), and the like. The dye that stains non-nucleated components used in this embodiment is particularly preferably DiOC3(3) (3,3-dipropyloxacarbocyanine iodide). - The diluting
solution 19u is a reagent that consists primarily of buffer. The dilutingsolution 19u contains an osmotic pressure compensating agent in order to obtain stable fluorescence signals without hemolyzing red blood cells. The osmotic pressure of thediluting solution 19u is adjusted to 100 to 600 mOsm/kg so as to be suitable for classification and measurement. When the urine specimen, thestaining solution 18u, and thediluting solution 19u are mixed, cell membranes or proteins of non-nucleated components are stained. - As the
staining solution 18b for staining nucleated components, a fluorescent dye that is more easily bonded to nucleic acids than to lipids and proteins is selected. More specifically, thestaining solution 18b contains an intercalator or a dye that can be bonded to minor grooves for specifically staining nucleic acids. Examples of the intercalator include known dyes such as cyanine-based, acridine-based, and phenanthridium-based dyes. Examples of the cyanine-based intercalator include SYBR Green I and Thiazole orange. Examples of the acridine-based intercalator include Acridinorange. Examples of the phenanthridium-based intercalator include propidium iodide and ethidium bromide. Examples of the dye that can be bonded to minor grooves include known dyes such as DAPI and Hoechst. Examples of the Hoechst dye that can be bonded to minor grooves include Hoechst 33342 and Hoechst 33258. In this embodiment, thestaining solution 18b preferably contains a cyanine-based intercalator, particularly preferably SYBR GreenI or Thiazole orange. - The diluting
solution 19b contains a cationic surfactant for facilitating membrane penetration of thestaining solution 18b by damaging cell membranes, and for hemolyzing red blood cells and making impurities such as red blood cell fragments smaller. The dilutingsolution 19b may contain a nonionic surfactant instead of the cationic surfactant. When the urine specimen, thestaining solution 18b, and the dilutingsolution 19b are mixed, in-urine physical components having nucleic acids are stained to levels corresponding to their configurations and characteristics. - As described above, the diluting
solution 19b contains a surfactant having a hemolytic action. Accordingly, red blood cells contained in a urine specimen can be hemolyzed, and non-nucleated components can be precisely measured even in a urine specimen containing a large amount of red blood cells. Furthermore, in measurement of nucleated components, a reagent having a hemolytic action is used, so that cell membranes can be damaged, and nucleic acids can be efficiently stained. This aspect also contributes to improvement in the precision of measurement of nucleated components. - The urine
specimen analysis device 100 of this embodiment prepares, from one urine specimen, a first measurement sample for measuring non-nucleated components in urine and a second measurement sample for measuring nucleated components in urine. The urinespecimen analysis device 100 measures non-nucleated components such as red blood cells using the first measurement sample, and measures nucleated cells such as white blood cells using the second measurement sample. The first measurement sample contains a fluorescent dye that easily stains lipids or proteins of cell membranes. The second measurement sample contains a fluorescent dye that easily stains nucleic acids. Thus, according to this embodiment, in-urine particles can be precisely classified or identified using differences in the characteristics of cells, that is, the stain levels according to the nucleic acid amount and the membrane stainability, without the influence of changes in the cell forms. Although in-urine particles may be damaged when passing through a glomerulus or may be deformed due to a change in the osmotic pressure when passing through a ureter, according to this embodiment, precise analysis can be performed using differences in the stainability, without the influence of changes in the particle forms. - In this embodiment, one
optical detection portion 5 is used for both measurement of the first measurement sample and measurement of the second measurement sample. Accordingly, the device configuration can be simplified, and the device can be made smaller. -
FIG. 3 is a diagram showing the configuration of theoptical detection portion 5. Acondenser lens 52 converges laser light emitted from a semiconductorlaser light source 53, on theflow cell 51. A converginglens 54 converges forward scattered light emitted from physical components in a measurement sample, on a first scatteredlight receiving portion 55 configured by a photodiode. Another converginglens 56 converges side scattered light and fluorescence emitted from the physical components, on adichroic mirror 57. Thedichroic mirror 57 reflects the side scattered light to a second scatteredlight receiving portion 58 configured by a photomultiplier tube, and allows the fluorescence to pass therethrough toward afluorescence receiving portion 59 configured by a photomultiplier tube. The first scatteredlight receiving portion 55, the second scatteredlight receiving portion 58, and thefluorescence receiving portion 59 convert optical signals into electrical signals, and respectively output a forward scattered light signal (hereinafter, referred to as "FSC"), a side scattered light signal (hereinafter, referred to as "SSC"), and a fluorescence signal (hereinafter, referred to as "FL"). The first scatteredlight receiving portion 55, thefluorescence receiving portion 59, and the second scatteredlight receiving portion 58 can switch the amplification factor at the time of photoelectric conversion, that is, the light sensitivity between a low sensitivity and a high sensitivity by switching the drive voltage. The light sensitivity is switched by amicrocomputer 11, which will be described later. - Note that, as the light source, a gas laser light source also can be used instead of the semiconductor laser light source, but the semiconductor laser light source is preferably used because the cost is lower, the size is smaller, and the power consumption is lower.
-
FIG. 4 is a block diagram showing the configuration of the urinespecimen analysis device 100. In the diagram, themeasurement unit 10 includes thespecimen drawing portion 1, thesample preparing portion 2, and theoptical detection portion 5 described above, as well as anamplifier circuit 50 that amplifies an output signal of theoptical detection portion 5, afilter circuit 6 that performs filtering processing on an output signal from theamplifier circuit 50, an A/D converter 7 that converts an output signal (analog signal) of thefilter circuit 6 into a digital signal, a digitalsignal processing circuit 8 that performs predetermined waveform processing on the digital signal, amemory 9 that is connected to the digitalsignal processing circuit 8, themicrocomputer 11 that is connected to thesample preparing portion 2, theamplifier circuit 50, and the digitalsignal processing circuit 8, and aLAN adapter 12 that is connected to themicrocomputer 11. Theinformation processing portion 13 is connected via theLAN adapter 12 to themeasurement unit 10 through a LAN cable. Theinformation processing portion 13 analyzes measurement data obtained by themeasurement unit 10. Theoptical detection portion 5, theamplifier circuit 50, thefilter circuit 6, the A/D converter 7, the digitalsignal processing circuit 8, and thememory 9 form a measurement portion 10a that measures a measurement sample, thereby generating measurement data. - The
optical detection portion 5 amplifies each of the FSC, SSC, and FL signals using a preamplifier. Each amplified signal is input via a signal channel to theamplifier circuit 50. An FSC signal channel is connected to a main amplifier (FSC amplifier) for amplifying FSC. An SSC signal channel is connected to a main amplifier (SSC amplifier) for amplifying SSC. An FL signal channel is branched into two channels between the preamplifier and theamplifier circuit 50. One of the signal channels is connected to a main amplifier with a high amplification factor of theamplifier circuit 50. The other signal channel is connected to a main amplifier with a low amplification factor. Accordingly, FLH amplified at a high amplification factor and FLL amplified at a low amplification factor are obtained from FL corresponding to one particle. Hereinafter, the main amplifier with a high amplification factor is referred to as an FLH amplifier and FL input to the FLH amplifier is referred to as "FLH". Also, the main amplifier with a low amplification factor is referred to as an FLL amplifier, and FL input to the FLL amplifier is referred to as "FLL". - The
amplifier circuit 50 amplifies four types of signals consisting of FSC, SSC, FLH, and FLL, according to a set gain. Theamplifier circuit 50 can set a plurality of different gains. Themicrocomputer 11 can individually adjust the gain of each preamplifier of theamplifier circuit 50 in a stepwise manner. The gain can be set among three levels consisting of low level, middle level, and high level. The high level has the highest gain, and the low level has the lowest gain. -
FIG. 5 is a block diagram showing the configuration of theinformation processing portion 13. Theinformation processing portion 13 is configured by a personal computer, including amain unit 400, aninput portion 408, and adisplay portion 409. Themain unit 400 has aCPU 401, aROM 402, aRAM 403, ahard disk 404, areading device 405, an input/output interface 406, animage output interface 407, and acommunication interface 410. - The
CPU 401 executes a computer program stored in theROM 402 and a computer program loaded into theRAM 402. TheRAM 403 is used to read a computer program stored in theROM 402 and thehard disk 404. TheRAM 403 is used also as a working area of theCPU 401 during execution of these computer programs. - In the
hard disk 404, various computer programs that are to be executed by theCPU 401 and data that can be used to execute the computer programs, such as operating systems and application programs, are installed. That is to say, in thehard disk 404, computer programs for analyzing measurement data given from themeasurement unit 10 and outputting analysis results are installed. - The
reading device 405 is configured by a CD drive, a DVD drive, or the like, and can read computer programs and data stored in a storage medium. The input/output interface 406 is connected to theinput portion 408 including a mouse and a keyboard, and, when a user uses theinput portion 408, data is input to theinformation processing portion 13. Theimage output interface 407 is connected to thedisplay portion 409 configured by a liquid crystal panel or the like, and outputs video signals according to image data to thedisplay portion 409. Thedisplay portion 409 displays an image based on the input video signals. Furthermore, theinformation processing portion 13 is connected via thecommunication interface 410 to themeasurement unit 10, and can exchange data with themeasurement unit 10 via thecommunication interface 410. - Hereinafter, an operation of the urine specimen analysis device according to this embodiment will be described.
-
FIG. 6 is a flowchart showing a procedure of specimen measurement processing of the urinespecimen analysis device 100. First, an instruction to perform measurement is input by a user via theinput portion 408 of the information processing portion 13 (Step S101). Upon receiving this instruction, theCPU 401 transmits instruction data for giving themeasurement unit 10 an instruction to start measurement (Step S102). If themeasurement unit 10 receives the instruction data (Step S103), themicrocomputer 11 performs measurement sample preparation processing (Step S104), non-nucleated component measurement processing (Step S105), and nucleated component measurement processing (Step S106). -
FIG. 7 is a flowchart showing a procedure of the measurement sample preparation processing. In the measurement sample preparation processing, first, themicrocomputer 11 controls thespecimen drawing portion 1 so that a predetermined amount of urine specimen is sucked from the test tube T into thesuction tube 17. Themicrocomputer 11 controls thespecimen drawing portion 1 so that a predetermined amount of urine specimen aliquot is dispensed to each of thereaction tank 2u and thereaction tank 2b (Steps S201 and S202). - The
microcomputer 11 controls thesample preparing portion 2 so that the following steps S203 to S207 are performed. In steps S203 and S204, a predetermined amount of dilutingsolution 19u andstaining solution 18u are taken out and dispensed into thereaction tank 2u (Steps S203 and S204). In steps S205 and S206, a predetermined amount of dilutingsolution 19b andstaining solution 18b are taken out and dispensed into thereaction tank 2b (Steps S205 and S206). Each of thereaction tank 2u and thereaction tank 2b is heated by an unshown heater to a predetermined temperature, and, in this state, the mixture in each tank is stirred by a propeller-like stirrer (not shown) (Step S207). Accordingly, a first measurement sample for measuring non-nucleated components is prepared in thereaction tank 2u, and a second measurement sample for measuring nucleated components is prepared in thereaction tank 2b. If the process in step S207 ends, themicrocomputer 11 returns the procedure to the main routine. -
FIG. 8 is a flowchart showing a procedure of non-nucleated component measurement processing. In the non-nucleated component measurement processing, first, themicrocomputer 11 sets the light sensitivity of theoptical detection portion 5 and the gain of theamplifier circuit 50 to a first set value for measuring non-nucleated components (Step S301). - Each of the first set value and a second and a third set value, which will be described later, contains a value of the light sensitivity of each light receiving portion of the
optical detection portion 5 and a value of the gain of theamplifier circuit 50. Hereinafter, the values are distinguished from each other by referring to the former as "light sensitivity" and the latter as "gain". The amplification factor of a signal is determined by the product of these values. Hereinafter, a value determined by the product of the light sensitivity and the gain is referred to as an "amplification factor". - If the first set value is set, the light sensitivity of the
optical detection portion 5 is set to the low sensitivity. Furthermore, the gain of the FSC amplifier is set to the middle level. The FLL amplifier is set to the middle level. The FLH amplifier is set to the low level. The FLH amplification factor determined by the first set value is lower than an FLH2 amplification factor determined by the third set value, which will be described later. - The
microcomputer 11 sends a sheath liquid to theflow cell 51 by driving an unshown compressor (Step S302). In a state where the sheath liquid is continuously supplied to theflow cell 51, themicrocomputer 11 supplies the first measurement sample from thereaction tank 2u to the flow cell 51 (Step S303). - Accordingly, the sheath liquid and the first measurement sample are simultaneously supplied to the
flow cell 51, and a flow of the first measurement sample enclosed in the sheath liquid is formed in theflow cell 51. The thus formed sample flow is irradiated with a laser beam from the light source 53 (Step S304), and a beam spot is formed on theflow cell 51. When particles pass through the beam spot on theflow cell 51, the particles are irradiated with light from thelight source 53, and forward scattered light, fluorescence, and side scattered light are generated from the particles. The forward scattered light, the fluorescence, and the side scattered light are respectively received by the first scatteredlight receiving portion 55, thefluorescence receiving portion 59, and the second scatteredlight receiving portion 58, and are converted into electrical signals (Step S305). Accordingly, each time particles pass through theflow cell 51, output signals of the first scatteredlight receiving portion 55, the second scatteredlight receiving portion 59, and thefluorescence receiving portion 58 change in a pulsed manner. - The electrical signals corresponding to the light receiving levels of the first scattered
light receiving portion 55 and the second scatteredlight receiving portion 58 are output as FSC and SSC. The electrical signals corresponding to the light receiving levels of thefluorescence receiving portion 59 are output as two signals consisting of FLH and FLL. At that time, FSC, SSC, FLH, and FLL are output at the light sensitivity (low sensitivity) determined by the first set value set in step S301. The output signals are amplified by the main amplifier of theamplifier circuit 50 at the gain determined by the first set value. - Accordingly, four types of optical signals consisting of a low-sensitivity fluorescence signal (hereinafter, referred to as FLL), a high-sensitivity fluorescence signal (hereinafter, referred to as FLH), FSC, and SSC are obtained from each particle of the first measurement sample.
- The FSC, FLL, FLH, and SSC amplified by the
amplifier circuit 50 set to the first set value are subjected to filtering processing by thefilter circuit 6. These signals are converted by the A/D converter 7 into digital signals, and are subjected to predetermined signal processing by the digitalsignal processing circuit 8. - The digital
signal processing circuit 8 performs signal processing, thereby extracting parameters used in analysis processing, from the optical signals (FSC, SSC, FLL, and FLH). The analysis parameters include a forward scattered light intensity (hereinafter, referred to as "FSCP"), a pulse width of the forward scattered light (hereinafter, referred to as "FSCW"), a side scattered light intensity (hereinafter, referred to as "SSCP"), a low-sensitivity fluorescence intensity (hereinafter, referred to as "FLLP"), a pulse width of the low-sensitivity fluorescence signal (hereinafter, referred to as "FLLW"), a pulse area of the low-sensitivity fluorescence signal (hereinafter, referred to as "FLLA"), a high-sensitivity fluorescence intensity (hereinafter, referred to as "FLHP"), a pulse width of the high-sensitivity fluorescence signal (hereinafter, referred to as "FLHW"), and a pulse area of the high-sensitivity fluorescence signal (hereinafter, referred to as "FLHA"). - Hereinafter, extraction of analysis parameters will be described with reference to
FIGS. 9A to 9C . There are three types of analysis parameters consisting of "intensity", "pulse width", and "pulse area" for each optical signal. The intensity is represented by P. The pulse width is represented by W. The pulse area is represented by A. As described above, each time particles pass through theflow cell 51, electrical signals output from the light receiving portions change in a pulsed manner according to the characteristics of the particles. Each of the intensities of the optical signals such as FSCP, SSCP, FLLP, and FLHP is obtained as a pulse peak height P as shown inFIG. 9A . Each of the pulse widths of the optical signals such as FSCW, FLLW, and FLHW is obtained as an interval W from a time T1 when a pulse exceeds a predetermined threshold to a time T2 when the pulse drops below the threshold as shown inFIG. 9B . Each of the pulse areas of the optical signals such as FLLA and FLHA is obtained as an area of a region PA (region indicated by diagonal lines in the diagram) defined by a signal pulse waveform line L1, straight lines L2 and L3 indicating the times when the optical signal intensity is at a predetermined threshold, on both sides of the pulse, and a straight line L4 at which the optical signal intensity is 0, as shown inFIG. 9C , that is, as the time integral value of the signal intensity. - Note that the above-described method for extracting analysis parameters is merely an example, and other extraction methods may be used. The pulse area may be an approximate as long as it is a value reflecting the area under the pulse time curve, and is not limited to the time integral value. For example, the pulse area may be the product of the pulse width and the peak height, or may be the triangle area obtained from the pulse width and the peak height. Furthermore, when extracting the time integral value, the base may not be a straight line at which the intensity is 0, and may be set as appropriate. For example, the base may be at the predetermined threshold shown in
FIG. 9C , or may be at a reference value that can be determined at the pulse value obtained when only the sheath liquid flows through theflow cell 51. - Reference is again made to
FIG. 8 . The parameters extracted from the optical signals as described above are stored as measurement data in the memory 9 (Step S306). When the above-described procedure ends, themicrocomputer 11 returns the procedure to the main routine. -
FIG. 10 is a flowchart showing a procedure of nucleated component measurement processing. In the nucleated component measurement processing, first, themicrocomputer 11 sets the light sensitivity of theoptical detection portion 5 and the gain of theamplifier circuit 50 to a second set value (Step S311). The second set value is a set value for measuring nucleated components such as white blood cells, epithelial cells, and fungi. - If the second set value is set, the light sensitivity of the
optical detection portion 5 is set to the low sensitivity. Furthermore, the FSC amplifier is set to the low level. The FLL amplifier is set to the low level. The FLH amplifier is set to the middle level. The FLH amplification factor determined by the second set value is lower than an FLH2 amplification factor determined by the third set value, which will be described later. - Next, the
microcomputer 11 sends a sheath liquid to theflow cell 51 by driving an unshown compressor (Step S312). In a state where the sheath liquid is continuously supplied to theflow cell 51, themicrocomputer 11 supplies the second measurement sample from thereaction tank 2b to the flow cell 51 (Step S313). - Accordingly, the sheath liquid and the second measurement sample are simultaneously supplied to the
flow cell 51, and a flow of the second measurement sample enclosed in the sheath liquid is formed in theflow cell 51. The thus formed sample flow is irradiated with a laser beam from the light source 53 (Step S314). Accordingly, forward scattered light, fluorescence, and side scattered light are generated from the nucleated cells. The forward scattered light, the fluorescence, and the side scattered light are respectively received by the first scatteredlight receiving portion 55, thefluorescence receiving portion 59, and the second scatteredlight receiving portion 58, and are converted into electrical signals (Step S315). - The
optical detection portion 5 outputs FSC, FLH, FLL, and SSC at the light sensitivity determined by the second set value. The output signals are amplified by theamplifier circuit 50 at the gain determined by the second set value. - Accordingly, four types of optical signals consisting of a low-sensitivity fluorescence signal FLL, a first high-sensitivity fluorescence signal (hereinafter, referred to as "FLH1"), FSC, and SSC are obtained from each particle of the second measurement sample.
- The amplified signals are subjected to filtering processing by the
filter circuit 6. These signals are converted by the A/D converter 7 into digital signals, and are subjected to predetermined signal processing by the digitalsignal processing circuit 8. With this signal processing, an FSC peak value is extracted as FSCP. An FSC pulse width is extracted as FSCW. An SSC peak value is extracted as SSCP. An FLL peak value is extracted as FLLP. An FLL pulse width is extracted as FLLW. An FLL pulse area is extracted as FLLA. An FLH1 peak value is extracted as a first high-sensitivity fluorescence intensity (hereinafter, referred to as "FLHP 1"). An FLH1 pulse width is extracted as a first high-sensitivity fluorescence pulse width (hereinafter, referred to as "FLHW1"). An FLH1 pulse area is extracted as a first high-sensitivity fluorescence pulse area (hereinafter, referred to as "FLHA1 "). Data of the extracted parameters is stored as measurement data in the memory 9 (Step S316). - When a predetermined period of time has passed after the supply of the second measurement sample to the
flow cell 51 is started, themicrocomputer 11 changes the light sensitivity of theoptical detection portion 5 and the gain of theamplifier circuit 50 to a third set value (Step S317). The third set value is a set value for measuring bacteria. - If the third set value is set, the light sensitivity of the
optical detection portion 5 is set to the high sensitivity. Furthermore, the FSC amplifier is set to the high level. The FLH amplifier is set to the high level. The FLL amplifier is not used. - The light sensitivity (high sensitivity) of the
fluorescence receiving portion 59 at the third set value is five times the light sensitivity (low sensitivity) of thefluorescence receiving portion 59 at the second set value. The reason for this is that a bacterium has a size smaller than that of any other nucleated cell, and therefore has a fluorescence amount smaller than that in measurement of any other nucleated cell. When the light sensitivity of thefluorescence receiving portion 59 at the third set value is set to be higher than the light sensitivity at the second set value, the light sensitivity becomes suitable for bacteria, and a trace amount of fluorescence emitted from bacteria can be precisely detected. Furthermore, when the gain of the FSC amplifier at the third set value is set to the high level, very small bacteria can be precisely detected. - In a state where the
optical detection portion 5 and theamplifier circuit 50 is set to the third set value, the second measurement sample is measured (Step S318). Accordingly, theoptical detection portion 5 outputs signals at the light sensitivity determined by the third set value, and the output signals are amplified by theamplifier circuit 50 at the gain determined by the third set value. The FLH output from theoptical detection portion 5 when the third set value is set is amplified by the FLH amplifier of theamplifier circuit 50 and is obtained as a second high-sensitivity fluorescence signal (hereinafter, referred to as "FLH2"). - Accordingly, two types of optical signals consisting of a second high-sensitivity fluorescence signal FLH2 and FSC are obtained from each particle of the second measurement sample.
- The FSC and FLH2 amplified by the
amplifier circuit 50 are subjected to filtering processing by thefilter circuit 6, and are then converted by the A/D converter 7 into digital signals and subjected to predetermined signal processing by the digitalsignal processing circuit 8. With this signal processing, an FSC peak is extracted as FSCP. An FSC pulse width is extracted as FSCW. An SSC peak value is extracted as SSCP. FLH2 peak value is extracted as a second high-sensitivity fluorescence intensity (hereinafter, referred to as "FLHP2"). An FLH2 pulse width is extracted as a second high-sensitivity fluorescence pulse width (hereinafter, referred to as "FLHW2"). An FLH2 pulse area is extracted as a second high-sensitivity fluorescence pulse area (hereinafter, referred to as "FLHA2"). Data of the extracted parameters is stored as measurement data in the memory 9 (Step S319). When the above-described procedure ends, themicrocomputer 11 returns the procedure to the main routine. - After the nucleated component measurement processing, the
microcomputer 11 transmits the measurement data generated by the non-nucleated component measurement processing and the nucleated component measurement processing, to the information processing portion 13 (Step S107), and ends the procedure. - If the
information processing portion 13 receives the measurement data (Step S108), theCPU 401 performs measurement data analysis processing (Step S109), thereby generating a urine specimen analysis result, and stores the analysis result in thehard disk 404.FIG. 11 is a flowchart showing a procedure of measurement data analysis processing. The measurement data analysis processing includes first non-nucleated component classification processing (Step S401), second non-nucleated component classification processing (Step S402), first nucleated component classification processing (Step S403), second nucleated component classification processing (Step S404), and bacteria detection processing (Step S405). - In the first non-nucleated component classification processing S401, red blood cells and crystals are detected using the FSC and FLH obtained by measuring the first measurement sample, and the numbers thereof are counted. Red blood cells and crystals are detected using FLH, because each of them is less stainable than any of a cast, a mucus thread, and the like, and therefore has a smaller fluorescence amount.
FIG. 12 is a diagram showing distributions of red blood cells and crystals in FLHP-FSCP space. InFIG. 12 , the horizontal axis indicates FLHP, and the vertical axis indicates FSCP. As shown in the diagram, a difference is seen in FLHP between a red blood cell distribution region R11 and a crystal distribution region R12. The reason for this is that there is a difference in the dye stainability between a crystal and a red blood cell. Accordingly, red blood cells and crystals are classified based on FLHP. In the first non-nucleated component classification processing, particles contained in the region R11 shown in the diagram are detected as red blood cells, and the number thereof is counted. Furthermore, particles contained in the region R12 shown in the diagram are detected as crystals, and the number thereof is counted. -
FIGS. 13A and13B show specific detection results in the first non-nucleated component classification processing S401.FIG. 13A is a scattergram showing an exemplary detection result of red blood cells, andFIG. 13B is a scattergram showing an exemplary detection result of crystals.FIG. 13A shows a result obtained by measuring a specimen containing red blood cells, andFIG. 13B shows a result obtained by measuring a specimen containing crystals. - In the second non-nucleated component classification processing S402, casts and mucus threads are detected using the FLL obtained by measuring the first measurement sample, and the numbers thereof are counted. Casts and mucus threads are detected using FLL, because each of them is more stainable than any of a red blood cell and a crystal, and therefore has a larger fluorescence amount.
FIG. 14 is a diagram showing distributions of casts and mucus threads in FLLW-FLLA space. In the diagram, the horizontal axis indicates FLLW, and the vertical axis indicates FLLA. As shown in the diagram, in the FLLW-FLLA region, casts and mucus threads appear in different regions R21 and R22. The reason for this is that there is a difference in the stainability and the thickness of stained substrate, between a cast and a mucus thread. Accordingly, casts and mucus threads are classified based on FLLW and FLLA. In the second non-nucleated component classification processing, particles contained in the region R21 shown in the diagram are detected as casts, and the number thereof is counted. Furthermore, particles contained in the region R22 shown in the diagram are detected as mucus threads, and the number thereof is counted. -
FIGS. 15A and 15B show specific detection results in the second non-nucleated component classification processing S402.FIG. 15A is a scattergram showing an exemplary detection result of casts, andFIG. 15B is a scattergram showing an exemplary detection result of mucus threads.FIG. 15A shows a result obtained by measuring a specimen containing casts, andFIG. 15B shows a result obtained by measuring a specimen containing mucus threads. - Next, in-urine cells having nucleic acids are classified by the first nucleated component classification processing, the second nucleated component classification processing, and the bacteria detection processing.
- In the first nucleated component classification processing S403, atypical cells, white blood cells, and epithelial cells are detected using the FSC and FLL obtained by measuring the second measurement sample, and the numbers thereof are counted. Atypical cells, white blood cells, and epithelial cells are detected using FLL, because each of them has a nucleic acid amount larger than that of any of a sperm, Trichomonas vaginalis, a fungus, and the like, and therefore has a larger fluorescence amount.
FIG. 16 is a diagram showing distributions of white blood cells, atypical cells, and epithelial cells in FLLA-FSCW space. In the diagram, the horizontal axis indicates FLLA, and the vertical axis indicates FSCW. As shown in the diagram, a difference is seen in FLLA between white blood cells and epithelial cells, and atypical cells. The reason for this is that there is substantially no difference in the nucleic acid amount between a white blood cell and an epithelial cell, and an atypical cell has a nucleic acid amount larger than that of any of a white blood cell and an epithelial cell. Furthermore, a difference is seen in FSCW between white blood cells and epithelial cells. The reason for this is that an epithelial cell has a size larger than that of a white blood cell. Accordingly, white blood cells, epithelial cells, and atypical cells are classified based on FLLA and FSCW. In the first nucleated component classification processing, particles contained in a region R31 shown in the diagram are detected as atypical cells, and the number thereof is counted. Furthermore, particles contained in a region R32 shown in the diagram are detected as white blood cells, and the number thereof is counted. Furthermore, particles contained in a region R33 shown in the diagram are detected as epithelial cells, and the number thereof is counted. -
FIGS. 17A to 17C show specific detection results in the first nucleated component classification processing S403.FIG. 17A is a scattergram showing an exemplary detection result of white blood cells,FIG. 17B is a scattergram showing an exemplary detection result of epithelial cells, andFIG. 17C is a scattergram showing an exemplary detection result of atypical cells.FIG. 17A shows a result obtained by measuring a specimen containing white blood cells,FIG. 17B shows a result obtained by measuring a specimen containing epithelial cells, andFIG. 17C shows a result obtained by measuring a specimen containing atypical cells. - In the second nucleated component classification processing S404, sperm, Trichomonas vaginalis, and fungi are detected using the FSC and FLH1 obtained by measuring the second measurement sample, and the numbers thereof are counted.
FIG. 18 is a diagram showing distributions of sperm, Trichomonas vaginalis, and fungi in FLHP1-FSCP space. Sperm, Trichomonas vaginalis, and fungi are detected using FLH1, because each of them has a nucleic acid amount smaller than that of any of a white blood cell, an epithelial cell, and an atypical cell, and therefore has a smaller fluorescence amount. In the diagram, the horizontal axis indicates FLHP1, and the vertical axis indicates FSCP. As shown in the diagram, distribution regions of sperm, fungi, and Trichomonas vaginalis in FLHP 1-FSCP space are different. The reason for this is that there is a difference in the nucleic acid amount and in the size between a sperm, a fungus, and Trichomonas vaginalis. Accordingly, sperm, Trichomonas vaginalis, and fungi are classified based on FLHP1 and FSCP. In the second nucleated component classification processing, particles contained in a region R41 shown in the diagram are detected as sperm, and the number thereof is counted. Furthermore, particles contained in a region R42 shown in the diagram are detected as fungi, and the number thereof is counted. Furthermore, particles contained in a region R43 shown in the diagram are detected as Trichomonas vaginalis, and the number thereof is counted. -
FIGS. 19A to 19C show specific detection results in the second nucleated component classification processing S404.FIG. 19A is a scattergram showing an exemplary detection result of fungi,FIG. 19B is a scattergram showing an exemplary detection result of Trichomonas vaginalis, andFIG. 19C is a scattergram showing an exemplary detection result of sperm.FIG. 19A shows a result obtained by measuring a specimen containing fungi,FIG. 19B shows a result obtained by measuring a specimen containing Trichomonas vaginalis, andFIG. 19C shows a result obtained by measuring a specimen containing sperm. - In the bacteria detection processing S405, bacteria are detected using the FSC and FLH2 obtained by measuring the second measurement sample, and the number thereof is counted. A bacterium has a significantly smaller size and a smaller nucleic acid amount than any other nucleated cell such as a white blood cell, and therefore has a very small fluorescence amount. Accordingly, bacteria are detected using FLH2.
FIG. 20 is a diagram showing a distribution of bacteria in FLHP2-FSCP space. In the diagram, the horizontal axis indicates FLHP2, and the vertical axis indicates FSCP. As shown in the diagram, bacteria appear in a predetermined region R5. Other nucleated cells such as white blood cells (not shown) appear in a region having a fluorescence intensity higher than that of the region R5. Furthermore, impurities not having nucleic acids (not shown) appear in a region having a fluorescence intensity lower than that of the region R5. In the bacteria detection processing, particles contained in the region R5 shown in the diagram are detected as bacteria, and the number thereof is counted. -
FIG. 21 shows a specific detection result in the bacteria detection processing S405.FIG. 21 is a scattergram showing an exemplary detection result of bacteria.FIG. 21 shows a result obtained by measuring a specimen containing bacteria. - If the measurement data analysis processing ends, the
CPU 401 returns the procedure to the main routine. - The
CPU 401 displays an analysis result obtained by this measurement data analysis processing, on the display portion 409 (Step S110), and ends the procedure. - Although the foregoing embodiment described, as an example, a configuration in which red blood cells, casts, crystals, and mucus threads are detected from the first measurement sample, the present invention is not limited to this. Any configuration is possible as long as at least red blood cells are detected as particles not having nucleic acids. In addition to red blood cells, casts, crystals, or mucus threads may be optionally detected.
- Although the foregoing embodiment described a configuration in which white blood cells, epithelial cells, atypical cells, sperm, Trichomonas vaginalis, fungi, and bacteria are detected from the second measurement sample, the present invention is not limited to this. Any configuration is possible as long as at least white blood cells are detected as cells having nucleic acids. In addition to white blood cells, epithelial cells, atypical cells, sperm, Trichomonas vaginalis, fungi, or bacteria may be optionally detected.
- Although the foregoing embodiment described a configuration in which fluorescence signals at three sensitivities consisting of FLL, FLH1, and FLH2 are obtained from the second measurement sample, and are used to classify cells having nucleic acids into white blood cells, epithelial cells, atypical cells, sperm, Trichomonas vaginalis, fungi, and bacteria, the present invention is not limited to this. A configuration is possible in which fluorescence signals at two types of sensitivities are obtained and are used to classify cells having nucleic acids into a plurality of types, or in which one fluorescence signal is used to classify cells having nucleic acids into a plurality of types.
- Although the foregoing embodiment described a configuration in which fluorescence signals at a plurality of sensitivities are obtained by switching both of the sensitivity of the
fluorescence receiving portion 59 and the amplification factor of theamplifier circuit 50, the present invention is not limited to this. For example, a configuration is possible in which fluorescence signals at a plurality of sensitivities are obtained by switching the sensitivity of thefluorescence receiving portion 59 without switching the amplification factor of theamplifier circuit 50, or in which fluorescence signals at a plurality of sensitivities are obtained by switching the amplification factor of theamplifier circuit 50 without switching the sensitivity of thefluorescence receiving portion 59. - Although the foregoing embodiment showed an example in which the staining solution and the diluting solution are separate solutions, they may be combined into one solution.
- Although the foregoing embodiment described a configuration in which the
specimen drawing portion 1 sucks a predetermined amount of specimen by pipetting, and distributes specimen aliquots to thereaction tank 2u and thereaction tank 2b, the present invention is not limited to this. A configuration is possible in which a predetermined amount of specimen is taken out through a sampling valve from a sucked specimen, and aliquots each in that predetermined amount are supplied to thereaction tank 2u and thereaction tank 2b. - Although the foregoing embodiment described a configuration in which the measurement sample preparation processing, the non-nucleated component measurement processing, the nucleated component measurement processing, and the measurement data analysis processing are performed in this order, this order is merely an example, and the processing may be performed in other orders. For example, a configuration is possible in which after the first measurement sample is prepared, the non-nucleated component measurement processing is performed, and, then, the first non-nucleated component classification processing and the second non-nucleated component classification processing are performed, after which the second measurement sample is prepared, and the nucleated component measurement processing is performed, and, then, the first nucleated component classification processing, the second nucleated component classification processing, and the bacteria detection processing are performed. Furthermore, the order in which the measurement of the second measurement sample using the second set value and the measurement of the second measurement sample using the third set value in the nucleated component measurement processing also can be changed.
- Although the foregoing embodiment described a configuration in which the
information processing portion 13 analyzes the measurement data, the present invention is not limited to this. A configuration is also possible in which themicrocomputer 11 of themeasurement unit 10 analyzes the measurement data. -
- 1
- Specimen drawing portion
- 2
- The sample preparing portion
- 2u, 2b
- Reaction tank
- 3
- Sample rack
- 4
- Rack table
- 5
- Optical detection portion
- 10
- Measurement unit
- 11
- Microcomputer
- 13
- Information processing portion
- 18u, 18b
- Staining solution
- 19u, 19b
- Diluting solution
- 50
- Amplifier circuit
- 100
- Urine specimen analysis device
- 401
- CPU
Claims (13)
- A urine specimen analysis device (100), comprising:a specimen drawing portion (1) for drawing a first aliquot and a second aliquot from a urine specimen;a sample preparing portion (2) for preparing a first measurement sample by mixing the first aliquot and a first staining dye that stains red blood cells, and preparing a second measurement sample by mixing the second aliquot and a second staining dye that stains nucleic acids;a measurement portion (10) for measuring fluorescence emitted from the first measurement sample prepared by the sample preparing portion, and measuring fluorescence emitted from the second measurement sample prepared by the sample preparing portion; andan information processing portion (13) for detecting at least red blood cells contained in the first aliquot based on the fluorescence of the first measurement sample measured by the measurement portion, and detecting at least white blood cells contained in the second aliquot based on the fluorescence of the second measurement sample measured by the measurement portion,wherein the measurement portion (10) includes:a flow cell (51) for allowing a measurement sample to flow therethrough;a light source (53) for emitting light on the measurement sample that flows through the flow cell;a fluorescence receiving portion (59) for receiving fluorescence emitted from a particle in the measurement sample, and outputting a fluorescence signal; anda scattered light receiving portion (55, 58) for receiving scattered light emitted from a particle in the measurement sample, and outputting a scattered light signal,wherein the measurement portion (10) can amplify a signal of fluorescence received by the fluorescence receiving portion at a plurality of sensitivities, andthe information processing portion (13) is configured to detect white blood cells contained in the second aliquot, based on a fluorescence signal amplified at a low sensitivity, and detect in-urine particles smaller than white blood cells contained in the second aliquot, based on a fluorescence signal amplified at a high sensitivity.
- The urine specimen analysis device (100) according to claim 1, wherein the sample preparing portion (2) is configured to prepare the first measurement sample without hemolyzing red blood cells contained in the first aliquot, and prepare the second measurement sample while hemolyzing red blood cells contained in the second aliquot.
- The urine specimen analysis device (100) according to claim 1 or 2, wherein the information processing portion (13) is configured to distinguishably detect red blood cells and other in-urine particles not containing nucleic acids contained in the first aliquot, based on the fluorescence of the first measurement sample.
- The urine specimen analysis device (100) according to any one of claims 1 to 3, wherein the information processing portion (13) is configured to distinguishably detect white blood cells and other in-urine particles containing nucleic acids contained in the second aliquot, based on the fluorescence of the second measurement sample.
- The urine specimen analysis device (100) according to claim 1,wherein the measurement portion (10) can amplify a signal of fluorescence received by the fluorescence receiving portion at least at a first sensitivity, a second sensitivity higher than the first sensitivity, and a third sensitivity higher than the first and second sensitivities, andthe information processing portion (13) is configured to detect white blood cells in the second measurement sample based on a first fluorescence signal amplified at the first sensitivity, detect sperm or fungi in the second measurement sample based on a second fluorescence signal amplified at the second sensitivity, and detect bacteria in the second measurement sample based on a third fluorescence signal amplified at the third sensitivity.
- The urine specimen analysis device (100) according to claim 5, wherein the measurement portion (13) is configured to obtain the first and second fluorescence signals from the second measurement sample during a first period in which the measurement sample flows through the flow cell, and obtain the third fluorescence signal from the measurement sample during a second period that is before or after the first period.
- The urine specimen analysis device (100) according to claim 5, wherein the information processing portion (13) is configured to classify at least white blood cells and epithelial cells contained in the second aliquot based on the first fluorescence signal, and classify sperm and fungi contained in the second aliquot based on the second fluorescence signal.
- The urine specimen analysis device (100) according to claim 1, wherein the information processing portion (13) is configured to classify in-urine particles contained in the first aliquot into red blood cells and other in-urine particles not containing nucleic acids, based on the fluorescence signal of the first measurement sample obtained via the fluorescence receiving portion and the scattered light signal of the first measurement sample obtained via the scattered light receiving portion.
- The urine specimen analysis device (100) according to claim 8, wherein the information processing portion (13) is configured to distinguishably detect red blood cells and casts contained in the first aliquot, based on the fluorescence signal of the first measurement sample and the scattered light signal of the first measurement sample.
- The urine specimen analysis device (100) according to claim 1, wherein the information processing portion (13) is configured to distinguishably detect white blood cells and epithelial cells contained in the first aliquot, based on the fluorescence signal of the second measurement sample and the scattered light signal of the second measurement sample.
- The urine specimen analysis device (100) according to claim 1, wherein the information processing portion (13) can obtain at least a fluorescence intensity from the fluorescence signal, can obtain at least a scattered light intensity from the scattered light signal, and classifies, among particles in the first measurement sample, particles belonging to a first range determined by the fluorescence intensity and the scattered light intensity as red blood cells; or
the information processing portion (13) can obtain at least a fluorescence pulse area and a fluorescence pulse width from the fluorescence signal, and classifies, among particles in the first measurement sample, particles belonging to a second range determined by the fluorescence pulse area and the fluorescence pulse width as casts. - The urine specimen analysis device (100) according to claim 5, wherein the information processing portion (13) can obtain at least a fluorescence pulse area from the first fluorescence signal, can obtain at least a scattered light pulse width from the scattered light signal, and classifies, among particles in the second measurement sample, particles belonging to a third range determined by the fluorescence pulse area of the first fluorescence signal and the scattered light pulse width as white blood cells; orclassifies, among particles in the second measurement sample, particles belonging to a fourth range determined by the fluorescence pulse area of the first fluorescence signal and the scattered light pulse width as epithelial cells; orthe information processing portion (13) can obtain at least a fluorescence intensity from the second fluorescence signal, can obtain at least a scattered light intensity from the scattered light signal, and classifies, among particles in the second measurement sample, particles belonging to a fifth range determined by the fluorescence intensity of the second fluorescence signal and the scattered light pulse width as sperm orclassifies, among particles in the second measurement sample, particles belonging to a sixth range determined by the fluorescence intensity of the second fluorescence signal and the scattered light pulse width as fungi; orthe information processing portion (13) can obtain at least a fluorescence intensity from the third fluorescence signal, can obtain at least a scattered light intensity from the scattered light signal output from the scattered light receiving portion, and classifies, among particles in the second measurement sample, particles belonging to a seventh range determined by the fluorescence intensity of the third fluorescence signal and the scattered light intensity as bacteria.
- A urine specimen analysis method, comprising:drawing (S201, S202) a first aliquot and a second aliquot from a urine specimen;preparing (S203, S204) a first measurement sample by mixing the first aliquot and a first staining dye that stains red blood cells;measuring (S305) first fluorescence emitted from the prepared first measurement sample;detecting (S401) at least red blood cells contained in the first aliquot based on the measured first fluorescence;preparing (S205, S206) a second measurement sample by mixing the second aliquot and a second staining dye that stains nucleic acids;measuring (S315, S318) second fluorescence emitted from the prepared second measurement sample;detecting at least white blood cells contained in the second aliquot based on the measured second fluorescence; anddetecting white blood cells contained in the second aliquot, based on a fluorescence signal amplified at a low sensitivity, and detect in-urine particles smaller than white blood cells contained in the second aliquot, based on a fluorescence signal amplified at a high sensitivity.
Priority Applications (1)
| Application Number | Priority Date | Filing Date | Title |
|---|---|---|---|
| EP23161429.8A EP4220158A3 (en) | 2013-02-28 | 2014-02-28 | Urine specimen analysis device and urine specimen analysis method |
Applications Claiming Priority (2)
| Application Number | Priority Date | Filing Date | Title |
|---|---|---|---|
| JP2013039747 | 2013-02-28 | ||
| PCT/JP2014/055168 WO2014133160A1 (en) | 2013-02-28 | 2014-02-28 | Urine sample analysis device and urine sample analysis method |
Related Child Applications (1)
| Application Number | Title | Priority Date | Filing Date |
|---|---|---|---|
| EP23161429.8A Division EP4220158A3 (en) | 2013-02-28 | 2014-02-28 | Urine specimen analysis device and urine specimen analysis method |
Publications (3)
| Publication Number | Publication Date |
|---|---|
| EP2963418A1 EP2963418A1 (en) | 2016-01-06 |
| EP2963418A4 EP2963418A4 (en) | 2016-10-26 |
| EP2963418B1 true EP2963418B1 (en) | 2023-04-12 |
Family
ID=51428418
Family Applications (2)
| Application Number | Title | Priority Date | Filing Date |
|---|---|---|---|
| EP14756669.9A Active EP2963418B1 (en) | 2013-02-28 | 2014-02-28 | Urine sample analysis device and urine sample analysis method |
| EP23161429.8A Pending EP4220158A3 (en) | 2013-02-28 | 2014-02-28 | Urine specimen analysis device and urine specimen analysis method |
Family Applications After (1)
| Application Number | Title | Priority Date | Filing Date |
|---|---|---|---|
| EP23161429.8A Pending EP4220158A3 (en) | 2013-02-28 | 2014-02-28 | Urine specimen analysis device and urine specimen analysis method |
Country Status (7)
| Country | Link |
|---|---|
| US (1) | US9835559B2 (en) |
| EP (2) | EP2963418B1 (en) |
| JP (1) | JP6232046B2 (en) |
| KR (1) | KR101885417B1 (en) |
| CN (1) | CN105026928B (en) |
| BR (1) | BR112015020370A2 (en) |
| WO (1) | WO2014133160A1 (en) |
Families Citing this family (12)
| Publication number | Priority date | Publication date | Assignee | Title |
|---|---|---|---|---|
| CN106104270B (en) | 2014-02-28 | 2019-08-02 | 希森美康株式会社 | Urine sample analysis method, urine sample analysis reagent and urine sample analysis kit |
| JP6116502B2 (en) | 2014-02-28 | 2017-04-19 | シスメックス株式会社 | Sample analyzer and sample analysis method |
| KR102024497B1 (en) * | 2014-02-28 | 2019-09-23 | 시스멕스 가부시키가이샤 | Method for urine sample analysis, reagent for urine sample analysis, and reagent kit for urine sample analysis |
| JP6238856B2 (en) | 2014-08-25 | 2017-11-29 | シスメックス株式会社 | Urine atypical cell analysis method, urine analyzer, and body fluid atypical cell analysis method |
| JP6352871B2 (en) | 2015-08-28 | 2018-07-04 | シスメックス株式会社 | Urine sample analyzer and urine sample analysis method |
| CN109154549B (en) * | 2015-12-18 | 2021-08-20 | 雅培实验室 | Particle detection method and system for implementing the same |
| US20190187125A1 (en) * | 2016-08-18 | 2019-06-20 | Konica Minolta, Inc | Measurement method |
| JP6875930B2 (en) * | 2017-05-31 | 2021-05-26 | シスメックス株式会社 | Urinalysis device and urine analysis method |
| JP7023370B2 (en) * | 2018-08-22 | 2022-02-21 | 株式会社日立ハイテク | Automatic analyzer and optical measurement method |
| KR102415611B1 (en) * | 2020-01-14 | 2022-07-06 | (주) 한일사이메드 | Sample measurement system |
| US11486812B2 (en) * | 2020-04-20 | 2022-11-01 | Becton, Dickinson And Company | Apparatus and method for quantitative characterization of a light detector |
| KR102229764B1 (en) * | 2020-10-21 | 2021-03-19 | (주)휴마스 | Method and apparatus for rapid monitoring of unederwater microplastics based on fluorescence tagging and multifunctional photometry |
Family Cites Families (19)
| Publication number | Priority date | Publication date | Assignee | Title |
|---|---|---|---|---|
| JP3070968B2 (en) * | 1991-05-14 | 2000-07-31 | シスメックス株式会社 | Urine cell analysis reagents and methods |
| JP3213334B2 (en) * | 1991-05-14 | 2001-10-02 | シスメックス株式会社 | Urine cell analyzer |
| US5656499A (en) * | 1994-08-01 | 1997-08-12 | Abbott Laboratories | Method for performing automated hematology and cytometry analysis |
| DE69535413T2 (en) | 1994-10-20 | 2007-11-29 | Sysmex Corp. | Reagent and method for analyzing solid components in urine |
| JP3580615B2 (en) * | 1994-10-20 | 2004-10-27 | シスメックス株式会社 | Urine particulate analysis reagent and particulate analysis method using the reagent |
| JP3467340B2 (en) * | 1995-03-06 | 2003-11-17 | シスメックス株式会社 | Urine red blood cell discriminator |
| JP3783808B2 (en) * | 1997-05-19 | 2006-06-07 | シスメックス株式会社 | Leukocyte classification and counting reagent |
| US7553453B2 (en) * | 2000-06-02 | 2009-06-30 | Honeywell International Inc. | Assay implementation in a microfluidic format |
| JP4324552B2 (en) * | 2002-06-24 | 2009-09-02 | シスメックス株式会社 | Leukocyte classification and counting method |
| JP4759438B2 (en) * | 2006-05-17 | 2011-08-31 | シスメックス株式会社 | Urine component analyzer |
| JP4918281B2 (en) * | 2006-05-18 | 2012-04-18 | シスメックス株式会社 | Urine component analyzer |
| JP4817450B2 (en) * | 2007-01-31 | 2011-11-16 | シスメックス株式会社 | Blood analyzer, blood analysis method and computer program |
| US8148101B2 (en) * | 2008-07-22 | 2012-04-03 | Abbott Laboratories | Method for classifying and counting bacteria in body fluids |
| CN101750274B (en) * | 2008-12-17 | 2014-06-25 | 深圳迈瑞生物医疗电子股份有限公司 | Differential blood count reagent, kit and method of differential blood count |
| CN102766346B (en) * | 2012-07-30 | 2014-12-17 | 北京福罗泰科技有限责任公司 | Cyanine fluorescent dye |
| EP2772745B1 (en) * | 2013-02-28 | 2016-01-13 | Sysmex Corporation | Urine sample analyzer, sample analyzing method, and sample analyzing control program |
| EP2997363A4 (en) * | 2013-05-13 | 2016-11-30 | Chiranjit Deka | Apparatus and methods for cellular analysis |
| EP2811032B1 (en) * | 2013-06-03 | 2018-04-04 | Sysmex Corporation | Bacteria analyzing method and specimen analyzer |
| JP6116502B2 (en) * | 2014-02-28 | 2017-04-19 | シスメックス株式会社 | Sample analyzer and sample analysis method |
-
2014
- 2014-02-28 KR KR1020157022296A patent/KR101885417B1/en active IP Right Grant
- 2014-02-28 EP EP14756669.9A patent/EP2963418B1/en active Active
- 2014-02-28 BR BR112015020370A patent/BR112015020370A2/en not_active IP Right Cessation
- 2014-02-28 WO PCT/JP2014/055168 patent/WO2014133160A1/en active Application Filing
- 2014-02-28 JP JP2015503062A patent/JP6232046B2/en active Active
- 2014-02-28 CN CN201480010189.0A patent/CN105026928B/en active Active
- 2014-02-28 EP EP23161429.8A patent/EP4220158A3/en active Pending
-
2015
- 2015-08-27 US US14/838,014 patent/US9835559B2/en active Active
Also Published As
| Publication number | Publication date |
|---|---|
| EP4220158A3 (en) | 2023-08-09 |
| CN105026928B (en) | 2018-11-06 |
| US9835559B2 (en) | 2017-12-05 |
| JP6232046B2 (en) | 2017-11-15 |
| US20150369741A1 (en) | 2015-12-24 |
| KR101885417B1 (en) | 2018-08-03 |
| KR20150107859A (en) | 2015-09-23 |
| JPWO2014133160A1 (en) | 2017-02-09 |
| BR112015020370A2 (en) | 2017-07-18 |
| EP4220158A2 (en) | 2023-08-02 |
| EP2963418A4 (en) | 2016-10-26 |
| CN105026928A (en) | 2015-11-04 |
| WO2014133160A1 (en) | 2014-09-04 |
| EP2963418A1 (en) | 2016-01-06 |
Similar Documents
| Publication | Publication Date | Title |
|---|---|---|
| EP2963418B1 (en) | Urine sample analysis device and urine sample analysis method | |
| JP6116502B2 (en) | Sample analyzer and sample analysis method | |
| JP6106113B2 (en) | Urine sample analyzer, sample analysis method, and sample analysis control program | |
| US7892850B2 (en) | Apparatus and method for measuring immature platelets | |
| EP2990799B1 (en) | Method for analyzing atypical cells in urine and urine analyzer | |
| EP2630492B1 (en) | Internal focus reference beads for imaging cytometry | |
| US9784729B2 (en) | Canceration information providing method and canceration information providing device | |
| US9719123B2 (en) | Urine sample analyzer and urine sample analyzing method | |
| US20150104786A1 (en) | Cell analysis method, cell analyzer and sample screening method | |
| EP2645082B1 (en) | Canceration information providing method and canceration information providing device | |
| CN116625991A (en) | Urine sample analysis method and urine sample analysis device |
Legal Events
| Date | Code | Title | Description |
|---|---|---|---|
| PUAI | Public reference made under article 153(3) epc to a published international application that has entered the european phase |
Free format text: ORIGINAL CODE: 0009012 |
|
| 17P | Request for examination filed |
Effective date: 20150813 |
|
| AK | Designated contracting states |
Kind code of ref document: A1 Designated state(s): AL AT BE BG CH CY CZ DE DK EE ES FI FR GB GR HR HU IE IS IT LI LT LU LV MC MK MT NL NO PL PT RO RS SE SI SK SM TR |
|
| AX | Request for extension of the european patent |
Extension state: BA ME |
|
| DAX | Request for extension of the european patent (deleted) | ||
| A4 | Supplementary search report drawn up and despatched |
Effective date: 20160923 |
|
| RIC1 | Information provided on ipc code assigned before grant |
Ipc: G01N 15/00 20060101ALN20160919BHEP Ipc: G01N 21/64 20060101ALI20160919BHEP Ipc: G01N 33/483 20060101ALI20160919BHEP Ipc: G01N 21/47 20060101ALI20160919BHEP Ipc: G01N 33/493 20060101AFI20160919BHEP Ipc: G01N 15/14 20060101ALI20160919BHEP |
|
| STAA | Information on the status of an ep patent application or granted ep patent |
Free format text: STATUS: EXAMINATION IS IN PROGRESS |
|
| STAA | Information on the status of an ep patent application or granted ep patent |
Free format text: STATUS: EXAMINATION IS IN PROGRESS |
|
| 17Q | First examination report despatched |
Effective date: 20201204 |
|
| STAA | Information on the status of an ep patent application or granted ep patent |
Free format text: STATUS: EXAMINATION IS IN PROGRESS |
|
| GRAP | Despatch of communication of intention to grant a patent |
Free format text: ORIGINAL CODE: EPIDOSNIGR1 |
|
| STAA | Information on the status of an ep patent application or granted ep patent |
Free format text: STATUS: GRANT OF PATENT IS INTENDED |
|
| RIC1 | Information provided on ipc code assigned before grant |
Ipc: G01N 15/00 20060101ALN20221011BHEP Ipc: G01N 33/483 20060101ALI20221011BHEP Ipc: G01N 21/64 20060101ALI20221011BHEP Ipc: G01N 21/47 20060101ALI20221011BHEP Ipc: G01N 15/14 20060101ALI20221011BHEP Ipc: G01N 33/493 20060101AFI20221011BHEP |
|
| INTG | Intention to grant announced |
Effective date: 20221026 |
|
| GRAS | Grant fee paid |
Free format text: ORIGINAL CODE: EPIDOSNIGR3 |
|
| GRAA | (expected) grant |
Free format text: ORIGINAL CODE: 0009210 |
|
| STAA | Information on the status of an ep patent application or granted ep patent |
Free format text: STATUS: THE PATENT HAS BEEN GRANTED |
|
| AK | Designated contracting states |
Kind code of ref document: B1 Designated state(s): AL AT BE BG CH CY CZ DE DK EE ES FI FR GB GR HR HU IE IS IT LI LT LU LV MC MK MT NL NO PL PT RO RS SE SI SK SM TR |
|
| REG | Reference to a national code |
Ref country code: GB Ref legal event code: FG4D |
|
| REG | Reference to a national code |
Ref country code: CH Ref legal event code: EP |
|
| REG | Reference to a national code |
Ref country code: DE Ref legal event code: R096 Ref document number: 602014086680 Country of ref document: DE |
|
| REG | Reference to a national code |
Ref country code: IE Ref legal event code: FG4D |
|
| REG | Reference to a national code |
Ref country code: AT Ref legal event code: REF Ref document number: 1560053 Country of ref document: AT Kind code of ref document: T Effective date: 20230515 |
|
| REG | Reference to a national code |
Ref country code: LT Ref legal event code: MG9D |
|
| REG | Reference to a national code |
Ref country code: NL Ref legal event code: MP Effective date: 20230412 |
|
| REG | Reference to a national code |
Ref country code: AT Ref legal event code: MK05 Ref document number: 1560053 Country of ref document: AT Kind code of ref document: T Effective date: 20230412 |
|
| PG25 | Lapsed in a contracting state [announced via postgrant information from national office to epo] |
Ref country code: NL Free format text: LAPSE BECAUSE OF FAILURE TO SUBMIT A TRANSLATION OF THE DESCRIPTION OR TO PAY THE FEE WITHIN THE PRESCRIBED TIME-LIMIT Effective date: 20230412 |
|
| PG25 | Lapsed in a contracting state [announced via postgrant information from national office to epo] |
Ref country code: SE Free format text: LAPSE BECAUSE OF FAILURE TO SUBMIT A TRANSLATION OF THE DESCRIPTION OR TO PAY THE FEE WITHIN THE PRESCRIBED TIME-LIMIT Effective date: 20230412 Ref country code: PT Free format text: LAPSE BECAUSE OF FAILURE TO SUBMIT A TRANSLATION OF THE DESCRIPTION OR TO PAY THE FEE WITHIN THE PRESCRIBED TIME-LIMIT Effective date: 20230814 Ref country code: NO Free format text: LAPSE BECAUSE OF FAILURE TO SUBMIT A TRANSLATION OF THE DESCRIPTION OR TO PAY THE FEE WITHIN THE PRESCRIBED TIME-LIMIT Effective date: 20230712 Ref country code: ES Free format text: LAPSE BECAUSE OF FAILURE TO SUBMIT A TRANSLATION OF THE DESCRIPTION OR TO PAY THE FEE WITHIN THE PRESCRIBED TIME-LIMIT Effective date: 20230412 Ref country code: AT Free format text: LAPSE BECAUSE OF FAILURE TO SUBMIT A TRANSLATION OF THE DESCRIPTION OR TO PAY THE FEE WITHIN THE PRESCRIBED TIME-LIMIT Effective date: 20230412 |
|
| PG25 | Lapsed in a contracting state [announced via postgrant information from national office to epo] |
Ref country code: RS Free format text: LAPSE BECAUSE OF FAILURE TO SUBMIT A TRANSLATION OF THE DESCRIPTION OR TO PAY THE FEE WITHIN THE PRESCRIBED TIME-LIMIT Effective date: 20230412 Ref country code: PL Free format text: LAPSE BECAUSE OF FAILURE TO SUBMIT A TRANSLATION OF THE DESCRIPTION OR TO PAY THE FEE WITHIN THE PRESCRIBED TIME-LIMIT Effective date: 20230412 Ref country code: LV Free format text: LAPSE BECAUSE OF FAILURE TO SUBMIT A TRANSLATION OF THE DESCRIPTION OR TO PAY THE FEE WITHIN THE PRESCRIBED TIME-LIMIT Effective date: 20230412 Ref country code: LT Free format text: LAPSE BECAUSE OF FAILURE TO SUBMIT A TRANSLATION OF THE DESCRIPTION OR TO PAY THE FEE WITHIN THE PRESCRIBED TIME-LIMIT Effective date: 20230412 Ref country code: IS Free format text: LAPSE BECAUSE OF FAILURE TO SUBMIT A TRANSLATION OF THE DESCRIPTION OR TO PAY THE FEE WITHIN THE PRESCRIBED TIME-LIMIT Effective date: 20230812 Ref country code: HR Free format text: LAPSE BECAUSE OF FAILURE TO SUBMIT A TRANSLATION OF THE DESCRIPTION OR TO PAY THE FEE WITHIN THE PRESCRIBED TIME-LIMIT Effective date: 20230412 Ref country code: GR Free format text: LAPSE BECAUSE OF FAILURE TO SUBMIT A TRANSLATION OF THE DESCRIPTION OR TO PAY THE FEE WITHIN THE PRESCRIBED TIME-LIMIT Effective date: 20230713 Ref country code: AL Free format text: LAPSE BECAUSE OF FAILURE TO SUBMIT A TRANSLATION OF THE DESCRIPTION OR TO PAY THE FEE WITHIN THE PRESCRIBED TIME-LIMIT Effective date: 20230412 |
|
| PG25 | Lapsed in a contracting state [announced via postgrant information from national office to epo] |
Ref country code: FI Free format text: LAPSE BECAUSE OF FAILURE TO SUBMIT A TRANSLATION OF THE DESCRIPTION OR TO PAY THE FEE WITHIN THE PRESCRIBED TIME-LIMIT Effective date: 20230412 |
|
| REG | Reference to a national code |
Ref country code: DE Ref legal event code: R097 Ref document number: 602014086680 Country of ref document: DE |
|
| PG25 | Lapsed in a contracting state [announced via postgrant information from national office to epo] |
Ref country code: SK Free format text: LAPSE BECAUSE OF FAILURE TO SUBMIT A TRANSLATION OF THE DESCRIPTION OR TO PAY THE FEE WITHIN THE PRESCRIBED TIME-LIMIT Effective date: 20230412 |
|
| PG25 | Lapsed in a contracting state [announced via postgrant information from national office to epo] |
Ref country code: SM Free format text: LAPSE BECAUSE OF FAILURE TO SUBMIT A TRANSLATION OF THE DESCRIPTION OR TO PAY THE FEE WITHIN THE PRESCRIBED TIME-LIMIT Effective date: 20230412 Ref country code: SK Free format text: LAPSE BECAUSE OF FAILURE TO SUBMIT A TRANSLATION OF THE DESCRIPTION OR TO PAY THE FEE WITHIN THE PRESCRIBED TIME-LIMIT Effective date: 20230412 Ref country code: RO Free format text: LAPSE BECAUSE OF FAILURE TO SUBMIT A TRANSLATION OF THE DESCRIPTION OR TO PAY THE FEE WITHIN THE PRESCRIBED TIME-LIMIT Effective date: 20230412 Ref country code: EE Free format text: LAPSE BECAUSE OF FAILURE TO SUBMIT A TRANSLATION OF THE DESCRIPTION OR TO PAY THE FEE WITHIN THE PRESCRIBED TIME-LIMIT Effective date: 20230412 Ref country code: DK Free format text: LAPSE BECAUSE OF FAILURE TO SUBMIT A TRANSLATION OF THE DESCRIPTION OR TO PAY THE FEE WITHIN THE PRESCRIBED TIME-LIMIT Effective date: 20230412 Ref country code: CZ Free format text: LAPSE BECAUSE OF FAILURE TO SUBMIT A TRANSLATION OF THE DESCRIPTION OR TO PAY THE FEE WITHIN THE PRESCRIBED TIME-LIMIT Effective date: 20230412 |
|
| PLBE | No opposition filed within time limit |
Free format text: ORIGINAL CODE: 0009261 |
|
| STAA | Information on the status of an ep patent application or granted ep patent |
Free format text: STATUS: NO OPPOSITION FILED WITHIN TIME LIMIT |
|
| 26N | No opposition filed |
Effective date: 20240115 |
|
| PGFP | Annual fee paid to national office [announced via postgrant information from national office to epo] |
Ref country code: DE Payment date: 20240116 Year of fee payment: 11 Ref country code: GB Payment date: 20240118 Year of fee payment: 11 |
|
| PG25 | Lapsed in a contracting state [announced via postgrant information from national office to epo] |
Ref country code: SI Free format text: LAPSE BECAUSE OF FAILURE TO SUBMIT A TRANSLATION OF THE DESCRIPTION OR TO PAY THE FEE WITHIN THE PRESCRIBED TIME-LIMIT Effective date: 20230412 |