EP0063431B1 - Spectroscopic analyzer system - Google Patents
Spectroscopic analyzer system Download PDFInfo
- Publication number
- EP0063431B1 EP0063431B1 EP82301694A EP82301694A EP0063431B1 EP 0063431 B1 EP0063431 B1 EP 0063431B1 EP 82301694 A EP82301694 A EP 82301694A EP 82301694 A EP82301694 A EP 82301694A EP 0063431 B1 EP0063431 B1 EP 0063431B1
- Authority
- EP
- European Patent Office
- Prior art keywords
- light
- interference filters
- conductor
- light conductor
- signals
- Prior art date
- Legal status (The legal status is an assumption and is not a legal conclusion. Google has not performed a legal analysis and makes no representation as to the accuracy of the status listed.)
- Expired
Links
Images


Classifications
-
- G—PHYSICS
- G01—MEASURING; TESTING
- G01N—INVESTIGATING OR ANALYSING MATERIALS BY DETERMINING THEIR CHEMICAL OR PHYSICAL PROPERTIES
- G01N21/00—Investigating or analysing materials by the use of optical means, i.e. using sub-millimetre waves, infrared, visible or ultraviolet light
- G01N21/17—Systems in which incident light is modified in accordance with the properties of the material investigated
- G01N21/25—Colour; Spectral properties, i.e. comparison of effect of material on the light at two or more different wavelengths or wavelength bands
- G01N21/31—Investigating relative effect of material at wavelengths characteristic of specific elements or molecules, e.g. atomic absorption spectrometry
- G01N21/314—Investigating relative effect of material at wavelengths characteristic of specific elements or molecules, e.g. atomic absorption spectrometry with comparison of measurements at specific and non-specific wavelengths
-
- A—HUMAN NECESSITIES
- A61—MEDICAL OR VETERINARY SCIENCE; HYGIENE
- A61B—DIAGNOSIS; SURGERY; IDENTIFICATION
- A61B1/00—Instruments for performing medical examinations of the interior of cavities or tubes of the body by visual or photographical inspection, e.g. endoscopes; Illuminating arrangements therefor
- A61B1/00163—Optical arrangements
- A61B1/00165—Optical arrangements with light-conductive means, e.g. fibre optics
-
- A—HUMAN NECESSITIES
- A61—MEDICAL OR VETERINARY SCIENCE; HYGIENE
- A61B—DIAGNOSIS; SURGERY; IDENTIFICATION
- A61B5/00—Measuring for diagnostic purposes; Identification of persons
- A61B5/0059—Measuring for diagnostic purposes; Identification of persons using light, e.g. diagnosis by transillumination, diascopy, fluorescence
- A61B5/0071—Measuring for diagnostic purposes; Identification of persons using light, e.g. diagnosis by transillumination, diascopy, fluorescence by measuring fluorescence emission
-
- A—HUMAN NECESSITIES
- A61—MEDICAL OR VETERINARY SCIENCE; HYGIENE
- A61B—DIAGNOSIS; SURGERY; IDENTIFICATION
- A61B5/00—Measuring for diagnostic purposes; Identification of persons
- A61B5/0059—Measuring for diagnostic purposes; Identification of persons using light, e.g. diagnosis by transillumination, diascopy, fluorescence
- A61B5/0075—Measuring for diagnostic purposes; Identification of persons using light, e.g. diagnosis by transillumination, diascopy, fluorescence by spectroscopy, i.e. measuring spectra, e.g. Raman spectroscopy, infrared absorption spectroscopy
-
- A—HUMAN NECESSITIES
- A61—MEDICAL OR VETERINARY SCIENCE; HYGIENE
- A61B—DIAGNOSIS; SURGERY; IDENTIFICATION
- A61B5/00—Measuring for diagnostic purposes; Identification of persons
- A61B5/0059—Measuring for diagnostic purposes; Identification of persons using light, e.g. diagnosis by transillumination, diascopy, fluorescence
- A61B5/0082—Measuring for diagnostic purposes; Identification of persons using light, e.g. diagnosis by transillumination, diascopy, fluorescence adapted for particular medical purposes
- A61B5/0084—Measuring for diagnostic purposes; Identification of persons using light, e.g. diagnosis by transillumination, diascopy, fluorescence adapted for particular medical purposes for introduction into the body, e.g. by catheters
Landscapes
- Health & Medical Sciences (AREA)
- Life Sciences & Earth Sciences (AREA)
- Physics & Mathematics (AREA)
- Surgery (AREA)
- General Health & Medical Sciences (AREA)
- Pathology (AREA)
- Animal Behavior & Ethology (AREA)
- Veterinary Medicine (AREA)
- Heart & Thoracic Surgery (AREA)
- Medical Informatics (AREA)
- Molecular Biology (AREA)
- Engineering & Computer Science (AREA)
- Biophysics (AREA)
- Spectroscopy & Molecular Physics (AREA)
- Public Health (AREA)
- Biomedical Technology (AREA)
- Optics & Photonics (AREA)
- Nuclear Medicine, Radiotherapy & Molecular Imaging (AREA)
- Radiology & Medical Imaging (AREA)
- Chemical & Material Sciences (AREA)
- Analytical Chemistry (AREA)
- Biochemistry (AREA)
- General Physics & Mathematics (AREA)
- Immunology (AREA)
- Investigating Or Analysing Materials By Optical Means (AREA)
Description
- The present invention relates generally to a spectroscopic analyser system for analytically examining objects such as intravital tissues and the like of animals and plants, more particularly for analysing the influence of oxygen concentration, metabolism of medicines, ischemia and the like on intravital objects such as tissues or organs of circulatory systems.
- It is well known that intravital pigments of oxidation/reduction type such as, for example, cytochromes carried by mitochondria in cells of respiratory systems exhibit absorption spectra which are markedly different between oxidation and reduction types of pigments or cytochromes. By making use of this fact, it is possible to obtain biological or biogenical information on the cell base through spectroscopical or photometrical detection and quantitative analysis.
- Various techniques for analysing the cell base using spectroscopal and photoelectrical methods are disclosed, for example, in U.S. 3 963 351; U.S. 4 180 327; U.S. 3 825 342; G.B. 2 058 343; EP 0 003 015 and IBM Technical Disclosure Bulletin, Vol. 20. No. 11B, April 1978.
- Heretofore, a so-called two-wavelength photometry has been adopted for obtaining a biological or biogenical information of the type mentioned above. In two-wavelength photometry, measurement is made as to difference in absorption of an object under test between a maximal absorption wavelength (i.e. the wavelength at which difference in absorption between oxidation and reduction types of the pigments concerned makes appearance most significantly) and a reference wavelength (i.e. the wavelength which approximates closely to the maximal absorption wavelength and at which difference in absorption is scarcely observed between the oxidation and reduction types). Any influence ascribable to turbidity of a specimen can be cancelled out because of its substantial equivalency at both wavelengths. Further, by selecting the wavelengths so as to be scarcely influenced by oxidation and/or reduction of other pigments, evaluation of pigment in concern can be effected with a high accuracy.
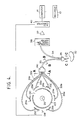
- A typical example of hitherto known spectroscopic analyser system which is operatively based on the principle of two-wavelength photometry is schematically shown in Figure 1. This system comprises a
light source 1 of a predetermined range of wavelengths, afirst monochromator 3 for deriving from thelight source 1 light ray of a wavelength À1 at which the maximal absorption by aspecimen 2 under test occurs (this wavelength is referred to as the maximal absorption wavelength), asecond monochromator 4 for deriving the reference wavelength λ2, a swingably vibratedmirror 5 for projecting alternately the two light beams of the different wavelengths À1 and X2 to thespecimen 2, aphotoelectric converter element 6 for converting the light beams transmitted through thespecimen 2 into corresponding electric signals, achopper circuit 7 for separating the output signal from thephotoelectric converter element 6 into signal components attributable to the wavelengths λ1 and A2, respectively,signal conditioning circuits chopper circuit 7, adifferential amplifier 9 for detecting difference between the output signals from theconditioning circuits recorder 10 for recording data on the basis of the output signal S from thedifferential amplifier 9 as a function of time. - Circuit configuration of the
signal conditioning circuits circuits integrators hold circuits 13a and 13b for holding the outputs of theintegrators signal conditioning circuit 8a is different from the hold time T2 of the sample and holdcircuit 13b belonging to thesignal conditioning circuit 8b, as is graphically illustrated in Fig. 3. This is because the output signals from thesignal conditioning circuits differential amplifier 9. - The hitherto known spectroscopic analyzer system described above however suffers from various and serious drawbacks. First, because a specific component of the
specimen 2 in concern requires, for the evaluation or identification thereof, two light beams of different wavelengths λ1 and λ3, twomonochromators monochromators specimen 2 can be prepared only through a series of cumbersome procedures such as smashing, differential centrifugation, extraction, purification and containment in a cuvette. The specimen which requires such troublesome preparation can usually provide a single kind of data. For obtaining a number of desired data, the specimen must be prepared in consideration of various particular conditions, thus involving delicate and time consuming procedures as well as high expenditure. Further, difficulty will be encountered in management of stock materials for preparing such specimens. Moreover, theswingable mirror 5 for irradiating the specimen alternately with two light beams of different wavelengths gives rise to an instability in the optical path, providing a cause for generation of noise, to another disadvantage. Besides, use of theintegrators signal processing circuits signal processing circuits - U.S. 3 963 351 relates to another analyser system in which the specimen is irradiated by light at different wavelengths produced using a light chopper in the form of a rotatable disc carrying a plurality of interference filters so as to intermittently and successively intercept the path of light emitted by a light source.
- According to IBM Technical Disclosure Bulletin, Vol. 20, No. 11 B, April 1978, the reflectance or transmittance of a test sample to light at different selected wavelengths is determined by irradiating the sample with polychromatic light from a source contained in a housing, via light-conducting rods and conducting the reflected or transmitted light to a first position within a rotating drum the wall of which contains a series of discrete interference filters, and measuring the intensity of the light passing through each filter in turn. The polychromatic source light is also separately conducted to a position in the drum spaced by 180° from the first position and its intensity is measured passing through each filter in turn, to provide a reference. The light source housing is fixedly mounted at the centre of the rotating drum which is in turn contained within a further housing to exclude interference from ambient light.
- One object of the present invention is to provide a spectroscopic analyser system which avoids the various disadvantages of known systems and which allows various kinds of data to be concurrently available from a single object under test on a time series base through a single spectroscopic process.
- Another object of the invention is to enable identification or quantitative estimation of substance to be carried out with a high accuracy at a high speed.
- A further object of the invention is to enable the spectroscopic analysis of intravital tissues, organs and the like of living animals and plants in situ without necessity of preparing specific specimens.
- According to an aspect of the invention, we propose a spectroscopic analyser system for examining intravital tissue comprising:
- a light source emitting a predetermined range of wavelengths;
- spectroscopic means including a plurality of sets of interference filters adapted to be operated for producing a light beam (Ai) of sequentially different wavelength from the light source;
- a first light conductor transmitting the light (A,) of the sequentially different wavelengths to an object under analysis; and
- a second conductor for receiving the light (λ) reflected from or transmitted through the object and transmitting the light to photoelectric converter means converting the light into corresponding electrical signals (Sλ1);
- characterised in that the system further comprises means for digitising the electrical signals; and
- digital processing means for storing the digital signals so as to eliminate noise and obtain a plurality of data signals (SB-SA; SD-SC; SF―SE) corresponding to each set of interference filters; and in that:
- the spectroscopic means is for two-wavelength photometry and comprises a cylindrical slit member mounted rotatably around the light source and having a peripheral wall formed with a slit, and a cylindrical stationary housing disposed so as to enclose therein the rotatable slit member, wherein the plurality of the interference filters are fixedly disposed in a peripheral wall of the stationary cylindrical member in a circular array so as to be scanned successively with light emitted from the light source through the slit upon rotation of the cylindrical slit member, the interference filters being spaced by a substantially same distance from one another, and wherein the interference filters are optically coupled to the inlet portions of optical fibre bundles whose outlet end portions are arranged randomly together to form the first conductor.
- Embodiments of the present invention will now be described by way of example with reference to the accompanying drawings in which:
- Figure 1 shows schematically in a block diagram an arrangement of a hitherto known spectroscopic analyser system;
- Figure 2 shows in a block diagram a circuit configuration of signal conditioning circuits shown in Figure 1;
- Figure 3 illustrates graphically signals available from the outputs of the circuits shown in Figure 2;
- Figure 4 shows schematically a general arrangement of a spectroscopic analyser system according to one embodiment of the invention;
- Figure 5 shows in a perspective view a structure of a spectroscopic unit used in the system shown in Figure 4;
- Figures 6(A), (B), and (C) show cross-sections of optical fibre bundles taken along the lines A-A, B-B and C-C in Figure 4;
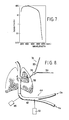
- Figure 7 graphically illustrates wavelength characteristic of a photoelectric converter element used in the system of Figure 4;
- Figure 8 illustrates a perfusing system in the state in which an object is being spectroscopically tested;
- Figure 9 graphically illustrates a waveform of signal produced from the photoelectric converter element after having been amplified;
- Figure 10(A) graphically illustrates a digitising and sampling operation of an analog-to-digital converter;
- Figure 10(B) illustrates graphically and analogically a first arithmetic operation effected by an electronic computer;
- Figure 10(C) illustrates graphically and analogically a second arithmetic operation effected by the electronic computer;
- Figure 11 illustrates graphically data signals obtained from the output of the electronic computer;
- Figure 12 shows schematically an arrangement of the spectroscopic analyser system according to another embodiment of the invention; and
- Figure 13 shows a modification of the spectroscopic analyser system shown in Figure 12.
- Referring first of all to Figures 4 and 5, the spectroscopical analyser system comprises a
light source 20 emitting light rays in a predetermined range of wavelengths and may be constituted by a xenon arc lamp or the like having a wide wavelength range covering infrared to ultraviolet regions. Thelight source 20 is disposed within acylindrical housing 121 having closed top and bottom at a substantially centre position. It is supplied with a stabilised power source (not shown) having a rated output of 500W. Further, an arc stabiliser (not shown) may be provided so as to suppress variation in the light output to a possible minimum. - The
spectroscopic unit 100 shown in Figure 5 has acylindrical housing 121 within which is disposed arotor 122 adapted to be rotated at a high speed and constituted by acylindrical slit member 123 having closed top and bottom and encasing therein thelight source 20. The bottom wall of thecylindrical slit member 123 is fixedly mounted on ashaft 124 at the centre, whichshaft 124 extends downwardly and is rotatably supported by a ball bearing 125 which in turn, is fixedly mounted on the bottom wall of thecylindrical housing 121. It will be seen that theshaft 124 is adapted to be driven by amotor 129 through atransmission 126 constituted by pulleys. 127a and 127b and abelt 128. Thus, thecylindrical slit member 123 can be rotated at a high speed (e.g. 33 Hz) about the axis of theshaft 124. Aslit 130 is formed in the peripheral wall of thecylindrical rotor 122 at a lower end portion thereof. Aconductor 131 for connecting thelight source 20 to the power supply source is led out through anopening 132 formed in the top wall of thecylindrical slit member 123 and a hole formed in the top wall of thehousing 121 in a light-tight manner to be connected to the power supply source. Further, acylindrical shield member 133 depends downwardly from the top wall of thehousing 121 and encloses an upper half of thecylindrical slit member 123. Thisshield member 133 serves to prevent light leakage possibly occurring through the opening 132 from affecting adversely light scanning operation effected by theslit 130. - Mounted fixedly on the peripheral wall of the stationary
cylindrical housing 121 along and in opposition to a circular path followed by theslit 130 upon rotation of thecylindrical slit member 123 are a plurality of wave guides 135 with an equal angular distance therebetween so that the wave guides 135 successively come to axial alignment with thelight source 20 through theslit 130 upon rotation of thecylindrical slit member 123. In the case of the illustrative embodiment being described, six wave guides 135 are provided, wherein each of the wave guides 135 is fixedly fitted with acondenser lens 136 so as to be scanned once by the light beam through theslit 130 for each rotation of thecylindrical slit member 123. Further, the wave guides 135 are provided withinterference filters condenser lens 136, respectively, to perform two-wavelength photometry required for quantitative analysis or evaluation of pigments of oxidation and reduction types present in living tissue or organs to be tested. By way of example, it is assumed that theinterference filters interference filters hole 138 is formed in the cylindrical side wall of thehousing 121 .at a position between the light guides 135 in which theinterference filters 29a and 29fare fitted, respectively so as to be scanned by light beam through theslit 130. A photoelectric sensor or the like may be placed in thehole 138 to produce an electric signal which is utilised as a synchronising or marker signal during subsequent processing anelectronic computer 41 as described hereinafter. - As is schematically illustrated in Figure 4,
optical fibre bundles 33a, ..., 33f are optically coupled to the interference filters 29a to 29f, respectively. Each of theoptical fibre bundles 33a, ..., 33f is constituted by a number of optical fibres of quartz-based material, as is clearly shown in Figure 6(A). Theseoptical fibre bundles 33a, ..., 33f are combined together and integrated to a single optical fibre bundle forming an irradiating or projectinglight conductor 33 which serves to transmit the monochromatic light rays produced from the spectroscopic unit 28 mentioned above to anobject 32 under test such as a living tissue or organ and a reflectedlight conductor 34 which serves for receiving light rays reflected from theobject 32 and transmitting the information carrying light rays thus obtained to a succeeding processing stage. - In this connection, it is important to note that the optical fibre bundles, 33a, ..., 33f are so combined that the individual optical fibres are randomly intermingled in a manner illustrated in Figure 6(B) in a cross-sectional view. A clamp or
fixture 140 holds rigidly the intermingled or combined optical fibre bundles. On the other hand, the free end portion of the irradiating or projectinglight conductor 33 is integrated with one end portion of the reflectedlight conductor 34 in such a manner that ends of the individual optical fibres of thelight conductors light conductors object 32 under test for irradiating it with the monochromatic light rays by thelight conductor 33 and receiving the reflected and modulated light rays by means of the reflected light receiving and transmittingconductor 34. A clamp or thelike fixture 35 holds the intermingledoptical fibres object 32 under test and receiving effectively light rays reflected therefrom. - The receiving light conductor or
optical fibre bundle 34 is coupled to aphotoelectric converter 38 which may be constituted by a photomultiplier, photo diode or the like and which serves to convert the reflected light signals inputted thereto through theoptical fibre bundle 34 into corresponding electric signals. Thephotoelectric converter 38 is so selected that it exhibits such a sensitivity which is substantially constant over a wavelength range of 200 nm to 800 nm, as is illustrated in Figure 7. - The electrical output signals thus derived from the
photoelectric converter 38 are applied to the input of anamplifier 39 which has a linear characteristic and serves to amplify the input signals to a desired level. - The output signals from the
amplifier 39 are supplied to an analog-to-digital converter (hereinafter referred to as A/D converter) 40 for converting the analog signal outputted from theamplifier 39 into corresponding digital signals at a high rate. The A/D converter 40 employed to this end may be constituted by a commercially available 16-bit A/D converter, by way of example. - The digital signals outputted from the A/
D converter 40 are then supplied to anelectronic computer 41 to be temporarily stored and arithmetically processed with noise being eliminated in a manner described hereinafter in detail. Data signals thus available from the output terminal of theelectronic computer 41 on a desired time series base are recorded by means of arecorder 10. - For evaluating quantitatively pigments of oxidation and reduction types present in a living tissue of the
object 32 under test such as an organ of a circulatory system with the aid of the spectroscopic analyser system described above, the irradiating end face and the reflected light receiving end face of thelight conductors object 32 to be tested, while a perfusing tube 42 (Fig. 8) is connected to theobject 32 in concern to thereby constitute aperfusion system 44 through which oxygen O2, nitrogen N2,medicines 43 and the like are supplied to theobject 32. It is to be noted that anoxygen sensor 45 is disposed within the perfusingtube 42 for detecting concentration of oxygen contained in the flow within thetube 42. The output signal from theoxygen sensor 45 is supplied to theelectronic computer 41 through a separately provided channel to be recorded by therecorder 10 as variations in the oxygen concentration on the time base. - In operation, as the
cylindrical slit member 123 is rotated at a high speed, the interference filters, 29a, ...29f are successively scanned by light ray from thelight source 20 through therotating slit 130, whereby monochromatic light rays, i\a, ..., xi are successively produced and transmitted through theoptical fibre bundles 33a to 33f to irradiate theobject 32 under test, whereby the resulting monochromatic rays reflected light rays of the wavelengths i\a, ...λf are successively received by the receiving end face of theoptical fibre bundle 34 and transmitted to thephotoelectrical converter 38 to be converted into corresponding electrical signals which are then amplified to a desired level by theamplifier 39. The waveform of the signal output from theamplifier 39 is in the form of a pulse train including pulse-like signals Sλa, ...SA, corresponding to the monochromatic light rays extracted through theinterference filters 29a, ...29f, respectively as is illustrated in Figure 9 in which time is taken along the abscissa with the signal magnitude being taken along the ordinate. On the assumption that the rotational frequency of theslit member 123 is 33Hz, each of the pulse-like signals will have a duration of about 2 ms. The output pulse-like signals from theamplifier 39 are digitalised by the A/D converter 40 at a high rate. More specifically, the reflected light signals outputted from theamplifier 39 is sampled by the A/D converter 40 in accordance with a program stored in theelectronic computer 41 at a sampling rate of the order of micro seconds (ps) as indicated by the sampling time points marked X in Figure 10(A). The sampled signals thus produced are stored in a memory incorporated in theelectronic computer 41. In this connection, it should be noted that the correspondence between the pulse-like signals Sλa, ..., SA, and therelevant interference filters 29a, ..., 29f can be identifed by the reference signal produced by a suitable means (not shown) of the spectroscopic unit 23, as described hereinbefore. - Subsequently, two types of processings are performed on the sampled digital signal stored in the memory. In the first processing, the sampled digital signals are subjected to comparison with a reference level 46 (e.g. 0.5 volts), as schematically illustrated in Figure 10(B), wherein only the sampled signals of magnitudes higher than the
reference level 46 are determined to be utilised as data quantity representing the reflected light signal Sλ1 (wherein i is a, b, c, d, e, or f), provided that five sampled digital signals exceeding thelevel 46 make appearance in succession, by way of example. Through this processing, the so-called white noise can be eliminated, to an advantage. - In the second phase of processing, more accurate data value is derived from the data quantity obtained through the first processing. In more particular, assuming that 16 digital signals are sampled validly from the signal reflected light signal Sλ1, as indicated by P1' P2, ..., P16 in Figure 10(C), the sampling time points P1, P2 and P3 as well as P14, P15 and P,6 occur during the rise-up period and the falling period of the reflected light signal Sλ1, respectively. Accordingly, the sampled digital signals corresponding to these sampling time points are neglected, and only the digital signals sampled at the remaining sampling time points, that is P4, .... P13 in the case of the illustrated embodiment, are considered as valid data which are subsequently subjected to arithmetic operation to determine the arithmetic mean or geometric mean. Through this second processing, the white noise can be further eliminated.
- The arithmetic processings of the sampled digital signals derived from each of the reflected light signals Sλa, ..., Sλ1, are performed repeatedly, for example, for 50 reflected light signals Sλ1, derived from the same interference filter, so thereby obtain the mean data SA to S, for each of the reflected light signals Saa, ..., SAf at a rate of 0.5 to 1 second.
- On the basis of the mean data SA, . , SF obtained for the reflected light signals Sλa, ..., Sλf, respectively, logarithmic differences between data SB and SA, So and Sc and SF and SE are arithmetically determined, resulting in that output signals SB―SA' So-Sc and SF―SE are produced at a given rate of 0.5 sec. to 1 sec. and supplied through appropriate interface to the
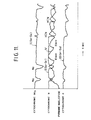
recorder 10 to be recorded on a recording sheet, as is illustrated in Fig. 10. In case theobject 32 under test is not stationary but movable, the distance between theobject 32 and the probe end portion of thelight conductor 31 and hence the effective length of the whole optical path may undergo variations, involving noise or drift in the data signals. However, such noise or drift can be readily cancelled out or compensated through appropriate processing executed by the electronic computer. For example, it will be readily possible to measure variation in the length of the optical path from time to time by determining variation in the quantity of light of a reference wavelength transmitted along the optical path, wherein the optical path length is correspondingly corrected in the sense to cancel out the noise or drift. - The data signals SB―SA, SD―SC and SF―SE finally obtained are graphically illustrated by curves I, II and III, respectively, in Fig. 13, wherein the curve I, II and III represent, respectively, changes occurred in cytochromes aa3, b and c as the result of oxidation or reduction. It will be seen from these graphs that all of cytochromes undergo changes of reduction type upon injection of N2 in the perfusing tube 42 (Fig. 8). Above all, change of cytochrome aa3 is remarkable. Further, upon injection of thianide KCN in the
perfusing tube 42, cytochromes exhibit significant changes ascribable to reduction, among which change of cytochrome b is most remarkable. These changes of pigments of oxidation and/or reduction type present in living organis on a time series base are representative of medicinal metabolism in a circulatory system and provided very meaningful biogenic information. Most of noises observed in the curves shown in Figure 11 are believed to be ascribable to pulsation brought about by a perfusing pump (not shown) used in theperfusing system 44. - Figure 12 shows another embodiment of spectroscopic analyser system, which differs from the system described above in that the
spectroscopic unit 100 includes an interference filter (having a transmitting wavelength of 340 nm) for producing fluorescence in addition to theinterference filters 29a; 29b and 29c; 29d required for quantitatively evaluating cytochrome aa3 and cytochrome b. Further, the reflectedlight conductor 34 is bifurcated at 48 wherein one of the branchedlight conductor 34a is coupled directly to the photo-electric converter 38 so that the corresponding electric signal resulted from the photoelectric conversion is supplied to the A/D converter 40 through theamplifier 39, while the other branchedlight conductor 34b is coupled to another photoelectric converter 38' through a fluorescence selectinginterference filter 47 having a transmitting wavelength of 450 nm, the output signal from the converter 38' being supplied to the A/D converter 40 by way of a different channel including an amplifier 39'. Thereference numeral 48 indicates a clamp or fixture for securing the bifurcated portion. - With this arrangement, data representative of oxidation and/or reduction of cytochrome aa3 and cytochrome b are obtained through the same processing as described hereinbefore. Additionally, fluorescence reflected or excited by the
object 32 under test in response to the irradiating light ray passed through the interference filter for fluorescence emission is detected by the photoelectric converter 38' through the fluorescence selectinginterference filter 47. The output signal from the photoelectric converter 38' is stored in theelectronic computer 41 after having been digitalised and subsequently undergoes arithmetic operation to be outputted as fluorescence data on a time series base with noise being concurrently eliminated. - Such fluorescence is attributable to cytoplasmic pyridine-nucleoside. In Figure 11, a curve IV represents fluorescence data as obtained by injecting ethyl alcohol (EtOH) in the
perfusing tube 42. It will be seen that cytoplasmic pyridine-nucleoside exhibits reduction type reaction with ethyl alcohol. - Although it has been described that the
fluorescence selecting filter 47 is disposed at the branched reflectedlight conductor 34b, thisfilter 47 may equally be installed in thespectroscopic unit 100 to a simplification of the system. Further, in consideration of the fact that reflecting of the very fluorescence excitation light ray having wavelength of 340 nm gives rise to variation in emitted fluorescence, the branched reflectedlight conductor 34b may be again bifurcated, wherein a sub-branched reflectedlight conductor 34c is coupled to another photo-electric converter element 38" through an interposedinterference filter 49 having a transmitting wavelength of 340 nm, as is shown in Figure 13. The output signal from thephotoelectric converter 38" is supplied to the A/D converter 40 through anamplifier 39", wherein the signal component correspondimg to the reflected light signal taken out through the sub-branchedlight conductor 34c is subtracted from the fluorescence signal derived from the light signal supplied through thelight conductor 34b through corresponding arithmetic operation. Then, more accurate measurement of fluorescence can be assured. As the alternative, the fluorescence signal and the reflected light signal outputted from thephotoelectric converter elements 38' and 38", respectively, may be supplied to a subtractor (not shown) to thereby detect difference between thesesignals 38' and 38", wherein the difference signal thus derived is arithmetically processed by theelectric computer 41 after analog-to-digital conversion through the A/D converter 40, to thereby compensate variation of the received fluorescence signal brought about by the fluorescence exciting light ray per se. - In all of the embodiments described above, it has been assumed that the xenon arc lamp is employed as the
light source 20. However, the invention is never restricted to the use of the xenon lamp. Since it is sufficient for thelight source 20 to emit the light rays in a visible range, other lamps such as tungsten filament lamp and the like can be employed. Further, the interference filters are also never restricted to those for quantitatively evaluating cytochromes and for producing fluorescence. Other types of interference filters can of course, be employed. For example, interference filters for deriving light rays having a reference wavelength of 456 nm and maximal absorption wavelength of 500 nm, respectively, can be used for quantitatively identifying flavin adenine dinucleotide, while interference filters for producing light rays having a reference wavelength of 675 nm and a maximal . absorption wavelength of 685 nm may be used for determining concentration of calcium contained in cells. In the foregoing, description has been made on the assumption that light information obtained from light rays reflected by the object under test is utilised for the intended quantitative evaluation or identification. However, it is equally possible to make use of the light information derived from the light rays transmitted through the object under test in the electronic signal processing described above. Further, other parameters such as moisture and temperature can be monitored by theelectronic computer 41 in addition to concentration of oxygen. Finally, it should be mentioned that the spectroscopic analyser systems according to the invention can be used in other applications such as spectroscopical analyses of living tissues and organs of plants and animals as well as environmental and industrial applications. It will be understood that the spectroscopical analyser system according to the invention makes it possible to evaluate pigments of reduction and oxidation types present in living tissues, cells or organs in a straightforward manner on the basis of light information obtained from living objects under test without necessity of previously preparing specimens and, besides, allows such evaluation to be performed on a plurality of pigments in concern simultaneously on a time series base with an enhanced efficiency and accuracy. Accordingly, not only biological information which is very important for determining influences of medicines, variations in oxygen concentration, ischemia, metabolism or hormones and the like in circulatory systems and others can be obtained for intravital tissues or cells of animals and plants of wide varieties, but also information useful for environmental control and/ or industrial purposes are available with an improved reliability with disturbing noises being suppressed to a minimum. Further, the time required for the analyses can be reduced significantly.
Claims (6)
Applications Claiming Priority (4)
| Application Number | Priority Date | Filing Date | Title |
|---|---|---|---|
| JP53130/81 | 1981-04-10 | ||
| JP5315081A JPS57168141A (en) | 1981-04-10 | 1981-04-10 | Spectroscopic analysis apparatus |
| JP10228981A JPS585631A (en) | 1981-07-02 | 1981-07-02 | Spectrochemical analysis device |
| JP102289/81 | 1981-07-02 |
Publications (2)
| Publication Number | Publication Date |
|---|---|
| EP0063431A1 EP0063431A1 (en) | 1982-10-27 |
| EP0063431B1 true EP0063431B1 (en) | 1987-10-28 |
Family
ID=26393854
Family Applications (1)
| Application Number | Title | Priority Date | Filing Date |
|---|---|---|---|
| EP82301694A Expired EP0063431B1 (en) | 1981-04-10 | 1982-03-31 | Spectroscopic analyzer system |
Country Status (2)
| Country | Link |
|---|---|
| US (1) | US4505583A (en) |
| EP (1) | EP0063431B1 (en) |
Cited By (1)
| Publication number | Priority date | Publication date | Assignee | Title |
|---|---|---|---|---|
| US8175688B2 (en) | 1997-10-30 | 2012-05-08 | Hypermed Imaging, Inc. | Multispectral/hyperspectral medical instrument |
Families Citing this family (48)
| Publication number | Priority date | Publication date | Assignee | Title |
|---|---|---|---|---|
| GB2136120B (en) * | 1983-03-10 | 1986-10-08 | Shionogi & Co | Photoelectric brain scanner and its use |
| FR2547922B3 (en) * | 1983-06-24 | 1986-02-21 | Thomson Csf | METHOD OF QUANTITATIVE ANALYSIS BY ABSORPTION SPECTROSCOPY AND DEVICE FOR IMPLEMENTING SAME |
| US4637729A (en) * | 1983-12-14 | 1987-01-20 | Carrier Corporation | Fiber optic moisture analysis probe |
| JPS60256443A (en) * | 1984-05-31 | 1985-12-18 | オムロン株式会社 | Image measuring apparatus |
| US4702598A (en) * | 1985-02-25 | 1987-10-27 | Research Corporation | Flow cytometer |
| EP0590268B1 (en) * | 1985-03-22 | 1998-07-01 | Massachusetts Institute Of Technology | Fiber Optic Probe System for Spectrally Diagnosing Tissue |
| DE3541165A1 (en) * | 1985-11-21 | 1987-05-27 | Hellige Gmbh | DEVICE FOR CONTINUOUSLY DETERMINING CONCENTRATION CHANGES IN MIXTURES |
| IT1213864B (en) * | 1987-12-23 | 1990-01-05 | Consiglio Nazionale Ricerche | METHOD OF DETECTION OF ENTEROGASTRIC REFLUX AND EQUIPMENT FOR THE IMPLEMENTATION OF THAT METHOD |
| EP0352923A1 (en) * | 1988-07-25 | 1990-01-31 | BAXTER INTERNATIONAL INC. (a Delaware corporation) | Spectrophotometric apparatus and method for monitoring oxygen saturation |
| JPH0239145U (en) * | 1988-09-09 | 1990-03-15 | ||
| EP0358809A1 (en) * | 1988-09-15 | 1990-03-21 | Hellige GmbH | Spectrophotometer for monitoring a living organism |
| GB2227832A (en) * | 1989-02-06 | 1990-08-08 | Hamamatsu Photonics Kk | Optical examination apparatus |
| US5369496A (en) * | 1989-11-13 | 1994-11-29 | Research Foundation Of City College Of New York | Noninvasive method and apparatus for characterizing biological materials |
| GB9014786D0 (en) * | 1990-07-04 | 1990-08-22 | Imperial College | Meconium monitoring system |
| DE4026821A1 (en) * | 1990-08-24 | 1992-03-05 | Philips Patentverwaltung | METHOD FOR DETECTING ANOMALIES OF THE SKIN, ESPECIALLY MELANOMAS, AND DEVICE FOR IMPLEMENTING THE METHOD |
| US5137364A (en) * | 1991-01-31 | 1992-08-11 | Mccarthy Cornelius J | Optical spectral analysis apparatus |
| US5422730A (en) * | 1994-03-25 | 1995-06-06 | Barlow; Clyde H. | Automated optical detection of tissue perfusion by microspheres |
| EP0762109A3 (en) * | 1995-08-30 | 1997-09-17 | Kyoto Daiichi Kagaku Kk | Method of and apparatus for measuring lactic acid in organism |
| US6208749B1 (en) | 1997-02-28 | 2001-03-27 | Electro-Optical Sciences, Inc. | Systems and methods for the multispectral imaging and characterization of skin tissue |
| US6081612A (en) * | 1997-02-28 | 2000-06-27 | Electro Optical Sciences Inc. | Systems and methods for the multispectral imaging and characterization of skin tissue |
| US6005249A (en) * | 1997-03-18 | 1999-12-21 | Smithsonian Environmental Research Center | Cosine corrected optical pathway of a spectral radiometer |
| CA2308375C (en) * | 1997-10-30 | 2013-04-09 | Edgar N. Lewis | Multispectral/hyperspectral medical instrument |
| US6505059B1 (en) | 1998-04-06 | 2003-01-07 | The General Hospital Corporation | Non-invasive tissue glucose level monitoring |
| US6721582B2 (en) | 1999-04-06 | 2004-04-13 | Argose, Inc. | Non-invasive tissue glucose level monitoring |
| US7899518B2 (en) | 1998-04-06 | 2011-03-01 | Masimo Laboratories, Inc. | Non-invasive tissue glucose level monitoring |
| US6728560B2 (en) | 1998-04-06 | 2004-04-27 | The General Hospital Corporation | Non-invasive tissue glucose level monitoring |
| GB9815702D0 (en) * | 1998-07-21 | 1998-09-16 | Cambridge Imaging Ltd | Improved imaging system for fluorescence assays |
| US6741884B1 (en) | 1998-09-03 | 2004-05-25 | Hypermed, Inc. | Infrared endoscopic balloon probes |
| US8024027B2 (en) | 1998-09-03 | 2011-09-20 | Hyperspectral Imaging, Inc. | Infrared endoscopic balloon probes |
| US6597932B2 (en) | 2000-02-18 | 2003-07-22 | Argose, Inc. | Generation of spatially-averaged excitation-emission map in heterogeneous tissue |
| JP4030710B2 (en) * | 2000-08-07 | 2008-01-09 | 富士フイルム株式会社 | Image reading device |
| DE10231667A1 (en) * | 2002-07-12 | 2004-01-22 | Olympus Biosystems Gmbh | Lighting device and optical object inspection device |
| MXPA05004610A (en) * | 2003-05-14 | 2005-06-08 | Tbs Holding Ag | Method and device for the recognition of biometric data following recording from at least two directions. |
| US7181219B2 (en) | 2003-05-22 | 2007-02-20 | Lucent Technologies Inc. | Wireless handover using anchor termination |
| JP4633347B2 (en) * | 2003-08-27 | 2011-02-16 | ソニー株式会社 | Electronics |
| WO2007043899A1 (en) | 2005-10-14 | 2007-04-19 | Applied Research Associates Nz Limited | A method of monitoring a surface feature and apparatus therefor |
| BRPI0805608B1 (en) * | 2008-12-15 | 2018-11-21 | Embrapa Pesquisa Agropecuaria | method, equipment and system for the diagnosis of stresses and diseases in higher plants |
| US9030663B2 (en) * | 2011-10-31 | 2015-05-12 | Exelis Inc. | Remote absorption spectroscopy by coded transmission |
| US9179844B2 (en) | 2011-11-28 | 2015-11-10 | Aranz Healthcare Limited | Handheld skin measuring or monitoring device |
| NL1039667C2 (en) * | 2012-06-11 | 2013-12-12 | Purac Biochem Bv | Quantification of lactide amounts in a polymeric matrix. |
| SG11201701015QA (en) * | 2014-08-29 | 2017-03-30 | Univ Tohoku | Optical concentration measuring method |
| SG11201703289YA (en) * | 2014-11-23 | 2017-06-29 | Fujikin Kk | Optical gas concentration measuring method, and method for monitoring gas concentration by said method |
| US10013527B2 (en) | 2016-05-02 | 2018-07-03 | Aranz Healthcare Limited | Automatically assessing an anatomical surface feature and securely managing information related to the same |
| US11116407B2 (en) | 2016-11-17 | 2021-09-14 | Aranz Healthcare Limited | Anatomical surface assessment methods, devices and systems |
| EP4183328A1 (en) | 2017-04-04 | 2023-05-24 | Aranz Healthcare Limited | Anatomical surface assessment methods, devices and systems |
| CN107462561B (en) * | 2017-09-09 | 2021-11-23 | 华中农业大学 | Fluorescent dynamic automatic detection device and method for tobacco leaf spot character |
| WO2019106819A1 (en) * | 2017-11-30 | 2019-06-06 | 株式会社Shinsei | Health condition management system, method for controlling health condition management system, and program |
| US20220363076A1 (en) * | 2019-11-11 | 2022-11-17 | Hewlett-Packard Development Company, L.P. | Providing a status of a radiation emitter |
Family Cites Families (7)
| Publication number | Priority date | Publication date | Assignee | Title |
|---|---|---|---|---|
| DE2122655A1 (en) * | 1971-05-07 | 1972-11-30 | Max Planck Gesellschaft | Optical absorption device for determining the concentration of a component of a substance mixture |
| US3963351A (en) * | 1975-04-14 | 1976-06-15 | Britton Chance | Multi-channel optical time-sharing apparatus having a rotating filter wheel with position-encoding means |
| JPS5352180A (en) * | 1976-10-22 | 1978-05-12 | Hitachi Ltd | Two light beams spectrophotometer |
| DE2963757D1 (en) * | 1978-01-03 | 1982-11-11 | Shapiro H M | Apparatus for non-invasive detection of zinc protoporphyrin in erythrocytes |
| US4300689A (en) * | 1978-01-16 | 1981-11-17 | Hoffmann-La Roche Inc. | Dual wavelength spectrophotometer for ampoule leak detection and content inspection |
| US4290433A (en) * | 1979-08-20 | 1981-09-22 | Alfano Robert R | Method and apparatus for detecting the presence of caries in teeth using visible luminescence |
| US4340307A (en) * | 1980-07-07 | 1982-07-20 | Beckman Instruments, Inc. | Bichromatic spectrophotometer with wavelength reversal |
-
1982
- 1982-03-31 EP EP82301694A patent/EP0063431B1/en not_active Expired
- 1982-03-31 US US06/363,855 patent/US4505583A/en not_active Expired - Fee Related
Cited By (1)
| Publication number | Priority date | Publication date | Assignee | Title |
|---|---|---|---|---|
| US8175688B2 (en) | 1997-10-30 | 2012-05-08 | Hypermed Imaging, Inc. | Multispectral/hyperspectral medical instrument |
Also Published As
| Publication number | Publication date |
|---|---|
| EP0063431A1 (en) | 1982-10-27 |
| US4505583A (en) | 1985-03-19 |
Similar Documents
| Publication | Publication Date | Title |
|---|---|---|
| EP0063431B1 (en) | Spectroscopic analyzer system | |
| Rousseau | Raman difference spectroscopy as a probe of biological molecules | |
| US6351306B1 (en) | Optical measurement probe calibration configurations | |
| US3994590A (en) | Discrete frequency colorimeter | |
| KR101647857B1 (en) | Spectrometer, spectrometry, and spectrometry program | |
| US5151603A (en) | Method for optical determination of concentration of substance and apparatus for the determination | |
| US5061075A (en) | Optical method and apparatus for diagnosing human spermatozoa | |
| JP2005501233A (en) | Spectral breath analysis | |
| JPH08510321A (en) | Glucose fluorescence inspection apparatus and method | |
| US5422719A (en) | Multi-wave-length spectrofluorometer | |
| JPH0259647A (en) | Automatic fluorophotometer | |
| JPS6218859B2 (en) | ||
| US4320970A (en) | Photon counting fluorimeter | |
| JP2011513740A (en) | Time-resolved spectroscopic analysis method and system using photon mixing detector | |
| US3897155A (en) | Atomic fluorescence spectrometer | |
| US6737649B2 (en) | Infrared analysis instrument with offset probe for particulate sample | |
| JPS585631A (en) | Spectrochemical analysis device | |
| US4178102A (en) | Process and apparatus for measuring the concentration of a molecule of selective spectrum in a sample substance | |
| JPH01102342A (en) | Fluoro-microscopic spectral method and apparatus | |
| Hassinen | [34] Reflectance spectrophotometric and surface fluorometric methods for measuring the redox state of nicotinamide nucleotides and flavins in intact tissues | |
| JP2006266868A (en) | Absorption analyzer and absorption analysis method | |
| EP4276444A1 (en) | Optical co2 concentration meter based on ir light absorption in gas | |
| JP2855777B2 (en) | Emission spectroscopy detector | |
| Schwab et al. | A new organ spectrophotometer for sensitive dual-wavelength absorbance measurement and spectral scanning of intact perfused organs | |
| Fisher et al. | The Use of Ensemble Averaging to Increase the Sensitivity of Measurements with Flame Photometers |
Legal Events
| Date | Code | Title | Description |
|---|---|---|---|
| PUAI | Public reference made under article 153(3) epc to a published international application that has entered the european phase |
Free format text: ORIGINAL CODE: 0009012 |
|
| AK | Designated contracting states |
Designated state(s): DE FR GB NL |
|
| 17P | Request for examination filed |
Effective date: 19830414 |
|
| GRAA | (expected) grant |
Free format text: ORIGINAL CODE: 0009210 |
|
| AK | Designated contracting states |
Kind code of ref document: B1 Designated state(s): DE FR GB NL |
|
| REF | Corresponds to: |
Ref document number: 3277548 Country of ref document: DE Date of ref document: 19871203 |
|
| ET | Fr: translation filed | ||
| PLBE | No opposition filed within time limit |
Free format text: ORIGINAL CODE: 0009261 |
|
| STAA | Information on the status of an ep patent application or granted ep patent |
Free format text: STATUS: NO OPPOSITION FILED WITHIN TIME LIMIT |
|
| 26N | No opposition filed | ||
| PGFP | Annual fee paid to national office [announced via postgrant information from national office to epo] |
Ref country code: NL Payment date: 19890331 Year of fee payment: 8 Ref country code: GB Payment date: 19890331 Year of fee payment: 8 Ref country code: FR Payment date: 19890331 Year of fee payment: 8 Ref country code: DE Payment date: 19890331 Year of fee payment: 8 |
|
| PG25 | Lapsed in a contracting state [announced via postgrant information from national office to epo] |
Ref country code: GB Effective date: 19900331 |
|
| PG25 | Lapsed in a contracting state [announced via postgrant information from national office to epo] |
Ref country code: NL Effective date: 19901001 |
|
| NLV4 | Nl: lapsed or anulled due to non-payment of the annual fee | ||
| GBPC | Gb: european patent ceased through non-payment of renewal fee | ||
| PG25 | Lapsed in a contracting state [announced via postgrant information from national office to epo] |
Ref country code: FR Effective date: 19901130 |
|
| PG25 | Lapsed in a contracting state [announced via postgrant information from national office to epo] |
Ref country code: DE Effective date: 19901201 |
|
| REG | Reference to a national code |
Ref country code: FR Ref legal event code: ST |