CN104718874B - Yield measurement and base cutter height control system for a harvester - Google Patents
Yield measurement and base cutter height control system for a harvester Download PDFInfo
- Publication number
- CN104718874B CN104718874B CN201410602449.5A CN201410602449A CN104718874B CN 104718874 B CN104718874 B CN 104718874B CN 201410602449 A CN201410602449 A CN 201410602449A CN 104718874 B CN104718874 B CN 104718874B
- Authority
- CN
- China
- Prior art keywords
- processing device
- harvester
- image
- elevator
- sensor
- Prior art date
- Legal status (The legal status is an assumption and is not a legal conclusion. Google has not performed a legal analysis and makes no representation as to the accuracy of the status listed.)
- Active
Links
Images


Classifications
-
- G—PHYSICS
- G01—MEASURING; TESTING
- G01F—MEASURING VOLUME, VOLUME FLOW, MASS FLOW OR LIQUID LEVEL; METERING BY VOLUME
- G01F25/00—Testing or calibration of apparatus for measuring volume, volume flow or liquid level or for metering by volume
- G01F25/0084—Testing or calibration of apparatus for measuring volume, volume flow or liquid level or for metering by volume for measuring volume
-
- G—PHYSICS
- G01—MEASURING; TESTING
- G01F—MEASURING VOLUME, VOLUME FLOW, MASS FLOW OR LIQUID LEVEL; METERING BY VOLUME
- G01F22/00—Methods or apparatus for measuring volume of fluids or fluent solid material, not otherwise provided for
Landscapes
- Physics & Mathematics (AREA)
- Fluid Mechanics (AREA)
- General Physics & Mathematics (AREA)
- Length Measuring Devices By Optical Means (AREA)
- Management, Administration, Business Operations System, And Electronic Commerce (AREA)
- Indicating And Signalling Devices For Elevators (AREA)
Abstract
The present invention provides a system that can include a 3D sensor. The 3D sensor can be configured to detect an area of a lift on the harvester. The 3D sensor can also be configured to emit a first signal related to the area. The system can also include a processing device in communication with the 3D sensor. The system can also include a storage device having instructions stored therein that are executable by the processing device to cause the processing device to receive the first signal and determine a volume of material on the elevator based on the first signal.
Description
Reference to related applications
The present application claims priority from U.S. provisional patent application No.61/898,600 entitled "Video-Based Yield measurement and Base cut right Control for Harvester" and filed on 11/1/2013, which is incorporated herein by reference in its entirety.
Technical Field
The present disclosure generally relates to devices for agricultural operations. More specifically, but not by way of limitation, the present disclosure relates to yield measurement and base cutter height control systems for harvesters.
Background
A harvester or combine can be used to harvest material (e.g., sugar cane, vegetables, crops, etc.) from a farm and load the material into a cart pulled by a tractor. Like many other types of farm operations, it may be desirable for a farm operator to know the production of each part of the farm. This can allow the farm operator to optimize the cultivation process. Information about production may be difficult to obtain.
Disclosure of Invention
In one example, a system is provided that includes a 3D sensor. The 3D sensor can be configured to detect an area of a lift on the harvester. The 3D sensor can also be configured to emit a first signal related to the area. The system can also include a processing device in communication with the camera system. The system can also include a storage device having instructions stored therein that are executable by the processing device to cause the processing device to receive the first signal and determine a volume of material on the elevator based on the first signal.
In another example, a method is provided that can include receiving, by a processing device, a data signal from a 3D sensor. The 3D sensor can be positioned on a lift of the harvester. The method can also include generating, by the processing device, a three-dimensional (3D) map based on the data signals. The method can also include determining, by the processing device, a volume of material on the elevator based on the 3D map.
In another example, a harvester is provided. The harvester can include a lift. The 3D sensor can be coupled to a harvester. The 3D sensor can be configured to detect a region associated with the elevator. The 3D sensor can also be configured to transmit data signals related to the area for generating a 3D map related to the material on the lift, determining a composition of the material, and determining a volume of crop contained in the material based on the composition and the 3D map.
In another example, a system can include a 3D sensor configured to detect an area associated with ground below a harvester. The 3D sensor can also be configured to emit a first signal related to the area. The system can also include a processing device in communication with the 3D sensor. The system can also include a storage device having instructions stored therein that are executable by the processing device for causing the processing device to determine a parameter of the base cutter based on the first signal.
In another example, a method is provided that can include receiving, by a processing device, a data signal from a 3D sensor positioned on a harvester. The method can also include generating, by the processing device, a three-dimensional (3D) map based on the data signals. The method can also include determining, by the processing device, a lateral position of the line of material or a height of the line of material based on the 3D map.
Drawings
FIG. 1 is a front perspective view of an example of a harvester for use with a yield measurement system and a base cutter height control system according to one example.
Fig. 2 is a perspective view of a yield measurement system mounted on an elevator of a harvester according to an example.
FIG. 3 is a perspective view of a camera system for use with a yield measurement system according to one example.
FIG. 4 is a perspective view of an elevator for use with a yield measurement system according to one example.
FIG. 5 is a top view of an elevator with paddles for use with a production measurement system according to one example.
FIG. 6 is a block diagram illustrating an example of a computing device for use with a production measurement system according to one example.
Fig. 7 is a block diagram of an example of a process for measuring a yield of material carried by an elevator according to an example.
FIG. 8 is a segmented image for determining composition of materials in an image according to an example.
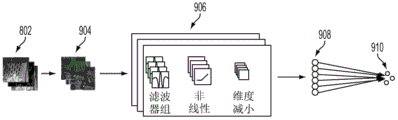
FIG. 9 is an example of a process for determining a composition of a material in an image according to an example.
FIG. 10 illustrates an example of a yield profile output by a yield measurement system according to one example.
FIG. 11 is a side perspective view of an example of a harvester for use with a base cutter height control system according to one example.
FIG. 12 is a rear perspective view of an example of a harvester for use with a base cutter height control system according to one example.
FIG. 13 is a perspective view of an example of a camera system mounted to an underside of a harvester for use with a base cutter height control system according to an example.
FIG. 14 is a perspective view of an example of a camera system mounted at an angle to the underside of a harvester and for use with a base cutter height control system according to one example.
FIG. 15 is a perspective view of an example of a lighting system 1502 for use with a base cutter height control system according to an example.
FIG. 16 is a block diagram of an example of a process for determining a new base cutter height, according to one example.
FIG. 17 is a chart illustrating an example of a 3D map for use with a base cutter height control system according to one example.
FIG. 18 is a chart for determining row lateral position, row height, and material height, according to an example.
FIG. 19 is an example of a geographical map output by a base cutter height control system according to one example.
Detailed Description
Yield measuring system
Certain aspects and features of the present disclosure relate to a real-time yield measurement system for a harvester (e.g., a combine). The yield measurement system can include a 3D sensor (e.g., a stereo camera system) coupled to a lift of the harvester. The 3D sensor is capable of detecting material (e.g., sugar cane, potatoes, sugar beets, tomatoes, or other crops) passing over a portion of the elevator. The yield measurement system is capable of processing data from the 3D sensor to measure the net volume of material carried by the lift in real time (e.g., substantially while harvesting).
In some examples, the yield measurement system can distinguish crop carried by the lift from impurities (e.g., foreign material). The yield measurement system is capable of distinguishing crop from impurities by determining one or more characteristics (e.g., size, color, shape, and texture) of the material carried by the elevator. The yield measurement system can determine the composition of the material (e.g., how much crop is in the material and how much impurities is in the material) based on the characteristics. For example, the 3D sensor can include two or more cameras. The yield measurement system is capable of analyzing images captured of portions of the elevator that can be viewed by the camera. The captured image is capable of capturing a surface area of the material on the elevator. Based on the captured images, the yield measurement system can estimate that 80% of the surface area of the material includes sugar cane and 20% of the surface area of the material includes impurities. Based on the crop to impurity ratio, the yield measurement system can apply a scaling factor to the net volume measurement to estimate the volume of material associated with the crop. For example, the yield measurement system can multiply the net volume measurement by 80% (i.e., 0.8) to determine the actual volume of material associated with the sugar cane. In this way, the yield measurement system can determine (e.g., estimate) the volume of crop on the portion of the hoist that can be seen by the camera from the captured images.
In some examples, the production measurement system is capable of measuring the volume of material in the overlapping sections of the elevator. The measurement system is capable of adjusting the volume measurement based on the amount of overlap. This can allow the yield measurement system to provide more accurate volume measurements.
In some examples, the yield measurement system can include a sensor for detecting a parameter associated with the harvester. The parameters can include ground speed, Global Positioning System (GPS) location, primary extractor speed, secondary extractor speed, primary fan speed, secondary fan speed, engine rpm, parameters related to a top cutter (topper), orientation, crop processing engagement, and operating state of the harvester. The yield measurement system can integrate the volume measurement results with harvester parameters to produce a yield map in real time.
These illustrative examples are given to introduce the reader to the general subject matter discussed herein and are not intended to limit the scope of the disclosed concepts. The following paragraphs describe a number of additional features and examples with reference to the drawings in which like reference numerals represent like elements, and the directional descriptions are used to describe the illustrative aspects, but should not be used to limit the disclosure, as do the illustrative aspects.
Fig. 1 is a front perspective view of an example of a harvester 100 for use with a yield measurement system and a base cutter height control system according to one example. The harvester 100 can be used to collect material 102 (e.g., sugar cane 506 shown in fig. 5) from a field. Harvester 100 can be any harvester 100 for harvesting any type of crop. Material 102 can pass through harvester 100 into elevator 104. The material 102 can be carried onto a lift 104 and loaded (e.g., dumped) into a cart 108 pulled by a tractor 106.
Fig. 2 is a perspective view of a yield measurement system 200 mounted on the hoist 104 of a harvesting machine according to one example. The production measurement system 200 can include a three-dimensional (3D) sensor 202 for capturing a 3D profile of the material in the elevator 104. The 3D sensor can include one or more of a camera, a 3D laser scanner, an ultrasound transducer, a range sensor, a structured light camera, a 3D camera, and a flash lidar.
In some examples, 3D sensor 202 can include two or more cameras (e.g., color cameras or grayscale cameras) mounted in the same housing or different housings. The cameras can have a known geometric or spatial relationship with respect to each other. For example, as shown in fig. 3, the 3D sensor 202 can include stereo cameras 302a, 302b mounted in a housing 304. Housing 304 can include one or more mounting devices 306a, 306b (e.g., holes, clips, or clips) for mounting 3D sensor 202 to the harvester. The housing 304 can include apertures positioned in front of the stereo cameras 302a, 302b such that the housing 304 does not block the field of view of the stereo cameras 302a, 302 b. The stereo cameras 302a, 302b can have a known spatial relationship with respect to each other.
The 3D sensor 202 can be mounted above the elevator 104 and oriented to face the elevator 104. This can allow the 3D sensor 202 to detect material carried by the lift 104 and passing through a detectable area of the 3D sensor 202 (e.g., a field of view of a camera associated with the 3D sensor 202). The 3D sensor 202 can transmit a signal related to the detectable region to a computing device (e.g., computing device 612 of fig. 6).
The computing device (not shown) can be positioned at any suitable location within the harvester. For example, the computing device can be positioned within a passenger compartment of the harvester. The computing device can receive the signals from the 3D sensor 202 and apply data related to the signals to one or more algorithms (e.g., image processing algorithms or stereo vision algorithms). The computing device can use an algorithm to generate a 3D contour of the scene (e.g., a portion of the lift 104 and material within the portion of the lift 104) detected by the 3D sensor 202. In the example where 3D sensor 202 includes cameras, as the number of cameras making up 3D sensor 202 increases, the computing device can generate more detailed or more accurate 3D contours of the scene.
As shown in fig. 8, in examples where the 3D sensor 202 includes a camera, the computing device can generate a 3D contour of the scene based on the captured images from the camera. For example, the computing device can apply triangulation to the captured images. Triangulation can include matching pixels from a first image captured by a first camera to related pixels in a second image captured by a second camera. The difference between a pixel position in the first image and a corresponding pixel position in the second image can be a disparity. The computing device can generate an image 804, the image 804 showing the disparity between pixels in the captured image. Based on each pixel location in the first image, the associated disparity, and the distance (e.g., in meters) in real space between the first camera and the second camera, the computing device can determine a 3D location in real space associated with each pixel. The computing device can use the 3D locations in real space to generate a 3D contour 806 corresponding to the camera data.
In some examples, the computing device can use data from a camera in the 3D sensor to determine the characteristics of the material. For example, the computing device can determine one or more characteristics (e.g., color and texture) associated with the material and one or more characteristics associated with the elevator. In some examples, the computing device can determine that the material is one color (e.g., brown) and the elevator is a different color (e.g., silver).
The computing device can use the characteristics of the material to determine the composition of the material. For example, the computing device can use material-related characteristics and/or elevator-related characteristics to divide the captured image 800 into different segmented regions 802. In some examples, the computing device can use the 3D contour 806 to improve the partitioning of the captured image 800 into different segmented regions 802. As shown in fig. 9, when dividing an image into segmented regions 802, the computing device can generate corrected segmented regions 904. The corrected segment regions 904 can include versions of each of the segment regions 802 that have been corrected for illumination, scale, and perspective to improve invariance to these factors. The computing device can include a feature extraction module 906, the feature extraction module 906 configured to extract features 908 from each of the corrected segmented regions 904. In some examples, feature extraction module 906 can apply one or more filters to the corrected segment region, change dimensions (dimensions) of the corrected segment region, or estimate (account for) non-linearities in the corrected segment region. The computing device can classify the features 908 (e.g., by applying a classifier or regression to the features 908) to determine the impurity content 910 in each of the segmented regions 802. In this way, the computing device can analyze the segmented regions 802 in the image to determine the amount of impurities in the material on the elevator (and thus determine the desired amount of material). For example, the computing device can determine whether the material includes 40% impurities and 60% desired crop. Based on the ratio, the computing device can apply a scaling factor to the net volume of the material. This result can provide a more accurate determination of the volume of desired crop carried by the lift 104.
Returning to fig. 2, in some examples, the computing device can operate an extractor fan (not shown) based on the composition of the material. The extractor fan can be a component of a primary extractor or a secondary extractor in a crop cleaning system associated with the harvester. The material harvested by the harvester can pass through a crop cleaning system before moving onto the elevator 104. The extractor fan can be rotated to blow on the material, which can remove impurities and debris from the material. In some examples, the computing device can vary the rate at which the extractor fan rotates based on the amount of impurities in the material on the elevator 104. The computing device can increase the speed of the extractor fan if the amount of impurities exceeds a threshold. The computing device can cause the speed of the extractor fan to decrease if the amount of impurities is below a threshold. In some examples, if the extractor fan is rotated at a higher speed, the extractor fan can blow more impurities off the harvested material, resulting in a higher crop to impurity ratio. In this way, the computing device can determine the composition of the material and adjust the speed of the extractor fan to control the amount of impurities in the material.
In some examples, the harvester can include a primary extractor cleaning system. The primary extractor cleaning system can move around a primary extractor (e.g., primary extractor 110 of fig. 1) to clean the primary extractor. The computing device can disengage (e.g., shut down) the primary extractor cleaning system if the primary extractor cleaning system is too close to the 3D sensor 202 (e.g., a camera associated with the 3D sensor 202). This can reduce the accumulation of dust and debris on 3D sensor 202.
In some examples, the production measurement system 200 can measure characteristics of the elevator 104 when the elevator 104 does not include any material. The resulting measurements can serve as a baseline or calibration measurement that can be used to estimate the accumulation of dust and debris, and the deformation of the shape of the elevator 104 that may otherwise affect the net volume measurement. For example, the calibration measurement can be subtracted from the net volume measurement to determine the actual volume of material in the elevator 104. A low pass filter or probability filter (e.g., kalman filter) can be applied to the actual volume of material in the elevator 104 to improve accuracy.
In some examples, the yield measurement system 200 can determine whether there is no material in the elevator 104 (e.g., for initial calibration) by monitoring the volume of material on the elevator 104 and one or more parameters related to the harvester (e.g., ground speed, elevator speed, engine load, or engagement of the harvester). For example, if the ground speed of the harvester is zero mph for more than seven seconds while the lift 104 is running, the yield measurement system 200 may determine that there is no material in the lift 104. As another example, if the crop harvesting system is disengaged for more than five seconds while the lift 104 is running, the yield measurement system 200 may determine that there is no material in the lift 104. When the production measurement system 200 determines that there is no material in the elevator 104, the production measurement system 200 can automatically measure a characteristic of the elevator 104 (e.g., as described above), which generates or updates a calibration measurement. This process of dynamic calibration can estimate the amount of dust accumulation or deformation of the elevator 104 over time, thereby improving the accuracy of the production measurement system 200.
There are multiple possible mounting locations for the 3D sensor 202 for viewing the material carried by the elevator 104. In some examples, the 3D sensor 202 can be centered across the width of the elevator 104. This can eliminate or reduce bias with respect to non-uniform shapes of material that may be deposited on the elevator 104 paddle (e.g., paddle 502 shown in fig. 5). In some examples, the 3D sensor 202 can be positioned at the furthest distance possible from the elevator 104 (e.g., while avoiding collision with the primary extractor when the elevator 104 is raised or rotated). The 3D sensor 202 can also be positioned at an angle (e.g., 38 °) relative to the elevator plane that is not perpendicular to the elevator plane. For example, the 3D sensor 202 can be positioned at an angle of less than 90 ° relative to the plane of the elevator. Positioning and tilting 3D sensor 202 in this manner can enhance the results of image processing algorithms, as described below.
For example, the 3D sensor 202 can include at least two cameras. To generate a 3D contour of a scene captured by a camera, a computing device can apply an algorithm that matches pixels from a first image originating from a first camera to corresponding pixels in a second image from a second camera. This process can be repeated until a pixel in the first image is mapped to a corresponding pixel in the second image. However, this process may be adversely affected by the pattern of holes (e.g., holes 504 shown in fig. 5) that can be located in the back plate of the elevator 104. For example, rather than mapping a single pixel from the first image to a single pixel from the second image, pixels from the first image associated with apertures located in the backplane may be matched to a plurality of pixels from the second image associated with a plurality of apertures located in the backplane. This can produce errors in the output from the algorithm. In some examples, positioning the camera at an angle can cause perspective distortion in the image captured by the camera. This can allow the computing device to more easily find unique corresponding pixels between camera images, thereby minimizing correlation errors. In other examples, the output of the algorithm can be improved by making the pattern of holes in the backplate irregular, which can reduce the associated errors.
In some examples, the yield measurement system 200 can include an illumination system 204. The lighting system 204 can include one or more lights (e.g., bulbs or light emitting diodes). In some examples, the illumination system 204 can include one or more sensors (e.g., photodetectors) for detecting the amount of ambient light. The computing device can operate the one or more lights based on the detected level of ambient light from the one or more sensors.
In examples where the 3D sensor 202 includes a camera, the illumination system 204 can illuminate the field of view of the camera. This can allow the yield measurement system 200 to be used in environments with minimal or no ambient light. For example, the lighting system 204 can allow the production measurement system 200 to be used during dawn, night, dusk, or poor weather conditions (e.g., cloudy days).
Further, in examples where the 3D sensor 202 includes a camera, the illumination system 204 can reduce the exposure time of the camera. This can allow the exposure time to be fast enough to reduce or eliminate motion blur in the image captured by the camera, even if the lift 104 (and the material on the lift 104) is moving at a high rate. For example, to minimize the exposure time of the camera, the illumination system 204 can provide additional light to the scene captured by the camera. This additional light can sufficiently illuminate the scene so that the camera can capture images using short exposure times.
The yield measurement system 200 can include one or more paddle sensors 206 (e.g., hall effect sensors). In some examples, the paddle sensor 206 can be positioned on a side of the elevator 104. In other examples (e.g., the example shown in fig. 4), the paddle sensor 206 can be positioned below the lift 104. The paddle sensor 206 is capable of detecting when the paddle sensor 206 passes the paddle and transmitting an associated sensor signal to the computing device.
In some examples, the computing device can receive and use the paddle sensor signal to trigger the capture of data by the 3D sensor 202. For example, the computing device can receive a paddle sensor signal related to a paddle through the paddle sensor 206 and substantially simultaneously cause the 3D sensor 202 to capture data (e.g., to cause a camera associated with the 3D sensor 202 to capture an image). By using the paddle sensor 206 to trigger data capture, the paddle can be at substantially the same location within the detectable area of the 3D sensor 202 each time data is captured. This can improve the accuracy of the algorithm used to determine the volume of material in the elevator 104.
In some examples, the computing device can use the paddle sensor signal to determine the speed of the elevator 104. For example, a single paddle sensor 206 can be positioned on the side of the lift 104. As the paddle passes the paddle sensor 206, the paddle sensor 206 is able to detect the paddle and transmit an associated sensor signal to the computing device. If the paddles on the elevator 104 are evenly spaced, the computing device can divide the amount of spacing by the time period between the two sensor signals to determine the speed of the elevator 104. For example, if the time period between two sensor signals is 200ms and the spacing between the paddles is 20cm, the computing device can divide 20cm by 200ms to determine a speed of 1 m/s.
As another example, two paddle sensors 206 can be positioned on the sides of the lift 104. The computing device can determine the speed of the elevator based on the paddle sensor signals from the two paddle sensors 206 even if the paddles are not evenly spaced. For example, the computing device can determine an amount of time between when the paddle passes the first paddle sensor 206 (activates the first paddle sensor 206) and when the paddle passes the second paddle sensor 206 (activates the second paddle sensor 206). If the spacing between the two paddle sensors 206 is known, the computing device can calculate the speed of the elevator by dividing the amount of spacing by the amount of time between activation of the paddle sensors 206. For example, if the spacing between two paddle sensors 206 is 10cm and the time difference between activation of the two paddle sensors 206 is 0.1s, the computing device can divide 0.1s by 10cm to determine a speed of 1 m/s.
Additionally or alternatively, other methods can be used to determine the speed of the elevator 104. For example, the encoder can be positioned on a motor (e.g., a hydraulic motor) or a gear that moves the elevator 104. The computing device can use the sensor signals from the encoders to determine the speed of the elevator.
In examples where the 3D sensor 202 includes a camera, the computing device can use the position of the paddle in the camera image to determine the speed of the lift 104. For example, as shown in fig. 5, the dashed line 508 can represent the position of the paddle 502 as determined by the computing device based on the camera image. The computing device can use the position of the paddle 502, and the time between taking each image, to determine the speed of the elevator. For example, the computing device can determine the distance (e.g., 10cm) the paddle 502 moves between two images. The computing device can determine the speed of the elevator (1m/s) by dividing the distance the paddle 502 moves by the amount of time between taking two images (0.1 s). In some examples, the speed of paddle 502 determined based on the image data can be more accurate than the speed of paddle 502 determined based on paddle sensor 206. The computing device can also receive one or more parameters (e.g., engine speed) related to the harvester and use the parameters to improve the accuracy of the determined elevator speed.
Returning to fig. 2, the production measurement system 200 can use the data from the 3D sensor 202 and the speed of the elevator 104 to determine the production of material. For example, the computing device can use data from 3D sensor 202 to generate a 3D contour of a scene within a detectable area of 3D sensor 202. The computing device can use the 3D contour to determine the instantaneous volume of the desired crop on the elevator 104. The computing device can estimate the total volume of the desired crop carried by the lift 104 by multiplying the instantaneous volume by the speed of the lift. The computing device CAN also receive data related to the harvester (e.g., via a CAN bus connection to the electrical system of the harvester), such as the speed, GPS location, and operating status of the harvester. The computing device can determine an instantaneous yield measurement of the desired crop based on the total volume of the desired crop carried by the lift 104 and the data related to the harvester.
FIG. 6 is a block diagram illustrating an example of a computing device 612 for use with a yield measurement system according to one example. The computing device 612 can include a network interface 620. Network interface 620 can represent one or more components that facilitate a network connection. Examples include, but are not limited to, wired interfaces such as Ethernet, USB, IEEE1394, and/or wireless interfaces such as IEEE802.11, bluetooth, or radio interfaces for accessing a wireless telephony network (e.g., a transceiver/antenna for accessing a CDMA, GSM, UMTS, or other mobile communications network).
The computing device 612 can include an input/output interface 610. The I/O interface 610 can be used to facilitate connection to hardware for inputting data (e.g., buttons, switches, levers, touch-sensitive surfaces, or other user input devices) or outputting data (e.g., a display, touch screen display, or other user interface device). For example, the I/O interface 610 can be in wired or wireless communication with the 3D sensor 202 (e.g., a camera, a 3D laser scanner, an ultrasound transducer, a range sensor, a structured light camera, a 3D camera, or a flash lidar), the paddle sensor 206 (e.g., a hall effect sensor), the lighting system 204 (e.g., to detect low light and illuminate the field of view of the camera associated with the 3D sensor 202), and other sensors 618 (e.g., shaft encoders). In some examples, the computing device 612 is capable of wired or wireless communication with the 3D sensor 202, the paddle sensor 206, the lighting system 204, and the other sensors 618 through the network interface 620.
The I/O interface CAN communicate with or include a Controller Area Network (CAN) interface 611. In some examples, CAN interface 611 CAN communicate directly with bus 604 or another component of computing device 612. CAN interface 611 CAN be in wired (e.g., over a CAN bus) or wireless communication with harvester sensor 614 via a CAN bus and configured to receive data from harvester sensor 614. Harvester sensor 614 is capable of detecting various parameters of the harvester. For example, harvester sensor 614 can detect ground speed, GPS position, primary extractor speed, secondary extractor speed, primary fan speed, secondary fan speed, engine rmp, heading, crop processing engagement, operating conditions, parameters related to the top cutter, and other parameters of the harvester. In some examples, harvester sensor 614 is capable of detecting environmental characteristics external to the harvester, such as harvest width and farm conditions (e.g., burning versus green sugar cane). Harvester sensor 614 CAN transmit a sensor signal to CAN interface 611.
The computing device 612 includes a processing device 602. The processing device 602 can perform one or more operations for determining a yield measurement of a material. The processing device 602 is capable of executing the instructions 608 stored in the storage device 606 to perform operations. The processing device 602 can include one processing device or a plurality of processing devices. Non-limiting examples of processing device 602 include a field programmable gate array ("FPGA"), an application specific integrated circuit ("ASIC"), a microprocessor, and the like.
The processing device 602 can be communicatively coupled to a storage device 606 through a bus 604. Non-volatile storage 606 may include any type of storage device that retains stored information when power is removed. Non-limiting examples of storage 606 include electrically erasable and programmable read only memory ("EEPROM"), flash memory, or any other type of non-volatile memory. In some aspects, at least some of the storage devices 606 can include a medium from which the processing device 602 can read the instructions 608. The computer readable medium can include electronic, optical, magnetic, or other storage devices that can provide computer readable instructions or other program code to the processing device 602. Non-limiting examples of a computer-readable medium include, but are not limited to, magnetic disk(s), memory chip(s), ROM, random access memory ("RAM"), ASIC, configuration processor, optical storage, or any other medium from which a computer processor can read instructions. The instructions may comprise processor-specific instructions generated by a compiler or interpreter from code written in any suitable computer programming language (e.g., C, C + +, C #, etc., among others). In some examples, the memory 606 can include an image processing module (not shown). Processing device 602 can use an image processing module to perform one or more image processing tasks on data received from 3D sensor 202.
In some examples, processing device 602 can receive data from 3D sensor 202. The processing device 602 can apply the data to an algorithm to determine an instantaneous volume of material on a portion of the elevator. The processing device 602 may also be capable of receiving sensor data from the paddle sensor 206. The processing device 602 can apply the sensor data from the paddle sensor 206 to an algorithm to determine the speed of the elevator. The processing device 602 can multiply the instantaneous volume by the speed of the elevator to estimate the total volume of material on the elevator. Processing device 602 may also be capable of receiving harvester data from harvester sensor 614. The processing device 602 can integrate harvester data with estimates of the total volume of material to produce a real-time production map.
Fig. 7 is a block diagram of an example of a process 700 for measuring a volume of material carried by an elevator according to an example. Some examples can include more steps than shown in fig. 7, fewer steps than shown in fig. 7, or different steps than shown in fig. 7. The following steps are described with reference to the components described above in connection with the computing device 612 shown in fig. 6.
In block 702, the processing device 602 processes data from the 3D sensor 202. Processing device 602 can receive data through a wired or wireless connection with 3D sensor 202. The data can be related to the portion of the elevator that is within the detectable area of 3D sensor 202.
In some examples, the processing device 602 can apply one or more algorithms to the data to process the data. For example, the processing device 602 can correct the data, perform disparity calculations on the data, and perform speckle filtering on the data.
In block 704, the processing device 602 generates a 3D map (e.g., a 3D topological map) based on the processed data. The processing device 602 can execute one or more algorithms to generate the 3D map. In some examples, the processing device 602 can apply triangulation to generate a 3D contour of the processed data. Triangulation can include matching pixels from a first image captured by a first camera to related pixels in a second image captured by a second camera. The difference between a pixel position in the first image and a corresponding pixel position in the second image can be a disparity. Based on the pixel location in the first image, the disparity, and the distance (e.g., in meters) in the real space between the first camera and the second camera, the computing device can determine a 3D location in real space associated with the pixel. This process can be repeated for all pixels in the first and second images to produce a 3D contour corresponding to the processed camera data.
In some examples, when generating the 3D contour, the processing device 602 can change the coordinate system of the 3D contour to a frame aligned with the elevator plane such that the y-axis follows the paddle direction, the z-axis points from the elevator to the 3D sensor 202 (e.g., a camera in the 3D sensor), and the X is orthogonal to the y-axis and the z-axis. The origin of the frame can be located at the center of the detectable area of 3D sensor 202 (e.g., within the field of view of the camera of 3D sensor 202). The processing device 602 can divide the 3D contour into a square grid (e.g., 1.25cm by 1.25cm in size) associated with the plane of the elevator. The processing means 602 can discard points falling outside the square grid. For each square in the square grid, the processing device 602 can determine a robust maximum height relative to the plane of the elevator (e.g., using a median filter). Based on the square grid and the robust maximum height, the processing device 602 is able to generate a 3D map. Each cell in the 3D map can have an associated robust maximum height.
In block 706, the processing device 602 filters the 3D map. The processing device 602 can filter the 3D map to remove noise, erroneous data, and extraneous data. This may result in a more accurate 3D map. For example, the processing device 602 can filter out a portion of the 3D map associated with the calibration data (e.g., as discussed with reference to block 709) using a spatial filter. For example, the processing device 602 can filter portions of a 3D map associated with an elevator paddle. This can allow the processing device 602 to produce instantaneous volume measurements of the volume of the undoped paddle.
In block 708, the processing device 602 determines whether the production measurement system is in a calibration mode. For example, processing device 602 can consult memory 606 for the position to determine whether the production measurement system is in a calibration mode. If the production measurement system is in calibration mode, process 700 can continue to block 709.
In block 709, the processing device 602 generates calibration data. The processing device 602 can generate calibration data by analyzing the 3D map to determine the position of the elevator backplane and any deformations (e.g., bends or ridges) in the elevator backplane. The processing device 602 can also analyze the 3D map to determine characteristics of the paddle. The position of the elevator back plate, any deformations in the elevator back plate, and the characteristics of the paddle can be included in the calibration data.
In block 710, the processing device 602 stores the calibration data. In some examples, the processing device 602 can store the calibration data in the memory 606. In other examples, the processing device 602 may store the data at other locations, such as in a remote database or computing device 612 (e.g., by communicating with the remote database or computing device 612 via the network interface 620).
If the production measurement system is not in the calibration mode, the process 700 can continue to block 712. In block 712, the processing device 602 determines a volume of the material based on the filtered 3D map. For example, the processing device 602 can subtract a calibration value related to the plane of the elevator backboard from the robust maximum height of the unit (e.g., determined in block 704). This can result in a height of material in the cell. Since each cell can have a known area (e.g., 1.25cm x 1.25cm to 1.5625 cm)2Area) so the processing device 602 can multiply the area of the cell by the height of the material in the cell to determine the volume of the material in the cell. The processing device 602 can repeat this process for all units to determine the total instantaneous volume of material on the elevator.
In block 714, the processing device 602 can estimate a composition of the material detectable by the 3D sensor 202. For example, data from the 3D sensor 202 can be correlated with an image of a surface area of the material on the elevator. The processing device 602 can determine characteristics (e.g., size, shape, texture, and color) associated with a surface region of a material. Based on the characteristics, the processing device 602 can determine a desired material to foreign material ratio in the surface region of the material. For example, the processing device 602 may determine that the surface area of the material includes 80% of the desired material and 20% of the impurities. Based on the ratio of the desired material to the foreign material, the processing device 602 can apply a scaling factor to the instantaneous volume measurement (e.g., determined in block 712) to estimate the volume of the material associated with the desired material.
In block 716, the processing device 602 determines the speed of the elevator. In some examples, the processing device 602 can rely on sensor signals from the paddle sensor 206 to determine the speed of the lift. In other examples, processing device 602 can apply an algorithm to data from 3D sensor 202 to determine the speed of the elevator. In still other examples, the processing device 602 can use sensor signals from other sensors 618 (e.g., shaft encoders) to determine the speed of the elevator.
In block 718, the processing device 602 estimates a total instantaneous volume of the desired material on the elevator. In some examples, the processing device 602 can apply a scaling factor to the instantaneous volume estimated from block 707 (based on the composition determined in block 714). This can produce an estimate of the instantaneous volume of the desired material. The processing device 602 can multiply the instantaneous volume estimate by the speed of the elevator to determine a desired total instantaneous volume of material on the elevator.
In block 720, the processing device 602 determines an instantaneous yield of the desired material. The processing device 602 can determine the instantaneous yield of the desired material based on the total instantaneous volume of the desired material and the harvester parameters. For example, processing device 602 can receive data related to the speed, GPS location, or orientation of the harvester from harvester sensor 614. The processing device 602 can integrate the total instantaneous volume of the desired material (e.g., from block 718) with the GPS location to determine the instantaneous production of the desired material at that GPS location. In this way, the processing device 602 is able to generate a real-time yield map representing the yield of desired material at a plurality of locations on the farm. In some examples, the instantaneous production can be integrated over time, enabling a measurement of the cumulative production of harvested material to be produced. The instantaneous production can be further tuned based on the weight of the material, which can be determined when the material arrives at the processing mill or by using in-farm density or weight measurement methods.
FIG. 10 illustrates yield graphs 1002a-d output by a yield measurement system according to an example. The yield map 1002a shows a yield map generated using raw yield data. In some examples, one or more algorithms can be applied to the raw yield data to improve the accuracy of the yield map.
For example, the harvested material may not always flow steadily through the harvester. Rather, material may accumulate in the harvester before passing onto the elevator 104. If the material accumulates and passes onto the elevator 104 in batches, the production measurement system 200 may measure an incorrect high production value. The computing device is able to process these production "spikes" and spatially redistribute the high production values by tracking the time and spatial area covered during the accumulation cycle. For example, the computing device can apply the time at which the production spike occurred and one or more harvester parameters (e.g., GPS location or harvester chopper pressure) to an algorithm to spatially redistribute the high production value. The algorithm can be dynamically selected by the user from a number of options. For example, the options can include algorithms for determining: (i) mean flow during accumulation region; or (ii) fitting a flow based on a pattern of harvesters previously passing through the same area of the farm. This can reduce errors in the yield map due to accumulation of material, thereby improving the accuracy and precision of the yield.
As another example, the computing device can eliminate data points collected by the harvester when the harvester is not collecting material. The computing device can determine when the harvester is not harvesting crop based on one or more parameters associated with the harvester. For example, the computing device can determine whether the harvester is not harvesting crop based on the base cutter height (e.g., if the base cutter height is greater than or less than a threshold), the drive engagement of the lift, the instantaneous volume of material on the lift (e.g., whether the instantaneous volume is greater than or less than a threshold), or the GPS location (e.g., whether the harvester is positioned in an area known to have no crop or to be outside of a predetermined farm boundary). Yield map 1002b illustrates an example of a yield map in which raw yield data collected by a harvester when not harvesting crop has been eliminated.
As yet another example, there may be a time delay between when data has been actually collected by the harvester from the farm and when the GPS receiver determines the GPS location associated with the material. This time delay enables the GPS receiver to mark the acquired material with a GPS position offset by a certain distance. The computing device can apply one or more algorithms to correct for such inaccuracies. For example, based on data from harvester sensor 614 (e.g., ground speed of the harvester and speed of the lift), the computing device can determine the distance that the GPS location may be off. The computing device can correct the GPS location of the material based on the distance. The corrected GPS position can more accurately reflect the precise spatial location in the farm from which the material was collected. The yield map 1002c shows an example of a yield map generated using a corrected GPS position.
As another example, spatial filtering can be used to improve the visual appearance of the production data (e.g., a production map). Spatial filtering, rather than time series filtering, can allow for multidimensional filtering of production data. The characteristics of the spatial filtering can be adjusted to meet end user goals. For example, Kriging filtering or inverse weighted distance filtering can be used to produce a smooth response of yield data across multiple areas in a crop where crop is collected. The yield map 1002d shows an example of a yield map generated using the corrected GPS position and spatial filtering.
In some examples, computing device 612 may also be capable of producing real-time measurements of machine quality productivity. Machine mass productivity can represent the amount of material produced per hour (e.g., in tons). Computing device 612 is capable of determining the machine quality production rate based on the volume (or yield) of material and the amount of time it takes to produce the volume (or yield) of the material. Machine quality productivity can be used to assess capital asset utilization and optimize support equipment logistics and harvest logistics.
In some examples, production data and machine quality productivity can be provided to an operator via a user interface (e.g., a dynamic user interface). For example, the yield map and machine quality productivity measurements can be provided through a user interface that is output on a display in communication with the computing device 612. This can facilitate data acquisition and operational feedback. In some examples, yield data can be used to optimize transportation of harvested crop and harvesting-related support equipment logistics. Machine quality productivity can guide business rules related to service, maintenance, and operator training of a production fleet (e.g., a sugarcane production fleet).
Base cutter height control system
Certain aspects and features of the present disclosure relate to a base cutter height control system for measuring the height of a base cutter located on a harvester. The base cutter height control system can include a camera system having at least two cameras. The camera can capture images of material (e.g., stubble) cut by the base cutter and passing beneath the harvester. The base cutter height control system can apply image processing to the images to determine the height of the base cutter. Based on the determined base cutter height, the base cutter height control system can change the base cutter height (e.g., to an optimal or preferred height).
In some examples, the harvester can include both a yield measurement system (described above) and a base cutter height control system (described below).
Fig. 11 is a side perspective view of an example of a harvester 100 for use with a base cutter height control system 1100 according to an example. Base cutter height control system 1100 can include a 3D sensor 1102 mounted to harvester 100. The 3D sensor can include one or more of a camera, a 3D laser scanner, an ultrasound transducer, a range sensor, a structured light camera, a 3D camera, and a flash lidar.
The 3D sensor 1102 can be mounted in any suitable location for detecting one or more characteristics of the ground area being processed by the blades of the base cutter or having been previously processed by the blades of the base cutter. For example, 3D sensor 1102 can be positioned below harvester 100, at a front of harvester 100, or at a rear of harvester 100. In the example shown in fig. 12, a 3D sensor 1102 is mounted below the harvester 100 and between the rear wheels of the harvester. In this example, 3D sensor 1102 is able to detect an area 1202 located directly behind harvester 100 and between the rear wheels of harvester 100.
In some examples, base cutter height control system 1100 can include debris barrier 1104. The debris barrier 1104 can be positioned near, around, or in front of the 3D sensor 1102 to prevent dust or debris from entering a detectable area (e.g., field of view) of the 3D sensor 1102. In some examples, debris barrier 1104 can include a curtain or baffle (e.g., a plastic or metal baffle).
Fig. 13 is a perspective view of an example of a 3D sensor 1102 mounted to the underside of a harvester 1300 for use with a base cutter height control system according to an example. The 3D sensor 1102 can include two or more cameras. The camera can be constructed similarly to the camera described with reference to fig. 2-3.
The 3D sensor 1102 can be mounted at an angle (e.g., pitch angle) to the harvester. The angle can be between 0 degrees and 90 degrees relative to a ground plane (e.g., a geometric plane). In some examples, the angle can be configured to allow the 3D sensor 1102 to view areas that are not directly perpendicular to the ground. For example, as shown in fig. 14, the 3D sensor 1102 can be mounted to the harvester at an angle of 13.30 degrees.
FIG. 15 is a perspective view of an example of a lighting system 1502 for use with a base cutter height control system according to an example. The lighting system 1502 can include one or more lights 1504a, 1504b and one or more sensors (not shown) for detecting an amount of ambient light. For example, the lighting system 1502 can include one light 1504a positioned at one lateral end of the 3D sensor 1102 and another light 1504b positioned at the other lateral end of the 3D sensor 1102. The lights 1504a, 1504b can be separate from or integrally formed with the housing of the 3D sensor 1102. In some examples, the lamps 1504a, 1504b can include a protective housing configured to protect the lamps 1504a, 1504b from dust and debris. The protective housing can comprise plastic, rubber, perspex, or metal.
The base cutter height control system is capable of operating the lights 1504a, 1504 b. In some examples, the base cutter height control system can operate the lights 1504a, 1504b based on the detected level of ambient light from one or more ambient light sensors. This can allow the base cutter height control system to be used with low to no ambient light. This can also allow the camera associated with the 3D sensor 1102 to have a short enough exposure time to reduce or eliminate motion blur even if the harvester is moving at a high rate.
The base cutter height control system can include a computing device (e.g., similar to computing device 612 of fig. 6). In some examples, the computing device can receive a sensor signal from an ambient light sensor in the lighting system and operate the lights based on the sensor signal.
The computing device can also receive data from the 3D sensor 1102. The data can be related to cut material (e.g., stubble) passing under or near the harvester. The computing device can apply one or more algorithms (e.g., stereo vision algorithms) to the data (or a filtered version of the data) to generate a 2.5-dimensional (3D) map of the ground. Based on the 3D map, the computing device can determine a contour of the ground.
In some examples, the computing device can use the contour of the ground to determine (i) the row lateral position; (ii) row height above ground; (iii) a material height; (iv) the lateral position of the material; and (v) a desired base cutter height setting. In some examples, the computing device can generate a geographic map representing material elevation data associated with a plurality of locations in a field.
FIG. 16 is a block diagram of an example of a process 1600 for controlling base cutter height, according to an example. Some examples can include fewer steps than shown in fig. 16, more steps than shown in fig. 16, or different steps than shown in fig. 16. The following steps are described with reference to the components described above with respect to the computing device 612 shown in fig. 6.
In block 1602, the processing device 602 processes data from the 3D sensor 202. Processing device 602 can receive data through a wired or wireless connection with 3D sensor 202. This data can be correlated to the material within the detectable region of 3D sensor 202. The data can be or can be converted into a 3D contour by the processing means 602. For example, the processing device 602 can use triangulation or any other method to convert the data into 3D contours.
The processing device 602 can apply one or more algorithms to the data to process the data. In some examples, the processing device 602 can filter the data to remove noise and erroneous data. For example, the computing device can apply a filter to the data to reduce the effect of material in the air (e.g., slices of sugar cane) that obscures the field of view of the camera associated with the 3D sensor 202.
In some examples, the processing device 602 can calibrate the data. For example, the harvester can be driven on flat ground. Processing device 602 can use data from 3D sensor 202 to determine the position and orientation of 3D sensor 202 relative to the ground. The processing device 602 can store the position and orientation and use the position and orientation to calibrate the data.
In block 1604, the processing device 602 generates a 3D map based on the processed data. The 3D map can include a plurality of cells. Each cell can include a rectangular region corresponding to the relevant region in real space. For example, as shown in fig. 17, the 3D map 1702 can include a plurality of cells. The center of each cell can be represented by point 1706. In some examples, each cell in the 3D map can be associated with a parameter that: the parameter is related to the cell area in real space. For example, the parameters can include the height of the material (e.g., the height of the stubble), and the standard deviation of the height of the material relative to the unit area in real space. The boundary 1704 of the 3D map can define the bounds of the 3D map.
To generate the 3D map, the processing device 602 can map the 3D data points to corresponding cells. For example, 3D data points can be mapped to a particular cell 1708. In some examples, multiple 3D data points can be mapped to the same specific cell 1708.
In block 1606, the processing device 602 determines an upper 3D map and a lower 3D map. The lower 3D map can include a 3D map relating to a feature located in a plane at or near the ground level. The upper 3D map can include a 3D map relating to features located in a plane along or near the top of the material (e.g., the top of the stubble). The processing device 602 can determine an upper 3D map and a lower 3D map based on the 3D map (e.g., generated in block 1604). The processing device 602 can use a high percentage (e.g., 90%) of the height of the 3D data points relative to the ground to determine the upper 3D map. Process 602 can use a low percentage (e.g., 10%) of the height of the 3D data points relative to the ground to determine the lower 3D map.
In block 1608, the processing device 602 determines a row lateral position and a row height (e.g., a lateral position and a height of a region in real space associated with the row). The processing means 602 is able to determine the row position based on the lower 3D map. The processing device 602 can fit a model (e.g., a parabola) to the lower 3D map. For example, as shown in fig. 18, the processing device 602 can fit a parabola 1810 to the lower 3D map 1802. Processing device 602 can determine the lateral position of the row based on the position of vertex 1808 of parabola 1810 along the x-axis. In some examples, if 3D sensor 202 is positioned at the lateral middle of the wheels (or tracks) of the harvester, the center of the x-axis can represent the lateral middle between the wheels (or tracks) of the harvester.
In some examples, processing device 602 can determine row height 1806 based on vertex 1808 of parabola 1810. For example, the processing device 602 can determine the row height 1806 based on the height of the vertex 1808 of the parabola (e.g., 0.1 m).
In block 1610, the processing device 602 determines a height of the material. The processing device 602 can determine the height of the material based on the upper 3D map. For example, as shown in fig. 18, the processing device 602 can generate an upper 3D map 1804. To determine the height of the material, the processing device 602 can subtract the height of the lower 3D map 1802 from the height of the upper 3D map 1804 (e.g., 1.5m) at the vertex 1808. The difference between the height of the lower 3D map 1802 at the vertex 1808 and the upper 3D map 1804 can be the height of the material.
In block 1612, the processing device 602 determines a new base cutter height (or orientation). The processing device 602 may determine a new base cutter height based on the determined material height (e.g., from block 1610), the current base cutter height setting, and user input data. For example, the user may enter a desired material level into the computing device 612 (e.g., via a keyboard or touch screen display). The processing device 602 may determine a new base cutter height (or orientation) based on the difference between the desired material height and the determined material height. In some examples, the processing device 602 can use scaling, hysteresis, or other algorithms to generate the new base cutter height. For example, the processing device 602 may determine a new base cutter height in proportion to a difference between the desired material height and the determined material height.
In some examples, the processing device 602 can determine a new base cutter height based on the calibration factor. For example, a user can manipulate the base cutter height until the desired height of material cut by the harvester is reached. The user may cause the processing device 602 to determine the height of the material (e.g., using the method described in block 1602-. This height can be used as a calibration factor. The processing device 602 can compare the height of the material cut by the harvester later with a calibration factor. The processing device 602 can determine a new base cutter height based on the difference between the height of the material and the calibration factor.
In some examples, when a new base cutter is determined, the processing device 602 may change the base cutter height to the new base cutter height. In this manner, the base cutter control system can function as a feedback loop.
In block 1614, the processing device 602 can determine the number of pieces of dropped (e.g., cut) material, the length of the dropped pieces of material, and the number of material roots based on the data from the 3D sensor 202. For example, the processing device 602 can extract features from the data. The processing device 602 can extract features from the data by filtering, determining texture information associated with the data, and determining 2D and 3D edges associated with the data. The processing device 602 is also capable of determining the entropy, frequency, and first and higher order derivatives associated with the data. The processing device 602 classifies (e.g., by applying a classifier or regression) the features to detect and determine (i) the number of dropped material sheets; (ii) the length of the falling piece of material; and (iii) the number of visible material roots.
In some examples, the processing device 602 may be capable of estimating damage due to base cutter heights that are too low (e.g., with respect to a desired or optimal base cutter height). If the base cutters are too low in height, the base cutters can penetrate the row of material and extract or damage the material roots. The processing device 602 can estimate damage based on one or more of the number of dropped material pieces, the length of the dropped material pieces, and the number of visible material roots.
FIG. 19 is an example of a geographic map 1900 output by a base cutter height control system according to an example. In some examples, the geographic map 1900 can be provided through a user interface that is output onto a display. This can facilitate data acquisition and operational feedback.
The geographic map 1900 can include areas 1902, 1904, 1906 that differ in color. In some examples, each of the differently colored regions 1902, 1904, 1906 on the figure can be highly correlated with different materials. For example, colored areas 1902 can be associated with geographic areas having high material. Colored area 1904 can be associated with a geographic area having low material. Colored area 1906 can be associated with a geographic area having mid-height material. In other examples, each of the differently colored regions 1902, 1904, 1906 on the graph can be related to the number of pieces of dropped material, the length of the pieces of dropped material, or the number of roots of material. For example, colored area 1902 can be associated with a geographic area having a large number of pieces of drop material. Colored region 1904 can be associated with a geographic region having a low number of dropped pieces of material. Colored region 1906 can be associated with a geographic region having a moderate number of dropped material pieces.
The base cutter height control system can be based on (i) the material height, the number of dropped material pieces, the length of dropped material pieces, or the number of material roots; and (ii) data from one or more harvester sensors (e.g., harvester sensor 614 of fig. 6) to produce colored areas 1902, 1904, 1906. For example, when the base cutter height control system determines the material height at a particular location, the base cutter height control system can receive GPS data (e.g., latitude and longitude) related to the particular location. The base cutter height control system can position the GPS location on the geographic map 1900 and update the color associated with the GPS location based on the material height. As another example, when the base cutter height system determines the number of dropped material pieces at a particular location, the base cutter height control system can receive GPS data (e.g., latitude and longitude) related to the particular location. The base cutter height control system can position the GPS location on the geographical map 1900 and update the color associated with the GPS location based on the number of dropped material pieces.
The foregoing description of certain embodiments, including illustrative embodiments, has been presented for the purposes of illustration and description only and is not intended to be exhaustive or limited to the precise forms disclosed. Numerous modifications, variations, and uses will be apparent to those skilled in the art without departing from the scope of the disclosure.
Claims (36)
1. A system for yield measurement of a harvester, the system comprising:
a stereo camera system configured to detect an area of a lift on a harvester and to emit an image related to the area, the lift having a lift back plate with an irregular pattern of apertures configured to reduce volumetric determination errors;
a processing device in communication with the stereo camera system; and
a storage device having stored therein instructions executable by the processing device to cause the processing device to:
receiving the image;
generating a three-dimensional, 3D contour of the region at least in part by analyzing the images using a triangulation in which a first set of pixels in a first image from a first camera of the stereoscopic camera system are associated with a second set of pixels in a second image from a second camera of the stereoscopic camera system, the 3D contour comprising square meshes, each square in the square meshes having a predetermined area and a corresponding height relative to a plane of the elevator;
filtering out data points from the 3D profile corresponding to a paddle on the elevator to produce a filtered 3D profile; and
determining a volume of material on the elevator based on the filtered 3D profile.
2. The system of claim 1, further comprising a sensor configured to detect a parameter of the harvester and transmit a signal related to the parameter to the processing device, wherein the storage device further comprises instructions executable by the processing device to cause the processing device to:
receiving the signal; and
generating a three-dimensional 3D map based on the signals;
determining a volume of the material based on the 3D map; and
determining a yield of the material based on the volume of the material and the signal.
3. The system of claim 2, wherein the parameter comprises GPS position, speed, direction, or crop handling engagement.
4. The system of claim 2, wherein the storage device further comprises instructions executable by the processing device to cause the processing device to:
generating a corrected GPS position by modifying the GPS position related to the production by distance;
spatially filtering the yield to produce a filtered yield value; and
a production map is produced based on the filtered production values and the corrected GPS position.
5. The system of claim 1, wherein the storage device further comprises instructions executable by the processing device for causing the processing device to:
determining a composition of the material by analyzing a color and texture of the material in the image, wherein the composition comprises a first percentage of material attributable to a target material and a second percentage of material attributable to a foreign material; and
applying a scaling factor to a volume of the material based on the composition to determine a calibration volume.
6. The system of claim 5, wherein the storage device further comprises instructions executable by the processing device for causing the processing device to:
varying a speed of a fan associated with the primary extractor or the secondary extractor based on the composition.
7. The system of claim 5, wherein the storage device further comprises instructions executable by the processing device for causing the processing device to:
operating the stereo camera system when the elevator does not include material;
receiving the image from the stereo camera system;
determining a baseline volume based on the image; and
modifying the calibrated volume based on the baseline volume.
8. The system of claim 5, wherein the storage device further comprises instructions executable by the processing device for causing the processing device to determine the composition of the material by:
determining that a first portion of an image corresponds to the elevator and a second portion of the image corresponds to the material based on the first color of the elevator being different from the second color of the material.
9. The system of claim 1, further comprising a lighting system, the lighting system comprising: a sensor configured to detect an amount of ambient light and at least one light positioned to illuminate an area of the lift, wherein the memory device further includes instructions executable by the processing device to cause the processing device to
Operating the at least one light to illuminate an area of the elevator based on the detected amount of ambient light.
10. The system of claim 1, further comprising a paddle sensor configured to detect a position of a paddle on the lift and transmit a signal to the processing device, wherein the storage device further comprises instructions executable by the processing device to cause the processing device to:
receiving the signal;
determining a speed of the elevator based on the signal; and
operating the stereo camera system based on the signal.
11. The system of claim 1, wherein the storage device further comprises instructions executable by the processing device for causing the processing device to:
determining a position of a paddle on the lift based on an image from the stereoscopic camera system by identifying the paddle in the image from the stereoscopic camera system; and
determining a speed of the lift based on the position of the paddle.
12. A method for yield measurement of a harvester, the method comprising:
receiving, by a processing device, an image from a stereo camera system, the image being an image of an area of a hoist of a harvester, the hoist having a hoist back plate with an irregular pattern of apertures configured to reduce volumetric determination errors;
generating, by the processing device, a three-dimensional 3D contour of a region of the lift at least in part by analyzing the images using triangulation in which a first set of pixels in a first image from a first camera of the stereoscopic camera system are associated with a second set of pixels in a second image from a second camera of the stereoscopic camera system, the 3D contour comprising square meshes, each square in the square meshes having a predetermined area and a corresponding height relative to a plane of the lift;
filtering, by the processing device and from the 3D contour, data points corresponding to a paddle on the elevator to produce a filtered 3D contour; and
determining, by the processing device, a volume of material on the elevator based on the filtered 3D profile.
13. The method of claim 12, further comprising:
calibrating the 3D contour based on calibration data, wherein the calibration data is determined using other images from the stereo camera system generated before the material is positioned in the elevator, and wherein the calibration data accounts for (i) a position of a back plate of the elevator, (ii) any deformation in the back plate of the elevator, and (iii) characteristics of a paddle on the elevator.
14. The method of claim 12, further comprising:
determining a speed of the elevator; and
multiplying the speed of the elevator by the volume to determine a total volume of material on the elevator.
15. The method of claim 12, further comprising:
determining a composition of a volume of material on the elevator by:
dividing the image into a plurality of segmented regions based on visual features of the material in the elevator;
generating a corrected segmented region by correcting the segmented region for at least one of illumination, scale, and perspective;
performing feature extraction on the corrected segmented region to determine one or more features in the corrected segmented region; and
classifying the one or more features as impurities or target material to determine a composition of the material on the elevator; and
modifying a volume of material on the elevator based on the composition.
16. The method of claim 15, further comprising varying a speed of a fan associated with the primary extractor or the secondary extractor based on a composition of the volume of the material.
17. The method of claim 12, further comprising:
receiving a signal from a sensor related to a parameter of the harvester; and
producing a production map based on the volume of the material and the parameter.
18. The method of claim 17, wherein generating the yield map further comprises:
generating a yield based on the volume of the material;
generating a corrected GPS position by modifying the parameter by distance;
spatially filtering the yield to produce a filtered yield value; and
generating the yield map based on the filtered yield value and the corrected GPS position.
19. A harvester, the harvester comprising:
an elevator having an elevator backplate with an irregular pattern of holes configured to reduce volumetric errors; and
a stereo camera system coupled to the harvesting machine and configured to detect an area associated with the lift and to emit images associated with the area, wherein the harvesting machine is configured to:
for generating a three-dimensional 3D contour with the region of the lift by analyzing the images using a triangulation in which a first set of pixels in a first image from a first camera of the stereoscopic camera system is associated with a second set of pixels in a second image from a second camera of the stereoscopic camera system;
adjusting a coordinate plane of the 3D contour to align with a plane of the lift such that the coordinate plane of the 3D contour includes (i) a first axis oriented in a direction of movement of a paddle on the lift, (ii) a second axis oriented from the lift toward the stereo camera system, and (iii) a third axis orthogonal to the first axis and the second axis;
determining a composition of a material by analyzing the 3D profile of the region of the elevator; and
determining a volume of crop contained in the material based on the composition of the material.
20. The harvester of claim 19, further comprising a paddle sensor configured to detect a position of a paddle on the lift and to emit a paddle sensor signal usable for:
determining a speed of the elevator; and
operating the stereo camera system.
21. The harvester of claim 19, further comprising a lighting system, said lighting system comprising:
a sensor configured to detect an amount of ambient light; and
a plurality of lights positioned to illuminate the area of the lift and separate from the stereo camera system,
wherein the harvester is configured to operate the plurality of lights to illuminate the area of the lift based on the amount of ambient light detected using the sensor.
22. The harvester of claim 19, further comprising a sensor configured to detect a parameter of the harvester and to emit a sensor signal related to the parameter that is usable for:
determining a yield of the crop based on the volume of material and the sensor signal.
23. The harvester of claim 22, wherein said yield can be used in a yield map.
24. The harvester of claim 19, wherein the composition of said material can be used to vary the speed of a fan associated with the primary extractor or the secondary extractor.
25. A system for base cutter height control of a harvester, the system comprising:
a harvester, comprising:
a base cutter; and
a stereo camera system positioned below the harvester, the stereo camera system configured to capture an area below or behind the harvester and to emit an image of the area; a processing device in communication with the stereo camera system; and
a storage device having instructions stored thereon that are executable by the processing device for causing the processing device to:
generating three-dimensional of the region by analyzing the image using triangulation
A 3D contour in which a first set of pixels in a first image from a first camera of the stereoscopic camera system is associated with a second set of pixels in a second image from a second camera of the stereoscopic camera system; and
modifying a height of the base cutter based on the 3D profile.
26. The system of claim 25, wherein the storage device further comprises instructions executable by the processing device for causing the processing device to:
determining a lateral position of a row of stubbles or a height of the stubbles based on the 3D contour of the region; and
modifying the height of the base cutter based on a lateral position of the row of stubbles or a height of the stubbles.
27. The system of claim 25, further comprising a debris barrier configured to protect the stereoscopic camera system from damage or debris.
28. The system of claim 25, further comprising a lighting system, the lighting system comprising:
a sensor configured to detect an amount of ambient light; and
at least one light positioned below the harvester for illuminating the area.
29. The system of claim 25, wherein the storage device further comprises instructions executable by the processing device for causing the processing device to:
receiving an image from the stereo camera system;
determining a calibration factor by analyzing the image; and
determining the height of the base cutter based on the calibration factor.
30. The system of claim 25, further comprising a sensor configured to detect a position of the harvester and emit a sensor signal related to the position, and wherein the storage device further comprises instructions executable by the processing device for causing the processing device to:
analyzing the image to determine information about material depicted in the image, the information comprising: the height of the material, the number of pieces of dropped material, the length of the pieces of dropped material, or the number of roots of the material; and
generating a geographic map based on the location of the harvester and the information.
31. A method for base cutter height control for a harvester, the method comprising:
receiving, by a processing device, an image from a stereo camera system positioned below a harvester, the harvester including a base cutter, the image depicting an area below or behind the harvester;
generating, by the processing device, a three-dimensional, 3-D contour of the region by analyzing the images using a triangulation in which a first set of pixels in a first image from a first camera of the stereoscopic camera system are associated with a second set of pixels in a second image from a second camera of the stereoscopic camera system; and
modifying, by the processing device, a height of the base cutter based on the 3D profile.
32. The method of claim 31, further comprising:
filtering the image from the stereo camera system to generate a filtered image;
using the filtered image, a lateral position of a line of material depicted in the image, or a height of the line of material depicted in the image, is determined.
33. The method of claim 32, further comprising:
calibrating the height of the line of material based on calibration data, wherein the calibration data is determined using (i) other images from the stereo camera system and (ii) user input.
34. The method of claim 32, further comprising:
receiving a signal from a sensor indicative of a position of the harvester; and
generating a geographic map based on the location of the harvester and a height of the row of material.
35. The method of claim 34, further comprising:
analyzing the image to determine information about material depicted in the image, the information comprising: the number of pieces of dropped material, the length of the pieces of dropped material, or the number of material roots; and
generating the geographic map based on the location of the harvester and the information.
36. The method of claim 31, wherein filtering the image comprises reducing an effect of airborne debris on the 3D contour.
Applications Claiming Priority (4)
| Application Number | Priority Date | Filing Date | Title |
|---|---|---|---|
| US201361898600P | 2013-11-01 | 2013-11-01 | |
| US61/898,600 | 2013-11-01 | ||
| US14/527,152 US10371561B2 (en) | 2013-11-01 | 2014-10-29 | Yield measurement and base cutter height control systems for a harvester |
| US14/527,152 | 2014-10-29 |
Publications (2)
| Publication Number | Publication Date |
|---|---|
| CN104718874A CN104718874A (en) | 2015-06-24 |
| CN104718874B true CN104718874B (en) | 2020-03-03 |
Family
ID=53006743
Family Applications (1)
| Application Number | Title | Priority Date | Filing Date |
|---|---|---|---|
| CN201410602449.5A Active CN104718874B (en) | 2013-11-01 | 2014-10-31 | Yield measurement and base cutter height control system for a harvester |
Country Status (5)
| Country | Link |
|---|---|
| US (1) | US10371561B2 (en) |
| CN (1) | CN104718874B (en) |
| AU (1) | AU2014256411B2 (en) |
| BR (1) | BR102014027364B1 (en) |
| IN (1) | IN2014DE03130A (en) |
Families Citing this family (57)
| Publication number | Priority date | Publication date | Assignee | Title |
|---|---|---|---|---|
| US11212962B2 (en) * | 2013-02-20 | 2022-01-04 | Deere & Company | Field condition determination |
| US9961832B2 (en) * | 2014-06-13 | 2018-05-08 | Deere & Company | Control of base cutter orientation in sugarcane harvesters |
| US10334781B2 (en) * | 2015-08-20 | 2019-07-02 | Cnh Industrial America Llc | Side shake rate based on machine throughputs |
| US10234837B2 (en) * | 2015-09-28 | 2019-03-19 | Deere & Company | Adaptive performance targets for controlling a mobile machine |
| US10303677B2 (en) * | 2015-10-14 | 2019-05-28 | The Climate Corporation | Computer-generated accurate yield map data using expert filters and spatial outlier detection |
| US9788485B2 (en) * | 2015-10-23 | 2017-10-17 | Deere & Company | Variable speed elevator control system |
| US10645876B2 (en) | 2016-03-01 | 2020-05-12 | Deere & Company | System and method for controlled cleaning in a cane harvester |
| US20180047177A1 (en) * | 2016-08-15 | 2018-02-15 | Raptor Maps, Inc. | Systems, devices, and methods for monitoring and assessing characteristics of harvested specialty crops |
| CN108200804B (en) * | 2016-12-19 | 2021-05-04 | 上海交通大学 | Visual sensing grain flow online detection device and detection method |
| GB201621879D0 (en) * | 2016-12-21 | 2017-02-01 | Branston Ltd | A crop monitoring system and method |
| SE543160C2 (en) * | 2017-01-16 | 2020-10-13 | Tracy Of Sweden Ab | A method for determining and managing origin identifation of logs |
| US10317272B2 (en) * | 2017-05-17 | 2019-06-11 | Deere & Company | Automatic wireless wagon detection apparatus and method |
| US10827676B2 (en) * | 2018-01-29 | 2020-11-10 | Deere & Company | Monitor and control system for a harvester |
| US11744180B2 (en) | 2018-01-29 | 2023-09-05 | Deere & Company | Harvester crop mapping |
| US11006577B2 (en) * | 2018-02-26 | 2021-05-18 | Cnh Industrial America Llc | System and method for adjusting operating parameters of an agricultural harvester based on estimated crop volume |
| CN108990521B (en) * | 2018-09-30 | 2023-11-10 | 江苏农牧科技职业学院 | Harvester header integrated control system based on it is embedded |
| BR112021007032A2 (en) | 2018-10-24 | 2021-07-20 | The Climate Corporation | leveraging genetics and resource engineering to drive placement predictability for seed product selection and recommendation by field |
| US11178818B2 (en) | 2018-10-26 | 2021-11-23 | Deere & Company | Harvesting machine control system with fill level processing based on yield data |
| US11079725B2 (en) | 2019-04-10 | 2021-08-03 | Deere & Company | Machine control using real-time model |
| US11641800B2 (en) | 2020-02-06 | 2023-05-09 | Deere & Company | Agricultural harvesting machine with pre-emergence weed detection and mitigation system |
| US11957072B2 (en) | 2020-02-06 | 2024-04-16 | Deere & Company | Pre-emergence weed detection and mitigation system |
| US11467605B2 (en) | 2019-04-10 | 2022-10-11 | Deere & Company | Zonal machine control |
| US11672203B2 (en) | 2018-10-26 | 2023-06-13 | Deere & Company | Predictive map generation and control |
| US11653588B2 (en) | 2018-10-26 | 2023-05-23 | Deere & Company | Yield map generation and control system |
| US11240961B2 (en) | 2018-10-26 | 2022-02-08 | Deere & Company | Controlling a harvesting machine based on a geo-spatial representation indicating where the harvesting machine is likely to reach capacity |
| US11589509B2 (en) | 2018-10-26 | 2023-02-28 | Deere & Company | Predictive machine characteristic map generation and control system |
| US11234366B2 (en) | 2019-04-10 | 2022-02-01 | Deere & Company | Image selection for machine control |
| BR112021017318A2 (en) | 2019-04-10 | 2021-11-16 | Climate Corp | Leverage Feature Engineering to Increase Placement Predictability for Seed Product Selection and Per-Field Recommendation |
| US11778945B2 (en) | 2019-04-10 | 2023-10-10 | Deere & Company | Machine control using real-time model |
| CN110089260A (en) * | 2019-04-15 | 2019-08-06 | 江苏大学 | A kind of the cereal flow monitoring method and monitoring system of the defeated grain of scraper-type |
| US11231317B2 (en) | 2019-08-20 | 2022-01-25 | Cnh Industrial America Llc | Systems and methods for filtering sensor signal interference deriving from powered components of a header |
| US10829033B1 (en) | 2019-08-20 | 2020-11-10 | Cnh Industrial America Llc | Automatically controlled header work lights |
| DE102019122905A1 (en) * | 2019-08-27 | 2021-03-04 | Exel Industries | Determination device for determining a date when harvesting fruits, corresponding treatment device and harvesting machine |
| AU2019466291A1 (en) * | 2019-09-20 | 2022-03-31 | Seeing Systems Pty Ltd | Systems and methods for gathering data relating to crops and for managing crop growing operations |
| US11477940B2 (en) | 2020-03-26 | 2022-10-25 | Deere & Company | Mobile work machine control based on zone parameter modification |
| US11874669B2 (en) | 2020-10-09 | 2024-01-16 | Deere & Company | Map generation and control system |
| US11871697B2 (en) | 2020-10-09 | 2024-01-16 | Deere & Company | Crop moisture map generation and control system |
| US11889788B2 (en) | 2020-10-09 | 2024-02-06 | Deere & Company | Predictive biomass map generation and control |
| US11844311B2 (en) | 2020-10-09 | 2023-12-19 | Deere & Company | Machine control using a predictive map |
| US11864483B2 (en) | 2020-10-09 | 2024-01-09 | Deere & Company | Predictive map generation and control system |
| US11474523B2 (en) | 2020-10-09 | 2022-10-18 | Deere & Company | Machine control using a predictive speed map |
| US11825768B2 (en) | 2020-10-09 | 2023-11-28 | Deere & Company | Machine control using a predictive map |
| US11592822B2 (en) | 2020-10-09 | 2023-02-28 | Deere & Company | Machine control using a predictive map |
| US11635765B2 (en) | 2020-10-09 | 2023-04-25 | Deere & Company | Crop state map generation and control system |
| US11711995B2 (en) | 2020-10-09 | 2023-08-01 | Deere & Company | Machine control using a predictive map |
| US11675354B2 (en) | 2020-10-09 | 2023-06-13 | Deere & Company | Machine control using a predictive map |
| US11983009B2 (en) | 2020-10-09 | 2024-05-14 | Deere & Company | Map generation and control system |
| US11849672B2 (en) | 2020-10-09 | 2023-12-26 | Deere & Company | Machine control using a predictive map |
| US11946747B2 (en) | 2020-10-09 | 2024-04-02 | Deere & Company | Crop constituent map generation and control system |
| US11845449B2 (en) | 2020-10-09 | 2023-12-19 | Deere & Company | Map generation and control system |
| US11927459B2 (en) | 2020-10-09 | 2024-03-12 | Deere & Company | Machine control using a predictive map |
| US11650587B2 (en) | 2020-10-09 | 2023-05-16 | Deere & Company | Predictive power map generation and control system |
| US11895948B2 (en) | 2020-10-09 | 2024-02-13 | Deere & Company | Predictive map generation and control based on soil properties |
| US11849671B2 (en) | 2020-10-09 | 2023-12-26 | Deere & Company | Crop state map generation and control system |
| US11727680B2 (en) | 2020-10-09 | 2023-08-15 | Deere & Company | Predictive map generation based on seeding characteristics and control |
| US11889787B2 (en) | 2020-10-09 | 2024-02-06 | Deere & Company | Predictive speed map generation and control system |
| US20230189689A1 (en) * | 2021-12-22 | 2023-06-22 | Agco Corporation | Row position mapping of an agricultural implement |
Citations (7)
| Publication number | Priority date | Publication date | Assignee | Title |
|---|---|---|---|---|
| US20020014116A1 (en) * | 1999-02-26 | 2002-02-07 | Campbell Ronald H. | Methods and systems for measuring crop density |
| US6389785B1 (en) * | 1997-06-24 | 2002-05-21 | Claas Selbstfahrende Erntemaschinen Gmbh | Contour scanning apparatus for agricultural machinery |
| CN1695419A (en) * | 2005-06-23 | 2005-11-16 | 上海交通大学 | Intelligent system for measuring yield based on remote data transmission |
| US20080156124A1 (en) * | 2005-02-23 | 2008-07-03 | O'connor Timothy C | Method and Apparatus for Tracing and Blending Commingled Non-Liquid Bulk Materials |
| US20100269470A1 (en) * | 2009-04-24 | 2010-10-28 | Price Randy R | Optical Yield Monitor for a Sugar Cane Harvester |
| US20110166788A1 (en) * | 2009-08-18 | 2011-07-07 | Terry Griffin | Computer-Automated Spatial Analysis |
| CN102379189A (en) * | 2010-08-31 | 2012-03-21 | 中国农业机械化科学研究院 | Grain yield distribution information measurement method and device |
Family Cites Families (13)
| Publication number | Priority date | Publication date | Assignee | Title |
|---|---|---|---|---|
| US6690413B1 (en) * | 1999-04-21 | 2004-02-10 | Michael S. Moore | Tractor-trailer viewing system |
| CA2402379A1 (en) * | 2000-02-17 | 2001-08-23 | Paul Hendershott | Bulk materials management apparatus and method |
| DE10214648A1 (en) * | 2002-04-02 | 2003-10-16 | Claas Selbstfahr Erntemasch | Measuring device on an agricultural machine |
| CA2430737C (en) | 2003-06-02 | 2011-12-20 | Centre De Recherche Industrielle Du Quebec | Method and apparatus for estimating surface moisture content of wood chips |
| DE102004038404B4 (en) * | 2004-08-07 | 2021-01-07 | Deere & Company | Device for the automatic adjustment of the cutting height of a header for harvesting stem-like plants |
| ATE542610T1 (en) * | 2006-03-31 | 2012-02-15 | Thomas Valerio | METHOD AND DEVICE FOR SORTING FINE NON-FERROUS METALS AND INSULATED WIRE PIECES |
| GB0714942D0 (en) * | 2007-08-01 | 2007-09-12 | Cnh Belgium Nv | A biomass cleaner improvements in corp harvesting machine and related methods |
| DE102010017688A1 (en) * | 2010-07-01 | 2012-01-05 | Claas Selbstfahrende Erntemaschinen Gmbh | Device for detecting and determining the composition of bulk material |
| US9348111B2 (en) * | 2010-08-24 | 2016-05-24 | Apple Inc. | Automatic detection of lens deviations |
| JP5934653B2 (en) * | 2010-11-29 | 2016-06-15 | パナソニック インテレクチュアル プロパティ コーポレーション オブ アメリカPanasonic Intellectual Property Corporation of America | Image classification device, image classification method, program, recording medium, integrated circuit, model creation device |
| US8649940B2 (en) * | 2012-02-10 | 2014-02-11 | Deere & Company | Method and stereo vision system for managing the unloading of an agricultural material from a vehicle |
| US8988426B2 (en) * | 2012-06-05 | 2015-03-24 | Apple Inc. | Methods and apparatus for rendering labels based on occlusion testing for label visibility |
| JP6270361B2 (en) * | 2013-07-16 | 2018-01-31 | 株式会社キーエンス | 3D image processing apparatus, 3D image processing method, 3D image processing program, computer-readable recording medium, and recorded apparatus |
-
2014
- 2014-10-29 US US14/527,152 patent/US10371561B2/en active Active
- 2014-10-31 CN CN201410602449.5A patent/CN104718874B/en active Active
- 2014-10-31 IN IN3130DE2014 patent/IN2014DE03130A/en unknown
- 2014-10-31 BR BR102014027364-6A patent/BR102014027364B1/en active IP Right Grant
- 2014-10-31 AU AU2014256411A patent/AU2014256411B2/en active Active
Patent Citations (7)
| Publication number | Priority date | Publication date | Assignee | Title |
|---|---|---|---|---|
| US6389785B1 (en) * | 1997-06-24 | 2002-05-21 | Claas Selbstfahrende Erntemaschinen Gmbh | Contour scanning apparatus for agricultural machinery |
| US20020014116A1 (en) * | 1999-02-26 | 2002-02-07 | Campbell Ronald H. | Methods and systems for measuring crop density |
| US20080156124A1 (en) * | 2005-02-23 | 2008-07-03 | O'connor Timothy C | Method and Apparatus for Tracing and Blending Commingled Non-Liquid Bulk Materials |
| CN1695419A (en) * | 2005-06-23 | 2005-11-16 | 上海交通大学 | Intelligent system for measuring yield based on remote data transmission |
| US20100269470A1 (en) * | 2009-04-24 | 2010-10-28 | Price Randy R | Optical Yield Monitor for a Sugar Cane Harvester |
| US20110166788A1 (en) * | 2009-08-18 | 2011-07-07 | Terry Griffin | Computer-Automated Spatial Analysis |
| CN102379189A (en) * | 2010-08-31 | 2012-03-21 | 中国农业机械化科学研究院 | Grain yield distribution information measurement method and device |
Also Published As
| Publication number | Publication date |
|---|---|
| CN104718874A (en) | 2015-06-24 |
| IN2014DE03130A (en) | 2015-07-03 |
| US20150124054A1 (en) | 2015-05-07 |
| US10371561B2 (en) | 2019-08-06 |
| BR102014027364B1 (en) | 2021-01-12 |
| AU2014256411A1 (en) | 2015-05-21 |
| BR102014027364A2 (en) | 2016-08-09 |
| AU2014256411B2 (en) | 2018-09-27 |
Similar Documents
| Publication | Publication Date | Title |
|---|---|---|
| CN104718874B (en) | Yield measurement and base cutter height control system for a harvester | |
| CN110602943B (en) | System and method for monitoring crops | |
| US10292321B2 (en) | Agricultural work machine for avoiding anomalies | |
| US20230345928A1 (en) | Identifying and avoiding obstructions using depth information in a single image | |
| RU2747303C2 (en) | System for controlling the working parameter of a harvester | |
| EP3125670B1 (en) | Agricultural implement operator monitoring methods | |
| US20180047177A1 (en) | Systems, devices, and methods for monitoring and assessing characteristics of harvested specialty crops | |
| Zhang et al. | A LIDAR-based crop height measurement system for Miscanthus giganteus | |
| EP1655620B1 (en) | Obstacle detection using stereo vision | |
| EP3555562B1 (en) | Crop scanner | |
| US20210241482A1 (en) | Yield prediction for a cornfield | |
| EP3157322A1 (en) | Modular systems and methods for determining crop yields with high resolution geo-referenced sensors | |
| US11935289B2 (en) | Agricultural analysis robotic systems and methods thereof | |
| CN104766135A (en) | Method, device and system for predicting crop yield | |
| US20220101554A1 (en) | Extracting Feature Values from Point Clouds to Generate Plant Treatments | |
| US20220100996A1 (en) | Ground Plane Compensation in Identifying and Treating Plants | |
| EP4130659A1 (en) | Agricultural traveling vehicle, control device, and program | |
| Swanson et al. | A multi-modal system for yield prediction in citrus trees | |
| CN107656287B (en) | A kind of Boundary Extraction device and method of the crudefiber crop row based on laser radar | |
| WO2023276228A1 (en) | Row detection system, farm machine provided with row detection system, and row detection method | |
| WO2023276227A1 (en) | Row detection system, farm machine provided with row detection system, and method for detecting row | |
| Jeon et al. | Stereovision system and image processing algorithms for plant specific application | |
| Vollet et al. | Simultaneous 3D Reconstruction and Vegetation Classification Utilizing a Multispectral Stereo Camera | |
| WO2021095042A1 (en) | Machine learning model for accurate crop count |
Legal Events
| Date | Code | Title | Description |
|---|---|---|---|
| C06 | Publication | ||
| PB01 | Publication | ||
| C10 | Entry into substantive examination | ||
| SE01 | Entry into force of request for substantive examination | ||
| GR01 | Patent grant | ||
| GR01 | Patent grant |