WO2025115148A1 - 災害発生予測システム、及び災害発生予測方法 - Google Patents
災害発生予測システム、及び災害発生予測方法 Download PDFInfo
- Publication number
- WO2025115148A1 WO2025115148A1 PCT/JP2023/042822 JP2023042822W WO2025115148A1 WO 2025115148 A1 WO2025115148 A1 WO 2025115148A1 JP 2023042822 W JP2023042822 W JP 2023042822W WO 2025115148 A1 WO2025115148 A1 WO 2025115148A1
- Authority
- WO
- WIPO (PCT)
- Prior art keywords
- disaster
- occurrence prediction
- disaster occurrence
- infrasound
- information
- Prior art date
- Legal status (The legal status is an assumption and is not a legal conclusion. Google has not performed a legal analysis and makes no representation as to the accuracy of the status listed.)
- Pending
Links
Images



Classifications
-
- G—PHYSICS
- G01—MEASURING; TESTING
- G01H—MEASUREMENT OF MECHANICAL VIBRATIONS OR ULTRASONIC, SONIC OR INFRASONIC WAVES
- G01H9/00—Measuring mechanical vibrations or ultrasonic, sonic or infrasonic waves by using radiation-sensitive means, e.g. optical means
-
- G—PHYSICS
- G01—MEASURING; TESTING
- G01V—GEOPHYSICS; GRAVITATIONAL MEASUREMENTS; DETECTING MASSES OR OBJECTS; TAGS
- G01V1/00—Seismology; Seismic or acoustic prospecting or detecting
-
- G—PHYSICS
- G01—MEASURING; TESTING
- G01W—METEOROLOGY
- G01W1/00—Meteorology
Definitions
- the present invention relates to a disaster occurrence prediction system and a disaster occurrence prediction method.
- Patent Document 1 describes an anomaly detection device that acquires backward Rayleigh scattered light from an OPGW (optical fiber composite overhead ground wire), generates vibration information for a frequency range including the natural frequency of the optical fiber composite overhead ground wire based on the acquired backward Rayleigh scattered light, and detects anomalies in power transmission equipment based on the generated vibration information.
- OPGW optical fiber composite overhead ground wire
- Patent Document 2 describes a tsunami detection device that obtains information about tsunamis using infrasound (ultra-low frequency sound, micro-pressure waves).
- the tsunami detection device determines whether an earthquake detected by an earthquake detection unit is of a predetermined magnitude or greater, measures infrasound, and when an earthquake of a predetermined magnitude or greater is detected, determines whether a tsunami has occurred based on the magnitude of the change in sound pressure of the measured infrasound.
- Non-Patent Document 1 describes micro-pressure vibration data that is being experimentally observed in a study titled “Research on early tsunami detection using the results of micro-pressure vibration observations.”
- Infrasound is generated by large-scale physical phenomena that cause disasters, such as earthquakes, tsunamis, typhoons, volcanic eruptions, and meteorite falls, and has the property of propagating long distances through the atmosphere. For this reason, it is expected to be used as a remote sensing means to obtain information for disaster prevention from remote locations.
- Patent Document 2 and Non-Patent Document 1 research and development is underway on disaster prevention systems that use infrasound.
- the present invention has been made in consideration of this background, and aims to provide a disaster prediction system and a disaster prediction method that can efficiently and inexpensively realize a disaster prediction mechanism that uses infrasound.
- One of the means for solving the above problem is a disaster occurrence prediction system that utilizes power transmission facilities that are installed over a wide area and is composed of an optical analysis unit and an information processing device, and acquires the time change in vibration intensity for each frequency of the optical fiber at measurement points set along the optical fiber attached to the power transmission line using DAS (Distributed Acoustic Sensing), monitors in real time whether or not there is a feature attributable to infrasound in the time change in vibration intensity for each frequency at the measurement point, and outputs information predicting the occurrence of a disaster if such a feature is detected.
- DAS Distributed Acoustic Sensing
- the present invention makes it possible to realize a disaster prediction system that uses infrasound efficiently and at low cost.
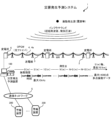
- FIG. 1 is a diagram showing a schematic configuration of a disaster occurrence prediction system.
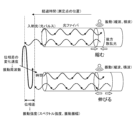
- FIG. 2 is a diagram illustrating a mechanism for measuring a vibration state by a DAS. 13 is a graph showing the change over time for each frequency of the vibration state at each measurement point.
- FIG. 1 is a diagram showing a main configuration of a disaster occurrence prediction device.
- FIG. 2 is a diagram showing main functions of a disaster occurrence prediction device.
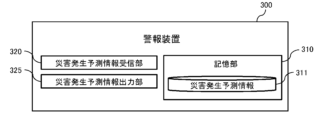
- FIG. 2 is a diagram showing the main configuration of an alarm device.
- FIG. 2 is a diagram showing main functions of the alarm device.
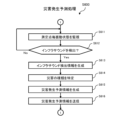
- 11 is a flowchart illustrating a disaster occurrence prediction process.
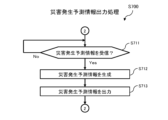
- 13 is a flowchart illustrating a disaster occurrence prediction information output process. 13 is an example of a disaster occurrence prediction information output screen.
- FIG. 1 shows a schematic configuration of a disaster prediction system 1, which is described as one embodiment of the present invention.
- the disaster prediction system 1 includes a disaster prediction device 100 provided in a substation 6 or the like, and one or more warning devices 300.
- the disaster occurrence prediction device 100 is configured using an information processing device (computer).
- the disaster occurrence prediction device 100 is communicatively connected to the alarm device 300 via a communication network 5.
- the communication network may be, for example, a LAN (Local Area Network), a WAN (Wide Area Network), the Internet, a PLC (Power Line Communication), a public communication network, a dedicated line, etc.
- the disaster occurrence prediction device 100 uses the optical fiber 4a of the OPGW4 (OPTICAL fiber composite overhead ground wire) (optical fiber composite overhead ground wire) installed on the power transmission line 3 as a vibration detection sensor, and acquires the vibration state at each measurement point by a technology (distributed multipoint vibration measurement method (hereinafter referred to as "DAS" (Distributed Acoustic Sensing)) that measures the vibration state (vibration intensity, vibration frequency) based on the expansion and contraction of the optical fiber 4a at each of multiple measurement positions (hereinafter referred to as "measurement points") set along the optical fiber 4a.
- DAS distributed multipoint vibration measurement method
- the DAS acquires the vibration state at each measurement point by, for example, the principle of C-OTDR (Coherent detection Optical Time Domain Reflectometer).
- the disaster prediction device 100 inputs a light pulse (laser pulse, hereinafter also referred to as "incident light") from the end face of the optical fiber 4a, and measures the change speed ( ⁇ stretching frequency) of the phase difference of the backscattered light of the light pulse at each measurement point.
- the phase difference is estimated from the intensity change due to the interference between the backscattered lights.
- the disaster prediction device 100 determines the vibration frequency (for example, vibration frequency in the range of up to 10 kHz) of the longitudinal wave and transverse wave of the optical fiber 4a at each measurement point based on the measured change speed.
- the disaster prediction device 100 also determines the vibration intensity (spectral intensity, vibration amplitude) at each measurement point based on the phase difference for each vibration frequency.
- the disaster prediction device 100 also determines the position of each measurement point (distance from the end face) based on the elapsed time from the time when the incident light is input to the end face to the time when the return light is received.
- the above measurement points are set, for example, at predetermined intervals d (m) along the optical fiber that are shorter than the span of the transmission tower 2 (0 (m), d (m), ..., N (m), N + d (m), N + 2 d (m)).
- predetermined interval d is 5 (m) and measurement points are set over a maximum range of 70 (km) of the transmission line 3, approximately 14,000 measurement points will be set along the optical fiber.
- the vibration state of the optical fiber 4a at each measurement point is affected by the sound (sound pressure) received by the optical fiber 4a from the outside.
- the optical fiber 4a between adjacent transmission towers 2 (span) is a string with the transmission towers 2 at both ends as fixed ends, and resonates with the sound of a specific frequency received from the outside, generating a natural vibration.
- the disaster occurrence prediction device 100 generates information predicting the occurrence of a disaster (hereinafter referred to as "disaster occurrence prediction information") based on infrasound observed by the DAS, and transmits the generated disaster occurrence prediction information to the warning device 300.
- the warning device 300 is an information processing device (computer) capable of communicating with the disaster occurrence prediction device 100 via the communication network 5, and is, for example, a personal computer, a smartphone, a tablet, various server devices, a mainframe, etc.
- the warning device 300 is operated, for example, by a facility of an organization that monitors disasters (such as a disaster prevention center or a facility operated by a city, ward, town, or village).
- a facility of an organization that monitors such as a disaster prevention center or a facility operated by a city, ward, town, or village.
- the warning device 300 receives disaster occurrence prediction information sent from the disaster occurrence prediction device 100, it outputs information based on the received disaster occurrence prediction information (display on a display device, audio output from an audio output device, etc.).
- Figure 3 is a graph showing the time variation of vibration intensity for each frequency at each measurement point of the power transmission line 3 stretching from Hiroshima Prefecture to Shimane Prefecture, acquired by the disaster prediction device 100 using the DAS when an earthquake (seismic intensity "4") occurred in Hyuga-Nada at around 21:14 on July 22, 2023.
- the three graphs show the time variation of vibration intensity for each frequency of the optical fiber 4a, measured at the measurement points of three adjacent spans (spans with identifiers (hereinafter referred to as "span ID") "K1", "K2", and "K3" of the power transmission line 3 near Hatsukaichi City, Hiroshima Prefecture.
- time flows from top to bottom on the page.
- the shade of color in the figure represents the vibration intensity (arbitrary unit) for each frequency (the lighter the color, the greater the vibration intensity).
- infrasound Since the transmission speed of infrasound is almost the same as the speed of sound, when an earthquake occurs, it is observed by the DAS before the tsunami arrives. Therefore, when infrasound is observed by the DAS, it is possible to transmit this fact and information based on the observed infrasound (the predicted arrival of a tsunami, the predicted time of the tsunami's arrival, the scale of the tsunami (wave height, etc.)) to the warning device 300 installed in the area where a disaster is predicted to occur in advance as disaster occurrence prediction information.
- the observed infrasound the predicted arrival of a tsunami, the predicted time of the tsunami's arrival, the scale of the tsunami (wave height, etc.
- FIG. 4A is a diagram showing the main components of the disaster prediction device 100.
- the disaster prediction device 100 comprises a processor 101, a main memory device 102 (memory), an auxiliary memory device 103 (external memory device), an input device 104, an output device 105, a communication device 106, and an optical analysis unit 107. These are connected to each other so as to be able to communicate with each other via a bus or a communication cable.
- the disaster prediction device 100 may be realized in whole or in part using virtual information processing resources, such as a virtual server provided by a cloud system.
- the processor 101 is configured using, for example, a CPU (Central Processing Unit), an MPU (Micro Processing Unit), a GPU (Graphics Processing Unit), an FPGA (Field Programmable Gate Array), an ASIC (Application Specific Integrated Circuit), an AI (Artificial Intelligence) chip, etc.
- a CPU Central Processing Unit
- MPU Micro Processing Unit
- GPU Graphics Processing Unit
- FPGA Field Programmable Gate Array
- ASIC Application Specific Integrated Circuit
- AI Artificial Intelligence
- the main memory device 102 is a memory device used by the processor 101 when executing a program, and is, for example, ROM (Read Only Memory), RAM (Random Access Memory), non-volatile memory (NVRAM (Non Volatile RAM)), etc.
- ROM Read Only Memory
- RAM Random Access Memory
- NVRAM Non Volatile RAM
- the auxiliary storage device 103 is a device that stores programs and data, and can be configured, for example, with an SSD (Solid State Drive), a hard disk drive, an optical storage device (CD (Compact Disc), DVD (Digital Versatile Disc), etc.). Programs and data can be read into the auxiliary storage device 103 from other information processing devices equipped with non-transient recording media or non-transient storage devices via a recording medium reading device or communication device 106. The programs and data stored (memorized) in the auxiliary storage device 103 are read into the main storage device 102 as needed.
- SSD Solid State Drive
- CD Compact Disc
- DVD Digital Versatile Disc
- the input device 104 is an interface that accepts information input from the outside, such as a keyboard, a mouse, a touch panel, or a voice input device.
- the output device 105 is an interface that outputs various information such as the progress of processing and the results of processing to the outside.
- the output device 105 is, for example, a display device (liquid crystal monitor, LCD (Liquid Crystal Display) etc.) that visualizes the various information described above, a device that converts the various information described above into audio (audio output device (speaker etc.)), or a device that converts the various information described above into text (printing device etc.).
- the information processing device 10 may be configured to input and output information between it and other devices via the communication device 106.
- the input device 104 and the output device 105 constitute a user interface that realizes interactive processing with the user (accepting information, providing information, etc.).
- the communication device 106 is a device that realizes communication with other devices via a communication network 5 (such as a LAN (Local Area Network), WAN (Wide Area Network), the Internet, a public communication network, a dedicated line, etc.).
- the communication device 106 is a wired or wireless communication interface that realizes communication with other devices via a communication medium, such as a NIC (Network Interface Card), a wireless communication module, or a USB module (USB: Universal Serial Bus), etc.
- the optical analysis unit 107 is a device that uses a DAS to measure the vibration state of a measurement point, and includes a vibration measurement device using a C-OTDR and a signal processing circuit.
- the optical analysis unit 107 includes a CW (continuous wave) laser light source that generates an optical pulse (laser light) to be input to the end face of the optical fiber 4a, an optical pulse generator, an optical amplifier, optical equipment (optical detector, optical interferometer), a signal processing circuit (phase calculation circuit, etc.), etc.
- the optical analysis unit 107 and the optical fiber 4a are connected, for example, by optically connecting the output part of the laser light source of the optical analysis unit 107 to the connection port (socket) of the core wire of the OPGW installed in the substation. Therefore, the connection does not cause any impact on the power system, such as a power outage.
- the disaster occurrence prediction device 100 may be equipped with, for example, an operating system, a file system, a DBMS (Database Management System) (relational database, NoSQL, etc.), a KVS (Key-Value Store), etc.
- an operating system a file system
- DBMS Database Management System
- NoSQL NoSQL
- KVS Key-Value Store
- the various functions of the disaster prediction device 100 are realized by the processor 101 reading and executing programs stored in the main memory device 102, or by the hardware (FPGA, ASIC, AI chip, etc.) that constitutes the disaster prediction device 100.
- the disaster prediction device 100 stores various information (data), for example, as tables in a database or files managed by a file system.
- FIG. 4B is a block diagram explaining the main functions of the disaster prediction device 100.
- the disaster prediction device 100 has the functions of a memory unit 110, a vibration state measurement unit 120, an infrasound detection unit 125, a disaster type identification unit 130, a disaster prediction information generation unit 132, and a disaster prediction information transmission unit 135.
- the memory unit 110 stores the vibration state for each measurement point 111, infrasound detection information 112, disaster type information 113, disaster occurrence prediction information 114, equipment information 115, and geographic information 116.
- the vibration state for each measurement point 111, infrasound detection information 112, disaster type information 113, and disaster occurrence prediction information 114 will be described later.
- the equipment information 115 includes information related to the power transmission equipment (the correspondence between each measurement point and each span, the type of power transmission equipment, the position (latitude, longitude) of the power transmission equipment and spans, etc.).
- the geographic information 116 includes a map and geographical information of the surrounding area where the power transmission equipment is deployed.
- the vibration state measurement unit 120 uses the DAS to measure the time change in vibration intensity for each frequency at each measurement point on each span, and manages the measurement results as the vibration state for each measurement point 111.
- the vibration state for each measurement point 111 includes, for example, information on the graph shown in FIG. 3.
- the infrasound detection unit 125 detects infrasound based on the time change in vibration intensity for each frequency at each measurement point included in the vibration state for each measurement point 111 during the above-mentioned period.
- the infrasound detection unit 125 detects infrasound by monitoring in real time whether or not there is an aspect attributable to infrasound in the time change in vibration intensity for each frequency at each measurement point.
- the infrasound detection unit 125 detects infrasound, for example, by performing data analysis (background noise removal, signal identification, etc.) on the graph shown in FIG. 3.
- the infrasound detection unit 125 When the infrasound detection unit 125 detects infrasound, it manages information indicating that infrasound has been detected and information based on aspects attributable to infrasound in the time change in vibration intensity for each frequency at the measurement point as infrasound detection information 112. For example, the infrasound detection unit 125 manages information indicating the date and time when infrasound was detected and information used as the basis for determining that infrasound has been detected (for example, information obtained from the graph shown in FIG. 3) as infrasound detection information 112.
- the infrasound detection unit 125 determines that infrasound has been detected, for example, when a vibration intensity of a predetermined magnitude or greater is observed in the infrasound frequency band (20 Hz or less) at each measurement point of a predetermined number or more adjacent spans. Also, for example, the infrasound detection unit 125 determines that infrasound has been detected when vibrations of a predetermined magnitude or greater are observed across a wide frequency band at each measurement point of a predetermined number or more adjacent spans. Note that the infrasound detection unit 125 may detect infrasound by applying methods or criteria other than those described above to the time change in vibration intensity for each frequency at each measurement point. Also, multiple methods and criteria may be combined to improve detection accuracy.
- the disaster type identification unit 130 identifies the type of disaster (earthquake, tsunami, typhoon, volcanic eruption, meteorite fall, etc.) based on information (e.g., information obtained from the graph shown in Figure 3) that is the basis for determining that infrasound has been detected when the infrasound detection unit 125 detects infrasound, and manages the identified type of disaster as disaster type information 113.
- information e.g., information obtained from the graph shown in Figure 3
- the disaster occurrence prediction information generation unit 132 generates and manages disaster occurrence prediction information 114 based on the infrasound detection information 112 and the disaster type information 113.
- the disaster occurrence prediction information 114 includes, for example, information indicating the date and time when infrasound was detected and the span where infrasound was detected, obtained from the infrasound detection information 112.
- the disaster occurrence prediction information 114 also includes, for example, information obtained from the disaster type information 113, such as the type of disaster, information identifying the area where a disaster is predicted to occur, the predicted time when the disaster will occur for each identified area, the predicted scale of the disaster for each identified area, and the area where a disaster is predicted (expected) to occur.
- the disaster occurrence prediction information generating unit 132 identifies the position (latitude, longitude) of the span where infrasound was detected from the equipment information 115, and compares the identified position with the geographic information 116 to identify the area where a disaster is predicted to occur. For example, the disaster occurrence prediction information generating unit 132 identifies areas that are within a specified distance from the position of the span where infrasound was detected as areas where a disaster is predicted to occur. Furthermore, the disaster occurrence prediction information generating unit 132 determines the predicted time of disaster occurrence and the scale of the disaster for each area, for example, based on the distance between the identified area and the span where infrasound was detected. Furthermore, the disaster occurrence prediction information generating unit 132 determines the scale based on, for example, vibration intensity obtained from the graph shown in FIG. 3.
- the disaster occurrence prediction information transmission unit 135 shown in the figure transmits the disaster occurrence prediction information 114 generated by the disaster occurrence prediction information generation unit 132 to the warning device 300 via the communication network 5.
- FIG. 5A is a diagram showing the main configuration of the warning device 300.
- the elements shown in the figure are basically the same as the elements of the disaster prediction device 100 shown in FIG. 4A, so the explanation will be omitted.
- FIG. 5B is a block diagram explaining the main functions of the warning device 300. As shown in the figure, the warning device 300 has the functions of a memory unit 310, a disaster occurrence prediction information receiving unit 320, and a disaster occurrence prediction information output unit 325.
- the memory unit 110 stores disaster occurrence prediction information 311.
- the disaster occurrence prediction information receiving unit 320 receives the disaster occurrence prediction information 114 sent from the disaster occurrence prediction device 100, and manages the received disaster occurrence prediction information 114 as disaster occurrence prediction information 311.
- the disaster occurrence prediction information output unit 325 outputs information based on the disaster occurrence prediction information 311 to an output device (display device, audio output device (speaker), etc.).
- FIG. 6 is a flowchart explaining the process performed by the disaster prediction device 100 (hereinafter referred to as "disaster prediction process S600").
- Disaster prediction process S600 will be explained below with reference to FIG. 6. Note that the following explanation is premised on the assumption that the vibration state measurement unit 120 of the disaster prediction device 100 measures the time change (time change of vibration strength for each frequency) of the vibration state (vibration intensity, vibration frequency) of each measurement point on each span in real time using the DAS, and manages the latest vibration state of each measurement point as the vibration state for each measurement point 111.
- the infrasound detection unit 125 monitors in real time the change over time in the vibration strength for each frequency at each measurement point based on the vibration state for each measurement point 111 (S611-S612: No).
- the infrasound detection unit 125 detects an aspect attributable to infrasound in the change over time in the vibration strength for each frequency at each measurement point acquired from the vibration state for each measurement point 111 (S612: Yes)
- it generates and manages infrasound detection information 112 for the detected infrasound (S613).
- the disaster type identification unit 130 identifies the type of disaster based on the information on which the infrasound detection unit 125 has determined that infrasound has been detected, and manages the identified type of disaster as disaster type information 113 (S614).
- the disaster occurrence prediction information generation unit 132 generates and manages the disaster occurrence prediction information 114 based on the infrasound detection information 112 and the disaster type information 113 (S615).
- the disaster occurrence prediction information transmission unit 135 transmits the disaster occurrence prediction information 114 generated by the disaster occurrence prediction information generation unit 132 to the warning device 300 via the communication network 5 (S616). After that, the process returns to S611.
- FIG. 7 is a flowchart explaining the process performed by the warning device 300 (hereinafter referred to as "disaster occurrence prediction information output process S700"). Below, the disaster occurrence prediction information output process S700 will be explained with reference to the same figure.
- the disaster occurrence prediction information receiving unit 320 waits in real time to receive the disaster occurrence prediction information 114 sent from the disaster occurrence prediction device 100 (S711: No).
- the disaster occurrence prediction information receiving unit 320 receives the disaster occurrence prediction information 114 (S711: Yes), it manages the received disaster occurrence prediction information 114 as disaster occurrence prediction information 311 (S712).
- the disaster occurrence prediction information output unit 325 outputs information based on the disaster occurrence prediction information 311 to the output device (S713). After that, the process returns to S711.
- Figure 8 is an example of a screen displayed when the disaster occurrence prediction information output unit 325 outputs the above information (hereinafter referred to as the "disaster occurrence prediction information output screen 800").
- the example disaster occurrence prediction information output screen 800 has a display field 811 for the infrasound detection date and time, a display field 812 for the detection distance, a display field 813 for the type of disaster, a display field 814 for the predicted disaster occurrence area, a display field 815 for the predicted disaster occurrence time, and a display field 816 for the scale of the disaster.
- the infrasound detection date and time display field 811 displays the date and time when the infrasound detection unit 125 detected infrasound.
- the detection span display field 812 displays the span ID of the span where infrasound was detected.
- the disaster type display field 813 also displays the contents of the disaster type information 113 (information indicating the type of disaster).
- the disaster predicted area display field 814 displays information indicating areas where disasters are predicted to occur.
- the predicted time of disaster occurrence display field 815 displays the predicted time of disaster occurrence.
- the disaster scale display field 816 also displays the scale of the disaster that will occur.
- the disaster occurrence prediction system 1 of this embodiment monitors in real time whether there is a phenomenon caused by infrasound in the time change (time change of vibration intensity for each frequency) of the vibration state (vibration intensity, vibration frequency) of each measurement point acquired by the DAS, and outputs information predicting the occurrence of a disaster if the above phenomenon is detected.
- the disaster occurrence prediction system 1 uses existing power transmission facilities to quickly provide information predicting the occurrence of a disaster, so that a disaster occurrence prediction mechanism using infrasound can be realized efficiently and at low cost.
- the disaster occurrence prediction system 1 outputs information such as the span where infrasound was observed, the type of disaster, the area where the disaster is predicted to occur, the time when the disaster is predicted to occur, and the scale of the disaster as disaster occurrence prediction information 114, making it possible to quickly provide useful information to people in areas where a disaster is predicted to occur.
- the infrasound detection unit 125 inputs the feature quantities extracted by performing image recognition processing on the graph (image) shown in FIG. 3 as explanatory variables, a machine learning model that has been trained to output whether or not infrasound has been detected as a target variable may be used.
- the disaster type identification unit 130 inputs feature quantities extracted by performing image recognition processing on the graph (image) shown in FIG. 3 as explanatory variables, a machine learning model that has been trained to output information indicating the type of disaster as a target variable may be used.
- the disaster occurrence prediction device 100 may take into account information provided from other systems (for example, the "infrasound monitoring network" described in Non-Patent Document 1) via the communication network 5 or the like to improve the accuracy of the disaster occurrence prediction information.
- other systems for example, the "infrasound monitoring network" described in Non-Patent Document 1
- the information provided by the disaster occurrence prediction system 1 may be linked with earthquake alerts and warning information issued by public institutions and the like, and used to identify events and prevent false alarms. For example, since an earthquake usually occurs at the time infrasound is observed, it is possible to verify the accuracy (credibility) of identifying events when issuing earthquake alerts and warning information.
- Disaster prediction system 2 Power transmission tower 3 Power line 4 OPGW 4a Optical fiber 100
- Disaster occurrence prediction device 107 Optical analysis unit 110 Memory unit 111 Vibration state at each measurement point 112 Infrasound detection information 113 Disaster type information 114 Disaster occurrence prediction information 115 Facility information 116 Geographic information 120 Vibration state measurement unit 125 Infrasound detection unit 130 Disaster type identification unit 132 Disaster occurrence prediction information generation unit 135 Disaster occurrence prediction information transmission unit 300
- Alarm device 310 Memory unit 320 Disaster occurrence prediction information reception unit 325 Disaster occurrence prediction information output unit S600 Disaster occurrence prediction processing S700 Disaster occurrence prediction information output processing 800 Disaster occurrence prediction information output screen
Landscapes
- Environmental & Geological Engineering (AREA)
- Life Sciences & Earth Sciences (AREA)
- Physics & Mathematics (AREA)
- General Physics & Mathematics (AREA)
- Engineering & Computer Science (AREA)
- Atmospheric Sciences (AREA)
- Remote Sensing (AREA)
- General Life Sciences & Earth Sciences (AREA)
- Geology (AREA)
- Geophysics (AREA)
- Acoustics & Sound (AREA)
- Biodiversity & Conservation Biology (AREA)
- Ecology (AREA)
- Environmental Sciences (AREA)
- Geophysics And Detection Of Objects (AREA)
- Measurement Of Mechanical Vibrations Or Ultrasonic Waves (AREA)
- Alarm Systems (AREA)
Abstract
インフラサウンドを利用した災害発生予測の仕組みを効率よく低コストで実現する。災害発生予測システムは、光解析ユニットと情報処理装置を含んで構成され、送電線に沿って付設される光ファイバに沿って設定された測定点における光ファイバの周波数毎の振動強度の時間変化をDAS(Distributed Acoustic Sensing)により取得し、測定点の周波数毎の振動強度の時間変化にインフラサウンドに起因する態様が存在するか否かをリアルタイムに監視し、上記の態様を検出した場合に災害の発生を予測する情報を出力する。
Description
本発明は、災害発生予測システム、及び災害発生予測方法に関する。
特許文献1には、OPGW(OPtical fiber composite overhead Ground Wire)(光ファイバ複合架空地線)から後方レイリー散乱光を取得し、取得した後方レイリー散乱光に基づき光ファイバ複合架空地線の固有振動数を含む周波数領域についての振動情報を生成し、生成した振動情報に基づき送電設備の異常を検出する異常検出装置について記載されている。
特許文献2には、インフラサウンド(超低周波音、微気圧波)により津波に関する情報を取得する津波検出装置について記載されている。津波検出装置は、地震を感知する地震感知部が感知した地震が所定の大きさ以上の地震か否かを判断し、インフラサウンドを計測し、所定の大きさ以上の地震が感知されると、計測したインフラサウンドの音圧変化の大きさに基づき津波発生の有無を判定する。
非特許文献1には、「微気圧振動の観測結果を活用した津波の早期検知に関する研究」において、試験的に観測を実施している微気圧振動データに関して記載されている。
"インフラサウンド・モニタリング・ネットワーク",一般財団法人日本気象協会、[online],インターネット<URL:https://micos-sc.jwa.or.jp/infrasound-net/observed/>,令和5年11月1日検索
インフラサウンドは、地震、津波、台風、火山噴火、隕石落下等の災害をもたらすような大規模な物理現象により発生し、大気中を遠方まで伝わる性質を有する。そのため、防災のための情報を遠隔地から得る遠隔計測(リモートセンシング)手段としての活用が期待されている。また、特許文献2や非特許文献1に記載されているように、インフラサウンドを利用した防災システムについての開発や研究が進められている。
ところで、特許文献2や非特許文献1に記載されている仕組みによりインフラサウンドを利用した防災システムを実現しようとした場合、地震感知部として地震計を備えた高価な津波検知装置を多数用意する必要がある。また、津波検知装置を常時動作させるための電源供給が可能な設置場所を確保する必要もある。更に、津波検知装置の設置や維持管理には多大な労力とコストが必要になる。
本発明は、このような背景に鑑みてなされたものであり、インフラサウンドを利用した災害発生予測の仕組みを効率よく低コストで実現することが可能な、災害発生予測システム、及び災害発生予測方法を提供することを目的とする。
上記課題を解決するための手段の一つは、広域かつ面的に整備されている送電設備を活用した災害発生予測システムであって、光解析ユニットと情報処理装置を含んで構成され、送電線に沿って付設される光ファイバに沿って設定された測定点における前記光ファイバの周波数毎の振動強度の時間変化をDAS(Distributed Acoustic Sensing)により取得し、前記測定点の前記周波数毎の振動強度の時間変化にインフラサウンドに起因する態様が存在するか否かをリアルタイムに監視し、前記態様を検出した場合に災害の発生を予測する情報を出力する。
その他、本願が開示する課題、及びその解決方法は、発明を実施するための形態の欄、及び図面により明らかにされる。
本発明によれば、インフラサウンドを利用した災害発生予測の仕組みを効率よく低コストで実現することができる。
以下、本発明をその一実施形態に即して添付図面を参照しつつ説明する。本明細書及び添付図面の記載により、少なくとも以下の事項が明らかとなる。以下の説明において、符号の前に付した「S」の文字は処理ステップの意味である。
図1に本発明の一実施形態として説明する災害発生予測システム1の概略的な構成を示している。災害発生予測システム1は、変電所6等に設けられる災害発生予測装置100と、一つ以上の警報装置300と、を含む。
災害発生予測装置100は、情報処理装置(コンピュータ)を用いて構成される。災害発生予測装置100は、通信ネットワーク5を介して警報装置300と通信可能に接続している。通信ネットワークは、例えば、LAN(Local Area Network)、WAN(Wide Area Network)、インターネット(internet)、PLC(Power Line Communication)、公衆通信網、専用線等である。
災害発生予測装置100は、送電線3に架設されているOPGW4(OPtical fiber composite overhead Ground Wire)(光ファイバ複合架空地線)の光ファイバ4aを振動検知センサとして用い、光ファイバ4aに沿って設定された複数の測定位置(以下、「測定点」と称する。)の夫々における光ファイバ4aの伸縮に基づく振動状態(振動強度、振動周波数)を測定する技術(分布型多点振動測定法(以下、「DAS」(Distributed Acoustic Sensing)と称する。)により、各測定点の振動状態を取得する。DASでは、例えば、C-OTDR(Coherent detection Optical Time Domain Reflectometer)の原理により各測定点の振動状態を取得する。
図2は、災害発生予測装置100がDASにより各測定点の振動状態を測定する仕組みを説明する図である。同図に示すように、災害発生予測装置100は、光ファイバ4aの端面から光パルス(レーザーパルス。以下、「入射光」とも称する。)を入射し、各測定点における、光パルスの後方散乱光の位相差の変化速度(≒伸縮周波数)を測定する。尚、上記の位相差は、後方散乱光どうしの干渉による強度変化から推定する。そして、災害発生予測装置100は、測定した上記変化速度に基づき、各測定点における光ファイバ4aの縦波と横波の振動周波数(例えば、最大10kHzの範囲の振動周波数)を求める。また、災害発生予測装置100は、振動周波数毎の位相差に基づき、各測定点における振動強度(スペクトル強度、振動振幅)を求める。尚、災害発生予測装置100は、入射光を上記端面に入射した時点から戻り光を受光した時点までの経過時間に基づき、各測定点の位置(上記端面からの距離)を求める。
上記の測定点は、例えば、光ファイバに沿って送電鉄塔2の径間よりも短い所定間隔d(m)毎に設定される(0(m)、d(m)、・・・・、N(m)、N+d(m)、N+2d(m))。例えば、図1に示すように、所定間隔dを5(m)とし、送電線3の最長70(km)の範囲に測定点を設定した場合、光ファイバに沿って14000程度の測定点が設定される。
尚、各測定点における光ファイバ4aの振動状態には、光ファイバ4aが外部から受けた音(音圧)の影響が含まれる。即ち、隣接する送電鉄塔2間(径間)の光ファイバ4aは、両端の送電鉄塔2を固定端とした弦であり、外部から受けた特定周波数の音に共振して固有振動が発生する。
災害発生予測装置100は、各測定点の振動状態の時間変化(周波数毎の振動強度の時間変化)に基づき、インフラサウンド(超低周波音、微気圧波)に関する情報を取得する。例えば、音速を340(m/s)とした場合、インフラサウンド(20Hz以下)を観測するには、インフラサウンドの周波数を1Hzとすると、送電線3の長さが、波長(=340(m/s)/1(Hz))の1/2(=170m)以上であればよい。既設の送電線3の多くはこの条件を満たしている。
災害発生予測装置100は、DASにより観測したインフラサウンドに基づき、災害の発生を予測する情報(以下、「災害発生予測情報」と称する。)を生成し、生成した災害発生予測情報を警報装置300に送信する。
図1に戻り、警報装置300は、通信ネットワーク5を介して災害発生予測装置100と通信可能な情報処理装置(コンピュータ)であり、例えば、パーソナルコンピュータ、スマートフォン、タブレット、各種サーバ装置、メインフレーム等である。警報装置300は、例えば、災害監視を行っている組織の施設(防災センター、市区町村が運営する施設等)により運用される。警報装置300は、災害発生予測装置100から送られてくる災害発生予測情報を受信すると、受信した災害発生予測情報に基づく情報を出力(表示装置への表示、音声出力装置からの音声出力等)する。
続いて、インフラサウンドと、災害発生予測装置100がDASにより取得する各測定点の振動状態(振動強度、振動周波数)の時間変化(周波数毎の振動強度の時間変化)との関係について説明する。
図3は、2023年7月22日21時14分頃、日向灘において地震(震度「4」)が発生した際に広島県から島根県に亘る送電線3について災害発生予測装置100がDASにより取得した、各測定点の周波数毎の振動強度の時間変化を示すグラフである。3つのグラフは夫々、広島県廿日市市付近における、上記送電線3の隣接する3つの各径間(識別子(以下、「径間ID」と称する。)が「K1」、「K2」、「K3」の各径間)の測定点について測定された、光ファイバ4aの周波数毎の振動強度の時間変化である。尚、各グラフにおいて、時間は紙面の上から下に流れる。また、同図における色の濃淡は、周波数毎の振動強度(任意単位(Arbitrary Unit))を表す(色が薄い程、振動強度が大きい)。
同図に示すように、いずれの測定点においても、21時15分30秒前後にインフラサウンドに起因する周波数が3~4Hzの振動が観測されている。また、同時間帯には、地震の揺れにより、各径間の測定点において広い周波数帯域に亘りインフラサウンドに起因する振動が観測されている。尚、同図示す観測結果を、非特許文献1に記載の「インフラサウンド・モニタリング・ネットワーク」における観測点(安芸市消防防災センター(高知県安芸市)に設置されている観測点。広島県廿日市市と高知県安芸市は日向灘からほぼ等距離に位置する。)の同時間帯における微気圧振動観測データと照合したところ、同時間帯に気圧変動の標準偏差が10秒間程大きくなっていること、及び21時15分33秒に気圧変動の標準偏差がピークとなっていることが確認された。
ここでインフラサウンドの伝達速度は音速とほぼ同じであるため、地震が発生した場合、津波が到達するよりも前にDASにより観測される。このため、DASによりインフラサウンドが観測された際、災害の発生が予測される地域に設置されている警報装置300にその旨や観測したインフラサウンドに基づく情報(津波の到達が予測されること、津波の到達予測時刻、津波の規模(波高等)等)を災害発生予測情報として事前に伝えることが可能である。
図4Aは、災害発生予測装置100の主な構成を示す図である。同図に示すように、災害発生予測装置100は、プロセッサ101、主記憶装置102(メモリ)、補助記憶装置103(外部記憶装置)、入力装置104、出力装置105、通信装置106、及び光解析ユニット107を備える。これらはバス(bus)や通信ケーブル等を介して通信可能に接続されている。尚、災害発生予測装置100は、その全部又は一部が、例えば、クラウドシステムによって提供される仮想サーバのように、仮想的な情報処理資源を用いて実現されるものであってもよい。
プロセッサ101は、例えば、CPU(Central Processing Unit)、MPU(Micro Processing Unit)、GPU(Graphics Processing Unit)、FPGA(Field Programmable Gate Array)、ASIC(Application Specific Integrated Circuit)、AI(Artificial Intelligence)チップ等を用いて構成されている。
主記憶装置102は、プロセッサ101がプログラムを実行する際に利用する記憶装置であり、例えば、ROM(Read Only Memory)、RAM(Random Access Memory)、不揮発性メモリ(NVRAM(Non Volatile RAM))等である。
補助記憶装置103は、プログラムやデータを記憶する装置であり、例えば、SSD(Solid State Drive)、ハードディスクドライブ、光学式記憶装置(CD(Compact Disc)、DVD(Digital Versatile Disc)等)等で構成することができる。補助記憶装置103には、記録媒体の読取装置や通信装置106を介して、非一時的な記録媒体や非一時的な記憶装置を備えた他の情報処理装置からプログラムやデータを読み込むことができる。補助記憶装置103に格納(記憶)されているプログラムやデータは主記憶装置102に随時読み込まれる。
入力装置104は、外部からの情報の入力を受け付けるインタフェースであり、例えば、キーボード、マウス、タッチパネル、音声入力装置等である。
出力装置105は、処理経過や処理結果等の各種情報を外部に出力するインタフェースである。出力装置105は、例えば、上記の各種情報を可視化する表示装置(液晶モニタ、LCD(Liquid Crystal Display)等)、上記の各種情報を音声化する装置(音声出力装置(スピーカ等))、上記の各種情報を文字化する装置(印字装置等)である。尚、例えば、情報処理装置10が通信装置106を介して他の装置との間で情報の入力や出力を行う構成としてもよい。
入力装置104と出力装置105は、ユーザとの間での対話処理(情報の受け付け、情報の提供等)を実現するユーザインタフェースを構成する。
通信装置106は、通信ネットワーク5(LAN(Local Area Network)、WAN(Wide Area Network)、インターネット、公衆通信網、専用線等)を介して他の装置との間の通信を実現する装置である。通信装置106は、通信媒体を介して他の装置との間の通信を実現する、有線方式又は無線方式の通信インタフェースであり、例えば、NIC(Network Interface Card)、無線通信モジュール、USBモジュール(USB:Universal Serial Bus)等である。
光解析ユニット107は、DASにより測定点の振動状態を測定する装置であり、C-OTDRによる振動測定機器や信号処理回路を含む。光解析ユニット107は、光ファイバ4aの端面に入力する光パルス(レーザー光)を生成するCW(連続波)レーザー光源、光パルス発生器、光増幅器、光学機器(光検波器、光干渉器)、信号処理回路(位相計算回路等)等を含む。尚、光解析ユニット107と光ファイバ4aとの接続は、例えば、変電所内に設けられているOPGWの芯線の接続口(ソケット)に光解析ユニット107のレーザー光源の出射部を光学的に接続することにより行われる。そのため、接続に際して停電等の電力系統への影響を生じさせることはない。
災害発生予測装置100には、例えば、オペレーティングシステム、ファイルシステム、DBMS(DataBase Management System)(リレーショナルデータベース、NoSQL等)、KVS(Key-Value Store)等が導入されていてもよい。
災害発生予測装置100が備える各種の機能は、プロセッサ101が、主記憶装置102に格納されているプログラムを読み出して実行することにより、もしくは、災害発生予測装置100を構成するハードウェア(FPGA、ASIC、AIチップ等)自体によって実現される。災害発生予測装置100は、各種の情報(データ)を、例えば、データベースのテーブルやファイルシステムが管理するファイルとして記憶する。
図4Bは、災害発生予測装置100が備える主な機能を説明するブロック図である。同図に示すように、災害発生予測装置100は、記憶部110、振動状態測定部120、インフラサウンド検出部125、災害種類特定部130、災害発生予測情報生成部132、及び災害発生予測情報送信部135の各機能を備える。
上記機能のうち、記憶部110は、測定点毎振動状態111、インフラサウンド検出情報112、災害種類情報113、災害発生予測情報114、設備情報115、及び地理情報116を記憶する。このうち測定点毎振動状態111、インフラサウンド検出情報112、災害種類情報113、災害発生予測情報114については後述する。設備情報115は、送電設備に関する情報(各測定点と各径間との対応、送電設備の種類、送電設備や径間の位置(緯度、経度)等)を含む。また、地理情報116は、送電設備が展開されている周辺地域の地図や地理に関する情報を含む。
振動状態測定部120は、DASにより各径間の各測定点の周波数毎の振動強度の時間変化を測定し、測定した結果を測定点毎振動状態111として管理する。測定点毎振動状態111は、例えば、図3に例示したグラフの情報を含む。
インフラサウンド検出部125は、測定点毎振動状態111に含まれている各測定点の上記期間における周波数毎の振動強度の時間変化に基づきインフラサウンドを検出する。インフラサウンド検出部125は、各測定点の周波数毎の振動強度の時間変化にインフラサウンドに起因する態様が存在するか否かをリアルタイムに監視することによりインフラサウンドを検出する。インフラサウンド検出部125は、例えば、図3に示すグラフについてデータ解析(背景ノイズ除去、信号特定等)を行うことによりインフラサウンドを検出する。
インフラサウンド検出部125は、インフラサウンドを検出すると、インフラサウンドを検出したことを示す情報や、測定点の周波数毎の振動強度の時間変化におけるインフラサウンドに起因する態様に基づく情報を、インフラサウンド検出情報112として管理する。例えば、インフラサウンド検出部125は、インフラサウンドを検出した日時を示す情報や、インフラサウンドを検出したと判定する根拠とした情報(例えば、図3に示すグラフから取得される情報)を、インフラサウンド検出情報112として管理する。
インフラサウンド検出部125は、例えば、隣接する所定数以上の径間の夫々の測定点において、インフラサウンドの周波数帯域(20Hz以下)に所定の大きさ以上の振動強度が観測されている場合にインフラサウンドを検出したと判定する。また、例えば、インフラサウンド検出部125は、隣接する所定数以上の径間の夫々の測定点において広い周波数帯域に亘り所定の大きさ以上の振動が観測されている場合にインフラサウンドを検出したと判定する。尚、各測定点の周波数毎の振動強度の時間変化について、以上に示した以外の方法や基準を適用してインフラサウンド検出部125がインフラサウンドを検出するようにしてもよい。また、複数の方法や基準を組合せて検出精度を高めるようにしてもよい。
災害種類特定部130は、インフラサウンド検出部125がインフラサウンドを検出した場合に当該インフラサウンドを検出したと判定する根拠とした情報(例えば、図3に示すグラフから取得される情報)に基づき、災害の種類(地震、津波、台風、火山噴火、隕石落下等)を特定し、特定した災害の種類を災害種類情報113として管理する。
災害発生予測情報生成部132は、インフラサウンド検出情報112や災害種類情報113に基づき災害発生予測情報114を生成して管理する。災害発生予測情報114は、例えば、インフラサウンド検出情報112から取得される、インフラサウンドを検出した日時やインフラサウンドを検出した径間を示す情報を含む。また、災害発生予測情報114は、例えば、災害種類情報113から取得される、災害の種類、災害の発生が予測される地域を特定する情報、特定した地域毎の災害の発生する予測時刻、特定した地域毎の予測される災害の規模、災害の発生が予測(予想)される地域等の情報を含む。
尚、災害発生予測情報生成部132は、例えば、インフラサウンドを検出した径間の位置(緯度、経度)を設備情報115から特定し、特定した位置を地理情報116と対照することにより、災害の発生が予測される地域を特定する。例えば、災害発生予測情報生成部132は、インフラサウンドを検出した径間の位置から所定距離内に存在する地域を災害の発生が予測される地域として特定する。また、災害発生予測情報生成部132は、例えば、特定した上記地域とインフラサウンドを検出した径間との間の距離に基づき、地域毎の災害の発生する予測時刻や災害の規模を求める。また、災害発生予測情報生成部132は、例えば、図3に示すグラフから取得される振動強度等に基づき上記の規模を求める。
同図に示す災害発生予測情報送信部135は、災害発生予測情報生成部132が生成した災害発生予測情報114を通信ネットワーク5を介して警報装置300に送信する。
図5Aは、警報装置300の主な構成を示す図である。同図に示す各要素は基本的に図4Aに示した災害発生予測装置100の同名の要素と同様であるので説明を省略する。
図5Bは、警報装置300が備える主な機能を説明するブロック図である。同図に示すように、警報装置300は、記憶部310、災害発生予測情報受信部320、及び災害発生予測情報出力部325の各機能を備える。
上記機能のうち、記憶部110は、災害発生予測情報311を記憶する。
災害発生予測情報受信部320は、災害発生予測装置100から送られてくる災害発生予測情報114を受信し、受信した災害発生予測情報114を災害発生予測情報311として管理する。
災害発生予測情報出力部325は、災害発生予測情報311に基づく情報を出力装置(表示装置、音声出力装置(スピーカ)等)に出力する。
図6は、災害発生予測装置100が行う処理(以下、「災害発生予測処理S600」と称する。)を説明するフローチャートである。以下、同図とともに災害発生予測処理S600について説明する。尚、以下の説明の前提として、災害発生予測装置100の振動状態測定部120は、DASによりリアルタイムに各径間の各測定点の振動状態(振動強度、振動周波数)の時間変化(周波数毎の振動強度の時間変化)を測定し、各測定点の最新の振動状態を測定点毎振動状態111として管理しているものとする。
同図に示すように、インフラサウンド検出部125は、測定点毎振動状態111に基づき各測定点の周波数毎の振動強度の時間変化をリアルタイムに監視している(S611~S612:No)。インフラサウンド検出部125は、測定点毎振動状態111から取得される各測定点の周波数毎の振動強度の時間変化にインフラサウンドに起因する態様を検出すると(S612:Yes)、検出したインフラサウンドについてインフラサウンド検出情報112を生成して管理する(S613)。
続いて、災害種類特定部130が、インフラサウンド検出部125がインフラサウンドを検出したと判定する根拠とした情報に基づき、災害の種類を特定し、特定した災害の種類を災害種類情報113として管理する(S614)。
続いて、災害発生予測情報生成部132が、インフラサウンド検出情報112や災害種類情報113に基づき災害発生予測情報114を生成して管理する(S615)。
続いて、災害発生予測情報送信部135が、災害発生予測情報生成部132が生成した災害発生予測情報114を通信ネットワーク5を介して警報装置300に送信する(S616)。その後、処理はS611に戻る。
図7は、警報装置300が行う処理(以下、「災害発生予測情報出力処理S700」と称する。)を説明するフローチャートである。以下、同図とともに災害発生予測情報出力処理S700ついて説明する。
同図に示すように、災害発生予測情報受信部320は、災害発生予測装置100から送られてくる災害発生予測情報114の受信をリアルタイムに待機している(S711:No)。災害発生予測情報受信部320は、災害発生予測情報114を受信すると(S711:Yes)、受信した災害発生予測情報114を災害発生予測情報311として管理する(S712)。
続いて、災害発生予測情報出力部325が、災害発生予測情報311に基づく情報を出力装置に出力する(S713)。その後、処理はS711に戻る。
図8は、災害発生予測情報出力部325が上記情報を出力する際に表示する画面の一例(以下、「災害発生予測情報出力画面800」と称する。)である。
同図に示すように、例示する災害発生予測情報出力画面800は、インフラサウンド検出日時の表示欄811、検出径間の表示欄812、災害種類の表示欄813、災害発生予測地域の表示欄814、災害発生予測時刻の表示欄815、及び災害規模の表示欄816を有する。
このうちインフラサウンド検出日時の表示欄811には、インフラサウンド検出部125がインフラサウンドを検出した日時が表示される。
また、検出径間の表示欄812には、インフラサウンドが検出された径間の径間IDが表示される。
また、災害種類の表示欄813には、災害種類情報113の内容(災害の種類を示す情報)が表示される。
また、災害発生予測地域の表示欄814には、災害の発生が予測される地域を示す情報が表示される。
また、災害発生予測時刻の表示欄815には、災害の発生予測時刻が表示される。
また、災害規模の表示欄816には、発生する災害の規模が表示される。
以上に説明したように、本実施形態の災害発生予測システム1は、DASにより取得される各測定点の振動状態(振動強度、振動周波数)の時間変化(周波数毎の振動強度の時間変化)にインフラサウンドに起因する態様が存在するか否かをリアルタイムに監視し、上記の態様を検出した場合に災害の発生を予測する情報を出力する。このように、災害発生予測システム1は既存の送電設備を利用して災害の発生を予測する情報を迅速に提供するので、インフラサウンドを利用した災害発生予測の仕組みを効率よく低コストで実現することができる。
また、災害発生予測システム1は、インフラサウンドが観測された径間、災害の種類、災害の発生が予測される地域、災害の発生が予測される時刻、災害の規模等の情報を災害発生予測情報114として出力するので、災害の発生が予測される地域の人々に有用な情報を迅速に提供することができる。
尚、上記の実施形態は、本発明の理解を容易にするためのものであり、本発明を限定して解釈するためのものではない。本発明は、その趣旨を逸脱することなく、変更、改良され得るとともに、本発明にはその等価物も含まれる。
例えば、インフラサウンド検出部125が、図3に示すグラフ(画像)について画像認識処理を行うことにより抽出される特徴量を説明変数として入力すると、インフラサウンドの検出有無を目的変数として出力するように学習した機械学習モデルを用いて行うようにしてもよい。
また例えば、災害種類特定部130が、図3に示すグラフ(画像)について画像認識処理を行うことにより抽出される特徴量を説明変数として入力すると、災害の種類を示す情報を目的変数として出力するように学習した機械学習モデルを用いて行うようにしてもよい。
また例えば、災害発生予測装置100が、他のシステム(例えば、非特許文献1に記載の「インフラサウンド・モニタリング・ネットワーク」)から通信ネットワーク5等を介して提供される情報を考慮して災害発生予測情報の精度を高めるようにしてもよい。
また例えば、災害発生予測システム1が提供する情報を、公的機関等が発出する地震速報や警報情報等と連動させ、事象の特定や誤報防止として活用するようにしてもよい。例えば、インフラサウンドが観測された時点で通常は地震も発生しているため、地震速報や警報情報等を発する際の事象の特定精度(信憑性)を検証することができる。
1 災害発生予測システム
2 送電鉄塔
3 送電線
4 OPGW
4a 光ファイバ
100 災害発生予測装置
107 光解析ユニット
110 記憶部
111 測定点毎振動状態
112 インフラサウンド検出情報
113 災害種類情報
114 災害発生予測情報
115 設備情報
116 地理情報
120 振動状態測定部
125 インフラサウンド検出部
130 災害種類特定部
132 災害発生予測情報生成部
135 災害発生予測情報送信部
300 警報装置
310 記憶部
320 災害発生予測情報受信部
325 災害発生予測情報出力部
S600 災害発生予測処理
S700 災害発生予測情報出力処理
800 災害発生予測情報出力画面
2 送電鉄塔
3 送電線
4 OPGW
4a 光ファイバ
100 災害発生予測装置
107 光解析ユニット
110 記憶部
111 測定点毎振動状態
112 インフラサウンド検出情報
113 災害種類情報
114 災害発生予測情報
115 設備情報
116 地理情報
120 振動状態測定部
125 インフラサウンド検出部
130 災害種類特定部
132 災害発生予測情報生成部
135 災害発生予測情報送信部
300 警報装置
310 記憶部
320 災害発生予測情報受信部
325 災害発生予測情報出力部
S600 災害発生予測処理
S700 災害発生予測情報出力処理
800 災害発生予測情報出力画面
Claims (10)
- 光解析ユニットと情報処理装置を含んで構成され、
送電線に沿って付設される光ファイバに沿って設定された測定点における前記光ファイバの周波数毎の振動強度の時間変化をDAS(Distributed Acoustic Sensing)により取得し、
前記測定点の前記周波数毎の振動強度の時間変化にインフラサウンドに起因する態様が存在するか否かをリアルタイムに監視し、
前記態様を検出した場合に災害の発生を予測する情報を出力する、
災害発生予測システム。 - 請求項1に記載の災害発生予測システムであって、
前記態様についてデータ解析を行うことにより前記災害の種類を特定し、
特定した前記災害の種類を示す情報を出力する、
災害発生予測システム。 - 請求項1に記載の災害発生予測システムであって、
前記測定点と前記送電線の径間との対応を示す情報を記憶し、
前記周波数毎の振動強度の時間変化にインフラサウンドに起因する態様を含む前記測定点を有する径間を示す情報を出力する、
災害発生予測システム。 - 請求項1に記載の災害発生予測システムであって、
前記測定点と前記送電線の径間との対応を示す情報と、前記径間が存在する位置を示す情報と、前記送電線の周辺の地理情報と、を記憶し、
前記周波数毎の振動強度の時間変化にインフラサウンドに起因する態様を含む前記測定点を有する径間を特定し、
特定した前記径間の周辺の地域における災害の発生を予測する情報を出力する、
災害発生予測システム。 - 請求項4に記載の災害発生予測システムであって、
特定した前記径間からの距離に基づき、前記周辺の地域において前記災害の発生が予測される時刻を求め、求めた前記時刻を示す情報を出力する、
災害発生予測システム。 - 請求項4に記載の災害発生予測システムであって、
特定した前記径間からの距離に基づき、前記周辺の地域における前記災害の規模を求め、求めた前記規模を示す情報を出力する、
災害発生予測システム。 - 光解析ユニットと情報処理装置を含んで構成される災害発生予測システムにおいて、
前記情報処理装置が、
送電線に沿って付設される光ファイバに沿って設定された測定点における前記光ファイバの周波数毎の振動強度の時間変化をDAS(Distributed Acoustic Sensing)により取得するステップ、
前記測定点の前記周波数毎の振動強度の時間変化にインフラサウンドに起因する態様が存在するか否かをリアルタイムに監視するステップ、及び、
前記態様を検出した場合に災害の発生を予測する情報を出力するステップ、
を実行する、災害発生予測方法。 - 請求項7に記載の災害発生予測方法であって、
前記情報処理装置が、
前記態様についてデータ解析を行うことにより前記災害の種類を特定するステップ、及び、
特定した前記災害の種類を示す情報を出力するステップ、
を更に実行する、災害発生予測方法。 - 請求項7に記載の災害発生予測方法であって、
前記情報処理装置が、
前記測定点と前記送電線の径間との対応を示す情報を記憶するステップ、及び、
前記周波数毎の振動強度の時間変化にインフラサウンドに起因する態様を含む前記測定点を有する径間を示す情報を出力するステップ、
を更に実行する、災害発生予測方法。 - 請求項7に記載の災害発生予測方法であって、
前記測定点と前記送電線の径間との対応を示す情報と、前記径間が存在する位置を示す情報と、前記送電線の周辺の地理情報と、を記憶するステップ、
前記周波数毎の振動強度の時間変化にインフラサウンドに起因する態様を含む前記測定点を有する径間を特定するステップ、及び、
特定した前記径間の周辺の地域における災害の発生を予測する情報を出力するステップ、
を更に実行する、災害発生予測方法。
Priority Applications (2)
| Application Number | Priority Date | Filing Date | Title |
|---|---|---|---|
| PCT/JP2023/042822 WO2025115148A1 (ja) | 2023-11-29 | 2023-11-29 | 災害発生予測システム、及び災害発生予測方法 |
| JP2024505402A JP7460042B1 (ja) | 2023-11-29 | 2023-11-29 | 災害発生予測システム、及び災害発生予測方法 |
Applications Claiming Priority (1)
| Application Number | Priority Date | Filing Date | Title |
|---|---|---|---|
| PCT/JP2023/042822 WO2025115148A1 (ja) | 2023-11-29 | 2023-11-29 | 災害発生予測システム、及び災害発生予測方法 |
Publications (1)
| Publication Number | Publication Date |
|---|---|
| WO2025115148A1 true WO2025115148A1 (ja) | 2025-06-05 |
Family
ID=90474299
Family Applications (1)
| Application Number | Title | Priority Date | Filing Date |
|---|---|---|---|
| PCT/JP2023/042822 Pending WO2025115148A1 (ja) | 2023-11-29 | 2023-11-29 | 災害発生予測システム、及び災害発生予測方法 |
Country Status (2)
| Country | Link |
|---|---|
| JP (1) | JP7460042B1 (ja) |
| WO (1) | WO2025115148A1 (ja) |
Citations (5)
| Publication number | Priority date | Publication date | Assignee | Title |
|---|---|---|---|---|
| JPH08128869A (ja) * | 1994-10-28 | 1996-05-21 | Nec Corp | 津波検出装置及び津波検出システム |
| US6788417B1 (en) * | 1999-04-30 | 2004-09-07 | The Regents Of The University Of California | Optical fiber infrasound sensor |
| JP2013246554A (ja) * | 2012-05-24 | 2013-12-09 | Tokyo Metropolitan Univ | 津波警報システム、津波警報方法、及び津波警報システム用のプログラム |
| CN111445671A (zh) * | 2020-04-02 | 2020-07-24 | 国网湖北省电力公司咸宁供电公司 | 基于光纤应变解析的输电线路地质灾害监测系统与方法 |
| JP2023050257A (ja) * | 2021-09-30 | 2023-04-11 | 富士通株式会社 | 異常検出プログラム、異常検出装置、及び異常検出方法 |
-
2023
- 2023-11-29 JP JP2024505402A patent/JP7460042B1/ja active Active
- 2023-11-29 WO PCT/JP2023/042822 patent/WO2025115148A1/ja active Pending
Patent Citations (5)
| Publication number | Priority date | Publication date | Assignee | Title |
|---|---|---|---|---|
| JPH08128869A (ja) * | 1994-10-28 | 1996-05-21 | Nec Corp | 津波検出装置及び津波検出システム |
| US6788417B1 (en) * | 1999-04-30 | 2004-09-07 | The Regents Of The University Of California | Optical fiber infrasound sensor |
| JP2013246554A (ja) * | 2012-05-24 | 2013-12-09 | Tokyo Metropolitan Univ | 津波警報システム、津波警報方法、及び津波警報システム用のプログラム |
| CN111445671A (zh) * | 2020-04-02 | 2020-07-24 | 国网湖北省电力公司咸宁供电公司 | 基于光纤应变解析的输电线路地质灾害监测系统与方法 |
| JP2023050257A (ja) * | 2021-09-30 | 2023-04-11 | 富士通株式会社 | 異常検出プログラム、異常検出装置、及び異常検出方法 |
Non-Patent Citations (1)
| Title |
|---|
| YAMAMOTO MASA-YUKI, SAITO HIROAKI, KAI YOSHIRO, KIKUCHI YUTAKA, KAKINAMI YOSHIHIRO, YOKOTA AKIHIRO: "Infrasound Laboratory's Efforts for Regional Disaster Prevention/Mitigation", KOCHI UNIVERSITY OF TECHNOLOGY BULLETIN, vol. 16, no. 1, 31 July 2019 (2019-07-31), JP, pages 29 - 37, XP093322708, ISSN: 2189-1265 * |
Also Published As
| Publication number | Publication date |
|---|---|
| JP7460042B1 (ja) | 2024-04-02 |
| JPWO2025115148A1 (ja) | 2025-06-05 |
Similar Documents
| Publication | Publication Date | Title |
|---|---|---|
| Gorshkov et al. | Scientific applications of distributed acoustic sensing: State-of-the-art review and perspective | |
| López-Castro et al. | A systematic review of structural health monitoring systems to strengthen post-earthquake assessment procedures | |
| Wu | Progress on development of an earthquake early warning system using low-cost sensors | |
| Hsiao et al. | A new prototype system for earthquake early warning in Taiwan | |
| Iannaccone et al. | A prototype system for earthquake early-warning and alert management in southern Italy | |
| Mucciarelli et al. | The influence of wind on measurements of seismic noise | |
| Fichtner et al. | Fiber‐optic observation of volcanic tremor through floating ice sheet resonance | |
| Clayton et al. | CSN‐LAUSD network: A dense accelerometer network in Los Angeles Schools | |
| Bindi et al. | On-site structure-specific real-time risk assessment: perspectives from the REAKT project | |
| Scaini et al. | Near‐real‐time damage estimation for buildings based on strong‐motion recordings: An application to target areas in northeastern Italy | |
| Porras et al. | Preliminary results of an earthquake early warning system in Costa Rica | |
| Grapenthin et al. | The utility of GNSS for earthquake early warning in regions with sparse seismic networks | |
| CN119165523A (zh) | 基于地震预警的地震事件判别方法及装置 | |
| Picozzi | An attempt of real-time structural response assessment by an interferometric approach: A tailor-made earthquake early warning for buildings | |
| Evers et al. | Tracing a meteoric trajectory with infrasound | |
| Hilbring et al. | Earthquake early warning for transport lines | |
| JP7460042B1 (ja) | 災害発生予測システム、及び災害発生予測方法 | |
| Ogweno et al. | Earthquake early warning feasibility study for the New Madrid seismic zone | |
| Franchi et al. | Structural health monitoring systems operating in a 5g-based network | |
| Tiganescu et al. | PREVENT—An integrated multi-sensor system for seismic monitoring of civil structures | |
| WO2025109652A1 (ja) | 設備監視システム、及び設備監視方法 | |
| RU2337382C1 (ru) | Способ краткосрочного предсказания землетрясений | |
| Casazza et al. | Application of an innovative monolithic mechanical seismometer for urban vibroscape monitoring | |
| WO2025094280A1 (ja) | 落雷監視システム、及び落雷監視方法 | |
| Taale | Design concept for an IoT-based earthquake early warning platform |
Legal Events
| Date | Code | Title | Description |
|---|---|---|---|
| ENP | Entry into the national phase |
Ref document number: 2024505402 Country of ref document: JP Kind code of ref document: A |
|
| WWE | Wipo information: entry into national phase |
Ref document number: 2024505402 Country of ref document: JP |
|
| 121 | Ep: the epo has been informed by wipo that ep was designated in this application |
Ref document number: 23960166 Country of ref document: EP Kind code of ref document: A1 |