WO2025057751A1 - 情報処理装置、情報処理方法および情報処理プログラム - Google Patents
情報処理装置、情報処理方法および情報処理プログラム Download PDFInfo
- Publication number
- WO2025057751A1 WO2025057751A1 PCT/JP2024/030928 JP2024030928W WO2025057751A1 WO 2025057751 A1 WO2025057751 A1 WO 2025057751A1 JP 2024030928 W JP2024030928 W JP 2024030928W WO 2025057751 A1 WO2025057751 A1 WO 2025057751A1
- Authority
- WO
- WIPO (PCT)
- Prior art keywords
- point cloud
- camera
- point
- pair
- information processing
- Prior art date
- Legal status (The legal status is an assumption and is not a legal conclusion. Google has not performed a legal analysis and makes no representation as to the accuracy of the status listed.)
- Ceased
Links
Images








Classifications
-
- G—PHYSICS
- G01—MEASURING; TESTING
- G01B—MEASURING LENGTH, THICKNESS OR SIMILAR LINEAR DIMENSIONS; MEASURING ANGLES; MEASURING AREAS; MEASURING IRREGULARITIES OF SURFACES OR CONTOURS
- G01B11/00—Measuring arrangements characterised by the use of optical techniques
-
- G—PHYSICS
- G06—COMPUTING OR CALCULATING; COUNTING
- G06T—IMAGE DATA PROCESSING OR GENERATION, IN GENERAL
- G06T7/00—Image analysis
- G06T7/80—Analysis of captured images to determine intrinsic or extrinsic camera parameters, i.e. camera calibration
Definitions
- the present invention relates to registration for multiple cameras.
- spatial recognition is necessary.
- a method using multiple images captured by multiple cameras may be adopted.
- alignment between the multiple cameras is required.
- the external parameters of the cameras are determined by registration.
- Patent Document 1 discloses a multi-sensor composite calibration method that includes internal parameter calibration of a camera and external parameter calibration of a laser radar camera.
- One objective of the present invention is to provide a new method for evaluating the accuracy of registration.
- An information processing device includes a synthesis unit that generates a synthetic image by synthesizing a first image obtained by capturing an image of a reference object on which a reference marker is arranged with a first camera and a second image obtained by capturing an image of the reference object with a second camera on the same coordinate system based on the correspondence between the first camera coordinate system of the first camera and the second camera coordinate system of the second camera; a first point cloud generation unit that extracts a first point cloud included in a first area determined based on the reference marker from the point cloud generated based on information about the reference object; a second point cloud generation unit that extracts a second point cloud included in a second area determined based on the reference marker from the point cloud included in the synthetic image; a search unit that searches for a second point pair in the second point cloud that corresponds to the first point pair for a first point pair selected from the first point cloud; and an evaluation unit that evaluates the accuracy of the correspondence based on the shape and dimensions of the first point pair and the second
- a first point pair selected from the first point cloud and a second point pair corresponding to the first point pair in the second point cloud are obtained based on a reference object on which a reference marker is placed, and the accuracy of the correspondence can be evaluated based on the shape and dimensions of the first point pair and the second point pair. Since the absolute error can also be evaluated based on the shape and dimensions of the first point pair and the second point pair, the accuracy of safety design, etc. can be improved.
- the information processing device may further include a determination unit that determines the correspondence based on the difference between the position and orientation of the reference marker calculated based on an image obtained by capturing an image of the reference object with the first camera and the position and orientation of the reference marker calculated based on an image obtained by capturing an image of the reference object with the second camera.
- a determination unit that determines the correspondence based on the difference between the position and orientation of the reference marker calculated based on an image obtained by capturing an image of the reference object with the first camera and the position and orientation of the reference marker calculated based on an image obtained by capturing an image of the reference object with the second camera.
- the information processing device may further include an optimization unit that optimizes the correspondence so that the difference in shape and dimensions between the first point pair and the second point pair is reduced.
- the search unit may determine coordinates in the second point cloud corresponding to each point of the first point pair, and determine each point of the second point pair based on the center of gravity of one or more points that exist within a predetermined distance from the determined coordinates. With this configuration, it is possible to determine points in the second point cloud corresponding to each point of the first point pair in a statistically robust manner.
- Each of the first and second regions may be determined based on the surface on which the reference marker of the reference object is arranged. With this configuration, by using the surface on which the reference marker is arranged as the reference, it is possible to optimize the point cloud required to associate the first point pair with the second point pair.
- the shape dimensions may include length and angle.
- the evaluation unit may output a histogram of length error and a histogram of angle error. With this configuration, accuracy can be evaluated from the perspective of each of the length and angle included in the shape dimensions.
- the evaluation unit may calculate the variation in the error in the shape dimensions by repeating the calculation of the error in the shape dimensions of the second pair of points. This configuration makes it possible to predict fluctuations that occur during measurement.
- the first point pair may be selected based on the geometric features of the reference object. With this configuration, the first point pair is selected more stably.
- An information processing method includes: generating a composite image by combining a first image obtained by capturing an image of a reference object on which a reference marker is arranged with a first camera and a second image obtained by capturing an image of the reference object with a second camera on the same coordinate system based on a correspondence between a first camera coordinate system of the first camera and a second camera coordinate system of the second camera; extracting a first point cloud included in a first area determined based on the reference marker from the point cloud generated based on information about the reference object; extracting a second point cloud included in a second area determined based on the reference marker from the point cloud included in the composite image; searching for a second point pair in the second point cloud that corresponds to the first point pair for a first point pair selected from the first point cloud; and evaluating the accuracy of the correspondence based on the shape and dimensions of the first point pair and the second point pair.
- An information processing program causes a computer to execute the following operations: generate a composite image by combining a first image obtained by capturing an image of a reference object on which a reference marker is arranged with a first camera and a second image obtained by capturing an image of the reference object with a second camera on the same coordinate system based on a correspondence between a first camera coordinate system of the first camera and a second camera coordinate system of the second camera; extract a first point cloud included in a first area determined based on the reference marker from the point cloud generated based on information about the reference object; extract a second point cloud included in a second area determined based on the reference marker from the point cloud included in the composite image; search for a second point pair in the second point cloud that corresponds to the first point pair for a first point pair selected from the first point cloud; and evaluate the accuracy of the correspondence based on the shape and dimensions of the first point pair and the second point pair.
- the present invention makes it possible to evaluate the accuracy of registration.
- FIG. 7 is a diagram for explaining a process of calculating a homogeneous transformation matrix in the rough calibration process shown in FIGS. 5 and 6 .
- FIG. FIG. 2 is a diagram showing an example of a marker coordinate system for markers arranged on each surface of an object.
- 11A and 11B are diagrams illustrating examples of relationships between markers in terms of rotation and translation based on a CAD canonical coordinate system.
- 11A to 11C are diagrams for explaining an example of the ROI point cloud extraction process according to the present embodiment.
- 11A to 11C are diagrams for explaining an example of a CAD-derived point cloud generation process according to the present embodiment.
- 11 is a diagram for explaining an example of a key point search in the identification process according to the present embodiment.
- FIG. 13 is a diagram for explaining a method of searching for key points by a minimum distance method.
- FIG. 13 is a diagram for explaining a method for searching for key points by the centroid method.
- FIG. 13 is a diagram for explaining a method for searching for key points by the average center of gravity method.
- 11 is a diagram for explaining a method of searching for key points by the average center of gravity method and M-estimation.
- 11A to 11C are diagrams for explaining an example of geometry calculation in the identification processing according to the present embodiment.
- FIG. 10A and 10B are diagrams for explaining a method of searching for key points using the average center of gravity method and the RANSAC method;
- 11A to 11C are diagrams for explaining an example of
- FIG. 11 is a diagram showing an example of information processing according to the present embodiment.
- FIG. 11 is a diagram showing an example of information processing according to the present embodiment.
- FIG. 11 is a diagram showing an example of information processing according to the present embodiment.
- 1 is a schematic diagram showing a configuration example of a reference object used in an information processing system according to the present embodiment.
- FIG. 1 is a schematic diagram showing a configuration example of a reference object used in an information processing system according to the present embodiment.
- FIG. 1 is a schematic diagram showing a configuration example of a reference object used in an information processing system according to the present embodiment.
- FIG. 1 is a schematic diagram showing a configuration example of a reference object used in an information processing system according to the present embodiment.
- FIG. 1 is a schematic diagram showing a configuration example of a reference object used in an information processing system according to the present embodiment.
- FIG. 11 is a diagram for explaining an example of absolute error evaluation in the accuracy evaluation process according to the present embodiment.
- FIG. 11 is a diagram for explaining an example of repeated error evaluation of the accuracy evaluation process according to the present embodiment.
- FIG. 13 is a schematic diagram showing an example of an output of an accuracy evaluation result according to the present embodiment.
- FIG. 11 is a diagram for explaining an example of a penalty term in the fine-tuning process according to the present embodiment.
- 13A and 13B are diagrams illustrating an example of a change in length error due to fine tuning processing according to the present embodiment.
- 11A and 11B are diagrams illustrating an example of a change in angle error due to fine tuning processing according to the present embodiment.
- FIG. 13A to 13C are diagrams for explaining accuracy check using a point cloud thickness in the information processing method according to the present embodiment.
- 11A to 11C are diagrams for explaining a method of calculating precision spatial distribution according to the present embodiment.
- 10 is a flowchart showing an example of a processing procedure of a calculation method for precision spatial distribution according to the present embodiment.
- 11 is a diagram showing an example of visualization of the precision spatial distribution obtained by the precision spatial distribution calculation method according to the present embodiment.
- FIG. FIG. 2 is a schematic diagram showing an example of a functional configuration of an information processing system according to the present embodiment.
- 11 is a diagram for explaining a method of setting an arbitrary world coordinate system in the information processing system according to the present embodiment.
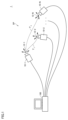
- Application Examples> 1 is a schematic diagram showing an example of the configuration of an information processing system 1 according to the present embodiment.
- the information processing system 1 includes an information processing device 100 and a plurality of cameras 10-1, 10-2, ..., 10-N (N is an integer of 2 or more) (hereinafter, sometimes collectively referred to as "cameras 10").
- Camera 10 captures, for example, a two-dimensional image (RGB image) and a depth image simultaneously. Camera 10 may also capture a three-dimensional image.
- RGB image two-dimensional image
- Camera 10 may also capture a three-dimensional image.
- the information processing device 100 performs alignment (registration or camera registration) between multiple cameras 10.
- the cameras 10-1, 10-2, ..., 10-N each have a camera coordinate system 12-1, 12-2, ..., 12-N (hereinafter, sometimes collectively referred to as "camera coordinate system 12").
- the camera coordinate system 12 corresponds to the field of view of each camera 10.
- Registration is a process for determining the correspondence between the camera coordinate systems 12 for multiple cameras 10.
- the correspondence between the camera coordinate systems 12 is determined based on one or more points in the space SP.
- the correspondence between the camera coordinate systems 12 may be, for example, a homogeneous transformation matrix, which is an external parameter of the camera.
- a homogeneous transformation matrix is explained as an example of the correspondence between the camera coordinate systems 12, but any parameter, transformation matrix, or transformation function may be used.
- the homogeneous transformation matrix T is the extrinsic parameter of one camera 10 relative to another camera 10.
- a homogeneous transformation matrix T 1 2 from the camera coordinate system 12-1 to the camera coordinate system 12-2 is calculated.
- a homogeneous transformation matrix T 1 N from the camera coordinate system 12-1 to the camera coordinate system 12-N is calculated.
- the homogeneous transformation matrix is a matrix that indicates rotation and translation (position).
- the information processing system 1 evaluates the accuracy of the correspondence (homogeneous transformation matrix T) between the calculated camera coordinate systems 12.
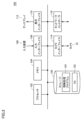
- FIG. 2 is a schematic diagram showing an example of the hardware configuration of an information processing device 100 according to the present embodiment.
- the information processing device 100 is an example of a computer, and includes one or more processors 102, a memory 104, an input interface 106, a display interface 110, a camera interface 114, a network controller 116, and storage 120.
- the one or more processors 102 execute computer-readable instructions contained in a program stored in the storage 120 to provide the processes and functions described below.
- the one or more processors 102 execute computer-readable instructions contained in a program, part or all of the program may be deployed in the memory 104.
- Storage 120 is an example of a non-transitory computer-readable medium.
- storage 120 stores an OS (Operating System) 122 and an information processing program 124.
- OS 122 includes computer-readable instructions for providing the functions required by a computer, and computer-readable instructions for generating an environment for executing information processing program 124.
- the information processing program 124 includes computer-readable instructions for the processing described below.
- the input interface 106 accepts input commands from an input device 108 such as a keyboard, a touch panel, a mouse, or a tablet.
- the input device 108 may be part of the configuration of the information processing device 100.
- the display interface 110 outputs a video signal to the display 112.
- the display 112 may be part of the configuration of the information processing device 100.
- the camera interface 114 exchanges data with multiple cameras 10 .
- the network controller 116 exchanges data with other information processing devices via the network.
- processor includes hardwired circuits as well as arithmetic circuits that sequentially execute computer-readable instructions, such as a CPU (Central Processing Unit) and a GPU (Graphics Processing Unit).
- hardwired circuits include an ASIC (Application Specific Integrated Circuit) and an FPGA (Field Programmable Gate Array).
- processor includes a SoC (System on a chip) that integrates a core, memory, and peripheral circuits.
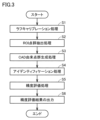
- FIG. 3 is a flowchart showing an example of a processing procedure of an information processing method according to the present embodiment.
- the processing shown in FIG. 3 includes registration and accuracy evaluation.
- Each step shown in FIG. 3 may be realized by the processor 102 of the information processing device 100 executing the information processing program 124.
- Step S1 the information processing device 100 executes a rough calibration process (step S1). After the rough calibration process is executed, the correspondence between the camera coordinate systems 12 is determined. Step S1 may be executed in advance, independently of the processing of the other steps.
- the information processing device 100 executes a ROI (Region of Interest) point cloud extraction process (step S2). By executing the ROI point cloud extraction process, the information processing device 100 extracts a point cloud included in the ROI (hereinafter also referred to as the "ROI point cloud").
- ROI point cloud a point cloud included in the ROI
- the information processing device 100 executes a CAD (Computer Aided Design) derived point cloud generation process (step S3).
- the information processing device 100 executes the CAD derived point cloud generation process to generate a point cloud based on CAD information (hereinafter also referred to as a "CAD derived point cloud").
- Step S3 may be executed in advance, independently of the processing of the other steps.
- a “point cloud” refers to a collection of points that include position information.
- a “point cloud” may include color information in addition to position information.
- the position information may be three-dimensional data or 2.5-dimensional data.
- the position information may include two-dimensional data and depth information (distance information) that are independent of each other.
- the identification process includes a process for determining the correspondence between the ROI point cloud extracted by the ROI point cloud extraction process and the CAD-derived point cloud generated by the CAD-derived point cloud generation process.
- the identification process includes a process for calculating the shape dimensions of the key point pairs of the CAD-derived point cloud and the shape dimensions of the key point pairs of the ROI point cloud.
- the accuracy evaluation process includes a process of calculating accuracy based on the shape dimensions calculated in the identification process.
- accuracy refers to the direct or indirect accuracy of the homogeneous transformation matrix T (external parameters) that is the result of registration.
- accuracy can also refer to the accuracy of spatial information reconstructed based on images captured by multiple cameras.
- accuracy can also refer to the accuracy of the result of combining images captured by multiple cameras.
- the output of the accuracy evaluation result includes, for example, a spatial visualization of the calculated accuracy.
- a fine-tuning process may be performed to optimize the correspondence between the camera coordinate systems 12.
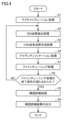
- FIG. 4 is a flowchart showing another example of the processing procedure of the information processing method according to the present embodiment.
- the processing shown in FIG. 4 includes fine tuning processing.
- Each step shown in FIG. 4 may be realized by the processor 102 of the information processing device 100 executing the information processing program 124.
- Step S1 The information processing device 100 executes a rough calibration process (step S1).
- Step S1 may be executed in advance, independently of the processing of the other steps.
- the information processing device 100 executes an ROI point cloud extraction process (step S2).
- the information processing device 100 executes a CAD-derived point cloud generation process (step S3).
- Step S3 may be executed in advance, independently of the processing of the other steps.
- the information processing device 100 executes an identification process (step S4).
- the information processing device 100 executes a fine-tuning process (step S7).
- the information processing device 100 determines whether the end condition of the fine-tuning process is satisfied (step S8). If the end condition of the fine-tuning process is not satisfied (NO in step S8), the process from step S2 onwards is repeated.
- step S8 If the termination condition of the fine-tuning process is satisfied (YES in step S8), the information processing device 100 executes the accuracy evaluation process (step S5). Next, the information processing device 100 outputs the accuracy evaluation result (step S6). Then, the process ends.
- Step S1 Rough Calibration Processing
- the rough calibration process determines the correspondence between the camera coordinate systems 12. More specifically, a homogeneous transformation matrix T C T of a camera coordinate system 12C of a reference camera (hereinafter also referred to as a "reference camera 10C”) to a camera coordinate system 12T of another camera (hereinafter also referred to as a “target camera 10T " ) is calculated.
- a homogeneous transformation matrix T C T of a camera coordinate system 12C of a reference camera hereinafter also referred to as a "reference camera 10C”
- target camera 10T another camera
- Any method may be used to calculate the homogeneous transformation matrix T C T.
- a method using a reference marker and a method using a point group will be illustrated as examples.
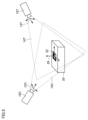
- FIG. 5 is a diagram for explaining an example of rough calibration processing according to the present embodiment.
- an example of rough calibration processing using a reference marker hereinafter, also simply referred to as a "marker”.
- a reference object (hereinafter also simply referred to as "object") 20 exists within the field of view (FOV) 14C of each of the reference camera 10C and the target camera 10T.
- a marker 22 is disposed on the object 20. The marker 22 exists within the field of view 14C of the reference camera 10C and within the field of view 14T of the target camera 10T.
- the marker 22 is, for example, one that can detect the position and orientation in three-dimensional space.
- the marker 22 may be, for example, a two-dimensional marker.
- a surface on which the two-dimensional marker is arranged hereinafter also referred to as the "effective surface" is defined.
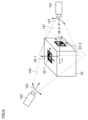
- FIG. 6 is a diagram for explaining another example of the rough calibration process according to the present embodiment.
- FIG. 6 shows a case where multiple cameras 10 cannot measure the same marker 22.
- marker 22-1 is placed on one surface of object 20, and marker 22-2 is placed on another surface of object 20.
- marker 22-1 is within the field of view 14C of reference camera 10C
- marker 22-2 is within the field of view 14T of target camera 10T.
- identification information indicating the marker 22 may be detectable.
- the marker 22 for example, AprilTag developed by The APRIL Robotics Laboratory at the University of Michigan may be used.
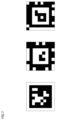
- FIG. 7 is a diagram showing an example of an AprilTag. Three AprilTags are shown as examples in FIG. 7. The position and orientation in three-dimensional space, as well as the identification information, of each AprilTag can be visually measured.
- a homogeneous transformation matrix T is calculated based on the difference in the position and orientation of the marker 22 in each camera coordinate system 12 measured from the images captured by each camera 10.
- the position and orientation of the marker 22 are expressed, for example, by a six-dimensional vector of position coordinates (three dimensions) and orientation angle (three dimensions).
- the rough calibration process involves determining the correspondence (homogeneous transformation matrix T) between the camera coordinate systems 12 based on the difference between the position and orientation of the marker 22 calculated based on an image obtained by capturing an image of the object 20 with the reference camera 10C and the position and orientation of the marker 22 calculated based on an image obtained by capturing an image of the object 20 with the target camera 10T.
- the position and orientation of the marker 22 can also be defined as a marker coordinate system 26 based on the surface (effective surface 24) on which the marker 22 is placed.
- a marker coordinate system 26 based on the surface (effective surface 24) on which the marker 22 is placed.
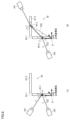
- FIG. 8 is a diagram for explaining the process of calculating the homogeneous transformation matrix in the rough calibration process shown in FIGS. 5 and 6.
- the homogeneous transformation matrix (rotation and translation) from the CAD canonical coordinate system 21, which is set in advance based on CAD information, to the markers 22 placed on each surface of the object 20 is calculated in advance.
- the geometric calculation of the rotation and translation of the markers 22 can be made easier to handle.
- a homogeneous transformation matrix T CAD mrk1 from the CAD canonical coordinate system 21 to the marker coordinate system 26-1 of the marker 22-1 is calculated
- a homogeneous transformation matrix T CAD mrk2 from the CAD canonical coordinate system 21 to the marker coordinate system 26-2 of the marker 22-2 is calculated.
- a homogeneous transformation matrix T C T from the camera coordinate system 12C of the reference camera 10C to the camera coordinate system 12T of the target camera 10T is calculated by T C mrkC ⁇ T mrkC mrkT ⁇ (T T mrkT ) ⁇ 1 .
- the homogeneous transformation matrix T C mrkC corresponds to the position and orientation of the marker 22 calculated based on an image obtained by capturing an image of the object 20 with the reference camera 10C.
- the homogeneous transformation matrix T T mrkT corresponds to the position and orientation of the marker 22 calculated based on an image obtained by capturing an image of the object 20 with the target camera 10T.
- the homogeneous transformation matrix T mrkC mrkT corresponds to the rotation and translation from the marker 22 present in the field of view 14C of the reference camera 10C to the marker 22 present in the field of view 14T of the target camera 10T.
- the homogeneous transformation matrix T C T T C mrk1 ⁇ (T T mrk2 ) ⁇ 1 is calculated.
- the homogeneous transformation matrix T mrkC mrkT is not E (unit matrix) but is determined as follows:
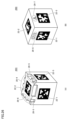
- FIG. 9 is a diagram showing an example of a marker coordinate system 26 for markers 22 arranged on each surface of an object 20. Referring to FIG. 9, when a marker 22 having identification information such as AprilTag is used, the identification information of the marker 22 shown in the captured image is obtained.
- a homogeneous transformation matrix from the CAD canonical coordinate system 21 to the marker 22 is calculated in advance.
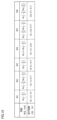
- FIG. 10 is a diagram showing an example of the relationship between rotation and translation between markers based on the CAD canonical coordinate system. Referring to FIG. 10, information indicating the amount of rotation and translation is prepared in advance in association with the identification information (ID: 0 to ID: 5) of the markers 22.
- the rotation amount and translation amount shown in FIG. 10 are values calculated based on the CAD canonical coordinate system 21 of the marker 22 with ID: 0.
- the information shown in FIG. 10 may be stored in the information processing device 100 as a homogeneous transformation matrix table.
- a homogeneous transformation matrix table T CAD mrki corresponding to the identification information of the marker 22 present within the field of view 14C of the reference camera 10C and a homogeneous transformation matrix table T CAD mrki corresponding to the identification information of the marker 22 present within the field of view 14T of the target camera 10T are selected, and a homogeneous transformation matrix T mrkTC mrkT is calculated.
- a homogeneous transformation matrix T C T T C mrkC ⁇ T mrkC mrkT ⁇ (T T mrkT ) ⁇ 1 is calculated.
- an object 20 on which one or more markers 22 are placed is imaged by multiple cameras, and a homogeneous transformation matrix, which is an external parameter of the camera, is calculated.
- the information processing device 100 determines the correspondence between the camera coordinate system 12C of the reference camera 10C and the camera coordinate system 12T of the target camera 10T based on the point clouds (representing a common object 20) extracted from each image. That is, the information processing device 100 estimates a homogeneous transformation matrix T C T of the camera coordinate system 12T from the camera coordinate system 12C of the reference camera 10C to the target camera 10T.
- FPFH Fast Point Feature Histogram
- ICP Iterative Closest Point
- Step S2 ⁇ E. ROI Point Cloud Extraction Process
- a first image obtained by capturing an image of the object 20 on which the markers 22 are placed using the reference camera 10C, and a second image obtained by capturing an image of the object 20 using the target camera 10T are converted into a composite image.
- the two images may be a collection of point clouds.
- an ROI for extracting the point cloud used in the identification process is determined, and the point cloud contained in the ROI (ROI point cloud) is extracted from the composite image.
- two images are obtained by capturing images of the object 20 on which the markers 22 are arranged using the reference camera 10C and the target camera 10T.
- the two images obtained are synthesized on the same coordinate system (camera coordinate system 12C) based on the correspondence (homogeneous transformation matrix T C T ) between the camera coordinate system 12C of the reference camera 10C and the camera coordinate system 12T of the target camera 10T.
- the ROI is determined and the ROI point cloud is extracted for the synthesized image generated by such transformation.
- the ROI point cloud extraction process can be executed using the homogeneous transformation matrix TCT .
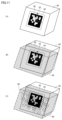
- FIG. 11 is a diagram for explaining an example of the ROI point cloud extraction process according to the present embodiment.
- 11A when the position and orientation in three-dimensional space of the marker 22 of the object 20 is measured, a marker coordinate system 26 is determined based on the surface (effective surface 24) on which the marker 22 is arranged. The origin of the marker coordinate system 26 is set to a predetermined position (e.g., the center position) of the marker 22.
- ROI 50 a predetermined area is determined as ROI 50, with the origin of the determined marker coordinate system 26 as the center.
- ROI 50 may be a hexahedron of any size.
- the size of ROI 50 may be a predetermined fixed value, or may be a variable value that changes according to any condition.
- a point cloud (ROI point cloud 56) contained in the determined ROI 50 is extracted.
- the ROI point cloud 56 may be expressed, for example, in a 2.5-dimensional data format.
- the 2.5-dimensional data format adds depth information (distance information) to two-dimensional image data.
- the ROI point cloud extraction process includes a process of extracting, from the point clouds contained in the composite image, ROI point cloud 56 (corresponding to the second point cloud) contained in ROI 50 (corresponding to the second region) determined based on marker 22.
- ROI 50 may be determined based on the surface (effective surface 24) on which marker 22 of object 20 is located.
- Identification processing is performed based on the extracted ROI point cloud 56.
- an object 20 on which one marker 22 is placed is shown as an example, but if multiple markers 22 are placed on the object 20, an ROI may be determined for each marker 22 (effective surface 24) and an ROI point cloud may be extracted.
- step S3 ⁇ F. CAD-derived point cloud generation process (step S3)> Next, the CAD-derived point cloud generation process (step S3) will be described.
- the information on the object 20 used in the rough calibration process (step S1) and the ROI point cloud extraction process (step S2) is prepared.
- the information on the object 20 may be design information or actual measurement information.
- design information CAD information 30 of the object 20 may be used.
- the design information is not limited to the term "CAD" and may be data in any format.
- actual measurement information information obtained by optically measuring the object 20 may be used.
- the actual measurement information may be information measured by any method and may be data in any format.
- a three-dimensional point cloud 32 indicating the shape of the object 20 is generated.
- a point cloud that exists within a target region 34 that corresponds to the effective surface 24 of the marker 22 is extracted as a CAD-derived point cloud 36.
- the CAD-derived point cloud 36 does not need to include all points of the object 20, but only needs to include at least the point cloud in the vicinity of the effective surface 24 of the marker 22.
- the three-dimensional point cloud 32 is represented, for example, in a three-dimensional data format.
- the point cloud present in the target region 34 may be converted from the three-dimensional data format to a 2.5-dimensional data format.
- the ROI point cloud 56 and the CAD-derived point cloud 36 can be associated with each other in the 2.5-dimensional data format.
- the CAD-derived point cloud generation process includes a process of extracting, from a point cloud generated based on information about the object 20 (e.g., CAD information 30), a CAD-derived point cloud 36 (corresponding to a first point cloud) included in a target region 34 (corresponding to a first region) determined based on the marker 22.
- the CAD-derived point cloud 36 may be determined based on a surface (effective surface 24) on which the marker 22 of the object 20 is located.
- an object 20 on which one marker 22 is placed is shown as an example, but if multiple markers 22 are placed on the object 20, a CAD-derived point cloud 36 may be generated for each marker 22 (effective surface 24).
- Step S4 Next, the identification process (step S4) will be described.
- the correspondence between the ROI point cloud 56 and the CAD-derived point cloud 36 is determined.
- the shape dimensions of the key point pairs of the CAD-derived point cloud and the shape dimensions of the key point pairs of the ROI point cloud are calculated.
- a key point in the CAD-derived point cloud 36 is selected.
- a search is made for a key point in the ROI point cloud 56 that corresponds to the selected key point in the CAD-derived point cloud 36.
- the key points in the CAD-derived point cloud 36 are determined in units of "key point pairs," which are pairs of two key points.
- key point pairs are calculated.
- the key point pairs are the targets for calculating the shape and dimensions.
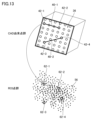
- FIG. 13 is a diagram for explaining an example of key point search in the identification process according to this embodiment.
- key point pair 40-1, 40-2 (hereinafter sometimes collectively referred to as "key point pair 40") are selected in the CAD-derived point cloud 36.
- the key point pair 40 (and key point 42) may be selected based on the geometric characteristics of the object 20 on which the marker 22 is placed.
- the key point pair 40 (and the key point 42) may be automatically selected according to one or more coordinates preset for the CAD information.
- the key point pair 40 (and the key point 42) may be selected according to a user instruction for the CAD-derived point cloud 36.
- the information processing device 100 may provide a user interface screen for the user to select the key point pair 40 (and the key point 42).
- key point pair 40-1 is a pair of key points 42-1 and 42-2.
- Key point pair 40-2 is a pair of key points 42-3 and 42-4.
- key points 42-1 to 42-4 may be collectively referred to as "key points 42.”
- Key points 62-1 to 62-4 (hereinafter sometimes collectively referred to as "key points 62") in the ROI point cloud 56 that correspond to key points 42-1 to 42-4 in the CAD-derived point cloud 36 are searched for. That is, the identification process includes a process of searching for a set of key points 62 (corresponding to a second point pair) in the ROI point cloud 56 that corresponds to a key point pair 40 (corresponding to a first point pair) selected from the CAD-derived point cloud 36 (first point cloud).
- FIG. 14 is a diagram for explaining a method for searching for key points using the minimum distance method.
- coordinates corresponding to key points 42 in CAD-derived point cloud 36 are given to ROI point cloud 56.
- the distance from the coordinates corresponding to key point 42 in CAD-derived point cloud 36 to each point is calculated.
- the point with the smallest distance from the coordinates corresponding to key point 42 in CAD-derived point cloud 36 is estimated as key point 62.
- centroid method which is another example of the key point searching method, will be described.
- FIG. 15 is a diagram for explaining a method for searching for key points using the centroid method.
- coordinates corresponding to key points 42 in CAD-derived point cloud 36 are assigned to ROI point cloud 56.
- a number of points existing within a predetermined radius R are determined from the coordinates corresponding to key points 42 in CAD-derived point cloud 36.
- the centroid of the multiple points existing within radius R is estimated as key point 62.
- the centroid method involves determining coordinates in the ROI point cloud 56 (second point cloud) that correspond to each point of the key point pair 40 (first point pair) in the CAD-derived point cloud 36, and determining the key point 62 of the key point pair 60 (second point pair) based on the centroid of one or more points that exist within a predetermined distance from the determined coordinates.
- FIG. 16 is a diagram for explaining a method for searching for key points using the average center of gravity method.
- multiple points that exist within a predetermined radius R are selected from the coordinates that correspond to the key point 42 in the CAD-derived point cloud 36.
- the center of gravity 64 of the multiple points that exist within the radius R is calculated.
- the center of gravity 64 can be calculated for each ROI point cloud 56. For example, multiple centers of gravity 64-1 to 64-6 are calculated, and the average of the multiple centers of gravity 64-1 to 64-6 is estimated as the key point 62.
- FIG. 17 is a diagram for explaining a method of searching for key points using the average center of gravity method and M-estimation.
- the center of gravity 64 can be calculated for each ROI point cloud 56, as with the average center of gravity method described above. Once the multiple centers of gravity 64 have been calculated, the average of the calculated centers of gravity 64 is calculated. Based on the calculated average, the deviation and standard deviation ⁇ of each of the multiple centers of gravity 64 are calculated.
- centroids 64 those with a deviation exceeding the standard deviation ⁇ are determined to be outliers, and the other centroids 64 are determined to be inliers. In the example shown in FIG. 17, three centroids 64-1, 64-3, and 64-4 are determined to be inliers.
- One of the centroids 64 determined as the appropriate value is estimated as the key point 62.
- the average of the centroids 64 determined as the appropriate value is estimated as the key point 62.
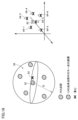
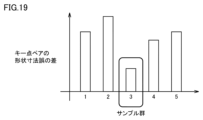
- FIGS. 18 and 19 are diagrams for explaining a method for searching for key points using the average centroid method and the RANSAC method.
- a number of centroids 64 are calculated from a number of samples of the ROI point cloud 56.
- the multiple centroids 64 are classified into outliers and inliers.
- centroids 64-5, 64-3, and 64-2 are determined to be proper values, and the remaining three centroids 64-4, 64-1, and 64-4 are determined to be outliers.
- the average of the centroids determined to be proper values and the average of the centroids determined to be outliers are each determined as RANSAC key points.
- the difference between the proper RANSAC key points and the outlier RANSAC key points is calculated as the error for key points 42 in CAD-derived point group 36.
- centroids 64-1, 64-5, and 64-6 are determined to be correct values, and the remaining three centroids 64-3, 64-2, and 64-4 are determined to be outliers.
- the difference between the correct RANSAC key points and the outlier RANSAC key points is calculated as the error for key point 42 in CAD-derived point group 36.
- the error for a number of sample groups with respect to key point 42 in CAD-derived point cloud 36 is calculated, and the sample group with the smallest error is determined as the optimal sample group.
- the average of the centroids of the optimal sample groups is estimated as key point 62.
- the key point search method is not limited to the above-mentioned method, and any method can be used. However, since the key point search method is an important factor that affects the accuracy evaluation process described later, multiple key point search methods may be evaluated and then one or more appropriate key point search methods may be determined.
- the key point search method is used to search for key points 62 in the ROI point cloud 56 that correspond to key points 42 in the CAD-derived point cloud 36, and the shape dimensions are calculated.
- FIG. 20 is a diagram for explaining an example of the shape and dimension calculation in the identification process according to this embodiment.
- key points 62-1 to 62-4 in the ROI point cloud 56 that correspond to key points 42-1 to 42-4 in the CAD-derived point cloud 36, respectively, are searched for.
- a key point pair 60-1 is determined that corresponds to the key point pair 40-1, 40-2 in the CAD-derived point cloud 36
- a key point pair 60-2 is determined that corresponds to the key point pair 40-3, 40-4 in the CAD-derived point cloud 36.
- the geometric dimensions of each of the key point pairs 40-1, 40-2 in the CAD-derived point cloud 36 are calculated.
- the geometric dimensions of each of the key point pairs 60-1, 60-2 (hereinafter sometimes collectively referred to as "key point pairs 60") in the ROI point cloud 56 are calculated.
- the geometric dimensions may be, for example, the length of the key point pair (one-dimensional: scalar quantity), or the length and angle of the key point pair (vector quantity).
- the length and direction of the geometric dimensions may be expressed using a component indicating the length and a rotational component indicating the angle.
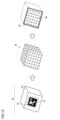
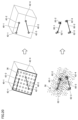
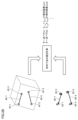
- 21 to 23 are diagrams showing an example of information processing according to the present embodiment. After the rough calibration process, a homogeneous transformation matrix T C T from the camera coordinate system 12C of the reference camera 10C to the camera coordinate system 12T of the target camera 10T is calculated.
- the marker coordinate system 26 in the camera coordinate system 12C of the target camera 10T is coordinate-transformed into the marker coordinate system 26 in the camera coordinate system 12C of the reference camera 10C using a homogeneous transformation matrix T C T.
- This coordinate transformation causes the point cloud obtained by imaging with the reference camera 10C and the point cloud obtained by imaging with the target camera 10T to be synthesized on the same coordinate system. That is, the point clouds are aggregated after matching the references through coordinate transformation using the homogeneous transformation matrix T C T.
- an ROI is determined based on the effective surface 24, and a point cloud included in the ROI (ROI point cloud 56) is extracted.
- a point cloud of the surface layer in the vicinity of the effective surface 24 is extracted.
- the ROI point cloud 56 is transformed into the CAD canonical coordinate system 21. This transformation of coordinates results in a consistent standard for calculating the shape dimensions in the identification process.
- key points 42 and key point pairs 40 are selected based on CAD information of the object 20 on which the markers 22 are placed.
- the key points 42 may be selected based on the geometric characteristics of the object 20.
- the key point search method searches for key point 62 in ROI point cloud 56 that corresponds to key point 42 in CAD-derived point cloud 36.
- the object 20 has an active surface 24 on which the markers 22 are placed, and may have geometric features for selecting the key points 42. Some examples of shapes that can be used as reference objects are given below.
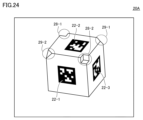
- FIG. 24 is a schematic diagram showing an example of the configuration of a reference object 20A used in the information processing system 1 according to this embodiment.
- the reference object 20A is based on a cube.
- Markers 22 are placed on each face of the reference object 20A (six faces in total). In FIG. 24, only markers 22-1 to 22-3 are depicted positioned on three faces, but markers 22 are also placed on each of the remaining faces not shown.
- the reference object 20A has portions cut out that correspond to the four vertices of a cube. More specifically, cube-shaped cutouts 28-1, 28-2 are provided at a pair of opposing vertices on the top surface of the reference object 20A. In addition, chamfered portions 29-1, 29-2 are provided at another pair of opposing vertices on the top surface of the reference object 20A.
- the notches 28-1, 28-2 and the chamfers 29-1, 29-2 are geometric features of the reference object 20A and can serve as criteria for selecting the key points 42 and key point pairs 40.
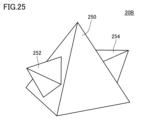
- FIG. 25 is a schematic diagram showing an example of the configuration of a reference object 20B used in the information processing system 1 according to this embodiment.
- the reference object 20B includes a main pyramid 250 and pyramids 252 and 254 whose bases coincide with one face of the pyramid 250. Markers may be placed on the faces of the pyramid 250 where the pyramids 252 and 254 are not present.
- the vertices of pyramid 250 and pyramids 252 and 254 are geometric features of reference object 20B and can serve as criteria for selecting key points 42 and key point pairs 40.
- FIG. 26 is a schematic diagram showing an example configuration of reference objects 20C and 20D used in the information processing system 1 according to this embodiment.
- reference object 20C is based on a cube. Markers 22-1 to 22-3 are placed on each of the three faces of reference object 20C.
- the reference object 20C has portions of its top surface that correspond to each side cut out. More specifically, the portions of the top surface of the reference object 20C that correspond to each side have cutouts 28-3 to 28-6.
- Each of the cutouts 28-3 to 28-6 is formed so that the cutout section and length are different from each other.
- the cutouts 28-3 to 28-6 have shapes that are distinguishable from each other.
- the notches 28-3 to 28-6 are geometric features of the reference object 20C and can serve as criteria for selecting the key points 42 and key point pairs 40.
- reference object 20D is based on a cube. Markers 22-1 to 22-3 are placed on each of the three faces of reference object 20D.
- the reference object 20D has portions of two faces cut out. More specifically, the two side faces of the reference object 20D each have a cutout 28-7, 28-8.
- cutout 28-7 is rectangular, and the cross section of cutout 28-8 is triangular. Cutouts 28-7 and 28-8 may have a shape in which the cross-sectional area decreases toward the inside of reference object 20D. In this way, the cross-sectional shapes of cutouts 28-7 and 28-8 are different, making them distinguishable from each other.
- the notches 28-7 and 28-8 are geometric features of the reference object 20D and can serve as criteria for selecting the key points 42 and key point pairs 40.
- FIG. 27 is a schematic diagram showing an example of the configuration of a reference object 20E used in an information processing system 1 according to this embodiment.
- the reference object 20E includes a main pillar 260 and five planar plates 261 to 265 on which markers 22 can be placed.
- Planar plate 262 is supported by main pillar 260.
- Planar plates 261, 263, 264, and 265 are supported by support members 271, 273, 274, and 275 connected to main pillar 260.
- the arrangement of the planar plates 261-265 is a geometric feature of the reference object 20E and can be a criterion for selecting the key points 42 and key point pairs 40.
- the reference object (object 20) may be a cube or a rectangular parallelepiped without any cutouts or the like.
- the reference object (object 20) is not limited to the shapes described above and may be any shape.
- the key points 42 and key point pairs 40 may be selected based on geometric features of a reference object.
- a reference object having geometric features may be employed to set the key points 42 and key point pairs 40.
- step S5 Next, the accuracy evaluation process (step S5) will be described.
- the accuracy evaluation process includes a process of evaluating the accuracy of the homogeneous transformation matrix T (correspondence between camera coordinate systems 12) based on the shape dimensions of the key point pair 40 (first point pair) in the CAD-derived point cloud 36 and the key point pair 60 (second point pair) in the ROI point cloud 56.
- the calculated accuracy includes, for example, at least one of the absolute error and the repeatability error.
- Fig. 28 is a diagram for explaining an example of absolute error evaluation in the accuracy evaluation process according to the present embodiment. With reference to Fig. 28, for each key point pair, the difference between the geometric dimensions of key point pair 40 in CAD-derived point cloud 36 and key point pair 60 in ROI point cloud 56 is calculated. The calculated difference is the absolute error.
- the absolute error in the target information processing system 1 is calculated by statistically processing the absolute error calculated for each of the multiple key point pairs. Also, the absolute error in the target information processing system 1 is calculated by statistically processing the shape error of each key point pair calculated from multiple samples.
- the absolute error is calculated as the accuracy based on the difference between the geometric dimensions of the key point pairs 40 in the CAD-derived point cloud 36 and the geometric dimensions of the key point pairs 60 in the ROI point cloud 56.
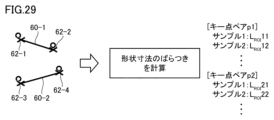
- Fig. 29 is a diagram for explaining an example of the repetitive error evaluation of the accuracy evaluation process according to the present embodiment.
- the variation in the shape and dimensions of key point pairs 60 in ROI point cloud 56 is calculated for each key point pair.
- the calculated variation (e.g., standard deviation) becomes the repetitive error.
- the standard deviation of the shape dimensions of the same key point pair is calculated as the repeat error.
- the accuracy evaluation process includes a process of calculating the variation in the geometric dimension error by repeatedly calculating the geometric dimension error of the key point pair 60 (second point pair) in the ROI point cloud 56.
- the shape dimensions of the key point pair 40 in the CAD-derived point cloud 36 and the shape dimensions of the key point pair 60 in the ROI point cloud 56 are obtained, so that any accuracy evaluation process can be performed using at least one of the two types of shape dimensions.
- Step S6 Next, the output of the accuracy evaluation result (step S6) will be described.
- FIG. 30 is a schematic diagram showing an example of the output of the accuracy evaluation result according to the present embodiment.
- the output screen 200 of the accuracy evaluation result includes information 210 indicating the error in the length of the shape dimension, and information 220 indicating the error in the angle of the shape dimension.
- Information 210 includes statistical information 212 and a histogram 214 for length errors.
- the histogram 214 indicates the number (frequency) of key point pairs for each magnitude of length error.
- Information 220 includes statistical information 222 and a histogram 224 for angle errors.
- the histogram 224 indicates the number (frequency) of key point pairs for each magnitude of angle error.
- the information processing device 100 may output a histogram 214 of length errors and a histogram 224 of angle errors.
- Step S7 Next, the fine-tuning process (step S7) will be described. If the calculated accuracy (absolute error and repeat error) does not satisfy a predetermined condition, a process including the fine-tuning process may be executed.
- the fine-tuning process is a process of optimizing the homogeneous transformation matrix T so as to minimize the error in the shape dimensions calculated by the identification process.
- the fine-tuning process includes a process of optimizing the homogeneous transformation matrix T (the correspondence between the camera coordinate systems 12) so as to reduce the difference in the shape dimensions between the key point pair 40 (first point pair) in the CAD-derived point cloud 36 and the key point pair 60 (second point pair) in the ROI point cloud 56.
- the optimization of the homogeneous transformation matrix T can be reduced to a nonlinear programming problem for minimizing (or maximizing) an evaluation function using the shape dimensions.
- the evaluation function includes the sum of squares of the absolute errors between the geometric dimensions of the key point pairs 40 in the CAD-derived point cloud 36 and the geometric dimensions of the key point pairs 60 in the ROI point cloud 56 for all key point pairs.
- minimizing the evaluation function means minimizing the sum of squares of the absolute errors between the geometric dimensions of the key point pairs 40 in the CAD-derived point cloud 36 and the geometric dimensions of the key point pairs 60 in the ROI point cloud 56.
- the above evaluation function may include a penalty term such as:
- FIG. 31 is a diagram illustrating an example of a penalty term in the fine-tuning process according to this embodiment.
- the radius R may be increased stepwise until a predetermined number of points are found.
- the increase in the search radius from the reference radius R to radius R' may be reflected in the penalty term.
- the penalty term may be a value obtained by multiplying
- an evaluation function may be adopted that uses the L2 regularization term as a penalty term in addition to the length error and angle error of the shape dimensions.
- the following evaluation function may be used.
- the evaluation function used in the fine-tuning process can be any function that uses the calculation results of the shape dimensions of the key point pairs obtained in the identification process.
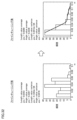
- Fig. 32 is a diagram showing an example of change in length error due to fine-tuning processing according to the present embodiment.
- the histogram before the fine-tuning processing shows a multi-peak distribution
- the histogram shows an exponential distribution.
- the more the distribution is biased to the left the better the accuracy. In this way, it can be seen that the fine-tuning processing brings the error distribution closer to an ideal one.
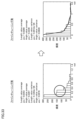
- FIG. 33 shows an example of how the angle error changes due to fine-tuning processing according to this embodiment.
- the histogram before the fine-tuning processing deviated from the exponential distribution
- the histogram shows an exponential distribution.
- the parameter ⁇ becomes larger after the fine-tuning processing.
- the histogram shows a sharper exponential distribution.
- the fine-tuning process can reduce errors in the shape dimensions.
- Examples of algorithms for comparing the distribution shapes of histograms include a method using a histogram intersection kernel and a method using histogram Euclidean distance.
- a facility maintenance technician can generate and save a histogram of the error before starting operation, and then regenerate the histogram of the error during daily inspections and compare it with the saved histogram.
- the facility maintenance technician can determine whether the accuracy has decreased based on changes in the distribution shape of the histogram.
- a facility maintainer Before starting operation, a facility maintainer generates a histogram of the error, approximates the generated histogram with an exponential distribution, and saves the determined parameter ⁇ . During routine inspections, the facility maintainer regenerates the histogram of the error, approximates the generated histogram with an exponential distribution, and calculates the parameter ⁇ . The facility maintainer can manage the trend of the accuracy based on changes in the value of the parameter ⁇ .
- a margin I ⁇ margin calculated according to the following formula may be used for trend management of accuracy.
- ⁇ Exp_crite indicates a reference value of the parameter ⁇
- ⁇ Exp_curr indicates a value of the parameter ⁇ calculated from the histogram to be evaluated.
- the margin I ⁇ margin 0, when it is improving the margin I ⁇ margin > 0, when it is worsening the margin I ⁇ margin ⁇ 0.
- the absolute value of the margin I ⁇ margin indicates the degree of the trend (improvement or deterioration).
- the parameter ⁇ calculated from a histogram of such errors, can also be used to trend-manage accuracy.
- the thickness of the point cloud (point cloud thickness) may be used as a method for checking the accuracy in detail.
- FIG. 34 is a diagram for explaining accuracy check using point cloud thickness in the information processing method according to this embodiment.
- a composite point cloud 270 is generated by combining the point cloud extracted from the image captured by the reference camera 10C and the point cloud extracted from the image captured by the target camera 10T.
- the point cloud thickness is calculated from each of the regions 282 corresponding to the composite seams and the regions 284 corresponding to areas other than the composite seams.
- the point cloud thickness indicates the degree of variation in the point cloud within a region. In other words, the smaller the calculated point cloud thickness, the higher the accuracy.
- the point cloud thickness of region 284 corresponding to the non-composite seams depends on the accuracy of the camera 10 (sensor) itself. Ideally, it is preferable that the point cloud thickness of region 282 corresponding to the composite seams is the same as the point cloud thickness of region 284 corresponding to the non-composite seams. In other words, it is possible to quantitatively evaluate how appropriately the rough calibration process or fine tuning process was performed based on how close the point cloud thickness of region 282 is to the point cloud thickness of region 284.
- a reference plane Q is estimated from the point cloud included in the specified region.
- the reference plane Q is determined based on the coordinates of the point cloud included in the specified region, for example, by the least squares method.
- the Euclidean distance L(i) between a point P(i) included in the point cloud and the reference plane Q is calculated.
- the variance of the Euclidean distance L(i) is determined as the point cloud thickness.
- the synthesis accuracy is calculated by comparing the point cloud thickness between the area 282 corresponding to the synthesis seam and the area 284 corresponding to the non-synthetic seam.
- the identification process is based on a point cloud extracted from the vicinity of the effective surface 24 of the marker 22. Therefore, the calculated accuracy is for the vicinity of the effective surface 24. If the object 20 on which the marker 22 is arranged is placed at multiple positions in the space SP and the accuracy at each position is calculated, the spatial distribution of accuracy in the space SP can be obtained.
- the uniformity (flatness) of precision in the space SP can be evaluated.
- the spatial distribution of precision in the space SP can be visualized.
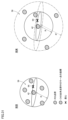
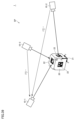
- FIG. 35 is a diagram for explaining a method for calculating the spatial distribution of precision according to this embodiment. Referring to FIG. 35, a reference camera 10C and a target camera 10T are placed in a space SP.
- the object 20 on which the marker 22 is placed is successively placed at different measurement positions Pos1, Pos2, Pos3, .... At each measurement position, the accuracy is calculated by the process described above.
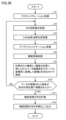
- FIG. 36 is a flowchart showing an example of the processing procedure of the method for calculating the spatial distribution of precision according to the present embodiment. Each step shown in FIG. 36 may be realized by the processor 102 of the information processing device 100 executing the information processing program 124.
- the information processing device 100 executes a rough calibration process (step S1). At this time, the object 20 on which the marker 22 is placed is placed at an arbitrary measurement position. Step S3 may be executed in advance, independently of the processing of the other steps.
- the information processing device 100 executes an ROI point cloud extraction process (step S2).
- the information processing device 100 executes a CAD-derived point cloud generation process (step S3).
- Step S3 may be executed in advance, independent of the processing of the other steps. Also, step S3 may be executed only the first time during the loop processing including step S10.
- the information processing device 100 executes an identification process (step S4). Then, the information processing device 100 executes an accuracy evaluation process (step S5). The information processing device 100 stores the calculated accuracy in association with the coordinates obtained by converting the marker coordinate system 26 used in the accuracy calculation into the global coordinate system (step S9).
- the information processing device 100 determines whether the object 20 on which the marker 22 is placed has been moved to another measurement position (step S10).
- the user may give an instruction to the information processing device 100, which may cause the information processing device 100 to determine whether the object 20 has been moved to another measurement position.
- step S10 If the object 20 on which the marker 22 is placed has been moved to another measurement position (YES in step S10), the processing from step S2 onwards is repeated.
- the information processing device 100 calculates the accuracy spatial distribution based on a pair of the calculated accuracy and the coordinates obtained by converting the marker coordinate system 26 used to calculate the accuracy into the global coordinate system (step S11).
- the information processing device 100 may use a known interpolation method to calculate the accuracy of each measurement position within the space SP from the stored information.
- the information processing device 100 visualizes and outputs the precision spatial distribution in the calculated space SP (step S12). Then, the processing ends.
- the process of calculating the spatial distribution of precision includes a process of calculating the precision of the correspondence (homogeneous transformation matrix T) between the camera coordinate systems 12 based on the shape and dimensions of the key point pair 40 (first point pair) of the CAD-derived point cloud 36 and the key point pair 60 (second point pair) of the ROI point cloud 56, and a process of visualizing the precision of the correspondence (homogeneous transformation matrix T) between the camera coordinate systems 12 calculated for each measurement position when the object 20 is placed at multiple measurement positions in space, in relation to each measurement position.
- FIG. 37 is a diagram showing an example of visualization of the spatial accuracy distribution obtained by the method for calculating the spatial accuracy distribution according to this embodiment.
- the accuracy of each measurement position is expressed by shading or color.
- an image may be output in which the accuracy value of the correspondence relationship (homogeneous transformation matrix T) between the camera coordinate systems 12 is expressed by at least one of shading and color.
- the visualized spatial distribution of accuracy can help the user recognize areas in the space SP where error variation and error bias exist. Areas where error variation and error bias exist provide useful information for optimizing the installation location of a robot, for example. Furthermore, information on the presence or absence of areas where error variation and error bias exist provides useful information for determining whether or not there is a need to add a camera.
- FIG. 38 is a schematic diagram showing an example of the functional configuration of an information processing system 1 according to this embodiment. Each component shown in FIG. 38 may be realized by the processor 102 of the information processing device 100 executing the information processing program 124.
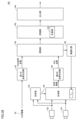
- the information processing device 100 includes, as components, a synthesis unit 150, a determination unit 152, a first point cloud generation unit 154, a second point cloud generation unit 156, a search unit 158, an evaluation unit 160, an output unit 164, and an optimization unit 166.
- the synthesis unit 150 converts two images captured by the reference camera 10C and the target camera 10T into a synthetic image using a homogeneous transformation matrix T C T.
- the synthesis unit 150 executes a process of generating a synthetic image of the ROI point cloud extraction process (step S3).
- the determination unit 152 determines the homogeneous transformation matrix T C T based on the difference between the position and orientation of the marker 22 calculated based on an image obtained by capturing an image of the object 20 with the reference camera 10C and the position and orientation of the marker 22 calculated based on an image obtained by capturing an image of the object 20 with the target camera 10T .
- the determination unit 152 executes a rough calibration process (step S1).
- the first point cloud generator 154 extracts the CAD-derived point cloud 36 from the point cloud generated based on the information of the object 20 (CAD information 30).
- the first point cloud generator 154 executes the CAD-derived point cloud generation process (step S3).
- the second point cloud generation unit 156 extracts, from the point clouds contained in the composite image, an ROI point cloud 56 contained in the ROI 50 determined based on the marker 22.
- the second point cloud generation unit 156 executes the process of determining the ROI and the process of extracting the ROI point cloud in the ROI point cloud extraction process (step S3).
- the search unit 158 searches for key points in the ROI point cloud 56 that correspond to the key points in the selected CAD-derived point cloud 36.
- the search unit 158 calculates the shape and dimensions of the searched key point pairs.
- the search unit 158 calculates the shape and dimensions of the key point pairs in the CAD-derived point cloud and the ROI point cloud.
- the search unit 158 executes the identification process (step S4).
- the evaluation unit 160 calculates the accuracy based on the shape dimensions of the key point pairs calculated by the search unit 158.
- the evaluation unit 160 may include a calculation unit 162 for calculating the accuracy.
- the evaluation unit 160 executes an accuracy evaluation process (step S5).
- the output unit 164 outputs the calculation results obtained by the evaluation unit 160.
- the output unit 164 executes a process (step S6) for outputting the accuracy evaluation results.
- the output unit 164 may generate and output the accuracy spatial distribution.
- the output unit 164 performs the following steps: matching accuracy with coordinates (step S9), calculating the accuracy spatial distribution (step S11), and visualizing the accuracy spatial distribution (step S12).
- the optimization unit 166 optimizes the homogeneous transformation matrix T C T so as to reduce the difference in shape and dimensions between the key point pairs 40 of the CAD-derived point cloud 36 and the key point pairs 60 of the ROI point cloud 56.
- the optimization unit 166 executes a fine-tuning process (step S7).
- FIG. 39 is a diagram for explaining a method for setting an arbitrary world coordinate system in an information processing system according to this embodiment. Referring to FIG. 39, cameras 10-1, 10-2, and 10-3 are placed in a space SP.
- a homogeneous transformation matrix T 1 2 from (the camera coordinate system of) the camera 10-1 to (the camera coordinate system of) the camera 10-2 is determined by the rough calibration process or the fine tuning process.
- a homogeneous transformation matrix T 1 3 from (the camera coordinate system of) the camera 10-1 to (the camera coordinate system of) the camera 10-3 is determined.
- the reference object 20 is positioned so that it is included in at least a portion of the field of view of each of the cameras 10-1 to 10-3.
- the reference object 20 is positioned at a position where the user wishes to set a world coordinate system.
- the reference object 20 has a CAD canonical coordinate system 21 that is set in advance based on CAD information.
- the CAD canonical coordinate system 21 of the reference object 20 is used as the world coordinate system.
- the reference object 20 is captured by the cameras 10-1 to 10-3, and the position and orientation of the CAD canonical coordinate system 21 in the camera coordinate system of each camera 10 is calculated based on the image.
- the position and orientation of the CAD canonical coordinate system 21 are determined based on the surface (effective surface) on which the marker 22 of the reference object 20 is located.
- the position and orientation of the CAD canonical coordinate system 21 calculated based on the image captured by the reference camera 10-1 may be set as the world coordinate system as is.
- the world coordinate system may be determined using a homogeneous transformation matrix. More specifically, the position and orientation of the CAD canonical coordinate system 21 calculated based on the image captured by the camera 10-2 or 10-3 are transformed into the position and orientation of the camera coordinate system of the camera 10-1 using a homogeneous transformation matrix. In this way, the world coordinate system may be determined via the camera coordinate system of the reference camera.
- the camera coordinate system of the reference camera can be used as the world coordinate system.
- the marker 22 is not limited to AprilTag, and any AR (Augmented Reality) marker can be used.
- the AR marker is generated using, for example, "ARToolKit," which is an example of an AR development library.
- the marker 22 may be any QR code (registered trademark).
- the markers 22 used in the above-described rough calibration process may be different from the markers 22 used in other processes. That is, in the rough calibration process, any method may be adopted as long as it is possible to determine a homogeneous transformation matrix T C T from the camera coordinate system 12C of the reference camera 10C to the camera coordinate system 12T of the target camera 10T. Therefore, the homogeneous transformation matrix T C T may be determined using any machine-learned model.
- the information processing device 100 executes the main processing
- multiple information processing devices 100 may work together to execute processing.
- some or all of the processing may be executed using computing resources on the cloud.
- a synthesis unit (S2; 150) that synthesizes a first image obtained by imaging a reference object (20) on which a reference marker (22) is arranged with a first camera (10C) and a second image obtained by imaging the reference object with a second camera (10T) on the same coordinate system based on a correspondence relationship between a first camera coordinate system of the first camera and a second camera coordinate system of the second camera to generate a synthetic image; a first point cloud generating unit (S3; 154) for extracting a first point cloud (36) included in a first region (34) determined based on the reference marker, from the point cloud generated based on the information (30) of the reference object; a second point cloud generation unit (S2; 156) for extracting a second point cloud (56) included in a second region (50) determined based on the reference marker from the point cloud included in the composite image; a search unit (S4; 158) for searching for a second point pair (60) in the second point group that corresponds to a first point pair (
- the information processing device further comprising a determination unit (S1; 152) that determines the correspondence relationship based on a difference between a position and orientation of the reference marker calculated based on an image obtained by capturing an image of the reference object with the first camera, and a position and orientation of the reference marker calculated based on an image obtained by capturing an image of the reference object with the second camera.
- a determination unit S1; 152 that determines the correspondence relationship based on a difference between a position and orientation of the reference marker calculated based on an image obtained by capturing an image of the reference object with the first camera, and a position and orientation of the reference marker calculated based on an image obtained by capturing an image of the reference object with the second camera.
- the geometry includes a length and an angle. 6.
- the information processing device according to any one of configurations 1 to 5, wherein the evaluation unit outputs a histogram (214) of length errors and a histogram (224) of angle errors.
- [Configuration 9] generating a composite image (S2) by combining a first image obtained by capturing an image of a reference object (20) on which a reference marker (22) is placed with a first camera (10C) and a second image obtained by capturing an image of the reference object with a second camera (10T) on the same coordinate system based on a correspondence between a first camera coordinate system of the first camera and a second camera coordinate system of the second camera; Extracting (S3) a first point cloud (36) included in a first region (34) determined based on the reference marker from the point cloud generated based on the information (30) of the reference object; Extracting (S2) a second point group (56) included in a second region (50) determined based on the reference marker from the point group included in the composite image; For a first pair of points (40) selected from the first set of points, searching (S4) for a second pair of points (60) in the second set of points that corresponds to the first pair of points; and evaluating (S6) accuracy of the correspondence based on geometric dimensions
- a computer (100) generating a composite image (S2) by combining a first image obtained by capturing an image of a reference object (20) on which a reference marker (22) is placed with a first camera (10C) and a second image obtained by capturing an image of the reference object with a second camera (10T) on the same coordinate system based on a correspondence between a first camera coordinate system of the first camera and a second camera coordinate system of the second camera; Extracting (S3) a first point cloud included in a first region (34) determined based on the reference marker from the point cloud generated based on the information (30) of the reference object; Extracting (S2) a second point group (56) included in a second region (50) determined based on the reference marker from the point group included in the composite image; For a first pair of points selected from the first set of points, searching (S4) for a second pair of points (60) in the second set of points that corresponds to the first pair of points; and evaluating (S6) the accuracy of the correspondence based on the geometric
- ⁇ S. Advantages> According to the information processing system 1 of the present embodiment, by performing registration using a reference object whose shape, etc. is defined in advance, it is possible to evaluate the accuracy of the homogeneous transformation matrix, which is the result of registration. Since the evaluated accuracy is based on the absolute error, it is possible to ensure the safety of the robot design.
- a spatial accuracy distribution can be generated by placing reference objects at multiple measurement positions in the target space and calculating the accuracy.
- the spatial accuracy distribution it is possible to efficiently optimize the camera position and consider whether or not to add additional cameras.
Landscapes
- Engineering & Computer Science (AREA)
- Physics & Mathematics (AREA)
- General Physics & Mathematics (AREA)
- Computer Vision & Pattern Recognition (AREA)
- Theoretical Computer Science (AREA)
- Length Measuring Devices By Optical Means (AREA)
Abstract
レジストレーションの精度を評価するための新たな方法を提供する。 情報処理装置は、リファレンス物体の情報に基づいて生成された点群のうち、リファレンスマーカを基準として決定される第1の領域に含まれる第1の点群を抽出する第1の点群生成部と、合成画像に含まれる点群のうち、リファレンスマーカを基準として決定される第2の領域に含まれる第2の点群を抽出する第2の点群生成部と、第1の点群のうちから選択される第1の点ペアについて、第2の点群において第1の点ペアに対応する第2の点ペアを探索する探索部と、第1の点ペアおよび第2の点ペアの形状寸法に基づいて、対応関係の精度を評価する評価部とを含む。
Description
本発明は、複数のカメラについてのレジストレーションに関する。
例えば、自立ロボットを実現するためには、空間の認識が必要である。空間の認識には、例えば、複数のカメラで撮像される複数の画像を用いる方法が採用されてもよい。複数のカメラを用いる場合には、当該複数のカメラ間の位置合わせ(レジストレーションあるいはカメラレジストレーション)が必要となる。レジストレーションにより、カメラの外部パラメータ(同次変換行列)が決定される。
例えば、特開2022-039906号公報(特許文献1)は、カメラの内部パラメータキャリブレーションと、レーザーレーダ-カメラの外部パラメータキャリブレーションとを含むマルチセンサによる複合キャリブレーション方法などを開示する。
上述の先行技術文献においては、キャリブレーションの精度が向上されていると開示されているが、キャリブレーションの精度自体を評価する方法については開示されていない。
本発明は、レジストレーションの精度を評価するための新たな方法を提供することを一つの目的とする。
本発明の一例に従う情報処理装置は、リファレンスマーカが配置されたリファレンス物体を第1のカメラで撮像して得られる第1の画像とリファレンス物体を第2のカメラで撮像して得られる第2の画像とを、第1のカメラの第1のカメラ座標系と第2のカメラの第2のカメラ座標系との対応関係に基づいて、同一の座標系上に合成して合成画像を生成する合成部と、リファレンス物体の情報に基づいて生成された点群のうち、リファレンスマーカを基準として決定される第1の領域に含まれる第1の点群を抽出する第1の点群生成部と、合成画像に含まれる点群のうち、リファレンスマーカを基準として決定される第2の領域に含まれる第2の点群を抽出する第2の点群生成部と、第1の点群のうちから選択される第1の点ペアについて、第2の点群において第1の点ペアに対応する第2の点ペアを探索する探索部と、第1の点ペアおよび第2の点ペアの形状寸法に基づいて、対応関係の精度を評価する評価部とを含む。
この構成によれば、リファレンスマーカが配置されたリファレンス物体に基づいて、第1の点群のうちから選択される第1の点ペアと、第2の点群において第1の点ペアに対応する第2の点ペアとを取得することで、第1の点ペアおよび第2の点ペアの形状寸法に基づいて、対応関係の精度を評価できる。第1の点ペアおよび第2の点ペアの形状寸法に基づくことで、絶対誤差を評価することもできるので、安全設計などの精度を高めることができる。
情報処理装置は、第1のカメラでリファレンス物体を撮像して得られる画像に基づいて計算されるリファレンスマーカの位置および姿勢と、第2のカメラでリファレンス物体を撮像して得られる画像に基づいて計算されるリファレンスマーカの位置および姿勢との差に基づいて、対応関係を決定する決定部をさらに含んでもよい。この構成によれば、対応関係の精度を評価するために用いられるリファレンスマーカを用いて、カメラ座標系間の対応関係も決定できる。
情報処理装置は、第1の点ペアと第2の点ペアとの形状寸法の差が小さくなるように、対応関係を最適化する最適化部をさらに含んでもよい。この構成によれば、第1の点ペアおよび第2の点ペアの形状寸法に基づいて、カメラ座標系間の対応関係の精度を高めることができる。
探索部は、第1の点ペアの各点に対応する第2の点群における座標を決定し、当該決定された座標から予め定められた距離内に存在する1または複数の点の重心に基づいて、第2の点ペアの各点を決定してもよい。この構成によれば、第1の点ペアの各点に対応する第2の点群における点を統計的にロバストに決定できる。
第1の領域および第2の領域の各々は、リファレンス物体のリファレンスマーカが配置された面を基準として決定されてもよい。この構成によれば、リファレンスマーカが配置された面を基準とすることで、第1の点ペアと第2の点ペアとの対応付けに必要な点群を最適化できる。
形状寸法は、長さおよび角度を含んでもよい。評価部は、長さの誤差についてのヒストグラムと、角度の誤差についてのヒストグラムとを出力してもよい。この構成によれば、形状寸法に含まれる長さおよび角度のそれぞれの観点から、精度を評価できる。
評価部は、第2の点ペアの形状寸法の誤差の計算を繰り返すことで、形状寸法の誤差のばらつきを計算してもよい。この構成によれば、計測によって生じるゆらぎなどの予測が可能となる。
第1の点ペアは、リファレンス物体の形状的な特徴に基づいて選択されてもよい。この構成によれば、第1の点ペアがより安定的に選択される。
本発明の別の一例に従う情報処理方法は、リファレンスマーカが配置されたリファレンス物体を第1のカメラで撮像して得られる第1の画像とリファレンス物体を第2のカメラで撮像して得られる第2の画像とを、第1のカメラの第1のカメラ座標系と第2のカメラの第2のカメラ座標系との対応関係に基づいて、同一の座標系上に合成して合成画像を生成することと、リファレンス物体の情報に基づいて生成された点群のうち、リファレンスマーカを基準として決定される第1の領域に含まれる第1の点群を抽出することと、合成画像に含まれる点群のうち、リファレンスマーカを基準として決定される第2の領域に含まれる第2の点群を抽出することと、第1の点群のうちから選択される第1の点ペアについて、第2の点群において第1の点ペアに対応する第2の点ペアを探索することと、第1の点ペアおよび第2の点ペアの形状寸法に基づいて、対応関係の精度を評価することとを含む。
本発明のさらに別の一例に従う情報処理プログラムは、コンピュータに、リファレンスマーカが配置されたリファレンス物体を第1のカメラで撮像して得られる第1の画像とリファレンス物体を第2のカメラで撮像して得られる第2の画像とを、第1のカメラの第1のカメラ座標系と第2のカメラの第2のカメラ座標系との対応関係に基づいて、同一の座標系上に合成して合成画像を生成することと、リファレンス物体の情報に基づいて生成された点群のうち、リファレンスマーカを基準として決定される第1の領域に含まれる第1の点群を抽出することと、合成画像に含まれる点群のうち、リファレンスマーカを基準として決定される第2の領域に含まれる第2の点群を抽出することと、第1の点群のうちから選択される第1の点ペアについて、第2の点群において第1の点ペアに対応する第2の点ペアを探索することと、第1の点ペアおよび第2の点ペアの形状寸法に基づいて、対応関係の精度を評価することとを実行させる。
本発明によれば、レジストレーションの精度を評価できる。
本発明の実施の形態について、図面を参照しながら詳細に説明する。なお、図中の同一または相当部分については、同一符号を付してその説明は繰り返さない。
<A.適用例>
図1は、本実施の形態に従う情報処理システム1の構成例を示す模式図である。図1を参照して、情報処理システム1は、情報処理装置100と、複数のカメラ10-1,10-2,…,10-N(Nは2以上の整数)(以下、「カメラ10」と総称することもある。)とを含む。
図1は、本実施の形態に従う情報処理システム1の構成例を示す模式図である。図1を参照して、情報処理システム1は、情報処理装置100と、複数のカメラ10-1,10-2,…,10-N(Nは2以上の整数)(以下、「カメラ10」と総称することもある。)とを含む。
カメラ10は、例えば、2次元画像(RGB画像)およびデプス画像を同時に撮像する。カメラ10は、3次元画像を撮像してもよい。
情報処理装置100は、複数のカメラ10間の位置合わせ(レジストレーションあるいはカメラレジストレーション)を行う。カメラ10-1,10-2,…,10-Nは、カメラ座標系12-1,12-2,…,12-N(以下、「カメラ座標系12」と総称することもある。)をそれぞれ有する。カメラ座標系12は、各カメラ10の視野に応じたものである。
レジストレーションは、複数のカメラ10について、カメラ座標系12間の対応関係を決定するための処理である。レジストレーションにおいて、空間SPにある1または複数の点に基づいて、カメラ座標系12間の対応関係が決定される。カメラ座標系12間の対応関係は、例えば、カメラの外部パラメータである同次変換行列であってもよい。以下の説明においては、同次変換行列をカメラ座標系12間の対応関係の一例として説明するが、どのようなパラメータ、変換行列または変換関数を用いてもよい。
レジストレーションが成功すると、あるカメラ10のカメラ座標系12と別のカメラ10のカメラ座標系12との間の対応関係を示す同次変換行列Tの計算が可能である。同次変換行列Tは、あるカメラ10に対する別のカメラ10の外部パラメータである。
例えば、カメラ10-1のカメラ座標系12-1を基準(criteria)とすると、カメラ座標系12-1からカメラ座標系12-2への同次変換行列T1
2が計算される。同様に、カメラ座標系12-1からカメラ座標系12-Nへの同次変換行列T1
Nが計算される。同次変換行列は、回転および平行移動(位置)を示す行列である。
本実施の形態に従う情報処理システム1は、計算されるカメラ座標系12間の対応関係(同次変換行列T)の精度を評価する。
<B.ハードウェア構成例>
次に、本実施の形態に従う情報処理システム1の情報処理装置100のハードウェア構成例について説明する。
次に、本実施の形態に従う情報処理システム1の情報処理装置100のハードウェア構成例について説明する。
図2は、本実施の形態に従う情報処理装置100のハードウェア構成例を示す模式図である。図2を参照して、情報処理装置100は、コンピュータの一例であり、1または複数のプロセッサ102と、メモリ104と、入力インターフェイス106と、表示インターフェイス110と、カメラインターフェイス114と、ネットワークコントローラ116と、ストレージ120とを含む。
1または複数のプロセッサ102は、ストレージ120に格納されているプログラムに含まれるコンピュータ読取可能命令を実行することで、後述するような処理および機能を提供する。1または複数のプロセッサ102がプログラムに含まれるコンピュータ読取可能命令を実行する場合には、プログラムの一部または全部がメモリ104に展開されてもよい。
ストレージ120は、非一過性のコンピュータ読取可能媒体の一例である。ストレージ120には、例えば、OS(Operating System)122と、情報処理プログラム124とが格納される。OS122は、コンピュータとして必要な機能を提供するためのコンピュータ読取可能命令と、情報処理プログラム124を実行する環境を生成するためのコンピュータ読取可能命令とを含む。
情報処理プログラム124は、後述する処理のためのコンピュータ読取可能命令を含む。
入力インターフェイス106は、キーボード、タッチパネル、マウス、および、タブレットなどの入力装置108からの入力指令を受け付ける。入力装置108は、情報処理装置100の構成の一部であってもよい。
表示インターフェイス110は、映像信号をディスプレイ112に出力する。ディスプレイ112は、情報処理装置100の構成の一部であってもよい。
カメラインターフェイス114は、複数のカメラ10とデータをやり取りする。
ネットワークコントローラ116は、ネットワークを介して、他の情報処理装置などとデータをやり取りする。
ネットワークコントローラ116は、ネットワークを介して、他の情報処理装置などとデータをやり取りする。
本明細書において、「プロセッサ」との用語は、CPU(Central Processing Unit)およびGPU(Graphics Processing Unit)などのコンピュータ読取可能命令を順次実行する演算回路に加えて、ハードワイヤード回路も包含する。ハードワイヤード回路の一例としては、ASIC(Application Specific Integrated Circuit)およびFPGA(Field Programmable Gate Array)などが挙げられる。「プロセッサ」は、コア、メモリおよび周辺回路を統合したSoC(System on a chip)を包含する。
<C.処理手順例>
次に、本実施の形態に従う情報処理システム1において実行される処理の手順例について説明する。
次に、本実施の形態に従う情報処理システム1において実行される処理の手順例について説明する。
図3は、本実施の形態に従う情報処理方法の処理手順の一例を示すフローチャートである。図3に示す処理は、レジストレーションおよび精度評価を含む。図3に示す各ステップは、情報処理装置100のプロセッサ102が情報処理プログラム124を実行することで、実現されてもよい。
図3を参照して、情報処理装置100は、ラフキャリブレーション処理を実行する(ステップS1)。ラフキャリブレーション処理の実行後、カメラ座標系12間の対応関係が決定される。ステップS1は、他のステップの処理とは独立して、予め実行されてもよい。
情報処理装置100は、ROI(Region of Interest;関心領域)点群抽出処理を実行する(ステップS2)。情報処理装置100は、ROI点群抽出処理を実行することで、ROIに含まれる点群(以下、「ROI点群」とも称する。)を抽出する。
情報処理装置100は、CAD(Computer Aided Design)由来点群生成処理を実行する(ステップS3)。情報処理装置100は、CAD由来点群生成処理を実行することで、CAD情報に基づく点群(以下、「CAD由来点群」とも称す。)を生成する。ステップS3は、他のステップの処理とは独立して、予め実行されてもよい。
本明細書において、「点群(ポイントクラウド)」は、位置情報を含む点(ポイント)の集合を意味する。「点群」は、位置情報に加えて、色情報を含んでもよい。位置情報は、3次元データであってもよいし、2.5次元データであってもよい。位置情報は、2次元データと奥行情報(距離情報)とを互いに独立して有するものであってもよい。
続いて、情報処理装置100は、アイデンティフィケーション処理を実行する(ステップS4)。アイデンティフィケーション処理は、ROI点群抽出処理により抽出されたROI点群と、CAD由来点群生成処理により生成されたCAD由来点群との対応関係を決定する処理を含む。アイデンティフィケーション処理は、CAD由来点群のキー点ペアの形状寸法およびROI点群のキー点ペアの形状寸法を計算する処理を含む。
続いて、情報処理装置100は、精度評価処理を実行する(ステップS5)。精度評価処理は、アイデンティフィケーション処理において計算された形状寸法に基づいて、精度を計算する処理を含む。
本明細書において、「精度」は、レジストレーションの結果である同次変換行列T(外部パラメータ)の直接的または間接的な精度を意味する。ただし、「精度」は、複数のカメラが撮像する画像に基づいて再構成される空間情報の精度を意味する場合もある。また、「精度」は、複数のカメラが撮像する画像を合成した結果の精度を意味する場合もある。
続いて、情報処理装置100は、精度評価結果を出力する(ステップS6)。精度評価結果の出力は、例えば、計算された精度の空間的なビジュアライゼーションを含む。
ラフキャリブレーション処理に加えて、カメラ座標系12間の対応関係を最適化するためのファインチューニング処理が実行されてもよい。
図4は、本実施の形態に従う本実施の形態に従う情報処理方法の処理手順の別の一例を示すフローチャートである。図4に示す処理は、ファインチューニング処理を含む。図4に示す各ステップは、情報処理装置100のプロセッサ102が情報処理プログラム124を実行することで、実現されてもよい。
情報処理装置100は、ラフキャリブレーション処理を実行する(ステップS1)。ステップS1は、他のステップの処理とは独立して、予め実行されてもよい。
情報処理装置100は、ROI点群抽出処理を実行する(ステップS2)。情報処理装置100は、CAD由来点群生成処理を実行する(ステップS3)。ステップS3は、他のステップの処理とは独立して、予め実行されてもよい。
情報処理装置100は、アイデンティフィケーション処理を実行する(ステップS4)。情報処理装置100は、ファインチューニング処理を実行する(ステップS7)。
情報処理装置100は、ファインチューニング処理の終了条件が満たされたか否かを判断する(ステップS8)。ファインチューニング処理の終了条件が満たされていなければ(ステップS8においてNO)、ステップS2以下の処理が繰り返される。
ファインチューニング処理の終了条件が満たされていれば(ステップS8においてYES)、情報処理装置100は、精度評価処理を実行する(ステップS5)。続いて、情報処理装置100は、精度評価結果を出力する(ステップS6)。そして、処理は終了する。
以下、各ステップの詳細について説明する。
<D.ラフキャリブレーション処理(ステップS1)>
次に、ラフキャリブレーション処理(ステップS1)について説明する。
<D.ラフキャリブレーション処理(ステップS1)>
次に、ラフキャリブレーション処理(ステップS1)について説明する。
上述したように、ラフキャリブレーション処理においては、カメラ座標系12間の対応関係が決定される。より具体的には、基準となるカメラ(以下、「基準カメラ10C」とも称す。)のカメラ座標系12Cから別のカメラ(以下、「ターゲットカメラ10T」とも称す。)へのカメラ座標系12Tの同次変換行列TC
Tが計算される。
同次変換行列TC
Tの計算はどのような方法を用いてもよいが、以下では、リファレンスマーカを用いる方法、および、点群を用いる方法について例示する。
(d1:リファレンスマーカを用いる方法)
図5は、本実施の形態に従うラフキャリブレーション処理の一例を説明するための図である。図5には、リファレンスマーカ(以下、単に「マーカ」とも略称する。)を用いたラフキャリブレーション処理の一例が示される。
図5は、本実施の形態に従うラフキャリブレーション処理の一例を説明するための図である。図5には、リファレンスマーカ(以下、単に「マーカ」とも略称する。)を用いたラフキャリブレーション処理の一例が示される。
図5を参照して、基準カメラ10Cおよびターゲットカメラ10Tのそれぞれの視野(FOV:Field Of View)14C内にリファレンス物体(以下、単に「物体」とも称す。)20が存在する。物体20には、マーカ22が配置されている。マーカ22は、基準カメラ10Cの視野14C内に存在するとともに、ターゲットカメラ10Tの視野14T内に存在する。
マーカ22は、例えば、3次元空間における位置および姿勢を検出可能なものが用いられる。マーカ22は、例えば、2次元マーカであってもよい。マーカ22が2次元マーカである場合には、2次元マーカが配置された面(以下、「有効面」とも称す。)が規定される。
図6は、本実施の形態に従うラフキャリブレーション処理の別の一例を説明するための図である。図6には、複数のカメラ10が同一のマーカ22を計測できない場合が示される。
図6を参照して、物体20のある面上にマーカ22-1が配置され、物体20の別の面上にマーカ22-2が配置されている。このような配置によって、基準カメラ10Cの視野14C内にマーカ22-1が存在し、ターゲットカメラ10Tの視野14T内にマーカ22-2が存在する。
複数のマーカが同時に用いられる場合には、マーカ22を示す識別情報が検出可能であってもよい。マーカ22としては、例えば、The APRIL Robotics Laboratory at the University of Michiganにより開発されたAprilTagを用いることができる。
図7は、AprilTagの一例を示す図である。図7には、3つのAprilTagが例示されている。各AprilTagは、3次元空間における位置および姿勢、ならびに、識別情報を視覚的に計測可能である。
図5および図6に示すように、各カメラ10が撮像する画像により計測される、それぞれのカメラ座標系12におけるマーカ22の位置および姿勢の差に基づいて、同次変換行列Tが計算される。マーカ22の位置および姿勢は、例えば、位置座標(3次元)および姿勢角度(3次元)の6次元のベクトルで表現される。
ラフキャリブレーション処理は、基準カメラ10Cで物体20を撮像して得られる画像に基づいて計算されるマーカ22の位置および姿勢と、ターゲットカメラ10Tで物体20を撮像して得られる画像に基づいて計算されるマーカ22の位置および姿勢との差に基づいて、カメラ座標系12間の対応関係(同次変換行列T)を決定する処理を含む。
マーカ22の位置および姿勢は、マーカ22が配置された面(有効面24)を基準とするマーカ座標系26として定義することもできる。以下の説明においては、マーカ座標系26を用いてカメラ座標系12間の対応関係(同次変換行列T)を決定する処理を説明する。
図8は、図5および図6に示すラフキャリブレーション処理における同次変換行列を計算する処理を説明するための図である。
CAD情報に基づいて予め設定されるCAD正準座標系21から物体20の各面に配置されたマーカ22への同次変換行列(回転および平行移動)が、予め計算される。CAD正準座標系21を用いることで、マーカ22の回転および平行移動の幾何計算の取扱性を容易化できる。
例えば、図8(A)に示すように、CAD正準座標系21からマーカ22-1のマーカ座標系26-1への同次変換行列TCAD
mrk1が計算される。また、図8(B)に示すように、CAD正準座標系21からマーカ22-2のマーカ座標系26-2への同次変換行列TCAD
mrk2が計算される。
基準カメラ10Cのカメラ座標系12Cからターゲットカメラ10Tのカメラ座標系12Tへの同次変換行列TC
Tは、TC
mrkC×TmrkC
mrkT×(TT
mrkT)-1で計算される。
同次変換行列TC
mrkCは、基準カメラ10Cで物体20を撮像して得られる画像に基づいて計算されるマーカ22の位置および姿勢に相当する。同次変換行列TT
mrkTは、ターゲットカメラ10Tで物体20を撮像して得られる画像に基づいて計算されるマーカ22の位置および姿勢に相当する。
同次変換行列TmrkC
mrkTは、基準カメラ10Cの視野14Cに存在するマーカ22からターゲットカメラ10Tの視野14T内に存在するマーカ22への回転および平行移動に相当する。
図8(A)に示すように、基準カメラ10Cおよびターゲットカメラ10Tのそれぞれの視野内に同一のマーカ22が存在する場合には、同次変換行列TmrkTC
mrkTは、同一のマーカへの回転および平行移動に相当する。すなわち、同次変換行列TmrkC
mrkT=E(単位行列)となる。
その結果、同次変換行列TC
T=TC
mrk1×(TT
mrk2)-1で計算される。
一方、図8(B)に示すように、基準カメラ10Cの視野14C内に存在するマーカ22と、ターゲットカメラ10Tの視野14T内に存在するマーカ22とが異なる場合には、同次変換行列TmrkC mrkTがE(単位行列)ではなく、以下のように決定される。
一方、図8(B)に示すように、基準カメラ10Cの視野14C内に存在するマーカ22と、ターゲットカメラ10Tの視野14T内に存在するマーカ22とが異なる場合には、同次変換行列TmrkC mrkTがE(単位行列)ではなく、以下のように決定される。
図9は、物体20の各面に配置されたマーカ22のマーカ座標系26の一例を示す図である。図9を参照して、AprilTagのような識別情報を有するマーカ22を用いる場合には、撮像された画像に写るマーカ22の識別情報が取得される。
マーカ22の識別情報毎に、CAD正準座標系21からマーカ22への同次変換行列が予め計算される。
図10は、CAD正準座標系に基づくマーカ間の回転および平行移動の関係例を示す図である。図10を参照して、マーカ22の識別情報(ID:0~ID:5)に対応付けて、回転量および並行移動量を示す情報が予め用意される。
図10に示す回転量および並行移動量は、ID:0のマーカ22のCAD正準座標系21に基づいて計算された値である。図10に示す情報は、同次変換行列テーブルとして情報処理装置100に格納されてもよい。
例えば、基準カメラ10Cで物体20を撮像して得られる画像に基づいて取得されたマーカ22の識別情報(ID)が「1」であり、ターゲットカメラ10Tで物体20を撮像して得られる画像に基づいて取得されたマーカ22の識別情報(ID)が「2」である場合には、同次変換行列TmrkC
mrkT=Tmrk1
mrk2=(TCAD
mrk1)-1×TCAD
mrk2と計算される。
すなわち、図10に示す同次変換行列テーブルにおいて、基準カメラ10Cの視野14C内に存在するマーカ22の識別情報に対応する同次変換行列テーブルTCAD
mrkiと、ターゲットカメラ10Tの視野14T内に存在するマーカ22の識別情報に対応する同次変換行列テーブルTCAD
mrkiとが選択され、同次変換行列TmrkTC
mrkTが計算される。
計算された同次変換行列TmrkTC
mrkTを用いて、同次変換行列TC
T=TC
mrkC×TmrkC
mrkT×(TT
mrkT)-1が計算される。
このように、ラフキャリブレーション処理においては、1または複数のマーカ22が配置された物体20を複数のカメラでそれぞれ撮像することで、カメラの外部パラメータである同次変換行列が計算される。
(d2:点群を用いる方法)
上述の図5に示すように、基準カメラ10Cの視野14C内およびターゲットカメラ10Tの視野14T内のいずれにも物体20が存在している場合を想定する。ラフキャリブレーション処理に用いる物体20が決定された上で、基準カメラ10Cが撮像する画像およびターゲットカメラ10Tが撮像する画像の各々から、物体20の外形を示す点群が抽出される。
上述の図5に示すように、基準カメラ10Cの視野14C内およびターゲットカメラ10Tの視野14T内のいずれにも物体20が存在している場合を想定する。ラフキャリブレーション処理に用いる物体20が決定された上で、基準カメラ10Cが撮像する画像およびターゲットカメラ10Tが撮像する画像の各々から、物体20の外形を示す点群が抽出される。
FPFH(Fast Point Feature Histogram)法およびICP(Iterative Closest Point)法を組み合わせることで、情報処理装置100は、それぞれの画像から抽出された点群(共通の物体20を示す)に基づいて、基準カメラ10Cのカメラ座標系12Cとターゲットカメラ10Tのカメラ座標系12Tとの対応関係を決定する。すなわち、情報処理装置100は、基準カメラ10Cのカメラ座標系12Cからターゲットカメラ10Tへのカメラ座標系12Tの同次変換行列TC
Tを推定する。
以上のような処理によって、カメラ座標系12間の対応関係(同次変換行列T)が計算される。
<E.ROI点群抽出処理(ステップS2)>
次に、ROI点群抽出処理(ステップS2)について説明する。
次に、ROI点群抽出処理(ステップS2)について説明する。
上述したように、ROI点群抽出処理においては、マーカ22が配置された物体20を基準カメラ10Cで撮像して得られる第1の画像と、物体20をターゲットカメラ10Tで撮像して得られる第2の画像とが合成画像に変換される。なお、2つの画像は、点群の集合であってもよい。そして、アイデンティフィケーション処理において用いられる点群を抽出するためのROIが決定され、合成画像からROIに含まれる点群(ROI点群)が抽出される。
上述の図5に示すように、マーカ22が配置された物体20を基準カメラ10Cおよびターゲットカメラ10Tで撮像することで2つの画像が得られる。得られた2つの画像は、基準カメラ10Cのカメラ座標系12Cとターゲットカメラ10Tのカメラ座標系12Tとの対応関係(同次変換行列TC
T)に基づいて、同一の座標系(カメラ座標系12C)上に合成される。このような変換によって生成された合成画像に対して、ROIの決定およびROI点群の抽出が行われる。
なお、図6に示すように、基準カメラ10Cの視野14C内およびターゲットカメラ10Tの視野14T内に共通のマーカ22が存在しない場合であっても、同次変換行列TC
Tを用いて、ROI点群抽出処理を実行できる。
図11は、本実施の形態に従うROI点群抽出処理の一例を説明するための図である。
図11(A)を参照して、物体20のマーカ22の3次元空間における位置および姿勢が計測されると、マーカ22が配置された面(有効面24)を基準とするマーカ座標系26が決定される。マーカ座標系26の原点は、マーカ22の予め定められた位置(例えば、中心位置)に設定される。
図11(A)を参照して、物体20のマーカ22の3次元空間における位置および姿勢が計測されると、マーカ22が配置された面(有効面24)を基準とするマーカ座標系26が決定される。マーカ座標系26の原点は、マーカ22の予め定められた位置(例えば、中心位置)に設定される。
図11(B)を参照して、決定されたマーカ座標系26の原点を中心として、所定の領域がROI50として決定される。ROI50は、任意の大きさの6面体であってもよい。ROI50の大きさは、予め定められた固定値であってもよいし、任意の条件に応じて変化する可変値であってもよい。
図11(C)を参照して、決定されたROI50に含まれる点群(ROI点群56)が抽出される。ROI点群56は、例えば、2.5次元データ形式で表現されてもよい。2.5次元データ形式は、2次元画像データに奥行情報(距離情報)を付加したものである。
このように、ROI点群抽出処理は、合成画像に含まれる点群のうち、マーカ22を基準として決定されるROI50(第2の領域に相当)に含まれるROI点群56(第2の点群に相当)を抽出する処理を含む。ROI50は、物体20のマーカ22が配置された面(有効面24)を基準として決定されてもよい。抽出されたROI点群56に基づいて、アイデンティフィケーション処理が実行される。
なお、説明の便宜上、1つのマーカ22が配置された物体20を例示するが、複数のマーカ22が物体20に配置されている場合には、マーカ22(有効面24)毎にROIを決定し、ROI点群を抽出してもよい。
<F.CAD由来点群生成処理(ステップS3)>
次に、CAD由来点群生成処理(ステップS3)について説明する。
次に、CAD由来点群生成処理(ステップS3)について説明する。
上述したように、CAD由来点群生成処理においては、CAD由来点群が生成される。
図12は、本実施の形態に従うCAD由来点群生成処理の一例を説明するための図である。
図12は、本実施の形態に従うCAD由来点群生成処理の一例を説明するための図である。
図12を参照して、ラフキャリブレーション処理(ステップS1)およびROI点群抽出処理(ステップS2)において用いられた物体20の情報が用意される。物体20の情報は、設計情報であってもよいし、実測情報であってもよい。設計情報の一例として、物体20のCAD情報30を用いてもよい。設計情報は、「CAD」との用語に限定されず、どのような形式のデータであってもよい。実測情報の一例として、物体20を光学的に測定して得られた情報を用いてもよい。実測情報は、どのような方法で測定された情報であってもよいし、どのような形式のデータであってもよい。
CAD情報30に基づいて、物体20の形状を示す3次元点群32が生成される。生成された3次元点群32のうち、マーカ22の有効面24に対応する対象領域34内に存在する点群がCAD由来点群36として抽出される。CAD由来点群36は、物体20のすべての点群を含まなくてもよく、少なくとも、マーカ22の有効面24の近傍の点群を含んでいればよい。
3次元点群32は、例えば、3次元データ形式で表現される。アイデンティフィケーション処理を簡素化するために、対象領域34内に存在する点群は、3次元データ形式から2.5次元データ形式に変換されてもよい。
CAD由来点群36が2.5次元データ形式であれば、2.5次元データ形式において、ROI点群56とCAD由来点群36とを対応付けることができる。
このように、CAD由来点群生成処理は、物体20の情報(例えば、CAD情報30)に基づいて生成された点群のうち、マーカ22を基準として決定される対象領域34(第1の領域に相当)に含まれるCAD由来点群36(第1の点群に相当)を抽出する処理を含む。CAD由来点群36は、物体20のマーカ22が配置された面(有効面24)を基準として決定されてもよい。
なお、説明の便宜上、1つのマーカ22が配置された物体20を例示するが、複数のマーカ22が物体20に配置されている場合には、マーカ22(有効面24)毎にCAD由来点群36を生成してもよい。
<G.アイデンティフィケーション処理(ステップS4)>
次に、アイデンティフィケーション処理(ステップS4)について説明する。
次に、アイデンティフィケーション処理(ステップS4)について説明する。
上述したように、アイデンティフィケーション処理においては、ROI点群56とCAD由来点群36との対応関係が決定される。また、アイデンティフィケーション処理においては、CAD由来点群のキー点ペアの形状寸法およびROI点群のキー点ペアの形状寸法が計算される。
アイデンティフィケーション処理においては、CAD由来点群36中のキー点が選択される。選択されたCAD由来点群36中のキー点に対応する、ROI点群56中のキー点が探索される。CAD由来点群36中のキー点は、2つのキー点を組にした「キー点ペア」の単位で決定される。後述の処理において、キー点ペアの形状寸法が計算される。すなわち、キー点ペアは、形状寸法を計算する対象となる。
図13は、本実施の形態に従うアイデンティフィケーション処理のキー点探索の一例を説明するための図である。図13を参照して、CAD由来点群36において、キー点ペア40-1,40-2(以下、「キー点ペア40」と総称することもある。)が選択される。キー点ペア40(および、キー点42)は、マーカ22が配置された物体20の形状的な特徴に基づいて選択されてもよい。
キー点ペア40(および、キー点42)は、CAD情報に対して予め設定された1または複数の座標に従って、自動的に選択されてもよい。キー点ペア40(および、キー点42)は、CAD由来点群36に対するユーザの指示に応じて選択されてもよい。この場合には、情報処理装置100は、ユーザがキー点ペア40(および、キー点42)を選択するためのユーザインターフェイス画面を提供してもよい。
図13に示す例において、キー点ペア40-1は、キー点42-1とキー点42-2との組である。キー点ペア40-2は、キー点42-3とキー点42-4との組である。以下では、キー点42-1~42-4を「キー点42」と総称することもある。
CAD由来点群36中のキー点42-1~42-4にそれぞれ対応するROI点群56中のキー点62-1~62-4(以下、「キー点62」と総称することもある。)が探索される。すなわち、アイデンティフィケーション処理は、CAD由来点群36(第1の点群)のうちから選択されるキー点ペア40(第1の点ペアに相当)について、ROI点群56においてキー点ペア40に対応するキー点62の組(第2の点ペアに相当)を探索する処理を含む。
以下、CAD由来点群36中のキー点42に対応するROI点群56中のキー点62を探索するためのキー点探索法のいくつかについて例示する。
(g1:最小距離(Minimum distance)法)
まず、キー点探索法の一例である最小距離法について説明する。
まず、キー点探索法の一例である最小距離法について説明する。
図14は、最小距離法によりキー点を探索する方法を説明するための図である。図14を参照して、ROI点群56に対して、CAD由来点群36中のキー点42に対応する座標が与えられる。CAD由来点群36中のキー点42に対応する座標から各点までの距離が計算される。CAD由来点群36中のキー点42に対応する座標からの距離が最小となる点がキー点62として推定される。
(g2:重心(Center of gravity)法)
次に、キー点探索法の別の一例である重心法について説明する。
次に、キー点探索法の別の一例である重心法について説明する。
図15は、重心法によりキー点を探索する方法を説明するための図である。図15を参照して、ROI点群56に対して、CAD由来点群36中のキー点42に対応する座標が与えられる。CAD由来点群36中のキー点42に対応する座標から所定の半径R内に存在する複数の点が決定される。半径R内に存在する複数の点の重心がキー点62として推定される。
このように、重心法は、CAD由来点群36中のキー点ペア40(第1の点ペア)の各点に対応するROI点群56(第2の点群)における座標を決定し、当該決定された座標から予め定められた距離内に存在する1または複数の点の重心に基づいて、キー点ペア60(第2の点ペア)のキー点62を決定する処理を含む。以下に説明する重心法をベースとした各種方法についても同様である。
(g3:平均重心(Average Center of gravity)法)
次に、キー点探索法のさらに別の一例である平均重心法について説明する。
次に、キー点探索法のさらに別の一例である平均重心法について説明する。
図16は、平均重心法によりキー点を探索する方法を説明するための図である。図16を参照して、上述の重心法と同様に、CAD由来点群36中のキー点42に対応する座標から所定の半径R内に存在する複数の点が選択される。半径R内に存在する複数の点の重心64が計算される。
カメラ10が複数回撮像することにより、ROI点群56のサンプルを複数用意できる場合には、ROI点群56毎に重心64を計算できる。例えば、複数の重心64-1~64-6を計算した上で、複数の重心64-1~64-6の平均がキー点62として推定される。
(g4:平均重心法+M推定(M-estimation))
次に、キー点探索法のさらに別の一例である平均重心法にM推定を加えた方法について説明する。
次に、キー点探索法のさらに別の一例である平均重心法にM推定を加えた方法について説明する。
図17は、平均重心法およびM推定によりキー点を探索する方法を説明するための図である。図17を参照して、カメラ10が複数回撮像することにより、ROI点群56のサンプルを複数用意できる場合には、上述の平均重心法と同様に、ROI点群56毎に重心64を計算できる。複数の重心64が計算されると、計算された複数の重心64の平均が計算される。計算された平均に基づいて、複数の重心64の各々の偏差および標準偏差σが計算される。
複数の重心64のうち標準偏差σを超える偏差がある重心64は、外れ値(outlier)と決定され、それ以外の重心64が適正値(inlier)と決定される。図17に示す例では、3つの重心64-1,64-3,64-4が適正値と決定される。
適正値として決定された重心64のうち1つがキー点62として推定される。あるいは、適正値として決定された重心64の平均がキー点62として推定される。
(g5:平均重心法+RANSAC(Random sample consensus)法)
次に、キー点探索法のさらに別の一例である平均重心法にRANSAC法を加えた方法について説明する。
次に、キー点探索法のさらに別の一例である平均重心法にRANSAC法を加えた方法について説明する。
図18および図19は、平均重心法およびRANSAC法によりキー点を探索する方法を説明するための図である。図18を参照して、ROI点群56の複数のサンプルから複数の重心64が計算される。複数の重心64は、外れ値(outlier)と適正値(inlier)とに分類される。
サンプル群1においては、3つの重心64-5,64-3,64-2が適正値と決定され、残りの3つの重心64-4,64-1,64-4が外れ値と決定される。適正値と決定された重心の平均、および、外れ値と決定された重心の平均がそれぞれRANSAC用キー点として決定される。適正値のRANSAC用キー点と外れ値のRANSAC用キー点との差がCAD由来点群36中のキー点42に対する誤差として計算される。
同様に、サンプル群2においては、3つの重心64-1,64-5,64-6が適正値と決定され、残りの3つの重心64-3,64-2,64-4が外れ値と決定される。適正値のRANSAC用キー点と外れ値のRANSAC用キー点との差がCAD由来点群36中のキー点42に対する誤差として計算される。
図19を参照して、複数のサンプル群に対して、CAD由来点群36中のキー点42に対する誤差が計算され、誤差が最小値となるサンプル群が最適なサンプル群として決定される。最適なサンプル群の重心の平均がキー点62として推定される。
(g5:小括)
キー点探索法としては、上述した方法に限られず、任意の方法を用いることができる。ただし、キー点探索法は、後述の精度評価処理に影響を与える重要なファクタであるため、複数のキー点探索法を評価した上で、適切な1または複数のキー点探索法を決定してもよい。
キー点探索法としては、上述した方法に限られず、任意の方法を用いることができる。ただし、キー点探索法は、後述の精度評価処理に影響を与える重要なファクタであるため、複数のキー点探索法を評価した上で、適切な1または複数のキー点探索法を決定してもよい。
キー点探索法を用いて、CAD由来点群36中のキー点42に対応するROI点群56中のキー点62が探索されると、形状寸法が計算される。
図20は、本実施の形態に従うアイデンティフィケーション処理の形状寸法計算の一例を説明するための図である。図20を参照して、CAD由来点群36中のキー点42-1~42-4にそれぞれ対応するROI点群56中のキー点62-1~62-4が探索される。
ROI点群56中のキー点62-1~62-4に基づいて、CAD由来点群36中のキー点ペア40-1,40-2に対応するキー点ペア60-1が決定され、CAD由来点群36中のキー点ペア40-3,40-4に対応するキー点ペア60-2が決定される。
CAD由来点群36中のキー点ペア40-1,40-2の各々の形状寸法が計算される。また、ROI点群56中のキー点ペア60-1,60-2(以下、「キー点ペア60」と総称することもある。)の各々の形状寸法が計算される。形状寸法は、例えば、キー点ペアの長さ(1次元:スカラ量)であってもよいし、キー点ペアの長さおよび角度(ベクトル量)であってもよい。形状寸法の長さおよび方向は、長さを示す成分と、角度を示す回転成分とを用いて表現されてもよい。
<H.処理例>
次に、ROI点群抽出処理、CAD由来点群生成処理、および、アイデンティフィケーション処理の処理例を説明する。
次に、ROI点群抽出処理、CAD由来点群生成処理、および、アイデンティフィケーション処理の処理例を説明する。
図21~図23は、本実施の形態に従う情報処理の処理例を示す図である。
ラフキャリブレーション処理の後、基準カメラ10Cのカメラ座標系12Cからターゲットカメラ10Tのカメラ座標系12Tへの同次変換行列TC Tが計算される。
ラフキャリブレーション処理の後、基準カメラ10Cのカメラ座標系12Cからターゲットカメラ10Tのカメラ座標系12Tへの同次変換行列TC Tが計算される。
図21(A)を参照して、同次変換行列TC
Tを用いて、ターゲットカメラ10Tのカメラ座標系12Cにおけるマーカ座標系26が基準カメラ10Cのカメラ座標系12Cにおけるマーカ座標系26に座標変換される。この座標変換によって、基準カメラ10Cの撮像により得られた点群、および、ターゲットカメラ10Tの撮像によって得られた点群が同一の座標系上に合成される。すなわち、同次変換行列TC
Tを用いた座標変換により基準を一致させた上で、点群が集約される。
続いて、図21(B)を参照して、有効面24を基準としたROIが決定され、ROIに含まれる点群(ROI点群56)が抽出される。すなわち、有効面24の近傍にある表層の点群が抽出される。
続いて、図21(C)を参照して、ROI点群56は、CAD正準座標系21に座標変換される。この座標変換により、アイデンティフィケーション処理において、形状寸法を計算するための基準が一致する。
図22を参照して、マーカ22が配置された物体20のCAD情報に基づいて、キー点42およびキー点ペア40が選択される。キー点42は、物体20の形状的な特徴に基づいて選択されてもよい。
図23(A)を参照して、ROI点群56に対して、CAD由来点群36中のキー点42に対応する座標が与えられる。
図23(B)を参照して、キー点探索法により、CAD由来点群36中のキー点42に対応するROI点群56中のキー点62が探索される。
<I.リファレンス物体>
次に、リファレンス物体(物体20)の形状の一例について説明する。
次に、リファレンス物体(物体20)の形状の一例について説明する。
上述したように、物体20は、マーカ22が配置される有効面24を有しているとともに、キー点42を選択するための形状的な特徴を有してもよい。リファレンス物体としてのいくつかの形状について例示する。
図24は、本実施の形態に従う情報処理システム1において用いられるリファレンス物体20Aの構成例を示す模式図である。図24を参照して、リファレンス物体20Aは、立方体をベースとする。リファレンス物体20Aの各面には、マーカ22がそれぞれ配置される(合計6面分)。図24には、3つの面には位置されたマーカ22-1~22-3のみが表現されているが、図示されない残りの面の各々にもマーカ22が配置されている。
リファレンス物体20Aは、立方体の4つの頂点に相当する部分が切り欠かれている。より具体的には、リファレンス物体20Aの上面の対向する一対の頂点には、立方体状の切欠部28-1,28-2が設けられている。また、リファレンス物体20Aの上面の別の対向する一対の頂点には、面取り部29-1,29-2が設けられている。
切欠部28-1,28-2および面取り部29-1,29-2は、リファレンス物体20Aの形状的な特徴であり、キー点42およびキー点ペア40を選択する基準になり得る。
図25は、本実施の形態に従う情報処理システム1において用いられるリファレンス物体20Bの構成例を示す模式図である。図25を参照して、リファレンス物体20Bは、主となる四角錐250と、四角錐250の1つの面に底面が一致する四角錐252,254とを含む。四角錐250の四角錐252,254が存在しない面には、マーカが配置されてもよい。
四角錐250および四角錐252,254の各頂点などは、リファレンス物体20Bの形状的な特徴であり、キー点42およびキー点ペア40を選択する基準になり得る。
図26は、本実施の形態に従う情報処理システム1において用いられるリファレンス物体20C,20Dの構成例を示す模式図である。
図26(A)を参照して、リファレンス物体20Cは、立方体をベースとする。リファレンス物体20Cの3つの面には、それぞれマーカ22-1~22-3が配置される。
リファレンス物体20Cは、上面の各辺に相当する部分が切り欠かれている。より具体的には、リファレンス物体20Cの上面の各辺に相当する部分には、切欠部28-3~28-6が設けられている。
切欠部28-3~28-6の各々は、切り欠かれた区間および長さが互いに異なるように形成される。すなわち、切欠部28-3~28-6は、互いに識別可能な形状となっている。
切欠部28-3~28-6は、リファレンス物体20Cの形状的な特徴であり、キー点42およびキー点ペア40を選択する基準になり得る。
図26(B)を参照して、リファレンス物体20Dは、立方体をベースとする。リファレンス物体20Dの3つの面には、それぞれマーカ22-1~22-3が配置される。
リファレンス物体20Dは、2つの面の一部が切り欠かれている。より具体的には、リファレンス物体20Dの2つの側面の各々には、切欠部28-7,28-8が設けられている。
切欠部28-7の断面は長方形となっており、切欠部の28-8の断面は三角形となっている。切欠部28-7,28-8は、リファレンス物体20Dの内部に向かうに連れて、断面積が減少する形状であってもよい。このように、切欠部28-7,28-8の断面形状が異なることで、互いに識別可能な形状となっている。
切欠部28-7,28-8は、リファレンス物体20Dの形状的な特徴であり、キー点42およびキー点ペア40を選択する基準になり得る。
図27は、本実施の形態に従う情報処理システム1において用いられるリファレンス物体20Eの構成例を示す模式図である。図27を参照して、リファレンス物体20Eは、主柱260と、マーカ22を配置可能な5つの平面板261~265を含む。平面板262は主柱260により支持される。平面板261,263,264,265は、主柱260に接続された支持部材271,273,274,275により支持される。
平面板261~265の配置は、リファレンス物体20Eの形状的な特徴であり、キー点42およびキー点ペア40を選択する基準になり得る。
リファレンス物体(物体20)は、切欠部などが形成されていない立方体または直方体であってもよい。リファレンス物体(物体20)は、上述した形状に限られず、任意の形状であってもよい。
上述したように、キー点42およびキー点ペア40は、リファレンス物体の形状的な特徴に基づいて選択されてもよい。キー点42およびキー点ペア40を設定するために、形状的な特徴を有するリファレンス物体を採用してもよい。
<J.精度評価処理(ステップS5)>
次に、精度評価処理(ステップS5)について説明する。
次に、精度評価処理(ステップS5)について説明する。
上述したように、精度評価処理においては、アイデンティフィケーション処理において計算された形状寸法に基づいて、精度が計算される。すなわち、精度評価処理は、CAD由来点群36中のキー点ペア40(第1の点ペア)およびROI点群56中のキー点ペア60(第2の点ペア)の形状寸法に基づいて、同次変換行列T(カメラ座標系12間の対応関係)の精度を評価する処理を含む。
計算される精度としては、例えば、絶対誤差および繰り返し誤差のうち少なくとも一方を含む。
(j1:絶対誤差)
図28は、本実施の形態に従う精度評価処理の絶対誤差評価の一例を説明するための図である。図28を参照して、キー点ペア毎に、CAD由来点群36中のキー点ペア40の形状寸法と、ROI点群56中のキー点ペア60の形状寸法との差が計算される。計算された差が絶対誤差となる。
図28は、本実施の形態に従う精度評価処理の絶対誤差評価の一例を説明するための図である。図28を参照して、キー点ペア毎に、CAD由来点群36中のキー点ペア40の形状寸法と、ROI点群56中のキー点ペア60の形状寸法との差が計算される。計算された差が絶対誤差となる。
複数のキー点ペアの各々について計算された絶対誤差を統計処理することで、対象の情報処理システム1における絶対誤差が計算される。また、複数のサンプルから計算されるそれぞれのキー点ペアの形状誤差を統計処理することで、対象の情報処理システム1における絶対誤差が計算される。
例えば、キー点ペアp1について、キー点ペア40における形状寸法の長さがLcad1であり、キー点ペア60における形状寸法の長さがLROI1であれば、絶対誤差Δp1=|Lcad1-LROI1|となる。同様に、キー点ペアp2について、キー点ペア40における形状寸法がLc2であり、キー点ペア60における形状寸法がLROI2であれば、絶対誤差Δp2=|Lcad2-LROI2|となる。
あるいは、キー点ペアp1とキー点ペアp2とのなす角度について、キー点ペア40における角度がθcad1であり、キー点ペア60における角度がθROI1であれば、絶対誤差Δpθ1=|θcad1-θROI1|となる。
このように、CAD由来点群36中のキー点ペア40の形状寸法と、ROI点群56中のキー点ペア60の形状寸法との差に基づいて、精度として絶対誤差が計算される。
(j2:繰り返し誤差)
図29は、本実施の形態に従う精度評価処理の繰り返し誤差評価の一例を説明するための図である。図29を参照して、複数のサンプルについて、キー点ペア毎に、ROI点群56中のキー点ペア60の形状寸法のばらつきが計算される。計算されたばらつき(例えば、標準偏差)が繰り返し誤差となる。
図29は、本実施の形態に従う精度評価処理の繰り返し誤差評価の一例を説明するための図である。図29を参照して、複数のサンプルについて、キー点ペア毎に、ROI点群56中のキー点ペア60の形状寸法のばらつきが計算される。計算されたばらつき(例えば、標準偏差)が繰り返し誤差となる。
例えば、キー点ペアp1について、サンプル1における形状寸法がLROI11であり、サンプル2における形状寸法がLROI12である場合には、LROI11とLROI12との誤差が繰り返し誤差となる。
同様に、キー点ペアp2について、サンプル1における形状寸法がLROI21であり、サンプル2における形状寸法がLROI22である場合には、LROI21とLROI22との誤差が繰り返し誤差となる。
あるいは、キー点ペアp1について、サンプル1における角度がθcad11であり、サンプル2における角度がθROI12である場合には、θROI21とθROI22との誤差が繰り返し誤差となる。
3つ以上のサンプルについて繰り返し誤差を計算する場合には、同一のキー点ペアの形状寸法の標準偏差が繰り返し誤差として計算される。
このように、精度評価処理は、ROI点群56中のキー点ペア60(第2の点ペア)の形状寸法の誤差の計算を繰り返すことで、形状寸法の誤差のばらつきを計算する処理を含む。
(j3:その他)
キー点ペア毎に、CAD由来点群36中のキー点ペア40の形状寸法と、ROI点群56中のキー点ペア60の形状寸法とが得られるので、2種類の形状寸法のうち少なくとも一方を用いて、任意の精度評価処理を行うことができる。
キー点ペア毎に、CAD由来点群36中のキー点ペア40の形状寸法と、ROI点群56中のキー点ペア60の形状寸法とが得られるので、2種類の形状寸法のうち少なくとも一方を用いて、任意の精度評価処理を行うことができる。
<K.精度評価結果の出力(ステップS6)>
次に、精度評価結果の出力(ステップS6)について説明する。
次に、精度評価結果の出力(ステップS6)について説明する。
図30は、本実施の形態に従う精度評価結果の出力の一例を示す模式図である。図30を参照して、精度評価結果の出力画面200は、形状寸法の長さの誤差を示す情報210と、形状寸法の角度の誤差を示す情報220とを含む。
情報210は、統計情報212と、長さの誤差についてのヒストグラム214とを含む。ヒストグラム214は、長さの誤差の大きさ毎にキー点ペアの数(頻度)を示す。情報220は、統計情報222と、角度の誤差についてのヒストグラム224とを含む。ヒストグラム224は、角度の誤差の大きさ毎にキー点ペアの数(頻度)を示す。
このように、情報処理装置100は、長さの誤差についてのヒストグラム214と、角度の誤差についてのヒストグラム224とを出力してもよい。
ヒストグラムにおいては、左側に分布が偏るほど精度が良好であると判断できる。図30に示すように、長さおよび角度の誤差についてのヒストグラムの分布形状を参照することで、誤差のばらつきなども評価することができる。
<L.ファインチューニング処理(ステップS7)>
次に、ファインチューニング処理(ステップS7)について説明する。計算された精度(絶対誤差および繰り返し誤差)が予め定められた条件を満たさない場合に、ファインチューニング処理を含む処理が実行されてもよい。
次に、ファインチューニング処理(ステップS7)について説明する。計算された精度(絶対誤差および繰り返し誤差)が予め定められた条件を満たさない場合に、ファインチューニング処理を含む処理が実行されてもよい。
ファインチューニング処理は、アイデンティフィケーション処理により計算される形状寸法の誤差を最小化するように、同次変換行列Tを最適化する処理である。すなわち、ファインチューニング処理は、CAD由来点群36中のキー点ペア40(第1の点ペア)およびROI点群56中のキー点ペア60(第2の点ペア)との形状寸法の差が小さくなるように、同次変換行列T(カメラ座標系12間の対応関係)を最適化する処理を含む。同次変換行列Tの最適化は、形状寸法を用いた評価関数を最小化(または、最大化)するための非線形計画問題に帰結できる。
ファインチューニング処理においては、コストを示す評価関数を定義するとともに、評価関数が示すコストを最小化するように、同次変換行列Tの各パラメータが探索される。
より具体的には、同次変換行列T*(R*,t*)に関して、以下のような評価関数を用いることができる。

評価関数は、すべてのキー点ペアについての、CAD由来点群36中のキー点ペア40の形状寸法と、ROI点群56中のキー点ペア60の形状寸法との絶対誤差の二乗総和を含む。すなわち、評価関数を最小化することは、CAD由来点群36中のキー点ペア40の形状寸法と、ROI点群56中のキー点ペア60の形状寸法との絶対誤差の二乗総和を最小化することを意味する。
上述の評価関数は、以下のようなペナルティ項を含んでもよい。

図31は、本実施の形態に従うファインチューニング処理のペナルティ項の一例を説明するための図である。
図31を参照して、ラフキャリブレーション処理の精度、および、点群のゆらぎなどによって、CAD由来点群36中のキー点42に対応する座標から所定の半径R内に所定数の点が存在しない場合がある。図30の左側(現実)の例では、半径R内に1つの点のみが存在する。
このような場合には、所定数の点が見つかるまで、半径Rを段階的に大きくしてもよい。ただし、探索半径が基準の半径Rから半径R’まで増大したことをペナルティ項に反映してもよい。例えば、|半径R’-半径R|に係数を乗じた値をペナルティ項としてもよい。
また、形状寸法の長さの誤差および角度の誤差に加えて、L2正則化項をペナルティ項とする評価関数を採用してもよい。例えば、以下のような評価関数を用いることができる。

以上のように、ファインチューニング処理に用いる評価関数は、アイデンティフィケーション処理において得られるキー点ペアの形状寸法の計算結果を用いるものであれば、どのようなものであってもよい。
以下、ファインチューニング処理の効果の一例について説明する。
図32は、本実施の形態に従うファインチューニング処理による長さの誤差の変化例を示す図である。図32を参照して、ファインチューニング処理前においては、ヒストグラムが多峰性を示していたのに対して、ファインチューニング処理後においては、ヒストグラムが指数分布を示しているのが分かる。ヒストグラムにおいては、左側に分布が偏るほど精度が良好である。このように、ファインチューニング処理によって、理想的な誤差分布に近付いていることが分かる。
図32は、本実施の形態に従うファインチューニング処理による長さの誤差の変化例を示す図である。図32を参照して、ファインチューニング処理前においては、ヒストグラムが多峰性を示していたのに対して、ファインチューニング処理後においては、ヒストグラムが指数分布を示しているのが分かる。ヒストグラムにおいては、左側に分布が偏るほど精度が良好である。このように、ファインチューニング処理によって、理想的な誤差分布に近付いていることが分かる。
図33は、本実施の形態に従うファインチューニング処理による角度の誤差の変化例を示す図である。図33を参照して、ファインチューニング処理前においては、指数分布から外れたヒストグラムであったのに対して、ファインチューニング処理後においては、ヒストグラムが指数分布を示しているのが分かる。指数分布p(x)=λexp(-λ)について、ファインチューニング処理後においては、パラメータλが大きくなっている。すなわち、ヒストグラムは、より鋭い指数分布を示すようになる。
このように、ファインチューニング処理によって、形状寸法の誤差を低減させることができる。
<M.精度評価の応用例>
次に、本実施の形態に従う情報処理方法のいくつかの精度評価の応用例について説明する。上述の精度評価結果の出力は、ラフキャリブレーション処理およびファインチューニング処理の実行結果に基づくものであったが、本実施の形態に従う情報処理方法は、精度の経年的な変化および定期的な精度の管理などに用いることもできる。
次に、本実施の形態に従う情報処理方法のいくつかの精度評価の応用例について説明する。上述の精度評価結果の出力は、ラフキャリブレーション処理およびファインチューニング処理の実行結果に基づくものであったが、本実施の形態に従う情報処理方法は、精度の経年的な変化および定期的な精度の管理などに用いることもできる。
(m1:ヒストグラムに基づく精度管理)
上述の図32に示すように、精度はヒストグラムの分布形状に反映される。ヒストグラムの分布形状を所定のアルゴリズムを用いて比較することで、精度の変化などを定量的に計算できる。
上述の図32に示すように、精度はヒストグラムの分布形状に反映される。ヒストグラムの分布形状を所定のアルゴリズムを用いて比較することで、精度の変化などを定量的に計算できる。
ヒストグラムの分布形状を比較するアルゴリズムとしては、例えば、ヒストグラム交差カーネルを用いる方法、および、ヒストグラムユークリッド距離を用いる方法などが挙げられる。
例えば、設備保全者は、運用開始前に、誤差についてのヒストグラムを生成および保存しておき、日常点検時などに、誤差についてのヒストグラムを再生成し、保存されているヒストグラムと比較してもよい。設備保全者は、ヒストグラムの分布形状の変化に基づいて、精度が低下しているか否かを判断できる。
このような誤差についてのヒストグラムの分布形状の変化に基づく観測を設備保全業務としてもよい。
あるいは、指数分布p(x)=λexp(-λ)を用いて誤差についてのヒストグラムを近似することで推定されるパラメータλに基づいて、精度のトレンド管理を行ってもよい。
例えば、設備保全者は、運用開始前に、誤差についてのヒストグラムを生成し、生成されたヒストグラムを指数分布で近似して決定されたパラメータλを保存する。設備保全者は、日常点検時などに、誤差についてのヒストグラムを再生成し、生成されたヒストグラムを指数分布で近似してパラメータλを計算する。設備保全者は、パラメータλの値の変化に基づいて、精度をトレンド管理できる。
精度のトレンド管理には、例えば、以下のような式に従って計算される余裕度Iλmarginを用いてもよい。

ただし、λExp_criteは、パラメータλの基準値を示し、λExp_currは評価対象のヒストグラムから計算あれたパラメータλの値を示す。
パラメータλが基準値から変化しない場合には余裕度Iλmargin=0となり、改善方向であれば余裕度Iλmargin>0となり、悪化方向は余裕度Iλmargin<0となる。余裕度Iλmarginの絶対値は、(改善または悪化)傾向の度合いを示す。
このような誤差についてのヒストグラムから計算されるパラメータλを用いて、精度をトレンド管理することもできる。
(m2:点群厚に基づく精度管理)
ファインチューニング処理後に、精度を詳細に確認する方法として、点群の厚み(点群厚)を用いてもよい。
ファインチューニング処理後に、精度を詳細に確認する方法として、点群の厚み(点群厚)を用いてもよい。
図34は、本実施の形態に従う情報処理方法の点群厚を利用した精度確認を説明するための図である。
図34(A)を参照して、ラフキャリブレーション処理またはファインチューニング処理の実行後、基準カメラ10Cが撮像した画像から抽出された点群と、ターゲットカメラ10Tが撮像した画像から抽出された点群とを合成した合成点群270が生成される。
合成点群270に対して、合成の繋ぎ目に相当する領域282、および、合成の繋ぎ目以外に相当する領域284の各々から点群厚が計算される。
点群厚は、領域内の点群のばらつきの度合い示す。すなわち、計算される点群厚が小さいほど、精度が高いことを示す。
合成の繋ぎ目以外に相当する領域284の点群厚は、カメラ10(センサ)自体の精度に依存するものである。理想的には、合成の繋ぎ目に相当する領域282の点群厚は、合成の繋ぎ目以外に相当する領域284の点群厚と同じであることが好ましい。すなわち、領域282の点群厚が領域284の点群厚にどれだけ近接しているかに基づいて、ラフキャリブレーション処理またはファインチューニング処理がどの程度適切に実行されたかを定量的に評価できる。
図34(B)を参照して、指定された領域に含まれる点群から基準平面Qが推定される。基準平面Qは、例えば、最小二乗法により、指定された領域に含まれる点群の座標に基づいて決定される。点群に含まれる点P(i)における基準平面Qとのユークリッド距離L(i)が計算される。最終的に、ユークリッド距離L(i)の分散が点群厚として決定される。すなわち、点群厚Thickness=variance(L(i:1→n))として計算される。
点群厚の値が大きいほど、基準平面Qに対して点群が乱れて存在していることを示す。合成の繋ぎ目に相当する領域282と合成の繋ぎ目以外に相当する領域284との間で、点群厚を比較することで、合成精度が計算される。
<N.精度空間分布>
上述したように、アイデンティフィケーション処理は、マーカ22の有効面24の近傍から抽出された点群に基づく。そのため、計算される精度は、有効面24の近傍に対するものである。マーカ22が配置された物体20を空間SPの複数の位置に配置した上で、各位置における精度を計算すれば、空間SPにおける精度空間分布が得られる。
上述したように、アイデンティフィケーション処理は、マーカ22の有効面24の近傍から抽出された点群に基づく。そのため、計算される精度は、有効面24の近傍に対するものである。マーカ22が配置された物体20を空間SPの複数の位置に配置した上で、各位置における精度を計算すれば、空間SPにおける精度空間分布が得られる。
空間SPにおける精度空間分布を用いることで、空間SPにおける精度の一様性(フラットネス)を評価できる。また、空間SPにおける精度空間分布を可視化してもよい。
図35は、本実施の形態に従う精度空間分布の計算方法を説明するための図である。図35を参照して、空間SPにおいて、基準カメラ10Cおよびターゲットカメラ10Tが配置されている。
基準カメラ10Cおよびターゲットカメラ10Tの配置位置は維持したまま、マーカ22が配置された物体20は、計測位置Pos1,Pos2,Pos3,…と順次異なる位置に配置される。各計測位置において、上述したような処理によって精度が計算される。
図36は、本実施の形態に従う精度空間分布の計算方法の処理手順の一例を示すフローチャートである。図36に示す各ステップは、情報処理装置100のプロセッサ102が情報処理プログラム124を実行することで、実現されてもよい。
情報処理装置100は、ラフキャリブレーション処理を実行する(ステップS1)。このとき、マーカ22が配置された物体20は、任意の計測位置に配置される。ステップS3は、他のステップの処理とは独立して、予め実行されてもよい。
情報処理装置100は、ROI点群抽出処理を実行する(ステップS2)。情報処理装置100は、CAD由来点群生成処理を実行する(ステップS3)。ステップS3は、他のステップの処理とは独立して、予め実行されてもよい。また、ステップS3は、ステップS10を含むループ処理中において、最初の1回のみ実行されてもよい。
情報処理装置100は、アイデンティフィケーション処理を実行する(ステップS4)。続いて、情報処理装置100は、精度評価処理を実行する(ステップS5)。情報処理装置100は、計算された精度と、精度の計算に用いられたマーカ座標系26をグローバル座標系に変換した座標とを対応付けて格納する(ステップS9)。
情報処理装置100は、マーカ22が配置された物体20が別の計測位置に移動されたか否かを判断する(ステップS10)。ユーザが情報処理装置100に指示を与えることで、情報処理装置100は、物体20が別の計測位置に移動された否かを判断してもよい。
マーカ22が配置された物体20が別の計測位置に移動されていれば(ステップS10においてYES)、ステップS2以下の処理が繰り返される。
マーカ22が配置された物体20が別の計測位置に移動されていなければ(ステップS10においてNO)、情報処理装置100は、計算された精度と、精度の計算に用いられたマーカ座標系26をグローバル座標系に変換した座標との組に基づいて、精度空間分布を計算する(ステップS11)。
物体20を空間SP内でまんべんなく移動させることができない場合もあるので、情報処理装置100は、公知の補間方法を用いて、格納されている情報から空間SP内の各計測位置の精度を計算してもよい。
情報処理装置100は、計算された空間SPにおける精度空間分布を可視化して出力する(ステップS12)。そして、処理は終了する。
このように、精度空間分布を計算する処理は、CAD由来点群36のキー点ペア40(第1の点ペア)とROI点群56のキー点ペア60(第2の点ペア)の形状寸法に基づいて、カメラ座標系12間の対応関係(同次変換行列T)の精度を計算する処理と、物体20が空間の複数の計測位置に配置されたときに、それぞれの計測位置について計算されるカメラ座標系12間の対応関係(同次変換行列T)の精度をそれぞれの計測位置に関連付けて可視化する処理とを含む。
図37は、本実施の形態に従う精度空間分布の計算方法により得られた精度空間分布を可視化した例を示す図である。図37に示す精度空間分布においては、各計測位置の精度が濃淡または色で表現される。このように、カメラ座標系12間の対応関係(同次変換行列T)の精度の値が、濃淡および色の少なくとも一方で表現された画像が出力されてもよい。
可視化された精度空間分布によれば、空間SP内において、誤差のばらつきおよび誤差のバイアスなどが存在する領域をユーザが認識することを支援できる。誤差のばらつきおよび誤差のバイアスが存在する領域は、例えば、ロボットの設置場所を最適化するための有効な情報となる。また、誤差のばらつきおよび誤差のバイアスが存在する領域の有無の情報は、カメラを追加する必要性があるか否かを判断するための有効な情報となる。
<O.機能構成例>
次に、本実施の形態に従う情報処理システム1の機能構成例について説明する。
次に、本実施の形態に従う情報処理システム1の機能構成例について説明する。
図38は、本実施の形態に従う情報処理システム1の機能構成例を示す模式図である。図38に示す各コンポーネントは、情報処理装置100のプロセッサ102が情報処理プログラム124を実行することで、実現されてもよい。
図38を参照して、情報処理装置100は、コンポーネントとして、合成部150と、決定部152と、第1の点群生成部154と、第2の点群生成部156と、探索部158と、評価部160と、出力部164と、最適化部166とを含む。
合成部150は、同次変換行列TC
Tを用いて、基準カメラ10Cおよびターゲットカメラ10Tが撮像して得られる2つの画像を合成画像に変換する。合成部150は、ROI点群抽出処理(ステップS3)の合成画像を生成する処理を実行する。
決定部152は、基準カメラ10Cで物体20を撮像し得られる画像に基づいて計算されるマーカ22の位置および姿勢と、ターゲットカメラ10Tで物体20を撮像し得られる画像に基づいて計算されるマーカ22の位置および姿勢との差に基づいて、同次変換行列TC
Tを決定する。決定部152は、ラフキャリブレーション処理(ステップS1)を実行する。
第1の点群生成部154は、物体20の情報(CAD情報30)に基づいて生成された点群からCAD由来点群36を抽出する。第1の点群生成部154は、CAD由来点群生成処理(ステップS3)を実行する。
第2の点群生成部156は、合成画像に含まれる点群のうち、マーカ22を基準として決定されるROI50に含まれるROI点群56を抽出する。第2の点群生成部156は、ROI点群抽出処理(ステップS3)のROIを決定する処理およびROI点群を抽出する処理を実行する。
探索部158は、選択されたCAD由来点群36中のキー点に対応する、ROI点群56中のキー点を探索する。探索部158は、探索したキー点ペアの形状寸法を計算する。探索部158は、CAD由来点群のキー点ペアの形状寸法およびROI点群のキー点ペアの形状寸法を計算する。探索部158は、アイデンティフィケーション処理(ステップS4)を実行する。
評価部160は、探索部158により計算されたキー点ペアの形状寸法に基づいて精度を計算する。評価部160は、精度を計算するための計算部162を含んでもよい。評価部160は、精度評価処理(ステップS5)を実行する。
出力部164は、評価部160による計算結果を出力する。出力部164は、精度評価結果を出力する処理(ステップS6)を実行する。
出力部164は、精度空間分布を生成および出力してもよい。出力部164は、精度と座標との対応付け(ステップS9)、精度空間分布の計算(ステップS11)、および、精度空間分布の可視化(ステップS12)を実行する。
最適化部166は、CAD由来点群36のキー点ペア40とROI点群56のキー点ペア60との形状寸法の差が小さくなるように、同次変換行列TC
Tを最適化する。最適化部166は、ファインチューニング処理(ステップS7)を実行する。
<P.世界座標系の設定>
次に、任意の世界座標系を設定する処理について説明する。ラフキャリブレーション処理またはファインチューニング処理によって、カメラ座標系12間の対応関係が決定された後、リファレンス物体20を用いて、任意の位置に世界座標系が設定されてもよい。
次に、任意の世界座標系を設定する処理について説明する。ラフキャリブレーション処理またはファインチューニング処理によって、カメラ座標系12間の対応関係が決定された後、リファレンス物体20を用いて、任意の位置に世界座標系が設定されてもよい。
図39は、本実施の形態に従う情報処理システムにおける任意の世界座標系を設定する方法を説明するための図である。図39を参照して、カメラ10-1,10-2,10-3が空間SPに配置されている。
例えば、カメラ10-1が基準カメラであり、カメラ10-2,10-3がターゲットカメラであるとする。ラフキャリブレーション処理またはファインチューニング処理によって、カメラ10-1(のカメラ座標系)からカメラ10-2(のカメラ座標系)への同次変換行列T1
2が決定されている。同様に、カメラ10-1(のカメラ座標系)からカメラ10-3(のカメラ座標系)への同次変換行列T1
3が決定されている。
まず、カメラ10-1~10-3のそれぞれの視野のうち少なくとも一部に含まれるようにリファレンス物体20が配置される。リファレンス物体20は、ユーザが世界座標系を設定したい位置に配置される。リファレンス物体20は、CAD情報に基づいて予め設定されるCAD正準座標系21を有している。レファアレンス物体20のCAD正準座標系21が世界座標系として用いられる。
レファアレンス物体20をカメラ10-1~10-3で撮像して画像に基づいて、各カメラ10のカメラ座標系におけるCAD正準座標系21の位置および姿勢が計算される。CAD正準座標系21の位置および姿勢は、レファアレンス物体20のマーカ22が配置された面(有効面)を基準として決定される。
基準カメラであるカメラ10-1で撮像した画像に基づいて計算されたCAD正準座標系21の位置および姿勢は、そのまま世界座標系として設定されてもよい。
基準カメラであるカメラ10-1の視野内にレファアレンス物体20が存在せず、カメラ10-2またはカメラ10-3の視野内にレファアレンス物体20が存在する場合には、同次変換行列を用いて、世界座標系が決定されてもよい。より具体的には、カメラ10-2またはカメラ10-3で撮像した画像に基づいて計算されたCAD正準座標系21の位置および姿勢は、同次変換行列を用いて、カメラ10-1のカメラ座標系の位置および姿勢に変換される。このように、世界座標系は、基準カメラのカメラ座標系を経由して決定されてもよい。
なお、世界座標系を設定しない場合には、基準カメラのカメラ座標系を世界座標系として用いることができる。
<Q.変形例>
上述の説明においては、2次元マーカの一例であるAprilTagを用いる構成例を説明したが、マーカ22は、AprilTagに限られず、任意のAR(Augmented Reality)マーカを用いることができる。ARマーカは、例えば、AR開発ライブラリの一例である「ARToolKit」を用いて生成される。マーカ22は、任意のQRコード(登録商標)であってもよい。
上述の説明においては、2次元マーカの一例であるAprilTagを用いる構成例を説明したが、マーカ22は、AprilTagに限られず、任意のAR(Augmented Reality)マーカを用いることができる。ARマーカは、例えば、AR開発ライブラリの一例である「ARToolKit」を用いて生成される。マーカ22は、任意のQRコード(登録商標)であってもよい。
上述のラフキャリブレーション処理において用いられるマーカ22と、それ以外の処理において用いられるマーカ22とは別のものであってもよい。すなわち、ラフキャリブレーション処理においては、基準カメラ10Cのカメラ座標系12Cからターゲットカメラ10Tのカメラ座標系12Tへの同次変換行列TC
Tを決定できれば、どのような方法が採用されてもよい。そのため、任意の機械学習済みモデルを用いて、同次変換行列TC
Tが決定されてもよい。
上述の説明においては、情報処理装置100が主たる処理を実行する構成例を示したが、複数の情報処理装置100が連係して処理を実行してもよい。また、クラウド上のコンピューティングリソースを用いて、一部または全部の処理を実行してもよい。
<R.付記>
上述したような本実施の形態は、以下のような技術思想を含む。
上述したような本実施の形態は、以下のような技術思想を含む。
[構成1]
リファレンスマーカ(22)が配置されたリファレンス物体(20)を第1のカメラ(10C)で撮像して得られる第1の画像と前記リファレンス物体を第2のカメラ(10T)で撮像して得られる第2の画像とを、前記第1のカメラの第1のカメラ座標系と前記第2のカメラの第2のカメラ座標系との対応関係に基づいて、同一の座標系上に合成して合成画像を生成する合成部(S2;150)と、
前記リファレンス物体の情報(30)に基づいて生成された点群のうち、前記リファレンスマーカを基準として決定される第1の領域(34)に含まれる第1の点群(36)を抽出する第1の点群生成部(S3;154)と、
前記合成画像に含まれる点群のうち、前記リファレンスマーカを基準として決定される第2の領域(50)に含まれる第2の点群(56)を抽出する第2の点群生成部(S2;156)と、
前記第1の点群のうちから選択される第1の点ペア(40)について、前記第2の点群において前記第1の点ペアに対応する第2の点ペア(60)を探索する探索部(S4;158)と、
前記第1の点ペアおよび前記第2の点ペアの形状寸法に基づいて、前記対応関係の精度を評価する評価部(S6;160)とを備える、情報処理装置。
[構成2]
前記第1のカメラで前記リファレンス物体を撮像して得られる画像に基づいて計算される前記リファレンスマーカの位置および姿勢と、前記第2のカメラで前記リファレンス物体を撮像して得られる画像に基づいて計算される前記リファレンスマーカの位置および姿勢との差に基づいて、前記対応関係を決定する決定部(S1;152)をさらに備える、構成1に記載の情報処理装置。
前記第1のカメラで前記リファレンス物体を撮像して得られる画像に基づいて計算される前記リファレンスマーカの位置および姿勢と、前記第2のカメラで前記リファレンス物体を撮像して得られる画像に基づいて計算される前記リファレンスマーカの位置および姿勢との差に基づいて、前記対応関係を決定する決定部(S1;152)をさらに備える、構成1に記載の情報処理装置。
[構成3]
前記第1の点ペアと前記第2の点ペアとの形状寸法の差が小さくなるように、前記対応関係を最適化する最適化部(S7;166)をさらに備える、構成1または2に記載の情報処理装置。
前記第1の点ペアと前記第2の点ペアとの形状寸法の差が小さくなるように、前記対応関係を最適化する最適化部(S7;166)をさらに備える、構成1または2に記載の情報処理装置。
[構成4]
前記探索部は、前記第1の点ペアの各点に対応する前記第2の点群における座標を決定し、当該決定された座標から予め定められた距離内に存在する1または複数の点の重心(64)に基づいて、前記第2の点ペアの各点を決定する、構成1~3のいずれか1項に記載の情報処理装置。
前記探索部は、前記第1の点ペアの各点に対応する前記第2の点群における座標を決定し、当該決定された座標から予め定められた距離内に存在する1または複数の点の重心(64)に基づいて、前記第2の点ペアの各点を決定する、構成1~3のいずれか1項に記載の情報処理装置。
[構成5]
前記第1の領域および前記第2の領域の各々は、前記リファレンス物体の前記リファレンスマーカが配置された面(24)を基準として決定される、構成1~4のいずれか1項に記載の情報処理装置。
前記第1の領域および前記第2の領域の各々は、前記リファレンス物体の前記リファレンスマーカが配置された面(24)を基準として決定される、構成1~4のいずれか1項に記載の情報処理装置。
[構成6]
前記形状寸法は、長さおよび角度を含み、
前記評価部は、長さの誤差についてのヒストグラム(214)と、角度の誤差についてのヒストグラム(224)とを出力する、構成1~5のいずれか1項に記載の情報処理装置。
前記形状寸法は、長さおよび角度を含み、
前記評価部は、長さの誤差についてのヒストグラム(214)と、角度の誤差についてのヒストグラム(224)とを出力する、構成1~5のいずれか1項に記載の情報処理装置。
[構成7]
前記評価部は、前記第2の点ペアの形状寸法の誤差の計算を繰り返すことで、形状寸法の誤差のばらつきを計算する、構成1~6のいずれか1項に記載の情報処理装置。
前記評価部は、前記第2の点ペアの形状寸法の誤差の計算を繰り返すことで、形状寸法の誤差のばらつきを計算する、構成1~6のいずれか1項に記載の情報処理装置。
[構成8]
前記第1の点ペアは、前記リファレンス物体の形状的な特徴に基づいて選択される、構成1~7のいずれか1項に記載の情報処理装置。
前記第1の点ペアは、前記リファレンス物体の形状的な特徴に基づいて選択される、構成1~7のいずれか1項に記載の情報処理装置。
[構成9]
リファレンスマーカ(22)が配置されたリファレンス物体(20)を第1のカメラ(10C)で撮像して得られる第1の画像と前記リファレンス物体を第2のカメラ(10T)で撮像して得られる第2の画像とを、前記第1のカメラの第1のカメラ座標系と前記第2のカメラの第2のカメラ座標系との対応関係に基づいて、同一の座標系上に合成して合成画像を生成すること(S2)と、
前記リファレンス物体の情報(30)に基づいて生成された点群のうち、前記リファレンスマーカを基準として決定される第1の領域(34)に含まれる第1の点群(36)を抽出すること(S3)と、
前記合成画像に含まれる点群のうち、前記リファレンスマーカを基準として決定される第2の領域(50)に含まれる第2の点群(56)を抽出すること(S2)と、
前記第1の点群のうちから選択される第1の点ペア(40)について、前記第2の点群において前記第1の点ペアに対応する第2の点ペア(60)を探索すること(S4)と、
前記第1の点ペアおよび前記第2の点ペアの形状寸法に基づいて、前記対応関係の精度を評価すること(S6)とを備える、情報処理方法。
[構成10]
コンピュータ(100)に、
リファレンスマーカ(22)が配置されたリファレンス物体(20)を第1のカメラ(10C)で撮像して得られる第1の画像と前記リファレンス物体を第2のカメラ(10T)で撮像して得られる第2の画像とを、前記第1のカメラの第1のカメラ座標系と前記第2のカメラの第2のカメラ座標系との対応関係に基づいて、同一の座標系上に合成して合成画像を生成すること(S2)と、
前記リファレンス物体の情報(30)に基づいて生成された点群のうち、前記リファレンスマーカを基準として決定される第1の領域(34)に含まれる第1の点群を抽出すること(S3)と、
前記合成画像に含まれる点群のうち、前記リファレンスマーカを基準として決定される第2の領域(50)に含まれる第2の点群(56)を抽出すること(S2)と、
前記第1の点群のうちから選択される第1の点ペアについて、前記第2の点群において前記第1の点ペアに対応する第2の点ペア(60)を探索すること(S4)と、
前記第1の点ペアおよび前記第2の点ペアの形状寸法に基づいて、前記対応関係の精度を評価すること(S6)とを実行させる、情報処理プログラム(124)。
<S.利点>
本実施の形態に従う情報処理システム1によれば、予め形状などが定義されたリファレンス物体を用いて、レジストレーションを行うことで、レジストレーションの結果である同次変換行列の精度を評価できる。評価される精度は、絶対誤差に基づくものであるので、ロボットの安全設計を担保できる。
本実施の形態に従う情報処理システム1によれば、予め形状などが定義されたリファレンス物体を用いて、レジストレーションを行うことで、レジストレーションの結果である同次変換行列の精度を評価できる。評価される精度は、絶対誤差に基づくものであるので、ロボットの安全設計を担保できる。
本実施の形態に従う情報処理システム1によれば、対象の空間において複数の計測位置にリファレンス物体をそれぞれ配置して精度を計算することで、精度空間分布を生成できる。精度空間分布を用いることで、カメラ位置の最適化およびカメラ追加の要否検討などを効率化できる。
今回開示された実施の形態はすべての点で例示であって制限的なものではないと考えられるべきである。本発明の範囲は、上記した説明ではなく、請求の範囲によって示され、請求の範囲と均等の意味および範囲内でのすべての変更が含まれることが意図される。
10 カメラ、10C 基準カメラ、10T ターゲットカメラ、12,12C,12T カメラ座標系、14C,14T 視野、20,20A,20B,20C,20D,20E リファレンス物体(物体)、21 CAD正準座標系、22 マーカ、24 有効面、26 マーカ座標系、28 切欠部、29 面取り部、30 CAD情報、32 3次元点群、34 対象領域、36 CAD由来点群、40,60 キー点ペア、42,62 キー点、50 ROI、56 ROI点群、64 重心、100 情報処理装置、102 プロセッサ、104 メモリ、106 入力インターフェイス、108 入力装置、110 表示インターフェイス、112 ディスプレイ、114 カメラインターフェイス、116 ネットワークコントローラ、120 ストレージ、122 OS、124 情報処理プログラム、150 合成部、152 決定部、154 第1の点群生成部、156 第2の点群生成部、158 探索部、160 評価部、162 計算部、164 出力部、166 最適化部、200 出力画面、210,220 情報、212,222 統計情報、214,224 ヒストグラム、250,252,254 四角錐、260 主柱、261,262,263,264,265 平面板、270 合成点群、271,273,274,275 支持部材、282,284 領域。
Claims (10)
- リファレンスマーカが配置されたリファレンス物体を第1のカメラで撮像して得られる第1の画像と前記リファレンス物体を第2のカメラで撮像して得られる第2の画像とを、前記第1のカメラの第1のカメラ座標系と前記第2のカメラの第2のカメラ座標系との対応関係に基づいて、同一の座標系上に合成して合成画像を生成する合成部と、
前記リファレンス物体の情報に基づいて生成された点群のうち、前記リファレンスマーカを基準として決定される第1の領域に含まれる第1の点群を抽出する第1の点群生成部と、
前記合成画像に含まれる点群のうち、前記リファレンスマーカを基準として決定される第2の領域に含まれる第2の点群を抽出する第2の点群生成部と、
前記第1の点群のうちから選択される第1の点ペアについて、前記第2の点群において前記第1の点ペアに対応する第2の点ペアを探索する探索部と、
前記第1の点ペアおよび前記第2の点ペアの形状寸法に基づいて、前記対応関係の精度を評価する評価部とを備える、情報処理装置。 - 前記第1のカメラで前記リファレンス物体を撮像して得られる画像に基づいて計算される前記リファレンスマーカの位置および姿勢と、前記第2のカメラで前記リファレンス物体を撮像して得られる画像に基づいて計算される前記リファレンスマーカの位置および姿勢との差に基づいて、前記対応関係を決定する決定部をさらに備える、請求項1に記載の情報処理装置。
- 前記第1の点ペアと前記第2の点ペアとの形状寸法の差が小さくなるように、前記対応関係を最適化する最適化部をさらに備える、請求項1に記載の情報処理装置。
- 前記探索部は、前記第1の点ペアの各点に対応する前記第2の点群における座標を決定し、当該決定された座標から予め定められた距離内に存在する1または複数の点の重心に基づいて、前記第2の点ペアの各点を決定する、請求項1~3のいずれか1項に記載の情報処理装置。
- 前記第1の領域および前記第2の領域の各々は、前記リファレンス物体の前記リファレンスマーカが配置された面を基準として決定される、請求項1~3のいずれか1項に記載の情報処理装置。
- 前記形状寸法は、長さおよび角度を含み、
前記評価部は、長さの誤差についてのヒストグラムと、角度の誤差についてのヒストグラムとを出力する、請求項1~3のいずれか1項に記載の情報処理装置。 - 前記評価部は、前記第2の点ペアの形状寸法の誤差の計算を繰り返すことで、形状寸法の誤差のばらつきを計算する、請求項1~3のいずれか1項に記載の情報処理装置。
- 前記第1の点ペアは、前記リファレンス物体の形状的な特徴に基づいて選択される、請求項1~3のいずれか1項に記載の情報処理装置。
- リファレンスマーカが配置されたリファレンス物体を第1のカメラで撮像して得られる第1の画像と前記リファレンス物体を第2のカメラで撮像して得られる第2の画像とを、前記第1のカメラの第1のカメラ座標系と前記第2のカメラの第2のカメラ座標系との対応関係に基づいて、同一の座標系上に合成して合成画像を生成することと、
前記リファレンス物体の情報に基づいて生成された点群のうち、前記リファレンスマーカを基準として決定される第1の領域に含まれる第1の点群を抽出することと、
前記合成画像に含まれる点群のうち、前記リファレンスマーカを基準として決定される第2の領域に含まれる第2の点群を抽出することと、
前記第1の点群のうちから選択される第1の点ペアについて、前記第2の点群において前記第1の点ペアに対応する第2の点ペアを探索することと、
前記第1の点ペアおよび前記第2の点ペアの形状寸法に基づいて、前記対応関係の精度を評価することとを備える、情報処理方法。 - コンピュータに、
リファレンスマーカが配置されたリファレンス物体を第1のカメラで撮像して得られる第1の画像と前記リファレンス物体を第2のカメラで撮像して得られる第2の画像とを、前記第1のカメラの第1のカメラ座標系と前記第2のカメラの第2のカメラ座標系との対応関係に基づいて、同一の座標系上に合成して合成画像を生成することと、
前記リファレンス物体の情報に基づいて生成された点群のうち、前記リファレンスマーカを基準として決定される第1の領域に含まれる第1の点群を抽出することと、
前記合成画像に含まれる点群のうち、前記リファレンスマーカを基準として決定される第2の領域に含まれる第2の点群を抽出することと、
前記第1の点群のうちから選択される第1の点ペアについて、前記第2の点群において前記第1の点ペアに対応する第2の点ペアを探索することと、
前記第1の点ペアおよび前記第2の点ペアの形状寸法に基づいて、前記対応関係の精度を評価することとを実行させる、情報処理プログラム。
Applications Claiming Priority (2)
| Application Number | Priority Date | Filing Date | Title |
|---|---|---|---|
| JP2023150219 | 2023-09-15 | ||
| JP2023-150219 | 2023-09-15 |
Publications (1)
| Publication Number | Publication Date |
|---|---|
| WO2025057751A1 true WO2025057751A1 (ja) | 2025-03-20 |
Family
ID=95021268
Family Applications (1)
| Application Number | Title | Priority Date | Filing Date |
|---|---|---|---|
| PCT/JP2024/030928 Ceased WO2025057751A1 (ja) | 2023-09-15 | 2024-08-29 | 情報処理装置、情報処理方法および情報処理プログラム |
Country Status (2)
| Country | Link |
|---|---|
| TW (1) | TW202514536A (ja) |
| WO (1) | WO2025057751A1 (ja) |
Citations (2)
| Publication number | Priority date | Publication date | Assignee | Title |
|---|---|---|---|---|
| JP2017106749A (ja) * | 2015-12-07 | 2017-06-15 | 株式会社Hielero | 点群データ取得システム及びその方法 |
| JP2023022517A (ja) * | 2021-08-03 | 2023-02-15 | 株式会社東芝 | 計測システム及び計測プログラム |
-
2024
- 2024-08-28 TW TW113132449A patent/TW202514536A/zh unknown
- 2024-08-29 WO PCT/JP2024/030928 patent/WO2025057751A1/ja not_active Ceased
Patent Citations (2)
| Publication number | Priority date | Publication date | Assignee | Title |
|---|---|---|---|---|
| JP2017106749A (ja) * | 2015-12-07 | 2017-06-15 | 株式会社Hielero | 点群データ取得システム及びその方法 |
| JP2023022517A (ja) * | 2021-08-03 | 2023-02-15 | 株式会社東芝 | 計測システム及び計測プログラム |
Also Published As
| Publication number | Publication date |
|---|---|
| TW202514536A (zh) | 2025-04-01 |
Similar Documents
| Publication | Publication Date | Title |
|---|---|---|
| JP7646762B2 (ja) | ビジョンシステムにより画像特徴におけるエッジと法線を同時に考慮するためのシステム及び方法 | |
| JP6216508B2 (ja) | 3dシーンにおける3d物体の認識および姿勢決定のための方法 | |
| JP5251080B2 (ja) | 物体認識方法 | |
| JP5430456B2 (ja) | 幾何特徴抽出装置、幾何特徴抽出方法、及びプログラム、三次元計測装置、物体認識装置 | |
| JP4900204B2 (ja) | 物体認識方法 | |
| US10115035B2 (en) | Vision system and analytical method for planar surface segmentation | |
| JP5092711B2 (ja) | 物体認識装置およびロボット装置 | |
| KR20180014677A (ko) | 3d 이미지 데이터에서 3d 포즈와 기생포인트 제거의 스코어링을 개선하는 시스템 및 방법 | |
| CN119832043B (zh) | 用于生成点云直方图的方法和装置 | |
| CN112927353A (zh) | 基于二维目标检测和模型对齐的三维场景重建方法、存储介质及终端 | |
| CN112712062A (zh) | 基于解耦截断物体的单目三维物体检测方法和装置 | |
| CN117994329A (zh) | 一种基于立体视觉点云的目标定位方法及系统 | |
| Sølund et al. | A large-scale 3D object recognition dataset | |
| KR20150002157A (ko) | 단일 깊이 영상을 이용한 내용기반 3차원 모델 검색 방법, 이를 수행하는 3차원 모델 검색 서버 및 컴퓨터로 판독 가능한 기록매체 | |
| JP5104248B2 (ja) | 物体認識装置およびロボット装置 | |
| CN120543508B (zh) | 元器件倾斜检测方法、装置、系统和可读存储介质 | |
| Wan et al. | A performance comparison of feature detectors for planetary rover mapping and localization | |
| JP2025042978A (ja) | 情報処理装置、情報処理方法および情報処理プログラム | |
| Hillemann et al. | Novel view synthesis with neural radiance fields for industrial robot applications | |
| CN110728222B (zh) | 一种用于机械臂抓取系统中目标物体的位姿估计方法 | |
| Pohudina et al. | Possibilities of position determination | |
| CN119228865A (zh) | 一种基于物体图像的物体尺寸测量方法及装置 | |
| TW202514536A (zh) | 資訊處理裝置、資訊處理方法及資訊處理程式 | |
| Hołowko et al. | Color-based algorithm for automatic merging of multiview 3D point clouds | |
| Chen et al. | Precise 6dof localization of robot end effectors using 3d vision and registration without referencing targets |
Legal Events
| Date | Code | Title | Description |
|---|---|---|---|
| 121 | Ep: the epo has been informed by wipo that ep was designated in this application |
Ref document number: 24865253 Country of ref document: EP Kind code of ref document: A1 |
|
| NENP | Non-entry into the national phase |
Ref country code: DE |