WO2025009094A1 - ロジックモデル構築支援装置、ロジックモデル構築支援方法およびロジックモデル構築支援システム - Google Patents
ロジックモデル構築支援装置、ロジックモデル構築支援方法およびロジックモデル構築支援システム Download PDFInfo
- Publication number
- WO2025009094A1 WO2025009094A1 PCT/JP2023/024926 JP2023024926W WO2025009094A1 WO 2025009094 A1 WO2025009094 A1 WO 2025009094A1 JP 2023024926 W JP2023024926 W JP 2023024926W WO 2025009094 A1 WO2025009094 A1 WO 2025009094A1
- Authority
- WO
- WIPO (PCT)
- Prior art keywords
- logic model
- model construction
- construction support
- node
- quantitative value
- Prior art date
- Legal status (The legal status is an assumption and is not a legal conclusion. Google has not performed a legal analysis and makes no representation as to the accuracy of the status listed.)
- Ceased
Links
Images













Classifications
-
- G—PHYSICS
- G06—COMPUTING OR CALCULATING; COUNTING
- G06Q—INFORMATION AND COMMUNICATION TECHNOLOGY [ICT] SPECIALLY ADAPTED FOR ADMINISTRATIVE, COMMERCIAL, FINANCIAL, MANAGERIAL OR SUPERVISORY PURPOSES; SYSTEMS OR METHODS SPECIALLY ADAPTED FOR ADMINISTRATIVE, COMMERCIAL, FINANCIAL, MANAGERIAL OR SUPERVISORY PURPOSES, NOT OTHERWISE PROVIDED FOR
- G06Q10/00—Administration; Management
- G06Q10/06—Resources, workflows, human or project management; Enterprise or organisation planning; Enterprise or organisation modelling
- G06Q10/063—Operations research, analysis or management
Definitions
- the present invention relates to technology for supporting specific activities, such as organizational activities, and to technology for supporting the construction of logic models that use social impact indicators to evaluate the activities.
- SDGs Sustainable Development Goals
- the SDGs are expected to achieve sustainable development in a balanced and integrated manner in the three aspects of society, environment, and economy. For this reason, it is necessary to consider the impact and effect on the three aspects in the activities of various organizations, including corporate business. To do this, it is necessary to predict the impact of business activities on the value axes of society, environment, and economy, and to carry out activities to improve value.
- indicators corresponding to the environment and economy such as carbon dioxide emissions, which belong to environmental value, and corporate profits, which belong to economic value, can be objectively quantified by measuring carbon dioxide and reporting corporate activities, and this has already been implemented.
- social value includes objective indicators such as inequality and fairness, it also includes subjective aspects such as the continuity of local culture through regional development, the quality of life of local residents, and their sense of happiness.
- subjective indicators must take into account changes over time. For example, even if the subjective attachment to a landscape decreases due to the construction of a facility, it is possible that this will ease as people become accustomed to it.
- social impact indicators are used to evaluate the impact of policies and investments on society as social value in policy decisions by local governments and investment and loan decisions by financial institutions.
- Patent Document 1 has been proposed as a technology related to the above background.
- Patent Document 1 discloses a technology that can "stimulate discussion," which is an example of an activity.
- the creative support server 10 from among multiple nodes included in a tree diagram generated using nodes indicating opinions created by each user to derive a solution from the issue under discussion and links indicating the relationships between the nodes, traces the links from the solution node indicating the solution to the issue node indicating the issue, and selects each node included between the solution node and the issue node, calculates the contribution that each node made to deriving the solution using the type of each selected node and the type of link, and identifies nodes whose contribution is equal to or greater than a threshold.”
- Patent Document 1 the contribution of each node in a tree diagram to the discussion is evaluated.
- it is necessary to ensure the validity of the above-mentioned logic model. If the validity is insufficient, the predicted results of the social impact cannot be trusted when constructing the logic model, and there is a risk of discrepancies in the predicted results (different from what was expected).
- the base logic model is constructed while being modified through trial and error. Therefore, the objective of the present invention is to ensure the validity of the logic model used to evaluate social impact indicators constructed through trial and error.
- the present invention provides a logic model construction support device that includes a processor that executes a program and a storage device that stores the program,
- the processor is a logic model construction support device that executes, in accordance with the program, a logic model construction process for constructing a directed graph having multiple hierarchies represented by edges connecting nodes, a selection process for accepting a selection of a node for the constructed directed graph, a modification process for modifying a weighting coefficient corresponding to the edge connecting to the selected node, a simulation process for creating variation information regarding a first quantitative value of a social impact index of the logic model before the weighting coefficient is modified, a second quantitative value of the social impact index of the logic model after the weighting coefficient is modified, and the difference between the first quantitative value and the second quantitative value, and a variation information output process for outputting the variation information.
- Another aspect of the logic model construction support device of the present invention is a logic model construction support device having a processor that executes a program and a storage device that stores the program, in which the processor executes, in accordance with the program, a logic model construction process that constructs a directed graph having multiple hierarchies represented by edges connecting nodes, a display process that displays the constructed directed graph, a selection process that accepts a selection of a node for the displayed directed graph, a detailed display process that displays details of the selected node and the edges connecting to the node, a change process that changes a weighting coefficient corresponding to the displayed edge, a simulation process that creates a first quantitative value of the social impact index of the logic model before the change in the weighting coefficient, a second quantitative value of the social impact index of the logic model after the change in the weighting coefficient, and fluctuation information related to the difference between the first quantitative value and the second quantitative value, and a fluctuation information display process that displays the fluctuation information.
- the present invention also includes a logic model construction support method using a logic model construction support device, a program that causes this to function as a computer, or a storage medium that stores the program, and a logic model construction support system that includes the logic model construction support device.
- the present invention ensures the validity of the logic model when it is constructed.
- FIG. 1 is an explanatory diagram illustrating an example of a system configuration of a logic model building support system 100 according to a first embodiment.
- 1 is a functional block diagram of a logic model construction support device according to a first embodiment
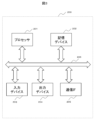
- FIG. 2 is a hardware configuration diagram of a computer that realizes each device according to the first embodiment.
- 4 is a flowchart showing a logic model building support process according to the first embodiment
- FIG. 2 is a diagram showing a logic model used in the first embodiment.
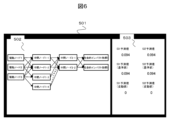
- 13 is a screen display example in step S32 in the first embodiment.
- 13 is a screen display example in step S34 in the first embodiment.
- 13 is a screen display example in step S35 in the first embodiment.
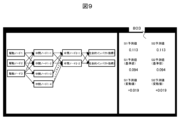
- 13 is a screen display example in step S37 in the first embodiment.
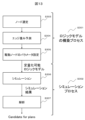
- FIG. 13 is a flowchart showing a logic model building support process according to the second embodiment; 13 is a graph showing a node influence degree in the second embodiment. 13 is a screen display example in step S32-1 in the second embodiment. 13 is a flowchart of a social impact index quantification process according to a third embodiment.
- FIG. 13 is a diagram showing nodes selected in a node selection process S303 according to the third embodiment.
- FIG. 13 is a diagram showing a logic model in which edges are connected according to the third embodiment;
- FIG. 13 is a diagram showing a logic model in which weights are added to each edge according to the third embodiment.
- FIG. 13 is a diagram showing a state in which a part of a logic model in which weights are added to each edge according to the third embodiment is extracted.
- FIG. 13 is a diagram illustrating an example of parameter settings of a driving node according to a third embodiment.
- FIG. 13 is a diagram for explaining a quantification process according to a third embodiment.
- FIG. 11 is a diagram illustrating parameters of a driving node according to a third embodiment.
- FIG. 13 is a graph showing the number of occurrences of policy requests according to the third embodiment.
- FIG. 13 is a graph showing the number of occurrences of policy requests according to the third embodiment.
- FIG. 13 is a diagram showing a simulation result in a simulation process S306 according to the third embodiment.
- the activity is to support decision-making such as the formulation of measures and consensus building for the measures.
- a logic model construction support device having a processor that executes a program and a storage device that stores the program is adopted, and the processor expresses a logic model used for evaluating a social impact index for evaluating the activities of an organization according to the program, and performs a display process that displays a directed graph having multiple hierarchies represented by edges connecting nodes that constitute the logic model, a selection process that accepts selection of a node for the displayed directed graph, a detailed display process that displays details of the selected node and the edges connected to the node, a change process that changes a weighting factor corresponding to the displayed edge in response to a user's operation, a simulation process that creates a first quantitative value of the social impact index of the logic model before the weighting factor is changed, a second quantitative value of the social impact index of the logic model after the weighting factor is changed,
- Example 1 is an example of an implementation form in which a logic model is constructed in a local government or the like with the aim of improving the social impact index, which is a long-term goal.
- support is provided for the formulation of measures to improve the social impact index of the target area.
- this example supports the realization of better measures.
- the extent to which the social impact index will change due to a measure is calculated through a logic model, thereby enabling the provision of, for example, a measure with the highest improvement prediction.
- FIG. 1 is an explanatory diagram showing an example of the system configuration of a logic model construction support system 100 according to a first embodiment. This system configuration is also common to the second and third embodiments described below.
- the logic model construction support system 100 includes a plurality of first information terminals 101-1 to n, a second information terminal 102, and a logic model construction support device 103, which are connected to each other via a network 105.
- the network 105 can be realized by the Internet, a LAN (Local Area Network), a WAN (Wide Area Network), or the like.
- the first information terminals 101-1 to 101-n are information terminals used by participant 1 to participant n (n is an integer equal to or greater than 1; hereafter collectively referred to as participants), respectively, and acquire information on the logic model structure envisioned by the participants and indicators they consider important, and transmit this to the logic model construction support device 103.
- participants information terminals used by participant 1 to participant n (n is an integer equal to or greater than 1; hereafter collectively referred to as participants), respectively, and acquire information on the logic model structure envisioned by the participants and indicators they consider important, and transmit this to the logic model construction support device 103.
- this can be realized by an information processing device (computer) such as a personal computer or a communication device such as a smart device.
- a participant refers to someone who takes part in the organization's activities (policies). For example, if the organization is a local government, this would be residents and general staff.
- the second information terminal 102 is an information terminal used by a decision maker such as a local government, and displays the logic model being constructed from the logic model construction support device 103 and simulation results including quantitative values of social impact indicators.
- a decision maker refers to a person who decides on the activities (policies) of an organization. For example, if the organization is a local government, it is the head or a senior official.
- the logic model construction support device 103 also receives the structures of the participants' logic models and indicators that they consider important from at least one of the first information terminals 101-1 to 101-n. Then, the logic model construction support device 103 executes the following processes.
- a construction process that constructs a directed graph A selection process that accepts a selection of nodes for the directed graph; A modification process that changes the weighting coefficients corresponding to the edges connected to the selected nodes; A simulation process that creates variation information regarding a first quantitative value of the social impact index of the logic model before the weighting coefficient is changed, a second quantitative value of the social impact index of the logic model after the weighting coefficient is changed, and the difference between the first quantitative value and the second quantitative value; A variation information output process that outputs the variation information.
- the logic model construction support device 103 is further capable of executing an output process that outputs the constructed directed graph and a detailed output process that outputs details of the selected nodes and the edges connected to the nodes.
- the fluctuation information output process, output process, and detailed output process include each display process that displays the output target. Furthermore, the various display processes described in this specification are examples of output processes. For this reason, other forms of output processing such as notification and transmission can also be adopted in the present invention. Furthermore, the fluctuation information output process may also output the first quantitative value and the second quantitative value.
- the logic model construction support device 103 may be realized as a social impact index quantification device that calculates and quantifies a social impact index.
- the logic model construction support device 103 also transmits quantifiable logic model data 1041 and the results of information processing (e.g., the quantitative value of the social impact index) to the second information terminal 102.
- the database 104 stores data used by the logic model construction support device 103 (logic model data 1041 and social impact index data 1042).
- the database 104 may be realized as a storage device of the logic model construction support device 103, or may be connected to the logic model construction support device 103 via the network 105.
- the logic model construction support device 103 may also be realized by an information processing device (computer) such as a server.
- FIG. 2 is a functional block diagram of a logic model construction support device 103 according to Example 1.
- the logic model construction support device 103 has a communication unit 1031, a directed graph generation unit 1032, a simulation unit 1033, and a memory unit 1040.
- the memory unit 1040 in FIG. 2 corresponds to the database 104 in FIG. 1, and although the logic model construction support device 103 is configured to have the memory unit 1040, the memory unit 1040 may be configured separately from the logic model construction support device 103.
- the communication unit 1031 connects to the network 105 and communicates with the first information terminals 101-1 to 101-n and the second information terminal 102.
- the directed graph generation unit 1032 generates a directed graph having multiple hierarchies represented by edges that connect nodes in the logic model.
- the simulation unit 1033 also calculates the quantitative value of the social impact index for the policy based on the generated directed graph.
- the simulation unit 1033 also calculates the fluctuation value of the quantitative value of the social impact index.
- the storage unit 1040 stores logic model data 1041 and social impact index data 1042.
- the logic model data 1041 includes a logic model. This includes a logic model that is the basis for construction, a logic model under construction that is modified in response to operations on the logic model, and a constructed logic model.
- the social impact index data 1042 indicates the social impact index of the logic model, and includes its quantitative value and its fluctuation value.
- the logic model data 1041 and the social impact index data 1042 may be treated as a single piece of information. In other words, these may be information in which the social impact index is associated with each piece of logic model data.
- FIG. 3 is a hardware configuration diagram of a computer that realizes each device according to the first embodiment.
- the computer 200 shown in FIG. 3 is common to the first information terminals 101-1 to 101-n, the second information terminal 102, and the logic model construction support device 103.
- the following describes the configuration unique to the logic model construction support device 103 that executes the main processing of this embodiment, and the configuration shared by each device.
- the computer 200 has a processor 201, a storage device 202, an input device 203, an output device 204, and a communication interface (communication IF) 205. These are connected to each other by a bus 206.
- the logic model construction support device 103 is realized by a server, the input device 203 and the output device 204 can be omitted.
- the processor 201 executes calculations in the computer 200 according to a program stored in the storage device 202.
- the storage device 202 is composed of a working area of the processor 201 and a storage medium or storage device (hereinafter simply referred to as a storage medium). The working area can be realized by a so-called memory.
- the storage medium can be realized by a non-temporary or temporary recording medium that stores various programs and data.
- the storage device 202 can be configured, for example, by a read only memory (ROM), a random access memory (RAM), a hard disk drive (HDD), or a flash memory.
- the storage device 202 of the logic model construction support device 103 stores a directed graph generation program, a simulation execution program, and a variation value calculation program as programs. These cause the processor 201 to execute the processes in the directed graph generation unit 1032 and the simulation unit 1033 in FIG. 2, respectively.
- the storage medium of the logic model construction support device 103 corresponds to the database 104 in FIG. 1 and the storage unit 1040 in FIG. 2. Therefore, the storage medium can be realized as a device separate from the logic model construction support device 103.
- the input device 203 accepts operations from users such as participants and decision makers. Examples of the input device 203 include a keyboard, mouse, touch panel, numeric keypad, scanner, and microphone.
- the output device 204 outputs data such as the results of processing by the processor 201. Examples of the output device 204 include a display, printer, and speaker.
- the communication IF 205 connects to the network 105, communicates with other devices, and transmits and receives logic data, various instructions, and data. In the logic model construction support device 103, the communication IF 205 corresponds to the communication unit 1031 in FIG. 2. This concludes the explanation of the configuration of the first embodiment, but like FIG. 1, FIGS. 2 and 3 are also common to the second and third embodiments described below.
- social impact indicators indicate the social impact created by activities such as policies.
- the degree of this social impact can be expressed as a numerical value (quantitative value).
- Social impact indicators target issues such as equality, life, health, nutrition, poverty, safety, and justice. Specific examples in the region also include subjective indicators such as residents' work attitudes and awareness of the SDGs.
- Social impact is also increasingly being used in finance such as ESG investment and social impact bonds to take into account the impact on society and the environment in investment decisions.
- Logic models can be expressed as a network model (e.g., a directed graph) made up of nodes and edges.
- the nodes represent various indicators
- the edges represent the causal relationships between the indicators.
- Logic models are also conceptual tools for clarifying the logic of social programs, and specifically, they can clarify the logic by which invested resources will affect the targeted social impact indicators.
- a typical logic model often consists of five main layers. Each layer is explained below.
- the first layer includes both resources and constraints for the policy.
- Resources are used when the policy is implemented, and include not only human resources, material resources, and financial resources, but also cultural resources. It is important to utilize these resources and generate effective social impact indicators within the constraints.
- the second layer, the activity layer, is the policy or the actions or activities for implementing the policy, including processes, tasks and actions.
- the third layer, the output layer, is the direct result of the activities carried out by the implementers.
- the results include business activities such as products and services provided, and ongoing support for the project.
- the fourth layer is the ripple effect of the output layer above, and refers to the indicators necessary to improve the social impact indicators.
- the ripple effects of "results” often include subjective indicators such as increased motivation, satisfaction, and awareness. In “results,” short-term and long-term effects may be treated separately.
- the fifth layer is the impact layer (social impact layer) is the final goal shared by the implementer or all related parties, and is an indicator of improvement toward solving social problems. In general, it is based on issues dealt with in the SDGs, such as correcting disparities, but depending on the organization, more local goals may be set. In addition, output or outcome indicators may be used as substitutes for social impact indicators. In this case, intermediate indicators are considered as targets.
- a logic model that allows the social impact index to be quantified is used. Specifically, the following process is performed.
- a weighting factor (a numerical value) is added to the edges of an existing logic model (directed graph) to calculate the quantitative value of the social impact index for activities in that logic model.
- the weight coefficients of the existing logic model are manipulated to modify the existing logic model (directed graph), thereby generating a new directed graph that represents the modified logic model.
- the modified logic model can be expressed as a logic model under construction.
- the difference (amount of change) between the quantitative value of the social impact index in the existing logic model and the quantitative value of the social impact index in the logic model being constructed is calculated as the fluctuation value.
- the presented information is not limited to the variation value (numerical value), and can be treated as variation information regarding the difference. For example, it includes specific numerical values, detailed information indicating the content of the change, and an outline indicating the summary thereof.
- an outline may be output to the first information terminals 101-1 to 101-n (participants), and detailed information may be output to the second information terminal 102 (decision maker). Furthermore, different information may be included for each of the first information terminals 101-1 to 101-n (participants). Furthermore, the detailed information may be information other than the variation value.
- logic model data 1041 The above existing logic models and the like are stored in the storage unit 1040 as logic model data 1041.
- the calculated quantitative values and fluctuation information are stored in the storage unit 1040 as social impact index data 1042. For this reason, the logic model is constructed in advance.
- At least two of the first information terminals 101-1 to 101-n and the second information terminal 102 can share the screens shown in Figures 6 to 9 and 12, which will be described later, and can perform operations on those screens.
- FIG. 4 is a flowchart showing the logic model construction support process according to the first embodiment.
- the premise of this flowchart is that the storage unit 1040 has stored an existing logic model in advance as logic model data 1041.
- the directed graph generating unit 1032 reads an existing logic model from the logic model data 1041 in the storage unit 1040 in response to an instruction from either the first information terminal 101-1 to n or the second information terminal 102.
- the directed graph generating unit 1032 may automatically read the logic model at a predetermined interval or the like.
- the storage unit 1040 is realized by a device separate from the logic model construction support device 103, the communication unit 1031 will receive the existing logic model.
- an existing logic model created in either the first information terminal 101-1 to n or the second information terminal 102 may be used.
- Figure 5 is a diagram showing an example of the logic model used in Example 1.
- the logic model is expressed in four layers, but the number of layers can be any number.
- the nodes in the input layer are represented as driving nodes
- the nodes in the impact layer are represented as social impact indicators
- the nodes from the activity layer to the outcome layer are represented as intermediate nodes. Note that this figure can also be treated as a directed graph as it is.
- edges connecting the nodes in Figure 5 are shown with solid and dashed lines. Of these, solid lines represent positive weight coefficients, and dashed lines represent negative weight coefficients.
- An edge with a positive weight coefficient attached will have a positive effect from the source side of the edge (the base of the arrow) to the destination side of the edge (the tip of the arrow). In other words, if the effect of the node on the source side increases, it is expected that the effect of the node on the destination side will increase. For example, in the case of a policy to improve academic ability, if the node on the source side represents "motivation to learn" and the node on the destination side is "test scores,” it is expected that an improvement in "motivation to learn” will lead to an improvement in "test scores.”
- a negative weighting coefficient represents the inverse relationship of the positive weighting coefficient. Furthermore, the weighting coefficient can be normalized to give it a real number between -1 and +1, and the absolute value of the coefficient represents the magnitude of the effect.
- step S32 of FIG. 4 the directed graph generation unit 1032 executes a logic model construction process to create, that is, construct, a directed graph that represents the read logic model.
- the directed graph may be displayed.
- this display is an example of output, and output includes various forms other than display. Note that the displays in the following examples are also examples of output, and are not limited to this.
- the directed graph generating unit 1032 notifies at least one of the first information terminals 101-1 to n and the second information terminal 102 of the directed graph via the communication unit 1031.
- the first information terminals 101-1 to n and the second information terminal 102 display the notified directed graph, and at least one of the participants and decision makers can confirm its contents.
- the information terminal to which the directed graph is notified (displayed) may be limited as follows. For example, it may be an information terminal used by a user who wants to modify the logic model to increase the persuasiveness of the logic model, or it may be at least one of the first information terminals 101-1 and the second information terminal 102.
- the directed graph is an example of an expression format for a logic model
- the target of the notification or display may be anything that indicates the logic model. For this reason, the logic model may be notified, and the first information terminals 101-1 to n and the second information terminal 102 may create and display the directed graph. You can also display the logic model in a different format.
- display screen 501 has a logic model display section 502 that displays the logic model, and a social impact display section 503.
- the logic model display section 502 displays the notified directed graph, that is, a configuration diagram of the logic model.
- the directed graph is displayed as a graph structure of nodes and edges, but it may also be displayed in a list as a node list or edge list.
- the node list a list of each node is displayed, and the display information for each node includes the connected edge and the connected node.
- the social impact display section 503 also displays each social impact index in the logic model shown by the directed graph in the logic model display section 502. That is, the social impact index predicted value (SI predicted value), the social impact index predicted value (base value) (SI predicted value (base value)), and the social impact index predicted value (variation value) (SI predicted value (variation value)) are displayed.
- the SI predicted value displays the quantitative value of the social impact index of the logic model after correction in the subsequent steps (S33 to S36).
- the SI predicted value (reference value) displays the quantitative value of the social impact index of the logic model shown by the directed graph in the logic model display section 502, i.e., the quantitative value before correction.
- the SI predicted value (variation value) displays the variation value, which is an example of variation information and is the difference (amount of change) between the previous SI predicted value and the SI predicted value (reference value). This difference may be a variation rate.
- the variation rate is the value obtained by dividing the difference by the SI predicted value (reference value). Note that in the example of FIG.
- the variation value is 0.
- two indicators are given as the social impact index. They correspond to social impact index 1 (SI1) and social impact index 2 (SI2), respectively.
- the display screen 501 in FIG. 6 may include only the logic model display section 502.
- a node selection process is executed. To do this, first, the first information terminal 101-1 and the second information terminal 102 accept, from the participant or decision maker, a selection of a node that the participant or decision maker wishes to change from among the nodes displayed in the logic model display unit 502. Next, the first information terminal 101-1 and the second information terminal 102 notify the logic model construction support device 103 of the selected node via the network 105. The directed graph generation unit 1032 then accepts the selected node via the communication unit 1031.
- step S34 a process for displaying details of edges and nodes is performed according to the node selection in step S33.
- the directed graph generation unit 1032 identifies detailed information of the selected node from the logic model data 1041. This detailed information includes the edges to which the node is connected and their weight coefficients.
- the directed graph generation unit 1032 notifies the first information terminal 101-1 and the second information terminal 102 of this detailed information using the communication unit 1031. Then, the first information terminal 101-1 and the second information terminal 102 perform a display including the detailed information.
- step S35 a change process is performed to change the weight coefficients of the edges displayed in step S34 in response to operations from the participants or decision makers.
- the first information terminal 101-1 and the second information terminal 102 accept the changed weight coefficients from the participants or decision makers.
- the first information terminal 101-1 and the second information terminal 102 notify the logic model construction support device 103 of the changed weight coefficients via the network 105.
- the directed graph generation unit 1032 accepts the changed weight coefficients via the communication unit 1031.
- the directed graph generation unit 1032 then changes the weight coefficients of the logic model data 1041 to the accepted weight coefficients.
- step S36 the simulation unit 1033 executes a simulation process using the changed weighting coefficients.
- This simulation process includes the calculation of the SI prediction value and the fluctuation value using the changed weighting coefficients.
- the simulation process also includes the creation of fluctuation information.
- steps S33 to S36 will be described.
- a node marked as intermediate node 2-2 is selected in the logic model represented by the displayed directed graph.
- step S33 a selection process is executed to accept the selection by clicking or tapping on the node on the logic model display unit 502.
- step S34 the selected node and the edges corresponding to this node are displayed.
- the selected node is displayed in detail on the selected node screen 604 shown in FIG. 7.
- the displayed contents are the nodes and edges that have the selected node as a connection destination.
- the selected node is the intermediate node 2-2.
- the nodes and edges that have the intermediate node 2-2 as a connection destination are the edge between intermediate node 1-1 and number 1, the edge between intermediate node 1-2 and number 2, the edge between intermediate node 1-3 and number 3, and the edge between intermediate node 1-4 and number 4.
- edge number 1 is 0.25
- edge number 2 is -0.25
- edge number 3 is -0.25
- edge number 4 is 0.25.
- the weighting coefficients are allocated so that the sum of the absolute values is 1.
- step S35 the first information terminal 101-1 to n and the second information terminal 102 execute a weighting factor change process to accept changes to the weighting factors corresponding to the edges from the participants and decision makers.
- the weighting factor values in the edge number and weighting factor display section 701 are input and changed by an input device 203 such as a keyboard attached to the first information terminal 101-1 to n and the second information terminal 102.
- the weighting factor of edge number 1 is changed to 0.40
- the weighting factor corresponding to edge number 2 is changed to -0.10
- the weighting factor of edge number 3 is changed to -0.40
- the weighting factor of edge number 4 is changed to 0.10.
- the first information terminal 101-1 and the second information terminal 102 accept selections from the participants and decision makers by clicking the apply button 702, etc.
- the changed weighting factors are sent to the logic model construction support device 103 via the network 105.
- the quantitative value of the social impact index is recalculated in response to the change in edge, that is, variation information is created, including the calculation of the SI prediction value and variation value.
- step S37 a variation information display process is executed for the result of the simulation process in step S36.
- the simulation unit 1033 notifies the first information terminal 101-1 and the second information terminal 102 of the simulation result including at least the SI predicted value and the variation value, using the communication unit 1031.
- the first information terminal 101-1 and the second information terminal 102 display the notified SI predicted value and the variation value.
- An example of the screen will be described below.
- the notified amount of change is displayed in the social impact display section 803.
- the SI1 predicted value and the SI2 predicted value are displayed as having been changed to 0.113 and 0.113, respectively, due to recalculation of the quantitative value of the social impact index accompanying the edge change.
- the SI1 change amount (change value) and the SI2 change amount (change value) are displayed as +0.019 and +0.019, respectively, which are the differences between the predicted value and the SI1 predicted value (before change) and the SI2 predicted value (before change).
- the SI1 and SI2 predictions have changed in the same way, but they may change differently depending on whether the logic model is changed or not.
- step S38 it is determined whether the participants or decision makers are satisfied with the changed social impact index.
- the first information terminal 101-1 and the second information terminal 102 first accept input from the participants or decision makers as to whether they are satisfied.
- the first information terminal 101-1 and the second information terminal 102 then notify the logic model construction support device 103 of the input indicating whether they are satisfied via the network 105.
- the simulation unit 1033 of the logic model construction support device 103 accepts the notified input via the communication unit 1031. If the participants are satisfied, the simulation unit 1033 transitions to step S39. If they are not satisfied, the simulation unit 1033 transitions to step S33.
- step S39 the simulation unit 1033 sends the changed logic model to the first information terminal 101-1 and the second information terminal 102 via the communication unit 1031 and stores the changed logic model in the database 104 as logic model data 1041.
- the process returns to step S303 and the subsequent processes are repeated.
- users such as participants and decision makers can refer to the quantitative values of the social impact index obtained by the calculation process and the fluctuations in the quantitative values of the social impact index when modifying the corresponding logic model.
- This makes it possible to support the construction of a logic model that satisfies the user, and it is expected that the user will be able to efficiently decide on measures with high social impact indexes.
- "satisfying the user” is an example of "ensuring validity,” and can be confirmed by receiving input of approval from the user or by satisfying the index value set by the user.
- Example 2 is an example in which a function is added that takes into account the node influence degree and supports node selection performed by users such as participants and decision makers when revising a logic model. Note that the configuration of each device in Example 2 is also the same as in Example 1. For this reason, the processing flow of Example 2 will be described.
- FIG. 10 is a flowchart showing a logic model construction support process related to Example 2.
- step S901 calculation of node influence degree
- step S32 is changed (S32-1) in response to the addition of step S901.
- steps common to Example 1 are denoted by the same reference numerals.
- step S901 which is different from the first embodiment, will be described.
- the user modifies the logic model
- the user needs to select the node to be modified.
- the logic model has a large number of nodes
- the node influence degree is calculated (step S901), and the nodes that have the greatest influence on the quantitative value of the social impact index are presented to the user, thereby assisting in the selection of nodes when modifying the logic model.
- the directed graph generating unit 1032 calculates the node influence degree, which indicates the degree of influence on the social impact index at the relevant node, as follows.
- the calculation target is node A.
- the directed graph generating unit 1032 fixes the weight coefficients other than the weight coefficient of the edge connecting node A to a predetermined value.
- This predetermined value is, for example, a representative value such as the average value.
- the directed graph generating unit 1032 changes the quantitative value of node A. This change is performed continuously, for example, between 0 and 1.
- the directed graph generating unit 1032 records the quantitative value of the social impact index when the quantitative value of node A is changed, and compares the maximum and minimum values, or the reference value and minimum value.
- the reference value is a predetermined numerical value, and if the amount of change (variation value) from the quantitative value is 0 to 1, it is, for example, 0.5.
- the directed graph generation unit 1032 uses the following (Equation 1) to set the minimum value or the reference value as the reference and determines the ratio of the compared difference values as the fluctuation value.
- Impact degree node A (reference value of quantitative value of social impact index ⁇ minimum value of quantitative value of social impact index)/(minimum value of quantitative value of social impact index) (Equation 1)
- the directed graph generating unit 1032 performs this process for each intermediate node and compares the degree of influence.
- the degree of influence is also defined as 0.
- the degree of influence of each node in the logic model used in this example is shown in FIG. 11.
- FIG. 11 is a graph showing the node influence degree in the second embodiment. In this graph, the degree of influence is shown for each intermediate node.
- a representative value such as the average or total of the influence degree on each social impact index is used as the degree of influence.
- the node with the highest degree of influence on the social impact index is the intermediate node 2-2.
- the node with the second highest degree of influence is the intermediate node 1-1, and the node with the third highest degree of influence is the intermediate node 1-4.
- step S32-1 a display process is performed that takes into account the degree of influence.
- the directed graph generation unit 1032 creates a directed graph that includes the degree of influence and its ranking, and the first information terminal 101-1 and the second information terminal 102 display this.
- FIG. 12 shows an example of the degree of influence presented on a directed graph that represents a logic model.
- the nodes with the first to third highest influence levels (top) are presented to the user.
- the above-mentioned top nodes may be distinguished from the others, or displayed in a limited manner.
- users can refer to it as a candidate for selecting nodes to modify when modifying the logic model.
- Example 3 and Example 4 described below an example of the above-mentioned quantification method will be described.
- the difference in social impact index between many policy candidates is quantitatively predicted (quantified), and support is provided for the consideration of policies that maximize the social impact index.
- a directed graph that represents a logic model for the policy candidates is generated, and the contents of this are described below.
- the generation of the directed graph is expressed as the construction of a logic model.
- the directed graph is one form of a logic model, and the logic model may be expressed in other forms.
- the directed graph generation unit 1032 can also be expressed as a logic model construction unit.
- FIG. 13 is a flowchart of the social impact index quantification process according to the third embodiment.
- This social impact index quantification process is roughly divided into two processing blocks: a logic model construction process S301 for enabling quantification, and a simulation process S302.
- the logic model construction process S301 for quantification corresponds to the above-mentioned directed graph generation process, and includes a node selection process S303, an edge weight prediction process S304, and a driving node parameter setting process S305.
- the node selection process S303 selects nodes required for the logic model using data obtained through workshops with IT support, etc.
- the edge weight prediction process S304 predicts and adds weights to edges based on the selection for quantification.
- the logic model is constructed in this manner.
- the driving node parameter setting process S305 sets parameters for nodes (called driving nodes) for enabling the logic model created in S304 to be simulated, and a quantifiable logic model is constructed.
- the logic model construction process S301 is carried out using the first information terminal 101 and data acquired from participants (input of the importance of the indicators).
- the logic model constructed in S301 is quantified and evaluated for policy formulation.
- the simulation process S302 has a simulation process S306 and an analysis process S307.
- the simulation process S306 executes a time evolution process starting from the driving node added to the logic model, thereby executing a quantification simulation of the social impact index.
- the analysis process S307 analyzes the results of the simulation process S306.
- Each process will be described in detail below.
- a specific example will be a request for power saving when natural energy is introduced in a simple area.
- the social impact index in this case is "power saving acceptance” and the measure is "power saving request”.
- the social impact index will also be simply referred to as the index.
- the introduction of a driving node and the addition of weights to edges will be added to the logic model. The process of this embodiment will be described with a focus on these points, following the flowchart in Figure 13.
- the directed graph generation unit 1032 selects indicators for each of the five layers in the logic model mentioned above.
- the five layers mentioned above are considered as two layers that behave differently from the perspective of quantification.
- the input layer, activity layer, and output layer are combined into a first layer (input/activity/output).
- the outcome layer and impact layer are combined into a second layer (outcome/social impact).
- each of the above layers, that is, the nodes are cleaned up.
- Fig. 14 is a diagram showing the nodes selected (picked up) in the node selection process S303.
- the layers illustrated in Fig. 14 are a first layer 401 and a second layer 402.
- Fig. 14 also illustrates indexes in the first layer 401 and the second layer 402.
- the indexes illustrated in the first layer 401 are as follows: Power generation facility size (solar) 403 Power generation facility size (nano hydro) 404 Power saving request level 405 Number of requests to save electricity (weekdays, tight) 406 Number of requests to save electricity (weekdays, non-pressure) 407 Number of requests for power saving (holiday, tight) 408 Number of requests for power saving (holiday, not tight) 409
- Power generation facility size solar
- Power generation facility size nano hydro
- Power saving request level 405 Number of requests to save electricity (weekdays, tight)
- 406 Number of requests to save electricity (weekdays, non-pressure)
- 407 Number of requests for power saving (holiday, tight
- Indicators shown as examples of the second layer 402 are environmental awareness 410, dissatisfaction with the request to save electricity (negative node) 411, and power saving acceptance 412. Indicators other than these may be added or deleted in the second layer 402 as well. Here, dissatisfaction with the request to save electricity 411 is noted as a negative node.
- the index becomes negative, it is in the direction of improvement, and the positive and negative direction of improvement is the opposite of other indexes, such as environmental awareness 410.
- the index "environmental awareness” 410 becomes positive as the value increases, since awareness of awareness increases.
- the index "dissatisfaction with requests to save electricity" 411 becomes negative as the value increases, since dissatisfaction increases. This makes post-processing simulations complicated, so the polarity of the negative nodes is reversed, indicating that dissatisfaction decreases as the value increases.
- this node is noted as a negative node (for example, this can be considered equivalent to converting the indicator "Satisfaction with regard to requests to save electricity" and making it a positive node). Indicators for which it is difficult to determine the direction of improvement also need to be decided in advance as either one or the other.
- indicators (nodes) of activities related to power generation facilities and requests for power saving are selected as the first layer. These requests for power saving are to request a certain amount of power reduction when there is a shortage of natural energy power. In addition, since the occurrence of requests for power saving depends on the amount of power generated by natural energy, the scale of introduction of power generation facilities and the degree of requests for power saving are the indicators.
- the power saving request is also divided into several categories depending on the situation. In this example, it is divided by a combination of the day of the week and whether it is urgent or not. First, the day of the week is divided into Monday to Friday (weekdays) or Saturday and Sunday (holidays). In addition, the combination of whether the outside temperature indicates urgent (above 35°C or below 5°C) or not (outside of the above conditions) results in four indicators.
- These indicators can be selected by creating a database of related keywords in advance and selecting the necessary indicators from the database 104, or by selecting them in a workshop or the like.
- the directed graph generation unit 1032 selects each indicator according to operations on each information terminal and predetermined rules. These indicators become nodes in the logic model. Note that a workshop includes acquiring data from various terminals using the logic model construction support system 100.
- the directed graph generation unit 1032 connects the nodes selected in S303 with edges and predicts the weight of each edge.
- connections with edges are originally intended to logically express causal relationships, but in the case of quantification, a calculation formula may be inserted between nodes.
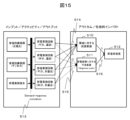
- FIG. 15 is a diagram showing a logic model in which edges are combined according to this embodiment.
- process 513 for calculating power supply and demand is inserted in the input/activity/output layer.
- the reason for this insertion is that fluctuations in the amount of power generated by power generation equipment can affect the frequency of power saving requests.
- the power supply and demand calculation can be realized by simulation.
- a method can be used in which the frequency of power saving requests is determined in advance (for example, two power saving requests occur in an average month) without taking the power generation equipment into consideration.
- edge 515 is an edge that inputs to a negative node (index 511), and is therefore drawn with a dashed line to clearly show that it is different from a positive node.
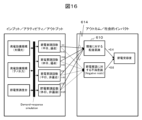
- FIG. 16 shows a logic model in which the directed graph generation unit 1032 has added (predicted) weights (numbers from -1 to 1) to each edge (514, 515, 516) in FIG. 15.
- FIG. 17 shows a diagram in which the four edges 614 of index 610 are extracted from the logic model in FIG. 16.
- the weight added to the edge input from index 706 is 0.0 (figure number 717).
- the weight added to the edge input from index 707 is +0.66 (figure number 718), and the weight added to the edge input from index 708 is 0.0 (figure number 719).
- the weight added to the edge input from index 709 is +0.34 (figure number 720).
- the directed graph generating unit 1032 adds (predicts) weights in accordance with the following rules. 1. The absolute value of the sum of the weights of the edges input to one index node is set to "1". 2. Separate nodes that receive edges with negative weighting from nodes that receive edges with positive weighting. Note that it is preferable that the directed graph generating unit 1032 outputs the logic models shown in Figures 14 to 16 to each information terminal using the communication unit 1031. As a result, each information terminal can display on the output device 204 the directed graphs that represent the logic models shown in Figures 14 to 16.
- the directed graph generation unit 1032 also determines and adds weights to edges based on the values (order of preferences) of policy decision makers or stakeholders. An example of this will be explained using Figure 17.
- indicator 710 “Environmental consciousness” from the top: indicator 706 "Power saving request, weekday, tight”, indicator 707 “Power saving request, weekday, not tight”, indicator 708 "Power saving request, Saturdays and Sundays, tight”, and indicator 709 "Power saving request, Saturdays and Sundays, not tight”.
- the weight indicates how much of an impact it has. This degree of impact can be derived objectively (statistical correlation value), but here we will assume that it is given in a subjective order of preference. A weight of "0.0" means that there is no impact or it is not considered, and an absolute large weight is added to the order of the greatest impact. In the case of a negative impact, a negative weight is added.
- the digraph generation unit 1032 determines that the influence of the indicator 707 "power saving request, weekday, not tight" (weight +0.66, diagram number 718) is the largest. The digraph generation unit 1032 also determines that the next most influential indicator is the indicator 706 "power saving request, weekends, not tight” (weight +0.34, diagram number 720). The digraph generation unit 1032 then determines that the rest are irrelevant (assuming that a power saving request during times of tightness will not be perceived positively). If these are expressed in order of preference, the degree of the power saving request on "environmental awareness” is "power saving request, weekday, not tight” > "power saving request, weekends, not tight.”
- the directed graph generation unit 1032 can also add weights to other nodes in the same way. In other words, if the edge input to a negative node has a negative weight, the sum is set to "-1". Also, as per rule 2 above, negative nodes and positive nodes are considered separately, and if an edge with a positive weight added is input to a certain index node, an edge with a negative weight added is not input.
- the driving node is a node necessary for the quantifiable logic model, and is a definition that does not exist in the conventional logic model.
- the digraph generating unit 1032 selects the driving node as a node to be considered as a policy candidate from the input/activity/output layer. In this embodiment, it is desirable to set the time when the indicators "power generation facility" 403, 404 and the indicator "power saving request degree" 405 shown in FIG. 14 are changed as a policy candidate.
- the digraph generating unit 1032 specifies the indicators "power generation facility scale (photovoltaic power)” 403, “power generation facility scale (nano hydro)” 404, and "power saving request degree” 405 as the driving nodes.
- the digraph generating unit 1032 sets the following indicators as the driving nodes.
- the directed graph generating unit 1032 can also exclude the indicator “power generation facility scale (photovoltaic power)” 403 , the indicator “power generation facility scale (nano-hydro)” 404 , and the indicator “degree of power saving request” 405 .
- time series parameters must be set in advance for the driving nodes.
- the time series parameters are, for example, values for each month from January to December.
- the time series parameter can be the system capacity (kW) of photovoltaic power generation.
- the system capacity of a power generation facility does not change over time, so the same number (such as 10 kW) is given as the time series parameter from January to December.
- FIG. 18 shows an example of parameter settings for the driving node according to this embodiment.
- the parameter settings are assumed to be in monthly units for one year.
- the upper diagram 801 in FIG. 18 is an example of the system capacity of photovoltaic power generation
- the lower diagram 802 in FIG. 18 is an example of the number of times a power saving request has occurred.
- the output of the driving node may have different units, it is necessary to normalize it to a numerical value such as 0 to 1 as necessary. Any function can be used for normalization here, but basically it is sufficient if it can reflect the degree of influence on the logic in the subsequent stage. For example, there is a method of normalizing it by the maximum value between driving nodes of the same unit. That is, in setting the parameters of the driving nodes S305, the directed graph generation unit 1032 sets (specifies) the time series parameters that it determines as described above.
- the directed graph generation unit 1032 constructs a quantifiable logic model.
- the directed graph generation unit 1032 stores the constructed quantifiable logic model in the storage unit 1040 as logic model data 1041.
- the simulation unit 1033 executes a time-evolution simulation for the quantifiable logic model. This simulation is executed with a minimum time step equivalent to one hour, and can be changed to a unit of one month, etc., as necessary. Furthermore, the simulation unit 1033 transfers values to the connected nodes according to the parameters set in the driving node for each hourly step. Then, the simulation unit 1033 executes a predetermined process in the connected node according to the transferred value. As a result, a quantification process is executed for the node. Note that this simulation process S302 is preferably the same as the simulation process (step S36) in the first and second embodiments. For this reason, it is preferable that the simulation process S302 is executed in the simulation process (step S36) in the first and second embodiments.
- the quantification process by the simulation unit 1033 will be explained using the node "environmental awareness" shown in FIG. 17 as an example.
- the simulation unit 1033 determines the index value (St, St indicates the index value at a certain time step t) of this node based on this calculation formula.
- the initial value S0 is set to 0.
- the simulation unit 1033 processes this formula for the nodes in the outcome/social impact layer at a certain time step, and calculates the index value of each node. Furthermore, the simulation unit 1033 advances the time steps in a time-evolving manner and updates the index value of each node (St+1, which is the index value for the time step t+1 that follows time step t). The simulation unit 1033 then repeatedly processes the time steps a preset number of times, thereby obtaining the index value of each node after the preset number of times. In this example, the time step is set to one month, and one year is assumed, so the preset number is 12 times (12 months).
- the simulation unit 1033 can compare the difference in index values between different measures by simulating the same logic model while changing the parameters of the driving nodes. In this way, the simulation unit 1033 can also search for a measure that maximizes the index value. Since the above index values include the social impact index (power saving acceptance in this example), which is the target node for quantification, this simulation makes it possible to quantify the social impact index. Furthermore, the simulation unit 1033 can analyze the social impact index quantified in this way between different measures. This will be explained in S307 below. Note that S307 may be executed by an evaluation unit separate from the simulation unit 1033.
- the data required to set the parameters of the driving node is the power generation potential of natural energy and the amount of power consumed by residents. Furthermore, it is assumed that a request for power saving will be made at a certain rate when natural energy is insufficient relative to demand, and if there is still a shortage after the power saving request, power will be purchased from the electricity market, etc. Furthermore, in this example, the system capacity of the solar power generation facility, the effective head of the small hydroelectric power generation facility, and the degree of the power saving request are set as parameters of the driving node.
- the simulation unit 1033 also estimates the amount of power generated from the scale of each power generation facility, performs supply and demand calculations in advance from the amount of power consumed by residents, and calculates time series parameters for the occurrence of power saving requests. In this embodiment, this calculation is performed in advance, but it is desirable to perform it during the simulation process S302.
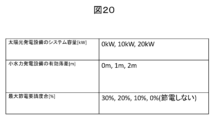
- the parameters of the driving node are shown in Figure 20. As shown in Figure 20, there are 36 possible combinations of measures. For the sake of explanation, a measure number is assigned to each measure in Figure 20. Let measure number 1 be (0kW, 0m, 30%), and measure number 2 be (10kW, 0m, 30%). In other words, the numbers are assigned in the order of solar power, small hydroelectric power, and power saving request level. Moreover, measure number 36 is (20kW, 2m, 0%).
- Fig. 21 and Fig. 22 Graphs showing the number of times that policy requests occurred, calculated in advance, for each policy number are shown in Fig. 21 and Fig. 22.
- Fig. 21 shows the number of requests to save electricity (weekdays, tight) 406 and the number of requests to save electricity (weekdays, not tight) 407 for each of the 36 policies per year.
- Fig. 22 also shows the number of requests to save electricity (holidays, tight) 408 and the number of requests to save electricity (holidays, not tight) 409.
- the simulation unit 1033 uses the communication unit 1031 to output the graphs shown in Figs. 11 and 12 to each information terminal. As a result, each information terminal is able to display the graphs shown in Figs. 21 and 22 on the output device 204. In addition, in this process, the simulation unit 1033 uses the weights shown in Fig. 16 as the weights of each edge of the quantifiable logic model.
- Figure 23 illustrates the values for each node of the quantifiable logic model, "environmental awareness,” “dissatisfaction with requests to save electricity (Negative node),” and the social impact index, "acceptance of electricity saving,” by policy. Since “dissatisfaction with requests to save electricity” is a negative node, it is shown as a positive value in Figure 23, but unlike other indexes, a positive value indicates a worsening trend. Therefore, it is essentially considered to be a negative value.
- the simulation unit 1033 analyzes the simulation results regarding the above. As a result, the simulation unit 1033 determines that this is due to the previous nodes, "environmental awareness” and “dissatisfaction with the request to save electricity.” This logic model is based on the subjective assumption that "environmental awareness” increases when a request to save electricity is made. However, looking at this the other way around, it suggests that if there is an abundance of power generation facilities, there will be no power shortages and environmental awareness will weaken.
- the social impact index will actually be lowered unless it is set to zero. Therefore, in this embodiment, when the power saving request level is not 0, the measures that maximize the social impact index are measure numbers 19 and 20, and the respective index values are -19.19.
- simulation unit 1033 searches for such maximum values.
- this maximum value is relative for each index, so the search for the maximum value by simulation unit 1033 means performing a relative evaluation to reach a consensus for each measure. Furthermore, simulation unit 1033 can identify the measure that shows the maximum value as the measure that improves the social impact index.
- the simulation unit 1033 uses the communication unit 1031 to output the measures that improve the social impact index to the second information terminal 102.
- the second information terminal 102 can display the measures on the output device 204. Therefore, a proposal for the improvement measures can be made to the decision maker.
- the evaluation unit 1034 may output the measures that improve the social impact index to the first information terminal 101.
- the first information terminal 101 can display the measures on the output device 204. Therefore, it is also possible to present the above-mentioned proposal to the participants.
- the third information terminal used by the supporter may be connected to the network 105. In this case, it is possible to display the measures that improve the social impact index on the third information terminal. This concludes the explanation of the third embodiment.
- Example 4 a policy is to evaluate businesses and companies when making ESG investments. Note that in this example, processing is executed with the same configuration as in Example 1.
- the driving node is an index related to the business or company that is the investment target. For example, it may be the number of employees in a region, or the percentage of the investment that is returned to the region (regional distribution rate).
- indicators related to the SDGs and indicators that the investing company considers important are used.
- subjective indicators such as CO2 emissions (or reductions) and employee job satisfaction can also be used.
- the connection relationships and weights of the edges of the logic model can be constructed according to the standards set by the investing company.
- a simulation is run by changing the parameters of the driving nodes that affect the effects of the investment, and the social impact indicator is quantified. This makes it possible for the system to propose to the investment decision maker the investment business or corporate form (such as the investment distribution rate) that can maximize the social impact indicator.
- 100...Logic model construction support system 101...First information terminal, 102...Second information terminal, 103...Logic model construction support device, 104...Database, 105...Network, 1031...Communication unit, 1032...Directed graph generation unit, 1033...Simulation unit, 1034...Evaluation unit, 1041...Logic model data, 1042...Social impact index data, 200...Computer, 201...Processor, 202...Storage device, 203...Input device, 204...Output device, 205...Communication IF
Landscapes
- Business, Economics & Management (AREA)
- Human Resources & Organizations (AREA)
- Engineering & Computer Science (AREA)
- Strategic Management (AREA)
- Entrepreneurship & Innovation (AREA)
- Economics (AREA)
- Operations Research (AREA)
- Game Theory and Decision Science (AREA)
- Development Economics (AREA)
- Marketing (AREA)
- Educational Administration (AREA)
- Quality & Reliability (AREA)
- Tourism & Hospitality (AREA)
- Physics & Mathematics (AREA)
- General Business, Economics & Management (AREA)
- General Physics & Mathematics (AREA)
- Theoretical Computer Science (AREA)
- Management, Administration, Business Operations System, And Electronic Commerce (AREA)
Abstract
妥当性を確保できるロジックモデルの構築を支援することを課題とする。組織の活動を評価するための社会的インパクト指標の評価に用いられるロジックモデルを表現し、ノード同士を接続するエッジで表現される複数の階層を有する有向グラフを表示し、表示された前記有向グラフに対するノードに対する選定を受け付け、選定された前記ノードおよび当該ノードに接続するエッジの詳細を表示し、使用者の操作に応じて、表示されたエッジに対応する重み係数を変更し、前記重み係数の変更前のロジックモデルの社会的インパクト指標の第1の定量値、前記重み係数の変更後のロジックモデルの社会的インパクト指標の第2の定量値および前記第1の定量値と前記第2の定量値の差分に関する変動情報を作成し、前記第1の定量値、前記第2の定量値および前記変動情報を表示するロジックモデル構築支援装置。
Description
本発明は、組織の活動といった所定の活動を支援するための技術に掛かり当該活動を評価する社会的インパクト指標を用いられるロジックモデルの構築を支援する技術に関する。
近年、自治体、企業、金融機関など各種団体、組織等(単に組織と称する)において、その組織の施策、業務、投融資といった活動が社会にどのような影響を与えるかを評価することが重要である。例えば、グローバルな社会課題を解決すべく、持続可能な開発目標SDGs(Sustainable Development Goals)が策定されている。そして、企業や自治体などの各種組織は事業、経営や活動の中に、その目標達成を目指す取り組みが重要視されている。SDGsでは、持続可能な開発を、社会、環境、経済の三つの側面において、バランスがとれ統合された形で達成することが期待されている。このため、企業の事業を始めとする各種組織の活動においても三つの側面への影響、効果を考慮していく必要がある。そのためには、事業などによる影響を、社会、環境、経済の価値軸で予測し、価値を向上する活動を行っていく必要がある。
上記の活動を実現するため、環境および経済に相当する指標群、例えば環境価値に属する二酸化炭素排出量や経済価値に属する企業利益は、二酸化炭素の計測や企業活動の報告レポートなどによって客観的に定量化することが可能であり、すでに実施されている。一方で、社会価値は、格差や公平度といった客観指標もあるが、地域開発による地域文化の継続性や地域住民の生活の質、幸福感といった、主観的な側面も含まれる。また、主観的指標は時間による変化を考慮する必要がある。例えば、景観に対する主観的愛着度は、施設建設で下がったとしても、慣れと共に緩和されていくことも考えられる。このような背景のもと、自治体の施策決定や金融機関の投融資判断などにおいて、施策や投融資が社会価値として、社会にどのような影響を与えるかを評価する社会的インパクト指標を用いれる例が増加している。
そのため、多数の施策候補の間での社会的インパクト指標の差の比較や、社会的インパクト指標の時間的変化の予測が必要となっている。また、社会的インパクト指標の評価にはロジックモデルが用いられることが多い。
上記背景に関係する技術として、特許文献1が提案されている。特許文献1では、活動の一例である「議論を活性化することができる」技術が開示されている。より詳細には、特許文献1には、「創造支援サーバ10は、議論の課題から解決策を導き出すために各ユーザが創造した意見を示すノードおよびノード間の関連性を示すリンクを用いて生成された樹形図に含まれる複数のノードのうち、解決策を示す解決策ノードから課題を示す課題ノードまでリンクを遡って、解決策ノードから課題ノードの間に含まれる各ノードを選定し、選定された各ノードの種別およびリンクの種別を用いて、各ノードが解決策を導き出すために貢献した貢献度を算出し、貢献度が閾値以上のノードを特定する」ことが記載されている。
特許文献1では、樹形図における各ノードの議論に対する貢献度を評価している。ここで、上述のロジックモデルについては、その妥当性の確保が必要である。妥当性が十分でない場合、ロジックモデルの構築の際には社会的インパクトの予測結果が信用できないため、予測結果に齟齬(思っていたものと違う)が生じる恐れがある。また、ロジックモデルの構築においては、ベースとなるロジックモデルを試行錯誤的に修正しながら構築することがなされる。そこで、本発明では、試行錯誤的に構築される社会的インパクト指標の評価に用いられるロジックモデルについて、妥当性を確保することを課題とする。
上記の課題を解決するための本発明の構成は、プログラムを実行するプロセッサと、前記プログラムを記憶する記憶デバイスとを有するロジックモデル構築支援装置であって、
前記プロセッサは、前記プログラムに従って、ノード間を接続するエッジで表現される複数の階層を有する有向グラフを構築するロジックモデル構築処理と、構築された前記有向グラフに対するノードに対する選定を受け付ける選定処理と、選定された前記ノードに接続するエッジに対応する重み係数を変更する変更処理と、前記重み係数の変更前のロジックモデルの社会的インパクト指標の第1の定量値、前記重み係数の変更後のロジックモデルの社会的インパクト指標の第2の定量値および前記第1の定量値と前記第2の定量値の差分に関する変動情報を作成するシミュレーション処理と、前記変動情報を出力する変動情報出力処理を実行するロジックモデル構築支援装置である。
前記プロセッサは、前記プログラムに従って、ノード間を接続するエッジで表現される複数の階層を有する有向グラフを構築するロジックモデル構築処理と、構築された前記有向グラフに対するノードに対する選定を受け付ける選定処理と、選定された前記ノードに接続するエッジに対応する重み係数を変更する変更処理と、前記重み係数の変更前のロジックモデルの社会的インパクト指標の第1の定量値、前記重み係数の変更後のロジックモデルの社会的インパクト指標の第2の定量値および前記第1の定量値と前記第2の定量値の差分に関する変動情報を作成するシミュレーション処理と、前記変動情報を出力する変動情報出力処理を実行するロジックモデル構築支援装置である。
また、本発明のロジックモデル構築支援装置の別の態様は、プログラムを実行するプロセッサと、前記プログラムを記憶する記憶デバイスとを有するロジックモデル構築支援装置であって、前記プロセッサは、前記プログラムに従って、ノード間を接続するエッジで表現される複数の階層を有する有向グラフを構築するロジックモデル構築処理と、構築された前記有向グラフを表示する表示処理と、表示された前記有向グラフに対するノードに対する選定を受け付ける選定処理と、選定された前記ノードおよび当該ノードに接続するエッジの詳細を表示する詳細表示処理と、表示されたエッジに対応する重み係数を変更する変更処理と、前記重み係数の変更前のロジックモデルの社会的インパクト指標の第1の定量値、前記重み係数の変更後のロジックモデルの社会的インパクト指標の第2の定量値および前記第1の定量値と前記第2の定量値の差分に関する変動情報を作成するシミュレーション処理と、前記変動情報を表示する変動情報表示処理を実行するロジックモデル構築支援装置である。
また、本発明には、ロジックモデル構築支援装置によるロジックモデル構築支援方法、これをコンピュータとして機能させるプログラムないし当該プログラムを格納する記憶媒体やロジックモデル構築支援装置を含むロジックモデル構築支援システムも含まれる。
本発明によれば、ロジックモデルの構築において、その妥当性を確保できる。
以下、本発明の一実施形態について説明する。本実施形態では、活動として、施策の策定やこのための合意形成といった意思決定を支援する。このために、本実施形態では、プログラムを実行するプロセッサと、前記プログラムを記憶する記憶デバイスとを有するロジックモデル構築支援装置であって、前記プロセッサは、前記プログラムに従って、組織の活動を評価するための社会的インパクト指標の評価に用いられるロジックモデルを表現し、当該ロジックモデルを構成するノード同士を接続するエッジで表現される複数の階層を有する有向グラフを表示する表示処理と、表示された前記有向グラフに対するノードに対する選定を受け付ける選定処理と、選定された前記ノードおよび当該ノードに接続するエッジの詳細を表示する詳細表示処理と、使用者の操作に応じて、表示されたエッジに対応する重み係数を変更する変更処理と、前記重み係数の変更前のロジックモデルの社会的インパクト指標の第1の定量値、前記重み係数の変更後のロジックモデルの社会的インパクト指標の第2の定量値および前記第1の定量値と前記第2の定量値の差分に関する変動情報を作成するシミュレーション処理と、前記第1の定量値、前記第2の定量値および前記変動情報を表示する変動情報表示処理を実行するロジックモデル構築支援装置を採用した。
このことで、ロジックモデルの構築において、妥当性を確保することを実現する。なお、「妥当性の確保」とは、構築されるロジックモデルを用いた社会的インパクト等の予測についての性能が所定条件を満たすことを意味する。ここで、予測についての性能とは、予測結果の精度を示す指標値が閾値以上であるかで確認できる。以下、本実施形態の具体例を示す各実施例を説明する。
まず、実施例1の背景について説明する。実施例1では、自治体等において、長期的な目標である社会的インパクト指標の向上をめざし、ロジックモデルを構築する場合の実施形例である。本実施例では、対象地域の社会的インパクト指標を向上させる施策策定を支援する。つまり、本実施例では、より優れた施策を実現することを支援する。このために、ロジックモデルを通じて施策によってどの程度社会インパクト指標が変化するかを算出することで、例えば最も改善予測が高い施策を提供することを実現する。
この実現のためには、自治体等の構成員にとってのロジックモデルの納得性が重要な要素である。そこで、本実施例では、ロジックモデル構築時の社会的インパクト指標の変動値を提示することで納得性の高いロジックモデルの構築を可能とする。以下、このための構成を説明する。
図1は、実施例1に係るロジックモデル構築支援システム100のシステム構成例を示す説明図である。なお、本システム構成は、後述の実施例2、3でも共通である。図1において、ロジックモデル構築支援システム100は、複数の第1情報端末101-1~n、第2情報端末102およびロジックモデル構築支援装置103が、ネットワーク105を介して互いに接続されている。ネットワーク105は、インターネット、LAN(Local Area Network)、WAN(Wide Area Network)などで実現できる。
第1情報端末101-1~nは、それぞれ参加者1~参加者n(nは1以上の整数。以下総称して参加者)が利用する情報端末であり、参加者の考えるロジックモデルの構造や重要と思う指標の情報を取得して、ロジックモデル構築支援装置103に送信する。例えば、パーソナルコンピュータやスマートデバイスのような通信デバイス等の情報処理装置(コンピュータ)で実現できる。なお、参加者とは、組織の活動(施策)に参加する者を示す。例えば、組織が地方公共団体の場合、住民や一般の職員である。
また、第2情報端末102は、自治体などの意思決定者が利用する情報端末であり、ロジックモデル構築支援装置103からの構築中のロジックモデルや社会インパクト指標の定量値を含むシミュレーション結果を表示する。例えば、パーソナルコンピュータやスマートデバイスのような通信デバイス等の情報処理装置(コンピュータ)で実現できる。なお、意志決定者とは、組織の活動(施策)を決定する者を示す。例えば、組織が地方公共団体の場合、首長や幹部職員である。
また、ロジックモデル構築支援装置103は、第1情報端末101-1~nの少なくとも1つから参加者のロジックモデルの構造や重要と考える指標を受信する。そして、ロジックモデル構築支援装置103は、以下の各処理を実行する。
有向グラフを構築する構築処理
有向グラフに対するノードに対する選定を受け付ける選定処理
選定されたノードに接続するエッジに対応する重み係数を変更する変更処理
重み係数の変更前のロジックモデルの社会的インパクト指標の第1の定量値、前記重み係数の変更後のロジックモデルの社会的インパクト指標の第2の定量値および前記第1の定量値と前記第2の定量値の差分に関する変動情報を作成するシミュレーション処理
前記変動情報を出力する変動情報出力処理
ロジックモデル構築支援装置103は、さらに、構築された有向グラフを出力する出力処理や選定されたノードおよび当該ノードに接続するエッジの詳細を出力する詳細出力処理を実行することも可能である。
有向グラフに対するノードに対する選定を受け付ける選定処理
選定されたノードに接続するエッジに対応する重み係数を変更する変更処理
重み係数の変更前のロジックモデルの社会的インパクト指標の第1の定量値、前記重み係数の変更後のロジックモデルの社会的インパクト指標の第2の定量値および前記第1の定量値と前記第2の定量値の差分に関する変動情報を作成するシミュレーション処理
前記変動情報を出力する変動情報出力処理
ロジックモデル構築支援装置103は、さらに、構築された有向グラフを出力する出力処理や選定されたノードおよび当該ノードに接続するエッジの詳細を出力する詳細出力処理を実行することも可能である。
ここで、変動情報出力処理、出力処理、詳細出力処理には、出力対象を表示する各表示処理が含まれる。また、本願明細書で記述する各種表示処理は、出力処理の一例である。このため、本願発明では、通知、送信等の他の出力処理の態様も採用できる。また、変動情報出力処理では、第1の定量値および第2の定量値も出力してもよい。なお、ロジックモデル構築支援装置103は、社会的インパクト指標を算出、定量化する社会的インパクト指標定量化装置として実現してもよい。
また、ロジックモデル構築支援装置103は、定量化可能なロジックモデルデータ1041や情報処理の実行結果(たとえば、社会的インパクト指標の定量値)を、第2情報端末102に送信する。データベース104は、ロジックモデル構築支援装置103で用いられるデータ(ロジックモデルデータ1041や社会的インパクト指標データ1042)を保存する。なお、データベース104は、ロジックモデル構築支援装置103の記憶装置として実現してもよいし、ネットワーク105を介して、ロジックモデル構築支援装置103と接続してもよい。また、ロジックモデル構築支援装置103もサーバ等の情報処理装置(コンピュータ)で実現できる。
次に、実施例1の主たる処理を実行するロジックモデル構築支援装置について説明する。図2は、実施例1に係るロジックモデル構築支援装置103の機能ブロック図である。図2において、ロジックモデル構築支援装置103は、通信部1031、有向グラフ生成部1032、シミュレーション部1033および記憶部1040を有する。ここで、図2の記憶部1040は、図1のデータベース104に相当し、ロジックモデル構築支援装置103が記憶部1040を有する構成としているが、記憶部1040はロジックモデル構築支援装置103と別構成としてもよい。
以下、各部について説明する。通信部1031は、ネットワーク105と接続し、第1情報端末101-1~n、第2情報端末102と通信する。また、有向グラフ生成部1032は、ロジックモデルにおけるノード同士を接続するエッジで表現される複数の階層を有する有向グラフを生成する。
また、シミュレーション部1033は、生成された有向グラフに基づいて、施策に対する社会的インパクト指標の定量値を算出する。また、シミュレーション部1033は、社会的インパクト指標の定量値の変動値を算出する。
さらに、記憶部1040は、ロジックモデルデータ1041および社会的インパクト指標データ1042を記憶する。ここで、ロジックモデルデータ1041には、ロジックモデルが含まれる。これには、構築のベースとなるロジックモデル、これに対する操作に応じて修正される構築中のロジックロジックモデル、構築されたロジックモデルが含まれる。
また、社会的インパクト指標データ1042には、ロジックモデルの社会的インパクト指標を示し、その定量値やその変動値が含まれる。なお、ロジックモデルデータ1041および社会的インパクト指標データ1042は、1つの情報として扱ってもよい。つまり、これらを、ロジックモデルデータごとに、その社会的インパクト指標が対応付けられた情報としてもよい。
次に、実施例1における各装置のハードウェア構成について説明する。図3は、実施例1に係る各装置を実現するコンピュータのハードウェア構成図である。図3に示すコンピュータ200は、第1情報端末101-1~n、第2情報端末102およびロジックモデル構築支援装置103で共通である。なお、以下では本実施例の主たる処理を実行するロジックモデル構築支援装置103に特有の構成と各装置で共有の構成について説明する。
コンピュータ200は、プロセッサ201、記憶デバイス202、入力デバイス203、出力デバイス204、通信インターフェース(通信IF)205を有する。そして、これらは互いにバス206により接続される。なお、ロジックモデル構築支援装置103をサーバで実現する場合、入力デバイス203、出力デバイス204は省略できる。以下、各構成について、説明する
プロセッサ201は、コンピュータ200での演算を、記憶デバイス202に記憶されるプログラムに従って実行する。記憶デバイス202は、プロセッサ201の作業エリアおよび記憶媒体ないし記憶装置(以下、単に記憶媒体)で構成される。作業エリアは、いわゆるメモリで実現できる。また、記憶媒体は、各種プログラムやデータを記憶する非一時的なまたは一時的な記録媒体で実現できる。また、記憶デバイス202としては、たとえば、ROM(Read Only Memory)、RAM(Random Access Memory)、HDD(Hard Disk Drive)、フラッシュメモリで構成できる。
プロセッサ201は、コンピュータ200での演算を、記憶デバイス202に記憶されるプログラムに従って実行する。記憶デバイス202は、プロセッサ201の作業エリアおよび記憶媒体ないし記憶装置(以下、単に記憶媒体)で構成される。作業エリアは、いわゆるメモリで実現できる。また、記憶媒体は、各種プログラムやデータを記憶する非一時的なまたは一時的な記録媒体で実現できる。また、記憶デバイス202としては、たとえば、ROM(Read Only Memory)、RAM(Random Access Memory)、HDD(Hard Disk Drive)、フラッシュメモリで構成できる。
ここで、ロジックモデル構築支援装置103の記憶デバイス202には、プログラムとして、有向グラフ生成プログラム、シミュレーション実行プログラムおよび変動値算出プログラムが記憶される。これらはそれぞれ、図2の有向グラフ生成部1032、シミュレーション部1033での処理を、プロセッサ201に実行させることになる。
また、ロジックモデル構築支援装置103の記憶媒体は、図1のデータベース104や図2の記憶部1040に相当する。このため、記憶媒体はロジックモデル構築支援装置103とは別装置として実現できる。
また、入力デバイス203は、参加者や意思決定者といった利用者からの操作を受け付ける。入力デバイス203としては、たとえば、キーボード、マウス、タッチパネル、テンキー、スキャナ、マイクで実現できる。また、出力デバイス204は、プロセッサ201での処理結果などのデータを出力する。出力デバイス204としては、たとえば、ディスプレイ、プリンタ、スピーカで実現できる。通信IF205は、ネットワーク105と接続し、他の装置と通信し、ロジックデータ、各種指示やデータを送受信する。ロジックモデル構築支援装置103においては、通信IF205は、図2の通信部1031に相当する。以上で、実施例1の構成の説明を終わるが、図2、3も図1と同様に、後述の実施例2、3と共通である。
次に、社会的インパクト指標およびロジックモデルについて具体的に説明する。社会的インパクト指標は一般に明確な定義はないが、本実施例では、施策といった活動によって生み出される社会的影響を示す。そして、この社会的影響の度合いは、社会的インパクト指標は数値(定量値)として表すことができる。また、社会的インパクト指標が対象とするのは、平等、生活、健康、栄養、貧困、安全、正義といった問題である。また、地域における具体的事例には、住民の就労意識やSDGs認知度といった主観的な指標も含まれる。また、社会的インパクトはESG投融資やソーシャルインパクトボンドなどの金融おいて、投資判断に社会や環境への影響を考慮するために用いられることも多くなってきている。
ここで、社会的インパクト指標の評価には、いくつかの手法があるが、その一つにロジックモデルの利用がある。ロジックモデルは、ノードとエッジで構成されたネットワークモデル(例えば、有向グラフ)で表現できる。ここで、ノードは各種指標、エッジは指標間の因果関係を表す。また、ロジックモデルは、社会的プログラムの論理を明確化するための概念的ツールであり、具体的には、投入された資源が、目的とする社会的インパクト指標にどのような論理で影響を与えていくかを明確化することができる。一般的なロジックモデルは主に5つの層から構成されることが多い。各層についての説明を以下に記載する。
第一の層:インプット層は、施策に対する資源と制約の両方を含む。資源は施策が実施される時に利用され、人的資源、物的資源、金銭的資源だけでなく文化的資源も含まれる。これらの資源を活用し、制約の範囲内で有効な社会的インパクト指標を生み出すことが重要となる。
第二の層:アクティビティ層は、施策または施策実施のための行為、活動であって、プロセス、作業や行為が含まれる。
第三の層:アウトプット層は、実施者によるアクティビティ層の直接の結果である。また結果は、受益者にとっては提供される製品や各種サービス、プロジェクトへの継続的支援などの事業活動が含まれる。
第四の層:アウトカム層は、上記アウトプット層が及ぼす波及的効果であり、社会的インパクト指標を改善していく必要な指標を指す。「成果」の中の波及的効果の対象として、意欲の向上、満足度や認知度などの主観的指標が含まれることが多い。「成果」の中では短期的効果と長期的効果を分けて扱う場合もある。
第五の層:インパクト層(社会的インパクト層)は、実施者またはその関係者全体で共有する最終目標であり、社会問題の解決に向けた改善的指標である。大きくは格差是正などのSDGsで扱われる課題から、組織によっては、よりローカルな目標が掲げられる場合もある。また社会インパクト指標は、アウトプットやアウトカム指標が代替として扱われる場合もある。この場合は、中間的指標を目標とおいて検討される。
既往のロジックモデルは、波及効果を論理的に明確化することが主眼とされており、その波及効果として、特にアウトカム層には定性的・主観的指標が含まれている。これは、これらの指標群は社会的インパクト指標の目的から考えると必要な指標であり、論理の妥当性を評価する上では有効と思われる。
そこで、本実施例では、社会的インパクト指標が定量化可能なロジックモデルを用いる。具体的には、以下の処理を行う。
(1)まず、既存のロジックモデル(有向グラフ)のエッジに重み係数(数値)を付加することで、当該ロジックモデルにおける活動に対する社会的インパクト指標の定量値を算出する。
(2)次に、既存のロジックモデルの重み係数を操作して、既存のロジックモデル(有向グラフ)を修正することで、修正されたロジックモデルを表現する新たな有向グラフを生成する。なお、修正されたロジックモデルは、構築中のロジックモデルと表現できる。
(3)次に、新たな有向グラフが表現する構築中のロジックモデルにおける活動に対する社会的インパクト指標の定量値を算出する。この定量値は、操作された重み係数に応じて変化するになる。
(4)次に、既存のロジックモデルにおける社会的インパクト指標の定量値と構築中のロジックモデルにおける社会的インパクト指標の定量値の差分(変化量)を、変動値として算出する。なお、
(5)そして、変動値を参加者や意思決定者に提示することで、エッジと社会的インパクト指標の定量値の関係性を可視化することができ、納得性の高いロジックモデルを提供する。なお、提示する情報は、変動値(数値)に限定せず、差分に関する変動情報として扱うことができる。例えば、具体的な数値、変化の内容を示す詳細情報やその概要を示すアウトラインなどが含まれる。例えば、第1情報端末101-1~n(参加者)にはアウトラインを出力し、第2情報端末102(意志決定者)には、詳細情報を出力してもよい。さらに、第1情報端末101-1~n(参加者)ごとに異なる情報を含めてもよい。また、詳細情報には、変動値以外の情報としてもよい。
(5)そして、変動値を参加者や意思決定者に提示することで、エッジと社会的インパクト指標の定量値の関係性を可視化することができ、納得性の高いロジックモデルを提供する。なお、提示する情報は、変動値(数値)に限定せず、差分に関する変動情報として扱うことができる。例えば、具体的な数値、変化の内容を示す詳細情報やその概要を示すアウトラインなどが含まれる。例えば、第1情報端末101-1~n(参加者)にはアウトラインを出力し、第2情報端末102(意志決定者)には、詳細情報を出力してもよい。さらに、第1情報端末101-1~n(参加者)ごとに異なる情報を含めてもよい。また、詳細情報には、変動値以外の情報としてもよい。
なお、以上の既存のロジックモデル等は、ロジックモデルデータ1041として、記憶部1040に記憶される。また、算出された定量値や変動情報などが、社会的インパクト指標データ1042として、記憶部1040に記憶される。このために、ロジッモデル予め構築されることになる。
さらに、第1情報端末101-1~nや第2情報端末102の少なくとも2台においては、後述の図6~図9、図12の画面を共有することや当該画面に対する操作を実現できる。
次に、上述の処理の詳細について述べる。この処理の主たる処理主体の構成は、図2を参照して説明する。図4は、実施例1に係るロジックモデル構築支援処理を示すフローチャートである。本フローチャートの前提として、記憶部1040が、予めロジックモデルデータ1041として既存のロジックモデルを記憶しているものとする。
図4のステップS31において、有向グラフ生成部1032が、第1情報端末101-1~nや第2情報端末102のいずれから指示に応じて、記憶部1040のロジックモデルデータ1041から既存のロジックモデルを読み出す。ここで、ロジックモデルの読み出しは、所定周期などで有向グラフ生成部1032が自動的に読み出してもよい。さらに、記憶部1040が、ロジックモデル構築支援装置103とは別装置で実現する場合、通信部1031が、既存のロジックモデルを受け付けることになる。さらに、本ステップにおいて、既存のロジックモデルを、第1情報端末101-1~nや第2情報端末102のいずれかにおいて作成されたものを用いてもよい。
ここで、ステップS31で読み出される既存のロジックモデル等、本実施例で用いられるロジックモデルについて説明する。図5は、実施例1で用いられるロジックモデル例を示す図である。図5では、説明簡易のため、ロジックモデルを4層で表現しているが、層数が何れでも構わない。また、インプット層のノードを駆動ノード、インパクト層のノードを社会的インパクト指標、アクティビティ層~アウトカム層のノードを中間ノードとして表記している。なお、本図は、そのまま有向グラフとして扱うこともできる。
また、図5の各ノード間をつなぐエッジを実線および破線で示している。このうち、実線は正の重み係数、破線は負の重み係数を表している。正の重み係数が付加されているエッジは、エッジのソース側(矢印の根本)から、エッジのデスティネーション側(矢印の先)に対し正の効果を与えることになる。すなわち、ソース側のノードの効果が上昇されば、デスティネーション側のノードの効果が上昇すると期待される。例えば、学力向上との施策の場合、ソース側のノードが「学習意欲」を表し、デスティネーション側のノードが「テストの点数」であった場合、「学習意欲」の向上が「テストの点数」の向上につながるといった期待である。
負の重み係数は、前記正の重み係数の逆の関係を表す。また重み係数は、規格化する事で―1~+1までの実数を与えることができ、係数の絶対値は効果の影響の大きさを表す。
次に、図4に戻り、実施例1の処理の説明を続ける。図4のステップS32において、有向グラフ生成部1032が、読み出されたロジックモデルを表現する有向グラフを作成、つまり構築するロジックモデル構築処理を実行する。この際、有向グラフを表示させてもよい。なお、この表示は出力の一例であり、出力は表示以外の各種態様が含まれる。なお、以下の各実施例における表示も出力の一例であり、これに限定されない。
本ステップでは、有向グラフ生成部1032は、通信部1031を介して、有向グラフを、第1情報端末101-1~nおよび第2情報端末102の少なくとも1つに通知する。この結果、第1情報端末101-1~nおよび第2情報端末102が、通知された有向グラフ表示し、参加者および意思決定者のうち少なくとも1人がその内容を確認できる。なお、有向グラフ通知先(表示する)情報端末は、以下のように限定的としてもよい。例えば、該当のロジックモデルの納得性を上げるためにロジックモデルの修正を行いたい使用者が使用する情報端末してもよいし、第1情報端末101-1の少なくとも1台や第2情報端末102としてもよい。また、有向グラフはロジックモデルの表現形式の一例であり、通知や表示の対象は、ロジックモデルを示すものであればよい。このため、ロジックモデルを通知し、第1情報端末101-1~nや第2情報端末102が有向グラフを作成し、これを表示してもよい。また、該当のロジックモデルを、別の表示形式で表示してもよい。
ここで、表示画面例を図6に示す。図6において、表示画面501は、ロジックモデルを表示するロジックモデル表示部502と社会的インパクト表示部503がある。ロジックモデル表示部502には、通知された有向グラフ、つまり、ロジックモデルの構成図が表示される。図6図では、有向グラフをノードとエッジのグラフ構造で表示しているが、ノードリストやエッジリストとしてリスト化して表示してもよい。ノードリストでは、各ノードのリストが表示され、各ノードの表示情報には接続されるエッジと接続される先のノードがある。
また、社会的インパクト表示部503では、ロジックモデル表示部502の有向グラフが示すロジックモデルにおける各社会的インパクト指標が表示される。すなわち、社会的インパクト指標予測値(SI予測値)、社会的インパクト指標予測値(基準値)(SI予測値(基準値))、社会的インパクト指標予測値(変動値)(SI予測値(変動値))が表示される。
SI予測値は、以降のステップ(S33~S36)により修正された後のロジックモデルの社会的インパクト指標の定量値が表示される。図6では、修正前のため、この後説明するSI予測値(基準値)がそのまま表示される。また、SI予測値(基準値)には、ロジックモデル表示部502の有向グラフが示すロジックモデルの社会的インパクト指標の定量値、すなわち修正前の定量値が表示される。SI予測値(変動値)には、変動情報の一例であり、先のSI予測値とSI予測値(基準値)の差分(変化量)である変動値が表示される。この差分は、変動率でもよい。変動率は、前記差分をSI予測値(基準値)で除算した値である。なお、図6の例では、S33~S36での修正前のため、変動値はは0である。なお、本実施例では、社会的インパクト指標として二つの指標を上げている。それぞれ、社会的インパクト指標1(SI1)、社会的インパクト指標2(SI2)に該当する。なお、図6の表示画面501は、ロジックモデル表示部502のみとしてもよい。
次に、図4に戻り、実施例1の処理の説明を続ける。図4のS33において、ノードの選定処理を実行する。このために、まず、第1情報端末101-1や第2情報端末102が、参加者や意志決定者から、ロジックモデル表示部502に表示されたノードの内、変更を希望するノードの選定を受け付ける。次に、第1情報端末101-1や第2情報端末102が、ネットワーク105を介して、ロジックモデル構築支援装置103に、選定されたノードを通知する。そして、有向グラフ生成部1032が、通信部1031を介して、選定されたノードを受け付ける。
また、ステップS34において、ステップS33のノードの選定に応じて、エッジやノードの詳細表示処理を行う。このために、有向グラフ生成部1032が、選定されたノードの詳細情報をロジックモデルデータ1041から特定する。この詳細情報には、ノードの接続先のエッジやその重み係数が含まれる。次に、有向グラフ生成部1032が、通信部1031を用いて、第1情報端末101-1や第2情報端末102に、この詳細情報を通知する。そして、第1情報端末101-1や第2情報端末102が、詳細情報を含む表示を行う。
また、ステップS35において、参加者や意思決定者からの操作に応じて、ステップS34で表示されたエッジの重み係数を変更する変更処理を行う。このために、第1情報端末101-1や第2情報端末102が、参加者や意志決定者から、変更後の重み係数を受け付ける。次に、第1情報端末101-1や第2情報端末102が、ネットワーク105を介して、ロジックモデル構築支援装置103に、変更された重み係数を通知する。次に、有向グラフ生成部1032が、通信部1031を介して、変更された重み係数を受け付ける。そして、有向グラフ生成部1032が、ロジックモデルデータ1041の重み係数を、受け付けられた重み係数に変更する。
また、ステップS36において、シミュレーション部1033が、変更された重み係数を用いて、シミュレーション処理を実行する。このシミュレーション処理には、変更された重み係数を用いたSI予測値や変動値の算出が含まれる。また、シミュレーション処理では、変動情報の作成が含まれる。
ここで、ステップS33~S36の具体例を説明する。ここでは、表示された有向グラフが表現するロジックモデルにおいて、中間ノード2-2と付記されたノードが選定された場合の例を説明する。まず、ステップS33において、ロジックモデル表示部502上の当該ノードに対するクリックまたはタップなどによる選定を受け付ける選定処理を実行する。次に、上述のように、ステップS34において、選定されたノードおよびこのノードに対応するエッジについて表示される。本ステップでは、図7で示す選択中ノード画面604によって、選定された当該ノードの詳細が表示される。表示される内容は、選定されたノードを接続先とするノードおよびエッジである。本画面例では、選定中ノードは中間ノード2-2である。このため、中間ノード2-2を接続先とするノードおよびエッジは、中間ノード1-1と番号1のエッジ、中間ノード1-2と番号2のエッジ、中間ノード1-3と番号3のエッジ、中間ノード1-4と番号4のエッジである。
また、該当するエッジに対して、各重み係数を表示する。本画面例では、エッジ番号1は0.25、エッジ番号2は-0.25、エッジ番号3は-0.25、エッジ番号4は0.25である。ここでは、絶対値の総和が1になるように配分されているとする。
次に、ステップS35において、第1情報端末101-1~nや第2情報端末102が、参加者や意志決定者から、エッジに対応する重み係数の変更を受け付ける重み係数変更処理を実行する。この結果、図8に示すように、エッジ番号と重み係数の表示部701の重み係数の数値が、第1情報端末101-1~nや第2情報端末102に付随するキーボードなどの入力デバイス203によって入力および変更される。図8の画面例では、エッジ番号1の重み係数は0.40に変更、エッジ番号2に対応する重み係数は-0.10に変更、エッジ番号3の重み係数は-0.40に変更、エッジ番号4の重み係数は0.10に変更される。その後、第1情報端末101-1や第2情報端末102が、参加者や意志決定者から、適用ボタン702をクリック等による選択を受け付ける。このことにより、変更後の重み係数はネットワーク105を介して、ロジックモデル構築支援装置103に送付される。そして、ステップS36において、エッジの変更に伴う社会的インパクト指標の定量値の再計算、つまり、SI予測値や変動値の算出を含む変動情報の作成が実行される。
次に、ステップS37において、ステップS36のシミュレーション処理の結果についての変動情報表示処理を実行する。このために、シミュレーション部1033が、通信部1031を用いて、第1情報端末101-1や第2情報端末102に、少なくともSI予測値および変動値を含むシミュレーション結果を通知する。そして、第1情報端末101-1や第2情報端末102が、通知されたSI予測値および変動値を表示する。
以下では、その画面例を説明する。図9に示すように、通知された変動量は社会的インパクト表示部803に表示される。当該社会的インパクト表示部803において、SI1予測値およびSI2予測値は、エッジ変更に伴う社会的インパクト指標の定量値の再計算によって、それぞれ0.113と0.113に変化されたものが表示される。また、SI1変化量(変動値)、SI2変化量(変動値)は、前記予測値とSI1予測値(変更前)、SI2予測値(変更前)との差分であるそれぞれ+0.019、+0.019が表示されている。本画面例ではSI1とSI2の予測が同様に変化したが、ロジックモデルの変更如何によって異なる変化することもありうる。
以下では、その画面例を説明する。図9に示すように、通知された変動量は社会的インパクト表示部803に表示される。当該社会的インパクト表示部803において、SI1予測値およびSI2予測値は、エッジ変更に伴う社会的インパクト指標の定量値の再計算によって、それぞれ0.113と0.113に変化されたものが表示される。また、SI1変化量(変動値)、SI2変化量(変動値)は、前記予測値とSI1予測値(変更前)、SI2予測値(変更前)との差分であるそれぞれ+0.019、+0.019が表示されている。本画面例ではSI1とSI2の予測が同様に変化したが、ロジックモデルの変更如何によって異なる変化することもありうる。
次に、ステップS38において、変更された社会的インパクト指標に納得したかを判断する。このために、まず、第1情報端末101-1や第2情報端末102が、参加者や意志決定者から、納得したかの入力を受け付ける。そして、第1情報端末101-1や第2情報端末102が、ネットワーク105を介してロジックモデル構築支援装置103に、納得したかを示す入力内容を通知する。次に、ロジックモデル構築支援装置103のシミュレーション部1033が、通信部1031を介して、通知された入力内容を受け付ける。そして、シミュレーション部1033は、納得している場合には、ステップS39に遷移する。また、納得していない場合、ステップS33に遷移する。
また、ステップS39において、シミュレーション部1033が、通信部1031を介して第1情報端末101-1や第2情報端末102に、変更されたロジックモデルをデータベース104に、ロジックモデルデータ1041として保存する。一方で、納得していない場合には、ステップS303に戻り、以降の処理を繰り返す。
このようにして、参加者や意思決定者といった使用者は、計算処理によって得られた社会的インパクト指標の定量値および該当するロジックモデルの修正の際に社会的インパクト指標の定量値の変動値を参照することができる。このことで、使用者が納得のいくロジックモデルの構築を支援することが可能であり、使用者は効率的に社会的インパクト指標の高い施策の決定を行うことが期待できる。ここで、「使用者が納得のいく」とは、「妥当性の確保」の一例であり、使用者からの承諾する旨の入力を受け付けることや使用者が設定した指標値を満たすことで確認できる。
実施例2では、実施例1と比較して、ノード影響度合いを考慮し、参加者や意思決定者といった使用者がロジックモデルの修正の際に行うノード選定を支援する機能を追加した事例である。なお、実施例2でも、各装置の構成は実施例1と同様である。このため、実施例2の処理フローについて説明する。図10は、実施例2に係るロジックモデル構築支援処理を示すフローチャートである。実施例2では、図4の実施例1のフローチャートに対し、ノード影響度合いの算出(ステップS901)が追加されている。さらに、ステップS901の追加に応じて、ステップS32が変更されている(S32-1)。また、図10において、実施例1と共通のステップについては、同じ符号を付記している。
以下、実施例1との相違である、ステップS901について説明する。本実施例では、使用者が、ロジックモデルの修正を行う際に、修正するノードを選択する必要がある。しかし、ロジックモデルのノード数が多数の場合には、どのノードから選択することが、納得性の高いロジックモデルを得られるために効率が良いかわからないという課題がある。そのため、使用者が、順々に総当たりでノードを選定していく必要がある。実施例2では、ノード影響度合いの算出(ステップS901)によって、社会的インパクト指標の定量値に影響度がより大きいノードを使用者に提示することで、ロジックモデルの修正の際におけるノードの選定を支援することになる。
ここで、ステップS901では、有向グラフ生成部1032が、該当のノードにおける社会的インパクト指標に対する影響度合いを示すノード影響度合いを次のように算出する。ここで、算出対象をノードAとする。有向グラフ生成部1032は、ノードAを接続先とするエッジの重み係数以外の重み係数をそれぞれ所定の値に固定する。この所定の値は、例えば平均値等の代表値などである。その後、有向グラフ生成部1032は、ノードAの定量値を変化させる。この変化は、例えば0~1間で連続的に実行される。有向グラフ生成部1032は、ノードAの定量値を変化させた場合の社会的インパクト指標の定量値の値を記録しておき、そのうち、最大値と最小値、または基準値と最小値の比較を行う。ここで基準値とは、あらかじめ決めておいた数値であり定量値からの変化量(変動値)が0~1ならば例えば0.5などである。また、有向グラフ生成部1032は、以下の(数1)を用いて、その最小値または基準値を基準として、前述の比較した差分値の比率を変動値とする。
影響度合いノードA=(社会的インパクト指標の定量値の基準値-社会的インパクト指標の定量値の最小値)/(社会的インパクト指標の定量値の最小値)・・・(数1)
有向グラフ生成部1032は、この処理を、各中間ノードに対して行い、影響度合いを比較する。ここで、基準値は差分値が0となるため、影響度合いも0と定義する。本例で用いたロジックモデルの各ノードの影響度合いを図11に示す。図11は、実施例2におけるノード影響度合いを示すグラフである。このグラフでは、中間ノードごとに、その影響度合いを示している。また、社会的インパクト指標が複数ある場合には、影響度合いとして、各社会的インパクト指標への影響度の平均や合計など代表値が用いられることとなる。図11の例では、最も社会的インパクト指標への影響度合いが大きいノードは中間ノード2-2であることがわかる。そして、二番目に影響度合い大きいノードは中間ノード1-1、三番目に大きなノードが中間ノード1-4である。ロジックモデルの修正を行う場合には、影響度合いの大きいノード(または小さいノード)から行うと効率的である。
有向グラフ生成部1032は、この処理を、各中間ノードに対して行い、影響度合いを比較する。ここで、基準値は差分値が0となるため、影響度合いも0と定義する。本例で用いたロジックモデルの各ノードの影響度合いを図11に示す。図11は、実施例2におけるノード影響度合いを示すグラフである。このグラフでは、中間ノードごとに、その影響度合いを示している。また、社会的インパクト指標が複数ある場合には、影響度合いとして、各社会的インパクト指標への影響度の平均や合計など代表値が用いられることとなる。図11の例では、最も社会的インパクト指標への影響度合いが大きいノードは中間ノード2-2であることがわかる。そして、二番目に影響度合い大きいノードは中間ノード1-1、三番目に大きなノードが中間ノード1-4である。ロジックモデルの修正を行う場合には、影響度合いの大きいノード(または小さいノード)から行うと効率的である。
このために、ステップS32-1において、影響度合いを考慮した表示処理を行う。例えば、有向グラフ生成部1032が、影響度合いやその順位を含む有向グラフを作成し、第1情報端末101-1や第2情報端末102がこれを表示する。ここで、図12に、前記影響度合いを、ロジックモデルを表現する有向グラフ上に提示した例を記載する。本図では、影響度合い1位から3位(上位)のノードを使用者に提示している。但し、全順位、または下位の順位の表示や、順位でなく影響度合いの数値の表示を行ってもよい。さらに、上述の上位のノードを他と区別したり、限定的に表示したりしてもよい。
以上のように、影響度合いを算出し、それをロジックモデル上に提示することで、使用者は、ロジックモデルの修正時に、修正するノードの選択の候補として参照することが可能となる。
実施例3および後述の実施例4では、上述の定量化手法例について説明する。そこで、本実施例では、多数の施策候補間における社会的インパクト指標の差を定量的に予測(定量化)し、社会的インパクト指標が最大となるような施策検討の支援を行う。この際、施策候補についてのロジックモデルを表現する有向グラフを生成し、以下、その内容を説明する。なお、本実施例や実施例4では、有向グラフの生成を、ロジックモデルの構築と表現する。但し、実施例1や3と同様に、有向グラフはロジックモデルの一形式であり、他の形式でロジックモデルを表してもよい。このため有向グラフ生成部1032は、ロジックモデル構築部とも表現できる。
図13は、実施例3に係る社会的インパクト指標定量化処理のフローチャートである。この社会的インパクト指標定量化処理は、大きく定量化を可能とするためのロジックモデルの構築プロセスS301とシミュレーションプロセスS302の2つの処理ブロックに分けられる。まず、定量化向けロジックモデルの構築プロセスS301は、上述の有向グラフの生成処理に該当し、ノード選定処理S303、エッジ重み予測処理S304、駆動ノードのパラメータ設定処理S305を有する。ノード選定処理S303は、IT支援等によるワークショップなどを通じて得られたデータを用いて、ロジックモデルに必要なノードを選定する。また、エッジ重み予測処理S304は、定量化のためにエッジに選定に基づいて重みを予測、付加する。以上により、ロジックモデルが構築されることになる。そして、駆動ノードのパラメータ設定処理S305は、S304で作成されたロジックモデルをシミュレーション可能とするためのノード(駆動ノードと呼称)のパラメータを設定し、定量化可能なロジックモデルが構築されることになる。なお、ロジックモデルの構築プロセスS301は、第1情報端末101を利用して、参加者から取得するデータ(指標に重要であるとの入力)を用いて行われる。
また、シミュレーションプロセスS302では、S301で構築されたロジックモデルについて、施策策定のための定量化および評価を行う。このために、シミュレーションプロセスS302は、シミュレーション処理S306および解析処理S307を有する。シミュレーション処理S306は、ロジックモデルに付加された駆動ノードを起点に時間発展処理を実行することで、社会的インパクト指標の定量化シミュレーションを実行する。
また、解析処理S307は、シミュレーション処理S306の結果解析を行う。以下、各処理の詳細を順に説明する。また、以下の説明では、具体的事例として、簡単な地域における自然エネルギーを導入した場合の節電要請を例とする。この際の社会的インパクト指標は「節電受容度」とし、施策としては「節電要請」とする。なお、以下、社会的インパクト指標は、単に指標とも称する。なお、社会的インパクト指標の定量化のためには、ロジックモデルに、駆動ノードの導入とエッジへの重みの付加について追加することになる。これらを中心に、本実施例の処理を図13のフローチャートに従って、説明する。
まず、ノードの選択処理S303では、有向グラフ生成部1032が、ロジックモデルにおける前述の5つの層の各層における指標を選定する。ここで、本実施例におけるロジックモデルでは、前述の5層を、定量化の観点で振る舞いの異なる2層にまとめて考える。まとめ方は、インプット層とアクティビティ層とアウトプット層をまとめた第一の層(インプット/アクティビティ/アウトプット)とする。また、同様にアウトカム層とインパクト層でまとめた第二の層(アウトカム/社会的インパクト)とする。本処理では、以上の各層、つまり、ノードの洗濯が実行される。
ここで、図14は、ノード選定処理S303で選定(ピックアップ)されたノードを示す図である。図14で例示している層は、それぞれ第一の層401と第二の層402である。また、図14では、第一の層401、第二の層402内に指標を例示している。第一の層401として例示している指標は、以下の指標である。
発電設備規模(太陽光)403
発電設備規模(ナノ水力)404
節電要請度合405
節電要請回数(平日、逼迫)406
節電要請回数(平日、非逼迫)407
節電要請回数(休日、逼迫)408節電要請回数(休日、非逼迫)409
もちろん、これ以外の指標を追加または削除することができる。また、第二の層402として、例示している指標は、環境に対する配慮意識410、節電要請に対する不満意識(ネガティブノード、Negative node)411、節電受容度412である。第二の層402についても、これら以外の指標を追加または削除することができる。ここで、節電要請に対する不満意識411はNegative nodeと付記している。
発電設備規模(太陽光)403
発電設備規模(ナノ水力)404
節電要請度合405
節電要請回数(平日、逼迫)406
節電要請回数(平日、非逼迫)407
節電要請回数(休日、逼迫)408節電要請回数(休日、非逼迫)409
もちろん、これ以外の指標を追加または削除することができる。また、第二の層402として、例示している指標は、環境に対する配慮意識410、節電要請に対する不満意識(ネガティブノード、Negative node)411、節電受容度412である。第二の層402についても、これら以外の指標を追加または削除することができる。ここで、節電要請に対する不満意識411はNegative nodeと付記している。
ここで、当該指標は、値が負になると改善方向で、他の指標、例えば環境に対する配慮意識410とは改善方向の正負が逆となる。例えば,これらの指標を数値化した場合,指標「環境に対する配慮意識」410は数値が上昇すると配慮意識が上がるためポジティブとなる。一方、指標「節電要請に対する不満意識」411は値が大きいと不満意識が上がるため、ネガティブとなる。このことは、後処理のシミュレーションをする際に煩雑化するため、ネガティブなノードは極性を反転させ、値が大きくなると不満意識が下がるようになることを示す。
なお、当該ノードはネガティブノードと付記する(例えば、指標「節電要請に対する満足意識」に変換してポジティブノードにすることと等価と考えれる)。また、改善方向の判断が難しい指標についても、あらかじめどちらかに決めておく必要がある。
ここで、第一の層として、発電設備や節電要請に関する活動の指標(ノード)が選定されている。この節電要請は、自然エネルギーの電力が不足しているときに一定量の電力削減を要請するものとする。また、節電要請の発生は自然エネルギーの発電量に依存するため,発電設備の導入規模や節電要請度合が指標となる。
また、節電要請は、状況によっていくつかに分割されている。本例では、曜日や切迫・非切迫の組合せにより分割されている。まず、曜日として月曜日~金曜日(平日とする)か土曜日、日曜日(休日とする)で分割される。また、外気温が逼迫(35℃以上または5度以下とする)を示すか非逼迫時(前述条件外とする)を示すかの組み合わせで、4つの指標となる。
また、これら指標、つまり、ノードの選定は、あらかじめ関連するキーワードでデータベース化し,必要な指標をデータベース104より選定する方法や、ワークショップ等で選定する方法で実現できる。そして、有向グラフ生成部1032が、各情報端末に対する操作や所定規則に従って、各指標を選定する。この各指標が、ロジックモデルのノードとなる。なお、ワークショップとは、ロジックモデル構築支援システム100を用いて、各種端末からデータを取得することが含まれる。
また、エッジ重み予測処理S304において、有向グラフ生成部1032は、S303で選定されたしたノード間をエッジで結合し、各エッジの重みを予測する。ここで、エッジでの結合は、本来は因果関係を論理的に表現されるものであるが、定量化の場合には、ノード間に計算式が挿入される場合がある。
この例を、図15に示す。図15は、本実施例に係るエッジを結合したロジックモデルを示す図である。図15の例では、インプット/アクティビティ/アウトプット層に電力の需給計算を行う処理513が挿入されている。このように挿入される理由は、発電設備による発電量の変動が節電要求の頻度に影響を与え得るためである。この影響を、詳細に計算するためには、電力需給計算をシミュレーションで実現できる。また、簡易的に計算するためには、発電設備を考慮せず、あらかじめ節電要求の頻度で決めてしまう方法(例えば,平均月に節電要求が2回発生するなど)で実現できる。
ここで、エッジには、指標510に入力する4つのエッジ514、指標511に入力する4つのエッジ515、指標512に入力する2つのエッジ516がある。なお、図15では、エッジ515はネガティブノード(指標511)に入力するエッジのため、ポジティブノードとの異なることを明示するために、破線で記載している。
さらに、有向グラフ生成部1032により、図15の各エッジ(514,515、516)に重み(-1~1までの数字)を付加(予測)したロジックモデルを図16に示す。さらに、図16のロジックモデルに対して、指標610の4つのエッジ614を抜き出した図を図17に示す。指標710に対し、指標706から入力するエッジに付加される重みは0.0(図番号717)である。また、指標707から入力するエッジに付加される重みは+0.66(図番号718)である、また、指標708から入力するエッジに付加される重みは0.0(図番号719)である。また、指標709から入力するエッジに付加される重みは+0.34(図番号720)である。
なお、本実施例では、有向グラフ生成部1032は、以下のルールに従って、重みを付加(予測)するものとする。
1.ひとつの指標ノードに入力するエッジの重みの総和の絶対値が「1」とする。
2.マイナスの重みを付加されたエッジが入力されるノードと,プラスの重みが付加されたエッジが入力されたノードは分ける。なお、有向グラフ生成部1032は、通信部1031を用いて、各情報端末に対して、図14~16に示すロジックモデルを出力することが望ましい。この結果、各情報端末は、出力デバイス204に、図14~16に示すロジックモデルを表現する有向グラフを表示することが可能となる。
1.ひとつの指標ノードに入力するエッジの重みの総和の絶対値が「1」とする。
2.マイナスの重みを付加されたエッジが入力されるノードと,プラスの重みが付加されたエッジが入力されたノードは分ける。なお、有向グラフ生成部1032は、通信部1031を用いて、各情報端末に対して、図14~16に示すロジックモデルを出力することが望ましい。この結果、各情報端末は、出力デバイス204に、図14~16に示すロジックモデルを表現する有向グラフを表示することが可能となる。
また、有向グラフ生成部1032は、施策の決定者または利害関係者の価値観(選好順序)を基に、エッジの重みの値を決定し、これを付加する。この例について、図17を用いて説明する。
図17では、指標710「環境に対する配慮意識」に対し、上から順に指標706「節電要請・平日・逼迫」、指標707「節電要請・平日・非逼迫」、指標708「節電要請・土日・逼迫」、指標709「節電要請・土日・非逼迫」の4ノードが接続されている。このことは、4つの節電要請により環境に対する配慮意識が変化する論理を表している。また、重みは、どのくらい影響を与えるかを意味する。この影響を与える度合は、客観的(統計的相関値)から導くことも可能だが、ここでは主観的な選好順序で与える場合を想定する。重みが「0.0」の場合は影響がない、または未考慮と思う場合で、影響の大きいと思う順番に絶対の大きな重みが付加される。マイナスの影響の場合には負の重みが付加される。
例えば、図17の例では、有向グラフ生成部1032が、指標707「節電要請・平日・非逼迫」の影響(重み+0.66、図番号718)が最も大きいと判断する。また、有向グラフ生成部1032は、次点は指標706「節電要請・土日・非逼迫」(重み+0.34、図番号720)とする。そして、有向グラフ生成部1032は、それ以外は無関係(逼迫時に節電要請があってもポジティブに受け止められないと仮定)とする。これらを、選好順序で表せば、「環境に対する配慮意識」への節電要請の度合として、「節電要請・平日・非逼迫」>「節電要請・土日・非逼迫」となる。
また、前述の通り、重みの総和を「1」としているので、有向グラフ生成部1032は、線形配分などにより選好順序から重みを推定(予測)することが可能である。図17の例では、0.0+0.66+0.0+0.34=1である。また、有向グラフ生成部1032は、他のノードに対しても同様に行うこと重みを付加できる。つまり、ネガティブノードに入力するエッジがマイナスの重みの場合には、総和は「-1」となるようにする。また、上記ルール2番の通り、ネガティブノードとポジティブノードは分けて考え、ある指標ノードにプラスの重みが付加されたエッジが入力する場合には、マイナスのエッジが付加されたエッジは入力しない。
次に、駆動ノードのパラメータ設定処理S305について説明する。ここで、駆動ノードは、定量化可能ロジックモデルに必要なノードであり、従来のロジックモデルにはない定義である。有向グラフ生成部1032は、駆動ノードとして、インプット/アクティビティ/アウトプット層から施策候補として考えたいノードとして選定する。本実施例においては、図14で示した指標「発電設備」403、404、および指標「節電要請度合」405を変化させた時を施策候補とすることが望ましい。このため、有向グラフ生成部1032は、駆動ノードとして、指標「発電設備規模(太陽光)」403、「発電設備規模(ナノ水力)」404、「節電要請度合」405を特定する。また別の方法として、インプット/アクティビティ/アウトプット層内で計算を行わない場合には、有向グラフ生成部1032は、駆動ノードとして以下の指標を設定する。
指標「節電要請・平日・逼迫」406
指標「節電要請・平日・非逼迫」407
指標「節電要請・土日・逼迫」408
指標「節電要請・土日・非逼迫」409
また、有向グラフ生成部1032は、指標「発電設備規模(太陽光)」403、指標「発電設備規模(ナノ水力)」404および指標「節電要請度合」405を除外することもできる。
指標「節電要請・平日・逼迫」406
指標「節電要請・平日・非逼迫」407
指標「節電要請・土日・逼迫」408
指標「節電要請・土日・非逼迫」409
また、有向グラフ生成部1032は、指標「発電設備規模(太陽光)」403、指標「発電設備規模(ナノ水力)」404および指標「節電要請度合」405を除外することもできる。
ここで、駆動ノードに対しては、時系列パラメータをあらかじめ設定しておく必要がある。時系列パラメータは、例えば1月~12月の各月の値などである。そして、指標「発電設備規模(太陽光)」403であれば、時系列パラメータとして太陽光発電のシステム容量(kW)があげられる。一般に、発電設備のシステム容量は時間で変化しないため、時系列パラメータとして1月~12月まで同一の数字(10kWなど)が与えられる。
一方、指標「節電要請・平日・逼迫」406を駆動ノードと置いた場合には、1月に節電要請する数、2月に節電要請する数などが時系列パラメータとして設定される。図18に、本実施例に係る駆動ノードのパラメータ設定の例を示す。本例では、パラメータ設定は月単位で1年分を想定している。
また、図18の上図801は太陽光発電のシステム容量例で,図18の下図802は節電要請の発生回数の例である。また、駆動ノードの出力は、単位が異なる場合があるため必要に応じて0~1などの数値に規格化する必要がある。ここで、規格化は任意の関数を用いるが、基本的には後段のロジックへの影響度合いが反映できていればよい。例えば、同一単位の駆動ノード間の最大値で規格化する方法がある。つまり、駆動ノードのパラメータ設定S305において、有向グラフ生成部1032は、自身が上述のように定める時系列パラメータを設定(特定)する。
以上のS303~S305で構成されるロジックモデルの構築プロセスS301により、有向グラフ生成部1032は、定量化可能ロジックモデルを構築する。なお、有向グラフ生成部1032は、構築された定量化可能ロジックモデルを、ロジックモデルデータ1041として記憶部1040に記憶することになる。
次に、シミュレーションプロセスS302について、説明する。まず、シミュレーション処理S306において、シミュレーション部1033が、定量化可能ロジックモデルに対し、時間発展的シミュレーションを実行する。このシミュレーションは、最小の時間ステップは1時間相当で実行され、必要に応じて1月単位などに変更することができる。また、シミュレーション部1033は、毎時間のステップに対し、駆動ノードに設定されたパラメータに従って、接続されたノードに値が転送する。そして、シミュレーション部1033は、接続されたノードにおいて、転送された値に応じて所定の処理を実行する。この結果、ノードに対する定量化処理が実行されることになる。なお、このシミュレーションプロセスS302は、実施例1や2のシミュレーション処理(ステップS36)と同じであることが望ましい。このため、実施例1や2のシミュレーション処理(ステップS36)において、シミュレーションプロセスS302が実行されることが望ましい。
ここで、図19を用いて、図17で例示したノード「環境に対する配慮意識」を例にしたシミュレーション部1033による定量化処理を説明する。図19に示す本ノードは4つの入力を持つため、図19のファンクションで示された計算式920において、n=4となる。シミュレーション部1033は、本計算式を基に本ノードの指標値(St、Stは、ある時間ステップtの時の指標値を示す。)を決定する。ここで、初期値S0は0としている。
但し、あらかじめ初期値の値がアンケートなどで分かっている場合には0以外の値を初期値としても指定できる。シミュレーション部1033は、本計算式の処理を、ある時間ステップにおいてアウトカム/社会的インパクト層のノードに対して実行し、それぞれのノードの指標値を算出する。さらに、シミュレーション部1033は、時間発展的に時間ステップを進めて各ノードの指標値(時間ステップtの次の時間ステップt+1の指標値であるSt+1)を更新する。そして、シミュレーション部1033は、既定回数の時間ステップを繰り返し処理することで、既定回数後の各ノードの指標値を得ることができる。既定回数は、本例では時間ステップを1か月単位として、1年間とするため、12回(12月分)となる。
また、シミュレーション部1033は、同一ロジックモデルに対して、駆動ノードのパラメータを変えてシミュレーションすることにより、異なる施策間での指標値の差を比較することができる。こうすることで、シミュレーション部1033は、指標値最大となる施策を探索することも可能である。上記指標値の中には定量化の目標ノードである社会的インパクト指標(本例では節電受容度)も含まれるため、本シミュレーションにより社会的インパクト指標の定量化が可能となる。また、このようにして定量化された社会的インパクト指標を、シミュレーション部1033が異なる施策間での解析を行うことが可能となる。このことについては、後述のS307で説明する。なお、S307については、シミュレーション部1033とは別の評価部で実行してもよい。
ここで、本実施例における具体的な値を示して定量化事例を記載する。本事例では、駆動ノードのパラメータ設定に必要なデータは自然エネルギーの発電ポテンシャルや住民の消費電力量を用いる。また、節電要請は自然エネルギーが需要に対して不足している場合に一定の割合で行い、節電要請後も不足している場合には電力市場等から購入することを想定している。また、本事例では駆動ノードのパラメータとして太陽光発電設備のシステム容量、小水力発電設備の有効落差および節電要請度合を設定する。
また、シミュレーション部1033は、各発電設備の規模から発電量を推定し、また住民の消費電力量から、あらかじめ需給計算を実施し、節電要請の発生の時系列パラメータを算出する。本算出は、本実施例ではあらかじめ実施したが、シミュレーションプロセスS302の際に実施することが望ましい。
ここで、駆動ノードのパラメータを、図20に示す。図20に示すように、施策の組み合わせは36通りとなる。説明のため、図20の各施策には施策番号を付記する。施策番号1を(0kW, 0m, 30%)とし、施策番号2を(10kW, 0m, 30%)がとする。つまり、太陽光、小水力、節電要請度合の順に変化させ番号を付記する。また、施策番号36は(20kW, 2m, 0%)となる。
また、各施策番号における、あらかじめ算出した施策要請の発生回数を示すグラフを、図21および図22に示す。施策要請は、図14で記載した通り4つの指標ある。つまり、それぞれ、節電要請回数(平日、逼迫)406、節電要請回数(平日、非逼迫)407、節電要請回数(休日、逼迫)408、節電要請回数(休日、非逼迫)409、である。図21には、36通りの各施策の年間の節電要請回数(平日、逼迫)406、節電要請回数(平日、非逼迫)407を示している。また、図22には、節電要請回数(休日、逼迫)408、節電要請回数(休日、非逼迫)409を示している。
なお、シミュレーション部1033は、通信部1031を用いて、各情報端末に対して、図11および12に示すグラフを出力することが望ましい。この結果、各情報端末は、出力デバイス204に、図21および22に示すグラフを表示することが可能となる。また、本処理において、シミュレーション部1033は、定量化可能ロジックモデルの各辺の重みとして、図16に記載のものを用いる。
次に、シミュレーション処理S306でのシミュレーション結果を図23に示す。図23には、定量化可能ロジックモデルの各ノード「環境に対する配慮意識」、「節電要請に対する不満意識(Negative node)」および社会的インパクト指標である「節電受容度」の施策別の値が図示されている。「節電要請に対する不満意識」はネガティブノード(Negative node)であるため、図23上では正の値となっているが、他の指標と異なり、正の値は悪化方向を示す。そのため、実質的にはマイナス値として考慮している。
また、施策番号1から9におけるノード「節電受容度」を見てみると、本指標は減少していることがわかる。一方で,施策番号1~9にかけては太陽光および小水力発電設備の規模が大きくなっている。すなわち、本ロジックモデルでは発電規模が大きくなると節電受容度が減少することがわかる。直感的に考えると,自然エネルギーの導入は節電受容度を上昇させると考えられるが逆の効果となった。
以上について、解析処理S307において、シミュレーション部1033が、シミュレーション結果を解析する。この結果、シミュレーション部1033は、前段のノードである「環境に対する配慮意識」と「節電要請に対する不満度」に起因していることを特定する。本ロジックモデルは節電要請の際に「環境に対する配慮意識」が上がる、という主観的仮定に基づいている。但し、これは逆に考えると、発電設備が潤沢にある場合には電力不足が発生せず、環境に対する意識が希薄化してしまうことを示唆している。
一方で少しでも電力が足りない場合には一定の不満度がたまってしまう。このため、解析処理S307の結果として発電規模を上昇させて節電要請回数を減らしてもゼロにしない限りは、むしろ社会的インパクト指標を下げてしまうという結果が得らえう。よって、本実施例では、節電要請度合が0でない場合において、社会的インパクト指標を最大とする施策は、施策番号19、および20であり、それぞれの指標値は-19.19となった。解析処理S307によって、シミュレーション部1033が、このような最大値の探索などを行う。ここで、この最大値は、各指標における相対的なものである、このため、シミュレーション部1033の最大値探索とは、各施策に対する合意形成のための相対評価の実行を意味する。また、シミュレーション部1033は、最大値を示す施策を、社会的インパクト指標が改善する施策して特定できる。
そして、シミュレーション部1033が、通信部1031を用いて、社会的インパクト指標が改善する施策を、第2情報端末102に出力することになる。この結果、第2情報端末102は、出力デバイス204に、当該施策を表示できる。このため、改善する施策についての提案を意思決定者に行うことができる。なお、評価部1034は、社会的インパクト指標が改善する施策を、第1情報端末101に出力してもよい。この結果、第1情報端末101は、出力デバイス204に、当該施策を表示できる。このため、上述の提案を、参加者に提示することも可能となる。なお、本実施例でにおいては、支援者が用いる第3情報端末をネットワーク105に接続してもよい。この場合、社会的インパクト指標が改善する施策を、第3情報端末に表示することが可能となる。以上で、実施例3の説明を終わる。
実施例4では、施策として、ESG投融資を行う際の事業や企業を評価する場合の例である。なお、本実施例でも実施例1と同様の構成で処理を実行する。実施例4では、駆動ノードには、投資対象の事業や企業に関する指標があげられる。例えば、地域内の従業員数であったり、当該投融資のうち地域内に還元する割合(域内分配率)であったり、である。
また、アウトカム/社会的インパクト層には、SDGsに関連する指標や投資元企業が重要視している指標が用いられる。例えば例えば、CO2排出量(または削減量)や、従業員の就労満足度などの主観的指標も用いることができる。ロジックモデルのエッジの接続関係や重みは、投資元企業が考える基準に従って構築することが考えられる。そのようにして得られた定量化可能ロジックモデルに対し、投融資の効果が影響する駆動ノードのパラメータを変化させてシミュレーションを実行し、社会的インパクト指標を定量化する。それにより、本システムは、例えば、社会的インパクト指標が最大となりうる投融資の事業や企業の形態(投融資の分配率など)を、投融資の意思決定者に提案することができる。
以上で、本発明の実施例4の説明を終了する。なお、実施例3、4によれば、社会的インパクト指標の数値による定量化が可能となる。また、主観的指標の時間的変化を考慮し、かつ多数の施策候補のそれぞれの社会的インパクト指標の数値を比較することで、施策間の相対評価を実現することになる。このことで、施策についての合意形成を支援可能となる。
100…ロジックモデル構築支援システム、101…第1情報端末、102…第2情報端末、103…ロジックモデル構築支援装置、104…データベース、105…ネットワーク、1031…通信部、1032…有向グラフ生成部、1033…シミュレーション部、1034…評価部、1041…ロジックモデルデータ、1042…社会的インパクト指標データ、200…コンピュータ、201…プロセッサ、202…記憶デバイス、203…入力デバイス、204…出力デバイス、205…通信IF
Claims (16)
- プログラムを実行するプロセッサと、前記プログラムを記憶する記憶デバイスとを有するロジックモデル構築支援装置であって、
前記プロセッサは、前記プログラムに従って、
ノード間を接続するエッジで表現される複数の階層を有する有向グラフを構築するロジックモデル構築処理と、
構築された前記有向グラフに対するノードに対する選定を受け付ける選定処理と、
選定された前記ノードに接続するエッジに対応する重み係数を変更する変更処理と、
前記重み係数の変更前のロジックモデルの社会的インパクト指標の第1の定量値、前記重み係数の変更後のロジックモデルの社会的インパクト指標の第2の定量値および前記第1の定量値と前記第2の定量値の差分に関する変動情報を作成するシミュレーション処理と、
前記変動情報を出力する変動情報出力処理を実行するロジックモデル構築支援装置。 - 請求項1に記載のロジックモデル構築支援装置であって、
前記変動情報は、前記差分を示す変動値であるロジックモデル構築支援装置。 - 請求項1に記載のロジックモデル構築支援装置であって、
さらに、ネットワークを介して、所定の活動への参加者が利用する第1情報端末および前記活動の意志決定者が利用する第2情報端末と接続する通信インターフェースを有し、
前記有向グラフ、前記エッジの詳細、前記第1の定量値、前記第2の定量値および前記変動情報は、前記第1情報端末および前記第2情報端末で出力するロジックモデル構築支援装置。 - 請求項3に記載のロジックモデル構築支援装置において、
前記第1情報端末は、前記変動情報のアウトラインを出力し、前記第2情報端末は前記変動情報の詳細情報を出力するロジックモデル構築支援装置。 - 請求項1に記載のロジックモデル構築支援装置において、
前記プロセッサは、前記プログラムに従って、
さらに、前記ノードにおける社会的インパクト指標に対する影響度合いを示すノード影響度合いを出力する出力処理を実行するロジックモデル構築支援装置。 - 請求項1に記載のロジックモデル構築支援装置において、
前記有向グラフは、第一のノード群と、時間変化に関するパラメータが設定される第二のノード群を備え、
前記第二のノード群は前記設定されたパラメータに対し出力データを算出し、
第一のノード群は、前記エッジを介して接続された第二のノード群の出力データを入力し、所定の処理を実行し、社会的インパクト指標の定量化データを出力するロジックモデル構築支援装置。 - 請求項1に記載のロジックモデル構築支援装置において、
前記変動情報出力処理は、前記第1の定量値および前記第2の定量値を出力するロジックモデル構築支援装置。 - プログラムを実行するプロセッサと、前記プログラムを記憶する記憶デバイスとを有するロジックモデル構築支援装置によるロジックモデル構築支援方法であって、
前記プログラムに従って、前記プロセッサにより、
ノード間を接続するエッジで表現される複数の階層を有する有向グラフを構築するロジックモデル構築処理と、
構築された前記有向グラフに対するノードに対する選定を受け付ける選定処理と、
選定された前記ノードに接続するエッジに対応する重み係数を変更する変更処理と、
前記重み係数の変更前のロジックモデルの社会的インパクト指標の第1の定量値、前記重み係数の変更後のロジックモデルの社会的インパクト指標の第2の定量値および前記第1の定量値と前記第2の定量値の差分に関する変動情報を作成するシミュレーション処理と、
前記変動情報を出力する変動情報出力処理を実行するロジックモデル構築支援方法。 - 請求項8記載のロジックモデル構築支援方法であって、
前記変動情報は、前記差分を示す変動値であるロジックモデル構築支援方法。 - 請求項8に記載のロジックモデル構築支援方法であって、
前記ロジックモデル構築支援装置は、さらに、ネットワークを介して、所定の活動への参加者が利用する第1情報端末および前記活動の意志決定者が利用する第2情報端末と接続する通信インターフェースを有し、
前記有向グラフ、前記エッジの詳細、前記第1の定量値、前記第2の定量値および前記変動情報は、前記第1情報端末および前記第2情報端末で出力するロジックモデル構築支援方法。 - 請求項10に記載のロジックモデル構築支援方法において、
前記第1情報端末は、前記変動情報のアウトラインを出力し、前記第2情報端末は前記変動情報の詳細情報を出力するロジックモデル構築支援方法。 - 請求項8に記載のロジックモデル構築支援方法において、
前記プログラムに従って、前記プロセッサにより、
さらに、前記ノードにおける社会的インパクト指標に対する影響度合いを示すノード影響度合いを出力する出力処理を実行するロジックモデル構築支援方法。 - 請求項8に記載のロジックモデル構築支援方法において、
前記有向グラフは、第一のノード群と、時間変化に関するパラメータが設定される第二のノード群を備え、
前記第二のノード群は前記設定されたパラメータに対し出力データを算出し、
第一のノード群は、前記エッジを介して接続された第二のノード群の出力データを入力し、所定の処理を実行し、社会的インパクト指標の定量化データを出力するロジックモデル構築支援方法。 - 請求項1に記載のロジックモデル構築支援方法において、
前記変動情報出力処理は、前記第1の定量値および前記第2の定量値を出力するロジックモデル構築支方法。 - プログラムを実行するプロセッサと、前記プログラムを記憶する記憶デバイスとを有するロジックモデル構築支援装置であって、
前記プロセッサは、前記プログラムに従って、
ノード間を接続するエッジで表現される複数の階層を有する有向グラフを構築するロジックモデル構築処理と、
構築された前記有向グラフを表示する表示処理と、
表示された前記有向グラフに対するノードに対する選定を受け付ける選定処理と、
選定された前記ノードおよび当該ノードに接続するエッジの詳細を表示する詳細表示処理と、
表示されたエッジに対応する重み係数を変更する変更処理と、
前記重み係数の変更前のロジックモデルの社会的インパクト指標の第1の定量値、前記重み係数の変更後のロジックモデルの社会的インパクト指標の第2の定量値および前記第1の定量値と前記第2の定量値の差分に関する変動情報を作成するシミュレーション処理と、
前記変動情報を表示する変動情報表示処理を実行するロジックモデル構築支援装置。 - 所定の活動への参加者が利用する第1情報端末、前記活動の意志決定者が利用する第2情報端末およびロジックモデル構築支援装置を有するロジックモデル構築支援システムにおいて、
前記ロジックモデル構築支援装置は、
プログラムを実行するプロセッサと、前記プログラムを記憶する記憶デバイスとを有し、
前記プロセッサは、前記プログラムに従って、
ノード間を接続するエッジで表現される複数の階層を有する有向グラフを構築するロジックモデル構築処理と、
構築された前記有向グラフに対するノードに対する選定を受け付ける選定処理と、
選定された前記ノードに接続するエッジに対応する重み係数を変更する変更処理と、
前記重み係数の変更前のロジックモデルの社会的インパクト指標の第1の定量値、前記重み係数の変更後のロジックモデルの社会的インパクト指標の第2の定量値および前記第1の定量値と前記第2の定量値の差分に関する変動情報を作成するシミュレーション処理と、
前記変動情報を出力する変動情報出力処理を実行するロジックモデル構築支援システム。
Priority Applications (2)
| Application Number | Priority Date | Filing Date | Title |
|---|---|---|---|
| PCT/JP2023/024926 WO2025009094A1 (ja) | 2023-07-05 | 2023-07-05 | ロジックモデル構築支援装置、ロジックモデル構築支援方法およびロジックモデル構築支援システム |
| JP2025530881A JPWO2025009094A1 (ja) | 2023-07-05 | 2023-07-05 |
Applications Claiming Priority (1)
| Application Number | Priority Date | Filing Date | Title |
|---|---|---|---|
| PCT/JP2023/024926 WO2025009094A1 (ja) | 2023-07-05 | 2023-07-05 | ロジックモデル構築支援装置、ロジックモデル構築支援方法およびロジックモデル構築支援システム |
Publications (1)
| Publication Number | Publication Date |
|---|---|
| WO2025009094A1 true WO2025009094A1 (ja) | 2025-01-09 |
Family
ID=94171317
Family Applications (1)
| Application Number | Title | Priority Date | Filing Date |
|---|---|---|---|
| PCT/JP2023/024926 Ceased WO2025009094A1 (ja) | 2023-07-05 | 2023-07-05 | ロジックモデル構築支援装置、ロジックモデル構築支援方法およびロジックモデル構築支援システム |
Country Status (2)
| Country | Link |
|---|---|
| JP (1) | JPWO2025009094A1 (ja) |
| WO (1) | WO2025009094A1 (ja) |
Cited By (2)
| Publication number | Priority date | Publication date | Assignee | Title |
|---|---|---|---|---|
| CN120655478A (zh) * | 2025-08-21 | 2025-09-16 | 浙江大学 | 一种公交碳效率关键因果链识别方法、电子设备、介质 |
| JP7761977B1 (ja) * | 2025-07-05 | 2025-10-29 | インパクトサークル株式会社 | ソーシャルインパクト可視化システム、情報処理方法及びプログラム |
Citations (7)
| Publication number | Priority date | Publication date | Assignee | Title |
|---|---|---|---|---|
| JPH02100756A (ja) * | 1988-10-07 | 1990-04-12 | Nec Corp | ニューラルネットワークの後向き伝搬訓練方法 |
| JP2006268592A (ja) * | 2005-03-25 | 2006-10-05 | Hitachi Ltd | 企業活動評価システムおよび方法 |
| JP2007207052A (ja) * | 2006-02-03 | 2007-08-16 | Hitachi Ltd | シミュレーションモデルジェネレータ |
| WO2016174725A1 (ja) * | 2015-04-28 | 2016-11-03 | 株式会社日立製作所 | 計算機及びニューラルネットワークを用いた演算方法 |
| JP2017507402A (ja) * | 2014-07-18 | 2017-03-16 | ライラス、ディミトリスLYRAS, Dimitris | 企業にとって関連する情報を識別する、システム及び方法 |
| WO2022153624A1 (ja) * | 2021-01-12 | 2022-07-21 | 株式会社日立製作所 | 施策決定支援装置および施策決定支援方法 |
| JP7301239B1 (ja) * | 2022-03-17 | 2023-06-30 | 株式会社日立製作所 | 生成装置、生成方法、および生成プログラム |
-
2023
- 2023-07-05 WO PCT/JP2023/024926 patent/WO2025009094A1/ja not_active Ceased
- 2023-07-05 JP JP2025530881A patent/JPWO2025009094A1/ja active Pending
Patent Citations (7)
| Publication number | Priority date | Publication date | Assignee | Title |
|---|---|---|---|---|
| JPH02100756A (ja) * | 1988-10-07 | 1990-04-12 | Nec Corp | ニューラルネットワークの後向き伝搬訓練方法 |
| JP2006268592A (ja) * | 2005-03-25 | 2006-10-05 | Hitachi Ltd | 企業活動評価システムおよび方法 |
| JP2007207052A (ja) * | 2006-02-03 | 2007-08-16 | Hitachi Ltd | シミュレーションモデルジェネレータ |
| JP2017507402A (ja) * | 2014-07-18 | 2017-03-16 | ライラス、ディミトリスLYRAS, Dimitris | 企業にとって関連する情報を識別する、システム及び方法 |
| WO2016174725A1 (ja) * | 2015-04-28 | 2016-11-03 | 株式会社日立製作所 | 計算機及びニューラルネットワークを用いた演算方法 |
| WO2022153624A1 (ja) * | 2021-01-12 | 2022-07-21 | 株式会社日立製作所 | 施策決定支援装置および施策決定支援方法 |
| JP7301239B1 (ja) * | 2022-03-17 | 2023-06-30 | 株式会社日立製作所 | 生成装置、生成方法、および生成プログラム |
Non-Patent Citations (1)
| Title |
|---|
| ANONYMOUS: "Three-value simulator ", 7 June 2023 (2023-06-07), pages 1 - 12, XP093258710, Retrieved from the Internet <URL:https://web.archive.org/web/20230607075157/https://www.hitachi.oi.kyoto-u.ac.jp/three-value_simulator/> * |
Cited By (3)
| Publication number | Priority date | Publication date | Assignee | Title |
|---|---|---|---|---|
| JP7761977B1 (ja) * | 2025-07-05 | 2025-10-29 | インパクトサークル株式会社 | ソーシャルインパクト可視化システム、情報処理方法及びプログラム |
| CN120655478A (zh) * | 2025-08-21 | 2025-09-16 | 浙江大学 | 一种公交碳效率关键因果链识别方法、电子设备、介质 |
| CN120655478B (zh) * | 2025-08-21 | 2025-10-28 | 浙江大学 | 一种公交碳效率关键因果链识别方法、电子设备、介质 |
Also Published As
| Publication number | Publication date |
|---|---|
| JPWO2025009094A1 (ja) | 2025-01-09 |
Similar Documents
| Publication | Publication Date | Title |
|---|---|---|
| Etemadinia et al. | Using a hybrid system dynamics and interpretive structural modeling for risk analysis of design phase of the construction projects | |
| Shyur | COTS evaluation using modified TOPSIS and ANP | |
| Liu et al. | Personnel selection using interval 2‐tuple linguistic VIKOR method | |
| Dikmen et al. | Using fuzzy risk assessment to rate cost overrun risk in international construction projects | |
| Chuang et al. | A data-driven MADM model for personnel selection and improvement | |
| Ou-Yang et al. | Applying a risk assessment approach for cost analysis and decision-making: a case study for a basic design engineering project | |
| Singh et al. | Application of sensitivity analysis for multiple attribute decision making in lean production system | |
| JP7576468B2 (ja) | 情報処理装置および情報処理方法 | |
| Jafari et al. | Horizontal integration through knowledge sharing in the supply chain under uncertainty | |
| Yang et al. | Big data-based human resource performance evaluation model using Bayesian network of deep learning | |
| JP7828827B2 (ja) | 社会指標定量化方法および装置 | |
| Johnson et al. | Identifying “best” applicants in recruiting using data envelopment analysis | |
| Shnorr | Integral assessment of retail digitalization | |
| Zhang et al. | A dynamic credit evaluation approach using sensitivity-optimized weights for supply chain finance | |
| CN120410647A (zh) | 数据处理方法、装置、计算机设备和存储介质 | |
| Shapiro et al. | DPCM: a method for modelling and analysing design process changes based on the applied signposting model | |
| Belgin et al. | Evaluating the performance of transfer offices using MCDM approaches | |
| Ranđelović et al. | An approach to determining the importance of model criteria in certifying a city as business-friendly | |
| Daim et al. | A framework for managing the forecasting process | |
| Seshagiri | Continuous process improvement-why wait till Level 5? | |
| Alzeaideen et al. | Using Artificial Intelligence and Competitive Advantage in Operations Management: A Case Study of Islamic Banks in Amman, Jordan | |
| Jumali et al. | Application of the Analytic Hierarchy Process (AHP) in Strategic Site Selection for Software Development Branch Expansion in Indonesia | |
| Huang et al. | Algorithmic Advancements and Workforce Dynamics in the Gig Economy: Evidence from the On-Demand Delivery Market | |
| Srivastava et al. | Software quality factor evaluation using Fuzzy multi-criteria approach. | |
| Baseer | Multi-criteria decision making for sustainable engineering systems: Application for the energy renovation of buildings |
Legal Events
| Date | Code | Title | Description |
|---|---|---|---|
| 121 | Ep: the epo has been informed by wipo that ep was designated in this application |
Ref document number: 23944346 Country of ref document: EP Kind code of ref document: A1 |
|
| ENP | Entry into the national phase |
Ref document number: 2025530881 Country of ref document: JP Kind code of ref document: A |
|
| NENP | Non-entry into the national phase |
Ref country code: DE |