WO2025004302A1 - 情報処理装置、表示制御方法、および表示制御プログラム - Google Patents
情報処理装置、表示制御方法、および表示制御プログラム Download PDFInfo
- Publication number
- WO2025004302A1 WO2025004302A1 PCT/JP2023/024314 JP2023024314W WO2025004302A1 WO 2025004302 A1 WO2025004302 A1 WO 2025004302A1 JP 2023024314 W JP2023024314 W JP 2023024314W WO 2025004302 A1 WO2025004302 A1 WO 2025004302A1
- Authority
- WO
- WIPO (PCT)
- Prior art keywords
- display mode
- group
- graph
- nodes
- displayed
- Prior art date
- Legal status (The legal status is an assumption and is not a legal conclusion. Google has not performed a legal analysis and makes no representation as to the accuracy of the status listed.)
- Ceased
Links
Images


Classifications
-
- G—PHYSICS
- G06—COMPUTING OR CALCULATING; COUNTING
- G06N—COMPUTING ARRANGEMENTS BASED ON SPECIFIC COMPUTATIONAL MODELS
- G06N5/00—Computing arrangements using knowledge-based models
- G06N5/02—Knowledge representation; Symbolic representation
Definitions
- Patent Document 1 discloses a data analysis device that accepts input of variables indicating each phenomenon to be analyzed and input of the causal direction between the variables, generates a causal relationship diagram showing the causal relationships between the variables, and sets variables specified as objective variables in the causal relationship diagram and variables that are on the causal side of the objective variable in the causal relationship diagram in an analysis tool that analyzes variables that affect the objective variable.
- the causal relationship diagram shown in Patent Document 1 is generated by having an operator input arrows that connect blocks with variable names. Therefore, when there are many variables, a complex causal relationship diagram may be generated in which arrows intersect between many blocks. Note that a causal relationship diagram can be referred to as a causal graph. Similarly, blocks can be referred to as nodes, and arrows as edges.
- causal relationships between multiple elements being analyzed can be automatically inferred using techniques such as causal discovery, which infers from each of the elements what causal relationships (or lack of causal relationships) exist between those elements.
- causal discovery which infers from each of the elements what causal relationships (or lack of causal relationships) exist between those elements.
- the edges connecting the nodes can be irregularly interwoven, making it difficult to smoothly recognize the relationships between the nodes.
- a causal graph does not necessarily make it easy to recognize the relationships between the nodes.
- This problem is not limited to causal graphs, but is a common problem that occurs when displaying various graphs that show the relationships between elements using nodes and edges.
- One aspect of the present invention has been made in consideration of such problems, and one example of its purpose is to provide a technology that makes it easier to recognize the relationships between nodes in a graph that shows the relationships between elements using nodes and edges.
- An information processing device includes a display control means for displaying a graph in which relationships between a plurality of elements are represented by nodes corresponding to each element and edges indicating the relationships between each element, and a switching means for switching the display mode of the graph between a first display mode in which, instead of each node corresponding to each element belonging to the same group, a substitute object that substitutes for the node is displayed, and a second display mode in which each node corresponding to each element belonging to the group is displayed.
- a display control method includes having at least one processor display a graph in which relationships between a plurality of elements are represented by nodes corresponding to each element and edges indicating the relationships between each element, and switching the display mode of the graph between a first display mode in which substitute objects that substitute for each node corresponding to each element belonging to the same group are displayed, and a second display mode in which each node corresponding to each element belonging to the group is displayed.
- a display control program causes a computer to function as a display control means for displaying a graph in which relationships between a plurality of elements are represented by nodes corresponding to each element and edges indicating the relationships between each element, and a switching means for switching the display mode of the graph between a first display mode in which, in place of each node corresponding to each element belonging to the same group, a substitute object that substitutes for the node is displayed, and a second display mode in which, in place of each node corresponding to each element belonging to the group, the node is displayed.
- One aspect of the present invention makes it easier to recognize relationships between nodes in a graph that shows relationships between elements using nodes and edges.
- FIG. 1 is a block diagram showing a configuration of an information processing device according to a first exemplary embodiment of the present invention
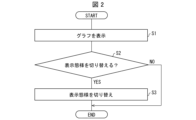
- 1 is a flow diagram showing a flow of a display control method according to an exemplary embodiment 1 of the present invention.
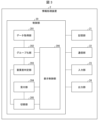
- FIG. 11 is a block diagram showing a configuration of an information processing device according to an exemplary embodiment 2 of the present invention.
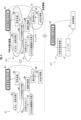
- FIG. 13 is a diagram showing a display example of a causal graph.
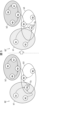
- 13A and 13B are diagrams illustrating an example of changing a group by changing a display position of a node.
- 13A and 13B are diagrams illustrating an example in which nodes to be grouped are selected after narrowing down the nodes to be displayed.
- 13A and 13B are diagrams illustrating examples of switching the display mode of a causal graph.
- FIG. 11 is a flow chart showing the flow of a display control method according to an exemplary embodiment 2 of the present invention.
- FIG. 1 is a diagram showing an example of a computer that executes instructions of a program, which is software that realizes the functions of each device according to each exemplary embodiment of the present invention.
- Example embodiment 1 DETAILED DESCRIPTION OF THE PREFERRED EMBODIMENTS
- This exemplary embodiment is a basic form of the exemplary embodiments described below.
- Fig. 1 is a block diagram showing the configuration of the information processing device 1. As shown in the figure, the information processing device 1 includes a display control unit 11 and a switching unit 12.
- the display control unit 11 displays a graph that shows the relationships between multiple elements using nodes corresponding to each element and edges that indicate the relationships between each element.
- the switching unit 12 switches the display mode of the graph displayed by the display control unit 11 between a first display mode in which, instead of each node corresponding to each element belonging to the same group, a substitute object that substitutes for those nodes is displayed, and a second display mode in which, instead of each node corresponding to each element belonging to the group, a substitute object that substitutes for those nodes is displayed.
- the information processing device 1 includes a display control unit 11 that displays a graph in which relationships between multiple elements are represented by nodes corresponding to each element and edges indicating the relationships between each element, and a switching unit 12 that switches the display mode of the graph between a first display mode in which, instead of each node corresponding to each element belonging to the same group, a substitute object that substitutes for those nodes is displayed, and a second display mode in which each node corresponding to each element belonging to the group is displayed. Therefore, the information processing device 1 according to this exemplary embodiment has the effect of making it easier to recognize relationships between nodes in a graph in which relationships between elements are represented by nodes and edges.
- the above-mentioned functions of the information processing device 1 can also be realized by a program.
- the display control program according to the present exemplary embodiment is configured to cause a computer to function as a display control means for displaying a graph in which the relationships between a plurality of elements are represented by nodes corresponding to each element and edges indicating the relationships between each element, and as a switching means for switching the display mode of the graph between a first display mode in which, instead of each node corresponding to each element belonging to the same group, a substitute object substituting the node is displayed, and a second display mode in which each node corresponding to each element belonging to the group is displayed. Therefore, according to the display control program according to the present exemplary embodiment, it is possible to obtain an effect that it is possible to easily recognize the relationship between nodes in a graph in which the relationship between elements is represented by nodes and edges.
- Flow of display control method The flow of the display control method according to this exemplary embodiment will be described with reference to Fig. 2.
- Fig. 2 is a flow diagram showing the flow of the display control method. Note that the execution subject of each step in this display control method may be a processor provided in the information processing device 1, a processor provided in another device, or a processor provided in a different device.
- At least one processor displays a graph that represents the relationships between multiple elements using nodes corresponding to each element and edges that indicate the relationships between each element.
- At least one processor determines whether or not to switch the display mode of the graph. If the determination in S2 is YES, the process proceeds to S3, and if the determination in S2 is NO, the process ends.
- At least one processor switches the display mode of the graph displayed in S1 between a first display mode in which substitute objects are displayed in place of each node corresponding to each element belonging to the same group, and a second display mode in which each node corresponding to each element belonging to the group is displayed.
- the display control method includes displaying a graph in which relationships between a plurality of elements are represented by nodes corresponding to each element and edges indicating the relationships between each element, and switching the display mode of the graph between a first display mode in which, in place of each node corresponding to each element belonging to the same group, a substitute object that substitutes for those nodes is displayed, and a second display mode in which each node corresponding to each element belonging to the group is displayed. Therefore, the display control method according to this exemplary embodiment has the effect of making it easier to recognize relationships between nodes in a graph in which relationships between elements are represented by nodes and edges.
- Fig. 3 is a block diagram showing the configuration of the information processing device 2.
- the information processing device 2 is a device having a function of supporting analysis using a causal graph. Note that the information processing device 2 may be a device whose main function is to support analysis using a causal graph, or may be a general-purpose device having other functions as well.
- the information processing device 2 can also support analysis using graphs other than causal graphs, so long as the graph represents the relationships between multiple elements using nodes corresponding to each element and edges indicating the relationships between the elements.
- graphs such as knowledge graphs also represent the relationships between elements using nodes and edges, so the information processing device 2 can also support analysis using knowledge graphs, etc. Therefore, the term “causal graph” in the following description can be read as any "graph” that represents the relationships between elements using nodes and edges.
- the term “causal analysis” in the following description can be read as any "analysis” of any relationship between elements.
- the information processing device 2 includes a control unit 20 that controls each unit of the information processing device 2, and a storage unit 21 that stores various data used by the information processing device 2.
- the information processing device 2 also includes a communication unit 22 that allows the information processing device 2 to communicate with other devices, an input unit 23 that accepts various data input to the information processing device 2, and an output unit 24 that allows the information processing device 2 to output various data.
- the control unit 20 of the information processing device 2 includes a data acquisition unit 201, a grouping unit 202, an importance determination unit 203, a reception unit 204, a switching unit 205, and a display control unit 206. Note that each of the components from the storage unit 21 to the output unit 24 may be built into the information processing device 2, or may be an external device attached to the information processing device 2.
- the data acquisition unit 201 acquires various data used to support analysis using a causal graph.
- the data acquisition unit 201 acquires analysis result data that indicates the results of a causal analysis.
- the analysis result data may be anything that can display a causal graph, and may be, for example, data that indicates each element that was the subject of the causal analysis and the relationship (causal relationship) between those elements.
- the data acquisition unit 201 may acquire analysis result data by performing causal analysis.
- causal analysis is a method of inferring what kind of causal relationship exists (or does not exist) between multiple elements through causal exploration from each of the elements, and estimating the strength of the inferred causal relationship.
- a specific method of causal exploration is known, for example, a method using a structural equation model, and the data acquisition unit 201 may acquire analysis result data generated by applying such a method.
- the result of the causal analysis may be obtained by causal analysis using AI (Artificial Intelligence).
- AI Artificial Intelligence
- the AI used for the causal analysis is not particularly limited as long as it is capable of inputting the elements to be subjected to the causal analysis and outputting information indicating the causal relationship between the elements and its strength.
- a causal graph may be generated by an operator specifying causal relationships between elements, in which case the data acquisition unit 201 may acquire analysis result data indicating the contents of the specification.
- the analysis result data may indicate, for example, the results of causal analysis involving natural language analysis.
- the causal graph may be an effective acyclic graph, a graph indicating bidirectional causal relationships, or a graph indicating looping causal relationships.
- the data acquisition unit 201 may acquire analysis result data generated by another device.
- the method of acquiring the analysis result data is not particularly limited.
- the data acquisition unit 201 may acquire analysis result data input by an operator of the information processing device 2 via the input unit 23, or may acquire analysis result data from another device by communication via the communication unit 22. This is also true in the case of acquiring data other than analysis result data.
- the grouping unit 202 groups the elements to be analyzed. Since each node included in the causal graph corresponds to each element to be analyzed, the grouping unit 202 can be said to group each node included in the causal graph. The specific grouping method will be described later.
- the importance determination unit 203 determines the importance of each group of elements to be analyzed in the causal graph of that group.
- the importance may be an index value indicating the importance, or may be the result of classification based on the importance (e.g., high importance, medium importance, low importance, etc.). The method of determining the importance will be described in detail later.
- the reception unit 204 receives various operations by an operator using the information processing device 2 in supporting an analysis using a causal graph. For example, the reception unit 204 receives an operation to switch the display mode of the causal graph.
- the switching unit 205 switches the display mode of the causal graph between a first display mode and a second display mode.
- the first display mode is a display mode in which, instead of each node corresponding to each element belonging to the same group, a substitute object that substitutes for those nodes is displayed.
- the second display mode is a display mode in which each node corresponding to each element belonging to the group is displayed.
- the display control unit 206 causes the display device to display various information for supporting analysis using the causal graph.
- the display device may be included in the information processing device 2, or may be an external device to the information processing device 2.
- the display control unit 206 displays a causal graph in which the causal relationships between multiple elements being analyzed are represented by nodes corresponding to each element and edges indicating the causal relationships between each element.
- the display control unit 206 may display nodes classified into the same group in an associated manner. Note that displaying nodes in an associated manner means displaying the nodes in a manner that allows the nodes to be recognized as being related to each other.
- the display control unit 206 switches the display mode of the causal graph between the first display mode and the second display mode according to an instruction from the switching unit 205. Furthermore, the display control unit 206 may change the display position of the node in response to a display position change operation received by the reception unit 204. Furthermore, when the target of the display position change operation received by the reception unit 204 is a group of nodes, the display control unit 206 may change the display position of each node belonging to the group all at once.
- the information processing device 2 includes a display control unit 206 that displays a causal graph in which the causal relationships between a plurality of elements are represented by nodes corresponding to each element and edges indicating the causal relationships between each element, and a switching unit 205 that switches the display mode of the causal graph between a first display mode in which, instead of each node corresponding to each element belonging to the same group, a substitute object that substitutes for those nodes is displayed, and a second display mode in which each node corresponding to each element belonging to the group is displayed.
- ausal relationships can be interpreted as any “relationship”
- causal graph can be interpreted as any “graph” that shows the relationships between any elements with nodes and edges.
- the data acquisition unit 201 may acquire a graph (a graph that is not a causal graph) such as a knowledge graph.
- the display control unit 206 displays the acquired graph.
- the switching unit 205 switches the display mode of the graph between a first display mode and a second display mode. This makes it possible to easily recognize the relationship between nodes in the graph.
- the information processing device 2 has the effect of making it easier to recognize the relationships between nodes in a graph that shows the relationships between elements using nodes and edges.
- the information processing device 2 includes a grouping unit 202 that groups the elements to be analyzed.
- the first display mode is a display mode in which substitute objects are displayed in place of the nodes corresponding to the elements that the grouping unit 202 has classified into the same group.
- the importance determination unit 203 determines the importance of each group of elements to be analyzed in the causal graph of the group.
- the method of determining the importance is arbitrary.
- the importance determination unit 203 may calculate an index value related to the causal relationship between each element and use the index value to determine the importance of each group.
- the index value may be, for example, a path coefficient.
- a path coefficient is a coefficient calculated using weight values of paths connecting each element.
- the weight values can be calculated by known methods of causal inference or causal search.
- the importance determination unit 203 may calculate, for example, the sum, average, or maximum value of the path coefficients between each element belonging to a group as the importance of the group.
- the importance determination unit 203 may identify elements that affect elements outside the group (elements such as nodes N2, N3, N6, and N8 in the causal graph G1' in FIG. 4) for each group. Then, the importance determination unit 203 may determine the path coefficient of a path between an element in a group that affects elements outside the group and an element that is affected by the element as the importance of the group. Note that, when multiple path coefficients are calculated for one group, the importance determination unit 203 may determine the sum, average, or maximum value of the path coefficients as the importance of the group.
- the index value may be another index value such as a P-value.
- the importance can be determined in the same manner as when the path coefficient is applied.
- the importance determination unit 203 determines the importance in stages depending on which of a predetermined numerical range the P-value falls within. For example, the importance determination unit 203 may determine the importance as high if the P-value is 0.001 or more and less than 0.01, as medium if the P-value is 0.01 or more and less than 0.05, and as low if the P-value is 0.05 or more.
- the switching unit 205 may also switch the display mode of each group to the most suitable display mode, between the first display mode and the second display mode, according to the manner in which the value of each element included in each group changes over time. This provides the effect of being able to switch the display mode according to the manner in which the value of each element changes over time, in addition to the effect provided by the information processing device 1 according to the first exemplary embodiment.
- the reception unit 204 may receive input of time series data of the values of each element.
- the switching unit 205 then generates information indicating the manner of change in the value of each element from the time series data (e.g., the rate of change or the amount of change). This allows the switching unit 205 to determine the optimal display mode for each group based on the generated information, in other words, to optimize the display mode.
- the above information can also be said to indicate the importance of each group in the causal graph.
- the above information may be generated by the importance determination unit 203, and in this case, it can be said that the switching unit 205 optimizes the display mode of each group based on the importance indicated in the above information.
- the above time series data may be obtained, for example, from a wearable device (e.g., a smart watch) worn by the user, from a measuring device such as a weighing scale used by the user, or from health checkup results, etc.
- a wearable device e.g., a smart watch
- a measuring device such as a weighing scale used by the user
- health checkup results etc.
- the switching unit 205 may determine the display mode of the group based on the magnitude of the amount of change or rate of change in the value of each element included in a group. Whether the amount of change or rate of change is large can be determined by comparing the amount of change or rate of change with a predetermined threshold value, or by comparing with the average amount of change or rate of change of each element. In other words, the evaluation of the magnitude of the amount of change or rate of change may be an absolute evaluation or a relative evaluation.
- the switching unit 205 may switch a group whose total value is greater than a predetermined threshold to the second display mode. This causes nodes corresponding to each element belonging to a group that includes an element with a large rate of change to be displayed. This allows the user to easily recognize elements with a large rate of change. For example, when a group that includes elements such as the amount of exercise and the amount of sleep is switched to the second display mode, the user can recognize from the displayed nodes that his or her own amount of exercise and the amount of sleep are unstable and that his or her lifestyle is irregular.
- the switching unit 205 may switch a group whose total value is less than a predetermined threshold value to the first display mode.
- a substitute object is displayed for a group that includes elements with a small rate of change. For example, if there is no significant change in the user's weight, body fat percentage, etc., the group that includes elements such as weight and body fat percentage is switched to the first display mode.
- nodes corresponding to elements such as weight and body fat percentage that the user does not currently need to be particularly concerned about are no longer presented to the user. This makes it possible to draw the user's attention to other nodes that require more attention from the user.
- Such screen optimization is effective when the user utilizes causal analysis to acquire healthy lifestyle habits.
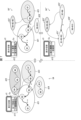
- Fig. 4 is a diagram showing an example of a causal graph displayed.
- a causal graph G1 shown in the upper left of Fig. 4 represents causal relationships between a plurality of elements by nodes N1 to N9 corresponding to each element and edges (one-way arrows connecting nodes) indicating the causal relationships between each element.
- each node is labeled with a name that indicates the corresponding element.
- "Cultural and artistic activities" listed in node N2 indicates the name given to the element of node N2.
- the name given to each element may be displayed in association with the node corresponding to that element.
- node N1 is an element that corresponds to the objective variable
- all other nodes are elements that correspond to explanatory variables.
- the elements that are the subject of causal analysis may include elements other than explanatory variables and objective variables.
- causal graph G1 the nodes are not displayed in association with each other by group.
- causal graph G1' shown in the upper right of Figure 4 shows the causal relationships between nodes N1 to N9 like causal graph G1, but nodes classified into the same group are displayed in association with each other.
- nodes N1 to N3 are associated by being displayed on oval object a1.
- nodes N4 to N7 are associated by being displayed on object a2, and nodes N8 and N9 are associated by being displayed on object a3.
- nodes in the same group need only be displayed in a manner that allows the nodes to be recognized as being related to each other, and the display manner is not limited to the example of FIG. 4.
- nodes in the same group may be associated by being displayed in a display area corresponding to the group, or nodes in the same group may be associated by being displayed in the same or similar color.
- objects a1 to a3 are displayed in association with character strings indicating the names of the groups that correspond to them.
- object a1 is displayed in association with the character string "government-led measures.”
- the names given to each group may be displayed in association with the group.
- each node is displayed in association with each group, and for each group, each node corresponding to each element belonging to that group is displayed.
- the causal graph G1' is displayed in the second display mode described above. Since the information processing device 2 is equipped with a switching unit 205, it is possible to switch the second display mode to the first display mode.
- the causal graph G1" shown in the lower part of Figure 4 is obtained by switching the display mode of each group in the causal graph G1' to the first display mode.
- an alternative object a2' is displayed in place of nodes N5 to N7 that were displayed on object a2, and an alternative object a3' is displayed in place of nodes N8 and N9 that were displayed on object a3.
- the names of the groups to which they correspond are also displayed on these alternative objects.
- the switching unit 205 can switch the display mode for all groups at once, or can switch the display mode for only some of the groups.
- causal graph G1 it can be easily recognized that the objective variable "educational environment” is influenced by each node related to "government-led policies” and each node related to the "natural environment”.
- each node related to "government-led policies” influences each node related to "infrastructure”
- each node related to "infrastructure” influences each node related to the "natural environment”.
- the switching unit 205 can also switch from the first display mode to the second display mode. For example, the switching unit 205 can switch all groups in the causal graph G1" to the second display mode. In this case, the causal graph G1' is displayed again. The switching unit 205 can also switch only some of the groups in the causal graph G1" to the second display mode. By changing from the first display mode to the second display mode, the specific relationships between the nodes can be grasped in the second display mode, taking into account the general relationships recognized in the first display mode.
- At least one group In order to switch the display mode, at least one group must be set. However, it is not essential that the nodes belonging to the same group are displayed in an associated manner in order to switch. For example, even if the nodes are not displayed in an associated manner like the causal graph G1 in Figure 4, it is possible to switch the display mode to causal graph G1" if a group has been set.
- the reception unit 204 may also receive an operation to change the display positions of the substitute objects a1' to a3' in the causal graph G1".
- the display control unit 206 may then change the display positions of the substitute objects a1' to a3' in response to this change operation.
- Any type of change operation may be used.
- the operation to change the display position may be an operation to drag a substitute object on the display screen and drop it at a desired position.
- the reception unit 204 may receive an operation to change the display positions of the objects a1 to a3 that indicate a group of nodes in the causal graph G1'.
- the display control unit 206 may then change the display positions of the nodes on the objects a1 to a3 collectively in response to this change operation. This makes it possible to efficiently change the arrangement of the nodes in the causal graph G1'.
- the grouping unit 202 groups the elements to be analyzed.
- the grouping method is not particularly limited.
- the receiving unit 204 may receive a designation of elements or nodes to be grouped by an operator, and in this case, the grouping unit 202 performs grouping according to the designation by the operator.
- the grouping unit 202 may also automatically group the elements to be analyzed without the intervention of an operator. For example, if grouping rules are determined in advance, such as classifying all elements into one group and limiting the number of elements in each group to two or more, the grouping unit 202 can group each element according to the rules.
- the grouping unit 202 may classify a plurality of elements into a plurality of groups by exploratory factor analysis. This provides the effect of being able to automatically group elements related to each other in addition to the effect provided by the information processing device 1 according to the exemplary embodiment 1.
- exploratory factor analysis is an analytical method that estimates what factors bring about correlations between multiple variables, based on the correlation coefficients between each variable.
- the elements included in each group correspond to one factor that brings about a correlation between those elements.
- the number of groups into which the elements are classified may be determined in advance, or may be specified by the operator. Note that in exploratory factor analysis, one element may be associated with multiple factors.
- the multiple elements that are the subject of causal analysis may include those that are generated based on the respondent's answers to specific questions.
- the grouping unit 202 may classify multiple elements generated based on answers to the same or related questions into the same group. This provides the effect of being able to automatically group elements that are related to each other, in addition to the effect provided by the information processing device 1 according to the exemplary embodiment 1.
- the "causal analysis" in the above configuration can be read as any "analysis.”
- the above classification can be achieved by preparing in advance related data that indicates which question each element corresponds to and the relevance between the questions.
- the related data may be stored in advance in the storage unit 21 or the like, or may be acquired by the data acquisition unit 201.
- a survey is conducted in which a specific group of subjects are asked to answer multiple questions such as "What do you consider important when deciding where to live?", and the answers are collated to create multiple elements (e.g., "adequate public facilities" and "abundance of greenery") that are the subject of causal analysis.
- the grouping unit 202 can classify elements that correspond to the same questions into the same group using the associated data that indicates the questions that correspond to each element.
- the questions may be grouped by theme.
- the grouping unit 202 may classify elements corresponding to questions that belong to the same group, i.e., mutually related questions, into the same group, using the associated data indicating the question corresponding to each element and the associated data indicating the group to which each question belongs.
- the reception unit 204 may receive an operation to change the group set for each element, and the grouping unit 202 may change the group in response to the operation. Any operation may be used to change the group. For example, when an operation to select a node in the displayed causal graph is performed, the display control unit 206 may display options for changing the group of the element corresponding to the node. Then, when the reception unit 204 receives an operation to select the option, the display control unit 206 may display a list of groups that are candidates for the change destination. In this case, the grouping unit 202 changes the group of the element to the group selected from the list.
- the grouping unit 202 may change the classification of the element corresponding to the node from one group to another group. This provides the effect of making it possible to easily change groups through intuitive operations in addition to the effect provided by the information processing device 1 according to the first exemplary embodiment.
- Figure 5 is a diagram explaining an example of changing groups by changing the display position of a node.
- Causal graph G2 shown on the left side of Figure 5 shows the causal relationships between the elements corresponding to nodes N1 to N9, and these nodes are classified into three groups. Specifically, nodes N6 to N9, which are classified into the same group, are associated by being displayed on object b2. Furthermore, nodes N1 to N3 are associated and displayed by being displayed on object b1, and nodes N3 to N5 are associated and displayed by being displayed on object b3.
- the groups corresponding to objects b1 to b3 are referred to as the first to third groups, respectively.
- node N3 is within the display area of object b1 and is also displayed within the display area of object b3. This indicates that the element corresponding to node N3 belongs to both the first group and the third group. In this way, the grouping unit 202 may allow one element to be classified into multiple groups.
- the display control unit 206 may display a substitute object corresponding to each group, or may display a single substitute object that combines these substitute objects.
- the operator can also change the group of elements corresponding to node N3 by moving node N3. For example, the operator may drag node N3 with cursor Cu and drop it to a position outside the display area of object b1 but within the display area of object b3. This allows node N3 to be moved to a position outside the display area of object b1 but within the display area of object b3, and changes the group of elements corresponding to node N3 from the first and third groups to only the third group.
- Causal graph G2' shown on the right side of Figure 5 is obtained by moving node N3 in causal graph G2 outside the display area of object b1 and into the display area of object b3.
- the grouping unit 202 changes the group of the element corresponding to node N3 to only the third group.
- node N3 continues to be displayed both before and after the change.
- elements that are the subject of group changes are not limited to elements that belong to multiple groups.
- the grouping unit 202 can change the affiliation of an element that belongs to one group to another group, and can also make an element that does not belong to any group belong to a group.
- Fig. 6 is a diagram for explaining an example in which the nodes to be grouped are selected after narrowing down the nodes to be displayed.
- Causal graph G3 shown in the upper left of Figure 6 shows the causal relationships between each of the nodes N1 to N8.
- edges connecting nodes are displayed as lines with a thickness according to the path coefficient.
- the display control unit 206 may display edges in a display mode according to the path coefficient. This allows the operator to recognize paths with a stronger influence, allowing smooth analysis of the relationships between elements.
- the path coefficient can also be represented by the edge length or color, for example, in addition to the edge thickness.
- the display control unit 206 displays an object c1 together with the causal graph G3.
- the object c1 is a threshold specification object that accepts specification of a threshold value for the path coefficient in the causal graph G3.
- object c1 is an object having a slider arranged on a slider bar that can be moved on the slider bar.
- the slider bar indicates the range in which the pass coefficient threshold can be changed, and the position of the slider indicates the pass coefficient threshold.
- the operator can use object c1 to set the threshold to a small value, thereby displaying all of the nodes and edges that make up causal graph G3. Also, as shown in the lower left of Figure 6, the operator can operate object c1 with cursor Cu to change the threshold to a larger value. Note that the method of operating object c1 is not limited to using cursor Cu.
- Causal graph G3' shown in the lower left of Figure 6 is a graph in which, among the nodes included in causal graph G3, nodes that are the starting points of paths whose path coefficients are less than the changed threshold are hidden. Compared to causal graph G3, causal graph G3' makes it easier to recognize the relationships between paths whose path coefficients are equal to or greater than the threshold and the nodes included in those paths.
- the index value used as the criterion for switching between displaying and hiding a node is not limited to the path coefficient.
- the display and hiding of a node can be switched based on any index value as long as it is an index value related to the causal relationship between multiple elements.
- the display control unit 206 may switch between displaying and hiding a node based on a P value.
- the display control unit 206 may display an object that changes the threshold value of the P value. Note that in the case of the P value, the threshold value may be changed in stages rather than continuously.
- the operator can group the desired nodes. For example, in the causal graph G3', multiple nodes can be grouped by surrounding them with the cursor Cu.
- Causal graph G3 shown on the right side of Figure 6 shows an example of grouping target nodes by performing a drag operation to surround them.
- causal graph G3 the trajectory of the drag operation performed by cursor Cu on the display screen is shown by dashed line c2.
- the grouping unit 202 groups the elements corresponding to these nodes.
- grouping method when the nodes to be displayed have been narrowed down is not limited to this example. For example, even if you manually specify a group, you may select multiple nodes to group and group them, or you may group them automatically using the method described above in "Grouping Methods.”
- the reception unit 204 may receive a specified threshold value for a predetermined index value related to the causal relationship between multiple elements, and the display control unit 206 may switch between displaying and hiding each node based on the specified threshold value.
- the grouping unit 202 may then perform grouping for the elements corresponding to the displayed nodes. In this way, in addition to the effect of the information processing device 1 according to the first exemplary embodiment, it is possible to obtain an effect that it is possible to set groups by narrowing down the nodes to be displayed and clarifying the causal relationship between elements.
- the "causal relationship" in the above configuration may be read as any "relationship.”
- the switching unit 205 may switch between the first display mode and the second display mode for all groups, or may switch between the first display mode and the second display mode for some groups. This will be described with reference to Fig. 7.
- Fig. 7 is a diagram showing an example of switching the display mode of a causal graph.
- Causal graph G4 shown on the left side of Figure 7 contains a total of 10 nodes, N1 to N10.
- edges connecting nodes are displayed with lines of a thickness according to the path coefficient.
- edges with P values less than a threshold value are marked with an asterisk.
- edges with P values less than 0.05 are marked with the symbol "*”
- edges with P values less than 0.01 are marked with the symbol "**”.
- causal graph G4 nodes N1 to N3 displayed on object d21 belong to the first group. Similarly, nodes N4 to N6, nodes N7, N8, and nodes N9, N10 displayed on objects d22 to d24 belong to the second to fourth groups, respectively. In causal graph G4, all of the first to fourth groups are displayed in the second display mode.
- a switching object d1 for switching between the first display mode and the second display mode is displayed together with the causal graph G4.
- the trigger for switching between the first display mode and the second display mode can be set arbitrarily, but the switching unit 205 may perform the switching when the switching object d1 is operated.
- a drop-down list d11 is displayed together with the switching object d1.
- the drop-down list d11 may be displayed when the switching object d1 is selected or when the cursor Cu is placed on the switching object d1.
- Drop-down list d11 contains two options: “Simplify all” and “Simplify some.” “Simplify all” is an option for switching all groups to the first display mode, and “Simplify some” is an option for switching some groups to the first display mode.
- the display control unit 206 may present the operator with options for switching the display mode.
- the switching unit 205 switches all groups to the first display mode.
- the causal graph G4 will be displayed in the form of causal graph G4" shown in the lower right of FIG. 7.
- the switching unit 205 switches to the first display mode for groups that satisfy a predetermined condition.
- the "predetermined condition” can be any condition.
- the operator may be allowed to select the group for which the display mode is to be switched, in which case the selection by the operator becomes the "predetermined condition.”
- the condition related to the importance determined by the importance determination unit 203 may be the "predetermined condition.”
- the causal graph G4' shown in the upper right of FIG. 7 is obtained by switching to the first display mode for groups whose importance is less than the threshold. Specifically, the second group is switched to the first display mode, and a substitute object d22' is displayed in place of the nodes N4 to N6 of the second group. The fourth group is also switched to the first display mode, and a substitute object d24' is displayed in place of the nodes N9 and N10 of the fourth group.
- the substitute objects d22' and d24' display the number of the node that the object replaces. In this way, the substitute objects may be displayed in association with information indicating the node that the object replaces.
- causal graph G4' groups whose importance is below the threshold are simplified, making it easier to recognize the causal relationships between nodes belonging to groups whose importance is equal to or above the threshold. Specifically, nodes N1 to N3, N7, and N8 belonging to the first and third groups are displayed. The edges connecting these nodes all have large path coefficients, and many of them have P values less than 0.05, so they can be said to be important edges in causal graph G4'. The nodes connected by these edges can also be said to be important nodes. In other words, according to causal graph G4', important nodes and edges are displayed in a way that is easy for the operator to recognize.
- the switching unit 205 may select a group with high importance as the target of switching the display mode, or may select a group with low importance as the target of switching the display mode. Also, the operator may select whether to select a group with high importance or a group with low importance as the target of switching the display mode. Also, the operator may select a method of determining the importance (e.g., whether to determine the importance based on the path coefficient, whether to determine the importance based on the P value, etc.). These matters are the same when switching from the second display mode to the first display mode and when switching from the first display mode to the second display mode.
- the display control unit 206 may display a drop-down list d12.
- the drop-down list d12 includes two options: “Expand all” and “Simplify all.” “Expand all” is an option for switching all groups to the second display mode, and “Simplify all” is an option for switching all groups to the first display mode.
- the switching unit 205 switches all groups to the second display mode.
- the causal graph G4 will have a display mode like the causal graph G4 shown on the left side of FIG. 7.
- the switching unit 205 switches all groups to the first display mode. In this case, the causal graph G4 will have a display mode like the causal graph G4" shown in the lower right of FIG. 7.
- the display control unit 206 may display a drop-down list d13.
- the drop-down list d13 includes two options, "Expand all” and “Expand some”. "Expand all” is an option for switching all groups to the second display mode, and "Expand some” is an option for switching some groups to the second display mode.
- the switching unit 205 switches all groups to the second display mode.
- the causal graph G4 will have a display mode like the causal graph G4 shown on the left side of FIG. 7.
- the switching unit 205 switches some groups to the second display mode.
- the switching unit 205 switches to the second display mode for groups that satisfy a specified condition.
- the “specified condition” can be any condition.
- the condition related to the importance determined by the importance determination unit 203 may be the “specified condition.”
- the same conditions as in “Partially Simplified” may be applied.
- the causal graph G4" will be displayed in the form of the causal graph G4' shown in the upper right of Figure 7.
- the trigger for switching the display mode is arbitrary and is not limited to the above example.
- the switching unit 205 may switch the display mode every time a predetermined time has elapsed since the start of displaying the causal graph.
- the switching unit 205 may switch the group to the first display mode in response to an operation of selecting an object representing the group.
- the switching unit 205 may switch the group corresponding to the substitute object to the second display mode in response to an operation of selecting a substitute object.
- the switching unit 205 may display the substitute object d21' instead of the nodes N1 to N3 when an operation of selecting the object d21 with the cursor Cu is performed in the causal graph G4 or G4' shown in FIG. 7.
- the switching unit 205 may display the nodes N1 to N3 and the object d21 instead of the substitute object d21' when an operation of selecting the substitute object d21' with the cursor Cu is performed in the causal graph G4" shown in FIG. 7.
- the reception unit 204 may also receive a specification of an importance threshold while displaying the causal graph.
- the switching unit 205 may then determine the group to be the target of switching the display mode based on the specified threshold.
- the reception unit 204 may receive continuous changes in the threshold via a threshold specification object such as object c1 shown in FIG. 6. This allows, for example, an operator to switch from a state in which all groups are in the second display state to the first display mode in order of least important groups by continuously increasing the threshold until a state in which the association between the groups can be recognized is reached.
- the switching unit 205 may switch between the first display mode and the second display mode for a group that satisfies a predetermined condition. This provides the effect of facilitating analysis of a portion of a group in addition to the effect provided by the information processing device 1 according to the first exemplary embodiment.
- the information processing device 2 also includes an importance determination unit 203 that determines the importance of each group in the causal graph.
- the switching unit 205 may switch between the first display mode and the second display mode for groups whose importance meets a predetermined condition. This provides the effect of facilitating analysis of groups with high and low importance in addition to the effect provided by the information processing device 1 of the first exemplary embodiment.
- the "causal graph" in the above configuration can be interpreted as any "graph” that shows the relationship between any elements with nodes and edges.
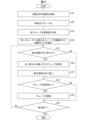
- Fig. 8 is a flow diagram showing the flow of the display control method.
- the data acquisition unit 201 acquires analysis result data indicating the results of the causal analysis.
- the data acquisition unit 201 may acquire analysis result data by performing a causal analysis, or may acquire analysis result data indicating the results of a causal analysis performed by another device.
- the grouping unit 202 groups each element that was the subject of the causal analysis, which is shown in the analysis result data acquired in S21. As explained in the section "Grouping Methods," various grouping methods can be applied.
- the receiving unit 204 may receive an input of the name of the group. This makes it possible to display the name of the group together with each node of each group or their substitute object when displaying the causal graph. Note that if each element has been grouped in advance, the processing of S22 is omitted.
- the importance determination unit 203 determines the importance of each group set in S22.
- the method for determining the importance is as explained in the "Importance determination method" section, so the explanation will not be repeated here.
- the display control unit 206 displays a causal graph that associates nodes classified into the same group in S22 (more precisely, nodes corresponding to elements classified into the same group). Note that in S24, the display control unit 206 may display some or all of the groups in the first display mode.
- the switching unit 205 determines whether or not to switch the display mode.
- the trigger for switching the display mode is arbitrary.
- the switching unit 205 may determine to switch the display mode when the reception unit 204 receives an operation to switch the display mode by the operator. If the determination in S25 is YES, the process proceeds to S26, and if the determination in S25 is NO, the process proceeds to S28.
- the switching unit 205 identifies the group to be switched. For example, when the reception unit 204 receives an operation to switch the display mode for all groups, the switching unit 205 sets all groups set in S22 as the group to be switched. Also, for example, when the reception unit 204 receives an operation to specify a group for which the display mode is to be switched, the switching unit 205 sets the specified group as the group to be switched.
- the switching unit 205 may identify a group that satisfies a predetermined condition as a target for switching the display mode. For example, the switching unit 205 may identify a group whose importance determined in S23 is equal to or greater than a threshold value or less than a threshold value as a target for switching the display mode.
- the switching unit 205 instructs the display control unit 206 to switch the display mode of the causal graph. More specifically, the switching unit 205 switches the groups identified in S26 that were displayed in the first display mode in S24 to the second display mode. Similarly, the switching unit 205 switches the groups identified in S26 that were displayed in the second display mode in S24 to the first display mode.
- the grouping unit 202 determines whether a group has been changed. For example, the grouping unit 202 may determine that a group has been changed when an operation to move the display position of a node that was displayed in a specified display area associated with a group into a specified display area associated with another group is received. If the determination in S28 is YES, the process proceeds to S29, and if the determination in S28 is NO, the process proceeds to S30.
- the grouping unit 202 updates the groups.
- the display control unit 206 may reflect the group update in the display. For example, assume that a node is moved from a display area associated with a group to a display area associated with another group. In this case, the display control unit 206 may narrow the display area associated with a group (for example, the display area of object b1 in FIG. 5) and widen the display area associated with the other group (for example, the display area of object b3 in FIG. 5).
- the display control unit 206 determines whether or not to end the display of the causal graph. For example, the display control unit 206 may determine to end the display of the causal graph when the reception unit 204 receives an operation to end the display of the causal graph. If it is determined as YES in S30 (i.e., to end the display), the display control method of FIG. 8 ends. On the other hand, if it is determined as NO in S30 (i.e., to continue the display), the process returns to S25.
- the display control method includes displaying a causal graph in which the causal relationships between a plurality of elements are represented by nodes corresponding to each element and edges indicating the causal relationships between each element (S24), and switching the display mode of the causal graph between a first display mode in which substitute objects that substitute for each node corresponding to each element belonging to the same group are displayed, and a second display mode in which each node corresponding to each element belonging to the group is displayed (S27).
- the "causal relationship" in the above display control method can be read as any "relationship,” and the "causal graph” can be read as any "graph” that shows the relationship between any elements with nodes and edges.
- the display control method according to this exemplary embodiment has the effect of making it easier to recognize the relationship between nodes in any graph that shows the relationship between elements with nodes and edges.
- the execution subject of each process described in the above embodiment is arbitrary and is not limited to the above example.
- the functions of the information processing devices 1 and 2 can be realized by multiple devices (which can also be called processors) that can communicate with each other.
- processors which can also be called processors
- each process described in the flowcharts of Figures 2 and 8 can be shared and executed by multiple processors.
- the execution subject of the display control method in the above embodiment may be one processor or multiple processors.
- Some or all of the functions of the information processing device 1 or 2 may be realized by hardware such as an integrated circuit (IC chip), or may be realized by software.
- information processing device 1 or 2 is realized, for example, by a computer that executes instructions of a program, which is software that realizes each function.
- a computer that executes instructions of a program, which is software that realizes each function.
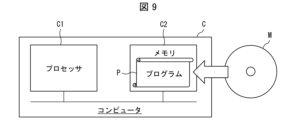
- An example of such a computer (hereinafter referred to as computer C) is shown in Figure 9.
- Computer C has at least one processor C1 and at least one memory C2.
- Memory C2 stores a program (display control program) P for operating computer C as information processing device 1 or 2.
- processor C1 reads and executes program P from memory C2, thereby realizing each function of information processing device 1 or 2.
- the processor C1 may be, for example, a CPU (Central Processing Unit), GPU (Graphic Processing Unit), DSP (Digital Signal Processor), MPU (Micro Processing Unit), FPU (Floating point number Processing Unit), PPU (Physics Processing Unit), TPU (Tensor Processing Unit), quantum processor, microcontroller, or a combination of these.
- the memory C2 may be, for example, a flash memory, HDD (Hard Disk Drive), SSD (Solid State Drive), or a combination of these.
- Computer C may further include a RAM (Random Access Memory) for expanding program P during execution and for temporarily storing various data.
- Computer C may further include a communications interface for sending and receiving data to and from other devices.
- Computer C may further include an input/output interface for connecting input/output devices such as a keyboard, mouse, display, and printer.
- the program P can also be recorded on a non-transitory, tangible recording medium M that can be read by the computer C.
- a recording medium M can be, for example, a tape, a disk, a card, a semiconductor memory, or a programmable logic circuit.
- the computer C can obtain the program P via such a recording medium M.
- the program P can also be transmitted via a transmission medium.
- a transmission medium can be, for example, a communications network or broadcast waves.
- the computer C can also obtain the program P via such a transmission medium.
- An information processing device comprising: a display control means for displaying a graph in which relationships between a plurality of elements are represented by nodes corresponding to each element and edges indicating the relationships between each element; and a switching means for switching the display mode of the graph between a first display mode in which substitute objects that substitute for each node corresponding to each element belonging to the same group are displayed, and a second display mode in which each node corresponding to each element belonging to the group is displayed.
- Appendix 4 The information processing device described in Appendix 2 or 3, wherein the switching means switches the display mode of each group in the graph to an optimal display mode between the first display mode and the second display mode, depending on the manner in which the values of each element included in the group change over time.
- Appendix 5 An information processing device as described in any of appendices 1 to 4, further comprising a grouping means for grouping the elements, and the first display mode is a display mode in which the substitute object is displayed in place of each node corresponding to each element classified into the same group by the grouping means.
- Appendix 7 The information processing device described in Appendix 5, wherein the multiple elements include those generated based on the respondent's answers to specific questions, and the grouping means classifies the multiple elements generated based on answers to the same or related questions into the same group.
- Appendix 8 An information processing device as described in Appendix 5, further comprising a receiving means for receiving a specification of a threshold value of a predetermined index value regarding the relationship between the plurality of elements, wherein the display control means switches between displaying and hiding each node based on the specified threshold value, and the grouping means performs grouping on the elements corresponding to the displayed nodes.
- Appendix 9 An information processing device as described in any of Appendices 5 to 8, wherein the grouping means changes the classification of an element corresponding to a node from the one group to the other group when the node displayed in a specified display area associated with a certain group is moved to a specified display area associated with another group.
- a display control method including: displaying, by at least one processor, a graph representing relationships between a plurality of elements using nodes corresponding to each element and edges indicating the relationships between each element; and switching the display mode of the graph between a first display mode in which, in place of each node corresponding to each element belonging to the same group, a substitute object that substitutes for those nodes is displayed; and a second display mode in which, in place of each node corresponding to each element belonging to the group, each node corresponding to each element belonging to the group is displayed.
- a display control program that causes a computer to function as a display control means for displaying a graph in which relationships between a plurality of elements are represented by nodes corresponding to each element and edges indicating the relationships between each element, and a switching means for switching the display mode of the graph between a first display mode in which instead of each node corresponding to each element belonging to the same group, a substitute object that substitutes for those nodes is displayed, and a second display mode in which each node corresponding to each element belonging to the group is displayed.
- An information processing device including at least one processor, the processor executing a process of displaying a graph in which relationships between a plurality of elements are represented by nodes corresponding to the elements and edges indicating the relationships between the elements, and a process of switching the display mode of the graph between a first display mode in which, instead of each node corresponding to each element belonging to the same group, a substitute object substituting the node is displayed, and a second display mode in which each node corresponding to each element belonging to the group is displayed.
- the information processing device may further include a memory, and the memory may store a display control program for causing the processor to execute the process of displaying a graph and the process of switching the display mode of the graph.
- the display control program may also be recorded on a computer-readable, non-transitory, tangible recording medium.
- Display control unit (display control means) 12 Switching section (switching means) 2 Information processing device 202 Grouping unit (grouping means) 203 Importance determining unit (importance determining means) 204 Reception unit (reception means) 205 Switching unit (switching means) 206 Display control unit (display control means)
Landscapes
- Engineering & Computer Science (AREA)
- Theoretical Computer Science (AREA)
- Computing Systems (AREA)
- Data Mining & Analysis (AREA)
- Evolutionary Computation (AREA)
- Physics & Mathematics (AREA)
- Computational Linguistics (AREA)
- General Engineering & Computer Science (AREA)
- General Physics & Mathematics (AREA)
- Mathematical Physics (AREA)
- Software Systems (AREA)
- Artificial Intelligence (AREA)
- User Interface Of Digital Computer (AREA)
Priority Applications (2)
| Application Number | Priority Date | Filing Date | Title |
|---|---|---|---|
| JP2025529154A JPWO2025004302A1 (cg-RX-API-DMAC7.html) | 2023-06-30 | 2023-06-30 | |
| PCT/JP2023/024314 WO2025004302A1 (ja) | 2023-06-30 | 2023-06-30 | 情報処理装置、表示制御方法、および表示制御プログラム |
Applications Claiming Priority (1)
| Application Number | Priority Date | Filing Date | Title |
|---|---|---|---|
| PCT/JP2023/024314 WO2025004302A1 (ja) | 2023-06-30 | 2023-06-30 | 情報処理装置、表示制御方法、および表示制御プログラム |
Publications (1)
| Publication Number | Publication Date |
|---|---|
| WO2025004302A1 true WO2025004302A1 (ja) | 2025-01-02 |
Family
ID=93938013
Family Applications (1)
| Application Number | Title | Priority Date | Filing Date |
|---|---|---|---|
| PCT/JP2023/024314 Ceased WO2025004302A1 (ja) | 2023-06-30 | 2023-06-30 | 情報処理装置、表示制御方法、および表示制御プログラム |
Country Status (2)
| Country | Link |
|---|---|
| JP (1) | JPWO2025004302A1 (cg-RX-API-DMAC7.html) |
| WO (1) | WO2025004302A1 (cg-RX-API-DMAC7.html) |
Citations (5)
| Publication number | Priority date | Publication date | Assignee | Title |
|---|---|---|---|---|
| US20050007383A1 (en) * | 2003-05-22 | 2005-01-13 | Potter Charles Mike | System and method of visual grouping of elements in a diagram |
| JP2008052494A (ja) * | 2006-08-24 | 2008-03-06 | Sony Corp | ネットワーク分析支援装置および方法、プログラム並びに記録媒体 |
| JP2013225251A (ja) * | 2012-04-23 | 2013-10-31 | Mitsubishi Electric Corp | 情報処理装置及び情報処理方法及びプログラム |
| JP2018005645A (ja) * | 2016-07-05 | 2018-01-11 | 山本 隆義 | 対象物の状態変化の原因探索方法 |
| WO2018168193A1 (ja) * | 2017-03-17 | 2018-09-20 | 株式会社日立製作所 | 業務改善支援装置および業務改善支援方法 |
-
2023
- 2023-06-30 WO PCT/JP2023/024314 patent/WO2025004302A1/ja not_active Ceased
- 2023-06-30 JP JP2025529154A patent/JPWO2025004302A1/ja active Pending
Patent Citations (5)
| Publication number | Priority date | Publication date | Assignee | Title |
|---|---|---|---|---|
| US20050007383A1 (en) * | 2003-05-22 | 2005-01-13 | Potter Charles Mike | System and method of visual grouping of elements in a diagram |
| JP2008052494A (ja) * | 2006-08-24 | 2008-03-06 | Sony Corp | ネットワーク分析支援装置および方法、プログラム並びに記録媒体 |
| JP2013225251A (ja) * | 2012-04-23 | 2013-10-31 | Mitsubishi Electric Corp | 情報処理装置及び情報処理方法及びプログラム |
| JP2018005645A (ja) * | 2016-07-05 | 2018-01-11 | 山本 隆義 | 対象物の状態変化の原因探索方法 |
| WO2018168193A1 (ja) * | 2017-03-17 | 2018-09-20 | 株式会社日立製作所 | 業務改善支援装置および業務改善支援方法 |
Also Published As
| Publication number | Publication date |
|---|---|
| JPWO2025004302A1 (cg-RX-API-DMAC7.html) | 2025-01-02 |
Similar Documents
| Publication | Publication Date | Title |
|---|---|---|
| Chakraborty et al. | Real-time forecasts and risk assessment of novel coronavirus (COVID-19) cases: A data-driven analysis | |
| US11036523B2 (en) | Systems and methods for adaptive user interfaces | |
| JP4537152B2 (ja) | コンピュータ上で視覚化グラフを提供する方法、および視覚化グラフを提供するコンピュータ、ユーザ端末、コンピュータプログラム及び記憶媒体 | |
| US10628001B2 (en) | Adapting user interfaces based on gold standards | |
| US8909653B1 (en) | Apparatus, systems and methods for interactive dissemination of knowledge | |
| CN113544786A (zh) | 使用机器学习预测分子嗅觉特性的系统和方法 | |
| JP2023162562A (ja) | プログラミング支援装置、および、プログラミング支援方法 | |
| JP2020087103A (ja) | 学習方法、コンピュータプログラム、分類器、及び生成器 | |
| JP2023549833A (ja) | 感覚特性予測のための機械学習モデル | |
| US12001786B2 (en) | Applied artificial intelligence technology for natural language generation using a graph data structure with follow-up capabilities | |
| CN119294534B (zh) | 基于医学知识的多模态智能医疗场景动态推理方法及装置 | |
| CN109155005A (zh) | 使用伪计数的增强学习 | |
| CN108008942A (zh) | 对数据记录进行处理的方法及系统 | |
| WO2023037399A1 (ja) | 情報処理装置、情報処理方法及びプログラム | |
| WO2025004302A1 (ja) | 情報処理装置、表示制御方法、および表示制御プログラム | |
| Sharma et al. | Multi-agents based data mining for intelligent decision support systems | |
| JP7750311B2 (ja) | 情報処理装置、情報処理システム、情報処理方法及びプログラム | |
| JP2021111299A (ja) | 学習装置、学習方法、学習プログラム、識別装置、識別方法および識別プログラム | |
| WO2025004299A1 (ja) | 情報処理装置、表示制御方法、および表示制御プログラム | |
| WO2024134797A1 (ja) | 情報処理装置、シミュレーション方法、およびシミュレーションプログラム | |
| Bijak et al. | Modelling in demography: from statistics to simulations | |
| Cui et al. | Deep embedding logistic regression | |
| JP6268322B1 (ja) | 学習データ精度可視化システム、学習データ精度可視化方法、及びプログラム | |
| WO2025004300A1 (ja) | 情報処理装置、支援方法、および支援プログラム | |
| Cao et al. | Estimating treatment effects in continuous time with hidden confounders |
Legal Events
| Date | Code | Title | Description |
|---|---|---|---|
| 121 | Ep: the epo has been informed by wipo that ep was designated in this application |
Ref document number: 23943693 Country of ref document: EP Kind code of ref document: A1 |
|
| ENP | Entry into the national phase |
Ref document number: 2025529154 Country of ref document: JP Kind code of ref document: A |
|
| WWE | Wipo information: entry into national phase |
Ref document number: 2025529154 Country of ref document: JP |
|
| NENP | Non-entry into the national phase |
Ref country code: DE |