WO2024257867A1 - データ処理装置及びデータ処理方法 - Google Patents
データ処理装置及びデータ処理方法 Download PDFInfo
- Publication number
- WO2024257867A1 WO2024257867A1 PCT/JP2024/021740 JP2024021740W WO2024257867A1 WO 2024257867 A1 WO2024257867 A1 WO 2024257867A1 JP 2024021740 W JP2024021740 W JP 2024021740W WO 2024257867 A1 WO2024257867 A1 WO 2024257867A1
- Authority
- WO
- WIPO (PCT)
- Prior art keywords
- data
- culture
- cell count
- cell
- count data
- Prior art date
- Legal status (The legal status is an assumption and is not a legal conclusion. Google has not performed a legal analysis and makes no representation as to the accuracy of the status listed.)
- Ceased
Links
Images












Classifications
-
- C—CHEMISTRY; METALLURGY
- C12—BIOCHEMISTRY; BEER; SPIRITS; WINE; VINEGAR; MICROBIOLOGY; ENZYMOLOGY; MUTATION OR GENETIC ENGINEERING
- C12M—APPARATUS FOR ENZYMOLOGY OR MICROBIOLOGY; APPARATUS FOR CULTURING MICROORGANISMS FOR PRODUCING BIOMASS, FOR GROWING CELLS OR FOR OBTAINING FERMENTATION OR METABOLIC PRODUCTS, i.e. BIOREACTORS OR FERMENTERS
- C12M25/00—Means for supporting, enclosing or fixing the microorganisms, e.g. immunocoatings
- C12M25/10—Hollow fibers or tubes
-
- C—CHEMISTRY; METALLURGY
- C12—BIOCHEMISTRY; BEER; SPIRITS; WINE; VINEGAR; MICROBIOLOGY; ENZYMOLOGY; MUTATION OR GENETIC ENGINEERING
- C12M—APPARATUS FOR ENZYMOLOGY OR MICROBIOLOGY; APPARATUS FOR CULTURING MICROORGANISMS FOR PRODUCING BIOMASS, FOR GROWING CELLS OR FOR OBTAINING FERMENTATION OR METABOLIC PRODUCTS, i.e. BIOREACTORS OR FERMENTERS
- C12M29/00—Means for introduction, extraction or recirculation of materials, e.g. pumps
- C12M29/16—Hollow fibers
-
- C—CHEMISTRY; METALLURGY
- C12—BIOCHEMISTRY; BEER; SPIRITS; WINE; VINEGAR; MICROBIOLOGY; ENZYMOLOGY; MUTATION OR GENETIC ENGINEERING
- C12M—APPARATUS FOR ENZYMOLOGY OR MICROBIOLOGY; APPARATUS FOR CULTURING MICROORGANISMS FOR PRODUCING BIOMASS, FOR GROWING CELLS OR FOR OBTAINING FERMENTATION OR METABOLIC PRODUCTS, i.e. BIOREACTORS OR FERMENTERS
- C12M33/00—Means for introduction, transport, positioning, extraction, harvesting, peeling or sampling of biological material in or from the apparatus
- C12M33/14—Means for introduction, transport, positioning, extraction, harvesting, peeling or sampling of biological material in or from the apparatus with filters, sieves or membranes
-
- C—CHEMISTRY; METALLURGY
- C12—BIOCHEMISTRY; BEER; SPIRITS; WINE; VINEGAR; MICROBIOLOGY; ENZYMOLOGY; MUTATION OR GENETIC ENGINEERING
- C12M—APPARATUS FOR ENZYMOLOGY OR MICROBIOLOGY; APPARATUS FOR CULTURING MICROORGANISMS FOR PRODUCING BIOMASS, FOR GROWING CELLS OR FOR OBTAINING FERMENTATION OR METABOLIC PRODUCTS, i.e. BIOREACTORS OR FERMENTERS
- C12M41/00—Means for regulation, monitoring, measurement or control, e.g. flow regulation
- C12M41/30—Means for regulation, monitoring, measurement or control, e.g. flow regulation of concentration
- C12M41/36—Means for regulation, monitoring, measurement or control, e.g. flow regulation of concentration of biomass, e.g. colony counters or by turbidity measurements
-
- C—CHEMISTRY; METALLURGY
- C12—BIOCHEMISTRY; BEER; SPIRITS; WINE; VINEGAR; MICROBIOLOGY; ENZYMOLOGY; MUTATION OR GENETIC ENGINEERING
- C12M—APPARATUS FOR ENZYMOLOGY OR MICROBIOLOGY; APPARATUS FOR CULTURING MICROORGANISMS FOR PRODUCING BIOMASS, FOR GROWING CELLS OR FOR OBTAINING FERMENTATION OR METABOLIC PRODUCTS, i.e. BIOREACTORS OR FERMENTERS
- C12M41/00—Means for regulation, monitoring, measurement or control, e.g. flow regulation
- C12M41/46—Means for regulation, monitoring, measurement or control, e.g. flow regulation of cellular or enzymatic activity or functionality, e.g. cell viability
-
- C—CHEMISTRY; METALLURGY
- C12—BIOCHEMISTRY; BEER; SPIRITS; WINE; VINEGAR; MICROBIOLOGY; ENZYMOLOGY; MUTATION OR GENETIC ENGINEERING
- C12M—APPARATUS FOR ENZYMOLOGY OR MICROBIOLOGY; APPARATUS FOR CULTURING MICROORGANISMS FOR PRODUCING BIOMASS, FOR GROWING CELLS OR FOR OBTAINING FERMENTATION OR METABOLIC PRODUCTS, i.e. BIOREACTORS OR FERMENTERS
- C12M41/00—Means for regulation, monitoring, measurement or control, e.g. flow regulation
- C12M41/48—Automatic or computerized control
Definitions
- the present invention relates to a data processing device and a data processing method for processing data obtained by culturing cells.
- JP 2020-171241 A shows a cell culture device.
- a user sets the culture conditions of the cell culture device so that a desired number of cells can be collected in a desired culture period.
- the cell culture device cultures cells under the set culture conditions.
- the present invention aims to solve the above-mentioned problems.
- the data processing device of the first invention is a data processing device that processes data on cell culture performed in a cell culture device equipped with a hollow fiber membrane, and includes an acquisition unit that acquires first cell count data indicating the change in cell count from the start of culture under first culture conditions to the end of culture and second cell count data indicating the change in cell count from the start of culture under second culture conditions to the present, a calculation unit that calculates a rate ratio that is the ratio between a first change rate, which is the change rate of the first cell count data in a first predetermined period, and a second change rate, which is the change rate of the second cell count data in a second predetermined period corresponding to the first predetermined period, and a prediction data generation unit that generates prediction data indicating the change in cell count from the present onward under the second culture conditions based on first partial data, which is the portion of the first cell count data after the first predetermined period, and the rate ratio.
- the configuration of item (1) above generates predicted data that reflects the second cell count data, which is data during the culture, so that the progress of the culture can be predicted during the culture. As a result, the user can change the initial culture plan as necessary during the culture. This makes it possible to optimally culture the cells.
- the data processing device described in item (1) above may include a display control unit that controls the display of the cell count calculated from third cell count data, which is data obtained by combining the second cell count data with the prediction data, on a display unit.
- the configuration of item (2) above allows the user to ascertain the culture period during which the desired number of cells can be harvested based on the number of cells displayed on the display unit.
- the predicted data generating unit may generate the predicted data when the deviation of the second rate of change from the first rate of change becomes equal to or greater than a predetermined amount.
- the first cell count data may be data obtained by a cell culture performed in the past, or data obtained by a cell culture simulation.
- the acquisition unit may acquire the first cell count data based on a plurality of cell count data.
- the data processing method of the second invention includes the steps of acquiring first cell count data indicating the change in cell count from the start of culture under first culture conditions to the end of culture and second cell count data indicating the change in cell count from the start of culture under second culture conditions to the present, calculating a rate ratio which is the ratio between a first change rate which is the rate of change of the first cell count data in a first predetermined period and a second change rate which is the rate of change of the second cell count data in a second predetermined period corresponding to the first predetermined period, and generating prediction data indicating the change in cell count from the present onward under the second culture conditions based on first partial data which is the portion of the first cell count data after the first predetermined period and the rate ratio.
- predicted data reflecting the second cell count data which is data during culture
- the user can change the initial culture plan as necessary during the culture. Therefore, it becomes possible to culture the cells in an optimal manner.
- the present invention makes it possible to predict the progress of cell culture during cultivation.
- FIG. 1 is a block diagram of a cell culture system.
- FIG. 2 is a circuit diagram of a cell culture circuit.
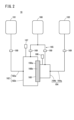
- FIG. 3 is a diagram showing the operation of the cell culture device during cell culture in the first culture mode.
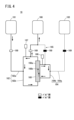
- FIG. 4 is a diagram showing the operation of the cell culture device during cell culture in the second culture mode.
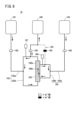
- FIG. 5 is a diagram showing the operation of the cell culture device during cell culture in the third culture mode.
- FIG. 6 is a diagram showing the operation of the cell culture device during cell culture in the fourth culture mode.
- FIG. 7 is a flowchart of the data display process.
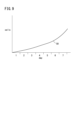
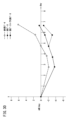
- Figure 8A is a graph showing the first cell count data and the second cell count data
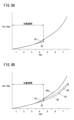
- Figure 8B is a graph showing the first cell count data and the third cell count data.
- FIG. 9 is a diagram showing transition data displayed on the display unit.
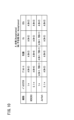
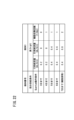
- FIG. 10 is a table showing the evaluation results of the examples.
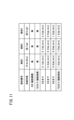
- FIG. 11 is a table showing the incubation conditions for each of the three samples.
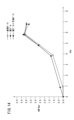
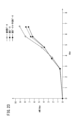
- FIG. 12 is a graph showing cell count data (glucose) obtained by simulating sample 2 (low) using sample 1 (middle) of adherent cells as reference data.
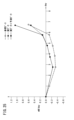
- FIG. 13 is a graph showing cell count data (lactic acid) obtained by simulating sample 2 (low) using sample 1 (middle) of adherent cells as reference data.
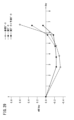
- FIG. 14 is a graph showing cell count data (oxygen) obtained by simulating sample 2 (low) using sample 1 (middle) of adherent cells as reference data.
- FIG. 12 is a graph showing cell count data (glucose) obtained by simulating sample 2 (low) using sample 1 (middle) of adherent cells as reference data.
- FIG. 13 is a graph showing cell count data (lactic acid) obtained by
- FIG. 15 is a graph showing cell count data (carbon dioxide) obtained by simulating sample 2 (low) using sample 1 (middle) of adherent cells as reference data.
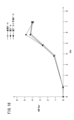
- FIG. 16 is a graph showing cell count data (glucose) obtained by simulating sample 3 (high) using sample 1 (middle) of adherent cells as reference data.
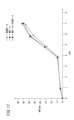
- FIG. 17 is a graph showing cell count data (lactic acid) obtained by simulating sample 3 (high) using sample 1 (middle) of adherent cells as reference data.
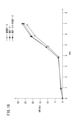
- FIG. 18 is a graph showing cell count data (oxygen) obtained by simulating sample 3 (high) using sample 1 (middle) of adherent cells as reference data.
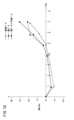
- FIG. 19 is a graph showing cell count data (carbon dioxide) obtained by simulating sample 3 (high) using sample 1 (middle) of adherent cells as reference data.
- FIG. 20 is a table showing the culture conditions.
- FIG. 21 is a table showing the culture conditions.
- FIG. 22 is a table showing the culture conditions.
- FIG. 23 is a graph showing cell count data (glucose) obtained by simulating sample 2 (low) using sample 1 (middle) of suspended cells as reference data.
- FIG. 24 is a graph showing cell count data (lactic acid) obtained by simulating sample 2 (low) using sample 1 (middle) of suspended cells as reference data.
- FIG. 25 is a graph showing cell count data (oxygen) obtained by simulating sample 2 (low) using sample 1 (middle) of suspended cells as reference data.
- FIG. 26 is a graph showing cell count data (carbon dioxide) obtained by simulating sample 2 (low) using sample 1 (middle) of suspended cells as reference data.
- FIG. 27 is a graph showing cell count data (glucose) obtained by simulating sample 3 (high) using sample 1 (middle) of suspended cells as reference data.
- FIG. 28 is a graph showing cell count data (lactic acid) obtained by simulating sample 3 (high) using sample 1 (middle) of suspended cells as reference data.
- FIG. 29 is a graph showing cell count data (oxygen) obtained by simulating sample 3 (high) using sample 1 (middle) of suspended cells as reference data.
- FIG. 30 is a graph showing cell count data (carbon dioxide) obtained by simulating sample 3 (high) using sample 1 (middle) of suspended cells as reference data.
- a user refers to past data to predict the changes in cell count (metabolic state) during the upcoming cell culture, and creates a culture plan based on the prediction results. For example, a user creates a culture period during which a desired number of cells can be harvested, and cultures the cells in a cell culture device for the created culture period.
- the change in cell count may deviate from the predicted change. If the actual change in cell count falls far short of the predicted change, it may not be possible to recover the desired number of cells within the initially set culture period.
- the embodiment described below makes it possible to predict the change in cell count during cell culture using data on the actual change in cell count.
- FIG. 1 is a block diagram of a cell culture system 10.
- the cell culture system 10 includes a cell culture device 12 and a data processing device 14.
- the data processing device 14 predicts the transition of changes in the number of cells and displays the transition of the number of cells according to the prediction result.
- the cells used in the cell culture system 10 may be mammalian cells or mammal-derived cells.
- the cells used in the cell culture system 10 may be adherent cells or floating cells.
- examples of the cells include HEK293 cells (human fetal kidney cells), ES cells (embryonic stem cells), iPS cells (induced pluripotent cells), mesenchymal stem cells, fibroblasts, endothelial cells, and neural stem cells.
- Examples of the floating cells include Jurkat cells (cells derived from human cellular leukemia), T cells, regulatory T cells, tumor-infiltrating lymphocytes, CAR-T cells, and CD34-positive cells.
- the cells used in the cell culture system 10 are not limited to those described above.
- a basal medium and a complete medium are used for cell culture.
- MEM Minimum Essential Media
- a basal medium e.g., MEM
- a basal medium e.g., MEM
- nutritional components such as proteins
- proteins albumin, growth factors, cytokines, etc.
- bovine serum containing albumin, growth factors, etc. is added to the basal medium.
- the cell culture device 12 includes a cell culture circuit 16 and a detection unit 18.
- the cell culture circuit 16 includes a bioreactor 160, a first supply unit 161, a first circuit 162, and a detection unit 18.
- the liquid supply unit 162 includes a second supply unit 163, a second circuit 164, a third circuit 165, a waste liquid storage unit 166, a first sampling unit 167, and a second sampling unit 168.
- the sampling unit 168 includes various sensors (not shown) for detecting the concentration of glucose, lactic acid, protein, etc.
- the cell culture circuit 16 includes various gas sensors for detecting the concentration of gas (O2, CO2, etc.) in the liquid.
- the cell culture circuit 16 also includes a plurality of pumps (not shown) that impart flow force to the liquid, and a plurality of valves 169 that can open and close the flow paths.
- the bioreactor 160 comprises a housing 160a and a plurality of hollow fiber membranes 160b.
- the housing 160a accommodates a plurality of hollow fiber membranes 160b.
- Each hollow fiber membrane 160b is cylindrical. That is, each hollow fiber membrane 160b has a hole (inner hole) that penetrates from one end to the other end.
- the bioreactor 160 comprises a flow path defined by the inner peripheral surface of the hollow fiber membrane 160b, and a flow path defined by the inner wall surface of the housing 160a and the outer peripheral surface of the hollow fiber membrane 160b. Inside the housing 160a, fluid can flow from the inside to the outside of the hollow fiber membrane 160b, and from the outside to the inside of the hollow fiber membrane 160b.
- the first supply unit 161 includes a bag containing a liquid such as a cell solution, a complete medium, a basal medium, or a cleaning solution.
- the first circuit 162 includes a first supply flow path 162a and a first circulation flow path 162b.
- the first supply flow path 162a connects the first supply unit 161 and the first circulation flow path 162b.
- the first circulation flow path 162b includes a flow path defined by the inner circumferential surface of each hollow fiber membrane 160b of the bioreactor 160.
- the liquid supplied from the first supply unit 161 to the first circulation flow path 162b via the first supply flow path 162a can circulate through the first circulation flow path 162b.
- the first sampling unit 167 samples the culture medium from the first circulation flow path 162b.
- the second supply unit 163 includes a bag containing a liquid such as a basal medium or a cleaning solution.
- the second circuit 164 includes a second supply flow path 164a and a second circulation flow path 164b.
- the second supply flow path 164a connects the second supply unit 163 and the second circulation flow path 164b.
- the second circulation flow path 164b includes a flow path defined by the inner wall surface of the housing 160a of the bioreactor 160 and the outer circulatory surface of the hollow fiber membrane 160b.
- the liquid supplied from the second supply unit 163 to the second circulation flow path 164b via the second supply flow path 164a can circulate through the second circulation flow path 164b.
- the second sampling unit 168 samples the culture medium from the second circulation flow path 164b.
- the third circuit 165 connects the first circulation flow path 162b to the waste liquid storage section 166, and also connects the second circulation flow path 164b to the waste liquid storage section 166.
- the waste liquid storage section 166 is equipped with a container for storing waste liquid. The waste liquid discharged from the first circulation flow path 162b and the second circulation flow path 164b is collected in the waste liquid storage section 166.
- One of the multiple valves 169 is disposed in the first supply flow path 162a.
- One of the multiple valves 169 is disposed in the second supply flow path 164a.
- One of the multiple valves 169 is disposed in the flow path of the third circuit 165 that connects the first circulation flow path 162b and the waste liquid storage section 166.
- One of the multiple valves 169 is disposed in the flow path of the third circuit 165 that connects the second circulation flow path 164b and the waste liquid storage section 166.
- the detection unit 18 detects the second cell count data 24 from the culture medium sampled by at least one of the first sampling unit 167 and the second sampling unit 168.
- the detection unit 18 sends the second cell count data 24 to the data processing device 14 at predetermined time intervals.
- the second cell count data 24 is data indicating a change (increase or decrease) in the cell count under the second culture conditions.
- the second cell count data 24 is also data indicating the combined metabolic rate of all cells present in the bioreactor 160.
- the cell count data described in this specification corresponds to data indicating, for example, the concentrations of glucose, lactic acid, O2, CO2, etc.
- the second culture conditions include, for example, information on substances contained in the culture medium, information on the gas supplied to the culture medium, information on the cell culture device 12 (volume information, operation information, culture form, etc.), the number of culture days, the number of seeds, various temperatures, etc. Details of the culture form are explained in [2] below.
- the data processing device 14 includes an input unit 26, a calculation unit 28, a storage unit 30, and a display unit 32.
- the data processing device 14 may be configured, for example, as a computer (a personal computer, a tablet terminal, a smartphone, etc.).
- the calculation unit 28 and the storage unit 30 may be provided in a server, and the display unit 32 may be provided in a terminal device.
- the input unit 26 is a man-machine interface operated by a user.
- the input unit 26 may be, for example, a keyboard, a touch panel, a mouse, etc.
- the input unit 26 sends information input by the user to the calculation unit 28.
- the calculation unit 28 may be configured, for example, by a processor such as a CPU (Central Processing Unit) or a GPU (Graphics Processing Unit). In other words, the calculation unit 28 may be configured by a processing circuit.
- a processor such as a CPU (Central Processing Unit) or a GPU (Graphics Processing Unit).
- the calculation unit 28 may be configured by a processing circuit.
- the calculation unit 28 includes an acquisition unit 34, a calculation unit 36, a data generation unit 38 (prediction data generation unit), and a display control unit 40.
- Each of the acquisition unit 34, the calculation unit 36, the data generation unit 38, and the display control unit 40 can be realized by the calculation unit 28 executing a program stored in the storage unit 30.
- the acquisition unit 34, the calculation unit 36, the data generation unit 38, and the display control unit 40 may be realized by an integrated circuit such as an ASIC (Application Specific Integrated Circuit) or an FPGA (Field-Programmable Gate Array).
- ASIC Application Specific Integrated Circuit
- FPGA Field-Programmable Gate Array
- at least a part of the acquisition unit 34, the calculation unit 36, the data generation unit 38, and the display control unit 40 may be configured by an electronic circuit including a discrete device.
- the acquisition unit 34 acquires data from devices external to the calculation unit 28 (cell culture device 12, input unit 26, memory unit 30, external memory device, etc.).
- the calculation unit 36 calculates a first change rate, a second change rate, and a rate ratio, which will be described later.
- the data generation unit 38 generates correction data 46 and prediction data 48 ( Figure 8B) based on the first cell count data 42 and the rate ratio. Furthermore, the data generation unit 38 generates third cell count data 44 based on the second cell count data 24 and the prediction data 48.
- the display control unit 40 controls the display of the display unit 32.
- the storage unit 30 may be composed of a volatile memory (not shown) and a non-volatile memory (not shown).
- An example of the volatile memory may be a RAM (Random Access Memory).
- This volatile memory is used as a working memory for the processor, and temporarily stores data and the like required for processing or calculation.
- An example of the non-volatile memory may be a ROM (Read Only Memory), flash memory, and the like.
- This non-volatile memory is used as a storage memory, and stores programs, tables, maps, and the like. At least a portion of the storage unit 30 may be provided in the processor, integrated circuit, etc. as described above.
- the memory unit 30 stores the first cell count data 42 in advance before cells are cultured in the cell culture device 12.
- the first cell count data 42 is data indicating a change (increase or decrease) in the cell count under the first culture conditions.
- the first cell count data 42 is data representing the combined metabolic rates of all cells present in the bioreactor 160.
- the first culture conditions include, for example, information about substances contained in the culture medium, information about the gas supplied to the culture medium, information about the cell culture device 12 (volume information, operation information, culture form, etc.), number of days of culture, number of seeds, various temperatures, etc.
- the first cell count data 42 may be data obtained by cell culture performed in the past.
- the first cell count data 42 may be data obtained by a simulation of cell culture.
- the first cell count data 42 may be stored in an external storage device, not in the storage unit 30.
- the display unit 32 may be, for example, a display.
- the display unit 32 displays various display objects (e.g., trend data 50) according to the control of the display control unit 40.
- a controller (not shown) can change the flow path through which the culture medium flows and the flow rate of the culture medium by controlling a plurality of pumps (not shown) and a plurality of valves 169. This allows the cell culture circuit 16 to realize a plurality of culture forms.
- the first to eighth culture forms will be described as examples of the culture forms.
- the first and second culture types are primarily performed from the early to middle stages of the cell culture process.
- the third and fourth culture types are primarily performed from the middle to late stages of the cell culture process.
- the fifth culture type is appropriately performed during the culture period to collect cells.
- [2-1 First culture form] 3 is a diagram showing the operation of the cell culture device 12 during cell culture in the first culture mode.
- the first culture mode is as follows. (a) Complete medium is supplied from the first supply unit 161 to the first circuit 162 (first circulation flow path 162b). (b) The basal medium is not supplied from the second supply unit 163 to the second circuit 164 (second circulation flow path 164b). (c) A portion of the culture medium is discarded from the second circulation flow path 164 b through the third circuit 165 to the waste liquid storage section 166 .
- the first culture form is primarily performed in a cell culture process, but may also be performed in a cell collection process.
- a basal medium is supplied from both ends of the hollow fiber membrane 160b. This allows the cells present in the first circulation flow path 162b to be collected within the hollow fiber membrane 160b.
- [2-2 Second culture form] 4 is a diagram showing the operation of the cell culture device 12 during cell culture in the second culture mode.
- the second culture mode is as follows. (a) Complete medium is supplied from the first supply unit 161 to the first circuit 162 (first circulation flow path 162b). (b) The basal medium is not supplied from the second supply unit 163 to the second circuit 164 (second circulation flow path 164b). (c) A portion of the culture medium is discarded from the first circulation flow path 162 b through the third circuit 165 to the waste liquid storage section 166 .
- [2-3 Third culture form] 5 is a diagram showing the operation of the cell culture device 12 during cell culture in the third culture mode.
- the third culture mode is as follows. (a) Complete medium is supplied from the first supply unit 161 to the first circuit 162 (first circulation flow path 162b). (b) The basal medium is supplied from the second supply unit 163 to the second circuit 164 (second circulation flow path 164b). (c) A portion of the culture medium is discarded from the second circulation flow path 164 b through the third circuit 165 to the waste liquid storage section 166 .
- [2-4 Fourth culture form] 6 is a diagram showing the operation of the cell culture device 12 during cell culture in the fourth culture mode.
- the fourth culture mode is as follows. (a) Complete medium is supplied from the first supply unit 161 to the first circuit 162 (first circulation flow path 162b). (b) The basal medium is supplied from the second supply unit 163 to the second circuit 164 (second circulation flow path 164b). (c) A portion of the culture medium is discarded from the first circulation flow path 162 b through the third circuit 165 to the waste liquid storage section 166 .
- the fifth culture mode is as follows.
- the operation of the cell culture apparatus 12 during cell culture in the fifth culture mode is the same as that of the cell culture apparatus 12 during cell culture in the first culture mode, except for the following (a).
- the operation is the same as in FIG.
- the basal medium is supplied from the first supply unit 161 to the first circuit 162 (first circulation flow path 162b).
- the basal medium is not supplied from the second supply unit 163 to the second circuit 164 (second circulation flow path 164b).
- a portion of the culture medium is discarded from the second circulation flow path 164 b through the third circuit 165 to the waste liquid storage section 166 .
- the basal medium may be supplied from both ends of the hollow fiber membrane 160b. This allows the cells present in the first circulation flow path 162b to be collected in the hollow fiber membrane 160b.
- the process in the fifth culture form is called the cell collection process.
- the sixth culture mode is as follows.
- the operation of the cell culture apparatus 12 during cell culture in the sixth culture mode is the same as that of the cell culture apparatus 12 during cell culture in the second culture mode, except for (a) below.
- the operation is the same as in FIG.
- the basal medium is supplied from the first supply unit 161 to the first circuit 162 (first circulation flow path 162b).
- the basal medium is not supplied from the second supply unit 163 to the second circuit 164 (second circulation flow path 164b).
- a portion of the culture medium is discarded from the first circulation flow path 162 b through the third circuit 165 to the waste liquid storage section 166 .
- the seventh culture mode is as follows.
- the operation of the cell culture apparatus 12 during cell culture in the seventh culture mode is the same as that of the cell culture apparatus 12 during cell culture in the third culture mode, except for (a) below.
- the operation is the same as in FIG.
- the basal medium is supplied from the first supply unit 161 to the first circuit 162 (first circulation flow path 162b).
- the basal medium is supplied from the second supply unit 163 to the second circuit 164 (second circulation flow path 164b).
- a portion of the culture medium is discarded from the second circulation flow path 164 b through the third circuit 165 to the waste liquid storage section 166 .
- the eighth culture mode is as follows.
- the operation of the cell culture apparatus 12 during cell culture in the eighth culture mode is the same as that of the cell culture apparatus 12 during cell culture in the fourth culture mode, except for the following (a).
- the operation is the same as in FIG.
- the basal medium is supplied from the first supply unit 161 to the first circuit 162 (first circulation flow path 162b).
- the basal medium is supplied from the second supply unit 163 to the second circuit 164 (second circulation flow path 164b).
- a portion of the culture medium is discarded from the first circulation flow path 162 b through the third circuit 165 to the waste liquid storage section 166 .
- the first, third, fifth and seventh culture forms are performed in the culture process of suspension cells.
- the second, fourth, sixth and eighth culture forms are performed in the culture process of adherent cells.
- one of the above-mentioned culture forms may be performed, or a combination of multiple culture forms may be performed.
- Each culture form differs in the medium supplied, the method of supplying the medium, the method of disposing of the medium, etc.
- the data generation unit 38 can execute a simulation that combines multiple culture forms.
- [3. Operation of Data Processing Device 14] 7 is a flowchart of the data display process.
- the user causes the cell culture device 12 to perform cell culture, and also causes the data processing device 14 to perform data display process.
- the target period is a period required to calculate the first change rate and the second change rate described later.
- the target period is a period selected by the user from within the cell culture period. As an example, when the cell culture period is 7 days, the user can input "Day 1" as the start point of the target period and "Day 4" as the end point of the target period. In the following, the target period will be described as "Day 1 to Day 4". The user can also input another period.
- the first predetermined period which is the target period of the first cell count data 42
- the second predetermined period which is the target period of the second cell count data 24 are the same period. In other words, the second predetermined period corresponds to the first predetermined period.
- the user operates the input unit 26 to cause the data processing device 14 to execute the data display process.
- step S1 the acquisition unit 34 acquires the second cell count data 24 from the detection unit 18 of the cell culture device 12.
- the memory unit 30 sequentially stores the acquired second cell count data 24.
- step S2 the calculation unit 36 determines whether the fourth day (the end of the target period) has arrived. If the fourth day has arrived (step S2: YES), the process proceeds to step S3. On the other hand, if the fourth day has not arrived (step S2: NO), the process returns to step S1.
- the acquisition unit 34 acquires the first cell count data 42 and the second cell count data 24 from the memory unit 30.
- the first cell count data 42 acquired here is data indicating the change in cell count from the start of culture under the first culture conditions to the end of culture.
- the second cell count data 24 acquired here is data indicating the change in cell count from the start of culture under the culture conditions (second culture conditions) of the currently performed cell culture to the present.
- step S4 the calculation unit 36 calculates the first change rate and the second change rate in the target period specified by the user.
- the change rate is the ratio between the specified target period (from the first day to the fourth day) and the amount of change in the cell count data during that target period.
- the calculation unit 36 calculates the first change rate by dividing the amount of change in the first cell count data 42 in the target period (first specified period) of the first cell count data 42 by the target period.
- the calculation unit 36 calculates the second change rate by dividing the amount of change in the second cell count data 24 in the target period (second specified period) of the second cell count data 24 by the target period.
- the trend of the second cell count data 24 from the fourth day onwards is likely to significantly deviate from the trend of the first cell count data 42.
- the number of cells is likely to be significantly lower than the number initially predicted.
- the data display process ends.
- the trend of the second cell count data 24 from the fourth day onwards is likely not to deviate significantly from the trend of the first cell count data 42.
- the cell count is likely to be close to the initially predicted number. For this reason, it is not necessary to display the trend data 50. Therefore, the data display process ends.
- step S8 the data generating unit 38 brings the correction data 46 closer to the second cell count data 24. Specifically, the data generating unit 38 offsets the correction data 46 by the difference between the first cell count data 42 and the second cell count data 24 on the fourth day (the end point of the target period). In this way, the data generating unit 38 generates the predicted data 48.
- the correction data 46 after the offset is referred to as the predicted data 48.
- the predicted data 48 is data that indicates the change in the cell count from the present onwards under the second culture conditions.
- step S9 the data generation unit 38 generates third cell count data 44 (FIG. 8B) by combining the second cell count data 24 with the predicted data 48. Furthermore, the data generation unit 38 converts the third cell count data 44 into a cell count using a predetermined method.
- the data generating unit 38 may calculate the timing (date, time) at which the number of cells specified by the user can be collected based on the transition data 50.
- the display control unit 40 may cause the display unit 32 to display the timing at which the number of cells specified by the user can be collected.
- the present invention is not limited to the above disclosure, and various configurations may be adopted without departing from the gist of the present invention.
- Example of process for generating third cell count data 44 The inventors actually carried out a process for generating the third cell count data 44 based on the above-described embodiment. Furthermore, the inventors compared the generated third cell count data 44 with the measurement results measured in an actual cell culture to evaluate the accuracy of the third cell count data 44. As a result, the third cell count data 44 was close to the actual measurement results. From this, the inventors came to the conclusion that the third cell count data 44 is appropriate. An example of the process for generating the third cell count data 44 will be described below.
- N means the number of processes evaluated (processes that generate the third cell count data 44).
- TBD in parentheses means the number of samples whose simulation value did not fall within the range of ⁇ 5% ⁇ day of the actual measured concentration on the final day of culture.
- the evaluation results are also shown in the "lactic acid,” “O2,” and “CO2" rows.
- HEK293 cells were used as adherent cells to be cultured. A complete medium containing total protein as the protein was used. After priming the cell culture circuit 16 with PBS, the cell culture circuit 16 was precoated with a cellular adhesion factor (fibronectin), and after precoating, a bag filled with complete medium was connected to the first supply flow path 162a. Gas conditioning was performed, and cells were seeded in the first circulation channel 162b. • Cell culture was carried out mainly using the second culture form. During the cell culture period, the flow rate of the first circulation channel 162b was set to 20 mL/min, and the flow rate of the second circulation channel 164b was set to 300 mL/min.
- a cellular adhesion factor fibronectin
- FIG. 11 is a table showing the culture conditions for each of the three samples.
- FIG. 11 shows the flow rate of complete medium supplied from the first supply unit 161 to the first circuit 162 (first supply flow path 162a) on a daily basis.
- FIG. 12 is a graph showing cell count data (glucose) obtained by simulating sample 2 (low) using sample 1 (middle) as reference data.
- FIG. 13 is a graph showing cell count data (lactic acid) obtained by simulating sample 2 (low) using sample 1 (middle) as reference data.
- FIG. 14 is a graph showing cell count data (oxygen) obtained by simulating sample 2 (low) using sample 1 (middle) as reference data.
- FIG. 15 is a graph showing cell count data (carbon dioxide) obtained by simulating sample 2 (low) using sample 1 (middle) as reference data.
- the graphs shown with dashed lines are reference data.
- the graphs shown with dashed lines are actual data.
- the actual data is cell count data obtained by cell culture of sample 2.
- FIG. 16 is a graph showing cell count data (glucose) obtained by simulating specimen 3 (high) using specimen 1 (middle) of adherent cells as reference data.
- FIG. 17 is a graph showing cell count data (lactic acid) obtained by simulating specimen 3 (high) using specimen 1 (middle) of adherent cells as reference data.
- FIG. 18 is a graph showing cell count data (oxygen) obtained by simulating specimen 3 (high) using specimen 1 (middle) of adherent cells as reference data.
- FIG. 19 is a graph showing cell count data (carbon dioxide) obtained by simulating specimen 3 (high) using specimen 1 (middle) of adherent cells as reference data.
- the graphs shown with dashed lines are reference data.
- the graphs shown with dashed lines are actual data.
- the actual data is cell count data obtained by cell culture of sample 3.
- the present inventors performed three cell culture experiments with different culture conditions using the first culture device to generate three specimens of suspended cells (specimen 1, specimen 2, specimen 3). In each of the three cell culture experiments, cell culture was performed for seven days, and cell count data was measured periodically. Separately, the present inventors performed a process of generating third cell count data 44 under the culture conditions of specimen 2 and specimen 3 based on the cell count data (first cell count data 42) obtained by the cell culture of specimen 1. Furthermore, the third cell count data 44 was evaluated by comparing the third cell count data 44 obtained under the culture conditions of specimen 2 with the cell count data obtained by the cell culture experiment of specimen 2. Similarly, the third cell count data 44 was evaluated by comparing the third cell count data 44 obtained under the culture conditions of specimen 3 with the cell count data obtained by the cell culture experiment of specimen 3.
- the conditions for carrying out the three cell culture experiments are shown below.
- Jurkat cells were used as suspension cells to be cultured.
- a complete medium containing total protein was used as the protein.
- the bag filled with the complete medium after priming was connected to the first supply flow path 162a.
- Gas conditioning was performed, and cells were seeded in the first circulation channel 162b.
- a series of processes consisting of a cell culture step using the first culture form, a cell dispersion step, and a cell collection step were repeatedly performed.
- the supply and disposal of the culture medium were stopped, and the culture medium was circulated in the first circulation flow path 162b.
- the cells dispersed in the first circulation flow path 162b by the cell dispersion step were collected inside the bioreactor 160.
- the cell collection step was performed using the fifth culture form.
- a series of processes consisting of a cell culture step using the third culture form, a cell dispersion step, and a cell harvesting step were repeatedly performed.
- the cell harvesting step was performed using the fifth culture form.
- FIGS. 20 to 22 are tables showing the culture conditions.
- FIG. 20 shows the culture conditions for sample 1.
- FIG. 21 shows the culture conditions for sample 2.
- FIG. 22 shows the culture conditions for sample 3.
- the "IC supply flow rate” shown in each table is the flow rate of complete medium supplied from the first supply unit 161 to the first circulation flow path 162b via the first supply flow path 162a.
- the "EC supply flow rate” shown in each table is the flow rate of basal medium supplied from the second supply unit 163 to the second circulation flow path 164b via the second supply flow path 164a.
- FIG. 23 is a graph showing cell count data (glucose) obtained by simulating sample 2 (low) using sample 1 (middle) of suspended cells as reference data.
- FIG. 24 is a graph showing cell count data (lactic acid) obtained by simulating sample 2 (low) using sample 1 (middle) of suspended cells as reference data.
- FIG. 25 is a graph showing cell count data (oxygen) obtained by simulating sample 2 (low) using sample 1 (middle) of suspended cells as reference data.
- FIG. 26 is a graph showing cell count data (carbon dioxide) obtained by simulating sample 2 (low) using sample 1 (middle) of suspended cells as reference data.
- the graphs shown with dashed lines are reference data.
- the graphs shown with dashed lines are actual data.
- the actual data is cell count data obtained by cell culture of sample 2.
- FIG. 27 is a graph showing cell count data (glucose) obtained by simulating sample 3 (high) using sample 1 (middle) of suspended cells as reference data.
- FIG. 28 is a graph showing cell count data (lactic acid) obtained by simulating sample 3 (high) using sample 1 (middle) of suspended cells as reference data.
- FIG. 29 is a graph showing cell count data (oxygen) obtained by simulating sample 3 (high) using sample 1 (middle) of suspended cells as reference data.
- FIG. 30 is a graph showing cell count data (carbon dioxide) obtained by simulating sample 3 (high) using sample 1 (middle) of suspended cells as reference data.
- the graphs shown with dashed lines are reference data.
- the graphs shown with dashed lines are actual data.
- the actual data is cell count data obtained by cell culture of sample 3.
Landscapes
- Chemical & Material Sciences (AREA)
- Engineering & Computer Science (AREA)
- Health & Medical Sciences (AREA)
- Life Sciences & Earth Sciences (AREA)
- Organic Chemistry (AREA)
- Zoology (AREA)
- Bioinformatics & Cheminformatics (AREA)
- Wood Science & Technology (AREA)
- Sustainable Development (AREA)
- Biotechnology (AREA)
- Biomedical Technology (AREA)
- Microbiology (AREA)
- Biochemistry (AREA)
- General Engineering & Computer Science (AREA)
- General Health & Medical Sciences (AREA)
- Genetics & Genomics (AREA)
- Analytical Chemistry (AREA)
- Computer Hardware Design (AREA)
- Molecular Biology (AREA)
- Cell Biology (AREA)
- Immunology (AREA)
- Apparatus Associated With Microorganisms And Enzymes (AREA)
Abstract
Description
図1は、細胞培養システム10のブロック図である。細胞培養システム10は、細胞培養装置12と、データ処理装置14とを備える。データ処理装置14は、細胞数の変化の推移を予測し、予測結果に応じた細胞数の推移を表示する。細胞培養システム10に用いられる細胞は、哺乳動物細胞であってもよいし、哺乳動物由来の細胞であってもよい。また、細胞培養システム10に用いられる細胞は、接着細胞であってもよいし、浮遊細胞であってもよい。具体的に、細胞としては、例えば、HEK293細胞(ヒト胎児腎細胞)、ES細胞(胚性幹細胞:Embryonic Stem Cells)、iPS細胞(人工多能性幹細胞:induced Pluripotent Cells)、間葉系幹細胞(mesenchymal stem cells)、繊維芽細胞、内皮細胞、神経幹細胞等が挙げられる。浮遊細胞としては、例えば、Jurkat細胞(ヒト細胞性白血病由来細胞)、T細胞、制御性T細胞、腫瘍浸潤リンパ球、CAR-T細胞、CD34陽性細胞等が挙げられる。細胞培養システム10に用いられる細胞は、上述したものに限定されない。
細胞培養装置12は、細胞培養回路16と、検出部18とを備える。図2に示されるように、細胞培養回路16は、バイオリアクタ160と、第1供給部161と、第1回路162と、第2供給部163と、第2回路164と、第3回路165と、廃液収容部166と、第1サンプリング部167と、第2サンプリング部168とを備える。第1サンプリング部167及び第2サンプリング部168は、グルコース、乳酸、タンパク質等の濃度を検出する各種センサ(不図示)を備える。また、細胞培養回路16は、液体中のガス(O2、CO2等)の濃度を検出する各種ガスセンサを備える。また、細胞培養回路16は、液体に流動力を付与する複数のポンプ(不図示)と、流路を開閉し得る複数のバルブ169とを備える。
データ処理装置14は、入力部26と、演算部28と、記憶部30と、表示部32とを備える。データ処理装置14は、例えば、コンピュータ(パーソナルコンピュータ、タブレット端末、スマートフォン等)で構成されてもよい。なお、データ処理装置14のうち、演算部28と記憶部30とがサーバに備えられ、表示部32が端末装置に備えられてもよい。
細胞培養回路16においては、コントローラ(不図示)が、複数のポンプ(不図示)及び複数のバルブ169を制御することによって、培地が流れる流路と、培地の流量とを変えることが可能である。これにより、細胞培養回路16は、複数の培養形態を実現し得る。以下で、培養形態の一例として、第1培養形態~第8培養形態を説明する。
図3は、第1培養形態における細胞培養時の細胞培養装置12の動作を示す図である。第1培養形態は、以下のとおりである。
(a) 第1供給部161から第1回路162(第1循環流路162b)に完全培地が供給される。
(b) 第2供給部163から第2回路164(第2循環流路164b)に基礎培地が供給されない。
(c) 第2循環流路164bから第3回路165を介して廃液収容部166に培地の一部が廃棄される。
図4は、第2培養形態における細胞培養時の細胞培養装置12の動作を示す図である。第2培養形態は、以下のとおりである。
(a) 第1供給部161から第1回路162(第1循環流路162b)に完全培地が供給される。
(b) 第2供給部163から第2回路164(第2循環流路164b)に基礎培地が供給されない。
(c) 第1循環流路162bから第3回路165を介して廃液収容部166に培地の一部が廃棄される。
図5は、第3培養形態における細胞培養時の細胞培養装置12の動作を示す図である。第3培養形態は、以下のとおりである。
(a) 第1供給部161から第1回路162(第1循環流路162b)に完全培地が供給される。
(b) 第2供給部163から第2回路164(第2循環流路164b)に基礎培地が供給される。
(c) 第2循環流路164bから第3回路165を介して廃液収容部166に培地の一部が廃棄される。
図6は、第4培養形態における細胞培養時の細胞培養装置12の動作を示す図である。第4培養形態は、以下のとおりである。
(a) 第1供給部161から第1回路162(第1循環流路162b)に完全培地が供給される。
(b) 第2供給部163から第2回路164(第2循環流路164b)に基礎培地が供給される。
(c) 第1循環流路162bから第3回路165を介して廃液収容部166に培地の一部が廃棄される。
第5培養形態は、以下のとおりである。第5培養形態における細胞培養時の細胞培養装置12の動作は、下記(a)を除き、第1培養形態における細胞培養時の細胞培養装置12の動作(図3)と同じである。
(a) 第1供給部161から第1回路162(第1循環流路162b)に基礎培地が供給される。
(b) 第2供給部163から第2回路164(第2循環流路164b)に基礎培地が供給されない。
(c) 第2循環流路164bから第3回路165を介して廃液収容部166に培地の一部が廃棄される。
第6培養形態は、以下のとおりである。第6培養形態における細胞培養時の細胞培養装置12の動作は、下記(a)を除き、第2培養形態における細胞培養時の細胞培養装置12の動作(図4)と同じである。
(a) 第1供給部161から第1回路162(第1循環流路162b)に基礎培地が供給される。
(b) 第2供給部163から第2回路164(第2循環流路164b)に基礎培地が供給されない。
(c) 第1循環流路162bから第3回路165を介して廃液収容部166に培地の一部が廃棄される。
第7培養形態は、以下のとおりである。第7培養形態における細胞培養時の細胞培養装置12の動作は、下記(a)を除き、第3培養形態における細胞培養時の細胞培養装置12の動作(図5)と同じである。
(a) 第1供給部161から第1回路162(第1循環流路162b)に基礎培地が供給される。
(b) 第2供給部163から第2回路164(第2循環流路164b)に基礎培地が供給される。
(c) 第2循環流路164bから第3回路165を介して廃液収容部166に培地の一部が廃棄される。
第8培養形態は、以下のとおりである。第8培養形態における細胞培養時の細胞培養装置12の動作は、下記(a)を除き、第4培養形態における細胞培養時の細胞培養装置12の動作(図6)と同じである。
(a) 第1供給部161から第1回路162(第1循環流路162b)に基礎培地が供給される。
(b) 第2供給部163から第2回路164(第2循環流路164b)に基礎培地が供給される。
(c) 第1循環流路162bから第3回路165を介して廃液収容部166に培地の一部が廃棄される。
図7は、データ表示処理のフローチャートである。ユーザは、細胞培養装置12に細胞培養を実行させると共に、データ処理装置14にデータ表示処理を実行させる。
細胞の培養前に、複数の細胞数データが存在する場合がある。例えば、過去の複数回の細胞培養の各々で得られた細胞数データがある場合、又は、複数回のシミュレーションの各々で得られた細胞数データがある場合、取得部34は、複数の細胞数データに基づいて、第1細胞数データ42を取得してもよい。例えば、取得部34は、複数の細胞数データの平均を算出して第1細胞数データ42としてもよい。
各実施形態によれば、培養中のデータである第2細胞数データ24を反映した予測データ48を生成するため、培養中に培養の推移を予測することができる。培養中のデータである第2細胞数データ24を反映した予測データ48を生成するため、培養中に培養の推移を予測することができる。結果として、ユーザは、培養中に、必要に応じて当初の培養計画を変更することができる。従って、細胞の培養を好適に行うことが可能となる。
本発明者らは、上述した実施形態に基づいて、実際に第3細胞数データ44を生成する処理を実施した。更に、本発明者らは、生成された第3細胞数データ44と、実際の細胞培養において測定された測定結果とを比較して、第3細胞数データ44の精度評価を行った。結果としては、第3細胞数データ44は、実際の測定結果に近かった。このことから、本発明者らは、第3細胞数データ44は適切であるという結論に至った。以下で、第3細胞数データ44を生成する処理の実施例について説明する。
本発明者らは、第1培養装置を用いて、培養条件が異なる3つの細胞培養実験を行い、接着細胞の3つの検体(検体1、検体2、検体3)を生成した。3つの細胞培養実験の各々においては、7日間の細胞培養を行い、定期的に細胞数データを測定した。これとは別に、本発明者らは検体1の細胞培養によって得られた細胞数データ(=第1細胞数データ42)に基づいて、検体2及び検体3の培養条件における第3細胞数データ44を生成する処理を行った。更に、検体2の培養条件において得られた第3細胞数データ44と、検体2の細胞培養実験によって得られた細胞数データとを比較することによって、第3細胞数データ44の評価を行った。同様に、検体3の培養条件において得られた第3細胞数データ44と、検体3の細胞培養実験によって得られた細胞数データとを比較することによって、第3細胞数データ44の評価を行った。
・ 培養する接着細胞としてHEK293細胞を使用した。
・ タンパク質としてのトータルプロテインを含む完全培地を使用した。
・ PBSで細胞培養回路16をプライミングした後に、細胞培養回路16に細胞性接着因子(フィブロネクチン)をプレコートし、プレコート後に完全培地が充填されたバッグと第1供給流路162aとを接続した。
・ ガスコンディショニングを行い、第1循環流路162bに細胞を播種した。
・ 主に第2培養形態により細胞培養を行った。
・ 細胞培養期間中は、第1循環流路162bの流量を20mL/minとし、第2循環流路164bの流量を300mL/minとした。
本発明者らは、第1培養装置を用いて、培養条件が異なる3つの細胞培養実験を行い、浮遊細胞の3つの検体(検体1、検体2、検体3)を生成した。3つの細胞培養実験の各々においては、7日間の細胞培養を行い、定期的に細胞数データを測定した。これとは別に、本発明者らは検体1の細胞培養によって得られた細胞数データ(第1細胞数データ42)に基づいて、検体2及び検体3の培養条件における第3細胞数データ44を生成する処理を行った。更に、検体2の培養条件において得られた第3細胞数データ44と、検体2の細胞培養実験によって得られた細胞数データとを比較することによって、第3細胞数データ44の評価を行った。同様に、検体3の培養条件において得られた第3細胞数データ44と、検体3の細胞培養実験によって得られた細胞数データとを比較することによって、第3細胞数データ44の評価を行った。
・ 培養する浮遊細胞としてJurkat細胞を使用した。
・ タンパク質としてトータルプロテインを含む完全培地を使用した。
・ PBSで細胞培養回路16をプライミングした後に、プライミング後に完全培地が充填されたバッグと第1供給流路162aとを接続した。
・ ガスコンディショニングを行い、第1循環流路162bに細胞を播種した。
・ 細胞培養期間(7日間)の初期において、第1培養形態による細胞培養工程と、細胞分散工程と、細胞収集工程とからなる一連の処理を繰り返し行った。細胞分散工程では、培地の供給及び廃棄を停止させると共に、第1循環流路162b内で培地を循環させた。細胞収集工程では、細胞分散工程によって第1循環流路162b内に拡散した細胞を、バイオリアクタ160の内部に収集した。ここでは、細胞収集工程を、第5培養形態により行った。
・ 細胞培養期間(7日間)の中期~後期において、第3培養形態による細胞培養工程と、細胞分散工程と、細胞収集工程とからなる一連の処理を繰り返し行った。ここでは、細胞収集工程を、第5培養形態により行った。
Claims (6)
- 中空糸膜を備えた細胞培養装置で行われる細胞培養のデータ処理を行うデータ処理装置であって、
第1培養条件での培養開始から培養終了までの細胞数の変化を示す第1細胞数データと、第2培養条件での培養開始から現在までの細胞数の変化を示す第2細胞数データとを取得する取得部と、
前記第1細胞数データの第1所定期間における変化レートである第1変化レートと、前記第1所定期間に対応する第2所定期間における前記第2細胞数データの変化レートである第2変化レートとの比率であるレート比率を算出する算出部と、
前記第1細胞数データのうちの前記第1所定期間より後の部分である第1部分データと、前記レート比率とに基づいて、前記第2培養条件での現在以降の細胞数の変化を示す予測データを生成する予測データ生成部と、
を備える、データ処理装置。 - 請求項1に記載のデータ処理装置において、
前記第2細胞数データに前記予測データを結合したデータである第3細胞数データから算出される細胞数を表示部に表示する制御を行う表示制御部を備える、データ処理装置。 - 請求項1に記載のデータ処理装置において、
前記予測データ生成部は、前記第1変化レートに対する前記第2変化レートの乖離量が所定量以上になった場合に、前記予測データを生成する、データ処理装置。 - 請求項1に記載のデータ処理装置において、
前記第1細胞数データは、過去に行われた細胞培養によって得られたデータ、又は、細胞培養のシミュレーションによって得られたデータである、データ処理装置。 - 請求項1に記載のデータ処理装置において、
前記取得部は、複数の細胞数データに基づいて、前記第1細胞数データを取得する、データ処理装置。 - 第1培養条件での培養開始から培養終了までの細胞数の変化を示す第1細胞数データと、第2培養条件での培養開始から現在までの細胞数の変化を示す第2細胞数データとを取得する工程と、
前記第1細胞数データの第1所定期間における変化レートである第1変化レートと、前記第1所定期間に対応する第2所定期間における前記第2細胞数データの変化レートである第2変化レートとの比率であるレート比率を算出する工程と、
前記第1細胞数データのうちの前記第1所定期間より後の部分である第1部分データと、前記レート比率とに基づいて、前記第2培養条件での現在以降の細胞数の変化を示す予測データを生成する工程と、
を備える、データ処理方法。
Priority Applications (4)
| Application Number | Priority Date | Filing Date | Title |
|---|---|---|---|
| EP24823480.9A EP4722333A1 (en) | 2023-06-16 | 2024-06-14 | Data processing device and data processing method |
| CN202480039835.XA CN121420053A (zh) | 2023-06-16 | 2024-06-14 | 数据处理装置及数据处理方法 |
| JP2025528022A JPWO2024257867A1 (ja) | 2023-06-16 | 2024-06-14 | |
| US19/418,405 US20260103671A1 (en) | 2023-06-16 | 2025-12-12 | Data Processing Apparatus and Methods for Data Processing Using the Same |
Applications Claiming Priority (2)
| Application Number | Priority Date | Filing Date | Title |
|---|---|---|---|
| JP2023098864 | 2023-06-16 | ||
| JP2023-098864 | 2023-06-16 |
Related Child Applications (1)
| Application Number | Title | Priority Date | Filing Date |
|---|---|---|---|
| US19/418,405 Continuation US20260103671A1 (en) | 2023-06-16 | 2025-12-12 | Data Processing Apparatus and Methods for Data Processing Using the Same |
Publications (1)
| Publication Number | Publication Date |
|---|---|
| WO2024257867A1 true WO2024257867A1 (ja) | 2024-12-19 |
Family
ID=93852204
Family Applications (1)
| Application Number | Title | Priority Date | Filing Date |
|---|---|---|---|
| PCT/JP2024/021740 Ceased WO2024257867A1 (ja) | 2023-06-16 | 2024-06-14 | データ処理装置及びデータ処理方法 |
Country Status (5)
| Country | Link |
|---|---|
| US (1) | US20260103671A1 (ja) |
| EP (1) | EP4722333A1 (ja) |
| JP (1) | JPWO2024257867A1 (ja) |
| CN (1) | CN121420053A (ja) |
| WO (1) | WO2024257867A1 (ja) |
Citations (6)
| Publication number | Priority date | Publication date | Assignee | Title |
|---|---|---|---|---|
| JP2015216886A (ja) * | 2014-05-19 | 2015-12-07 | 横河電機株式会社 | 細胞培養制御システム及び細胞培養制御方法 |
| JP2019058156A (ja) * | 2017-09-28 | 2019-04-18 | オリンパス株式会社 | 画像処理装置および細胞観察システム |
| JP2020171241A (ja) | 2019-04-11 | 2020-10-22 | テルモ株式会社 | バイオリアクタ、細胞培養装置及び細胞培養方法 |
| WO2021100191A1 (ja) * | 2019-11-22 | 2021-05-27 | オリンパス株式会社 | 細胞数情報の表示方法、システム、及び、プログラム |
| WO2021166824A1 (ja) * | 2020-02-19 | 2021-08-26 | 富士フイルム株式会社 | 細胞培養プロセス探索方法、細胞培養プロセス探索プログラム、細胞培養プロセス探索装置、及び、学習済みモデル |
| WO2023276450A1 (ja) * | 2021-06-29 | 2023-01-05 | 富士フイルム株式会社 | 細胞の培養結果を予測する方法、培養結果予測プログラム、及び、培養結果予測装置 |
-
2024
- 2024-06-14 WO PCT/JP2024/021740 patent/WO2024257867A1/ja not_active Ceased
- 2024-06-14 JP JP2025528022A patent/JPWO2024257867A1/ja active Pending
- 2024-06-14 EP EP24823480.9A patent/EP4722333A1/en active Pending
- 2024-06-14 CN CN202480039835.XA patent/CN121420053A/zh active Pending
-
2025
- 2025-12-12 US US19/418,405 patent/US20260103671A1/en active Pending
Patent Citations (6)
| Publication number | Priority date | Publication date | Assignee | Title |
|---|---|---|---|---|
| JP2015216886A (ja) * | 2014-05-19 | 2015-12-07 | 横河電機株式会社 | 細胞培養制御システム及び細胞培養制御方法 |
| JP2019058156A (ja) * | 2017-09-28 | 2019-04-18 | オリンパス株式会社 | 画像処理装置および細胞観察システム |
| JP2020171241A (ja) | 2019-04-11 | 2020-10-22 | テルモ株式会社 | バイオリアクタ、細胞培養装置及び細胞培養方法 |
| WO2021100191A1 (ja) * | 2019-11-22 | 2021-05-27 | オリンパス株式会社 | 細胞数情報の表示方法、システム、及び、プログラム |
| WO2021166824A1 (ja) * | 2020-02-19 | 2021-08-26 | 富士フイルム株式会社 | 細胞培養プロセス探索方法、細胞培養プロセス探索プログラム、細胞培養プロセス探索装置、及び、学習済みモデル |
| WO2023276450A1 (ja) * | 2021-06-29 | 2023-01-05 | 富士フイルム株式会社 | 細胞の培養結果を予測する方法、培養結果予測プログラム、及び、培養結果予測装置 |
Also Published As
| Publication number | Publication date |
|---|---|
| EP4722333A1 (en) | 2026-04-08 |
| JPWO2024257867A1 (ja) | 2024-12-19 |
| US20260103671A1 (en) | 2026-04-16 |
| CN121420053A (zh) | 2026-01-27 |
Similar Documents
| Publication | Publication Date | Title |
|---|---|---|
| US8321145B2 (en) | Predictor of when to harvest cells grown in a bioreactor | |
| Schuler et al. | Real-time monitoring and control of microbial bioprocesses with focus on the specific growth rate: current state and perspectives | |
| JP7338971B2 (ja) | バイオリアクターにおける状態逸脱のモニタリング | |
| Martínez-Monge et al. | New developments in online OUR monitoring and its application to animal cell cultures | |
| Dietzsch et al. | On-line multiple component analysis for efficient quantitative bioprocess development | |
| JP2008178344A (ja) | 細胞培養方法及び細胞培養装置 | |
| US20200190460A1 (en) | Method for Monitoring a Biotechnological Process | |
| Abraham et al. | Bioreactor for scale-up: process control | |
| US20240170098A1 (en) | Method for predicting cell culture result, culture result prediction program, and culture result prediction apparatus | |
| Alberghina et al. | Flow cytometry and cell cycle kinetics in continuous and fed-batch fermentations of budding yeast | |
| JP2026505729A (ja) | 少なくとも1つのバイオリアクタの代謝速度および環境因子を制御および監視するコンピュータベースのシステムおよびその使用方法 | |
| US20120295289A1 (en) | Device and method for culturing cells | |
| EP4722333A1 (en) | Data processing device and data processing method | |
| Winter et al. | Soft sensor for viable cell counting by measuring dynamic oxygen uptake rate | |
| Chen et al. | Systematic inference of functional phosphorylation events in yeast metabolism | |
| JP2013085516A (ja) | 細胞培養制御方法、細胞培養制御装置及びこれを備える細胞培養装置 | |
| US20220137579A1 (en) | Optimized process control | |
| Winder et al. | The use of continuous culture in systems biology investigations | |
| US20260125631A1 (en) | Simulation apparatus, simulation system, and simulation method for simulating cell proliferation by a cell culture apparatus | |
| US20230002708A1 (en) | Adapting control of a cell culture in a production scale vessel with regard to a starting medium | |
| US11591558B2 (en) | Method for analysis and cell culture and an associated system | |
| US20240254429A1 (en) | Simulation Apparatus, Simulation System, And Simulation Method | |
| JP2010187594A (ja) | 培養モニタリング装置及び当該培養モニタリング装置を有する培養装置 | |
| US20250313793A1 (en) | Automated cell culturing and characterization to resemble in vivo conditions | |
| Van Beylen et al. | Real-Time Cell Growth Control Using a Lactate-Based Model Predictive Controller. Processes 2023, 11, 22 |
Legal Events
| Date | Code | Title | Description |
|---|---|---|---|
| 121 | Ep: the epo has been informed by wipo that ep was designated in this application |
Ref document number: 24823480 Country of ref document: EP Kind code of ref document: A1 |
|
| ENP | Entry into the national phase |
Ref document number: 2025528022 Country of ref document: JP Kind code of ref document: A |
|
| WWE | Wipo information: entry into national phase |
Ref document number: 2025528022 Country of ref document: JP |
|
| WWE | Wipo information: entry into national phase |
Ref document number: 2024823480 Country of ref document: EP |
|
| NENP | Non-entry into the national phase |
Ref country code: DE |
|
| ENP | Entry into the national phase |
Ref document number: 2024823480 Country of ref document: EP Effective date: 20260102 |
|
| ENP | Entry into the national phase |
Ref document number: 2024823480 Country of ref document: EP Effective date: 20260102 |
|
| ENP | Entry into the national phase |
Ref document number: 2024823480 Country of ref document: EP Effective date: 20260102 |
|
| ENP | Entry into the national phase |
Ref document number: 2024823480 Country of ref document: EP Effective date: 20260102 |
|
| WWP | Wipo information: published in national office |
Ref document number: 2024823480 Country of ref document: EP |