WO2024257529A1 - 生体情報測定システム - Google Patents
生体情報測定システム Download PDFInfo
- Publication number
- WO2024257529A1 WO2024257529A1 PCT/JP2024/017747 JP2024017747W WO2024257529A1 WO 2024257529 A1 WO2024257529 A1 WO 2024257529A1 JP 2024017747 W JP2024017747 W JP 2024017747W WO 2024257529 A1 WO2024257529 A1 WO 2024257529A1
- Authority
- WO
- WIPO (PCT)
- Prior art keywords
- information
- user
- detection unit
- detection
- stool
- Prior art date
- Legal status (The legal status is an assumption and is not a legal conclusion. Google has not performed a legal analysis and makes no representation as to the accuracy of the status listed.)
- Ceased
Links
Images












Classifications
-
- E—FIXED CONSTRUCTIONS
- E03—WATER SUPPLY; SEWERAGE
- E03D—WATER-CLOSETS OR URINALS WITH FLUSHING DEVICES; FLUSHING VALVES THEREFOR
- E03D9/00—Sanitary or other accessories for lavatories ; Devices for cleaning or disinfecting the toilet room or the toilet bowl; Devices for eliminating smells
-
- G—PHYSICS
- G01—MEASURING; TESTING
- G01N—INVESTIGATING OR ANALYSING MATERIALS BY DETERMINING THEIR CHEMICAL OR PHYSICAL PROPERTIES
- G01N33/00—Investigating or analysing materials by specific methods not covered by groups G01N1/00 - G01N31/00
- G01N33/48—Biological material, e.g. blood, urine; Haemocytometers
- G01N33/483—Physical analysis of biological material
- G01N33/497—Physical analysis of biological material of gaseous biological material, e.g. breath
-
- G—PHYSICS
- G01—MEASURING; TESTING
- G01N—INVESTIGATING OR ANALYSING MATERIALS BY DETERMINING THEIR CHEMICAL OR PHYSICAL PROPERTIES
- G01N33/00—Investigating or analysing materials by specific methods not covered by groups G01N1/00 - G01N31/00
- G01N33/48—Biological material, e.g. blood, urine; Haemocytometers
- G01N33/50—Chemical analysis of biological material, e.g. blood, urine; Testing involving biospecific ligand binding methods; Immunological testing
Definitions
- the disclosed embodiment relates to a biometric information measurement system.
- a toilet device that senses the properties of stool is known (see, for example, Patent Document 1). It is believed that information related to intestinal peristalsis can be inferred from such stool properties.
- a toilet device that senses defecation gas is known (see, for example, Patent Document 2). It is believed that information related to the intestinal environment can be inferred from such defecation gas.
- the disclosed embodiment aims to provide a biometric information measurement system that can appropriately estimate information related to a user's health.
- the biometric information measurement system is a biometric information measurement system that measures the biometric information of a user of a toilet room based on information on excrement discharged into a toilet bowl installed in the toilet room, and is characterized by comprising a first detection unit that detects feces, a second detection unit that detects fecal gas, and a control unit that executes an estimation process that estimates at least one of the provided information or score related to the health of the user based on the detection results of the first detection unit and the detection results of the second detection unit, and executes control to output the results of the estimation process to the outside.
- the health of the intestines is determined by the peristaltic movement of the outer wall of the intestine, which is mainly affected by stress, sleep, infections, etc., and the intestinal environment inside the intestine, which is mainly affected by diet. Furthermore, stool information (feces properties) is one indicator of peristaltic movement, and defecation gas information (amount or concentration of defecation gas) is one indicator of the intestinal environment.
- a bioinformation measuring system by outputting information and a score related to the user's health based on stool information related to the user's peristaltic movement and defecation gas information related to the user's intestinal environment, it is possible to output information and a score related to the user's health that takes into account the state of the outer wall of the intestine and the state of the inside of the intestine, and therefore it is possible to provide more accurate health support to the user.
- the inventors' research has revealed that the health of the entire intestine is determined by the peristaltic movement of the outer wall of the intestine, which is mainly affected by stress, sleep, infections, etc., and the intestinal environment inside the intestine, which is mainly affected by diet.
- Conventionally with only one of a toilet device that estimates only peristaltic movement and a toilet device that estimates the intestinal environment, it is only possible to grasp either information related to peristaltic movement or information related to the intestinal environment, and it is not possible to accurately grasp the health of the entire intestine.
- information related to the user's health can be appropriately estimated by estimating information related to the user's health based on the detection results of both stool and fecal gas.
- the control unit estimates first bioinformation based on the properties of the stool from the detection result of the first detection unit, estimates second bioinformation based on the amount or concentration of the fecal gas from the detection result of the second detection unit, and executes control to output the first bioinformation and the second bioinformation to the outside.
- the bioinformation measuring system shows the characteristics of the stool, which is an indicator of peristalsis, and the amount or concentration of fecal gas, which is an indicator of the intestinal environment, allowing the user to better understand the cause of their illness and how to improve their lifestyle, thereby enabling more accurate health support to be provided to the user.
- control unit executes the estimation process using a larger number of samples of the detection results of the second detection unit than the number of samples of the detection results of the first detection unit.
- a bioinformation measuring system data on the amount or concentration of fecal gas related to the intestinal environment is estimated using a larger number of samples than data on the properties of stool related to peristalsis to estimate information related to the user's health, making it possible to more accurately estimate peristalsis and the intestinal environment. Therefore, the bioinformation measuring system can appropriately estimate information related to the user's health.
- the estimation process uses the detection result of the first detection unit obtained from one toilet use and multiple detection results of the second detection unit obtained from multiple toilet use.
- Stool properties can change significantly due to sudden stress, and properties can change if multiple bowel movements occur in one day.
- the intestinal environment changes slowly over a period of a week or more, with changes of about 2-3 days being data variations caused by diet, etc. Therefore, according to a bioinformation measuring system according to one aspect of the embodiment, data on stool properties related to peristalsis is obtained from a single excretion data, and data on the amount or concentration of bowel gas related to the intestinal environment is obtained from multiple excretion data, making it possible to appropriately convey comprehensive health-related information and scores to the user. Therefore, the bioinformation measuring system can appropriately estimate information regarding the user's health.
- control unit executes the estimation process to estimate the score higher as the first evaluation corresponding to each classification of the stool properties based on the detection result of the first detection unit is higher, and estimates the score higher as the second evaluation of the fecal gas based on the detection result of the second detection unit is higher.
- Stool properties are evaluated differently depending on the classification.
- a common index (Bristol scale) that represents stool properties is that a banana-shaped stool in the middle is in a good condition, and the condition worsens as you move toward the ends.
- fecal gas which represents the intestinal environment
- the higher the score the more desirable the condition. Therefore, according to a bioinformation measuring system according to one aspect of the embodiment, when determining the intestinal condition, the better the classification of stool properties is, the better the intestinal condition is estimated to be, and the higher the score of fecal gas, which represents the intestinal environment, the better the intestinal condition is estimated to be, so that the intestinal condition can be appropriately estimated as a total score, and the user can be correctly informed of the intestinal condition. Therefore, the bioinformation measuring system can appropriately estimate information about the user's health.
- the biometric information measurement system is a biometric information measurement system that measures the biometric information of a user of a toilet room based on information about excrement discharged into a bowl of a toilet installed in the toilet room, and is characterized by comprising a first detection unit that detects information about intestinal peristalsis, a second detection unit that detects information about the intestinal environment, and a control unit that executes an estimation process to estimate at least one of the provided information or score related to the health of the user based on the detection results of the first detection unit and the detection results of the second detection unit, and executes control to output the results of the estimation process to the outside.
- the health of the intestine is determined by the peristaltic movement of the outer wall of the intestine, which is mainly affected by stress, sleep, infections, etc., and the intestinal environment inside the intestine, which is mainly affected by diet. Therefore, according to a bioinformation measuring system of one aspect of an embodiment, by outputting information provided about the user's health and a score based on information about the user's peristaltic movement and information about the user's intestinal environment, it is possible to output information provided about the user's health and a score that takes into account the state of the outer wall of the intestine and the state of the inside of the intestine, and therefore it is possible to provide more accurate health support for the user. In this way, according to a bioinformation measuring system of one aspect of an embodiment, by estimating information about the user's health based on the detection of both peristaltic movement and the intestinal environment, it is possible to appropriately estimate information about the user's health.
- the biometric information measurement system is a biometric information measurement system that measures the biometric information of a user of a toilet room based on information on excrement discharged into a toilet bowl installed in the toilet room, and is characterized by comprising a control unit that executes an estimation process to estimate at least one of the provided information or score related to the health of the user based on the detection result by a first detection unit that detects feces and the detection result by a second detection unit that detects defecation gas, and executes control to output the result of the estimation process to the outside.
- the health of the intestine is determined by the peristaltic movement of the outer wall of the intestine, which is mainly affected by stress, sleep, infections, etc., and the intestinal environment inside the intestine, which is mainly affected by diet.
- peristaltic movement depends on stool information
- the intestinal environment inside the intestine depends on defecation gas information.
- a bioinformation measuring system of one aspect of the embodiment by outputting information and scores related to the user's health based on stool information related to the peristaltic movement of the user and defecation gas information related to the user's intestinal environment, it is possible to output information and scores related to the user's health that take into account the state of the outer wall of the intestine and the state of the inside of the intestine, and therefore it is possible to provide more accurate health support for the user. In this way, according to a bioinformation measuring system of one aspect of the embodiment, it is possible to appropriately estimate information related to the user's health by estimating information related to the user's health based on the detection of both stool and defecation gas.
- the biometric information measurement system is a biometric information measurement system that measures the biometric information of a user of a toilet room based on information about excrement discharged into a bowl of a toilet installed in the toilet room, and is characterized by comprising a control unit that executes an estimation process to estimate at least one of the provided information or a score related to the health of the user based on a detection result by a first detection unit that detects information related to intestinal peristalsis and a detection result by a second detection unit that detects information related to the intestinal environment, and executes control to output the result of the estimation process to the outside.
- the health of the intestine is determined by the peristaltic movement of the outer wall of the intestine, which is mainly affected by stress, sleep, infections, etc., and the intestinal environment inside the intestine, which is mainly affected by diet.
- peristaltic movement depends on stool information
- the intestinal environment inside the intestine depends on defecation gas information.
- a bioinformation measuring system of one aspect of the embodiment by outputting information and scores related to the user's health based on stool information related to the peristaltic movement of the user and defecation gas information related to the user's intestinal environment, it is possible to output information and scores related to the user's health that take into account the state of the outer wall of the intestine and the state of the inside of the intestine, and therefore it is possible to provide more accurate health support for the user. In this way, according to a bioinformation measuring system of one aspect of the embodiment, it is possible to appropriately estimate information related to the user's health by estimating information related to the user's health based on the detection of both stool and defecation gas.
- information about the user's health can be appropriately estimated.
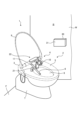
- FIG. 1 is a perspective view showing an example of a configuration of a toilet room according to an embodiment.
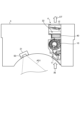
- FIG. 2 is a plan view illustrating an example of the configuration of the measurement device according to the embodiment.
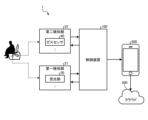
- FIG. 3 is a diagram illustrating an example of an overall outline of a biological information measuring system according to an embodiment.
- FIG. 4 is a diagram illustrating an example of the configuration of a biological information measuring system according to the embodiment.
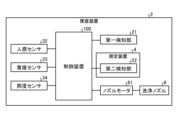
- FIG. 5 is a block diagram showing an example of the configuration of a toilet seat device according to an embodiment.
- FIG. 6 is a block diagram illustrating an example of the configuration of the control device according to the embodiment.
- FIG. 7 is a diagram illustrating an example of a process executed by the biological information measuring system according to the embodiment.
- FIG. 1 is a perspective view showing an example of a configuration of a toilet room according to an embodiment.
- FIG. 2 is a plan view illustrating an example of the configuration of the measurement device according to the embodiment.
- FIG. 3 is a diagram illustrating
- FIG. 8 is a diagram showing an example of the configuration of a gas sensor.
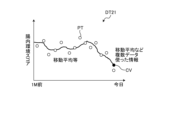
- FIG. 9 is a diagram showing an example of the second evaluation based on a plurality of data.
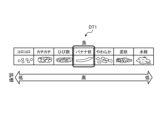
- FIG. 10 is a diagram illustrating an example of an estimation of a first evaluation according to the embodiment.
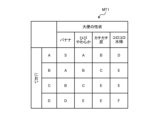
- FIG. 11 is a diagram illustrating an example of estimation of the second evaluation according to the embodiment.
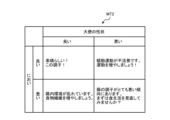
- FIG. 12 is a diagram illustrating an example of estimation of provided information according to the embodiment.
- FIG. 13 is a diagram illustrating an example of information used to estimate a score according to the embodiment.
- FIG. 14 is a diagram illustrating an example of information used to estimate provided information according to the embodiment.
- FIG. 15 is a diagram illustrating an example of information used to estimate provided information according to the embodiment.
- FIG. 16 is a diagram illustrating an example of information provided by the biological information measuring system.
- FIG. 17 is a diagram illustrating an example of information provided by the biological information measuring system.
- FIG. 18 is a diagram illustrating an example of information provided by the biological information measuring system.
- FIG. 19 is a diagram illustrating an example of information according to an estimation result.
- FIG. 20 is a diagram illustrating an example of information according to an estimation result.
- FIG. 21 is a diagram showing an example of information relating to a user's intestinal activity.
- FIG. 22 is a diagram showing an example of recommendation information for a user.
- FIG. 23 is a diagram showing an example of recommendation information for a user.
- FIG. 24 is a diagram showing an example of information of other users provided to a user.
- FIG. 25 is a diagram showing an example of a display form of information provided to a user.
- FIG. 26 is a diagram showing an example of recommendation information for a user.
- FIG. 27 is a diagram showing an example of information of other users provided to a user.
- FIG. 28 is a diagram showing an example of information on users having a relationship with the user.
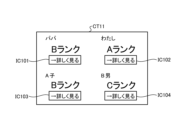
- FIG. 29 is a diagram showing an example of rank information regarding users.
- FIG. 30 is a diagram showing an example of information notification to a user.
- FIG. 31 is a diagram showing an example of information notification according to the usage status of the user.
- FIG. 32 is a diagram showing an example of information notification according to the usage status of the user.
- Embodiment In the bioinformation measuring system according to each embodiment described below, information about the health of the user estimated based on the detection result of the first detector 21, which is a detector for detecting stool, and the detection result of the second detector 22, which is a detector for detecting defecation gas, is managed.
- an imaging device having a line sensor and generating an image is described as an example of the first detector 21, and a gas detection device having a semiconductor gas sensor is described as an example of the second detector 22.
- the first detector 21 and the second detector 22 can adopt any configuration as long as they can obtain (detect) the desired information, which will be described later.
- the defecation gas referred to here is the gas that comes out of the intestines, and includes, for example, gas that comes out at the same time as defecation and gas that is not discharged at the same time as defecation.
- Fig. 1 is a perspective view showing an example of the configuration of a biological information measuring system according to an embodiment. Note that Fig. 1 shows a toilet seat 5 and a toilet lid 9 in a see-through state in order to show the configuration of a measuring device 4 and a first detector 21.
- a toilet 7 is installed on the floor surface F.
- the direction facing the space of the toilet room R from the floor surface F may be described as "up.”
- components of the vital sign measurement system 1, such as the suction device 10, the measurement device 4 that detects gas including the second detection unit 22 that is a gas detection device, and the first detection unit 21, are arranged.
- the toilet bowl 7 is a toilet bowl, and has a bowl portion 8 formed therein.
- the bowl portion 8 is concave downwards, and is the portion that receives the user's waste.
- the toilet bowl 7 is not limited to a floor-standing type as shown in the figure, and may be of any type, such as a wall-mounted type, as long as the bio-information measuring system 1 is applicable.
- the toilet bowl 7 has a rim portion around the entire edge of the opening facing the bowl portion 8.
- a flush water tank that stores flush water may be installed near the toilet bowl 7, or a so-called tankless type in which no flush water tank is installed may be used.
- a toilet flush is performed by supplying flushing water to the bowl portion 8 of the toilet 7.
- the flushing operation unit may be an operation lever, or a touch operation on a toilet flushing object displayed on the operation device 30.
- the flushing operation unit is not limited to an operation lever or the like that allows the user to manually flush the toilet, but may also be one that allows the toilet flush to be performed by a sensor that detects the user, such as a seating sensor.
- the toilet seat device 2 is attached to the top of the toilet bowl 7, and comprises a main body 3, a measuring device 4, a toilet seat 5, a cleaning nozzle 6, and a first detector 21.
- the measuring device 4 and the first detector 21 may be provided as separate devices from the toilet seat device 2, but this will be described later.
- the toilet seat device 2 is placed on top of the toilet bowl 7, which is formed with a bowl portion 8 that receives excrement.
- the toilet seat device 2 is placed on top of the toilet bowl 7 so that the cleaning nozzle 6 advances into the bowl portion 8 before spraying cleaning water.
- the toilet seat device 2 may be attached detachably to the toilet bowl 7, or may be attached so as to be integrated with the toilet bowl 7.
- the toilet seat device 2 measures the biometric information of the user of the toilet room R based on the feces gas discharged into the bowl portion 8 of the toilet 7 installed in the toilet room R.
- the measuring device 4 has a suction device 10 and a second detection unit 22.
- the toilet seat device 2, with the configuration of the first detection unit 21, etc. measures the biometric information of the user of the toilet room R based on the feces discharged into the bowl portion 8 of the toilet 7 installed in the toilet room R.
- the measuring device 4 and the first detection unit 21 will be described in detail in FIG. 2.
- the toilet seat 5 is formed in an annular shape and is positioned along the edge (rim portion) of the bowl portion 8 in a position overlapping the opening of the toilet bowl 7. A user sits on the toilet seat 5.
- the toilet seat 5 functions as a seating portion that supports the buttocks of a seated user.
- a toilet lid 9 is attached to the toilet seat device 2 as necessary, and the toilet seat device 2 does not have to have a toilet lid 9.
- the cleaning nozzle 6 is a nozzle for spraying water for cleaning.
- the cleaning nozzle 6 is configured to be movable forward and backward relative to the housing of the main body 3 by being driven by a drive source such as an electric motor (such as the nozzle motor 61 in FIG. 5).
- the cleaning nozzle 6 is also connected to a water source such as a water pipe (not shown).
- a water source such as a water pipe (not shown).
- the cleaning nozzle 6 is shown in the advanced position.
- the cleaning nozzle 6 may also be used to clean the inside of the toilet bowl 7 (bowl portion 8, etc.).
- the cleaning nozzle 6 may be used to be switchable between a private parts cleaning mode for cleaning the private parts of the user, and a toilet bowl cleaning mode for spraying water inside the toilet bowl 7.
- the cleaning nozzle 6 may be used to be switchable between the private parts cleaning mode and the toilet bowl cleaning mode in response to control by the toilet seat device 2.
- the operating device 30 is provided in the toilet room R.
- the operating device 30 is provided in a position where it can be operated by a user.
- the operating device 30 is provided in a position where it can be operated when the user is seated on the toilet seat 5.
- the operating device 30 is provided on the wall surface W on the left side as seen by a user seated on the toilet seat 5.
- the operating device 30 may be provided in various ways, not limited to on a wall surface, as long as it is available to a user seated on the toilet seat 5.
- the operating device 30 may be provided integrally with the toilet seat device 2.
- the operating device 30 is connected to the toilet seat device 2 via a specified network so as to be able to communicate with each other via a wired or wireless connection.
- the toilet seat device 2 and the operating device 30 may be connected in any manner as long as they are able to send and receive information, and may be connected to each other so as to be able to communicate with each other via a wired connection or a wireless connection.
- the operation device 30 accepts various operations from the user via a display surface (e.g., display screen 31) using, for example, a touch panel function.
- the operation device 30 may also be equipped with switches and buttons, and may accept various operations via the switches and buttons.
- the display screen 31 is, for example, the display screen of a tablet terminal or the like realized by a liquid crystal display or an organic EL (Electro-Luminescence) display, and is a display device for displaying various information.
- the operation device 30 accepts input from the user via the display screen 31, and also outputs to the user.
- the display screen 31 is a display device that displays various information.
- the operation device 30 accepts user operations to control various functions provided in the toilet room R.
- the operation device 30 accepts user operations to control the execution of local cleansing by the toilet seat device 2.
- the operation device 30 may have switches, buttons, etc. that accept the above-mentioned user operations, and execute various processes in response to the user's contact with the switches, buttons, etc.
- a user terminal such as a user's smartphone (corresponding to the display device 300 in FIG. 3) may have functions equivalent to those of the operation device 30.
- the bioinformation measuring system 1 measures the bioinformation of the user of the toilet room R based on the stool and defecation gas discharged into the bowl portion 8 of the toilet 7 installed in the toilet room R, using various configurations and processes described below.
- the bioinformation measuring system 1 executes control to appropriately measure the stool and defecation gas.
- the bioinformation measuring system 1 provides information to a user terminal such as the user's smartphone (corresponding to the display device 300 in FIG. 3) based on information collected by measurement, etc.
- the bioinformation measuring system 1 may also provide information to the operating device 30 (or display screen 31) of the toilet room R based on information collected by measurement, etc.
- Fig. 2 is a plan view showing an example of the configuration of the measuring device according to the embodiment.
- the measuring device 4 and the first detection unit 21 are arranged in the main body 3 as an example.
- Fig. 2 illustrates the configuration of the measuring device 4 and the first detection unit 21 by removing the housing (cover) of the main body 3 at the location where the measuring device 4 and the first detection unit 21 are arranged.
- the measuring device 4 has a suction device 10 that sucks gas from within the bowl portion 8 of the toilet 7, and a second detection unit 22 that detects the components of the sucked gas.
- the suction device 10 has a fan for sucking in gas in the bowl portion 8 of the toilet 7.
- a duct 11 that communicates with the inside of the bowl portion 8 of the toilet 7 is connected to the suction device 10.
- the duct 11 functions as a flow path that allows the gas in the bowl portion 8 to flow into the measuring device 4.
- the suction device 10 drives the fan to suck in gas in the bowl portion 8 using the duct 11 as a flow path.
- the suction device 10 performs suction-related processing under the control of the control device 100.
- the suction device 10 may be controlled by a control means (device) other than the control device 100.
- the second detector 22 detects fecal gas.
- the second detector 22 detects information on the intestinal environment.
- the second detector 22 executes processing related to the detection of components of gas sucked by the suction device 10.
- the second detector 22 is disposed downstream of the suction device 10 as viewed from the bowl portion 8 side.
- FIG. 2 is merely an example, and the second detector 22 may be disposed at any position as long as the gas sucked by the suction device 10 can be introduced.
- the second detector 22 is connected to a duct 12 that communicates with the outside of the main body portion 3.
- the duct 12 functions as a flow path that allows the gas in the second detector 22 to flow out of the measurement device 4.
- the gas in the second detector 22 is released outside the measurement device 4 through the duct 12 as a flow path.
- the second detection unit 22 executes a process related to gas detection in response to the control of the control device 100.
- the second detection unit 22 includes a gas sensor 40 that reacts to gas contained in the atmosphere.
- the gas sensor 40 detects specific components of the gas.
- a semiconductor gas sensor is used as the gas sensor 40.
- the gas sensor is not limited to the semiconductor gas sensor 40, and multiple types of sensors of any type may be used.
- the gas sensor 40 may be used as a single unit that combines sensors of multiple principles, such as a semiconductor type + infrared absorption type.
- the gas sensor 40 detects fecal gas that indicates the user's intestinal environment, and this will be described later.
- the first detector 21 detects feces.
- the first detector 21 detects information related to the peristaltic movement of the intestines.
- the first detector 21 detects feces (defecation) excreted by the user by capturing an image of the inside of the bowl portion 8 of the toilet 7.
- the first detector 21 is an image sensor.
- the first detector 21 has a light receiving unit 50.
- the light receiving element is a line sensor in which a CCD (Charge Coupled Device) sensor or a CMOS (Complementary Metal Oxide Semiconductor) sensor is arranged in a row.
- the light receiving element is not limited to a line sensor (one-dimensional image sensor), and various sensors such as an area sensor (two-dimensional image sensor) may be used.
- the first detector 21 may have a configuration that emits light of a predetermined wavelength (such as the light emitting element 51 in FIG. 7), but this will be described later.
- the light receiving unit 50 of the first detection unit 21 is positioned to receive light from area AD1 in the bowl portion 8 of the toilet bowl 7.
- the light receiving unit 50 is positioned to receive reflected light from stool falling inside the bowl portion 8 of the toilet bowl 7.
- the imaging of stool falling by the first detection unit 21 will be described in FIG. 7.
- the light receiving unit 50 of the first detection unit 21 may detect stool in any state, such as stool after it has hit water, not limited to when it is falling, as long as it is possible to obtain information necessary to estimate (determine) the properties of the stool.
- the light receiving unit 50 may detect the stool after it has fallen.
- the light receiving unit 50 may be positioned to capture an image of the water sealing portion of the toilet 7 (e.g., the portion of the bowl portion 8 where the water sealing portion collects).
- the light receiving unit 50 may be an area sensor (two-dimensional image sensor).
- the first detection unit 21 may be positioned in any location and any image sensor may be used as long as it is capable of detecting stool excreted in the toilet 7 and the desired information can be deduced.
- FIG. 3 is a diagram showing an example of an overall overview of the biological information measuring system according to an embodiment.
- Fig. 4 is a diagram showing an example of the configuration of the biological information measuring system according to an embodiment. Note that Figs. 3 and 4 only show a part of the configuration of the biological information measuring system 1 that is necessary for the explanation, and explanations of points similar to those described above will be omitted as appropriate.
- the vital information measuring system 1 has a toilet seat device 2 having components such as a first detector 21, a second detector 22, and a control device 100, a display device 300, and a server device 400.
- the vital information measuring system 1 may include multiple toilet seat devices 2, multiple display devices 300, and multiple server devices 400.
- the toilet seat device 2 is a device arranged in the toilet room R.
- the toilet seat device 2 communicates with other devices such as the display device 300 and the server device 400.
- the toilet seat device 2 may perform a process (personal identification) to acquire information for identifying a user who uses the toilet bowl 7 in the toilet room R to perform excretion.
- the toilet seat device 2 collects information on each of a plurality of users, such as a family, by personal identification. For example, the toilet seat device 2 acquires information for identifying a user who uses the toilet bowl 7 to perform excretion by communicating with the display device 300 owned by the user or by the user's operation of the operation device 30, and performs personal identification of the user.
- the toilet seat device 2 communicates with the display device 300 owned by the user and receives a user ID (also simply referred to as "ID"), which is user identification information for identifying the user, from the display device 300.
- ID also simply referred to as "ID"
- the toilet seat device 2 may identify a user by any method as long as it is possible to identify a user who uses the toilet bowl 7 in the toilet room R.
- the first detection unit 21 has a light receiving unit 50 and detects stool.
- the second detection unit 22 has a gas sensor 40 and detects defecation gas.
- the control device 100 is a computer (information processing device) that executes a process (also called an “estimation process") to estimate information about the user's health based on the detection results of the first detection unit 21 and the second detection unit 22, and controls the output of the results of the estimation process to the outside.
- the control device 100 estimates the provided information or score (hereinafter also called the "intestine score”) about the user's health through the estimation process, which will be described later.
- the control device 100 also communicates with devices that display information to users, such as the display device 300, using short-range wireless communication functions such as Bluetooth (registered trademark), BLE (Bluetooth Low Energy), and infrared.
- the control device 100 may be able to communicate with the display device 300 without going through the network N.
- the control device 100 may be connected to devices such as the display device 300 in any manner as long as it is possible to send and receive information, and may be connected to enable communication via a specified network (such as network N) such as the Internet, either wired or wirelessly.
- FIG. 4 shows a case where the toilet seat device 2 has the first detection unit 21, the second detection unit 22, and the control device 100
- the control device 100 may be provided separately from the first detection unit 21 and the second detection unit 22, and may control the first detection unit 21 and the second detection unit 22 by communicating wirelessly or wired with the first detection unit 21 and the second detection unit 22, and acquire each piece of information.
- the control device 100 may also be a device located outside the toilet room R.
- the control device 100 may be communicably connected to devices located inside the toilet room R, such as the toilet seat device 2, the first detection unit 21, the second detection unit 22, etc., via a predetermined network (e.g., network N) such as the Internet, either wired or wirelessly, and may be capable of acquiring desired information.
- a predetermined network e.g., network N
- the Internet either wired or wirelessly
- the first detection unit 21 and the second detection unit 22 may be controlled by a control means other than the control unit 100.
- the control unit 100 is a first control unit that executes various information processing such as estimation processing
- the bioinformation measurement system 1 may have a second control unit that is a device separate from the control unit 100 as a device that controls the first detection unit 21 and the second detection unit 22.
- the bioinformation measurement system 1 may have the control unit 100, which is a first control unit that executes various information processing such as estimation processing using information from the first detection unit 21 and the second detection unit 22, and a detection unit control unit that is a second control unit that controls the first detection unit 21 and the second detection unit 22.
- the first control device and the second control device are connected to each other via a predetermined network (e.g., network N) such as the Internet so that they can communicate with each other via a wired or wireless connection, and the first control device may execute an estimation process using the detection result of the first detection unit 21 and the detection result information of the second detection unit 22 received from the second control device.
- the first control device may be a mobile terminal (device) such as a smartphone or laptop computer that can be carried by an administrator of the bioinformation measurement system 1, etc.
- the display device 300 is a display device (computer) that displays information to be provided to a user.
- the display device 300 may be a user terminal (mobile terminal) owned by the user.
- the display device 300 is realized by, for example, a smartphone, a mobile phone, a PDA (Personal Digital Assistant), a tablet terminal, or a notebook PC (Personal Computer).
- the display device 300 is connected to devices included in the biometric information measurement system 1, such as the control device 100, via a predetermined network (such as network N) in a wired or wireless manner so as to be able to communicate with them.
- a predetermined network such as network N
- the display device 300 transmits and receives information to and from the control device 100.
- the display device 300 receives information to be provided to the user from the control device 100.
- the display device 300 receives information related to the user's health estimated by the estimation process of the control device 100.
- the display device 300 receives provided information or a score (intestinal score) related to the user's health as information related to the user's health.
- the display device 300 displays the information related to the user's health received from the control device 100. Examples of information displayed by the display device 300 will be described later.
- the server device 400 is a computer such as a cloud server.
- the server device 400 is connected to devices such as the display device 300 via a predetermined network (e.g., network N) such as the Internet in a wired or wireless manner so as to be able to communicate with them.
- a predetermined network e.g., network N
- the server device 400 may be connected to devices such as the display device 300 in any manner as long as it is possible to send and receive information, and may be connected to devices such as the display device 300 in a wired or wireless manner so as to be able to communicate with them.
- the server device 400 may also be connected to the control device 100 etc. in a communicative manner, receive raw data from measurements, process the data, and send the results to the display device 300.
- the server device 400 stores the information collected from the display device 300 in the storage unit.
- the server device 400 collects information about the health of each user for each user and stores the information in the storage unit.
- the server device 400 stores the health information of each user in the storage unit in association with information that identifies the user (such as an ID).
- the biological information measuring system 1 does not have to have at least one of the first detection unit that detects stool and the second detection unit that detects defecation gas.
- the control device 100 receives information from a detection unit that is not included in the biological information measuring system 1, and performs various information processing such as estimation processing using the received information.
- the biological information measuring system 1 does not have to have at least one of the measuring device 4 and the first detection unit 21.
- the control device 100 of the vital information measuring system 1 is communicatively connected to the measuring device 4 via wired or wireless communication, and receives information about the fecal gas detected by the second detection unit 22 from the measuring device 4.
- the control device 100 of the vital information measuring system 1 performs the estimation process using the information about the fecal gas received from the measuring device 4 that is not included in the vital information measuring system 1.
- the control device 100 of the bioinformation measuring system 1 is communicatively connected to the first detection unit 21 via wired or wireless communication and receives information about the stool detected by the first detection unit 21 from the first detection unit 21.
- the control device 100 of the bioinformation measuring system 1 performs the estimation process using information about the fecal gas received from the first detection unit 21 that is not included in the bioinformation measuring system 1.
- the control device 100 of the vital information measuring system 1 performs estimation processing using information related to defecation gas received from the measuring device 4 and information related to stool received from the first detection unit 21.
- the bioinformation measuring system 1 may only have a configuration for acquiring detected information and executing estimation processing using the acquired information.
- the bioinformation measuring system 1 may only have the control device 100, and the control device 100 may acquire (receive) desired information by communicating with other devices, execute various information processing such as estimation processing using the acquired information, and transmit the desired information to the other devices.
- the display device 300 does not have to be included in the bioinformation measuring system 1, or may be included in the bioinformation measuring system 1.
- the display device 300 may be included in the bioinformation measuring system 1.
- the operation device 30 has a function of displaying information related to the user's health.
- the device configuration and arrangement of the server device 400 in the vital information measuring system 1 can be in any form as long as it can communicate with devices such as the display device 300 and perform processing.
- the server device 400 when the server device 400 is configured on the cloud as shown in FIG. 3, it may be configured from multiple computers (servers).
- the server device 400 may be a portable terminal (device) such as a laptop computer that can be carried by an administrator of the vital information measuring system 1.
- the server device 400 may be placed in the toilet room R.
- Fig. 5 is a block diagram showing an example of the configuration of the toilet seat device according to the embodiment.
- the toilet seat device 2 includes a human sensor 32, a seating sensor 33, an illuminance sensor 34, a control device 100, a nozzle motor 61, and a cleaning nozzle 6.
- the configuration of the toilet seat device 2 shown in FIG. 5 is merely an example, and when each component is provided separately, the toilet seat device 2 may have only the toilet seat 5.
- the configuration of the toilet seat device 2 shown in FIG. 5 is merely an example, and the toilet seat device 2 may have any configuration.
- the human presence sensor 32, seating sensor 33, illuminance sensor 34, etc. may be disposed at any location as long as the desired sensing is possible.
- the toilet seat device 2 only needs to be capable of detecting a user sitting on the toilet seat 5, and may have at least one of the human presence sensor 32, seating sensor 33, and illuminance sensor 34.
- the toilet seat device 2 transmits and receives information to and from information processing devices such as the display device 300 and the server device 400 via a predetermined network (such as the Internet) in a wired or wireless manner using a communication device (such as the communication unit 110 of the control device 100 in FIG. 6).
- a predetermined network such as the Internet
- a communication device such as the communication unit 110 of the control device 100 in FIG. 6
- the human presence sensor 32 has a function of detecting a human body.
- the human presence sensor 32 is used as a seating detection means for detecting a user sitting on the toilet seat 5.
- the human presence sensor 32 is realized by a pyroelectric sensor using an infrared signal.
- the human presence sensor 32 may be realized by a ⁇ (micro) wave sensor.
- the human presence sensor 32 is an infrared light emitting/receiving distance sensor, and may detect a human body present near the toilet seat 5 just before the person (user) sits on the toilet seat 5, or a user sitting on the toilet seat 5.
- the human presence sensor 32 also functions as a seat leaving detection sensor that detects when a user leaves the toilet seat 5.
- the human presence sensor 32 detects whether the user is seated on the toilet seat 5.
- the human presence sensor 32 outputs a detection signal to the control device 100. Note that the above is just one example, and the human presence sensor 32 may detect a human body by various means other than the above. For example, the human presence sensor 32 detects a person (such as a user) approaching the toilet seat 5.
- the seating sensor 33 has a function of detecting a person sitting on the toilet seat device 2.
- the seating sensor 33 is used as a seating detection means for detecting a user sitting on the toilet seat 5.
- the seating sensor 33 is realized by a load sensor or the like.
- the seating sensor 33 detects that a user is sitting on the toilet seat 5.
- the seating sensor 33 is capable of detecting a user sitting on the toilet seat 5.
- the seating sensor 33 also functions as a seating detection sensor that detects when a user leaves the toilet seat 5.
- the seating sensor 33 detects whether the user is seated on the toilet seat 5. Note that the above is just one example, and the seating sensor 33 is not limited to the above, and may detect whether a person is seated on the toilet seat device 2 by various means.
- the seating sensor 33 outputs a seating detection signal to the control device 100.
- the illuminance sensor 34 is a sensor that detects illuminance.
- the illuminance sensor 34 is used as a seating detection means that detects when a user sits on the toilet seat 5.
- the illuminance sensor 34 is disposed in a position facing the bowl portion 8, and detects the illuminance inside the bowl portion 8.
- the illuminance sensor 34 also functions as a seat-leaving detection sensor that detects when a user leaves the toilet seat 5.
- the illuminance sensor 34 detects whether the user is seated on the toilet seat 5. Note that the above is merely one example, and the illuminance sensor 34 may be placed in any position as long as it is possible to detect when a user is sitting on the toilet seat 5 based on the illuminance.
- the control device 100 controls various configurations and processes.
- the control device 100 is a computer (information processing device) that executes various information processes related to the detection (measurement) of stool and gas, etc.
- the control device 100 may be any device that has the configuration required for control, and may be, for example, a microcomputer.
- the control device 100 controls various components for detecting (measuring) stool.
- the control device 100 controls the first detection unit 21.
- the control device 100 transmits control information to the first detection unit 21 for controlling the electronic shutter function of the light receiving unit 50.
- the shutter function of the light receiving unit 50 is not limited to an electronic shutter, and any method such as a mechanical shutter can be used as long as the desired detection is possible.
- the control device 100 may transmit control information to the first detection unit 21 for controlling the turning on and off of the light emitting unit.
- the control device 100 causes the first detection unit 21 to emit light and receive light.
- the control device 100 controls the first detection unit 21 to cause the light-emitting unit to emit light and the light-receiving unit 50 to receive light.
- the control device 100 causes the first detection unit 21 to emit light and receive light during the period when the seating sensor 33 detects that a user is sitting on the toilet seat 5.
- the control device 100 controls various components for detecting (measuring) gas.
- the control device 100 controls the second detection unit 22.
- the control device 100 transmits control information to the second detection unit 22 via a wired connection.
- the control device 100 may transmit control information to the second detection unit 22 wirelessly.
- the control device 100 when configured as a separate device from the toilet seat device 2, it may transmit control information for the second detection unit 22 to the toilet seat device 2 wirelessly. In this case, the control device of the toilet seat device 2 may control the second detection unit 22 based on the control information received.
- control device 100 may control the second detection unit 22 so that the measurement value from the gas sensor 40 falls within a predetermined range when the user is not using the toilet 7, and may execute reference value control to control the measurement value used as a reference value (baseline) to a predetermined value.
- the control device 100 may execute reference value control to control the reference value to a predetermined value by changing the resistance value of the resistive element of the gas sensor 40.
- the control device 100 may also control the suction device 10.
- the control device 100 controls the start and stop of suction by the suction device 10.
- the control device 100 transmits control information to the suction device 10 via a wired connection.
- the control device 100 may also transmit control information to the suction device 10 wirelessly.
- the control device 100 when the control device 100 is configured as a separate device from the toilet seat device 2, it may transmit control information for the suction device 10 to the toilet seat device 2 wirelessly. In this case, the control device of the toilet seat device 2 may control the suction device 10 based on the control information received.
- the control device 100 may also control various components of the bioinformation measurement system 1 other than those described above.
- the control device 100 controls the nozzle motor 61, etc.
- the control device 100 controls the nozzle motor 61, etc. based on a signal transmitted from the operation device 30.
- the control device 100 controls the nozzle motor 61 based on a control instruction signal related to local cleaning sent from the operating device 30.
- the control device 100 controls the nozzle motor 61 to move the cleaning nozzle 6 forward and backward.
- the control device 100 may control various mechanisms other than the nozzle motor 61.
- the control device 100 controls the opening and closing of an electromagnetic valve that functions as a valve that controls the flow of a fluid by an electromagnetic method.
- the control device 100 controls the electromagnetic valve to switch on and off the supply of tap water from a water supply pipe, for example.
- the control device 100 transmits control information to the nozzle motor 61 etc. via a wired connection.
- the control device 100 may also transmit control information to the nozzle motor 61 etc. wirelessly.
- the control device 100 when configured as a separate device from the toilet seat device 2, it may transmit control information for the nozzle motor 61 etc. to the toilet seat device 2 wirelessly.
- the control device of the toilet seat device 2 may control the nozzle motor 61 etc. based on the control information received.
- the nozzle motor 61 is a drive source (motor) that drives the cleaning nozzle 6 to move forward and backward.
- the nozzle motor 61 controls the cleaning nozzle 6 to move forward and backward relative to the main body 3.
- the nozzle motor 61 controls the cleaning nozzle 6 to move forward and backward in response to instructions from the control device 100.
- the control device 100 may also control the toilet lid 9 and toilet seat 5 as shown in FIG. 1.
- the control device 100 controls the toilet lid 9 and toilet seat 5 based on a signal transmitted from the operation device 30.
- the control device 100 controls the toilet lid 9 based on a control instruction signal transmitted from the operation device 30 regarding the opening and closing of the toilet lid.
- the control device 100 controls the toilet seat 5 based on a control instruction signal transmitted from the operation device 30 regarding the opening and closing of the seat.
- the control device 100 transmits control information to the toilet lid 9 and toilet seat 5 via a wired connection.
- the control device 100 may also transmit control information to the toilet lid 9 and toilet seat 5 wirelessly.
- the control device 100 determines whether or not a user is seated by seat detection means such as the human sensor 32, seat sensor 33, and illuminance sensor 34. For example, the control device 100 determines whether or not a user is seated by detection by the seat sensor 33.
- the toilet seat device 2 includes the control device 100
- the control device 100, the human sensor 32, the seat sensor 33, the illuminance sensor 34, and the like may be configured as separate devices from the toilet seat device 2.
- the control device 100 may be configured as a separate device from the toilet seat device 2.
- the control device 100 may be a server device and may be located at a position away from the toilet seat device 2. In this case, the control device 100 communicates with each device, such as the toilet seat device 2, the human sensor 32, the seat sensor 33, and the illuminance sensor 34, and receives various information from each device.
- the toilet seat device 2 may have a configuration (such as a control circuit) for controlling various components of the toilet seat device 2, such as the nozzle motor 61.
- a configuration such as a control circuit
- the bioinformation measurement system 1 can adopt any device configuration as long as it is capable of performing the desired processing.
- Fig. 6 is a block diagram showing an example of the configuration of the control device according to the embodiment.
- the control device 100 has a communication unit 110, a storage unit 120, and a control unit 130.
- the configuration of the control device 100 is not limited to the configuration shown in Fig. 6, and may be other configurations as long as the desired processing can be realized.
- the control device 100 does not need to have the communication unit 110.
- the communication unit 110 is realized, for example, by a communication circuit or the like.
- the communication unit 110 is connected to a specified network by wire or wirelessly, and transmits and receives information to and from an external information processing device.
- the communication unit 110 is connected to a specified network by wire or wirelessly, and transmits and receives information to and from other devices such as the operation device 30.
- the communication unit 110 may be configured as a separate device (communication device) from the control device 100, and may be included in the toilet seat device 2.
- the storage unit 120 is realized, for example, by a semiconductor memory element such as a random access memory (RAM) or a flash memory, or a storage device such as a hard disk or an optical disk.
- the storage unit 120 is a computer-readable recording medium that non-temporarily records data used by various information processing programs, etc.
- the storage unit 120 stores various information necessary for processing.
- the storage unit 120 stores various information acquired from other devices such as various sensors.
- the storage unit 120 stores various information used in various information processing.
- the storage unit 120 stores information related to reference value control such as target values.
- the memory unit 120 stores various information used in the estimation process related to stool, such as the properties of the stool.
- the memory unit 120 stores a threshold value used in the estimation process related to stool.
- the memory unit 120 stores various models (also called “estimation models") used in estimation related to the properties of stool.
- the memory unit 120 stores various estimation models used to estimate the shape, color, amount, etc. of stool. Note that the above is merely an example, and the memory unit 120 stores various information related to the detection of stool.
- the memory unit 120 stores various information used in gas-related estimation processing, such as the amount or concentration of gas.
- the memory unit 120 stores a threshold value used in gas-related estimation processing.
- the memory unit 120 stores various functions (also called “gas estimation functions") used to estimate (calculate) the amount or concentration of gas.
- the memory unit 120 stores various gas estimation functions used to estimate the amount or concentration of gas of a specified component.
- the memory unit 120 stores a function (also called "evaluation estimation function”) that calculates (estimates) an evaluation of defecation gas from the amount or concentration of gas of a specified component. Note that the above is merely an example, and the memory unit 120 stores various information related to gas detection.
- the control unit 130 is realized, for example, by an MPU (Micro Processing Unit) or a CPU (Central Processing Unit) executing programs (e.g., various information processing programs related to the present disclosure) stored inside the control device 100 using a RAM or the like as a working area.
- the control unit 130 may also be realized, for example, by an integrated circuit such as an ASIC (Application Specific Integrated Circuit) or an FPGA (Field Programmable Gate Array).
- control unit 130 has an acquisition unit 131, a processing unit 132, and an output unit 133, and realizes or executes the information processing functions and actions described below.
- the internal configuration of the control unit 130 is not limited to the configuration shown in FIG. 6, and may be other configurations as long as they perform the information processing described below.
- the acquisition unit 131 acquires various information.
- the acquisition unit 131 acquires various information from the storage unit 120.
- the acquisition unit 131 receives information from other devices.
- the acquisition unit 131 receives information (detection information, etc.) detected by various sensors from the various sensors.
- the acquisition unit 131 acquires information (detection information, etc.) detected by the seating detection means from the seating detection means.
- the acquisition unit 131 receives information (detection information, etc.) detected by at least one of the human sensor 32, the seating sensor 33, and the illuminance sensor 34 from that sensor.
- the acquisition unit 131 acquires the detection results by the first detection unit 21 that detects stool.
- the acquisition unit 131 acquires the detection results by the first detection unit 21 that detects information related to intestinal peristalsis.
- the acquisition unit 131 acquires the detection results by the second detection unit 22 that detects defecation gas.
- the acquisition unit 131 acquires the detection results by the second detection unit 22 that detects information related to the intestinal environment.
- the acquisition unit 131 receives information based on the detection by the first detection unit 21 from the first detection unit 21.
- the acquisition unit 131 receives information indicating the detection result related to stool detected by the first detection unit 21.
- the acquisition unit 131 also receives information based on the detection by the second detection unit 22 from the second detection unit 22.
- the acquisition unit 131 receives information indicating the detection result related to defecation gas detected by the second detection unit 22.
- the processing unit 132 performs various types of processing.
- the processing unit 132 performs various types of processing using the information stored in the storage unit 120.
- the processing unit 132 performs estimation processing.
- the processing unit 132 performs estimation processing using the various types of information stored in the storage unit 120.
- the processing unit 132 executes an estimation process to estimate at least one of the provided information or the score related to the user's health based on the detection result of the first detection unit 21 and the detection result of the second detection unit 22.
- the processing unit 132 executes control to output the result of the estimation process to the outside.
- the processing unit 132 executes control to output the result of the estimation process to the output unit 133 by instructing the output unit 133.
- the processing unit 132 estimates first biological information based on the properties of the stool from the detection result of the first detection unit 21.
- the processing unit 132 estimates second biological information based on the amount or concentration of fecal gas from the detection result of the second detection unit 22.
- the processing unit 132 executes control to output the first biological information and the second biological information.
- the processing unit 132 performs the estimation process using a larger number of samples of the detection results from the second detection unit 22 than the number of samples of the detection results from the first detection unit 21.
- the processing unit 132 estimates the first biometric information using the detection results from the first detection unit 21, which are data obtained from a single toilet use.
- the processing unit 132 estimates the second biometric information using the detection results from the second detection unit 22, which are data obtained from multiple toilet uses.
- the processing unit 132 estimates a higher score for each classification of stool properties based on the detection results of the first detection unit 21, as the first evaluation corresponding to that classification is higher.
- the processing unit 132 estimates a higher score for each classification of stool properties based on the detection results of the second detection unit 22, as the second evaluation corresponding to that classification is higher.
- the processing unit 132 performs estimation processing using the information detected by the first detection unit 21.
- the processing unit 132 performs estimation processing using the image captured by the first detection unit 21.
- the processing unit 132 estimates (determines) whether feces is included in the image captured by the first detection unit 21.
- the processing unit 132 estimates whether feces is included in the image using image recognition technology.
- the processing unit 132 estimates whether or not feces is included in an image using a model (feces estimation model) that takes an image as input and outputs information (score) indicating whether or not feces is included in the input image.
- a model feces estimation model
- the processing unit 132 compares the score output by the feces estimation model to which the image is input with a threshold (first threshold), and if the score is equal to or greater than the first threshold, estimates that the image contains feces.
- the processing unit 132 also compares the score output by the feces estimation model to which the image is input with the first threshold, and if the score is less than the first threshold, estimates that the image does not contain feces.
- the processing unit 132 may estimate whether or not feces is included in an image by appropriately using various information.
- the processing unit 132 estimates (classifies) the properties of the stool from the detection result by the first detection unit 21.
- the processing unit 132 estimates the classification of the properties of the stool as the first biological information.
- the processing unit 132 classifies the properties of the stool corresponding to an image (also called a "stool image") containing stool captured by the first detection unit 21, based on the image.
- the processing unit 132 uses the stool image to classify the shape (also simply called "shape") of the stool corresponding to the stool image.
- the processing unit 132 uses the stool image to classify the shape of the stool corresponding to the stool image into multiple types (7 levels) based on the Bristol scale. In this case, the processing unit 132 classifies the stool into a banana shape (normal stool), which is the middle paragraph (i.e., the fourth level) of the 7 levels, corresponding to the best condition, and the further away from that, the worse the condition.
- the processing unit 132 uses a stool image to classify whether the shape of the stool corresponding to the stool image is one of multiple levels based on shape. For example, the processing unit 132 uses a stool image to classify whether the shape of the stool corresponding to the stool image is one of the following: round, hard, cracked, banana-shaped, soft (semi-paste-like), muddy, and watery. For example, the processing unit 132 may classify (determine) the shape of the stool based on various information (feature quantities) such as the length of the stool image in the falling direction and the number of stool pieces (lumps).
- feature quantities such as the length of the stool image in the falling direction and the number of stool pieces (lumps).
- the processing unit 132 may classify the shape of the stool using AI (artificial intelligence) technology.
- the processing unit 132 may classify the shape of the stool using a learning model (shape estimation model) generated by machine learning.
- the shape estimation model is trained in advance using teacher data that indicates the classification judgment.
- This teacher data includes multiple combinations of stool images and labels (correct answer information) that indicate the shape of the lump (stool) contained in the stool image (either round, hard, cracked, banana-shaped, soft, muddy, or watery).
- the shape estimation model is a model that receives a stool image as input and outputs information that indicates the shape of the lump (stool) contained in the input stool image.
- the shape estimation model is trained to output information on the label (stool shape) corresponding to the input stool image when a stool image is input.
- the shape estimation model is trained using various methods related to so-called supervised learning as appropriate.
- the shape estimation model is stored in the memory unit 120, and the processing unit 132 may classify the shape of the stool using the shape estimation model stored in the memory unit 120.
- the control device 100 may perform a learning process to generate various estimation models, or the control device 100 may obtain various estimation models from an external device such as the server device 400.
- the above is only an example, and the processing unit 132 may classify the shape of the stool using various information as appropriate.
- the above seven levels of rolling, hard, cracked, banana-shaped, soft, muddy, and watery are only examples of shapes, and the processing unit 132 may classify shapes other than these, or may classify into six levels or less.
- an example of classifying the shape of the stool into one of multiple levels has been shown here, but this is not limited to the above, and if multiple stool shapes are included in one excretion act, multiple stool shapes may be classified.
- the processing unit 132 may estimate various information other than the shape of the stool. For example, the processing unit 132 may estimate (classify) the amount of stool based on the image captured by the first detection unit 21. For example, the processing unit 132 classifies the amount of stool based on the proportion of stool in the image. For example, the processing unit 132 may classify the amount of stool using a score output by a stool estimation model. If the score output by the stool estimation model to which an image is input is equal to or greater than a first threshold and less than a second threshold, the processing unit 132 may classify the amount of stool as "very small.” The second threshold is assumed to be a value greater than the first threshold.
- the processing unit 132 may classify the amount of stool as "small” if the score output by the stool estimation model to which an image is input is equal to or greater than a second threshold and less than a third threshold.
- the third threshold is assumed to be a value greater than the second threshold.
- the processing unit 132 may classify the amount of stool as "medium” if the score output by the stool estimation model to which an image is input is equal to or greater than a third threshold and less than a fourth threshold.
- the fourth threshold is assumed to be a value greater than the third threshold.
- the processing unit 132 may classify the amount of stool as "large” if the score output by the stool estimation model to which an image is input is equal to or greater than a fourth threshold and less than a fifth threshold.
- the fifth threshold is assumed to be a value greater than the fourth threshold.
- the processing unit 132 may classify the amount of stool as "very large” if the score output by the stool estimation model to which an image is input is equal to or greater than a fifth threshold.
- the above five-level classification is merely an example, and the processing unit 132 may classify the amount of stool using various information as appropriate. For example, the processing unit 132 may perform three-level classification using four thresholds.
- the processing unit 132 may use a stool image to estimate (classify) the color of the stool corresponding to the stool image.
- the processing unit 132 uses the stool image to classify whether the color of the stool corresponding to the stool image is one of multiple color-based levels.
- the processing unit 132 uses the stool image to classify whether the color of the stool corresponding to the stool image is one of yellow, light ochre, ochre, brown, dark brown, and dark dark brown.
- the processing unit 132 classifies the color of the stool based on the detection result by the first detection unit 21.
- the processing unit 132 appropriately uses various techniques for classifying stool colors to classify the color of the stool as either yellow, light ochre, ochre, brown, dark brown, or dark brown.
- the processing unit 132 classifies (determines) the color of the stool based on various information (feature values) such as the brightness and luminosity of a color image (RGB).
- the processing unit 132 may classify the color of the stool using a learning model (color estimation model) generated by machine learning.
- the processing unit 132 estimates an evaluation of peristaltic movement (also called the "first evaluation") using the stool properties based on the detection by the first detection unit 21.
- first evaluation also called the “first evaluation”
- the processing unit 132 estimates the first evaluation highest when the stool properties are banana-shaped (normal stool), which is the middle stage (i.e., stage 4) of the seven-stage scale. The processing unit 132 also estimates the first evaluation lower as the stool properties move away from the middle stage of the seven-stage scale. The processing unit 132 estimates the first evaluation low when the stool properties are hard (hard stool), which is the lowest stage (i.e., stage 1) of the seven-stage scale. The processing unit 132 also estimates the first evaluation low when the stool properties are watery (watery stool), which is the highest stage (i.e., stage 7) of the seven-stage scale.
- the processing unit 132 may estimate the first evaluation in any manner.
- the center corresponds to the best condition, and the extreme stages correspond to the worst, but depending on the manner of classification, the lowest stage (classification) may correspond to the worst condition, and the higher stages (classifications) may correspond to better conditions, with the highest stage (classification) corresponding to the worst condition.
- the processing unit 132 may estimate the first evaluation to be the lowest when the stool properties are in the lowest stage (classification), and may estimate the first evaluation to be the highest when the stool properties are in the highest stage (classification). In this way, the processing unit 132 estimates the first evaluation in a manner that corresponds to the manner of classification of the stool properties.
- the processing unit 132 also performs estimation processing using the information detected by the second detection unit 22.
- the processing unit 132 performs estimation processing using the information on the gas detected by the second detection unit 22.
- the processing unit 132 performs calculation processing.
- the processing unit 132 performs calculation processing using various information stored in the storage unit 120.
- the processing unit 132 performs calculation processing using various information acquired by the acquisition unit 131.
- the processing unit 132 calculates various pieces of information related to the gas.
- the processing unit 132 calculates values based on the measured values measured by the second detection unit 22.
- the processing unit 132 calculates the resistance value of the sensor element based on the voltage value measured by the gas sensor 40. For example, the processing unit 132 calculates the resistance value of the sensor element from the measured voltage value using a function that indicates the relationship between the voltage value and the resistance value of the sensor element.
- the processing unit 132 calculates the resistance value of the sensor element using formula (1).
- the processing unit 132 calculates the amount or concentration of gas based on the calculated resistance value of the sensor element.
- the processing unit 132 estimates (calculates) the amount or concentration of gas from the calculated resistance value using a function (gas estimation function) that indicates the relationship between the resistance value and the amount or concentration of gas.
- the processing unit 132 may calculate the amount or concentration of gas associated with the intestinal environment from the amount of change from a baseline of the sensor data detected by the second detection unit 22 (e.g., the voltage value before measuring the defecation gas).
- the processing unit 132 may convert the amount or concentration of gas into a unique score (e.g., an intestinal environment score) and generate information that indicates the change over time.
- a unique score e.g., an intestinal environment score
- the processing unit 132 estimates an evaluation of the intestinal environment (also referred to as a "second evaluation") using the amount or concentration of gas based on detection by the second detection unit 22. For example, the processing unit 132 estimates the second evaluation based on the amount or concentration of defecation gas as second biological information. For example, the processing unit 132 estimates the second biological information using an evaluation estimation function that takes the amount or concentration of gas based on detection by the second detection unit 22 as input and outputs an evaluation of defecation gas (second evaluation).
- the processing unit 132 can detect a gas (also called a "healthy gas") whose amount or concentration indicates that the intestinal environment is more likely to be good, the processing unit 132 estimates the second evaluation using the amount or concentration of the healthy gas. For example, the processing unit 132 estimates a higher second evaluation the greater the amount or concentration of the healthy gas. The processing unit 132 estimates (calculates) the second evaluation using a gas estimation function that increases the value of the second evaluation the greater the amount or concentration of the healthy gas.
- a gas also called a "healthy gas”
- the processing unit 132 When the processing unit 132 can detect a gas (also called an "odorous gas") whose amount or concentration indicates a high possibility of a poor intestinal environment, the processing unit 132 estimates the second evaluation using the amount or concentration of the odorous gas. For example, the processing unit 132 estimates a lower second evaluation the greater the amount or concentration of the odorous gas. The processing unit 132 estimates the second evaluation using a gas estimation function that reduces the value of the second evaluation the greater the amount or concentration of the odorous gas.
- a gas also called an "odorous gas”
- the processing unit 132 may estimate the second evaluation in any manner.
- the processing unit 132 may estimate the second evaluation based on the ratio between the amount or concentration of health gases and the amount or concentration of odorous gases in the user's defecation gas.
- the processing unit 132 estimates the second evaluation higher based on the calculated ratio, the more the health gases are in the user's defecation gas compared to the odorous gases.
- the control device 100 estimates the second evaluation lower based on the calculated ratio, the more the odorous gases are in the user's defecation gas compared to the health gases. Note that the above is merely an example, and the control device 100 may make any estimation based on the calculated score.
- the processing unit 132 controls the configuration for performing various detections. For example, the processing unit 132 controls the first detection unit 21. Also, for example, the processing unit 132 controls the second detection unit 22. The processing unit 132 controls the second detection unit 22 so that the measurement value by the gas sensor 40 falls within a predetermined range when the user is not using the toilet 7, and performs reference value control to control the measurement value used as the reference value to a predetermined value. The processing unit 132 performs reference value control to control the reference value to a predetermined value by changing the resistance value of the resistive element of the gas sensor 40. The processing unit 132 performs reference value control each time a defecation gas measurement is completed. The processing unit 132 performs reference value control by processing to feed back the measurement value of the gas sensor 40.
- the output unit 133 executes an output process that outputs various information.
- the output unit 133 functions as a transmission unit that transmits various information.
- the output unit 133 executes the output process by transmitting information to an external information processing device.
- the output unit 133 transmits information to an external information processing device.
- the output unit 133 transmits various information to the display device 300.
- the output unit 133 transmits various information to an administrator device such as a personal computer or smartphone used by the administrator.
- the output unit 133 may also execute the output process by transmitting information to the operation device 30 (or the display screen 31).
- the output unit 133 transmits information indicating the processing results by the processing unit 132.
- the output unit 133 transmits various information to the display device 300 that is used for display by the display device 300.
- the output unit 133 outputs the results of the estimation process to the outside.
- the output unit 133 transmits the results of the estimation process to the outside via the communication unit 110.
- the output unit 133 controls the display device 300 to output the results of the estimation process by transmitting the results of the estimation process to the display device 300.
- the output unit 133 transmits the results of the estimation process to the display device 300 and causes the display device 300 to display the results of the estimation process.
- Fig. 7 is a diagram showing an example of a process executed by the biological information measuring system according to the embodiment.
- the detection of stool by the first detection unit 21 and the detection of defecation gas by the second detection unit 22 will be described, followed by an overview of the estimation process based on that detection.
- the detection of stool by the first detection unit 21 and the detection of defecation gas by the second detection unit 22 are merely examples, and any detection mode can be adopted for the detection by the first detection unit 21 and the second detection unit 22 as long as the desired information can be detected.
- the first detection process MS1 in Fig. 7 is a diagram showing an example of a method of acquiring data.
- Objects OB1 and OB2 are schematic images of falling stool (excrement) to be detected (measured). Specifically, object OB1 shown by a solid line is a schematic representation of the position of the falling stool at a certain point in time (first point in time), and object OB2 shown by a dotted line is a schematic representation of the position of the falling stool at a point in time later than the first point in time (second point in time). That is, object OB1 and object OB2 in Figure 7 represent a single piece of falling stool at different times, and object OB2 corresponds to the stool at a later time than object OB1.
- object OB when objects OB1 and OB2 are described without distinction, they will be referred to as object OB.
- the first detection process MS1 in FIG. 7 shows a case where the first detection unit 21 has three light-emitting elements 51a, 51b, and 51c.
- each of the light-emitting elements 51a, 51b, and 51c is an LED (Light Emitting Diode) that emits light of a different wavelength.
- LED Light Emitting Diode
- the first detection process MS1 in FIG. 7 conceptually illustrates a process in which light from the light-emitting element 51 is irradiated onto the falling object OB, and a stool image (two-dimensional image) is acquired (generated) based on the result of light reception by the light-receiving unit 50.
- the dotted line extending from the light-emitting element 51 to the object OB typically illustrates the irradiation of light from the light-emitting element 51 to the object OB
- the dotted line extending from the object OB to the light-receiving unit 50 typically illustrates the reflected light from the object OB received by the light-receiving unit 50. That is, the first detection process MS1 in FIG.
- FIG. 7 typically illustrates a case in which data (one-dimensional image) of the bottom end of the object OB (the leading end in the falling direction) is detected in the detection of the object OB corresponding to the object OB1, and a case in which data (one-dimensional image) of the top end of the object OB (the rear end in the falling direction) is detected in the detection of the object OB corresponding to the object OB2.
- the first detection unit 21 In the first detection process MS1 in FIG. 7, the first detection unit 21 generates feces information (two-dimensional image) by arranging in chronological order the data (one-dimensional image) acquired over time for each wavelength emitted by each of the light-emitting elements 51a, 51b, and 51c. Note that various processes are possible for generating color images using light-emitting elements with different wavelengths and a line sensor, and a detailed description will be omitted, but an example of the process will be briefly described.
- the first detection unit 21 generates a two-dimensional image corresponding to the first light-emitting element (light-emitting element 51a) by arranging in chronological order the light reception data (one-dimensional image) obtained by emitting light from the light-emitting element 51a, which is a first light-emitting element that emits light of a first wavelength.
- the first detection unit 21 generates flight information (first two-dimensional image) corresponding to the first wavelength by arranging in chronological order the light reception data (one-dimensional image) obtained by emitting light of a first wavelength such as 590 nm.
- the first detection unit 21 also generates a two-dimensional image corresponding to the second light-emitting element (light-emitting element 51b) by arranging in chronological order the light reception data (one-dimensional image) obtained by emitting light from the second light-emitting element, light-emitting element 51b, which emits light of the second wavelength.
- the first detection unit 21 generates flight information (second two-dimensional image) corresponding to the second wavelength by arranging in chronological order the light reception data (one-dimensional image) obtained by emitting light of the second wavelength, such as 670 nm.
- the first detection unit 21 also generates a two-dimensional image corresponding to the third light-emitting element (light-emitting element 51c) by arranging in chronological order the light reception data (one-dimensional image) obtained by emitting light from the third light-emitting element, light-emitting element 51c, which emits light of the third wavelength.
- the first detection unit 21 generates flight information (third two-dimensional image) corresponding to the third wavelength by arranging in chronological order the light reception data (one-dimensional image) obtained by emitting light of the third wavelength, such as 870 nm.
- the first detection unit 21 can obtain a color image by generating two-dimensional images for each of the three wavelengths corresponding to the first light-emitting element, the second light-emitting element, and the third light-emitting element.
- the first detection unit 21 may generate a color image by combining the first two-dimensional image, the second two-dimensional image, and the third two-dimensional image described above.
- the light-receiving element of the light-receiving unit 50 such as a line sensor, may be a color light-receiving element, and light-emitting elements of multiple colors may be emitted simultaneously, and the color of the reflected light may be detected by the light-receiving unit to generate a color image.
- the first detection unit 21 may also be a camera that captures images and generates two-dimensional images.
- the first detection unit 21 may have an area sensor (two-dimensional image sensor) in which a CCD sensor or a CMOS sensor is arranged in a planar (two-dimensional) shape as the light receiving unit 50.
- the second detection process MS2 in Fig. 7 is a diagram showing an example of a method of acquiring data. Explanations of points similar to those described above will be omitted as appropriate.
- the second detection unit 22 has a gas sensor 40 that detects gas indicative of the intestinal environment of the user.
- the gas sensor 40 may be a gas sensor (also called an "odor gas sensor") that can detect gas (odor gas) derived from intestinal putrefaction and indicative of poor health.
- odor gas is gas generated by putrefaction caused by bad bacteria in the intestine.
- odor gas may be a gas that contains sulfur components in fecal gas. Examples of odor gas include ammonia, trimethylamine, hydrogen sulfide, methyl mercaptan, indole, and skatole.
- the second detection unit 22 may also have multiple gas sensors 40 including a gas sensor (also called a "health gas sensor") that can detect gases (health gases) derived from intestinal fermentation and indicating high health, in addition to odorous gases.
- a gas sensor also called a "health gas sensor”
- health gases are gases produced by fermentation by beneficial bacteria in the intestines.
- health gases may be gases derived from intestinal fermentation that increase in amount as the intestinal health level increases. Examples of health gases include hydrogen, carbon dioxide, acetic acid, methane, ethanol, water, etc.
- the second detection unit 22 may have multiple gas sensors 40.
- the second detection unit 22 may be a hydrogen gas sensor and may include multiple gas sensors 40 such as an odorous gas sensor and a methane gas sensor.
- the bioinformation measuring system may detect (estimate) the amount or concentration of odorous gas by removing the influence of the amount or concentration of gas (health-related gas) detected by the health-related gas possessed by the second detection unit 22 from the amount or concentration of odorous gas detected by the second detection unit 22.
- FIG. 8 is a diagram showing an example of the configuration of a gas sensor. Specifically, FIG. 8 is a diagram showing an example of the circuit configuration CR of a semiconductor gas sensor 40.
- the gas sensor 40 is an arrangement of a sensor element and a resistance element for measurement.
- the gas sensor 40 has a circuit configuration CR in which a sensor element (corresponding to the sensor resistor RS in FIG. 8) and a resistance element for measurement (corresponding to the resistance element RL in FIG. 8) are connected in series.
- Formula (1) corresponds to the circuit configuration CR shown in FIG. 8, and is the same formula as the function FC1 in FIG. 8.
- RS in formula (1) indicates the resistance value of the sensor element.
- “RS” in formula (1) indicates the resistance value of the sensor resistor RS, which is an example of a value calculated based on the measurement by the gas sensor 40.
- formula (1) is a formula for calculating the resistance value.
- RL indicates the resistance value of the resistive element RL.
- Vc indicates the voltage value of the circuit voltage Vc.
- Vout indicates the voltage value of the output voltage Vout at the resistive element.
- Vout indicates the voltage value of the resistive element RL, which is an example of a measured value measured by the gas sensor 40.
- the resistance value of the sensor resistor RS in formula (1) is an index related to the amount or concentration of defecation gas.
- the biological information measuring system 1 calculates an index (resistance value) related to the amount or concentration of defecation gas from a measured value (voltage value), and calculates the amount of gas from the calculated resistance value.
- resistance value index related to the amount or concentration of defecation gas from a measured value (voltage value
- VH corresponds to the heater voltage.
- the gas sensor in the present invention is not limited to a semiconductor sensor, and any sensor that satisfies the above formula (1) can be used as a substitute.
- the second detection unit 22 may have a gas sensor of any type, not limited to the above.
- the second detection unit 22 may have a gas sensor such as an infrared CO2 sensor (carbon dioxide concentration measuring device).
- the second detection unit 22 may have multiple types or multiple gas sensors of any type.
- the second detection unit 22 may have an electrochemical gas sensor in addition to an infrared CO2 sensor.
- the control device 100 estimates the classification of the stool properties as first biological information based on the detection of the stool by the first detection unit 21.
- the control device 100 estimates that the detected stool is banana-shaped, in the middle section of the seven stages corresponding to the Bristol scale.
- the first biological information DT1 is information regarding peristaltic movement (first information).
- control device 100 uses the estimated stool properties to estimate a first evaluation regarding peristaltic movement. Note that a processing example regarding this point will be described later with reference to FIG. 10 etc.
- the control device 100 estimates the amount or concentration of gas used to estimate the second evaluation based on the detection of defecation gas by the second detection unit 22.
- the control device 100 estimates the amount or concentration of gas X (e.g., an odorous gas) used to estimate the second evaluation from the calculated resistance value using a function (gas estimation function) that indicates the relationship between the resistance value and the amount or concentration of the gas X.
- gas estimation function gas estimation function
- the control device 100 estimates the second evaluation as second biological information using an evaluation estimation function that inputs the estimated amount or concentration of gas X and outputs a second evaluation.
- the control device 100 estimates a value (also called the "intestinal environment score") as indicated by a ⁇ in the time series data DT2 based on the defecation gas detection information as the second evaluation, based on the estimated amount or concentration of gas X.
- the time series data DT2 is time series data from one month ago (1M ago) to the day of processing, and is information on the intestinal environment (second evaluation). Note that the second evaluation may be calculated from multiple intestinal environment scores, but this will be described later.
- the control device 100 estimates at least one of the provided information or score related to the user's health based on the first evaluation and the second evaluation. Note that in FIG. 7, both the intestinal score information INF1 related to the intestinal score or intestinal rank, which is an example of a score related to the user's health, and the recommended information INF2, which is an example of the provided information, are illustrated, but the control device 100 may estimate either one of them. For example, in FIG. 8, since both the first evaluation and the second evaluation are good, the control device 100 estimates that the intestinal score or intestinal rank is high, as shown in the intestinal score information INF1. Note that in FIG.
- the control device 100 estimates, as the provided information, information indicating a deterioration of the intestinal environment, as shown in the recommendation information INF2.Furthermore, the control device 100 estimates, as the provided information, information indicating a recommended action to deal with the deterioration of the intestinal environment.
- the bioinformation measuring system 1 can estimate the health condition of the user's intestines based on information on both peristalsis and the intestinal environment, thereby appropriately estimating the health condition of the user.
- the bioinformation measuring system 1 can estimate the health condition of the user's intestines based on information on both the movement of the intestines themselves and the balance of intestinal bacteria living in the intestines.
- the bioinformation measuring system 1 estimates the properties of the stool based on detection by the line sensor, and estimates the intestinal environment based on detection by the gas sensor. For example, the bioinformation measuring system 1 senses the shape, amount, color, and bowel gas (farts, etc.) of the stool to visualize the state of the intestines from peristalsis and the intestinal environment, and by understanding the state of the intestines, can inform the user of the state of the intestines, which is linked to the state of the body and mind. In this way, the bioinformation measuring system 1 can estimate and inform the user of the daily state and changes of the intestines from the stool and bowel gas, and provide awareness of improvements to lifestyle behavior.
- the bioinformation measuring system 1 can estimate and inform the user of the daily state and changes of the intestines from the stool and bowel gas, and provide awareness of improvements to lifestyle behavior.
- the bioinformation measuring system 1 can estimate the state and changes of the user's entire intestines from the user's daily excretory behavior, and provide the user with information based on the estimation results. For example, with regard to peristalsis, the bioinformation measuring system 1 can display information on the estimated stool properties (color, shape, amount).
- the bioinformation measuring system 1 displays first bioinformation indicating the stool properties on the user's display device 300.
- the bioinformation measuring system 1 displays the first bioinformation DT1 on the user's display device 300.
- the bioinformation measuring system 1 displays information indicating the estimated stool properties, such as that shown in the first bioinformation DT1, on the user's display device 300.
- the bioinformation measuring system 1 can obtain the composition of fecal gas using a gas sensor and display changes over time. For example, the bioinformation measuring system 1 displays second bioinformation such as a second evaluation on the user's display device 300. In FIG. 7, the bioinformation measuring system 1 displays time-series data DT2 on the user's display device 300. For example, the bioinformation measuring system 1 displays information on an estimated intestinal environment score, as shown in the time-series data DT2, on the user's display device 300.
- the bioinformation measuring system 1 displays a score such as intestinal score information INF1 or provided information such as recommended information INF2 on the user's display device 300.
- a score such as intestinal score information INF1 or provided information such as recommended information INF2 on the user's display device 300.
- This allows the bioinformation measuring system 1 to display a combination of peristalsis and the intestinal environment. In this way, the bioinformation measuring system 1 can appropriately estimate and display information related to the user's health by estimating and displaying information related to the user's health from information on both stool properties and defecation gas.
- the provided information or score related to the health of the user shown in FIG. 7 is merely an example, and the biological information measuring system 1 may estimate the provided information or score by appropriately using various information. Some examples are described below. Note that the description of the same points as those described with reference to FIG.
- the bioinformation measurement system 1 may execute the estimation process by increasing the number of samples used to estimate the second evaluation compared to the number of samples used to estimate the first evaluation.
- the bioinformation measurement system 1 may use data obtained from multiple toilet use to estimate the second evaluation.
- the data used to estimate the first evaluation may be data obtained from one toilet use
- the data used to estimate the second evaluation may be data obtained from multiple toilet use.
- the number of toilet uses referred to here may be the number of uses of the toilet room R, with one use being from when the user enters the toilet room R to when he or she leaves the room.
- the average or representative value may be used as the information of that one toilet use.
- the bioinformation measurement system 1 may use the average of the amount or concentration of gas detected twice as the amount or concentration of gas in one toilet use. Any information can be used as the number of times the toilet is used, and may be, for example, the number of times the user has had a bowel movement.
- the bioinformation measuring system 1 estimates the second evaluation based on multiple data, as shown in FIG. 9.
- FIG. 9 is a diagram showing an example of a second evaluation based on multiple data.
- the points PT shown with white circles in the time series data DT21 in FIG. 9 indicate the intestinal environment scores corresponding to each toilet use, and the calculated value CV shown with black circles indicates the second evaluation calculated using information on multiple points PT.
- the bioinformation measuring system 1 estimates the calculated value CV, which is information calculated using multiple data such as a moving average, as the second evaluation, as shown in the time series data DT21.
- the curve in the time series data DT21 in FIG. 9 indicates the time series change in the second evaluation calculated using multiple data such as a moving average.
- the biological information measuring system 1 estimates the second evaluation regarding the intestinal environment based on multiple detection results, making it possible to appropriately estimate the second evaluation regarding the intestinal environment.
- FIG. 10 is a diagram showing an example of the estimation of the first evaluation according to the embodiment.
- the bioinformation measurement system 1 estimates that the middle (median) paragraph of the stool properties is the best among the seven stages, and estimates the first evaluation so that the further away from the center, the lower the evaluation. In this case, the bioinformation measurement system 1 estimates that the closer the estimation result based on the stool properties is to the median, the better the first evaluation.
- the bioinformation measurement system 1 estimates (determines) that the stool properties are the better the middle. For example, when the stool properties are banana, which is the middle paragraph among the seven stages, the control device 100 estimates the first evaluation to be the highest.
- the control device 100 may estimate that the first evaluation is 100 points when the stool properties are banana.
- the first evaluation is 7 ranks (stages) from S to A to F, with S being the best evaluation and the evaluations getting worse from A to F, the control device 100 may estimate that the first evaluation is S when the stool properties are banana-like.
- the classification and evaluation based on the Bristol scale are only one example, and any classification such as "hard”, “ideal”, and “soft” can be used, and any resolution (number of classifications) and notation can be used.
- FIG. 11 is a diagram showing an example of the estimation of the second evaluation according to the embodiment.
- the bioinformation measuring system 1 estimates the second evaluation higher the larger the value estimated based on the defecation gas, such as the intestinal environment score. In this case, the bioinformation measuring system 1 estimates that the second evaluation is better the larger the value indicated by the estimation result based on the defecation gas. In this way, the bioinformation measuring system 1 estimates (determines) that the higher the score of the information based on the defecation gas (odor information), the better.
- the biological information measurement system 1 outputs information according to the result of the estimation process. For example, when the information (evaluation, etc.) on the properties of the user's excrement (feces) is poor, the biological information measurement system 1 may provide the user with advice on stress and sleep. For example, the biological information measurement system 1 may generate information to be provided including content such as "Your peristalsis is getting worse. Please get a good night's sleep" and provide the generated information to the user.
- the bioinformation measuring system 1 may provide the user with advice regarding diet. For example, the bioinformation measuring system 1 may generate provision information including content such as "Your intestinal environment is deteriorating. Eat yogurt," and provide the generated provision information to the user.
- the bioinformation measuring system 1 when the bioinformation measuring system 1 acquires information about a user as shown in FIG. 12, such as time series data DT12 of stool properties and time series data DT22 of intestinal environment score, it generates provided information INF22 based on the time series data DT12 and the time series data DT22. Then, the bioinformation measuring system 1 displays the generated provided information INF22 on the display device 300 of the target user.
- FIG. 12 is a diagram showing an example of estimation of provided information according to an embodiment.
- the time series data DT12 and the time series data DT22 are time series data from one month ago (1M ago) to the day of processing.
- the bioinformation measurement system 1 As shown in the time series data DT12 and the time series data DT22, the intestinal environment score is decreasing, so the bioinformation measurement system 1 generates provided information INF22 including content such as "Your intestinal environment is deteriorating. Take healthy actions," and provides the generated provided information INF22 to the user. In this way, the bioinformation measurement system 1 compares two pieces of information on changes over time, information on changes over time in the properties of excrement as shown in the time series data DT12, and information on changes over time in odor as shown in the time series data DT22, generates provided information that prioritizes advice related to the information that is showing a greater deterioration, and displays the generated provided information.
- Fig. 13 is a diagram showing an example of information used to estimate a score according to the embodiment.
- Fig. 14 is a diagram showing an example of information used to estimate provided information according to the embodiment.
- Fig. 15 is a diagram showing an example of information used to estimate provided information according to the embodiment.
- the estimation table MT1 shown in Figure 13 is a list of estimated intestinal ranks based on a combination of the classification shown in the "Stool properties” item and the intestinal environment ranks A to D based on the intestinal environment score shown in the "Odor” item.
- the "Stool properties” item corresponds to an estimation based on the detection results (stool detection) by the first detection unit 21.
- the “Odor” item corresponds to an estimation based on the detection results (defecation gas detection) by the second detection unit 22.
- the intestinal rank is divided into seven ranks (stages), from S to A to F, with S being the best intestinal condition, A being the next best after S, and F being the worst intestinal condition.
- the health score is not limited to the intestinal rank, and any information (e.g., a numerical value (score) such as 0 to 100 points) can be used.
- the bioinformation measuring system 1 may output the intestinal score by adding up information on the properties of the stool (evaluation, etc.) and odor information.
- the "Odor" item includes four levels of intestinal environment rank, A to D.
- the intestinal environment rank indicates a four-level evaluation in which A is the best and D is the worst.
- the bioinformation measuring system 1 may estimate the four levels of intestinal environment rank by converting the estimated intestinal environment score. In this case, for example, the bioinformation measuring system 1 may estimate the intestinal environment rank as A when the intestinal environment score is 75 points or higher.
- the bioinformation measuring system 1 estimates that if the intestinal environment score is between 50 and 75 points, the intestinal environment rank is B, if the intestinal environment score is between 25 and 50 points, the intestinal environment rank is C, and if the intestinal environment score is less than 25 points, the intestinal environment rank is D.
- the intestinal environment ranks shown in FIG. 13 are merely examples, and any information (e.g., intestinal environment score, second evaluation, etc.) can be used for the "Odor" item.
- the "feces characteristics” item includes four classification groups: the first classification group of "banana,” the second classification group of “cracked” and “soft,” the third classification group of “hard” and “mud,” and the fourth classification group of "hard” and “watery.”
- the classification groups shown in Figure 13 are merely an example, and any combination of classification groups can be used.
- any information (such as a first evaluation) can be used for the "feces characteristics" item.
- the bioinformation measuring system 1 estimates the user's intestinal rank as a score using the user's intestinal environment rank, the classification of stool properties, and the estimation table MT1. For example, if the user's intestinal environment rank is A and the stool properties are banana, the bioinformation measuring system 1 estimates the user's intestinal rank to be S based on the corresponding elements in the estimation table MT1.
- the estimation table MT2 shown in FIG. 14 is a list of provided information based on a combination of two categories, good and bad, shown in the "feces properties" item and two categories, good and bad, shown in the "odor” item.
- FIG. 14 shows four pieces of provided information corresponding to the number of combinations of the two categories of "feces properties" and the two categories of "odor.” Note that the provided information shown in FIG. 14 is merely an example, and each piece of provided information may include any content corresponding to the state of the stool properties or the state of the odor.
- the "smell” category has two categories: “good” and “bad.” Note that the "smell” categories shown in FIG. 14 are merely examples, and any combination of categories can be used.
- the bioinformation measuring system 1 classifies it as "good” as shown in FIG. 14, and if the second evaluation is less than the predetermined value, the bioinformation measuring system 1 classifies it as "bad” as shown in FIG. 14.
- the bioinformation measuring system 1 may use various information to classify the odor as either "good” or "bad” as shown in FIG. 14. For example, if the intestinal environment score is equal to or greater than a predetermined value, the bioinformation measuring system 1 may classify it as "good” as shown in FIG. 14, and if the intestinal environment score is less than the predetermined value, the bioinformation measuring system 1 may classify it as "bad” as shown in FIG. 14.
- the item “feces characteristics” has two categories, “good” and “bad.” Note that the categories of “feces characteristics” shown in FIG. 14 are merely examples, and any combination of categories can be used.
- the bioinformation measuring system 1 classifies it as "good” as shown in FIG. 14, and if the first evaluation is less than the predetermined value, it classifies it as "bad” as shown in FIG. 14.
- the bioinformation measuring system 1 may use various information to classify the stool properties into either "good” or "bad” as shown in FIG. 14. For example, if the stool properties are "banana”, the bioinformation measuring system 1 may classify it as “good” as shown in FIG. 14, and if the stool properties are other than “banana”, it may classify it as "bad” as shown in FIG. 14.
- the bioinformation measurement system 1 estimates the information to be provided to a user using the odor classification, stool property classification, and estimation table MT2. For example, if the "odor" item for a user is “bad” and the “stool properties” item is “bad,” the bioinformation measurement system 1 estimates, based on the corresponding elements in estimation table MT2, that the information to be provided to the user, "Your intestines tend to be in very bad condition. Why don't you start by reviewing your diet?", is appropriate.
- the estimation table MT3 shown in FIG. 15 is a list of provided information based on combinations of the three categories shown in the "feces properties" item and the three categories shown in the "odor” item.
- FIG. 15 shows nine pieces of provided information corresponding to the number of combinations of the three categories of "feces properties” and the three categories of "odor.” Note that the provided information shown in FIG. 15 is merely an example, and each piece of provided information may include any content corresponding to the state of the stool properties or the state of the odor.
- the "smell” category has three categories: "good,” “average,” and “bad.” Note that the "smell” categories shown in FIG. 15 are merely examples, and any combination of categories can be used.
- the bioinformation measuring system 1 classifies it as "good” as shown in FIG. 15; if the second evaluation is less than the first threshold and equal to or greater than the second threshold, the bioinformation measuring system 1 classifies it as "average” as shown in FIG. 15; if the second evaluation is less than the second threshold, the bioinformation measuring system 1 classifies it as "bad” as shown in FIG. 15.
- the first threshold may be any value
- the second threshold may be any value less than the first threshold.
- the bioinformation measuring system 1 may use the intestinal environment score to classify the "odor" item into one of three categories: “good,” “average,” or "bad.”
- the item “feces characteristics” includes three taxonomic groups: the first taxonomic group of “muddy” and “watery,” the second taxonomic group of “cracked,” “banana,” and “soft,” and the third taxonomic group of "hard” and “hard.” Note that the taxonomic groups shown in Figure 15 are merely examples, and any combination of taxonomic groups can be used.
- the bioinformation measurement system 1 estimates the information to be provided to a user using the odor classification, stool property classification, and estimation table MT3. For example, if the "odor" category for a user is "normal” and the “stool properties” category is the third classification group of "hard” and "hard,” the bioinformation measurement system 1 estimates, based on the corresponding elements in estimation table MT3, that information such as “Start exercising twice a week" is suitable as information to be provided to the user.
- the biological information measuring system 1 generates various pieces of information shown below, and provides the generated information as follows:
- the display device 300 used by the corresponding user displays the information.
- the display device 300 used by the user displays a health management application (also called an "intestinal activity application") for displaying information related to the user's health. ) is installed, and the intestinal health app displays various information about the user's health.
- a health management application also called an "intestinal activity application”
- the display device 300 may display information relating to the user's health using an application other than the intestinal activity app.
- an example will be described in which the user of the display device 300 that displays information is user U.
- FIG. 16 shows an example of information related to the basic functions of the intestinal activity app that is provided by the biological information measurement system 1 and displayed by the display device 300.
- FIG. 16 is a diagram showing an example of information provided by the biological information measurement system.
- Content CT1 in FIG. 16 corresponds to, for example, the home screen of an intestinal activity app displayed on the display device 300.
- Content CT1 includes a display area AR1 that displays various information.
- intestinal condition information IM1 including the intestinal rank at the time of display, a schematic diagram of a person, and an illustration of the intestine corresponding to the intestinal rank at the time of display is displayed in the display area AR1.
- FIG. 16 shows a case where the intestinal rank of user U at the time of display is A.
- Content CT1 includes a button IC1 labeled “Recommended information for you.” Content CT1 also includes a button IC2 labeled “What is intestinal rank?" Content CT1 includes a button IC3 labeled “Intestinal movement.” Content CT1 includes a button IC4 labeled “Intestinal environment.” Content CT1 includes a button IC5 labeled “Intestinal activity diary.” Content CT1 includes a button IC6 labeled with information about user U's family. Examples of information displayed when buttons IC1 to IC6 are selected (designated) will be described later.
- FIG. 17 is a diagram showing an example of information provided by the biometric information measurement system.
- Content CT2 in FIG. 17 corresponds to, for example, a screen related to intestinal movement displayed by display device 300.
- Content CT2 includes feature information FT1 to FT3 that indicates information related to user U's stool at the time of display. Note that FIG. 17 shows a case in which feature information FT1 to FT3 are text information, but feature information FT1 to FT3 may be displayed in any manner, such as icons, as long as they can indicate the corresponding information.
- characteristic information FT1 indicates the amount of stool of user U at the time of display, and in Figure 17 indicates that the amount of stool is large.
- characteristic information FT2 indicates the color of user U's stool at the time of display, and in Figure 17 indicates that the color of the stool is brown.
- characteristic information FT3 indicates the properties of user U's stool at the time of display, and in Figure 17 indicates that the properties of the stool are normal (banana, etc.).
- Figure 17 shows a case where the properties of the stool are displayed as one of three types: soft, normal, or hard, but the properties of the stool may also be displayed as the contents of the Bristol scale, such as banana or hard.
- Content CT2 includes a button IC11 labeled "Calendar display.” For example, when button IC11 in content CT2 displayed on display device 300 is selected, display device 300 displays a calendar related to the measurement results of intestinal movement (e.g., stool characteristics, etc.).
- intestinal movement e.g., stool characteristics, etc.
- Content CT2 includes a button IC12 labeled "Today's Short Explanation: Peristaltic Movement Version.” For example, when button IC12 in content CT2 displayed on display device 300 is selected, display device 300 displays today's short explanation about peristaltic movement.
- Content CT2 includes a button IC13 labeled "Related Column.” For example, when button IC13 in content CT2 displayed on display device 300 is selected, display device 300 displays a related column about intestinal movement (e.g., stool characteristics, etc.).
- intestinal movement e.g., stool characteristics, etc.
- Content CT2 includes a button IC14 labeled "Score.”
- button IC14 in content CT2 displayed on display device 300 is selected, display device 300 displays information related to the score related to bowel movement (e.g., first evaluation, etc.).
- FIG. 18 is a diagram showing an example of information provided by the biometric information measurement system.
- Content CT3 in FIG. 18 corresponds to, for example, a screen relating to the intestinal environment displayed by the display device 300.
- Content CT3 includes time series data showing the changes in the intestinal environment index indicating the intestinal environment of the user U up to the time of display, and information provided based on the changes.
- the intestinal environment index may be any index such as an intestinal environment score, an intestinal environment rank, etc.
- Content CT3 includes a button IC21 labeled "Today's commentary: Intestinal environment version.” For example, when button IC21 in content CT3 displayed on display device 300 is selected, display device 300 displays today's commentary on intestinal environment.
- Content CT3 includes a button IC22 labeled "Related Column.” For example, when button IC22 in content CT3 displayed on display device 300 is selected, display device 300 displays a related column about the intestinal environment.
- Content CT3 includes a button IC23 labeled "Explanation of intestinal environment index.” For example, when button IC23 in content CT3 displayed on display device 300 is selected, display device 300 displays an explanation of the intestinal environment index displayed in content CT3.
- the information displayed in the display area AR1 is not limited to the information shown in FIG. 16, but may be any information.
- examples will be described using FIG. 19 and FIG. 20.
- FIG. 19 and FIG. 20 are diagrams showing examples of information according to the estimation result.
- the display device 300 may display in the display area AR1 the provided information "Good condition! suggesting the maintenance of the current state, and the intestinal condition information IM2 including a schematic diagram of a person and an illustration of the intestines corresponding to the intestinal rank at the time of display.
- the display device 300 displays the intestinal condition information IM2 in place of the intestinal condition information IM1 in the display area AR1 in the content CT1 shown in FIG. 16.
- the display device 300 may display in the display area AR1 the provided information "Getting better! suggesting the maintenance of the current state because the state is improving, and the intestinal condition information IM3 including an illustration of the intestines showing a change in the intestinal condition.
- the display device 300 displays the intestinal condition information IM3 in place of the intestinal condition information IM1 in the display area AR1 in the content CT1 shown in FIG. 16.
- the display device 300 displays any information in the display area AR1.
- the display device 300 displays information in the display area AR1 indicating the overall condition of the intestines, such as a score given as a point or a ranking, a judgment of whether it is good or bad, changes from the past, etc.
- the display device 300 may display a score or a ranking as an indicator of the condition of the intestines.
- the display device 300 may display a graph of the above-mentioned trend of change over time along with the above-mentioned information.
- the display device 300 displays information such as content CT4 shown in FIG. 21.
- FIG. 21 shows an example of information related to the user's intestinal health.
- Content CT4 in FIG. 21 corresponds to, for example, a screen related to intestinal activity displayed by the display device 300.
- Content CT4 includes calendar information of an intestinal activity diary showing the intestinal activity of the user U up to the time of display, etc.
- Content CT4 includes a button IC31 labeled "Intestinal health related column.” For example, when button IC31 in content CT4 displayed on display device 300 is selected, display device 300 displays the intestinal health related column.
- Content CT4 includes a button IC32 labeled "Everyone's Intestinal Health.” For example, when button IC32 in content CT4 displayed on display device 300 is selected, display device 300 displays information about the intestinal health of users other than user U; an example of this will be described later.
- Content CT4 includes a button IC33 labeled "Looking back on past intestinal activity.” For example, when button IC33 in content CT4 displayed on display device 300 is selected, display device 300 displays historical information about user U's intestinal activity, etc.
- FIG. 22 is a diagram showing an example of recommended information for a user.
- FIG. 22 shows an example of the display when the condition of the intestines of user U is poor (for example, intestinal rank D, etc.).
- Content CT5 in FIG. 22 corresponds to a screen related to provided information such as recommended information displayed by the display device 300, for example.
- Content CT5 includes provided information corresponding to the intestinal condition of the user U up to the time of display.
- Content CT5 includes provided information INF5 including suggestions for improving eating habits such as "You are feeling worse compared to the past" and "Your intestinal environment indicators tend to be worsening. Is your eating habits out of whack?".
- Content CT5 includes a button IC41 labeled "recommended information.” For example, when button IC41 in content CT5 displayed on display device 300 is selected, display device 300 displays various information such as content CT6 shown in FIG. 23.
- FIG. 23 is a diagram showing an example of recommended information for a user.
- Content CT6 in FIG. 23 corresponds to a screen related to provided information such as recommended information displayed by the display device 300, for example.
- Content CT6 includes provided information INF6 including suggestions on foods to ingest, such as "It is said that the intestinal environment is affected by diet. Water-soluble dietary fiber is said to be good!"
- Content CT6 also includes information on related sites, videos, recommended products, etc. that may lead to improved dietary habits.
- buttons IC32 in content CT4 displayed on the display device 300 are selected, the display device 300 displays information such as content CT7 shown in FIG. 24.
- FIG. 24 shows an example of information about other users provided to the user.
- Content CT7 in FIG. 24 corresponds to, for example, a screen related to information about other users displayed by the display device 300.
- Content CT7 includes information about intestinal activity of other users who have similar attributes to user U, such as age, sex, physique, and lifestyle.
- content CT7 includes information about intestinal activity recorded in an intestinal activity app by other users in their 30s who have similar attributes to user U, who is in his 30s, and information about intestinal activity posted on a social networking service (SNS).
- SNS social networking service
- the display device 300 displays intestinal activity methods of people with similar attributes or intestinal scores.
- the bioinformation measurement system 1 may obtain records in intestinal activity apps of others or information on SNS linked to attributes or intestinal scores associated with information identifying the user (such as an ID), and use this information as information related to the intestinal activity of other users similar to user U.
- Content CT8 in FIG. 25 corresponds to the screen displayed when, for example, a specific date is selected from the calendar of the intestinal activity diary included in content CT4.
- FIG. 25 is a diagram showing an example of the display form of information provided to the user.
- Content CT8 includes calendar information of the intestinal activity diary showing the intestinal activity of user U up to the time of display, and the intestinal score and icon corresponding to the selected date, etc.
- the display device 300 may prompt the user U to manually input the sensory information or select an icon.
- the display device 300 may prompt the user U to select an overall rating of A to E based on his/her own sensory (subjective) sensation.
- the display device 300 may also prompt the user U to select from among icons relating to subjective sensations based on his/her own sensory (subjective) sensation.
- the bioinformation measurement system 1 may then use the sensory information acquired through the user's selection to reevaluate or correct the user U's score, set a score value that the user U should aim for, etc.
- the display device 300 may also prompt the user U to manually input or select an icon for each of the multiple items.
- the display device 300 may display an icon for each item such as diet, lifestyle, and exercise, and prompt the user U to select from those icons.
- the display device 300 may acquire information by linking with other applications in a smartphone or a smartwatch.
- the bioinformation measurement system 1 collects information to determine whether to exclude intestinal activity information and outliers (such as outliers) in the measured values.
- the bioinformation measurement system 1 may then manage the information acquired by the user's selection by linking it to the estimated results as information indicating intestinal activity events and conditions.
- the bioinformation measurement system 1 may also execute a process of excluding outliers based on the information acquired from the user.
- the display device 300 may also provide information in response to changes in the user's intestinal condition.
- the display device 300 displays content CT9 including provided information in response to changes in the user U's score (intestinal score), diet, and exercise, and a button IC91 encouraging the purchase of a product corresponding to the provided information.
- FIG. 26 is a diagram showing an example of recommended information for a user.
- the bioinformation measurement system 1 estimates that XX yogurt is suitable for user U because user U's score is good when he consumes XX yogurt. Therefore, the bioinformation measurement system 1 generates content CT9 including provided information suggesting that XX yogurt is suitable for user U and that he should consume it, and a button IC91 for purchasing XX yogurt, and displays this on the display device 300.
- the display device 300 displays information such as an EC (electronic commerce) site that sells XX yogurt. In this way, when the score starts to deteriorate, the display device 300 displays information suggesting products related to intestinal health tools that have been effective in the past.
- EC electronic commerce
- display device 300 may display information other than content CT7 shown in FIG. 24.
- display device 300 may display information such as content CT10 shown in FIG. 27.
- FIG. 27 is a diagram showing an example of information of other users provided to a user.
- Content CT10 in FIG. 27 corresponds to, for example, a screen related to information about other users displayed by the display device 300.
- Content CT10 includes information related to the intestinal activity of other users similar to user U.
- content CT10 includes information related to the intestinal activity records of other users in their 30s who have similar attributes to user U, who is also in his 30s.
- the display device 300 outputs a group of information linked to attributes and intestinal scores associated with information (such as IDs) that identifies other users similar to user U.
- the display device 300 displays content CT10 including intestinal activity records showing the intestinal activity content and period of each of the other users, and information such as fluctuations in the intestinal score during that intestinal activity period. In this way, the display device 300 allows the user to view information linked to the intestinal activity events and results of other users (people).
- FIG. 28 is a diagram showing an example of information about users who have relationships with the user.
- FIG. 28 shows an example of a display in which user U's family consists of four people: user U (me), spouse (father), and two children (child A and son B).
- biometric information measurement system 1 makes it possible to identify users who have relationships with each user by managing information (ID, etc.) that identifies users who have relationships with each user in association with the information (ID, etc.) that identifies that user.
- Content CT11 in FIG. 28 corresponds to, for example, a screen displaying a list of users who have relationships with the user displayed by the display device 300.
- Content CT11 includes the four ranks of each of the user U's family members up to the time of display.
- Content CT11 includes a button IC101 with the rank B for the spouse (father) and the label " ⁇ View more”.
- Content CT11 also includes a button IC102 with the rank A for user U (me).
- Content CT11 also includes a button IC103 with the rank B for the child (child A) and the label " ⁇ View more”.
- Content CT11 also includes a button IC104 with the rank C for the child (child B) and the label " ⁇ View more”.
- the display device 300 transitions the display to display information showing the results for that individual user. For example, when button IC101 is selected, the display device 300 displays information showing the individual estimation results for the spouse (father). For example, the display device 300 switches the information displayed in the display area AR1 from information about the user U (me) to information about the spouse (father).
- the biometric information measurement system 1 can display the results of others through ID linkage.
- certain conditions, such as ID linkage are met, the biometric information measurement system 1 transmits data to a third party.
- family members have been described as users who have a relationship with the user, but users who have a relationship with the user are not limited to family members, and may also be users who belong to a common institution, such as a hospital or gym, or people who provide health management support to the user, such as doctors or gym trainers.
- the display device 300 displays information such as content CT12 shown in FIG. 29.
- FIG. 29 shows an example of rank information related to a user.
- the content CT12 includes rank information based on the intestinal rank of the user U at the time of display.
- the content CT12 includes information on the distribution of intestinal ranks in a group of users in their 30s who have attributes similar to the user U in his 30s.
- the bioinformation measuring system 1 extracts information on users in their 30s from the information on users it manages, generates information showing the distribution of intestinal ranks in a group of users in their 30s based on the extracted information, and generates the content CT12 by adding information showing the rank to which the user U corresponds to the generated information showing the distribution.
- FIG. 29 corresponds to, for example, a screen related to intestinal activity displayed by the display device 300.
- the content CT12 includes rank information based on the intestinal rank of the user U at the time of display.
- the content CT12 includes information on the distribution of intestinal ranks in a group of users in their 30s who have attributes similar to the user U in his 30s.
- the bioinformation measuring system 1 extracts information on users in their 30s from the information on users it manages,
- the display device 300 displays the content CT12 showing that the intestinal rank of the user U is C, and that the intestinal rank C is average for a group of users in their 30s. In this way, the display device 300 allows the user to compare the evaluation of ranks, etc. between the user and other users (people) who are similar (in attributes, etc.). Additionally, CT12 may also be an evaluation of a rank related to a score related to intestinal movement (e.g., a first evaluation, etc.) or an evaluation of a rank related to an intestinal environment index.
- CT12 may also be an evaluation of a rank related to a score related to intestinal movement (e.g., a first evaluation, etc.) or an evaluation of a rank related to an intestinal environment index.
- the biometric information measuring system 1 may also notify the user at a predetermined timing.
- the biometric information measuring system 1 may display any information in the display area AR11 of the display device 300 shown in FIG. 30.
- FIG. 30 is a diagram showing an example of information notification to the user.
- the display device 300 displays content CT13 in the display area AR11, which includes information such as "Caution! Your intestinal rank is dropping! For example, if the intestinal rank of user U starts to deteriorate, the display device 300 of user U displays content CT13 in the display area AR11. In this way, the display device 300 calls attention when the user's own score starts to deteriorate.
- the display device 300 displays content CT14 in the display area AR11, which includes information such as "Caution! Boy B's intestinal rank is dropping! Let's check it out.” For example, when the intestinal rank of Boy B, the child of user U, starts to deteriorate, the display device 300 of user U displays content CT14 in the display area AR11. In this way, the display device 300 calls attention when the score of another person who has a relationship with the user starts to deteriorate.
- the bioinformation measuring system 1 may also notify the user according to the user's usage. This point will be explained using Figs. 31 and 32.
- Figs. 31 and 32 are diagrams showing an example of information notification according to the user's usage.
- the bioinformation measuring system 1 may perform push notifications based on the user's login history to the intestinal activity app.
- the bioinformation measuring system 1 may also evaluate the user's level of interest in intestinal activity based on the number of times the user logs into the intestinal activity app and the frequency of inputting intestinal activity information.
- the bioinformation measurement system 1 may evaluate the user as having a high level of interest in intestinal activity and notify the user of information praising the user for their active activities.
- the bioinformation measurement system 1 notifies the user of information such as content CT15.
- the display device 300 of user U displays content CT15.
- the display device 300 displays content CT15 (pop-up display) superimposed on content CT1.
- the bioinformation measuring system 1 may assess that the user has a low level of interest in intestinal activity and notify the user of information encouraging active activity. If the bioinformation measuring system 1 assesses that the user has a low level of interest in intestinal activity, it causes the display area AR12 of the display device 300 shown in FIG. 32 to display information encouraging the user to be active.
- the display device 300 displays content CT16 in the display area AR12, which includes information such as "You haven't logged in for xx days. Would you like to restart your intestinal activity?"
- the display device 300 of the user U displays content CT16 in the display area AR12.
- the bioinformation measurement system 1 may provide notifications according to the user's level of interest in intestinal activity in order to maintain the user's motivation.
- the bioinformation measurement system 1 can inform the user of desired information by providing various types of information. For example, if the condition of the user's intestines is poor, the bioinformation measurement system 1 can encourage the user to improve the condition. The bioinformation measurement system 1 can satisfy the user's desire to know when their health condition is worsening, and can motivate the user to reconsider their lifestyle by notifying them when their score is dropping.
- the bioinformation measurement system 1 can encourage the user to maintain that condition.
- the bioinformation measurement system 1 can satisfy the user's desire to manage their health by linking it to their lifestyle habits, and can give the user a sense of security by informing them that their score is good.
- the bioinformation measurement system 1 can also satisfy the desires of users who want to use it to help manage the health of their family members and patients, for example, to know the condition of their family members' stomachs and plan their menus.
- the bioinformation measurement system 1 can encourage the user to further improve the condition.
- the bioinformation measurement system 1 can satisfy the needs of users who want to find an intestinal activity that suits their body, or who want to use it as an indicator of the effectiveness of intestinal activity, and can recognize the effects of foods such as yogurt that the user has started to eat, and encourage the continued intake of those foods.
- the bioinformation measurement system 1 can motivate users to work hard to achieve their goals, as a tool to maintain motivation for intestinal activity.
- the bioinformation measuring system 1 may also output an alert when the score falls below a predetermined level in comparison with past data.
- the bioinformation measuring system 1 may also notify the completion of measurement when the first bioinformation, the second bioinformation, the provided information, or the score are all collected.
- the bioinformation measuring system 1 may also preferentially output information with poor results, together with the reasons, from among the first bioinformation and the second bioinformation.
- the bioinformation measuring system 1 may also update the recommended information or score after each excretion act.
- the bioinformation measuring system 1 may also detect the properties of the stool using an image sensor, and detect defecation gas using a gas sensor.
- the bioinformation measuring system 1 may also detect the amount, color, density, and subjective information of the user regarding the feeling of relief after defecation, etc., as information regarding intestinal peristalsis, and may also detect the color and odor of the stool, as information regarding the intestinal environment, as well as defecation gas.
- the bioinformation measuring system 1 generates various contents as described above and provides the generated contents to the user.
- the control device 100 of the bioinformation measuring system 1 generates various information such as contents CT1 to CT16.
- the control device 100 then transmits the various information such as the generated contents CT1 to CT16 to the user's display device 300.
- the display device 300 receives the various information such as contents CT1 to CT16 and displays the received information such as contents CT1 to CT16.
- the processing unit 132 of the control device 100 functions as a generating unit that performs generation processing of various types of information.
- the processing unit 132 generates various types of information such as content to be displayed on the display device 300.
- the processing unit 132 generates screens (contents) shown in Figures 16 to 32.
- the processing unit 132 generates content (image information) to be provided to the display device 300 by appropriately using various technologies related to image generation and image processing.
- the processing unit 132 generates screens (image information) to be provided to the display device 300 by appropriately using various technologies such as Java (registered trademark).
- the processing unit 132 may generate content (image information) to be provided to the display device 300 based on the format of CSS (Cascading Style Sheets), JavaScript (registered trademark), or HTML (Hyper Text Markup Language). Additionally, for example, the processing unit 132 may generate content in various formats, such as JPEG (Joint Photographic Experts Group), GIF (Graphics Interchange Format), and PNG (Portable Network Graphics).
- CSS Clicking Style Sheets
- JavaScript registered trademark
- HTML Hyper Text Markup Language
- JPEG Joint Photographic Experts Group
- GIF Graphics Interchange Format
- PNG Portable Network Graphics
- a vital sign measurement system for measuring vital signs of a user of a toilet room based on information of excrement discharged into a bowl of a toilet bowl installed in the toilet room comprising: A first detection unit that detects feces; A second detection unit that detects defecation gas; a control unit that executes an estimation process to estimate at least one of provided information or a score related to the health of the user based on a detection result of the first detection unit and a detection result of the second detection unit, and executes control to output a result of the estimation process to an outside;
- a biological information measuring system comprising: (2) The control unit is estimating first biological information based on the properties of the stool from the detection result of the first detection unit; A second biological information based on the amount or concentration of the defecation gas is estimated from the detection result of the second detection unit;
- the biological information measuring system according to (1) further comprising: a control unit that controls the output of the
- the control unit is The biological information measuring system according to (1) or (2), characterized in that the estimation process is performed using a larger number of samples of the detection results of the second detection unit than the number of samples of the detection results of the first detection unit.
- the bioinformation measuring system described in (3) is characterized in that the estimation process uses the detection result of the first detection unit obtained from a single toilet use and multiple detection results of the second detection unit obtained from multiple toilet use respectively.
- the control unit is The higher the first evaluation corresponding to each classification of the stool properties based on the detection result of the first detection unit, the higher the score is estimated to be;
- the bioinformation measuring system according to any one of (1) to (4), characterized in that the estimation process is executed in such a way that the higher the second evaluation based on the detection result of the second detection unit, the higher the score is estimated to be.
- a vital sign measurement system for measuring vital signs of a user of a toilet room based on information of excrement discharged into a bowl of a toilet bowl installed in the toilet room, comprising: A first detection unit that detects information regarding intestinal peristalsis; A second detection unit that detects information regarding the intestinal environment; a control unit that executes an estimation process to estimate at least one of provided information or a score related to the health of the user based on a detection result of the first detection unit and a detection result of the second detection unit, and executes control to output a result of the estimation process to an outside;
- a biological information measuring system comprising: (7) A vital sign measurement system for measuring vital signs of a user of a toilet room based on information of excrement discharged into a bowl of a toilet bowl installed in the toilet room, comprising: a control unit that executes an estimation process to estimate at least one of the provided information or score related to the health of the user based on a detection result by a first detection unit that detects stool and a detection result by a
Landscapes
- Health & Medical Sciences (AREA)
- Life Sciences & Earth Sciences (AREA)
- Engineering & Computer Science (AREA)
- Molecular Biology (AREA)
- Biomedical Technology (AREA)
- Chemical & Material Sciences (AREA)
- Physics & Mathematics (AREA)
- Immunology (AREA)
- Hematology (AREA)
- Urology & Nephrology (AREA)
- General Health & Medical Sciences (AREA)
- Medicinal Chemistry (AREA)
- Analytical Chemistry (AREA)
- Biochemistry (AREA)
- Food Science & Technology (AREA)
- General Physics & Mathematics (AREA)
- Public Health (AREA)
- Pathology (AREA)
- Cell Biology (AREA)
- Biotechnology (AREA)
- Microbiology (AREA)
- Epidemiology (AREA)
- Biophysics (AREA)
- Hydrology & Water Resources (AREA)
- Water Supply & Treatment (AREA)
- Bidet-Like Cleaning Device And Other Flush Toilet Accessories (AREA)
- Investigating Or Analysing Biological Materials (AREA)
- Measuring And Recording Apparatus For Diagnosis (AREA)
- Medical Treatment And Welfare Office Work (AREA)
Abstract
実施形態に係る生体情報測定システムは、トイレ室に設置された大便器のボウル内に排出される排泄物の情報に基づいて、前記トイレ室の利用者の生体情報を測定する生体情報測定システムであって、大便を検知する第一検知部と、排便ガスを検知する第二検知部と、前記第一検知部の検知結果及び前記第二検知部の検知結果に基づいて、前記利用者の健康に関する提供情報またはスコアの少なくとも1つを推定する推定処理を実行し、前記推定処理の結果を外部に出力させる制御を実行する制御部と、備える。
Description
開示の実施形態は、生体情報測定システムに関する。
従来、トイレにおいて各種情報のセンシングを行う技術が提供されている。例えば、大便の性状をセンシングする便器装置が知られている(例えば、特許文献1参照)。このような、大便の性状からは腸の蠕動運動に関する情報を推定することができるとされている。また、例えば、排便ガスをセンシングする便器装置が知られている(例えば、特許文献2参照)。このような、排便ガスからは腸内環境に関する情報を推定することができるとされている。
しかしながら、上述した従来技術には、改善の余地がある。例えば、大便の性状からは腸の蠕動運動に関する情報を推定可能であるものの、腸内環境を加味した健康に関する情報を推定することは難しい。また、排便ガスからは腸内環境に関する情報を推定可能であるものの、腸の蠕動運動を加味した健康に関する情報を推定することは難しい。このように、上記の従来技術のように一つの要素のみを用いた推定では、複数の要素に基づく情報を推定することが難しく、利用者の健康に関する情報を適切に推定することが難しい場合がある。そのため、利用者の健康に関する情報を適切に推定することが望まれている。
開示の実施形態は、利用者の健康に関する情報を適切に推定することができる生体情報測定システムを提供することを目的とする。
実施形態の一態様に係る生体情報測定システムは、トイレ室に設置された大便器のボウル内に排出される排泄物の情報に基づいて、前記トイレ室の利用者の生体情報を測定する生体情報測定システムであって、大便を検知する第一検知部と、排便ガスを検知する第二検知部と、前記第一検知部の検知結果及び前記第二検知部の検知結果に基づいて、前記利用者の健康に関する提供情報またはスコアの少なくとも1つを推定する推定処理を実行し、前記推定処理の結果を外部に出力させる制御を実行する制御部と、を備えることを特徴とする。
腸の健康状態は、主にストレスや睡眠、感染症などから影響を受ける腸の外壁の蠕動運動と、主に食事から影響を受ける腸の内側の腸内環境から成り立つ。また、蠕動運動の指標の一つとして大便の情報(大便の性状)があり、腸内環境の指標の一つとして排便ガスの情報(排便ガスの量または濃度)がある。このことから、実施形態の一態様に係る生体情報測定システムによれば、利用者の蠕動運動と関りの持つ大便の情報と利用者の腸内環境と関りの持つ排便ガスの情報と基づいて、利用者の健康に関する提供情報やスコアを出力することで、腸の外壁の状態と腸の内側の状態とを考慮した利用者の健康に関する提供情報やスコアを出力できるため、より精度よく利用者の健康サポートを実施することができる。
発明者らの研究により、腸全体の健康状態は、主にストレスや睡眠、感染症などから影響を受ける腸の外壁の蠕動運動と、主に食事から影響を受ける腸の内側の腸内環境から成り立つことがわかってきた。従来のように、蠕動運動のみを推定する便器装置、及び腸内環境を推定する便器装置のうち1つのみでは、蠕動運動に関わる情報または腸内環境に関わる情報のいずれか一方しか把握できず、腸全体としての健康状態を正確に把握することができなかった。また、一方の情報のみからは、ストレスや睡眠、食事などの生活要素のうち、どれに最も問題があり、どのような改善が必要か、ということが分からなかった。また、排泄物の形を目で観察(目視)すること(観便)により、腸の健康状態を推定する行動(観便)等でも上記の課題を解決することが難しい。そこで、実施形態の一態様に係る生体情報測定システムによれば、大便及び排便ガスの両方の検知結果を基に、利用者の健康に関する情報を推定することで、利用者の健康に関する情報を適切に推定することができる。
実施形態の一態様に係る生体情報測定システムにおいて、前記制御部は、前記第一検知部の検知結果から前記大便の性状に基づく第一の生体情報を推定し、前記第二検知部の検知結果から前記排便ガスの量または濃度に基づく第二の生体情報を推定し、前記第一の生体情報及び前記第二の生体情報を外部に出力させる制御を実行することを特徴とする。
実施形態の一態様に係る生体情報測定システムによれば、蠕動運動の指標である大便の性状と、腸内環境の指標である排便ガスの量または濃度を示すことで、利用者(使用者)は自分の不調の原因を良く理解することができ、またどのように生活を改善したら良いかが分かるようになるため、より精度よく利用者の健康サポートを実施することができる。
実施形態の一態様に係る生体情報測定システムにおいて、前記制御部は、前記第一検知部の検知結果のサンプル数より前記第二検知部の検知結果のサンプル数を多く用いて前記推定処理を実行することを特徴とする。
蠕動運動は日々の生活習慣の影響を受けて、突発的に変化しやすい一方、腸内環境は直近の生活習慣に大きく影響を受けずにゆっくりと変化する。そのため、実施形態の一態様に係る生体情報測定システムによれば、腸内環境に関する排便ガスの量または濃度のデータは蠕動運動に関する大便の性状のデータよりも多くのサンプル数を用いて利用者の健康に関する情報を推定することで、より正確に蠕動運動、腸内環境それぞれの推定を行うことができる。したがって、生体情報測定システムは、利用者の健康に関する情報を適切に推定することができる。
実施形態の一態様に係る生体情報測定システムにおいて、前記推定処理では、1回のトイレ使用で得られた前記第一検知部の検知結果と、複数回のトイレ使用でそれぞれ得られた複数の前記第二検知部の検知結果と、を使用することを特徴とする。
便の性状は急激なストレスなどにより大きく変化し、一日に何回も排便があった場合に性状が変化することがある。一方で腸内環境は1週間以上かけてゆっくりと変化し、2~3日程度の変化は食事などによって発生するデータのばらつきである。そのため、実施形態の一態様に係る生体情報測定システムによれば、蠕動運動に関する大便の性状のデータは1回の排泄データを、腸内環境に関する排便ガスの量または濃度のデータは複数の排泄データを使うことで適切に総合的な健康に関する提供情報やスコアを利用者に伝えることができる。したがって、生体情報測定システムは、利用者の健康に関する情報を適切に推定することができる。
実施形態の一態様に係る生体情報測定システムにおいて、前記制御部は、前記第一検知部の検知結果に基づく前記大便の性状の分類ごとに対応する第一評価が高い程、前記スコアを高く推定し、前記第二検知部の検知結果に基づく前記排便ガスの第二評価が高い程前記スコアを高く推定する前記推定処理を実行することを特徴とする。
大便の性状は、その分類に応じて評価が異なる。例えば、大便の性状を表す一般的な指標(ブリストルスケール)は、中央に位置するバナナ状であると良い状態であり、両端に行くにつれ悪い状態であると言える。一方、腸内環境を表す排便ガスについては、スコアが高い状態である程望ましい状態であると言える。そのため、実施形態の一態様に係る生体情報測定システムによれば、腸の状態を判定する際には、大便の性状は分類の評価が良い程、腸の状態が良いと推定し、腸内環境を表す排便ガスはスコアが高い程、腸の状態が良いと推定することで、総合得点としての腸の状態を適切に推定でき、利用者に正しく腸の状態をお知らせすることができる。したがって、生体情報測定システムは、利用者の健康に関する情報を適切に推定することができる。
実施形態の一態様に係る生体情報測定システムは、トイレ室に設置された大便器のボウル内に排出される排泄物の情報に基づいて、前記トイレ室の利用者の生体情報を測定する生体情報測定システムであって、腸の蠕動運動に関する情報を検知する第一検知部と、腸内環境に関する情報を検知する第二検知部と、前記第一検知部の検知結果及び前記第二検知部の検知結果に基づいて、前記利用者の健康に関する提供情報またはスコアの少なくとも1つを推定する推定処理を実行し、前記推定処理の結果を外部に出力させる制御を実行する制御部と、を備えることを特徴とする。
腸の健康状態は、主にストレスや睡眠、感染症などから影響を受ける腸の外壁の蠕動運動と、主に食事から影響を受ける腸の内側の腸内環境から成り立つ。このことから、実施形態の一態様に係る生体情報測定システムによれば、利用者の蠕動運動の情報と利用者の腸内環境の情報と基づいて、利用者の健康に関する提供情報やスコアを出力することで、腸の外壁の状態と腸の内側の状態とを考慮した利用者の健康に関する提供情報やスコアを出力できるため、より精度よく利用者の健康サポートを実施することができる。このように、実施形態の一態様に係る生体情報測定システムによれば、蠕動運動及び腸内環境の両方の検知を基に、利用者の健康に関する情報を推定することにより、利用者の健康に関する情報の適切な推定が可能となる。
実施形態の一態様に係る生体情報測定システムは、トイレ室に設置された大便器のボウル内に排出される排泄物の情報に基づいて、前記トイレ室の利用者の生体情報を測定する生体情報測定システムであって、大便を検知する第一検知部による検知結果と、排便ガスを検知する第二検知部による検知結果に基づいて、前記利用者の健康に関する提供情報またはスコアの少なくとも1つを推定する推定処理を実行し、前記推定処理の結果を外部に出力させる制御を実行する制御部と、を備えることを特徴とする。
腸の健康状態は、主にストレスや睡眠、感染症などから影響を受ける腸の外壁の蠕動運動と、主に食事から影響を受ける腸の内側の腸内環境から成り立つ。また、蠕動運動は大便の情報に依存し、腸の内側の腸内環境は排便ガスの情報に依存する。このことから、実施形態の一態様に係る生体情報測定システムによれば、利用者の蠕動運動と関りの持つ大便の情報と利用者の腸内環境と関りの持つ排便ガスの情報と基づいて、利用者の健康に関する提供情報やスコアを出力することで、腸の外壁の状態と腸の内側の状態とを考慮した利用者の健康に関する提供情報やスコアを出力できるため、より精度よく利用者の健康サポートを実施することができる。このように、実施形態の一態様に係る生体情報測定システムによれば、大便及び排便ガスの両方の検知を基に、利用者の健康に関する情報を推定することで、利用者の健康に関する情報の適切な推定が可能となる。
実施形態の一態様に係る生体情報測定システムは、トイレ室に設置された大便器のボウル内に排出される排泄物の情報に基づいて、前記トイレ室の利用者の生体情報を測定する生体情報測定システムであって、腸の蠕動運動に関する情報を検知する第一検知部による検知結果と、腸内環境に関する情報を検知する第二検知部による検知結果とに基づいて、前記利用者の健康に関する提供情報またはスコアの少なくとも1つを推定する推定処理を実行し、前記推定処理の結果を外部に出力させる制御を実行する制御部と、を備えることを特徴とする。
腸の健康状態は、主にストレスや睡眠、感染症などから影響を受ける腸の外壁の蠕動運動と、主に食事から影響を受ける腸の内側の腸内環境から成り立つ。また、蠕動運動は大便の情報に依存し、腸の内側の腸内環境は排便ガスの情報に依存する。このことから、実施形態の一態様に係る生体情報測定システムによれば、利用者の蠕動運動と関りの持つ大便の情報と利用者の腸内環境と関りの持つ排便ガスの情報と基づいて、利用者の健康に関する提供情報やスコアを出力することで、腸の外壁の状態と腸の内側の状態とを考慮した利用者の健康に関する提供情報やスコアを出力できるため、より精度よく利用者の健康サポートを実施することができる。このように、実施形態の一態様に係る生体情報測定システムによれば、大便及び排便ガスの両方の検知を基に、利用者の健康に関する情報を推定することで、利用者の健康に関する情報の適切な推定が可能となる。
実施形態の一態様によれば、利用者の健康に関する情報を適切に推定することができる。
以下、添付図面を参照して、本願の開示する生体情報測定システムの実施形態を詳細に説明する。なお、以下に示す実施形態によりこの発明が限定されるものではない。
<1.実施形態>
以下に説明する各実施形態に係る生体情報測定システムでは、大便を検知する検知部である第一検知部21の検知結果と、排便ガスを検知する検知部である第二検知部22の検知結果とに基づき推定した利用者の健康に関する情報を管理する。以下の例では、ラインセンサを有し画像を生成する撮像装置を第一検知部21の一例とし、半導体式ガスセンサを有するガス検出装置を第二検知部22の一例として説明する。なお、第一検知部21及び第二検知部22は、各々の所望の情報を取得(検知)可能であれば、任意の構成が採用可能であるが、この点については後述する。なお、ここでいう排便ガスとは、腸から出るガスであり、例えば、排便ガスには、排便と同時に出てくるガスや排便と同時に排出されないガスも含まれる。
以下に説明する各実施形態に係る生体情報測定システムでは、大便を検知する検知部である第一検知部21の検知結果と、排便ガスを検知する検知部である第二検知部22の検知結果とに基づき推定した利用者の健康に関する情報を管理する。以下の例では、ラインセンサを有し画像を生成する撮像装置を第一検知部21の一例とし、半導体式ガスセンサを有するガス検出装置を第二検知部22の一例として説明する。なお、第一検知部21及び第二検知部22は、各々の所望の情報を取得(検知)可能であれば、任意の構成が採用可能であるが、この点については後述する。なお、ここでいう排便ガスとは、腸から出るガスであり、例えば、排便ガスには、排便と同時に出てくるガスや排便と同時に排出されないガスも含まれる。
以下では、画像及びガスの情報の収集場所となるトイレ室Rや生体情報測定システム1の概要について説明した後、生体情報測定システム1が実行する各種処理やその処理を行うための構成について説明する。
<1-1.トイレ室の構成例>
まず、実施形態に係る生体情報測定システムの構成について図1を参照して説明する。図1は、実施形態に係る生体情報測定システムの構成の一例を示す斜視図である。なお、図1では、測定装置4及び第一検知部21の構成を図示するために便座5や便蓋9を透過した態様で図示する。
まず、実施形態に係る生体情報測定システムの構成について図1を参照して説明する。図1は、実施形態に係る生体情報測定システムの構成の一例を示す斜視図である。なお、図1では、測定装置4及び第一検知部21の構成を図示するために便座5や便蓋9を透過した態様で図示する。
図1に示すように、トイレ室Rには、床面Fに、便器7が設置される。なお、以下では、床面Fからトイレ室Rの空間内に臨む向きを上と記載する場合がある。トイレ室Rには、吸引装置10及びガス検出装置である第二検知部22を含むガス検出を行う測定装置4及び第一検知部21等の生体情報測定システム1の構成要素が配置される。
便器7は、大便器であり、便器7には、ボウル部8が形成される。ボウル部8は、下方に凹んだ形状であり、利用者の排泄物を受ける部位である。なお、便器7は、図示のような床置き式に限らず、生体情報測定システム1を適用可能であれば、どのような形式でもよく、壁掛け式等のような形式であってもよい。便器7には、ボウル部8が臨む開口の端部の全周にわたってリム部が設けられる。トイレ室Rには、例えば、便器7付近に洗浄水を貯留する洗浄水タンクが設置されてもよいし、洗浄水タンクが設置されない、いわゆるタンクレス式でもよい。
例えば、トイレ室Rに設けられた洗浄用の洗浄操作部(図示省略)が利用者により操作されると、便器7のボウル部8への洗浄水の供給による便器洗浄が実施される。洗浄操作部は操作レバーや、操作装置30に表示された便器洗浄オブジェクトに対するタッチ操作であってもよい。なお、洗浄操作部は、操作レバーなどのような利用者の手動によって便器洗浄を実施させるものに限らず、着座センサのような利用者を検知するセンサの人体検知によって便器洗浄を実施させるものでもよい。
便座装置2は、便器7の上部に取り付けられ、本体部3と、測定装置4と、便座5と、洗浄ノズル6と、第一検知部21とを備える。なお、測定装置4及び第一検知部21は、便座装置2とは別装置として設けられてもよいが、この点については後述する。便座装置2は、排泄物を受けるボウル部8が形成された便器7の上部に載置される。便座装置2は、洗浄ノズル6が洗浄水を噴射する前にボウル部8に進出するように便器7の上部に載置される。なお、便座装置2は、便器7に対して着脱可能に取り付けられてもよいし、便器7と一体化するように取り付けられてもよい。
便座装置2は、測定装置4等の構成により、トイレ室Rに設置された便器7のボウル部8内に排出される排便ガスに基づいて、トイレ室Rの利用者の生体情報を測定する。測定装置4は、吸引装置10と第二検知部22とを有する。便座装置2は、第一検知部21等の構成により、トイレ室Rに設置された便器7のボウル部8内に排出される大便に基づいて、トイレ室Rの利用者の生体情報を測定する。なお、測定装置4及び第一検知部21については図2で詳述する。
図1に示すように、便座5は、環状に形成され、ボウル部8の端部(リム部)に沿って、便器7の開口に重なる位置に配置される。便座5は、利用者が着座する。便座5は、着座した利用者の臀部を支持する着座部として機能する。また、便蓋9は、便座装置2に必要に応じて取り付けられ、便座装置2は、便蓋9を有しなくてもよい。
洗浄ノズル6は、洗浄用の水を吐水するためのノズルである。洗浄ノズル6は、電動モータなどの駆動源(図5中のノズルモータ61等)の駆動により、本体部3の筐体に対して進退可能に構成される。また、洗浄ノズル6は、図示しない水道管などの水源に接続される。そして、洗浄ノズル6は、図1に示すように、本体部3の筐体に対して進出した位置(「進出位置」ともいう)にあるときに、水源からの水を利用者の身体へ噴出させて局部を洗浄する。
図1では、洗浄ノズル6が進出位置にある状態を示す。なお、洗浄ノズル6は、便器7(ボウル部8等)内の洗浄用にも共用されてもよい。洗浄ノズル6は、利用者の局部を洗浄する局部洗浄モードと、便器7内に水を撒く便器洗浄モードとを切り替え可能に用いられてもよい。例えば、洗浄ノズル6は、便座装置2による制御に応じて、局部洗浄モードと便器洗浄モードとを切り替え可能に用いられてもよい。
操作装置30は、トイレ室R内に設けられる。操作装置30は、利用者が操作可能な位置に設けられる。操作装置30は、利用者が便座5に着座時において、操作可能な位置に設けられる。図1では、操作装置30は、便座5に着座した利用者から見て左側方の壁面Wに配置される。なお、操作装置30は、便座5に着座した利用者が利用可能であれば、壁面に限らず、種々の態様により配置されてもよい。例えば、操作装置30は、便座装置2と一体に設けられてもよい。
操作装置30は、便座装置2と所定のネットワークを介して、有線または無線により通信可能に接続される。例えば、便座装置2と操作装置30とは、情報の送受信が可能であれば、どのような接続であってもよく、有線により通信可能に接続されてもよいし、無線により通信可能に接続されてもよい。
操作装置30は、例えばタッチパネル機能により表示面(例えば表示画面31)を介して利用者からの各種操作を受け付ける。また、操作装置30は、スイッチやボタンを備え、スイッチやボタン等により各種操作を受け付けてもよい。表示画面31は、例えば液晶ディスプレイや有機EL(Electro-Luminescence)ディスプレイ等によって実現されるタブレット端末等の表示画面であり、各種情報を表示するための表示装置である。つまり、操作装置30は、表示画面31により利用者の入力を受け付け、利用者への出力も行う。表示画面31は、各種情報を表示する表示装置である。
操作装置30は、トイレ室R内で提供される各種機能を制御するための利用者(ユーザ)の操作を受け付ける。操作装置30は、便座装置2による局部洗浄の実行を制御するための利用者の操作を受け付ける。例えば、操作装置30は、上述した利用者の操作を受け付けるスイッチやボタン等を有し、スイッチやボタン等に対する利用者の接触に応じて、各種処理を実行してもよい。なお、上記は一例であり、操作装置30は、各種処理を実行する利用者による操作を受け付けてもよい。また利用者のスマートフォン等の利用者端末(図3中の表示装置300に相当)が操作装置30と同等の機能を有していても良い。
生体情報測定システム1は、後述する各種の構成や処理により、トイレ室Rに設置された便器7のボウル部8内に排出される大便及び排便ガスに基づいて、トイレ室Rの利用者の生体情報を測定する。生体情報測定システム1は、大便及び排便ガスを適切に測定するために制御を実行する。生体情報測定システム1は、測定等により収集した情報を基に、利用者のスマートフォン等の利用者端末(図3中の表示装置300に相当)に情報提供を行う。また、生体情報測定システム1は測定等により収集した情報を基に、トイレ室Rの操作装置30(もしくは表示画面31)へ情報提供を行っても良い。
<1-2.測定装置の構成>
次に、測定装置4の構成について図2を参照して説明する。図2は、実施形態に係る測定装置の構成の一例を示す平面図である。図2に示す例では、測定装置4及び第一検知部21は、本体部3内に配置される場合を一例として示す。図2では、測定装置4及び第一検知部21が配置される箇所の本体部3の筐体(カバー)を取り除いて測定装置4及び第一検知部21の構成を図示する。
次に、測定装置4の構成について図2を参照して説明する。図2は、実施形態に係る測定装置の構成の一例を示す平面図である。図2に示す例では、測定装置4及び第一検知部21は、本体部3内に配置される場合を一例として示す。図2では、測定装置4及び第一検知部21が配置される箇所の本体部3の筐体(カバー)を取り除いて測定装置4及び第一検知部21の構成を図示する。
測定装置4は、便器7のボウル部8内のガスを吸引する吸引装置10と、吸引されたガスの成分を検出する第二検知部22とを有する。
吸引装置10は、便器7のボウル部8内のガスを吸引するためのファンを有する。吸引装置10は、便器7のボウル部8内に連通するダクト11が接続される。ダクト11は、ボウル部8内のガスを測定装置4へ流入させる流路として機能する。吸引装置10は、ファンを駆動させることにより、ダクト11を流路としてボウル部8内のガスを吸引する。例えば、吸引装置10は、制御装置100の制御に応じて吸引に関する処理を実行する。なお、吸引装置10が便座装置2に組み込まれている脱臭装置等と共用される場合、吸引装置10は制御装置100とは別の制御手段(装置)により制御されてもよい。
第二検知部22は、排便ガスを検知する。第二検知部22は、腸内環境に関する情報を検知する。第二検知部22は、吸引装置10により吸引されたガスの成分の検出に関する処理を実行する。図2では、第二検知部22は、ボウル部8側から見て吸引装置10の後段に配置される。なお、図2は一例に過ぎず、第二検知部22は、吸引装置10が吸引したガスを導入可能な位置であれば任意の位置に配置されてもよい。第二検知部22は、本体部3外に連通するダクト12が接続される。ダクト12は、第二検知部22内のガスを測定装置4から流出させる流路として機能する。例えば、吸引装置10の駆動に応じて、第二検知部22内のガスがダクト12を流路として測定装置4外へ放出される。
例えば、第二検知部22は、制御装置100の制御に応じてガスの検出に関する処理を実行する。第二検知部22は、気体に含まれるガスに反応するガスセンサ40を備える。ガスセンサ40は、ガスの特定の成分を検出する。例えば、ガスセンサ40は、半導体式ガスセンサが用いられる。なお、上記は一例に過ぎず、ガスセンサは、半導体式のガスセンサ40に限らず、任意の態様のセンサが複数種用いられてもよい。なお、ガスセンサ40は、半導体式+赤外線吸収式等、複数の原理のセンサを組み合わせた一つのユニットとして用いてもより。例えば、ガスセンサ40は、利用者の腸内環境を示す排便ガスを検知するが、この点については後述する。
第一検知部21は、大便を検知する。第一検知部21は、腸の蠕動運動に関する情報を検知する。第一検知部21は、便器7のボウル部8内を撮像することにより、利用者が排泄した大便(排便)を検知する。第一検知部21は、イメージセンサである。第一検知部21は、受光部50を有する。例えば、受光素子は、CCD(Charge Coupled Device)センサ、またはCMOS(Complementary Metal Oxide Semiconductor)センサが一列に並べられたラインセンサである。なお、受光素子は、ラインセンサ(一次元のイメージセンサ)に限らず、エリアセンサ(二次元のイメージセンサ)等の各種のセンサが用いられてもよい。なお、第一検知部21は、所定の波長の光を放射する構成(図7の発光素子51等)を有してもよいが、この点については後述する。
図2では、第一検知部21の受光部50は、便器7のボウル部8内の領域AD1からの光を受光するように配置される。例えば、受光部50は、便器7のボウル部8内を落下する大便からの反射光を受光するように配置される。第一検知部21による落下中の大便の撮像については、図7で説明する。なお、第一検知部21の受光部50は、落下中に限らず、大便の性状の推定(判定)に必要な情報を取得可能であれば、着水後の便など、任意の状態の大便を検知してもよい。
例えば、受光部50は、落下後の大便を検知してもよい。この場合、受光部50は、便器7の封水部(例えばボウル部8の封水が溜まる部分)を撮影するように配置されてもよい。受光部50は、エリアセンサ(二次元のイメージセンサ)であってもよい。このように、第一検知部21は、便器7内に排泄される便の検知が可能であり、所望の情報が推定可能であれば、どのような場所に配置されてもよく、どのようなイメージセンサが用いられてもよい。
<1-3.生体情報測定システムの全体概要例>
次に、生体情報測定システム1の全体概要の一例について、図3及び図4を参照して説明する。図3は、実施形態に係る生体情報測定システムの全体概要の一例を示す図である。図4は、実施形態に係る生体情報測定システムの構成例を示す図である。なお、図3及び図4では、生体情報測定システム1の構成のうち説明に必要な一部のみ図示し、上述した内容と同様の点については適宜説明を省略する。
次に、生体情報測定システム1の全体概要の一例について、図3及び図4を参照して説明する。図3は、実施形態に係る生体情報測定システムの全体概要の一例を示す図である。図4は、実施形態に係る生体情報測定システムの構成例を示す図である。なお、図3及び図4では、生体情報測定システム1の構成のうち説明に必要な一部のみ図示し、上述した内容と同様の点については適宜説明を省略する。
図4に示すように、生体情報測定システム1は、第一検知部21、第二検知部22及び制御装置100等の構成を有する便座装置2と、表示装置300と、サーバ装置400とを有する。生体情報測定システム1には、複数の便座装置2や、複数の表示装置300や、複数のサーバ装置400が含まれてもよい。
便座装置2は、トイレ室R内に配置される装置である。便座装置2は、表示装置300やサーバ装置400等の他の装置との間で通信する。なお、便座装置2は、トイレ室R内の便器7を利用して排泄を行う利用者を特定するための情報を取得する処理(個人識別)を行ってもよい。便座装置2は、個人識別により、家族等の複数の利用者の各々の情報を区別して収集する。例えば、便座装置2は、利用者が所有する表示装置300との通信や、操作装置30に対する利用者の操作等により、便器7を利用して排泄を行う利用者を特定するための情報を取得し、利用者の個人識別を行う。例えば、便座装置2は、利用者が所有する表示装置300との通信し、表示装置300から利用者を特定するための利用者識別情報である利用者ID(単に「ID」ともいう)を受信する。なお、便座装置2は、トイレ室Rの便器7を利用して排泄を行う利用者を特定が可能であれば、どのような方法により利用者の特定を行ってもよい。
図3に示すように、第一検知部21は、受光部50を有し、大便を検知する。また、第二検知部22は、ガスセンサ40を有し、排便ガスを検知する。また、制御装置100は、第一検知部21の検知結果及び第二検知部22の検知結果に基づいて、利用者の健康に関する情報を推定する処理(「推定処理」ともいう)を実行し、推定処理の結果を外部に出力させる制御を実行するコンピュータ(情報処理装置)である。なお、制御装置100は、推定処理により、利用者の健康に関する提供情報またはスコア(以下「腸スコア」ともいう)を推定するが、この点については後述する。
また、制御装置100は、表示装置300等の利用者への情報を表示する装置と、Bluetooth(登録商標)、BLE(Bluetooth Low Energy)、赤外線等の近距離無線通信の機能により表示装置300と通信する。制御装置100は、ネットワークNを介さずに表示装置300と通信可能であってもよい。なお、制御装置100は、情報の送受信が可能であれば、表示装置300等の装置とどのように接続されてもよく、例えばインターネット等の所定のネットワーク(ネットワークN等)を介して、有線または無線により通信可能に接続されてもよい。
なお、図4では便座装置2が第一検知部21、第二検知部22及び制御装置100を有する場合を示すが、これに限られない。例えば、制御装置100は、第一検知部21及び第二検知部22とは別に設けられ、第一検知部21及び第二検知部22と無線または有線により通信することにより、第一検知部21及び第二検知部22を制御し、各情報を取得してもよい。
また、制御装置100は、トイレ室R外に位置する装置であってもよい。この場合、制御装置100は、便座装置2、第一検知部21、第二検知部22等のトイレ室R内に配置される装置とインターネット等の所定のネットワーク(ネットワークN等)を介して、有線または無線により通信可能に接続され、所望の情報を取得可能であってもよい。
また、第一検知部21及び第二検知部22は、制御装置100とは別の制御手段により制御されてもよい。この場合、制御装置100は、推定処理等の各種の情報処理を実行する第1制御装置であり、生体情報測定システム1は、制御装置100とは別装置である第2制御装置を、第一検知部21及び第二検知部22を制御する装置として有してもよい。このように、生体情報測定システム1は、第一検知部21及び第二検知部22からの情報を用いて推定処理等の各種の情報処理を実行する第1制御装置である制御装置100と、第一検知部21及び第二検知部22を制御する第2制御装置である検知部制御装置とを有してもよい。
例えば、第1制御装置と第2制御装置とはインターネット等の所定のネットワーク(ネットワークN等)を介して、有線または無線により通信可能に接続され、第1制御装置は、第2制御装置から受信した第一検知部21の検知結果及び第二検知部22の検知結果情報を用いて推定処理を実行してもよい。例えば、第1制御装置は、生体情報測定システム1の管理者等が携帯可能なスマートフォンやノートパソコン等の携帯端末(デバイス)であってもよい。
表示装置300は、利用者へ提供する情報を表示する表示装置(コンピュータ)である。例えば、表示装置300は、利用者(ユーザ)が所有する利用者端末(携帯端末)であってもよい。この場合、表示装置300は、例えば、スマートフォンや、携帯電話機や、PDA(Personal Digital Assistant)、タブレット型端末や、ノート型PC(Personal Computer)等により実現される。例えば、表示装置300は、制御装置100等の生体情報測定システム1に含まれる装置と所定のネットワーク(ネットワークN等)を介して、有線または無線により通信可能に接続される。
表示装置300は、制御装置100との間で情報を送受信する。表示装置300は、利用者に提供する情報を制御装置100から受信する。表示装置300は、制御装置100の推定処理により推定された利用者の健康に関する情報を受信する。表示装置300は、利用者の健康に関する提供情報またはスコア(腸スコア)を利用者の健康に関する情報として受信する。表示装置300は、制御装置100から受信した利用者の健康に関する情報を表示する。なお、表示装置300が表示する情報の例については後述する。
図3に示すように、サーバ装置400は、クラウドサーバ等のコンピュータである。サーバ装置400は、表示装置300等の装置と、インターネット等の所定のネットワーク(ネットワークN等)を介して、有線または無線により通信可能に接続される。なお、サーバ装置400は、情報の送受信が可能であれば、表示装置300等の装置とどのように接続されてもよく、有線により通信可能に接続されてもよいし、無線により通信可能に接続されてもよい。またサーバ装置400は制御装置100等と通信可能に接続され、測定による生データを受け取り、データ処理を行って表示装置300に結果を送信しても良い。
サーバ装置400は、表示装置300から収集した情報を記憶部に記憶する。サーバ装置400は、利用者の健康に関する情報を利用者ごとに収集し、記憶部に記憶する。例えば、サーバ装置400は、利用者を識別する情報(ID等)に対応付けて、その利用者の健康に関する情報を記憶部に記憶する。
<1-3-1.生体情報測定システムの他の構成例>
なお、上記は一例に過ぎず、生体情報測定システム1は、所望の処理を実現可能であれば任意の装置構成が採用可能である。この点について、上記以外のシステム構成の一例について以下いくつか例示を記載する。
なお、上記は一例に過ぎず、生体情報測定システム1は、所望の処理を実現可能であれば任意の装置構成が採用可能である。この点について、上記以外のシステム構成の一例について以下いくつか例示を記載する。
また、生体情報測定システム1は、大便を検知する第一検知部と、排便ガスを検知する第二検知部との少なくとも1つを有しなくてもよい。この場合、制御装置100は、生体情報測定システム1に含まれない検知部から情報を受信し、受信した情報を用いて推定処理等の各種の情報処理を実行する。例えば、生体情報測定システム1は、測定装置4と第一検知部21との少なくとも1つを有しなくてもよい。
例えば、生体情報測定システム1が測定装置4を有しない場合、生体情報測定システム1の制御装置100は、測定装置4と有線または無線により通信可能に接続され、測定装置4から第二検知部22により検知された排便ガスに関する情報を受信する。この場合、生体情報測定システム1の制御装置100は、生体情報測定システム1に含まれない測定装置4から受信した排便ガスに関する情報を用いて、推定処理を実行する。
例えば、生体情報測定システム1が第一検知部21を有しない場合、生体情報測定システム1の制御装置100は、第一検知部21と有線または無線により通信可能に接続され、第一検知部21から第一検知部21により検知された大便に関する情報を受信する。この場合、生体情報測定システム1の制御装置100は、生体情報測定システム1に含まれない第一検知部21から受信した排便ガスに関する情報を用いて、推定処理を実行する。
なお、生体情報測定システム1が測定装置4及び第一検知部21の両方を有しない場合、生体情報測定システム1の制御装置100は、測定装置4から受信した排便ガスに関する情報、及び第一検知部21から受信した大便に関する情報を用いて、推定処理を実行する。
また、生体情報測定システム1は、検知された情報を取得し、取得した情報を用いて推定処理を実行する構成のみを有してもよい。この場合、生体情報測定システム1は、制御装置100のみを有し、制御装置100は、他の装置と通信することにより、所望の情報を取得(受信)し、取得した情報を用いて推定処理等の各種の情報処理を実行し、所望の情報を他の装置へ送信してもよい。
また、表示装置300は、生体情報測定システム1に含まれなくてもよいし、生体情報測定システム1に含まれてもよい。例えば、表示装置300がトイレ室Rの操作装置30である場合、表示装置300は、生体情報測定システム1に含まれてもよい。この場合、操作装置30が利用者の健康に関する情報を表示する機能を有する。
また、生体情報測定システム1におけるサーバ装置400の装置構成及び配置は、表示装置300等の装置と通信し、処理が実現可能であれば、任意の形態が採用可能である。例えば、サーバ装置400は、図3に示すようにクラウド上で構成される場合、複数のコンピュータ(サーバ)により構成されてもよい。例えば、サーバ装置400は、生体情報測定システム1の管理者等が携帯可能なノートパソコン等の携帯端末(デバイス)であってもよい。また、サーバ装置400は、トイレ室R内に配置されてもよい。
<1-4.便座装置の機能構成>
次に、便座装置2の機能構成について図5を参照して説明する。図5は、実施形態に係る便座装置の構成の一例を示すブロック図である。図5に示すように、便座装置2は、人感センサ32と、着座センサ33と、照度センサ34と、制御装置100と、ノズルモータ61と、洗浄ノズル6とを備える。
次に、便座装置2の機能構成について図5を参照して説明する。図5は、実施形態に係る便座装置の構成の一例を示すブロック図である。図5に示すように、便座装置2は、人感センサ32と、着座センサ33と、照度センサ34と、制御装置100と、ノズルモータ61と、洗浄ノズル6とを備える。
なお、図5に示す便座装置2の構成は一例に過ぎず、各構成が個別に設けられる場合、便座装置2は、便座5のみを有してもよい。このように、図5に示す便座装置2の構成は一例に過ぎず、便座装置2は、任意の構成が採用可能である。人感センサ32や着座センサ33や照度センサ34等は、所望のセンシングが可能であれば任意の箇所に配置されてもよい。また、便座装置2は、利用者の便座5への着座を検知可能であればよく、人感センサ32、着座センサ33及び照度センサ34のうち少なくとも1つを有すればよい。便座装置2は、通信装置(例えば図6中の制御装置100の通信部110等)により、所定のネットワーク(インターネット等)を介して、有線または無線で表示装置300及びサーバ装置400等の情報処理装置との間で情報の送受信を行う。
人感センサ32は、人体を検知する機能を有する。例えば、人感センサ32は、利用者の便座5への着座を検知する着座検知手段として用いられる。例えば、人感センサ32は、赤外線信号を用いた焦電センサ等により実現される。例えば、人感センサ32は、μ(マイクロ)波センサ等により実現されてもよい。例えば、人感センサ32は、赤外線投受光式の測距センサであり、人(利用者)が便座5に着座する直前において便座5の付近に存在する人体や、便座5に着座した利用者を検知してもよい。
人感センサ32は、利用者による便座5からの離座を検知する離座検知センサとしても機能する。人感センサ32は、便座5に対する利用者の着座状態を検知する。人感センサ32は、検知信号を制御装置100へ出力する。なお、上記は一例であり、人感センサ32は、上記に限らず、種々の手段により人体を検知してもよい。例えば、人感センサ32は、便座5へ接近した人(利用者など)を検知する。
着座センサ33は、便座装置2への人の着座を検知する機能を有する。例えば、着座センサ33は、利用者の便座5への着座を検知する着座検知手段として用いられる。例えば、着座センサ33は、荷重センサ等により実現される。着座センサ33は、利用者が便座5に着座したことを検知する。着座センサ33は、便座5に対する利用者による着座を検知可能である。
着座センサ33は、利用者による便座5からの離座を検知する離座検知センサとしても機能する。着座センサ33は、便座5に対する利用者の着座状態を検知する。なお、上記は一例であり、着座センサ33は、上記に限らず、種々の手段により便座装置2への人の着座を検知してもよい。着座センサ33は、着座検知信号を制御装置100へ出力する。
照度センサ34は、照度を検知するセンサである。例えば、照度センサ34は、利用者の便座5への着座を検知する着座検知手段として用いられる。例えば、照度センサ34は、ボウル部8を臨む位置に配置され、ボウル部8内の照度を検知する。
照度センサ34は、利用者による便座5からの離座を検知する離座検知センサとしても機能する。照度センサ34は、便座5に対する利用者の着座状態を検知する。なお、上記は一例に過ぎず、照度センサ34は、照度により利用者の便座5への着座が検知可能であれば、どのような位置に配置されてもよい。
制御装置100は、各種構成や処理を制御する。制御装置100は、大便及びガスの検知(測定)等に関する各種の情報処理を実行するコンピュータ(情報処理装置)である。制御装置100は、制御に必要な構成を有すればどのような装置であってもよく、例えばマイクロコンピュータ等であってもよい。
制御装置100は、大便を検知(測定)するための各種構成を制御する。制御装置100は、第一検知部21を制御する。制御装置100は、受光部50の電子シャッタの機能を制御するための制御情報を第一検知部21に送信する。なお、受光部50のシャッタの機能は、電子シャッタに限らず、所望の検知が可能であれば、機械的なシャッタ等の任意の方式が採用可能である。また、制御装置100は、第一検知部21が発光素子等の発光部を有する場合、発光部の点灯や消灯を制御するための制御情報を第一検知部21に送信してもよい。
例えば、制御装置100は、第一検知部21に発光及び受光を行わせる。制御装置100は、第一検知部21を制御して、発光部に光を照射させ、受光部50により受光を行わせる。制御装置100は、着座センサ33によって利用者による便座5への着座が検知されている期間において、第一検知部21に発光及び受光を行わせる。
制御装置100は、ガスを検知(測定)するための各種構成を制御する。制御装置100は、第二検知部22を制御する。制御装置100は、有線により、第二検知部22に制御情報を送信する。なお、制御装置100は、無線により、第二検知部22に制御情報を送信してもよい。例えば、制御装置100は、便座装置2と別装置として構成される場合、無線により、第二検知部22の制御情報を便座装置2へ送信してもよい。この場合、便座装置2の制御装置が受信した制御情報を基に第二検知部22を制御してもよい。
例えば、制御装置100は、利用者の便器7の使用時以外の間にガスセンサ40による測定値があらかじめ決められた範囲内の値となるように第二検知部22を制御し、基準値(ベースライン)として用いられる測定値を所定の値に制御する基準値制御を実行してもよい。制御装置100は、ガスセンサ40の抵抗素子の抵抗値を変更することにより、基準値を所定の値に制御する基準値制御を実行してもよい。
また、制御装置100は、吸引装置10を制御してもよい。例えば、制御装置100は、吸引装置10の吸引の開始や停止を制御する。制御装置100は、有線により、吸引装置10に制御情報を送信する。なお、制御装置100は、無線により、吸引装置10に制御情報を送信してもよい。例えば、制御装置100は、便座装置2と別装置として構成される場合、無線により、吸引装置10の制御情報を便座装置2へ送信してもよい。この場合、便座装置2の制御装置が受信した制御情報を基に吸引装置10を制御してもよい。
また、制御装置100は、上記以外にも生体情報測定システム1の各種構成を制御しても良い。制御装置100は、ノズルモータ61等を制御する。制御装置100は、操作装置30から送信された信号に基づいて、ノズルモータ61等を制御する。
制御装置100は、操作装置30から送信された局部洗浄に関する制御指示の信号に基づいて、ノズルモータ61を制御する。制御装置100は、洗浄ノズル6を進退させるためにノズルモータ61を制御する。なお、制御装置100は、ノズルモータ61に限らず、様々な機構の制御を行ってもよい。例えば、制御装置100は、流体の流れを電磁的方法により制御する弁(バルブ)の機能を有する電磁弁の開閉を制御する。例えば、制御装置100は、電磁弁を制御することにより、例えば給水管からの水道水の供給および停止を切り替える。
制御装置100は、有線により、ノズルモータ61等に制御情報を送信する。なお、制御装置100は、無線により、ノズルモータ61等に制御情報を送信してもよい。例えば、制御装置100は、便座装置2と別装置として構成される場合、無線により、ノズルモータ61等の制御情報を便座装置2へ送信してもよい。この場合、便座装置2の制御装置が受信した制御情報を基にノズルモータ61等を制御してもよい。
ノズルモータ61は、洗浄ノズル6を進退駆動する駆動源(モータ)である。ノズルモータ61は、洗浄ノズル6を本体部3に対して進退させる制御を実行する。ノズルモータ61は、制御装置100からの指示に応じて洗浄ノズル6を進退させる制御を実行する。
また、制御装置100は、図1に示すような便蓋9や便座5を制御してもよい。この場合、制御装置100は、操作装置30から送信された信号に基づいて、便蓋9や便座5を制御する。制御装置100は、操作装置30から送信された便蓋開閉に関する制御指示の信号に基づいて、便蓋9を制御する。制御装置100は、操作装置30から送信された着座部開閉に関する制御指示の信号に基づいて、便座5を制御する。制御装置100は、有線により、便蓋9や便座5に制御情報を送信する。なお、制御装置100は、無線により、便蓋9や便座5に制御情報を送信してもよい。
制御装置100は、人感センサ32、着座センサ33及び照度センサ34等の着座検知手段による利用者の着座が検知されたか否かを判定する。例えば、制御装置100は、着座センサ33の検知により利用者の着座が検知されたか否かを判定する。
図5に示す構成では、便座装置2に、制御装置100等が含まれる構成を一例として示したが、制御装置100、人感センサ32、着座センサ33及び照度センサ34等は、便座装置2とは別装置として構成されてもよい。例えば、制御装置100は、便座装置2とは別装置で構成されてもよい。例えば、制御装置100は、サーバ装置であり、便座装置2から離間した位置に配置されてもよい。この場合、制御装置100は、便座装置2、人感センサ32、着座センサ33及び照度センサ34等の各装置と通信し、各種の情報を各装置から受信する。また、この場合、便座装置2は、ノズルモータ61等の便座装置2の各種構成を制御するための構成(制御回路等)を有してもよい。なお、上記は一例に過ぎず、生体情報測定システム1は、所望の処理が可能であれば、任意の装置構成が採用可能である。
<1-5.制御装置の機能構成>
以下、制御装置の機能構成について図6を参照して説明する。図6は、実施形態に係る制御装置の構成の一例を示すブロック図である。図6に示すように、制御装置100は、通信部110と、記憶部120と、制御部130とを有する。なお、制御装置100の構成は、図6に示した構成に限られず、所望の処理を実現可能であれば他の構成であってもよい。例えば、制御装置100は、通信部110を有しなくてもよい。
以下、制御装置の機能構成について図6を参照して説明する。図6は、実施形態に係る制御装置の構成の一例を示すブロック図である。図6に示すように、制御装置100は、通信部110と、記憶部120と、制御部130とを有する。なお、制御装置100の構成は、図6に示した構成に限られず、所望の処理を実現可能であれば他の構成であってもよい。例えば、制御装置100は、通信部110を有しなくてもよい。
通信部110は、例えば、通信回路等によって実現される。通信部110は、所定のネットワークと有線または無線で接続され、外部の情報処理装置との間で情報の送受信を行う。例えば、通信部110は、所定のネットワークと有線または無線で接続され、操作装置30等の他の装置との間で情報の送受信を行う。なお、通信部110は、制御装置100とは別装置(通信装置)として構成され、便座装置2が有してもよい。
記憶部120は、例えば、RAM(Random Access Memory)、フラッシュメモリ等の半導体メモリ素子、または、ハードディスク、光ディスク等の記憶装置によって実現される。例えば、記憶部120は、各種の情報処理のプログラム等によって使用されるデータ等を非一時的に記録するコンピュータが読み取り可能な記録媒体である。
実施形態に係る記憶部120は、処理に必要な様々な情報を記憶する。記憶部120は、各種センサ等の他の装置から取得した各種情報を記憶する。記憶部120は、各種の情報処理で用いる様々な情報を記憶する。例えば、記憶部120は、目標値等の基準値制御に関する情報を記憶する。
記憶部120は、大便の性状等、大便に関する推定処理に用いる様々な情報を記憶する。例えば、記憶部120は、大便に関する推定処理に用いる閾値を記憶する。例えば、記憶部120は、大便の性状に関する推定に用いる各種のモデル(「推定モデル」ともいう)を記憶する。例えば、記憶部120は、便の形状、色、量等の推定に用いる各種の推定モデルを記憶する。なお、上記は一例に過ぎず、記憶部120は、大便の検知に関する様々な情報を記憶する。
記憶部120は、ガスの量または濃度等、ガスに関する推定処理に用いる様々な情報を記憶する。例えば、記憶部120は、ガスに関する推定処理に用いる閾値を記憶する。例えば、記憶部120は、ガスの量または濃度の推定(算出)に用いる各種の関数(「ガス推定関数」ともいう)を記憶する。例えば、記憶部120は、所定の成分のガスの量または濃度等の推定に用いる各種のガス推定関数を記憶する。例えば、記憶部120は、所定の成分のガスの量または濃度から排便ガスの評価を算出(推定)する関数(「評価推定関数」ともいう)を記憶する。なお、上記は一例に過ぎず、記憶部120は、ガスの検知に関する様々な情報を記憶する。
図6に戻り、説明を続ける。制御部130は、例えば、MPU(Micro Processing Unit)やCPU(Central Processing Unit)等によって、制御装置100内部に記憶されたプログラム(例えば、本開示に係る各種の情報処理のプログラム等)がRAM等を作業領域として実行されることにより実現される。また、制御部130は、例えば、ASIC(Application Specific Integrated Circuit)やFPGA(Field Programmable Gate Array)等の集積回路により実現されてもよい。
図6に示すように、制御部130は、取得部131と、処理部132と、出力部133とを有し、以下に説明する情報処理の機能や作用を実現または実行する。なお、制御部130の内部構成は、図6に示した構成に限られず、後述する情報処理を行う構成であれば他の構成であってもよい。
取得部131は、各種情報を取得する。取得部131は、記憶部120から各種情報を取得する。取得部131は、他の装置から情報を受信する。取得部131は、各種のセンサが検知した情報(検知情報等)を各種のセンサから受信する。
取得部131は、着座検知手段により検知された情報(検知情報等)を着座検知手段から取得する。取得部131は、人感センサ32、着座センサ33及び照度センサ34のうち少なくとも1つのセンサが検知した情報(検知情報等)をそのセンサから受信する。
取得部131は、大便を検知する第一検知部21による検知結果を取得する。取得部131は、腸の蠕動運動に関する情報を検知する第一検知部21による検知結果を取得する。取得部131は、排便ガスを検知する第二検知部22による検知結果を取得する。取得部131は、腸内環境に関する情報を検知する第二検知部22による検知結果を取得する。
取得部131は、第一検知部21から第一検知部21による検知に基づく情報を受信する。取得部131は、第一検知部21が検知した大便に関する検知結果を示す情報を受信する。また、取得部131は、第二検知部22から第二検知部22による検知に基づく情報を受信する。取得部131は、第二検知部22が検知した排便ガスに関する検知結果を示す情報を受信する。
処理部132は、各種の処理を行う。処理部132は、記憶部120に記憶された情報を用いて、各種の処理を行う。処理部132は、推定処理を行う。処理部132は、記憶部120に記憶された各種の情報を用いて推定処理を行う。
処理部132は、第一検知部21の検知結果及び第二検知部22の検知結果に基づいて、利用者の健康に関する提供情報またはスコアの少なくとも1つを推定する推定処理を実行する。処理部132は、推定処理の結果を外部に出力させる制御を実行する。処理部132は、出力部133に指示することにより、推定処理の結果を出力部133に出力させる制御を実行する。
処理部132は、第一検知部21の検知結果から大便の性状に基づく第一の生体情報を推定する。処理部132は、第二検知部22の検知結果から排便ガスの量または濃度に基づく第二の生体情報を推定する。処理部132は、第一の生体情報及び第二の生体情報を出力するように制御を実行する。
処理部132は、第一検知部21の検知結果のサンプル数より第二検知部22の検知結果のサンプル数を多く用いて推定処理を実行する。処理部132は、1回のトイレ使用で得られたデータである第一検知部21の検知結果を用いて第一の生体情報を推定する。処理部132は、複数回のトイレ使用で得られたデータである第二検知部22の検知結果を用いて第二の生体情報を推定する。
処理部132は、第一検知部21の検知結果に基づく大便の性状の分類ごとに対応する第一評価が高い程、スコアを高く推定する。処理部132は、第二検知部22の検知結果に基づく第二評価が高い程スコアを高く推定する。
処理部132は、第一検知部21により検知された情報を用いて、推定処理を行う。処理部132は、第一検知部21が撮像した画像を用いて、推定処理を行う。処理部132は、第一検知部21により撮影された画像中に大便が含まれるかを推定(判定)する。処理部132は、画像認識に関する技術を用いて、画像中に大便が含まれるかを推定する。
例えば、処理部132は、画像を入力として、入力された画像中に大便が含まれるか否かを示す情報(スコア)を出力するモデル(大便推定モデル)を用いて、画像中に大便が含まれるかを推定する。この場合、処理部132は、画像が入力された大便推定モデルが出力するスコアと閾値(第1閾値)とを比較し、スコアが第1閾値以上である場合、その画像中に大便が含まれると推定する。また、処理部132は、画像が入力された大便推定モデルが出力するスコアと第1閾値とを比較し、スコアが第1閾値未満である場合、その画像中に大便が含まれないと推定する。なお、上記は一例に過ぎず、処理部132は、様々な情報を適宜用いて、画像に大便が含まれるか否かを推定してもよい。
処理部132は、第一検知部21よる検知結果から大便の性状を推定(分類)する。処理部132は、大便の性状の分類を第一の生体情報として推定する。処理部132は、第一検知部21により撮影された大便が含まれる画像(「便画像」ともいう)に基づいて、その便画像に対応する大便の性状を分類する。例えば、処理部132は、便画像を用いて、その便画像に対応する便の形状(単に「形」ともいう)を分類する。例えば、処理部132は、便画像を用いて、その便画像に対応する便の形を、ブリストルスケールに基づく複数の種別(7段階)に分類する。この場合、処理部132は、7段階のうち中央の段落(すなわち4段階目)であるバナナ状(普通便)が最も良い状態に対応し、そこから離れるにつれて悪い状態に対応する分類を行う。
処理部132は、便画像を用いて、その便画像に対応する便の形が、形に基づく複数段階のレベルのいずれかであるかを分類する。例えば、処理部132は、便画像を用いて、その便画像に対応する便の形が、コロコロ、カチカチ、ひび割れ、バナナ状、やわらか(半練り状)、泥状、及び水様(水状)のいずれかであるかを分類する。例えば、処理部132は、便画像の落下方向の長さや便(塊)の個数等の様々な情報(特徴量)に基づいて便の形状を分類(判断)してもよい。
処理部132は、AI(人工知能)に関する技術を用いて便の形状を分類してもよい。例えば、処理部132は、機械学習により生成された学習モデル(形状推定モデル)を用いて、便の形状を分類してもよい。この場合、形状推定モデルは、事前に分類判断を示す教師データにより学習される。この教師データには、便画像と、その便画像に含まれる塊(便)の形状(コロコロ、カチカチ、ひび割れ、バナナ状、やわらか、泥状、及び水様のいずれか)を示すラベル(正解情報)との組合せを複数含む。例えば、形状推定モデルは、便画像を入力とし、入力された便画像に含まれる塊(便)の形状を示す情報を出力するモデルである。例えば、形状推定モデルは、便画像が入力された場合に、入力された便画像に対応するラベル(便の形状)の情報を出力するように学習される。形状推定モデルの学習は、いわゆる教師あり学習に関する種々の手法を適宜用いて行われる。
この場合、形状推定モデルは記憶部120に格納され、処理部132は、記憶部120に格納された形状推定モデルを用いて、便の形状を分類してもよい。なお、制御装置100が学習処理を行い、各種の推定モデルを生成してもよいし、制御装置100は、サーバ装置400等の外部装置から各種の推定モデルを取得してもよい。また、上記は一例に過ぎず、処理部132は、様々な情報を適宜用いて、便の形状を分類してもよい。また、上記のコロコロ、カチカチ、ひび割れ、バナナ状、やわらか、泥状、及び水様の7段階は形状の一例に過ぎず、処理部132は、それ以外の形状を分類してもよいし、6段階以下に分類してもよい。また、ここでは便の形を複数段階のレベルのいずれかであるかを分類する例を示したが、その限りではなく、1度の排泄行為において、複数の便の形状が含まれる場合は、複数の便形状を分類してもよい。
また、処理部132は、大便の形状以外にも、様々な情報を推定してもよい。例えば、処理部132は、第一検知部21により撮影された画像を基に大便の量を推定(分類)してもよい。例えば、処理部132は、画像中に占める大便の割合を基に大便の量を分類する。例えば、処理部132は、大便推定モデルが出力するスコアを用いて、大便の量を分類してもよい。処理部132は、画像が入力された大便推定モデルが出力するスコアが第1閾値以上、第2閾値未満である場合、大便の量を「とても少ない」と分類してもよい。第2閾値は、第1閾値よりも大きい値であるものとする。また、処理部132は、画像が入力された大便推定モデルが出力するスコアが第2閾値以上、第3閾値未満である場合、大便の量を「少ない」と分類してもよい。第3閾値は、第2閾値よりも大きい値であるものとする。
また、処理部132は、画像が入力された大便推定モデルが出力するスコアが第3閾値以上、第4閾値未満である場合、大便の量を「中」と分類してもよい。第4閾値は、第3閾値よりも大きい値であるものとする。また、処理部132は、画像が入力された大便推定モデルが出力するスコアが第4閾値以上、第5閾値未満である場合、大便の量を「多い」と分類してもよい。第5閾値は、第4閾値よりも大きい値であるものとする。また、処理部132は、画像が入力された大便推定モデルが出力するスコアが第5閾値以上である場合、大便の量を「とても多い」と分類してもよい。なお、上記の5段階の分類は一例に過ぎず、処理部132は、様々な情報を適宜用いて、大便の量を分類してもよい。例えば、処理部132は、4つの閾値を用いて、3段階の分類を行ってもよい。
また、例えば、処理部132は、便画像を用いて、その便画像に対応する便の色を推定(分類)してもよい。処理部132は、便画像を用いて、その便画像に対応する便の色が、色に基づく複数段階のレベルのいずれかであるかを分類する。例えば、処理部132は、便画像を用いて、その便画像に対応する便の色が、黄、薄い黄土、黄土、茶、こげ茶、及び濃いこげ茶のいずれかであるかを分類する。
処理部132は、第一検知部21による検知結果から便の色を分類する。処理部132は、便の色の分類に関する種々の技術を適宜用いて、便の色が、黄、薄い黄土、黄土、茶、こげ茶、及び濃いこげ茶のいずれかであるかを分類する。例えば、処理部132は、カラー画像(RGB)の輝度や明度等の様々な情報(特徴量)に基づいて便の色を分類(判断)する。例えば、処理部132は、機械学習により生成された学習モデル(色推定モデル)を用いて、便の色を分類してもよい。
処理部132は、第一検知部21による検知に基づく大便の性状を用いて、蠕動運動に関する評価(「第一評価」ともいう)を推定する。ここでは、大便の性状がブリストルスケールに基づく7段落の分類である場合を一例として説明する。
処理部132は、大便の性状が7段階のうち中央の段落(すなわち4段階目)であるバナナ状(普通便)である場合、第一評価を最も高く推定する。また、処理部132は、大便の性状が7段階のうち中央の段落から離れるにつれて、第一評価を低く推定する。処理部132は、大便の性状が7段階のうち最も下の段階(すなわち1段階目)であるコロコロ(コロコロ便)である場合、第一評価を低く推定する。また、処理部132は、大便の性状が7段階のうち最も上の段階(すなわち7段階目)である水様(水様便)である場合、第一評価を低く推定する。
なお、上記は一例に過ぎず、処理部132は、任意の態様により第一評価を推定してもよい。例えば、上記のブリストルスケールの場合、中央が最も良い状態に対応し、極端な段階が悪いに対応するが、分類の態様によっては、最下位の段階(分類)が最も悪い状態に対応し、上位の段階(分類)に行くにつれて良い状態に対応し、最上位の段階(分類)が最も悪い状態に対応する場合もある。この場合、処理部132は、大便の性状が最下位の段階(分類)である場合、第一評価を最も低く推定し、大便の性状が最上位の段階(分類)である場合、第一評価を最も高く推定してもよい。このように、処理部132は、大便の性状の分類に態様に対応する方法により第一評価を推定する。
また、処理部132は、第二検知部22により検知された情報を用いて、推定処理を行う。処理部132は、第二検知部22が検知したガスの情報を用いて、推定処理を行う。処理部132は、算出処理を行う。処理部132は、記憶部120に記憶された各種の情報を用いて算出処理を行う。処理部132は、取得部131により取得された各種の情報を用いて算出処理を行う。
処理部132は、ガスに関する各種情報を算出する。処理部132は、第二検知部22により測定された測定値を基に値を算出する。処理部132は、ガスセンサ40により測定された電圧値を基に、センサ素子の抵抗値を算出する。例えば、処理部132は、電圧値とセンサ素子の抵抗値との関係を示す関数を用いて、測定した電圧値からセンサ素子の抵抗値を算出する。処理部132は、式(1)を用いてセンサ素子の抵抗値を算出する。
処理部132は、算出したセンサ素子の抵抗値を基に、ガスの量または濃度を算出する。処理部132は、抵抗値とガスの量または濃度との関係を示す関数(ガス推定関数)を用いて、算出した抵抗値からガスの量または濃度を推定(算出)する。例えば、処理部132は、第二検知部22により検知されたセンサデータのベースライン(例えば排便ガスの測定前の電圧値)からの変化量から、腸内環境に紐づくガスの量または濃度を算出してもよい。この場合、処理部132は、ガスの量または濃度を独自のスコア(例えば腸内環境スコア)に変換し、経時変化を示す情報を生成してもよい。
処理部132は、第二検知部22による検知に基づくガスの量または濃度を用いて、腸内環境に関する評価(「第二評価」ともいう)を推定する。例えば、処理部132は、排便ガスの量または濃度に基づく第二評価を、第二の生体情報として推定する。例えば、処理部132は、第二検知部22による検知に基づくガスの量または濃度を入力として、排便ガスの評価(第二評価)を出力する評価推定関数を用いて第二の生体情報を推定する。
処理部132は、その量や濃度が大きいほど腸内環境が良い可能性が高いことを示すガス(「健康系ガス」ともいう)が検知可能である場合、健康系ガスの量または濃度を用いて、第二評価を推定する。例えば、処理部132は、健康系ガスの量または濃度が大きい程、第二評価を高く推定する。処理部132は、健康系ガスの量または濃度が大きい程、第二評価の値を大きくするガス推定関数を用いて、第二評価を推定(算出)する。
処理部132は、その量や濃度が大きいほど腸内環境が悪い可能性が高いことを示すガス(「臭気性ガス」ともいう)が検知可能である場合、臭気性ガスの量または濃度を用いて、第二評価を推定する。例えば、処理部132は、臭気性ガスの量や濃度が大きい程、第二評価を低く推定する。処理部132は、臭気性ガスの量や濃度が大きい程、第二評価の値を小さくするガス推定関数を用いて、第二評価を推定する。
なお、上記は一例に過ぎず、処理部132は、任意の態様により第二評価を推定してもよい。例えば、処理部132は、利用者の排便ガスにおける健康系ガスの量または濃度と臭気性ガスの量または濃度との比に基づいて第二評価を推定してもよい。処理部132は、算出した比に基づいて、利用者の排便ガスにおける健康系ガスが臭気性ガスよりも多い程、第二評価を高く推定する。制御装置100は、算出した比に基づいて、利用者の排便ガスにおける臭気性ガスが健康系ガスよりも多い程、第二評価を低く推定する。なお、上記は一例に過ぎず、制御装置100は、算出したスコアを基に任意の推定を行ってもよい。
処理部132は、各種の検知を行う構成を制御する。例えば、処理部132は、第一検知部21を制御する。また、例えば、処理部132は、第二検知部22を制御する。処理部132は、利用者の便器7の使用時以外の間にガスセンサ40による測定値があらかじめ決められた範囲内の値となるように第二検知部22を制御し、基準値として用いられる測定値を所定の値に制御する基準値制御を実行する。処理部132は、ガスセンサ40の抵抗素子の抵抗値を変更することにより、基準値を所定の値に制御する基準値制御を実行する。処理部132は、排便ガス測定の終了ごとに基準値制御を実行する。処理部132は、ガスセンサ40の測定値をフィードバックする処理により基準値制御を実行する。
出力部133は、各種情報を出力する出力処理を実行する。出力部133は、各種情報を送信する送信部として機能する。出力部133は、外部の情報処理装置へ情報を送信することにより、出力処理を実行する。出力部133は、外部の情報処理装置へ情報を送信する。例えば、出力部133は、表示装置300へ各種情報を送信する。例えば、出力部133は、管理者が利用するパソコン、スマートフォン等の管理者装置へ各種情報を送信する。また、出力部133は、操作装置30(もしくは表示画面31)へ情報を送信することにより、出力処理を実行しても良い。
出力部133は、処理部132による処理結果を示す情報を送信する。出力部133は、表示装置300が表示に用いる各種情報を表示装置300へ送信する。出力部133は、推定処理の結果を外部に出力する。出力部133は、通信部110を介して、推定処理の結果を外部に送信する。出力部133は、推定処理の結果を表示装置300に送信することにより、表示装置300に推定処理の結果を出力するように制御する。例えば、出力部133は、推定処理の結果を表示装置300に送信し、表示装置300により推定処理の結果を表示させる。
<1-6.処理例>
ここから、上述した生体情報測定システム1の構成を前提とした各種の処理例について説明する。なお、上述した点と同様の点については適宜説明を省略する。
ここから、上述した生体情報測定システム1の構成を前提とした各種の処理例について説明する。なお、上述した点と同様の点については適宜説明を省略する。
<1-6-1.処理概要>
まず、図7を用いて、処理の全体概要について説明する。図7は、実施形態に係る生体情報測定システムが実行する処理の一例を示す図である。
まず、図7を用いて、処理の全体概要について説明する。図7は、実施形態に係る生体情報測定システムが実行する処理の一例を示す図である。
以下では、第一検知部21による大便の検知、及び第二検知部22による排便ガスの検知の一例について説明した後、その検知に基づく推定処理の概要を説明する。なお、第一検知部21による大便の検知、及び第二検知部22による排便ガスの検知は、一例に過ぎず、所望の情報が検知可能であれば、第一検知部21及び第二検知部22の検知は、任意の検知態様が採用可能である。
<1-6-1-1.大便の検知>
まず、第一検知部21による大便の検知の一例について説明する。以下では、第一検知部21による便画像(データ)の取得方法の具体的動作について、図7の第一検知処理MS1を参照して説明する。図7の第一検知処理MS1は、データの取得方法の一例を示す図である。
まず、第一検知部21による大便の検知の一例について説明する。以下では、第一検知部21による便画像(データ)の取得方法の具体的動作について、図7の第一検知処理MS1を参照して説明する。図7の第一検知処理MS1は、データの取得方法の一例を示す図である。
図7の第一検知処理MS1に示す各要素について説明する。対象物OB1及び対象物OB2は、検知(測定)対象とする大便(排泄物)の落下イメージを模式的に示す。具体的には、実線で示す対象物OB1がある時点(第1時点)での落下中の大便の位置を模式的に示し、点線で示す対象物OB2が第1時点よりも後の時点(第2時点)での落下中の大便の位置を模式的に示す。すなわち、図7中の対象物OB1及び対象物OB2は、時間が異なる落下中の一つの大便を示し、対象物OB2は、対象物OB1よりも後の時間における大便に対応する。以下、対象物OB1及び対象物OB2を区別せずに説明する場合、対象物OBと記載する。
図7の第一検知処理MS1では、第一検知部21が3つの発光素子51a、51b、51cを有する場合を示す。例えば、発光素子51a、51b、51cの各々は異なる波長の光を放射するLED(Light Emitting Diode)である。以下、発光素子51a、51b、51cを区別せずに説明する場合、発光素子51と記載する。
図7の第一検知処理MS1では、落下中の対象物OBに対して発光素子51からの光を照射し、受光部50による受光の結果を基に便画像(二次元画像)を取得(生成)する処理を概念的に示す。発光素子51から対象物OBへ伸びる点線は、発光素子51から対象物OBへの光の照射を模式的に示し、対象物OBから受光部50へ伸びる点線は、受光部50が受光する対象物OBからの反射光を模式的に示す。すなわち、図7の第一検知処理MS1では、対象物OB1に対応する対象物OBの検知では対象物OBの下端(落下方向の先頭側)のデータ(一次元画像)が検知される場合を示し、対象物OB2に対応する対象物OBの検知では対象物OBの上端(落下方向の後方側)のデータ(一次元画像)が検知される場合を模式的に示す。
図7の第一検知処理MS1では、第一検知部21は、発光素子51a、51b、51cの各々に発光させた波長ごとに経時的に取得したデータ(一次元画像)を時系列で並べて便情報(二次元画像)を生成する。なお、波長の異なる発光素子とラインセンサを用いたカラー画像の生成については様々な処理が可能であり、詳細な説明は省略するが簡単に処理の一例を説明する。
第一検知部21は、第1波長の光を放射する第1の発光素子である発光素子51aを発光させて得た受光データ(一次元画像)を時間の順序に沿って並べて配置することにより、第1の発光素子(発光素子51a)に対応する二次元画像を生成する。例えば、第一検知部21は、590nm等の第1波長を発光させて得た受光データ(一次元画像)を時系列で並べることにより、第1波長に対応する便情報(第1の二次元画像)を生成する。
また、第一検知部21は、第2波長の光を放射する第2の発光素子である発光素子51bを発光させて得た受光データ(一次元画像)を時間の順序に沿って並べて配置することにより、第2の発光素子(発光素子51b)に対応する二次元画像を生成する。例えば、第一検知部21は、670nm等の第2波長を発光させて得た受光データ(一次元画像)を時系列で並べることにより、第2波長に対応する便情報(第2の二次元画像)を生成する。
また、第一検知部21は、第3波長の光を放射する第3の発光素子である発光素子51cを発光させて得た受光データ(一次元画像)を時間の順序に沿って並べて配置することにより、第3の発光素子(発光素子51c)に対応する二次元画像を生成する。例えば、第一検知部21は、870nm等の第3波長を発光させて得た受光データ(一次元画像)を時系列で並べることにより、第3波長に対応する便情報(第3の二次元画像)を生成する。
このように、第一検知部21は、第1の発光素子、第2の発光素子及び第3の発光素子の各々に対応する3つの波長ごとの二次元画像を生成することにより、カラー画像を取得することができる。例えば第一検知部21は、上述した第1の二次元画像、第2の二次元画像及び第3の二次元画像を合成することにより、カラー画像を生成してもよい。また、受光部50のラインセンサ等の受光素子をカラー式の受光素子とし、複数色の発光素子を同時に放射し、反射光の色を受光部で検知して、カラー画像を生成してもよい。
また、第一検知部21は、撮像を行うカメラであり、二次元の画像を生成してもよい。例えば、第一検知部21は、CCDセンサ、またはCMOSセンサが面状(二次元)に配列されたエリアセンサ(二次元のイメージセンサ)を受光部50として有してもよい。
<1-6-1-2.排便ガスの検知>
次に、第二検知部22による排便ガスの検知の一例について説明する。以下では、第二検知部22によるガスの情報の取得方法の具体的動作について図7の第二検知処理MS2を参照して説明する。図7の第二検知処理MS2は、データの取得方法の一例を示す図である。上述した点と同様の点については適宜説明を省略する。
次に、第二検知部22による排便ガスの検知の一例について説明する。以下では、第二検知部22によるガスの情報の取得方法の具体的動作について図7の第二検知処理MS2を参照して説明する。図7の第二検知処理MS2は、データの取得方法の一例を示す図である。上述した点と同様の点については適宜説明を省略する。
まず、生体情報測定システム1におけるガスセンサ40の一例について説明する。第二検知部22は、利用者の腸内環境を示すガスを検知するガスセンサ40を有する。例えば、ガスセンサ40は、腸内腐敗由来で健康度の低さを示すガス(臭気性ガス)を検出可能なガスセンサ(「臭気性ガスセンサ」ともいう)であってもよい。例えば、臭気性ガスは、腸内の悪玉菌による腐敗で生成されるガスである。例えば、臭気性ガスは、排便ガスのうち、硫黄成分を含むガスであってもよい。臭気性ガスは、一例として、アンモニア、トリメチルアミン、硫化水素、メチルメルカプタン、インドール、スカトール等がある。
また、第二検知部22は、臭気性ガス以外にも、腸内発酵由来で健康度の高さを示すガス(健康系ガス)を検出可能なガスセンサ(「健康系ガスセンサ」ともいう)を含む複数のガスセンサ40を有してもよい。例えば、健康系ガスは、腸内の善玉菌による発酵で生成されるガスである。例えば、健康系ガスは、腸内発酵由来で腸内の健康度が高い程多くなるガスであってもよい。健康系ガスは、一例として、水素、二酸化炭素、酢酸、メタン、エタノール、水等がある。
なお、第二検知部22は、複数のガスセンサ40を有してもよい。例えば、第二検知部22は、水素ガスセンサで、臭気性ガスセンサ、メタンガスセンサ等の複数のガスセンサ40が含まれてもよい。
例えば、生体情報測定システムは、第二検知部22が有する臭気性ガスで検知したガスの量または濃度から、第二検知部22が有する健康系ガスで検知したガス(健康系ガス)の量または濃度の影響を除くことにより、臭気性ガスの量または濃度を検知(推定)してもよい。
次に、ガスセンサの構成例について図8を用いて説明する。図8は、ガスセンサの構成の一例を示す図である。具体的には、図8は、半導体式のガスセンサ40の回路構成CRの一例を示す図である。
ガスセンサ40は、センサ素子と、測定用の抵抗素子とが配置されたものである。図8では、ガスセンサ40は、センサ素子(図8中のセンサ抵抗RSに対応)と、測定用の抵抗素子(図8中の抵抗素子RLに対応)とが直列接続された回路構成CRを有する。
半導体式のガスセンサ40では、以下のような式(1)を用いてガス量と関係がある値が算出される。式(1)は、図8中に示す回路構成CRに対応し、図8中の関数FC1と同様の式である。
RS =((Vc-Vout)/Vout)×RL … (1)
式(1)中の「RS」は、センサ素子の抵抗値を示す。例えば、式(1)中の「RS」は、ガスセンサ40による測定を基に算出される値の一例であるセンサ抵抗RSの抵抗値を示す。このように、式(1)は、抵抗値の計算式である。
式(1)中の「RL」は、抵抗素子RLの抵抗値を示す。式(1)中の「Vc」は、回路電圧Vcの電圧値を示す。式(1)中の「Vout」は、抵抗素子における出力電圧Voutの電圧値を示す。例えば、式(1)中の「Vout」は、ガスセンサ40により測定される測定値の一例である抵抗素子RLの電圧値を示す。
式(1)でのセンサ抵抗RSの抵抗値は、排便ガスの量または濃度と関係のある指標である。生体情報測定システム1は、排便ガスの量または濃度と関係ある指標(抵抗値)を測定値(電圧値)から算出し、算出した抵抗値からガス量を算出する。なお、半導体式のガスセンサの原理等についての詳細な説明は省略するが、例えば図8の回路構成CRのみに示される「RH」はセンサ素子を熱するためのヒータ(抵抗)に対応し、「VH」はヒータの電圧に対応する。なお、本発明におけるガスセンサは、半導体式のセンサに限らず、上記式(1)を満たすセンサであれば代替可能である。
なお、上記は一例に過ぎず、第二検知部22は、上記に限らず任意の態様のガスセンサを有してもよい。例えば、第二検知部22は、赤外線式のCO2センサ(二酸化炭素濃度測定器)等のガスセンサを有してもよい。また第二検知部22は、任意の様態のガスセンサを複数種、また複数個有してもよい。例えば、第二検知部22は、赤外線式のCO2センサに加え、電気化学式のガスセンサを有しても良い。
<1-6-1-3.推定処理>
ここから、第一検知部21による大便の検知、及び第二検知部22による排便ガスの検知に基づく推定処理の一例について説明する。制御装置100は、以下に示すような推定処理を実行する。なお、上述した内容と同様の点については適宜説明を省略する。
ここから、第一検知部21による大便の検知、及び第二検知部22による排便ガスの検知に基づく推定処理の一例について説明する。制御装置100は、以下に示すような推定処理を実行する。なお、上述した内容と同様の点については適宜説明を省略する。
制御装置100は、第一検知部21による大便の検知を基に大便の性状の分類を第一の生体情報として推定する。図7では、制御装置100は、大便検知情報に基づく第一の生体情報DT1に示すように、検知した大便を、ブリストルスケールに対応する7段階のうち中央の段落のバナナ状であると推定する。例えば、第一の生体情報DT1は、蠕動運動に関する情報(第一情報)である。
そして、制御装置100は、推定した大便の性状を用いて、蠕動運動に関する第一評価を推定する。なお、この点についての処理例については図10等で後述する。
制御装置100は、第二検知部22による排便ガスの検知に基づき第二評価の推定に用いるガスの量または濃度を推定する。図7では、制御装置100は、第二評価の推定に用いるガスであるガスX(例えば臭気性ガス等)について、抵抗値とその量または濃度との関係を示す関数(ガス推定関数)を用いて、算出した抵抗値からガスXの量または濃度を推定する。
そして、制御装置100は、推定したガスXの量または濃度を入力とし、第二評価を出力する評価推定関数を用いて、第二評価を第二の生体情報として推定する。図7では、制御装置100は、推定したガスXの量または濃度に基づいて、排便ガス検知情報に基づく時系列データDT2中の●で示すような値(「腸内環境スコア」ともいう)を第二評価として推定する。例えば、時系列データDT2は、1月前(1M前)から処理時点の日までの時系列データであり、腸内環境に関する情報(第二評価)である。なお、複数の腸内環境スコアから第二評価を算出してもよいが、この点について後述する。
制御装置100は、第一評価及び第二評価に基づいて、利用者の健康に関する提供情報またはスコアのうち少なくとも1つを推定する。なお、図7では、利用者の健康に関するスコアの一例である腸スコアまたは腸ランクに関する腸スコア情報INF1及び提供情報の一例である推奨情報INF2の両方を図示するが、制御装置100は、いずれか一方を推定してもよい。例えば、図8では、制御装置100は、第一評価及び第二評価の両方が良いため、腸スコア情報INF1に示すように、腸スコアまたは腸ランクが高いと推定する。なお、図8では、説明のため、「90点」の腸スコア及び「A」判定の腸ランクの両方をスコアとして推定した場合を示すが、制御装置100は、スコアの態様に応じて、90点及びA判定のうち一方のみを推定してもよい。なお、腸スコア及び腸ランクを区別しない場合、腸スコアと総称する。
また、制御装置100は、第一評価及び第二評価のうち、第二評価が悪くなってきている場合、推奨情報INF2に示すように、腸内環境の悪化を示す情報を提供情報として推定する。また、制御装置100は、腸内環境の悪化の対処のために推奨される行動を示す情報を提供情報として推定する。
このように、生体情報測定システム1は、蠕動運動及び腸内環境の両方の情報を基に、利用者の腸の健康状態を推定することにより、適切に利用者の健康状態を推定することができる。すなわち、生体情報測定システム1は、腸そのものの動き、及び腸の中に棲む腸内細菌のバランスの両方の情報を基に、利用者の腸の健康状態を推定することができる。
上記の例では、生体情報測定システム1は、ラインセンサによる検知を基に大便の性状を推定し、ガスセンサによる検知を基に腸内環境を推定する。例えば、生体情報測定システム1は、便の形、量、色、排便ガス(おなら等)をセンシングすることにより、蠕動運動及び腸内環境から腸の状態を可視化して、腸の状態を把握することで、心身の健康状態に通じる腸の状態をお知らせすることができる。このように、生体情報測定システム1は、便、排便ガスから日々の腸の状態や変化を推定、お知らせし生活行動改善の気づきを与えることができる。
また、上記の例では、生体情報測定システム1は、利用者の日常の排泄行為で、利用者の腸全体の状態や変化を推定し、推定結果に基づく情報を利用者へ提供することができる。例えば、生体情報測定システム1は、蠕動運動に関しては、推定した大便の性状(色、形、量)の情報を表示することができる。生体情報測定システム1は、大便の性状を示す第一の生体情報を利用者の表示装置300に表示する。図7では、生体情報測定システム1は、第一の生体情報DT1を利用者の表示装置300に表示する。例えば、生体情報測定システム1は、第一の生体情報DT1に示すような、推定した大便の性状を示す情報を、利用者の表示装置300に表示する。
生体情報測定システム1は、腸内環境に関しては、ガスセンサで排便ガスの組成を取得し、経時変化を表示することができる。例えば、生体情報測定システム1は、第二評価等の第二の生体情報を利用者の表示装置300に表示する。図7では、生体情報測定システム1は、時系列データDT2を利用者の表示装置300に表示する。例えば、生体情報測定システム1は、時系列データDT2に示すような、推定した腸内環境スコアの情報を、利用者の表示装置300に表示する。
また、図7では、生体情報測定システム1は、腸スコア情報INF1のようなスコアまたは推奨情報INF2のような提供情報を、利用者の表示装置300に表示する。これにより、生体情報測定システム1は、蠕動運動、腸内環境を組み合わせた表示を行うことができる。このように、生体情報測定システム1は、便の性状及び排便ガスの両方の情報から、利用者の健康に関する情報を推定し、表示することにより、利用者の健康に関する情報を適切に推定し、表示することができる。
<1-6-2.推定例>
図7で示した利用者の健康に関する提供情報またはスコアは一例に過ぎず、生体情報測定システム1は、様々な情報を適宜用いて、提供情報やスコアを推定してもよい。この点について、以下いくつか例示を記載する。なお、図7等で説明した内容と同様の点については適宜説明を省略する。
図7で示した利用者の健康に関する提供情報またはスコアは一例に過ぎず、生体情報測定システム1は、様々な情報を適宜用いて、提供情報やスコアを推定してもよい。この点について、以下いくつか例示を記載する。なお、図7等で説明した内容と同様の点については適宜説明を省略する。
<1-6-2-1.評価推定例>
まず、図9~図11を用いて、生体情報測定システム1による評価の推定例を説明する。例えば、生体情報測定システム1は、第一評価の推定に用いるサンプル数より第二評価の推定に用いるサンプル数を多くして、推定処理を実行してもよい。例えば、生体情報測定システム1は、第二評価の推定に複数回のトイレ使用で得られたデータを用いてもよい。例えば、第一評価の推定に用いるデータは1回のトイレ使用で得られたデータであり、第二評価の推定に用いるデータは複数回のトイレ使用で得られたデータであってもよい。例えば、ここでいうトイレ使用の回数は、利用者がトイレ室Rに入室してから退室するまでを1回としたトイレ室Rの使用回数であってもよい。この場合、1回のトイレ使用で、複数の情報が取得された場合、その平均や代表値をその1回のトイレ使用の情報としてもよい。例えば、生体情報測定システム1は、1回のトイレ使用で、ガスの量または濃度が2回検知された場合、その2回検知のガスの量または濃度の平均を1回のトイレ使用でのガスの量または濃度として用いてもよい。なお、トイレ使用の回数は、任意の情報が採用可能であり、例えば利用者の排便行為の回数であってもよい。
まず、図9~図11を用いて、生体情報測定システム1による評価の推定例を説明する。例えば、生体情報測定システム1は、第一評価の推定に用いるサンプル数より第二評価の推定に用いるサンプル数を多くして、推定処理を実行してもよい。例えば、生体情報測定システム1は、第二評価の推定に複数回のトイレ使用で得られたデータを用いてもよい。例えば、第一評価の推定に用いるデータは1回のトイレ使用で得られたデータであり、第二評価の推定に用いるデータは複数回のトイレ使用で得られたデータであってもよい。例えば、ここでいうトイレ使用の回数は、利用者がトイレ室Rに入室してから退室するまでを1回としたトイレ室Rの使用回数であってもよい。この場合、1回のトイレ使用で、複数の情報が取得された場合、その平均や代表値をその1回のトイレ使用の情報としてもよい。例えば、生体情報測定システム1は、1回のトイレ使用で、ガスの量または濃度が2回検知された場合、その2回検知のガスの量または濃度の平均を1回のトイレ使用でのガスの量または濃度として用いてもよい。なお、トイレ使用の回数は、任意の情報が採用可能であり、例えば利用者の排便行為の回数であってもよい。
例えば、生体情報測定システム1は、図9に示すように、複数のデータに基づいて第二評価を推定する。図9は、複数のデータに基づく第二評価の一例を示す図である。図9の時系列データDT21中の白丸で示す点PTは、各トイレ使用に対応する腸内環境スコアを示し、黒丸で示す算出値CVは、複数の点PTの情報を用いて算出された第二評価を示す。図9では、生体情報測定システム1は、時系列データDT21に示すように、移動平均など複数データを用いて算出された情報である算出値CVを第二評価として推定する。図9の時系列データDT21中の曲線は、移動平均など複数データを用いて算出された第二評価の時系列変化を示す。
このように、生体情報測定システム1は、腸内環境に関する第二評価を、複数の検知結果を基に推定することで、腸内環境に関する第二評価の適切な推定が可能となる。
次に、図10を用いて、第一評価の推定について説明する。図10は、実施形態に係る第一評価の推定の一例を示す図である。図10に示すように、生体情報測定システム1は、大便の性状が7段階のうち中央(中央値)の段落が最も良いと推定し、中央から離れるにつれて低くなるように第一評価を推定する。この場合、生体情報測定システム1は、大便の性状に基づく推定結果が中央値である程、第一評価が良いと推定する。生体情報測定システム1は、大便の性状は中央程良いと推定(判定)する。例えば、制御装置100は、大便の性状が7段階のうち中央の段落であるバナナである場合、第一評価を最も高く推定する。例えば、第一評価が0~100点の評価である場合、制御装置100は、大便の性状がバナナである場合、第一評価を100点であると推定してもよい。また、第一評価がS、A~Fの7ランク(段階)であり、Sが最も良い評価であり、AからFに向かうにつれて評価が悪くなる場合、制御装置100は、大便の性状がバナナである場合、第一評価をSであると推定してもよい。なお、上述したように、ブリストルスケールに基づく分類及び評価は一例に過ぎず、例えば「かたい」、「理想」、「やわらかい」などの任意の分類が採用可能であり、分解能(分類数)や表記等は任意の態様が採用可能である。また、上記したように、中央が最も良い状態に対応し、極端な段階が悪い状態に対応する場合に限らず、分類の各々に対応する評価が対応付けられれば、任意の対応付けであってもよく、中央値に最上位の評価が対応付かなくてもよい。
次に、図11を用いて、第二評価の推定について説明する。図11は、実施形態に係る第二評価の推定の一例を示す図である。図11に示すように、生体情報測定システム1は、腸内環境スコア等の排便ガスに基づき推定した値が大きい程、第二評価を高く推定する。この場合、生体情報測定システム1は、排便ガスに基づく推定結果が示す値が大きい程、第二評価が良いと推定する。このように、生体情報測定システム1は、排便ガスに基づく情報(臭い情報)はスコアが高いほど良いと推定(判定)する。
<1-6-2-2.情報出力例>
生体情報測定システム1は、推定処理の結果に応じた情報の出力を行う。例えば、生体情報測定システム1は、利用者の排泄物(大便)の大便の性状の情報(評価等)が悪い場合、利用者にストレスや睡眠に関するアドバイスを行ってもよい。例えば、生体情報測定システム1は、「蠕動運動が悪化してきています。睡眠をしっかりとりましょう。」等といった内容を含む提供情報を生成し、生成した提供情報を利用者に提供してもよい。
生体情報測定システム1は、推定処理の結果に応じた情報の出力を行う。例えば、生体情報測定システム1は、利用者の排泄物(大便)の大便の性状の情報(評価等)が悪い場合、利用者にストレスや睡眠に関するアドバイスを行ってもよい。例えば、生体情報測定システム1は、「蠕動運動が悪化してきています。睡眠をしっかりとりましょう。」等といった内容を含む提供情報を生成し、生成した提供情報を利用者に提供してもよい。
また、生体情報測定システム1は、利用者の排便ガスの臭いの情報が悪い場合、利用者に食事に関するアドバイスを行ってもよい。例えば、生体情報測定システム1は、「腸内環境が悪化してきています。ヨーグルトを食べましょう。」等といった内容を含む提供情報を生成し、生成した提供情報を利用者に提供してもよい。
例えば、生体情報測定システム1は、利用者について、図12中の大便の性状の時系列データDT12、及び腸内環境スコアの時系列データDT22に示すような情報を取得した場合、時系列データDT12及び時系列データDT22に基づく提供情報INF22を生成する。そして、生体情報測定システム1は、生成した提供情報INF22を、対象となった利用者の表示装置300に表示する。図12は、実施形態に係る提供情報の推定の一例を示す図である。例えば、時系列データDT12及び時系列データDT22は、1月前(1M前)から処理時点の日までの時系列データである。
図12では、時系列データDT12及び時系列データDT22に示すように、腸内環境スコアが低下してきているため、生体情報測定システム1は、「腸内環境が悪化してきています。健康行動をしましょう。」等といった内容を含む提供情報INF22を生成し、生成した提供情報INF22を利用者に提供する。このように、生体情報測定システム1は、時系列データDT12に示すような排泄物の大便の性状の経時変化の情報と、時系列データDT22に示すような臭いの経時変化の情報の2つの経時変化の情報を比較し、より悪化傾向の方の情報に関するアドバイスを優先的に対象として提供情報を生成し、生成した提供情報を表示する。
<1-6-2-3.提供情報・スコア推定例>
ここから、図13~図15を用いて、生体情報測定システム1による提供情報またはスコアの推定例を説明する。図13は、実施形態に係るスコアの推定に用いる情報の一例を示す図である。図14は、実施形態に係る提供情報の推定に用いる情報の一例を示す図である。図15は、実施形態に係る提供情報の推定に用いる情報の一例を示す図である。
ここから、図13~図15を用いて、生体情報測定システム1による提供情報またはスコアの推定例を説明する。図13は、実施形態に係るスコアの推定に用いる情報の一例を示す図である。図14は、実施形態に係る提供情報の推定に用いる情報の一例を示す図である。図15は、実施形態に係る提供情報の推定に用いる情報の一例を示す図である。
図13に示す推定用テーブルMT1は、「大便の性状」の項目に示す分類と、「におい」の項目に示す腸内環境スコアに基づくA~Dの腸内環境ランクとの組み合わせに基づく、腸ランクの推定値の一覧である。「大便の性状」の項目は、第一検知部21による検知(大便の検知)結果に基づく推定に対応する。また、「におい」の項目は、第二検知部22による検知(排便ガスの検知)結果に基づく推定に対応する。
図13では、腸ランクがS、A~Fの7ランク(段階)であり、Sが最も腸の状態が良く、AがSの次に良く、Fが最も腸の状態が悪い場合を示す。なお、健康に関するスコアは、腸ランクに限らず、任意の情報(例えば0~100点等の数値(点数)等)が採用可能である。例えば、生体情報測定システム1は、大便の性状の情報(評価等)、臭い情報を合計して腸スコアを出力してもよい。
図13では、「におい」の項目は、A~Dの4つの段階(レベル)の腸内環境ランクを含む。例えば、腸内環境ランクはAが最も良く、Dが最も悪い4段階評価を示す。例えば、生体情報測定システム1は、推定した腸内環境スコアを変換することにより、4つの段階(レベル)の腸内環境ランクを推定してもよい。この場合、例えば、生体情報測定システム1は、腸内環境スコアが75点以上である場合、腸内環境ランクをAと推定してもよい。
また、生体情報測定システム1は、腸内環境スコアが50点以上75点未満である場合、腸内環境ランクをBとし、腸内環境スコアが25点以上50点未満である場合、腸内環境ランクをCとし、腸内環境スコアが25点未満である場合、腸内環境ランクをDと推定する。なお、図13に示す腸内環境ランクは一例に過ぎず、「におい」の項目は、任意の情報(例えば腸内環境スコア、第二評価等)が採用可能である。
図13では、「大便の性状」の項目は、「バナナ」の第1分類群、「ひび」及び「やわらか」の第2分類群、「カチカチ」及び「泥」の第3分類群、「コロコロ」及び「水様」の第4分類群の4つの分類群を含む。なお、図13に示す分類群は一例に過ぎず、任意の組み合わせの分類群が採用可能である。また、「大便の性状」の項目は、任意の情報(例えば第一評価等)が採用可能である。
図13では、生体情報測定システム1は、利用者の腸内環境ランク、大便の性状の分類、及び推定用テーブルMT1を用いて、その利用者の腸ランクをスコアとして推定する。例えば、生体情報測定システム1は、利用者の腸内環境ランクがAであり、大便の性状がバナナである場合、推定用テーブルMT1で該当する要素に基づいて、その利用者の腸ランクをSであると推定する。
図14に示す推定用テーブルMT2は、「大便の性状」の項目に示す良し悪しの2分類と、「におい」の項目に示す良し悪しの2分類との組み合わせに基づく、提供情報の一覧である。図14では、「大便の性状」の2分類及び「におい」の2分類の組み合わせ数に対応する4つの提供情報を示す。なお、図14に示す提供情報は、一例に過ぎず、各提供情報は、大便の性状の状態やにおいの状態に対応する任意の内容を含む情報であってもよい。
図14では、「におい」の項目は、「良い」及び「悪い」の2つの分類である。なお、図14に示す「におい」の分類は一例に過ぎず、任意の組み合わせの分類が採用可能である。
例えば、生体情報測定システム1は、第二評価が所定値以上である場合、図14に示す「良い」に分類し、第二評価が所定値未満である場合、図14に示す「悪い」に分類する。なお、上記の分類処理は一例に過ぎず、生体情報測定システム1は、様々な情報を用いて、においを図14に示す「良い」及び「悪い」のいずれかに分類してもよい。例えば、生体情報測定システム1は、腸内環境スコアが所定値以上である場合、図14に示す「良い」に分類し、腸内環境スコアが所定値未満である場合、図14に示す「悪い」に分類してもよい。
図14では、「大便の性状」の項目は、「良い」及び「悪い」の2つの分類である。なお、図14に示す「大便の性状」の分類は一例に過ぎず、任意の組み合わせの分類が採用可能である。
例えば、生体情報測定システム1は、第一評価が所定値以上である場合、図14に示す「良い」に分類し、第一評価が所定値未満である場合、図14に示す「悪い」に分類する。なお、上記の分類処理は一例に過ぎず、生体情報測定システム1は、様々な情報を用いて、大便の性状を図14に示す「良い」及び「悪い」のいずれかに分類してもよい。例えば、生体情報測定システム1は、大便の性状が「バナナ」である場合、図14に示す「良い」に分類し、大便の性状が「バナナ」以外である場合、図14に示す「悪い」に分類してもよい。
図14では、生体情報測定システム1は、利用者のにおいの分類、大便の性状の分類、及び推定用テーブルMT2を用いて、その利用者の提供情報を推定する。例えば、生体情報測定システム1は、利用者について、「におい」の項目が「悪い」であり、「大便の性状」の項目が「悪い」である場合、推定用テーブルMT2で該当する要素に基づいて、「腸の調子がとても悪い傾向にあります。まずは食生活を見直してみませんか?」という内容の提供情報を、その利用者への提供情報をとして適していると推定する。
図15に示す推定用テーブルMT3は、「大便の性状」の項目に示す3分類と、「におい」の項目に示す3分類との組み合わせに基づく、提供情報の一覧である。図15では、「大便の性状」の3分類及び「におい」の3分類の組み合わせ数に対応する9つの提供情報を示す。なお、図15に示す提供情報は、一例に過ぎず、各提供情報は、大便の性状の状態やにおいの状態に対応する任意の内容を含む情報であってもよい。
図15では、「におい」の項目は、「良い」、「普通」及び「悪い」の3つの分類である。なお、図15に示す「におい」の分類は一例に過ぎず、任意の組み合わせの分類が採用可能である。
例えば、生体情報測定システム1は、第二評価が第一閾値以上である場合、図15に示す「良い」に分類し、第二評価が第一閾値未満かつ第二閾値以上である場合、図15に示す「普通」に分類し、第二評価が第二閾値未満である場合、図15に示す「悪い」に分類する。第一閾値は、任意の値が採用可能であり、第二閾値は、第一閾値よりも小さい任意の値が採用可能である。なお、生体情報測定システム1は、「におい」の項目について、腸内環境スコアを用いて、「良い」、「普通」及び「悪い」の3つの分類のいずれかに分類してもよい。
図15では、「大便の性状」の項目は、「泥状」及び「水様」の第1分類群、「ひび」、「バナナ」及び「やわらか」の第2分類群、「コロコロ」及び「カチカチ」の第3分類群、の3つの分類群を含む。なお、図15に示す分類群は一例に過ぎず、任意の組み合わせの分類群が採用可能である。
図15では、生体情報測定システム1は、利用者のにおいの分類、大便の性状の分類、及び推定用テーブルMT3を用いて、その利用者の提供情報を推定する。例えば、生体情報測定システム1は、利用者について、「におい」の項目が「普通」であり、「大便の性状」の項目がが「コロコロ」及び「カチカチ」の第3分類群である場合、推定用テーブルMT3で該当する要素に基づいて、「週2回の運動を始めてみましょう。」という内容の情報がその利用者への提供情報をとして適していると推定する。
<1-6-3.情報提供例>
ここから、上述した処理を前提として、生体情報測定システム1による利用者への情報提供例を説明する。例えば、生体情報測定システム1は、以下に示す各種情報を生成し、生成した情報を、対応する利用者が利用する表示装置300に表示させる。例えば、利用者が利用する表示装置300は、利用者の健康に関する情報を表示するための健康管理用のアプリケーション(「腸活アプリ」ともいう)がインストールされており、腸活アプリにより利用者の健康に関する各種情報を表示する。
ここから、上述した処理を前提として、生体情報測定システム1による利用者への情報提供例を説明する。例えば、生体情報測定システム1は、以下に示す各種情報を生成し、生成した情報を、対応する利用者が利用する表示装置300に表示させる。例えば、利用者が利用する表示装置300は、利用者の健康に関する情報を表示するための健康管理用のアプリケーション(「腸活アプリ」ともいう)がインストールされており、腸活アプリにより利用者の健康に関する各種情報を表示する。
なお、表示装置300は、利用者の健康に関する情報の表示が可能であれば、腸活アプリ以外のアプリケーション等により利用者の健康に関する情報を表示してもよい。以下では、情報を表示する表示装置300の利用者が利用者Uである場合を一例として説明する。
まず、図16を用いて、生体情報測定システム1が提供し、表示装置300が表示する腸活アプリの基本機能に関する情報の一例を示す。図16は、生体情報測定システムが提供する情報の一例を示す図である。
図16中のコンテンツCT1は、例えば、表示装置300が表示する腸活アプリのホーム画面に対応する。コンテンツCT1は、各種情報を表示する表示領域AR1を含む。図16では、表示時点での腸ランク、人の模式図、及び表示時点での腸ランクに対応する腸のイラスト等を含む腸状態情報IM1が表示領域AR1に表示される。図16では、表示時点での利用者Uの腸ランクがAである場合を示す。
コンテンツCT1は、「あなたへのリコメンド情報」と表記されたボタンIC1を含む。また、コンテンツCT1は、「腸ランクとは?」と表記されたボタンIC2を含む。コンテンツCT1は、「腸の動き」と表記されたボタンIC3を含む。コンテンツCT1は、「腸内環境」と表記されたボタンIC4を含む。コンテンツCT1は、「腸活日記」と表記されたボタンIC5を含む。コンテンツCT1は、利用者Uの家族に関する情報が表記されたボタンIC6を含む。なお、ボタンIC1~IC6が選択(指定)された場合に表示される情報の例については後述する。
例えば、表示装置300に表示されたコンテンツCT1中のボタンIC3が選択された場合、表示装置300は、図17に示すコンテンツCT2のような情報を表示する。図17は、生体情報測定システムが提供する情報の一例を示す図である。
図17中のコンテンツCT2は、例えば、表示装置300が表示する腸の動きに関する画面に対応する。コンテンツCT2は、表示時点での利用者Uの大便に関する情報を示す特徴情報FT1~FT3を含む。なお、図17では、特徴情報FT1~FT3が文字情報である場合を示すが、特徴情報FT1~FT3は、各々の対応する情報を示すことができれば、アイコン等の任意の表示態様であってもよい。
例えば、特徴情報FT1は、表示時点での利用者Uの大便の量を示し、図17では大便の量が多いことを示す。例えば、特徴情報FT2は、表示時点での利用者Uの大便の色を示し、図17では大便の色が茶であることを示す。例えば、特徴情報FT3は、表示時点での利用者Uの大便の性状を示し、図17では大便の性状が普通(バナナ等)であることを示す。図17では、大便の性状を軟便、普通、硬便の3つのいずれかで表示する場合を示すが、大便の性状は、バナナ、コロコロ等、ブリストルスケールの内容を表示してもよい。
コンテンツCT2は、「カレンダー表示」と表記されたボタンIC11を含む。例えば、表示装置300に表示されたコンテンツCT2中のボタンIC11が選択された場合、表示装置300は、腸の動き(例えば便の性状等)の測定結果に関するカレンダーを表示する。
コンテンツCT2は、「今日の一言解説 蠕動運動ver」と表記されたボタンIC12を含む。例えば、表示装置300に表示されたコンテンツCT2中のボタンIC12が選択された場合、表示装置300は、蠕動運動に関する今日の一言解説を表示する。
コンテンツCT2は、「関連コラム」と表記されたボタンIC13を含む。例えば、表示装置300に表示されたコンテンツCT2中のボタンIC13が選択された場合、表示装置300は、腸の動き(例えば便の性状等)に関する関連コラムを表示する。
コンテンツCT2は、「スコア」と表記されたボタンIC14を含む。例えば、表示装置300に表示されたコンテンツCT2中のボタンIC14が選択された場合、表示装置300は、腸の動きに関するスコア(例えば第一評価等)に関する情報を表示する。
例えば、表示装置300に表示されたコンテンツCT1中のボタンIC4が選択された場合、表示装置300は、図18に示すコンテンツCT3のような情報を表示する。図18は、生体情報測定システムが提供する情報の一例を示す図である。
図18中のコンテンツCT3は、例えば、表示装置300が表示する腸内環境に関する画面に対応する。コンテンツCT3は、表示時点までの利用者Uの腸内環境を示す腸内環境指標の変遷を示す時系列データ、その変化に基づく提供情報等を含む。なお、図18では、腸内環境指標は、腸内環境スコア、腸内環境ランク等の任意の指標であってもよい。
コンテンツCT3は、「今日の一言解説 腸内環境ver」と表記されたボタンIC21を含む。例えば、表示装置300に表示されたコンテンツCT3中のボタンIC21が選択された場合、表示装置300は、腸内環境に関する今日の一言解説を表示する。
コンテンツCT3は、「関連コラム」と表記されたボタンIC22を含む。例えば、表示装置300に表示されたコンテンツCT3中のボタンIC22が選択された場合、表示装置300は、腸内環境に関する関連コラムを表示する。
コンテンツCT3は、「腸内環境指標の説明」と表記されたボタンIC23を含む。例えば、表示装置300に表示されたコンテンツCT3中のボタンIC23が選択された場合、表示装置300は、コンテンツCT3で表示される腸内環境指標に関する説明を表示する。
また、表示領域AR1に表示する情報は、図16に示す情報に限らず、任意の情報であってもよい。この点について、図19及び図20を用いて例示を記載する。図19及び図20は、推定結果に応じた情報の一例を示す図である。
表示装置300は、図19に示すように、「良い状態です!」という現状の維持を提案する提供情報、及び人の模式図及び表示時点での腸ランクに対応する腸のイラスト等を含む腸状態情報IM2を、表示領域AR1に表示してもよい。この場合、表示装置300は、図16に示すコンテンツCT1中の表示領域AR1に、腸状態情報IM1に代えて腸状態情報IM2を表示する。また、表示装置300は、図20に示すように、「良くなってきています!」という状態が改善に向かっており現状の維持を提案する提供情報、及び腸の状態の変化を示す腸のイラスト等を含む腸状態情報IM3を、表示領域AR1に表示してもよい。この場合、表示装置300は、図16に示すコンテンツCT1中の表示領域AR1に、腸状態情報IM1に代えて腸状態情報IM3を表示する。
このように、表示装置300は、表示領域AR1に任意の情報を表示する。例えば、表示装置300は、腸全体の状態について、点数またはランク付けされたスコア、良し悪しの判定、過去からの変化等を示す情報を、表示領域AR1に表示する。このように、表示装置300は、腸の状態を表す指標として、点数付、またはランク付けしたものを表示してもよい。また、表示装置300は、上記のような情報とともに、上記の経時変動傾向のグラフを表示してもよい。
例えば、表示装置300に表示されたコンテンツCT1中のボタンIC5が選択された場合、表示装置300は、図21に示すコンテンツCT4のような情報を表示する。図21は、利用者の腸活に関する情報の一例を示す図である。
図21中のコンテンツCT4は、例えば、表示装置300が表示する腸活に関する画面に対応する。コンテンツCT4は、表示時点までの利用者Uの腸活を示す腸活日記のカレンダー情報等を含む。
コンテンツCT4は、「腸活関連コラム」と表記されたボタンIC31を含む。例えば、表示装置300に表示されたコンテンツCT4中のボタンIC31が選択された場合、表示装置300は、腸活関連コラムを表示する。
コンテンツCT4は、「みんなの腸活」と表記されたボタンIC32を含む。例えば、表示装置300に表示されたコンテンツCT4中のボタンIC32が選択された場合、表示装置300は、利用者U以外の利用者の腸活に関する情報を表示するが、この点についての例示は後述する。
コンテンツCT4は、「過去の腸活を振り返る」と表記されたボタンIC33を含む。例えば、表示装置300に表示されたコンテンツCT4中のボタンIC33が選択された場合、表示装置300は、利用者Uの腸活の履歴情報等を表示する。
例えば、表示装置300に表示されたコンテンツCT1中のボタンIC1が選択された場合、表示装置300は、図22に示すコンテンツCT5のような情報を表示する。図22は、利用者へのリコメンド情報の一例を示す図である。図22では、利用者Uの腸の状態が悪い(例えば腸ランクがD等)場合の表示を一例として示す。
図22中のコンテンツCT5は、例えば、表示装置300が表示する推奨情報等の提供情報に関する画面に対応する。コンテンツCT5は、表示時点までの利用者Uの腸の状態に対応する提供情報報等を含む。コンテンツCT5は、「過去と比較して調子が悪くなりました」、「腸内環境指標が悪くなっている傾向があります。食生活が乱れていませんか?」等の食生活の改善を促す提案等を含む提供情報INF5を含む。
コンテンツCT5は、「おススメ情報」と表記されたボタンIC41を含む。例えば、表示装置300に表示されたコンテンツCT5中のボタンIC41が選択された場合、表示装置300は、図23に示すコンテンツCT6のような各種情報を表示する。図23は、利用者へのリコメンド情報の一例を示す図である。
図23中のコンテンツCT6は、例えば、表示装置300が表示する推奨情報等の提供情報に関する画面に対応する。コンテンツCT6は、「腸内環境は、食生活の影響を受けると言われています。水溶性食物繊維が良いと言われていますよ!」等の摂取すべき食物の提案等を含む提供情報INF6を含む。また、コンテンツCT6は、食生活の改善に繋がり得る関連サイト、動画、おすすめ商品等の情報を含む。
例えば、表示装置300に表示されたコンテンツCT4中のボタンIC32が選択された場合、表示装置300は、図24に示すコンテンツCT7のような情報を表示する。図24は、利用者への他の利用者の情報の一例を示す図である。
図24中のコンテンツCT7は、例えば、表示装置300が表示する他の利用者の情報に関する画面に対応する。コンテンツCT7は、利用者Uに年齢や性別、体格、生活スタイルなどの属性が類似する他の利用者の腸活に関する情報等を含む。図24では、コンテンツCT7は、30代である利用者Uに属性が類似する30代の他の利用者が腸活アプリに記録した腸活に関する情報や、SNS(Social Networking Service)に投稿した腸活に関する情報などを含む。
なお、利用者Uに類似する他の利用者は、属性に限らず、腸スコア等の評価が類似する利用者であってもよい。例えば、利用者Uに類似する他の利用者は、利用者Uの腸スコアがBである場合、腸スコアがBの利用者であってもよい。このように、表示装置300は、類似する属性や腸スコアである人の腸活方法を表示する。例えば、生体情報測定システム1は、利用者を識別する情報(ID等)に対応付けられた属性や腸スコアに紐づいた他者の腸活アプリへの記録やSNSの情報などを取得して、利用者Uに類似する他の利用者の腸活に関する情報として用いてもよい。
図25中のコンテンツCT8は、例えば、コンテンツCT4に含まれる腸活日記のカレンダーの特定の日付が選択された場合の画面に対応する。図25は、利用者へ提供する情報の表示態様の一例を示す図である。コンテンツCT8は、表示時点までの利用者Uの腸活を示す腸活日記のカレンダー情報、及び選択された日付に対応する腸スコアやアイコン等を含む。
例えば、表示装置300は、利用者の体感情報について、手入力や、アイコンを選択するよう促してもよい。図25では、表示装置300は、利用者Uに、自身の体感(主観)に基づくA~Eの総合評価を選択するように促してもよい。また、表示装置300は、自身の体感(主観)に基づく主観に関するアイコンを表示することにより、利用者Uに、それらのアイコンから選択するように促してもよい。そして、生体情報測定システム1は、利用者の選択により取得した体感情報を用いて、利用者Uのスコアの再評価、補正を実行したり、利用者Uが目指すべきスコア値の設定などを行ったりなどしてもよい。
また、表示装置300は、複数の項目の各々について、手入力や、アイコンを選択するよう促してもよい。図25では、表示装置300は、食事、生活習慣、運動などの各項目についてアイコンを表示することにより、利用者Uに、それらのアイコンから選択するよう促してもよい。このほか表示装置300は、スマートフォン内の他のアプリケーションやスマートウォッチと連携することなどで情報を取得してもよい。これにより、生体情報測定システム1は、腸活の情報、測定値に外れ値があった場合にその点(外れ値等)を除外するかどうか決めるため情報を収集する。そして、生体情報測定システム1は、利用者の選択により取得した情報を、腸活イベントや状態を示す情報として推定結果に紐づけて管理してもよい。また、生体情報測定システム1は、利用者から取得した情報をもとに外れ値除外の処理を実行してもよい。
また、表示装置300は、利用者の腸の状態の変化に応じて情報提供を行ってもよい。図26では、表示装置300は、利用者Uのスコア(腸スコア)、食事、運動の変遷に応じた、提供情報及びその提供情報に対応する商品の購入を促すボタンIC91を含むコンテンツCT9を表示する。図26は、利用者へのリコメンド情報の一例を示す図である。
図26では、生体情報測定システム1は、利用者Uのスコアが○○ヨーグルトを摂取している時に良いため、利用者Uには○○ヨーグルトが合っていると推定する。そのため、生体情報測定システム1は、利用者Uには○○ヨーグルトが合っており、摂取することを提案する提供情報、及び○○ヨーグルトを購入するためのボタンIC91を含むコンテンツCT9を生成し、表示装置300に表示させる。
表示装置300に表示されたコンテンツCT9中のボタンIC91が選択された場合、表示装置300は、○○ヨーグルトを販売するEC(電子商取引)サイト等の情報を表示する。このように、表示装置300は、スコアが悪くなってきたときに過去に効果があった腸活ツールに関連する商品を提案する情報を表示する。
なお、表示装置300に表示されたコンテンツCT4中のボタンIC32が選択された場合、表示装置300は、図24に示すコンテンツCT7以外の情報を表示してもよい。例えば、表示装置300に表示されたコンテンツCT4中のボタンIC32が選択された場合、表示装置300は、図27に示すコンテンツCT10のような情報を表示してもよい。図27は、利用者への他の利用者の情報の一例を示す図である。
図27中のコンテンツCT10は、例えば、表示装置300が表示する他の利用者の情報に関する画面に対応する。コンテンツCT10は、利用者Uに類似する他の利用者の腸活に関する情報等を含む。図27では、コンテンツCT10は、30代である利用者Uに属性が類似する30代の他の利用者の腸活記録に関する情報を含む。
例えば、表示装置300は、利用者Uに類似する他の利用者を識別する情報(ID等)に対応付けられた属性や腸スコアに紐づいた情報群を出力する。例えば、表示装置300は、他の利用者の各々の腸活内容や期間等を示す腸活記録、その腸活期間での腸スコアの変動等情報を含むコンテンツCT10を表示する。このように、表示装置300は、他の利用者(人)の腸活イベントと結果とを紐づけた情報を、利用者が閲覧できるようにする。
例えば、表示装置300に表示されたコンテンツCT1中のボタンIC6が選択された場合、表示装置300は、図28に示すコンテンツCT11のような情報を表示する。図28は、利用者と関係を有する利用者の情報の一例を示す図である。図28では、利用者Uの家族が、利用者U(わたし)と、配偶者(パパ)と、2人の子供(A子、B男)との4人である場合の表示を一例として示す。例えば、生体情報測定システム1は、各利用者について、その利用者の関係を有する利用者を識別する情報(ID等)を、その利用者を識別する情報(ID等)に紐づけて管理することで、各利用者と関係を有する利用者を特定可能にする。
図28中のコンテンツCT11は、例えば、表示装置300が表示する利用者と関係を有する利用者の一覧表示に関する画面に対応する。コンテンツCT11は、表示時点までの利用者Uの家族の各々の4つの腸ランク等を含む。コンテンツCT11は、配偶者(パパ)についてランクがBであり、「→詳しく見る」と表記されたボタンIC101を含む。また、コンテンツCT11は、利用者U(わたし)についてランクがAであり、「→詳しく見る」と表記されたボタンIC102を含む。また、コンテンツCT11は、子供(A子)についてランクがBであり、「→詳しく見る」と表記されたボタンIC103を含む。また、コンテンツCT11は、子供(B男)についてランクがCであり、「→詳しく見る」と表記されたボタンIC104を含む。
表示装置300は、各利用者に対応する「詳しく見る」ボタンが選択された場合、その利用者個人の結果を示す情報の表示に表示を遷移させる。例えば、表示装置300は、ボタンIC101が選択された場合、配偶者(パパ)の個人の推定結果を示す情報を表示する。例えば、表示装置300は、表示領域AR1に表示される情報を、利用者U(わたし)の情報から配偶者(パパ)の情報に切り替える。
このように、生体情報測定システム1は、他者の結果もID連携で表示可能とする。生体情報測定システム1は、ID連携などの所定の条件を満たした場合、第三者にデータを送信する。なお、上述した例では、利用者と関係を有する利用者として家族を一例として説明したが、利用者と関係を有する利用者は、家族に限らず、病院やジムなど所属する先が共通する利用者や、医師、ジムのトレーナーなど利用者の健康管理サポートを行う者であってもよい。
例えば、表示装置300に表示されたコンテンツCT1中のボタンIC2が選択された場合、表示装置300は、図29に示すコンテンツCT12のような情報を表示する。図29は、利用者に関するランク情報の一例を示す図である。
図29中のコンテンツCT12は、例えば、表示装置300が表示する腸活に関する画面に対応する。コンテンツCT12は、表示時点での利用者Uの腸ランクに基づくランク情報等を含む。図29では、コンテンツCT12は、30代である利用者Uに属性が類似する30代の利用者群における腸ランクの分布に関する情報を含む。この場合、生体情報測定システム1は、管理する利用者の情報から30代の利用者の情報を抽出し、抽出した情報を基に30代の利用者群における腸ランクの分布を示す情報を生成し、生成した分布を示す情報に、利用者Uが該当するランクを示す情報を追加することによりコンテンツCT12を生成する。図29では、表示装置300は、利用者Uの腸ランクがCであり、腸ランクCは30代の利用者群では平均的であることを示すコンテンツCT12を表示する。これにより、表示装置300は、利用者と(属性等が)似たような他の利用者(人)たちとの間でランク等の評価を、利用者が比較可能にすることができる。なお、CT12はこのほか、腸の動きに関するスコア(例えば第一評価等)に関するランクの評価や、腸内環境指標に関するランクの評価であってもよい。
また、生体情報測定システム1は、所定のタイミングで利用者に通知を行ってもよい。生体情報測定システム1は、図30に示す表示装置300の表示領域AR11に任意の情報を表示させてもよい。図30は、利用者への情報通知の一例を示す図である。
例えば、表示装置300を利用する利用者(本人)のスコアが悪くなってきた場合、表示装置300は、「注意! 腸ランクが下がってきています!」等の情報を含むコンテンツCT13を表示領域AR11に表示する。例えば、利用者Uの腸ランクが悪くなってきた場合、利用者Uの表示装置300は、コンテンツCT13を表示領域AR11に表示する。このように、表示装置300は、利用者自身のスコアが悪くなってきたときに、注意喚起を促す。
また、表示装置300を利用する利用者(本人)と関係を有する他者(他の利用者)のスコアが悪くなってきた場合、表示装置300は、「注意!B男の腸ランクが下がってきています!確認してみましょう。」等の情報を含むコンテンツCT14を表示領域AR11に表示する。例えば、利用者Uの子供であるB男の腸ランクが悪くなってきた場合、利用者Uの表示装置300は、コンテンツCT14を表示領域AR11に表示する。このように、表示装置300は、利用者と関係を有する他者のスコアが悪くなってきたときに、注意喚起を促す。
また、生体情報測定システム1は、利用者の利用状況に応じて利用者に通知を行ってもよい。この点について、図31及び図32を用いて説明する。図31及び図32は、利用者の利用状況に応じた情報通知の一例を示す図である。例えば、生体情報測定システム1は、利用者の腸活アプリへのログイン履歴に基づくプッシュ通知を行ってもよい。また、生体情報測定システム1は、利用者の腸活アプリへのログイン回数や腸活入力頻度に基づいて、利用者の腸活への関心度を評価してもよい。
例えば、生体情報測定システム1は、利用者が積極的に活動出来ている場合、利用者の腸活への関心度が高いと評価し、その利用者に積極的な活動を称賛する情報を通知してもよい。図31では、利用者が10日連続で腸活アプリにログインした場合、生体情報測定システム1は、コンテンツCT15のような情報を利用者に通知する。例えば、利用者Uが10日連続で腸活アプリにログインした場合、利用者Uの表示装置300は、コンテンツCT15を表示する。例えば、表示装置300は、利用者Uが10日目に腸活アプリにログインしたタイミングで、コンテンツCT1に重畳させてコンテンツCT15を表示(ポップアップ表示)する。
例えば、生体情報測定システム1は、利用者が腸活アプリにログインしていない期間(例えば1週間ログイン無し等)が続いた場合、利用者の腸活への関心度が低いと評価し、その利用者に積極的な活動を促す情報を通知してもよい。利用者の腸活への関心度が低いと評価した場合、生体情報測定システム1は、図32に示す表示装置300の表示領域AR12に利用者に積極的な活動を促す情報を表示させる。
例えば、表示装置300を利用する利用者が腸活アプリにログインしていない期間が所定の期間(例えば7日等)になった場合、表示装置300は、「○○日ログインされていません。腸活を再開しませんか?」等の情報を含むコンテンツCT16を表示領域AR12に表示する。例えば、利用者Uが腸活アプリにログインしていない期間が○○日継続した場合、利用者Uの表示装置300は、コンテンツCT16を表示領域AR12に表示する。このように、生体情報測定システム1は、利用者のモチベーション維持のために、利用者の腸活への関心度に応じて通知を行ってもよい。
上述したように、生体情報測定システム1は、各種の情報提供を行うことで、利用者に所望の情報を知らせることができる。例えば、生体情報測定システム1は、腸の状態が悪い場合、利用者に状態改善を促すことができる。生体情報測定システム1は、健康に関する状態が悪くなってきたときに知りたいという利用者の要望を満たすことができ、スコアが下がってきたことを知らせることで、利用者に生活を見直す動機付けを与えることができる。
また、生体情報測定システム1は、腸の状態が良好である場合、利用者に状態キープを促すことができる。生体情報測定システム1は、生活習慣と紐づけて健康管理したいという利用者の要望を満たすことができ、スコアが良好であることを知らせることで、利用者に安心感を与えることができる。また、生体情報測定システム1は、利用者以外にも、その利用者の家族や患者の健康管理に役立てたいという利用者の要望を満たすことができ、例えば家族のおなかの調子を知って、献立を考えたいというような利用者の要望を満たすことができる。
また、生体情報測定システム1は、腸の状態が良くなって傾向がある場合、利用者に状態をもっと良くすることを促すことができる。生体情報測定システム1は、自分の体に合う腸活を探したい、腸活の効果指標として活用したい等という利用者の要望を満たすことができ、食べ始めたヨーグルト等の食物の効果を認識し、その食物の摂取の継続を促すことができる。また、生体情報測定システム1は、腸活のモチベーション維持のツールとして、利用者に目標達成を目指して頑張る動機付けを与えることができる。
また、生体情報測定システム1は、過去のデータと比較して、スコアが所定以上に下回った場合にアラートを出力してもよい。また、生体情報測定システム1は、第一の生体情報、第二の生体情報、提供情報またはスコアが揃った段階で測定完了を報知してもよい。また、生体情報測定システム1は、第一の生体情報及び第二の生体情報のうち、根拠とともに結果が優れない情報を優先して出力してもよい。また、生体情報測定システム1は、1回の排泄行為毎に推奨情報またはスコアを更新してもよい。また、生体情報測定システム1は、イメージセンサで大便の性状を検知し、ガスセンサで排便ガスを検知する。
また、生体情報測定システム1は、大便の性状以外に、大便の量、色、密度、排便後のスッキリ度合等の利用者の主観情報などを腸の蠕動運動に関する情報として検知してもよいし、排便ガス以外に、大便の色、便の臭いに関する利用者の主観情報などを腸内環境に関する情報として検知してもよい。
生体情報測定システム1は、上述したような各種のコンテンツを生成し、生成したコンテンツを利用者へ提供する。例えば、生体情報測定システム1の制御装置100は、コンテンツCT1~CT16等の各種の情報を生成する。そして、制御装置100は、生成したコンテンツCT1~CT16等の各種の情報を利用者の表示装置300へ送信する。コンテンツCT1~CT16等の各種の情報を受信した表示装置300は、受信したコンテンツCT1~CT16等の各種の情報を表示する。
この場合、例えば、制御装置100の処理部132は、各種の情報の生成処理を行う生成部として機能する。処理部132は、表示装置300に表示させるコンテンツ等の各種情報を生成する。処理部132は、図16~図32に示す画面(コンテンツ)を生成する。例えば、処理部132は、画像生成や画像処理等に関する種々の技術を適宜用いて、表示装置300へ提供するコンテンツ(画像情報)を生成する。例えば、処理部132は、Java(登録商標)等の種々の技術を適宜用いて、表示装置300へ提供する画面(画像情報)を生成する。なお、処理部132は、CSS(Cascading Style Sheets)やJavaScript(登録商標)やHTML(Hyper Text Markup Language)の形式に基づいて、表示装置300へ提供するコンテンツ(画像情報)を生成してもよい。また、例えば、処理部132は、JPEG(Joint Photographic Experts Group)やGIF(Graphics Interchange Format)やPNG(Portable Network Graphics)など様々な形式でコンテンツを生成してもよい。
なお、上述してきた各実施形態及び変形例は、処理内容を矛盾させない範囲で適宜組み合わせることが可能である。
さらなる効果や変形例は、当業者によって容易に導き出すことができる。このため、本発明のより広範な態様は、以上のように表しかつ記述した特定の詳細および代表的な実施形態に限定されるものではない。したがって、添付の請求の範囲およびその均等物によって定義される総括的な発明の概念の精神または範囲から逸脱することなく、様々な変更が可能である。
上述してきた各実施形態及び変形例について、以下のような構成であってもよいが、以下には限られない。
(1)
トイレ室に設置された大便器のボウル内に排出される排泄物の情報に基づいて、前記トイレ室の利用者の生体情報を測定する生体情報測定システムであって、
大便を検知する第一検知部と、
排便ガスを検知する第二検知部と、
前記第一検知部の検知結果及び前記第二検知部の検知結果に基づいて、前記利用者の健康に関する提供情報またはスコアの少なくとも1つを推定する推定処理を実行し、前記推定処理の結果を外部に出力させる制御を実行する制御部と、
を備えることを特徴とする生体情報測定システム。
(2)
前記制御部は、
前記第一検知部の検知結果から前記大便の性状に基づく第一の生体情報を推定し、
前記第二検知部の検知結果から前記排便ガスの量または濃度に基づく第二の生体情報を推定し、
前記第一の生体情報及び前記第二の生体情報を出力するように制御を実行する
ことを特徴とする(1)に記載の生体情報測定システム。
(3)
前記制御部は、
前記第一検知部の検知結果のサンプル数より前記第二検知部の検知結果のサンプル数を多く用いて前記推定処理を実行する
ことを特徴とする(1)または(2)に記載の生体情報測定システム。
(4)
前記推定処理では、1回のトイレ使用で得られた前記第一検知部の検知結果と、複数回のトイレ使用でそれぞれ得られた複数の前記第二検知部の検知結果と、を使用する ことを特徴とする(3)に記載の生体情報測定システム。
(5)
前記制御部は、
前記第一検知部の検知結果に基づく前記大便の性状の分類ごとに対応する第一評価が高い程、前記スコアを高く推定し、
前記第二検知部の検知結果に基づく第二評価が高い程前記スコアを高く推定する前記推定処理を実行する
ことを特徴とする(1)~(4)のいずれか1つに記載の生体情報測定システム。
(6)
トイレ室に設置された大便器のボウル内に排出される排泄物の情報に基づいて、前記トイレ室の利用者の生体情報を測定する生体情報測定システムであって、
腸の蠕動運動に関する情報を検知する第一検知部と、
腸内環境に関する情報を検知する第二検知部と、
前記第一検知部の検知結果及び前記第二検知部の検知結果に基づいて、前記利用者の健康に関する提供情報またはスコアの少なくとも1つを推定する推定処理を実行し、前記推定処理の結果を外部に出力させる制御を実行する制御部と、
を備えることを特徴とする生体情報測定システム。
(7)
トイレ室に設置された大便器のボウル内に排出される排泄物の情報に基づいて、前記トイレ室の利用者の生体情報を測定する生体情報測定システムであって、
大便を検知する第一検知部による検知結果と、排便ガスを検知する第二検知部による検知結果に基づいて、前記利用者の健康に関する提供情報またはスコアの少なくとも1つを推定する推定処理を実行し、前記推定処理の結果を外部に出力させる制御を実行する制御部と、
を備えることを特徴とする生体情報測定システム。
(8)
トイレ室に設置された大便器のボウル内に排出される排泄物の情報に基づいて、前記トイレ室の利用者の生体情報を測定する生体情報測定システムであって、
腸の蠕動運動に関する情報を検知する第一検知部による検知結果と、腸内環境に関する情報を検知する第二検知部による検知結果とに基づいて、前記利用者の健康に関する提供情報またはスコアの少なくとも1つを推定する推定処理を実行し、前記推定処理の結果を外部に出力させる制御を実行する制御部と、
を備えることを特徴とする生体情報測定システム。
(1)
トイレ室に設置された大便器のボウル内に排出される排泄物の情報に基づいて、前記トイレ室の利用者の生体情報を測定する生体情報測定システムであって、
大便を検知する第一検知部と、
排便ガスを検知する第二検知部と、
前記第一検知部の検知結果及び前記第二検知部の検知結果に基づいて、前記利用者の健康に関する提供情報またはスコアの少なくとも1つを推定する推定処理を実行し、前記推定処理の結果を外部に出力させる制御を実行する制御部と、
を備えることを特徴とする生体情報測定システム。
(2)
前記制御部は、
前記第一検知部の検知結果から前記大便の性状に基づく第一の生体情報を推定し、
前記第二検知部の検知結果から前記排便ガスの量または濃度に基づく第二の生体情報を推定し、
前記第一の生体情報及び前記第二の生体情報を出力するように制御を実行する
ことを特徴とする(1)に記載の生体情報測定システム。
(3)
前記制御部は、
前記第一検知部の検知結果のサンプル数より前記第二検知部の検知結果のサンプル数を多く用いて前記推定処理を実行する
ことを特徴とする(1)または(2)に記載の生体情報測定システム。
(4)
前記推定処理では、1回のトイレ使用で得られた前記第一検知部の検知結果と、複数回のトイレ使用でそれぞれ得られた複数の前記第二検知部の検知結果と、を使用する ことを特徴とする(3)に記載の生体情報測定システム。
(5)
前記制御部は、
前記第一検知部の検知結果に基づく前記大便の性状の分類ごとに対応する第一評価が高い程、前記スコアを高く推定し、
前記第二検知部の検知結果に基づく第二評価が高い程前記スコアを高く推定する前記推定処理を実行する
ことを特徴とする(1)~(4)のいずれか1つに記載の生体情報測定システム。
(6)
トイレ室に設置された大便器のボウル内に排出される排泄物の情報に基づいて、前記トイレ室の利用者の生体情報を測定する生体情報測定システムであって、
腸の蠕動運動に関する情報を検知する第一検知部と、
腸内環境に関する情報を検知する第二検知部と、
前記第一検知部の検知結果及び前記第二検知部の検知結果に基づいて、前記利用者の健康に関する提供情報またはスコアの少なくとも1つを推定する推定処理を実行し、前記推定処理の結果を外部に出力させる制御を実行する制御部と、
を備えることを特徴とする生体情報測定システム。
(7)
トイレ室に設置された大便器のボウル内に排出される排泄物の情報に基づいて、前記トイレ室の利用者の生体情報を測定する生体情報測定システムであって、
大便を検知する第一検知部による検知結果と、排便ガスを検知する第二検知部による検知結果に基づいて、前記利用者の健康に関する提供情報またはスコアの少なくとも1つを推定する推定処理を実行し、前記推定処理の結果を外部に出力させる制御を実行する制御部と、
を備えることを特徴とする生体情報測定システム。
(8)
トイレ室に設置された大便器のボウル内に排出される排泄物の情報に基づいて、前記トイレ室の利用者の生体情報を測定する生体情報測定システムであって、
腸の蠕動運動に関する情報を検知する第一検知部による検知結果と、腸内環境に関する情報を検知する第二検知部による検知結果とに基づいて、前記利用者の健康に関する提供情報またはスコアの少なくとも1つを推定する推定処理を実行し、前記推定処理の結果を外部に出力させる制御を実行する制御部と、
を備えることを特徴とする生体情報測定システム。
1 生体情報測定システム
2 便座装置
3 本体部
4 測定装置
5 便座
6 洗浄ノズル
7 便器
8 ボウル部
9 便蓋
10 吸引装置
21 第一検知部(撮像装置)
22 第二検知部(ガス検出装置)
40 ガスセンサ
50 受光部
100 制御装置
110 通信部
120 記憶部
130 制御部
131 取得部
132 処理部
133 出力部
R トイレ室
2 便座装置
3 本体部
4 測定装置
5 便座
6 洗浄ノズル
7 便器
8 ボウル部
9 便蓋
10 吸引装置
21 第一検知部(撮像装置)
22 第二検知部(ガス検出装置)
40 ガスセンサ
50 受光部
100 制御装置
110 通信部
120 記憶部
130 制御部
131 取得部
132 処理部
133 出力部
R トイレ室
Claims (8)
- トイレ室に設置された大便器のボウル内に排出される排泄物の情報に基づいて、前記トイレ室の利用者の生体情報を測定する生体情報測定システムであって、
大便を検知する第一検知部と、
排便ガスを検知する第二検知部と、
前記第一検知部の検知結果及び前記第二検知部の検知結果に基づいて、前記利用者の健康に関する提供情報またはスコアの少なくとも1つを推定する推定処理を実行し、前記推定処理の結果を外部に出力させる制御を実行する制御部と、
を備えることを特徴とする生体情報測定システム。 - 前記制御部は、
前記第一検知部の検知結果から前記大便の性状に基づく第一の生体情報を推定し、
前記第二検知部の検知結果から前記排便ガスの量または濃度に基づく第二の生体情報を推定し、
前記第一の生体情報及び前記第二の生体情報を出力するように制御を実行する
ことを特徴とする請求項1に記載の生体情報測定システム。 - 前記制御部は、
前記第一検知部の検知結果のサンプル数より前記第二検知部の検知結果のサンプル数を多く用いて前記推定処理を実行する
ことを特徴とする請求項1に記載の生体情報測定システム。 - 前記推定処理では、1回のトイレ使用で得られた前記第一検知部の検知結果と、複数回のトイレ使用でそれぞれ得られた複数の前記第二検知部の検知結果と、を使用する
ことを特徴とする請求項3に記載の生体情報測定システム。 - 前記制御部は、
前記第一検知部の検知結果に基づく前記大便の性状の分類ごとに対応する第一評価が高い程、前記スコアを高く推定し、
前記第二検知部の検知結果に基づく第二評価が高い程前記スコアを高く推定する前記推定処理を実行する
ことを特徴とする請求項1~4のいずれか1つに記載の生体情報測定システム。 - トイレ室に設置された大便器のボウル内に排出される排泄物の情報に基づいて、前記トイレ室の利用者の生体情報を測定する生体情報測定システムであって、
腸の蠕動運動に関する情報を検知する第一検知部と、
腸内環境に関する情報を検知する第二検知部と、
前記第一検知部の検知結果及び前記第二検知部の検知結果に基づいて、前記利用者の健康に関する提供情報またはスコアの少なくとも1つを推定する推定処理を実行し、前記推定処理の結果を外部に出力させる制御を実行する制御部と、
を備えることを特徴とする生体情報測定システム。 - トイレ室に設置された大便器のボウル内に排出される排泄物の情報に基づいて、前記トイレ室の利用者の生体情報を測定する生体情報測定システムであって、
大便を検知する第一検知部による検知結果と、排便ガスを検知する第二検知部による検知結果に基づいて、前記利用者の健康に関する提供情報またはスコアの少なくとも1つを推定する推定処理を実行し、前記推定処理の結果を外部に出力させる制御を実行する制御部と、
を備えることを特徴とする生体情報測定システム。 - トイレ室に設置された大便器のボウル内に排出される排泄物の情報に基づいて、前記トイレ室の利用者の生体情報を測定する生体情報測定システムであって、
腸の蠕動運動に関する情報を検知する第一検知部による検知結果と、腸内環境に関する情報を検知する第二検知部による検知結果とに基づいて、前記利用者の健康に関する提供情報またはスコアの少なくとも1つを推定する推定処理を実行し、前記推定処理の結果を外部に出力させる制御を実行する制御部と、
を備えることを特徴とする生体情報測定システム。
Priority Applications (1)
| Application Number | Priority Date | Filing Date | Title |
|---|---|---|---|
| CN202480023534.8A CN121013982A (zh) | 2023-06-15 | 2024-05-14 | 生物体信息测定系统 |
Applications Claiming Priority (2)
| Application Number | Priority Date | Filing Date | Title |
|---|---|---|---|
| JP2023098193A JP7764880B2 (ja) | 2023-06-15 | 2023-06-15 | 生体情報測定システム |
| JP2023-098193 | 2023-06-15 |
Publications (1)
| Publication Number | Publication Date |
|---|---|
| WO2024257529A1 true WO2024257529A1 (ja) | 2024-12-19 |
Family
ID=93851996
Family Applications (1)
| Application Number | Title | Priority Date | Filing Date |
|---|---|---|---|
| PCT/JP2024/017747 Ceased WO2024257529A1 (ja) | 2023-06-15 | 2024-05-14 | 生体情報測定システム |
Country Status (4)
| Country | Link |
|---|---|
| JP (2) | JP7764880B2 (ja) |
| CN (1) | CN121013982A (ja) |
| TW (1) | TW202522515A (ja) |
| WO (1) | WO2024257529A1 (ja) |
Families Citing this family (2)
| Publication number | Priority date | Publication date | Assignee | Title |
|---|---|---|---|---|
| WO2026070841A1 (ja) * | 2024-09-25 | 2026-04-02 | 京セラ株式会社 | 推定システム |
| JP7747927B1 (ja) * | 2025-04-23 | 2025-10-01 | 株式会社ビズリーチ | 情報処理システム、情報処理方法及びプログラム |
Citations (3)
| Publication number | Priority date | Publication date | Assignee | Title |
|---|---|---|---|---|
| JP4385402B2 (ja) * | 2004-04-02 | 2009-12-16 | Toto株式会社 | 腸内状態報知装置及び方法 |
| JP7107338B2 (ja) * | 2019-08-30 | 2022-07-27 | Toto株式会社 | 排便記録システム、排便記録方法および排便記録プログラム |
| JP2022147796A (ja) * | 2021-03-23 | 2022-10-06 | Toto株式会社 | 排泄情報管理システム |
-
2023
- 2023-06-15 JP JP2023098193A patent/JP7764880B2/ja active Active
-
2024
- 2024-05-14 WO PCT/JP2024/017747 patent/WO2024257529A1/ja not_active Ceased
- 2024-05-14 CN CN202480023534.8A patent/CN121013982A/zh active Pending
- 2024-05-27 TW TW113119473A patent/TW202522515A/zh unknown
-
2025
- 2025-10-24 JP JP2025179241A patent/JP2026016564A/ja active Pending
Patent Citations (3)
| Publication number | Priority date | Publication date | Assignee | Title |
|---|---|---|---|---|
| JP4385402B2 (ja) * | 2004-04-02 | 2009-12-16 | Toto株式会社 | 腸内状態報知装置及び方法 |
| JP7107338B2 (ja) * | 2019-08-30 | 2022-07-27 | Toto株式会社 | 排便記録システム、排便記録方法および排便記録プログラム |
| JP2022147796A (ja) * | 2021-03-23 | 2022-10-06 | Toto株式会社 | 排泄情報管理システム |
Also Published As
| Publication number | Publication date |
|---|---|
| JP2024179384A (ja) | 2024-12-26 |
| JP2026016564A (ja) | 2026-02-03 |
| JP7764880B2 (ja) | 2025-11-06 |
| CN121013982A (zh) | 2025-11-25 |
| TW202522515A (zh) | 2025-06-01 |
Similar Documents
| Publication | Publication Date | Title |
|---|---|---|
| JP7107338B2 (ja) | 排便記録システム、排便記録方法および排便記録プログラム | |
| JP2026016564A (ja) | 生体情報測定システム | |
| JP7464181B2 (ja) | 健康管理システム及び健康管理方法 | |
| US20250191731A1 (en) | Nutrient intake amount estimation system, nutrient intake amount estimation method, nutrient intake amount estimation device, storage medium, and nutrient intake amount output method | |
| JP2025188173A (ja) | 排泄情報管理システム | |
| JP2025000699A (ja) | 健康管理システム、健康管理方法、情報処理装置及び情報処理プログラム | |
| JP7761069B2 (ja) | 健康状態表示システム | |
| JP2025181655A (ja) | トイレシステム | |
| WO2025220491A1 (ja) | 健康レベル算出システム | |
| JP2025110252A (ja) | 健康状態表示システム | |
| JP2025110214A (ja) | 健康状態表示システム | |
| JP2025110016A (ja) | 健康状態表示システム | |
| CN114830255A (zh) | 信息传递装置和信息传递方法 | |
| WO2025205210A1 (ja) | トイレシステム | |
| JP2025153903A (ja) | トイレシステム | |
| JP2024018577A (ja) | 健康管理システム及び健康管理方法 | |
| JP2025155588A (ja) | 健康管理システム | |
| TW202429479A (zh) | 排泄困難度算出系統 | |
| JP2025165474A (ja) | 情報処理装置及びプログラム | |
| JP2025091541A (ja) | 排泄管理システム | |
| JP2024046028A (ja) | 生体情報管理システム | |
| WO2024214514A1 (ja) | プログラム、方法、および情報処理システム | |
| JP2024097355A (ja) | 排泄困難度算出システム | |
| CN120188225A (zh) | 促进早期医疗干预 |
Legal Events
| Date | Code | Title | Description |
|---|---|---|---|
| 121 | Ep: the epo has been informed by wipo that ep was designated in this application |
Ref document number: 24823151 Country of ref document: EP Kind code of ref document: A1 |
|
| NENP | Non-entry into the national phase |
Ref country code: DE |