WO2024257345A1 - 電気泳動システム、電気泳動データ処理装置、及び、電気泳動データ処理方法 - Google Patents
電気泳動システム、電気泳動データ処理装置、及び、電気泳動データ処理方法 Download PDFInfo
- Publication number
- WO2024257345A1 WO2024257345A1 PCT/JP2023/022453 JP2023022453W WO2024257345A1 WO 2024257345 A1 WO2024257345 A1 WO 2024257345A1 JP 2023022453 W JP2023022453 W JP 2023022453W WO 2024257345 A1 WO2024257345 A1 WO 2024257345A1
- Authority
- WO
- WIPO (PCT)
- Prior art keywords
- signal
- compression
- fluorescent
- fluorescence
- fluorescent signal
- Prior art date
- Legal status (The legal status is an assumption and is not a legal conclusion. Google has not performed a legal analysis and makes no representation as to the accuracy of the status listed.)
- Ceased
Links
Images













Classifications
-
- G—PHYSICS
- G01—MEASURING; TESTING
- G01N—INVESTIGATING OR ANALYSING MATERIALS BY DETERMINING THEIR CHEMICAL OR PHYSICAL PROPERTIES
- G01N21/00—Investigating or analysing materials by the use of optical means, i.e. using sub-millimetre waves, infrared, visible or ultraviolet light
- G01N21/62—Systems in which the material investigated is excited whereby it emits light or causes a change in wavelength of the incident light
- G01N21/63—Systems in which the material investigated is excited whereby it emits light or causes a change in wavelength of the incident light optically excited
- G01N21/64—Fluorescence; Phosphorescence
-
- G—PHYSICS
- G01—MEASURING; TESTING
- G01N—INVESTIGATING OR ANALYSING MATERIALS BY DETERMINING THEIR CHEMICAL OR PHYSICAL PROPERTIES
- G01N27/00—Investigating or analysing materials by the use of electric, electrochemical, or magnetic means
- G01N27/26—Investigating or analysing materials by the use of electric, electrochemical, or magnetic means by investigating electrochemical variables; by using electrolysis or electrophoresis
- G01N27/416—Systems
- G01N27/447—Systems using electrophoresis
- G01N27/44704—Details; Accessories
- G01N27/44717—Arrangements for investigating the separated zones, e.g. localising zones
- G01N27/44721—Arrangements for investigating the separated zones, e.g. localising zones by optical means
-
- G—PHYSICS
- G01—MEASURING; TESTING
- G01N—INVESTIGATING OR ANALYSING MATERIALS BY DETERMINING THEIR CHEMICAL OR PHYSICAL PROPERTIES
- G01N27/00—Investigating or analysing materials by the use of electric, electrochemical, or magnetic means
- G01N27/26—Investigating or analysing materials by the use of electric, electrochemical, or magnetic means by investigating electrochemical variables; by using electrolysis or electrophoresis
- G01N27/416—Systems
- G01N27/447—Systems using electrophoresis
Definitions
- the present invention relates to electrophoresis systems, electrophoresis data processing devices, and electrophoresis data processing methods.
- Multi-capillary electrophoresis systems are widely used in the analysis of biological samples.
- multiple capillaries are filled with electrophoretic separation media such as electrolyte solutions, polymer gels, and electrolyte solutions containing polymers, and electrophoretic analysis is performed in parallel.
- electrophoretic separation media such as electrolyte solutions, polymer gels, and electrolyte solutions containing polymers, and electrophoretic analysis is performed in parallel.
- a wide range of objects can be analyzed using electrophoresis, from low molecular weight molecules to polymers such as proteins and DNA (deoxyribonucleic acid).
- excitation light is irradiated onto a sample with fluorescently labeled DNA, and the fluorescent signal emitted by the fluorescent label is detected.
- the DNA base sequence and length are then analyzed based on the detected fluorescent signal.
- the fluorescent signal is detected by an image sensor such as a CCD (Charge Coupled Device) image sensor or a CMOS (Complementary Metal Oxide Semiconductor) image sensor.
- the multi-capillary electrophoresis system then detects the signal intensity for each wavelength based on the detected fluorescent signal.
- signal strength varies depending on the concentration of the sample. Therefore, while it is important to improve the detection sensitivity of the image sensor to detect weak signals, it is also important to expand the dynamic range to detect strong signal strengths.
- Binning which artificially combines the multiple light receiving surfaces (corresponding to pixels) that make up the image sensor and treats them as a single pixel, is known as a means of expanding the dynamic range of an image sensor.
- Patent Document 1 states that "if the fluorescence signal intensity obtained by executing the hardware binning exceeds a first threshold, the fluorescence detection device switches to the software binning to obtain the fluorescence signal intensity, and if the fluorescence signal intensity obtained by executing the software binning is equal to or less than the first threshold, the fluorescence detection device switches to the hardware binning to obtain the fluorescence signal intensity" (see claim 2).
- the multi-capillary electrophoresis system also outputs the generated data as a file called a primary analysis file.
- Secondary analysis involves analyzing the base sequence and length of nucleic acids from the data in the output primary analysis file. Secondary analysis is carried out by inputting the primary analysis file output by the multi-capillary electrophoresis system into secondary analysis software for carrying out secondary analysis. This makes it possible to analyze the base sequence and length of DNA.
- the range of signal intensities that can be input into secondary analysis software is fixed.
- the range of signal intensities that can be output by a multi-capillary electrophoresis system is larger than the range of signal intensities that can be input into secondary analysis software.
- Non-Patent Document 1 states, "The CCD detector and computer software in the ABI Genetic Analyzers use a 2-byte system for data storage, which enables fluorescence values to be encoded with 16 bits (each bit holding a value of 0 or 1). This 2-byte storage format enables the data collection and The software should provide a range of 0 to 65,535 in decimal (base-10) digits, or 0000000000000000 to 1111111111111111 in binary (base-2) digits. If both positive and negative values are permitted, then the maxima of a 2-byte storage system are +32,767 and -32,767.”
- a reagent called a primer which is used for amplifying DNA. Because the primer is added in excess compared to the DNA to be analyzed, the signal intensity due to the primer is greater than the signal intensity due to the DNA. In addition, because the primer is shorter than the DNA to be analyzed, it is detected earlier than the DNA to be analyzed.
- the signal intensity of the primary analysis file may be significantly greater than the range of signal intensities that can be input to the secondary analysis software due to the influence of fluorescent signals resulting from the primers.
- the signal intensity of the primary analysis file may be compressed so that it can be used in the secondary analysis software, but the compression rate in the signal intensity direction may become large, and information on DNA with minute signal intensities to be analyzed may be lost.
- Patent Document 2 states, "A method for clutter rejection, the method comprising the steps of: selecting a first set of data points from a set of data points filtered using an initial threshold criterion; selecting a plurality of overlapping subsets of data points from the first set of data points; applying a plurality of linear mappings to the plurality of overlapping subsets of data points; determining a plurality of error values from applying the plurality of linear mappings to the plurality of overlapping subsets of data points; and selecting a first final subset of overlapping data points with a minimum error value from the first set of data points, the first final subset of overlapping data points having data points within a standardized range and outlying data points removed" (see claim 9).
- Patent Document 1 describes a fluorescence detector that performs software binning. However, Patent Document 1 does not describe how to convert the large signal intensity obtained by software binning into a range of values that can be input into secondary analysis software.
- Non-Patent Document 1 also describes that the signal intensity that can be acquired by a CCD image sensor is "0" to "65,535", and that software converts this to a value range of "-32,767” to "32,767".
- the signal intensity that can be acquired increases, and the compression ratio in the signal intensity direction increases. This can result in the loss of DNA information with a small signal intensity to be analyzed. For this reason, it is necessary to minimize (optimize) the compression ratio in the signal intensity direction.
- Non-Patent Document 1 does not describe the compression method when software binning is implemented.
- Patent Document 2 describes a method for reducing data points by removing clutter, but does not describe a method for removing fluorescence caused by primers that increase signal intensity in the data output by the multi-capillary electrophoresis system.
- the present invention was made in light of this background, and its objective is to provide an appropriate compression method for fluorescent signal data.
- the present invention is characterized by comprising an electrophoresis device; a software binning processing unit that acquires from the electrophoresis device an analyte sample signal, which is a signal related to an analyte sample that has been subjected to hardware binning, and a matrix standard signal, which is a signal related to a matrix standard that has been subjected to hardware binning, and performs software binning on the analyte sample signal and the matrix standard signal; a fluorescence signal data generation unit that generates fluorescence signal data, which is data related to the fluorescence signal intensity for each frame, based on the analyte sample signal that has been subjected to the software binning and the matrix standard signal that has been subjected to the software binning; a compression range setting unit that distinguishes between and detects, for fluorescence signals included in the fluorescence signal data, a first fluorescence signal attributable to the analyt
- the present invention allows for appropriate compression of fluorescence signal data.
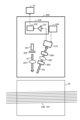
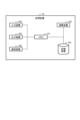
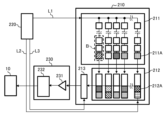
- FIG. 1 is a diagram showing an outline of a configuration example of an electrophoresis system according to a first embodiment
- FIG. 1 is a diagram showing an outline of the configuration of a fluorescence detection device according to a 1-1 embodiment.
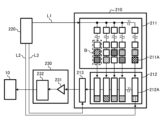
- FIG. 1 is a diagram showing an outline of the configuration of a CCD image sensor in the first embodiment;
- FIG. 1 is a diagram showing a configuration of a processing apparatus according to a first embodiment;
- FIG. 2 illustrates an example of a hardware configuration of a processing device.
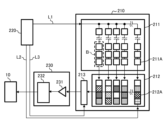
- FIG. 13 is a diagram (part 1) for explaining the operation of converting the dispersed fluorescence into a digital signal.
- FIG. 2 is a diagram (part 2) for explaining the operation of converting the dispersed fluorescence into a digital signal.
- FIG. 13 is a diagram (part 1) for explaining the operation of converting the dispersed fluorescence into a digital signal.
- FIG. 2 is a diagram (part 2) for explaining the operation of converting the dispersed fluorescence
- FIG. 11 is a diagram (part 3) for explaining the operation of converting the dispersed fluorescence into a digital signal.
- FIG. 4 is a diagram (part 4) for explaining the operation of converting the dispersed fluorescence into a digital signal.
- FIG. 5 is a diagram (part 5) for explaining the operation of converting the dispersed fluorescence into a digital signal.
- FIG. 4 is a diagram showing timing at which the control device applies pulses.
- FIG. 13 illustrates the generation of soft bins.
- FIG. 13 illustrates an example of a generalized bin and soft bin configuration.
- 11 is a diagram showing an example of a correspondence relationship between a soft bin and a bin; FIG.
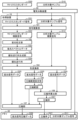
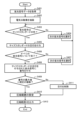
- FIG. 11 is a flowchart showing a procedure of a compression range determination process performed by a compression range setting unit in the 1-1 embodiment.
- FIG. 1 is a diagram showing an example of an electrophoretic image (part 1).
- 11 is a flowchart showing a procedure of a compression ratio calculation process performed by a compression ratio calculation unit in the 1-1 embodiment.
- 11 is a flowchart showing a procedure of a compression process performed by a compression unit in the first embodiment;
- FIG. 2 is a diagram showing an example of an electrophoretic image (part 2).
- FIG. 3 is a diagram showing an example of an electrophoretic image (part 3).
- FIG. 4 is a fourth example of an electrophoretic image.
- FIG. 5 is a fifth example of an electrophoretic image.
- FIG. 1 is a diagram showing an example of an electrophoretic image (part 1).
- 11 is a flowchart showing a procedure of a compression ratio calculation process performed by a compression ratio calculation unit in the 1-1 embodiment.
- FIG. 6 is a diagram showing an example of an electrophoretic image.
- FIG. 2 is a diagram showing a configuration of a processing apparatus according to a second embodiment; 13 is a flowchart showing the procedure of a compression range determination process performed by a compression range setting unit in the second embodiment;
- FIG. 7 is a diagram showing an example of an electrophoretic image.
- FIG. 8 is a diagram showing an example of an electrophoretic image.
- FIG. 9 is a diagram showing an example of an electrophoretic image.
- FIG. 10 is a diagram showing an example of an electrophoretic image.
- FIG. 11 is an example of an electrophoretic image.
- FIG. 13 is a diagram showing an example of a secondary analysis screen displayed in this embodiment.
- FIG. 1 is a diagram showing an outline of a configuration example of an electrophoresis system 1 according to the first embodiment.
- the electrophoresis system 1 includes a processing device 10 which is an electrophoresis data processing device, an electrophoresis device 20, and an external memory 30.
- the external memory 30 is a USB (Universal Serial Bus) memory, an external HD (Hard Disk), or the like.
- the electrophoresis apparatus 20 is a multi-capillary electrophoresis apparatus, and includes a pump unit 21, a high-voltage power supply 22, a thermostatic bath 23, a fluorescence detection apparatus 200, and a capillary array 240.
- the electrophoresis apparatus 20 also includes a sample tray 250 and a transporter 260.
- the sample tray 250 contains multiple sample containers 251.
- Each sample container 251 is a container that contains a sample in which a fluorescent label has been added to DNA, which is the object to be measured.
- Each sample container 251 contains a different sample.
- the transporter 260 transports the sample tray 250 so that each sample container 251 is positioned at the tip of the capillary 241.
- the capillary array 240 is composed of a plurality of capillaries 241. Each capillary 241 is hollow. Each capillary 241 is inserted into a sample container 251.
- the thermostatic chamber 23 keeps the inside of the capillary array 240 at a constant temperature.
- the pump unit 21 injects an electrophoretic medium M (e.g., a polymer) into the inside of each capillary 241. As a result, the inside of each capillary 241 is filled with the electrophoretic medium M.
- an electrophoretic medium M e.g., a polymer
- the high-voltage power supply 22 applies a high voltage to both ends of each capillary 241 filled with an electrophoretic medium M.
- the fluorescence detection position 24 is provided on the path along which the sample is electrophoresed. At the fluorescence detection position 24, the sample is irradiated with excitation light R1 (see FIG. 2).
- the sample is electrophoresed by the application of voltage from the high-voltage power supply 22, and moves inside the capillary 241.
- the direction of movement of the sample is indicated by an arrow.
- the sample that has moved inside the capillary 241 is irradiated with excitation light R1 (see FIG. 2) at the fluorescence detection position 24, and emits fluorescence R2 (see FIG. 2).
- the sample is then discharged into the discharge container 25.
- the fluorescence detection device 200 detects the fluorescence R2 emitted from the sample at the fluorescence detection position 24.
- the detailed configuration of the fluorescence detection device 200 will be described later.
- the sample passing through the inside of the capillary 241 is assumed to be a DNA fragment with a fluorescent label added, but samples other than DNA fragments may also be used.
- the processing device 10 includes a signal integration unit 101, which is a software binning processing unit, a fluorescence calibration unit 102, a color conversion unit 104, a compression range setting unit 105, a compression ratio calculation unit 106, a compression unit 107, etc.
- the detailed configuration of the processing device 10 will be described later.
- FIG. 2 is a diagram showing an outline of the configuration of a fluorescence detection device 200 according to the 1-1 embodiment. 2 , the fluorescence detection device 200 has an excitation light source 201, a shutter 202, and an excitation light lens 203. The fluorescence detection device 200 also has an optical filter 204, a fluorescence lens 205, a diffraction grating 206, and a CCD image sensor 210. The fluorescence detection device 200 further has a control device 220 and a conversion device 230.
- the excitation light source 201 continuously emits the excitation light R1.
- the excitation light source 201 is provided so that all the capillaries 241 in the capillary array 240 passing through the fluorescence detection position 24 are irradiated with the emitted excitation light R1.
- the shutter 202 repeatedly opens and closes at predetermined intervals. That is, when the shutter 202 is open, the excitation light R1 emitted from the excitation light source 201 is irradiated onto the capillary 241. When the shutter 202 is closed, the irradiation of the excitation light R1 onto the capillary 241 is blocked. The period from when the shutter 202 is closed to when the shutter 202 is opened and closed again is called a frame.
- the excitation light lens 203 focuses the excitation light R1 that has passed through the shutter 202.
- the excitation light R1 focused by the excitation light lens 203 is irradiated toward the fluorescence detection position 24.
- each capillary 241 the samples passing through the inside of each capillary 241 are DNA fragments to which fluorescent labels have been added, as described above.
- the fluorescent labels added to the DNA fragments undergoing electrophoresis inside each capillary 241 are excited by irradiation with excitation light R1, and emit fluorescence R2.
- the optical filter 204 cuts out light other than the fluorescence R2 emitted from the fluorescent label.
- a color filter is used as the optical filter 204 .
- the fluorescent lens 205 collects the fluorescent light R2 that has passed through the optical filter 204 .
- the diffraction grating 206 separates the fluorescence R2 collected by the fluorescent lens 205 into components according to wavelength.
- the CCD image sensor 210 receives the fluorescence R2 dispersed by the diffraction grating 206, and outputs an electric charge according to the intensity of the fluorescence R2.
- the control device 220 instructs the CCD image sensor 210 to output a charge based on the fluorescence R2.
- the conversion device 230 has a charge conversion section 231 and a digital conversion section 232 which is an ADC (Analog digital converter).
- the charge conversion section 231 converts the charge output from the CCD image sensor 210 into a voltage, and outputs the converted voltage as an analog signal.
- the digital conversion section 232 converts the analog signal output from the charge conversion section 231 into a digital signal. Then, the digital conversion section 232 outputs the converted digital signal to the processing device 10.
- a sample is placed in a sample container 251. Then, a high voltage is applied to both ends of each capillary 241 by the high-voltage power supply 22, so that the sample moves from the sample container 251 into the capillary 241. As a result, the sample moves inside the capillary 241 toward the discharge container 25 via the fluorescence detection position 24 (arrow in FIG. 1: electrophoresis).
- the moving speed differs depending on the base length of the DNA fragment as the sample, so that the DNA fragment with the shortest base length arrives at the fluorescence detection position 24 in order.
- the excitation light R1 emitted from the excitation light source 201, passing through the shutter 202, and collected by the excitation light lens 203 is irradiated onto the sample that has arrived at the fluorescence detection position 24.
- the fluorescent label attached to the DNA fragment is excited by the irradiation of the excitation light R1, and emits fluorescence R2.
- the fluorescence R2 passes through the optical filter 204, is collected by the fluorescent lens 205, and is separated into wavelengths by the diffraction grating 206.
- the CCD image sensor 210) 3 is a diagram showing an outline of the configuration of the CCD image sensor 210 in the first embodiment, with reference to FIG.
- the CCD image sensor 210 has a light receiving section 211 , a horizontal register section 212 , and a summing gate 213 .
- the light receiving unit 211 has a plurality of light receiving elements 211A arranged in a lattice pattern. Each light receiving element 211A is a surface that receives the fluorescence R2 separated by the diffraction grating 206 for each wavelength.
- the light receiving element 211A receives the light that is separated by the diffraction grating 206 from the fluorescence R2 emitted from the capillary 241 provided in the electrophoresis system 1.
- the light receiving element 211A receives the fluorescence R2, it accumulates a signal charge according to the intensity of the fluorescence R2.
- the light receiving unit 211 is also connected to the control device 220 by a pulse line L1.
- the signal charge accumulated in each light receiving element 211A constituting the light receiving unit 211 is output in response to an instruction from the control device 220 through the pulse line L1. Details of the output of the signal charge by the light receiving element 211A will be described later.
- the summing gate 213 further accumulates the signal charges accumulated by the horizontal register section 212.
- the summing gate 213 is connected to the control device 220 via a pulse line L3.
- the summing gate 213 outputs the accumulated signal charges in response to an instruction from the control device 220 via the pulse line L3.
- the CCD image sensor 210 can be of any of the following types: frame transfer type, full frame transfer type, interline transfer type, and frame interline transfer type.
- frame transfer type, interline transfer type, or frame interline transfer type there is no need to provide a shutter 202 (see FIG. 2).
- full frame transfer type it becomes possible to detect minute signals by increasing the number of light receiving elements 211A and the area of the light receiving elements 211A.
- CMOS image sensor Complementary Metal Oxide Semiconductor
- CMOS image sensor may be used to detect the fluorescence R2 (see FIG. 2) instead of the CCD image sensor 210.
- CMOS image sensor it becomes possible to directly obtain a digital signal from each light receiving element 211A.
- FIG. 4 is a diagram showing the configuration of a processing apparatus 10 according to the first embodiment, with reference to FIGS. 1 and 2 as appropriate.
- the processing device 10 has a signal integration unit 101, a fluorescence calibration unit 102, a pseudo-inverse matrix generation unit 103, and a color conversion unit 104.
- the processing device 10 also has a compression range setting unit 105, a compression rate calculation unit 106, and a compression unit 107.
- the signal integration unit 101 constitutes a software binning processing unit.
- the fluorescence calibration unit 102, the pseudo-inverse matrix generation unit 103, and the color conversion unit 104 constitute a fluorescence signal data generation unit.
- a matrix standard D20 is used in addition to the sample to be analyzed D10.
- the matrix standard D20 is a sample for fluorescence calibration.
- the sample to be analyzed D10 is a mixture of DNA fragments to which fluorescent labels have been added and primers.
- the primers are reagents used for amplifying DNA, and are added to the sample to be analyzed D10.
- the electrophoresis device 20 outputs an analysis sample signal D11, which is a digital signal (signal) of the analysis sample D10, from the analysis sample D10 using the method shown in Figures 6 to 11.
- the analysis sample signal D11 that is output is composed of signal intensities for each bin B.
- the output analysis sample signal D11 is input to the signal integration unit 101 of the processing device 10.
- the analysis sample signal D11 is a signal related to the analysis sample D10 that has been subjected to hardware binning.
- the electrophoresis device 20 also measures the matrix standard D20 in addition to the analysis target sample D10.
- the electrophoresis device 20 outputs a matrix standard signal D21, which is a digital signal of the matrix standard D20, using the method shown in Figures 6 to 11.
- the output matrix standard signal D21 is composed of signal intensities related to each bin B.
- the output matrix standard signal D21 is input to the signal integration unit 101 of the processing device 10.
- the analysis target sample D10 and the matrix standard D20 are measured separately.
- the matrix standard signal D21 is a signal related to the matrix standard D20 that has been subjected to hardware binning.
- the signal integration unit 101 acquires the analysis sample signal D11 and the matrix standard signal D21 from the electrophoresis device 20.
- the signal integration unit 101 integrates the input analysis target sample signal D11, which is a digital signal related to bin B of the analysis target sample D10, for each bin B. Through this integration, the signal integration unit performs software binning. Software binning will be described later, but it is a further binning performed on the results of hardware binning performed by the horizontal register unit 212 and summing gate 213 shown in FIG. 3.
- the signal integration unit 101 then outputs an analysis target sample integration signal D12, which is the result of integrating the analysis target sample signal D11 for each bin B, to the color conversion unit 104.
- the signal integration unit 101 also integrates the input matrix standard signal D21, which is a digital signal related to bin B of the matrix standard D20, for each bin B.
- the signal integration unit 101 then outputs a matrix standard integration signal D22, which is the result of integrating the matrix standard signal D21 for each bin B, to the fluorescence calibration unit 102.
- the signal integration unit 101 performs software binning on the matrix standard signal D21.
- the signal integration unit 101 performs software binning on the analysis target sample signal D11 and the matrix standard signal D21.
- the fluorescence calibration unit 102 normalizes the matrix standard integration signal D22 output from the signal integration unit 101 for each frame so that the maximum signal intensity is "1", and outputs the normalized signal to the pseudo-inverse matrix generation unit 103.
- the matrix standard integration signal D22 normalized by the fluorescence calibration unit 102 is called fluorescence spectrum data D23.
- the pseudo-inverse matrix generation unit 103 acquires the fluorescence spectrum data D23 output from the fluorescence calibration unit 102 and generates a pseudo-inverse matrix D24 of the fluorescence spectrum data D23.
- the generated pseudo-inverse matrix D24 is output to the color conversion unit 104.
- the color conversion unit 104 acquires the analysis target sample integrated signal D12 from the signal integration unit 101, and acquires the pseudo-inverse matrix D24 from the pseudo-inverse matrix generation unit 103. Next, the color conversion unit 104 multiplies the analysis target sample integrated signal D12 acquired from the signal integration unit 101 by the acquired pseudo-inverse matrix D24. This generates fluorescence signal data D25. The color conversion unit 104 outputs the generated fluorescence signal data D25 to the compression range setting unit 105, the compression rate calculation unit 106, and the compression unit 107.
- the fluorescence calibration unit 102, the pseudo-inverse matrix generation unit 103, and the color conversion unit 104 generate fluorescence signal data D25, which is data related to the fluorescence signal intensity for each frame.
- the fluorescence signal data D25 is generated based on the analysis target sample signal D11 that has been subjected to software binning, and the matrix standard signal D21 that has been subjected to software binning.
- the compression range setting unit 105 acquires the fluorescent signal data D25 from the color conversion unit 104, it generates an electrophoretic image EP (see FIG. 16). Then, the compression range setting unit 105 sets a compression range H (see FIG. 20) based on the generated electrophoretic image EP. The method for setting the compression range H will be described later. Thereafter, the compression range setting unit 105 outputs the set compression range H to the compression ratio calculation unit 106 and the compression unit 107.
- the compression ratio calculation unit 106 acquires the compression range H from the compression range setting unit 105, and acquires the fluorescence signal data D25 from the color conversion unit 104. The compression ratio calculation unit 106 then calculates the compression ratio D27 of the fluorescence signal data D25 based on the acquired compression range H and the fluorescence signal data D25. The method of calculating the compression ratio D27 by the compression ratio calculation unit 106 will be described later. The compression ratio calculation unit 106 outputs the calculated compression ratio D27 to the compression unit 107 and the external memory 30, etc.
- the compression unit 107 obtains the compression ratio D27 from the compression ratio calculation unit 106, as well as the fluorescence signal data D25 from the color conversion unit 104 and the compression range H from the compression range setting unit 105. The compression unit 107 then compresses the fluorescence signal data D25 based on the compression range H and the compression ratio D27 to generate compressed fluorescence signal data D28. The method of generating the compressed fluorescence signal data D28 will be described later. The compression unit 107 outputs the compressed fluorescence signal data D28 to the external memory 30, etc.
- FIG. 5 is a diagram illustrating an example of a hardware configuration of the processing device 10.
- the processing device 10 includes a memory 151 , a calculation device 152 , a storage device 153 , an input device 154 , an output device 155 , and a communication device 156 .
- the memory 151 is composed of a RAM (Random Access Memory) or the like.
- the arithmetic device 152 is composed of a CPU (Central Processing Unit), a GPU (Graphic Processing Unit), or the like.
- the storage device 153 is composed of a HD (Hard Disk), a SSD (Solid State Drive), or the like.
- the input device 154 is composed of a keyboard, buttons, or the like.
- the output device 155 is composed of a display or the like. The input device 154 and the output device 155 may be integrated into a touch panel display or the like.
- the program stored in the storage device 153 is loaded into the memory 151.
- the loaded program is then executed by the calculation device 152.
- This embodies the signal integration unit 101, the fluorescence calibration unit 102, the pseudo-inverse matrix generation unit 103, the color conversion unit 104, the compression range setting unit 105, the compression ratio calculation unit 106, and the compression unit 107 shown in FIG. 4.
- the processing device 10 and the electrophoresis device 20 may be an integrated device, or may be separate devices.
- the control device 220 and the conversion device 230 shown in FIG. 2 may be mounted on the processing device 10.
- Figures 6 to 10 are diagrams for explaining the operation of converting the dispersed fluorescence R2 (see Figure 2) into a digital signal. Please refer to Figure 2 as appropriate.
- the dashed lines shown on the light receiving element 211A indicate bin B. Bin B will be described later, and is a group of multiple light receiving elements 211A that is regarded as a single light receiving element 211A in a pseudo manner.
- the fluorescence R2 separated into wavelengths as shown in FIG. 2 is received by the light receiving element 211A of the electrophoresis device 20, and the signal charge is accumulated as shown in FIG. 6.
- the pattern shown on the light receiving element 211A indicates the signal charge accumulated in each light receiving element 211A.
- the control device 220 applies a pulse to the pulse line L1 to vertically transfer the signal charge accumulated in each light receiving element 211A.
- a pulse is applied to the pulse line L1
- the signal charge accumulated in each light receiving element 211A is vertically transferred from light receiving element 211A to light receiving element 211A.
- control device 220 applies a pulse to the pulse line L1 again, which transfers the signal charge accumulated in each light receiving element 211A in the vertical direction.
- a pulse is applied to the pulse line L1
- the signal charge accumulated in the light receiving elements 211A is transferred vertically and sequentially.
- each horizontal register 212A accumulates the previously transferred signal charge and the currently transferred signal charge.
- each of the signal charges accumulated at the positions in Figure 7 is transferred to the positions in Figure 8.
- control device 220 further applies a pulse to the pulse line L1 to transfer the signal charge accumulated in each of the light receiving elements 211A in the vertical direction.
- a pulse is applied to the pulse line L1
- the signal charge accumulated in each of the light receiving elements 211A is transferred vertically and sequentially from light receiving element 211A to light receiving element 211A.
- each horizontal register 212A accumulates the signal charge transferred two times previously, the signal charge transferred previously, and the signal charge transferred this time.
- each time a pulse is applied to the pulse line L1 the signal charge accumulated in the light receiving element 211A is sequentially transferred to the horizontal register 212A.
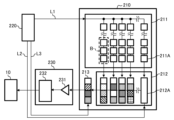
- a pulse is applied to the pulse line L1 a total of three times, causing signal charge to accumulate in the horizontal register 212A as shown in FIG. 9.
- control device 220 applies a pulse to the pulse line L2 to horizontally transfer the signal charges stored in the horizontal registers 212A.
- a pulse is applied to the pulse line L2
- the signal charges stored in each horizontal register 212A are transferred horizontally and sequentially. The timing at which the pulse is applied to the pulse line L2 will be described later.
- the signal charge stored in the horizontal register 212A at the end of the horizontal direction is transferred to the summing gate 213. As a result, the signal charge is transferred to the position shown in FIG. 10.
- control device 220 applies a pulse to the summing gate 213 via the pulse line L3, causing the summing gate 213 to output the signal charge to the conversion device 230 (see Figure 3).
- FIG. 11 is a diagram showing the timing at which the control device 220 applies pulses. 11 shows, from the top of the page, the timing of a pulse applied to the light receiving section 211, the timing of a pulse applied to the horizontal register section 212, and the timing of a pulse applied to the summing gate 213.
- the signal charges corresponding to multiple light receiving elements 211A are accumulated in the summing gate 213 by the operation described with reference to Figures 6 to 10, so that they can be treated as a single light receiving element 211A. Treating multiple light receiving elements 211A as a single light receiving element 211A in this manner is called hardware binning. In addition, the pseudo-combined light receiving elements 211A are called bin B (see Figure 3).
- a total of three light receiving elements 211A, three in the vertical direction and one in the horizontal direction, are hardware binned as one bin B.
- signal charges are accumulated in the horizontal register 212A and summing gate 213. That is, in the example shown in FIG. 6 to 11, as in the example shown in FIG. 11, a pulse is applied three times in succession to the light receiving section 211, and then a pulse is applied once to the horizontal register section 212. Then, a pulse is applied once to the summing gate 213.
- the bin B generated by this hardware binning is the bin B shown in FIG. 3.
- the area to be hardware binned does not have to be limited to the example shown in FIG. 6 to 11.
- the sensitivity of the CCD image sensor 210 can be changed. That is, the size of the bin B is variable. That is, the size of the bin B can be changed for each electrophoresis.
- one set (period T) is made up of three pulses to the light receiving section 211, one pulse to the horizontal register section 212, and one pulse to the summing gate 213, and such sets are repeated multiple times. The sets are repeated until all of the signal charges stored in the light receiving section 211 are transferred to the summing gate 213.
- the signal charges accumulated in the summing gate 213 are converted by the charge conversion unit 231 into a voltage corresponding to the number of signal charges transferred from the summing gate 213.
- the charge conversion unit 231 outputs the converted voltage as an analog signal to the digital conversion unit 232.
- the charge conversion unit 231 to which the signal charges have finally been transferred from the summing gate 213 outputs a voltage corresponding to the amount of transferred signal charge as an analog signal.
- the analog signal output from the charge conversion unit 231 is converted into a digital signal by the digital conversion unit 232.
- the converted digital signal is output to the processing device 10, the external memory 30, etc.
- the digital signal will be appropriately referred to as the "signal”
- the digital signal strength which is the strength of the digital signal, will be appropriately referred to as the "signal strength”.
- the digital conversion unit 232 converts the analog signal value when the summing gate 213 is saturated into a digital signal value of "65535" (ADU).
- FIG. 12 is a diagram showing the generation of a soft bin C.
- FIG. 12 shows that in one frame, the digital signal is integrated for each bin B to generate a soft bin C.
- the signal integration unit 101 can further treat a plurality of bins B as a single bin B in a pseudo manner by integrating the digital signal related to the input bin B. Treating a plurality of bins B as a single bin B in this manner is called software binning.
- the pseudo-combined bin B is called a soft bin C.
- FIG. 14 is a table showing an example of bins B constituting a soft bin C. Note that the area to be software binned is not limited to the examples shown in FIG. 12 and FIG. 14.
- the sensitivity of the CCD image sensor 210 can be changed by changing (making variable) the area to be software binned. In other words, the size of the soft bin C is variable.
- soft bins C1 to C20 are generated by performing software binning on 12 of the 240 bins B1 to B240 (B) output as a result of hardware binning.
- the value "30000” shown for each bin B is the signal strength output from that bin.
- a uniform signal strength of "30000” is output from each bin B.
- the value "360000” shown for each soft bin C is the signal strength output from that bin.
- FIG. 13 is a diagram showing an example of the configuration of a generalized bin B and soft bin C.
- FIG. 14 is a diagram showing an example of the correspondence between soft bin C and bin B.
- one bin B can be considered to be composed of m light receiving elements 211A in the vertical direction and n light receiving elements 211A in the horizontal direction.
- the bins B1 to BN shown in FIG. 13 do not overlap with each other.
- the size of bin B can be changed by changing the timing at which the control device 220 applies pulses.
- the soft bins C1-CL shown in Figure 13 do not overlap with each other.
- Figure 14 shows that, like Figure 12, soft bins C1-C20 (C) are generated by performing software binning on 12 of the 240 bins B1-B240 (B).
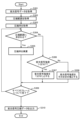
- Fig. 15 is a flowchart showing the procedure of the compression range determination process, which is the compression range setting step performed by the compression range setting unit 105 in the 1-1 embodiment.
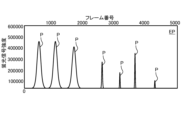
- Fig. 16 is a diagram showing an example of an electrophoretic image EP. Fig. 4 will be referred to as appropriate.
- the compression range determination process aims to separate the fluorescent signal P caused by the primers from the fluorescent signal P caused by the DNA in order to appropriately compress the fluorescent signal P caused by the DNA.
- the compression range setting unit 105 acquires the fluorescence signal data D25 from the color conversion unit 104 (S101).
- step S101 the compression range setting unit 105 acquires the fluorescence signal data D25 for all frames. Note that in subsequent processes similar to step S101, the fluorescence signal data D25 for all frames is also acquired. Furthermore, the fluorescence signal data D25 is the result of software binning.
- the compression range setting unit 105 draws (generates) an electrophoretic image EP (see FIG. 16) of the fluorescent signal data D25 (S102).
- the electrophoretic image EP is a graph of the fluorescent signal data D25.
- the compression range setting unit 105 draws a graph of the fluorescent signal data D25 with the horizontal axis representing the frame number and the vertical axis representing the fluorescent signal intensity of the frame number.
- the frame number is a number assigned to each frame in order of the earliest time.
- a graph with the horizontal axis representing the frame number and the vertical axis representing the fluorescent signal intensity of the frame is called an electrophoretic image EP.
- the electrophoretic image EP is drawn for each electrophoresis.
- the signal intensity of the fluorescent signal data D25 is constant.
- the signal intensity in the fluorescent signal data D25 is called the fluorescent signal intensity.
- a predetermined value is generally added to the calculated fluorescent signal intensity. Therefore, even when the CCD image sensor 210 is not irradiated with fluorescent light R, the fluorescent signal intensity generally has a predetermined value.
- the electrophoretic image EP has different fluorescence signal intensities for each frame number.
- the electrophoretic image EP contains multiple mountain-like shapes as shown in FIG. 16. Each mountain-like shape is referred to as a fluorescence signal P.
- the electrophoretic image EP has frame numbers from "1" to "5000".
- the compression range setting unit 105 selects one of the fluorescent signals P contained in the generated electrophoretic image EP. In doing so, the compression range setting unit 105 searches the electrophoretic image EP shown in Fig. 16 from frame number "1" to "5000" to obtain a range of frame numbers in which the fluorescent signal intensity is equal to or greater than a predetermined value. The compression range setting unit 105 selects the fluorescent signal intensity corresponding to this range of frame numbers as one fluorescent signal P.
- the compression range setting unit 105 judges whether or not the width (frame number) of the selected fluorescent signal P is equal to or greater than a first threshold value (S103).
- the first threshold value is set to a value that is sufficiently smaller than the width of the fluorescent signal P caused by the primers and sufficiently larger than the width of the fluorescent signal P caused by the DNA to be analyzed. Since the primers are added in excess compared to the DNA to be analyzed, the fluorescent signal intensity is large. In other words, the width of the fluorescent signal P caused by the primers is larger than the width of the fluorescent signal P caused by the DNA.
- the width of the fluorescent signal P that is known to be caused by the primer is preset as the first threshold.
- the width of the fluorescent signal P is defined by the start frame number and end frame number of the fluorescent signal P.
- the start frame number is defined as the first frame number at which the value of the fluorescent signal P becomes equal to or greater than a predetermined value.
- the end frame number is defined as the frame number after the start frame number, and as the first frame number at which the value of the fluorescent signal P becomes equal to or less than a predetermined value.
- the value of the first threshold is not limited to "50".
- the full width at half maximum may be used as the width of the fluorescent signal P. By using the full width at half maximum, it is possible to reduce the influence of the baseline.
- the compression range setting unit 105 determines whether the area of the fluorescent signal P is equal to or greater than the second threshold (S104).
- the second threshold is set to a value that is sufficiently smaller than the area of the fluorescent signal P caused by the primers and sufficiently larger than the area of the fluorescent signal P caused by the DNA to be analyzed. This is because, for the reasons described above, the area of the fluorescent signal P caused by the primers is characterized by being larger than the area of the fluorescent signal P caused by the DNA.
- the area of the fluorescent signal P that is known to be caused by the primer is set in advance as the second threshold.
- the compression range setting unit 105 determines whether the end frame number of the fluorescent signal P is less than the third threshold (S105).
- the third threshold is set to a value that is sufficiently greater than the end frame number of the fluorescent signal P caused by the primer and sufficiently smaller than the end frame number of the fluorescent signal P caused by the DNA to be analyzed.
- the end frame number of the fluorescent signal P known to be caused by the primer is set in advance as the third threshold. This is because the fluorescent signal P caused by the primer has the characteristic that it is detected before the fluorescent signal P caused by the DNA.
- the frame number "2500" is set as the third threshold.
- the compression range setting unit 105 determines that the target fluorescent signal P is a primer-derived fluorescent signal P. Then, the compression range setting unit 105 assigns a non-analysis marker JN (see FIG. 19) to the target fluorescent signal P (S106).
- step S103 if the width of the fluorescent signal P is less than the first threshold value (S103 ⁇ No), the compression range setting unit 105 determines that the target fluorescent signal P is a fluorescent signal P derived from the DNA to be analyzed. Then, the compression range setting unit 105 assigns the marker JY (see FIG. 19) to the target fluorescent signal P (S107).
- step S104 if the area of the fluorescent signal P is less than the second threshold value (S104 ⁇ No), the compression range setting unit 105 determines that the target fluorescent signal P is a fluorescent signal P derived from the DNA to be analyzed. Then, the compression range setting unit 105 assigns the marker JY (see FIG. 19) to the target fluorescent signal P (S107).
- step S105 if the end frame number of the fluorescent signal P is equal to or greater than the third threshold (S105 ⁇ No), the compression range setting unit 105 determines that this fluorescent signal P is a fluorescent signal P caused by the DNA to be analyzed. Then, the compression range setting unit 105 assigns the marker JY (see FIG. 19) to the fluorescent signal P to be analyzed (S107).
- the fluorescent signal P to which the analyte marker JY is attached is the first fluorescent signal caused by the analyte. That is, in the 1-1 embodiment, the fluorescent signal P derived from the DNA to be analyzed is the first fluorescent signal.
- the fluorescent signal P to which the non-analyte marker JN is attached is the second fluorescent signal caused by something other than the analyte. That is, in the 1-1 embodiment, the fluorescent signal P caused by the primer is the second fluorescent signal.
- the compression range setting unit 105 separates (distinguishes and detects) all the fluorescent signals P in the electrophoretic image EP into fluorescent signals P caused by the DNA being analyzed and fluorescent signals P caused by primers not being analyzed.
- the compression range setting unit 105 determines whether or not processing has been completed for all of the fluorescence signals P (S108). Whether or not processing has been completed for all of the fluorescence signals P is determined as follows. That is, the compression range setting unit 105 determines whether or not a fluorescence signal P is not detected from the fluorescence signal P for which processing has been completed until the last frame number of the electrophoretic image EP (see FIG. 16).
- the compression range setting unit 105 repeats the processing from step S103 onwards. If the processing has been completed for all frames (S108 ⁇ Yes), the compression range setting unit 105 determines whether or not a fluorescent signal P not to be analyzed has been detected (S109). That is, in step S109, the compression range setting unit 105 determines whether or not a fluorescent signal P to which a marker JN not to be analyzed has been added has been detected.
- the compression range setting unit 105 sets all frames as the compression range H (S111). For example, if the electrophoretic image EP has frame numbers from “1" to "5000” as shown in FIG. 16, the compression range setting unit 105 sets the range from "1" to "5000” as the compression range H.
- the compression range setting unit 105 detects the fluorescent signals contained in the fluorescent signal data D25 by distinguishing between the fluorescent signal P caused by the DNA to be analyzed and the fluorescent signal P caused by the primers. Then, the compression range setting unit 105 sets the compression range H for the frames of the fluorescent signal data D25 based on the result of this detection.
- the compression range setting unit 105 outputs the compression range H set in steps S110 and S111 to the compression ratio calculation unit 106 and the compression unit 107 (S112).
- the constants were set as the first threshold value of "50”, the second threshold value of "100000”, and the third threshold value of "2500", but these values are not limited to these.
- the first threshold value, the second threshold value, and the third threshold value are set appropriately based on the primers used in electrophoresis, DNA fragments, etc.
- the first threshold value, the second threshold value, and the third threshold value By setting the first threshold value, the second threshold value, and the third threshold value appropriately based on the primers used in electrophoresis, DNA fragments, etc., it is possible to appropriately distinguish between the analysis target and non-analysis target regardless of the electrophoresis conditions.
- the compression range setting unit 105 detects the fluorescent signal P contained in the fluorescent signal data D25 by distinguishing between the fluorescent signal P caused by the primers and the fluorescent signal P caused by the DNA to be analyzed. At this time, the compression range setting unit 105 performs this detection based on at least one of the width and area of the fluorescent signal P, and the last frame (end frame number) that includes the fluorescent signal P.
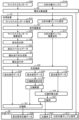
- compression ratio calculation process 17 is a flowchart showing the procedure of the compression ratio calculation process, which is the compression ratio calculation step performed by the compression ratio calculation unit 106 in the first embodiment.
- FIG. 4 will be referred to as appropriate.
- the compression ratio calculation unit 106 acquires the fluorescent light signal data D25 from the color conversion unit 104 (S201).
- the compression ratio calculation unit 106 acquires the compression range H from the compression range setting unit 105 (S202).
- the compression ratio calculation unit 106 renders (generates) an electrophoretic image EP (see FIG. 16 ) of the fluorescent signal data D25.
- the compression ratio calculation unit 106 then acquires a maximum signal intensity value D26, which is the maximum fluorescent signal intensity, from the fluorescent signal data D25 included in the compression range H (S203). Specific processing of step S203 will be described later.
- the maximum signal intensity value D26 is the maximum fluorescent signal intensity from the fluorescent signal data D25 included in the compression range H. In other words, the maximum signal intensity value D26 is the maximum value of the fluorescent signal intensity included in the compression range H.
- the compression ratio calculation unit 106 calculates a compression ratio D27 from the maximum signal strength value D26 and the upper limit of the value output by the compression unit 107 (S204).
- the compression ratio D27 is calculated as the upper limit of the value output by the compression unit 107 divided by the value of the maximum signal strength value D26.
- the upper limit of the value output by the compression unit 107 is "32767”.
- the upper limit of the value output by the compression unit 107 is a value determined by secondary analysis.
- the upper limit of the value output by the compression unit 107 is the maximum value (upper limit) of the signal strength that can be used in secondary analysis.
- secondary analysis is an analysis using data by the processing device 10.
- the upper limit of the value output by the compression unit 107 is not limited to "32767".
- the compression ratio calculation unit 106 calculates the compression ratio D27 based on the maximum signal intensity D26 of the fluorescent signal intensity included in the compression range H and the maximum signal intensity that can be used in the secondary analysis.
- the compression ratio calculation unit 106 outputs the calculated compression ratio D27 to the compression unit 107 and the external memory 30 (S205).
- compression process 18 is a flowchart showing the procedure of the compression process, which is the compression step performed by the compression unit 107 in the first embodiment.
- FIG. 4 will be referred to as appropriate.
- the compression unit 107 acquires the fluorescent light signal data D25 from the color conversion unit 104 (S301).
- the compression unit 107 acquires the compression range H from the compression range setting unit 105 (S302).
- the compression unit 107 acquires the compression ratio D27 from the compression ratio calculation unit 106 (S303).
- the compression unit 107 selects one frame constituting the acquired fluorescent light signal data D25.
- the compression unit 107 determines whether or not the selected frame is included in the compression range H (S304).
- the frame selection is preferably performed in ascending order of frame number.
- the compression unit 107 multiplies the fluorescence signal intensity of the fluorescence signal data D25 corresponding to the frame being processed by the compression rate D27 (S305).
- the compression unit 107 determines whether the fluorescent signal intensity of the selected frame is greater than "32767" (S306).
- the compression unit 107 sets the fluorescent signal intensity of the frame being processed to "32767” (S307). In other words, if the fluorescent signal intensity is greater than "32767" in an area outside the compression range H, the compression unit 107 rounds down the fluorescent signal intensity to "32767” (this does not mean that compression is performed).
- the fluorescent signal intensity of the frame being processed is left unchanged (S308).
- the compression unit 107 determines whether or not the processes of steps S304 to S308 have been completed for all frames (S309). If the processes of steps S304 to S308 have not been completed for all frames (S309 ⁇ No), the compression unit 107 returns to the process of step S304, and then performs the processes of steps S304 to S308 for the next frame.
- step S310 the compression unit 107 outputs the fluorescence signal data D25 that has been processed in steps S304 to S308 to the external memory 30 as compressed fluorescence signal data D28 (S310).
- the output target of step S310 is the external memory 30, but the compressed fluorescence signal data D28 may also be output directly to a computer that performs secondary analysis via a network, etc.
- the compression unit 107 generates compressed fluorescent signal data D28 by compressing the fluorescent signal data D25 based on the compression rate D27, and outputs the generated compressed fluorescent signal data D28. As shown in FIG. 4, the compression unit 107 outputs the analysis target sample signal D11 and the compression rate D27 in addition to the compressed fluorescent signal data D28.
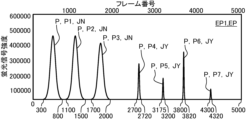
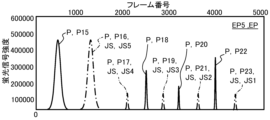
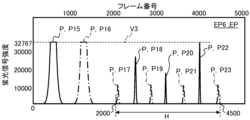
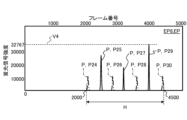
- Fig. 19 to Fig. 21 show electrophoretic images EP1, EP2 (EP) of an analysis target sample D10.
- the analysis target sample D10 includes a fluorescent signal P due to the DNA to be analyzed and a fluorescent signal P due to a primer not to be analyzed.
- 19 to 21 are diagrams showing examples of electrophoretic images EP.
- the first threshold is used in step S103 of Fig. 15, and in the example shown in Fig. 19, it is assumed that "50" frames are set as the first threshold.
- the second threshold is used in step S104 of Fig. 15, and in the example shown in Fig. 19, it is assumed that "10000000" is set as the second threshold as described above.
- the third threshold is used in step S105 of Fig. 15, and in the example shown in Fig. 19, it is assumed that "2500" frames are set as the third threshold as described above.
- the compression range setting unit 105 acquires the fluorescence signal data D25 from the color conversion unit 104 (S101). It is assumed that the compression range setting unit 105 renders the electrophoretic image EP1 (EP) shown in Fig. 19 in step S102. In Fig. 19, the numbers shown at the bottom indicate the frame numbers. For example, the fluorescence signal P1 (P) exists between frame numbers "300" and "800". The same is true for the other fluorescence signals P2 to P7 (P). Furthermore, frame number "5000" is the last frame number in the electrophoretic image EP1 (i.e., the fluorescence signal data D25).
- the area of fluorescence signal P1 is "100000000”
- the area of fluorescence signal P2 is "90000000”
- the area of fluorescence signal P3 is "70000000”.
- the area of fluorescence signal P4 is "2500000”
- the area of fluorescence signal P5 is "1000000”.
- the area of fluorescence signal P6 is "3000000"
- the area of fluorescence signal P7 is "500000”.
- the compression range setting unit 105 searches through these fluorescence signals P, starting from frame number "1," and processes the first detected fluorescence signal P1.
- the fluorescence signal P1 has a start frame number of "300” and an end frame number of "800", and therefore the frame width of the fluorescence signal P1 is "500” frames. Therefore, the frame width of the fluorescence signal P1 is equal to or greater than the first threshold value ("50" frames in this embodiment). Therefore, "Yes” is determined in step S103, and the compression range setting unit 105 proceeds to step S104.
- step S104 processing is performed based on the area of the fluorescence signal P1.
- the area of the fluorescence signal P1 is assumed to be "100000000.”
- the fluorescence signal P1 is equal to or greater than the second threshold value ("10000000" in this embodiment). Therefore, "Yes” is determined in step S104, and the compression range setting unit 105 proceeds to step S105.
- step S105 processing is performed based on the end frame number of the fluorescent signal P1.
- the end frame number of the fluorescent signal P1 is frame 800, which is less than the third threshold (frame 2500 in this embodiment).
- the primer is electrophoresed by hand, so it is known up to what time (i.e., frame number) the primer signal will reach. In addition, it is known that the primer will reach the fluorescence detection position 24 before the DNA.
- the third threshold is set in advance based on this information.
- step S105 returns "Yes” and the compression range setting unit 105 proceeds to step S106.
- step S106 the compression range setting unit 105 assigns a marker JN to the fluorescence signal P1, which is not subject to analysis, as shown in FIG. 19 (detected as a second fluorescence signal).
- step S108 the compression range setting unit 105 determines whether or not the processing for the fluorescence signal P1 has been completed for all the fluorescence signals P.
- the electrophoretic image EP1 in FIG. 19 does not include only the fluorescence signal P1 as the fluorescence signal P. Therefore, "No" is determined in step S108, and the compression range setting unit 105 repeats the processing from step S103 onwards for the fluorescence signal P2.
- the fluorescent signals P2 and P3, like the fluorescent signal P1, are given a marker JN not to be analyzed in step S106 as shown in FIG. 19 (they are detected as a second fluorescent signal).
- step S108 the compression range setting unit 105 determines whether the process has been completed for all the fluorescent signals P. As shown in FIG. 19, the fluorescent signals P contained in the electrophoretic image EP1 are not all fluorescent signals P1 to P3. Therefore, "No" is determined in step S108, and the compression range setting unit 105 repeats the process from step S103 onwards for the fluorescent signal P4.
- the fluorescence signal P4 has a start frame number of "2700" and an end frame number of "2720.” Therefore, the frame width of the fluorescence signal P4 is "20," which is less than the first threshold value ("50" frames in this embodiment). Therefore, "No” is determined in step S103, and the compression range setting unit 105 proceeds to step S107, where it assigns a marker JY to be analyzed to the fluorescence signal P4 as shown in FIG. 19 (it is detected as a first fluorescence signal).
- step S108 the compression range setting unit 105 determines whether or not processing of all of the fluorescence signals P contained in the electrophoretic image EP1 has been completed by processing the fluorescence signals P1 to P4.
- the fluorescence signals P contained in the electrophoretic image EP1 in FIG. 19 are not all of the fluorescence signals P, but rather P1 to P4. Therefore, "No" is determined in step S108, and the compression range setting unit 105 repeats the processing from step S103 onwards for the fluorescence signal P5.
- step S106 the fluorescent signals P5 to P7 are given the marker JY for analysis, just like the fluorescent signal P4 (and are detected as a distinct first fluorescent signal).
- step S108 the compression range setting unit 105 determines whether or not processing of all of the fluorescence signals P has been completed by processing the fluorescence signals P1 to P7.
- the fluorescence signals P contained in the electrophoretic image EP1 in FIG. 19 are all the fluorescence signals P1 to P7. Therefore, "Yes" is determined in step S108, and the compression range setting unit 105 proceeds to step S109.
- step S109 the compression range setting unit 105 determines whether or not there is a fluorescent signal P with a marker JN that is not the subject of analysis. From the explanation so far, the electrophoretic image EP1 in FIG. 19 includes fluorescent signals P1 to P3 that are not the subject of analysis. Therefore, "Yes" is determined in step S109, and the compression range setting unit 105 proceeds to step S110.
- step S110 the compression range H is determined.
- the fluorescent signals P to which the marker JN not to be analyzed was added in step S106 are fluorescent signals P1 to P3. Therefore, the last fluorescent signal P to which the marker JN not to be analyzed is added is fluorescent signal P3.
- the end frame number of fluorescent signal P3 is "2000" (the frame in which the second fluorescent signal is detected). Therefore, the compression range setting unit 105 sets the compression range H from the frame number "2001" next to frame number "2000" (the frame after the frame in which the second fluorescent signal is detected) to the last frame number "5000" in the electrophoretic image EP1 shown in FIG. 19.
- the compression range H is determined as shown in FIG. 20.
- the compression range setting unit 105 sets the compression range H from the frame after the frame in which the fluorescent signal P caused by the primer is detected.
- the compression range setting unit 105 may set the compression range H based on the fluorescent signal P to which the marker JY to be analyzed has been added.
- the first fluorescent signal P to which the marker JY to be analyzed has been added is fluorescent signal P4.
- the starting frame number of fluorescent signal P4 is "2700". Therefore, the compression range setting unit 105 sets the compression range H from frame number "2700" to the last frame number "5000" in the electrophoretic image EP1 shown in FIG. 19.
- the compression range H that has been set is set for a frame of the fluorescent signal data D25 based on the results of detection of the fluorescent signals P4 to P7 (first fluorescent signals) caused by the DNA to be analyzed and the fluorescent signals P1 to P3 (second fluorescent signals) caused by the primers.
- step S112 the compression range setting unit 105 outputs the set compression range H to the compression ratio calculation unit 106 and the compression unit 107.
- the compression range setting unit 105 performs processing that utilizes the characteristics of the fluorescent signal P caused by the primers (fluorescent signals P1 to P3 in the example shown in FIG. 19).
- the characteristics of the fluorescent signal P caused by the primers are that it has a wider frame width, a larger area, and is detected at an earlier frame number than the fluorescent signal P caused by the DNA to be analyzed. This makes it possible to distinguish between the fluorescent signal P caused by the primers and the fluorescent signal P caused by the DNA to be analyzed, and to set the compression range H.
- the compression ratio calculation unit 106 acquires the fluorescent signal data D25 from the color conversion unit 104 (S201).
- the compression rate calculation unit 106 acquires the compression range H from the compression range setting unit 105 (S202).
- the compression range H is frame numbers "2001" to "5000". In this way, through steps S201 and S202, the compression rate calculation unit 106 acquires the fluorescent signal data D25 and compression range H shown in FIG. 20.
- step S203 the compression rate calculation unit 106 acquires the maximum value of the fluorescent signal intensity of the fluorescent signal data D25 included in the compression range H (maximum signal intensity D26). As shown in FIG. 20, the maximum signal intensity D26 of the fluorescent signal intensity in the frame numbers "2001" to "5000" is "360000".
- the compression ratio calculation unit 106 calculates the compression ratio D27 in step S204. As described above, the maximum signal strength value D26 is "360,000", and the upper limit of the value output by the compression unit 107 is "32,767". Therefore, the compression ratio calculation unit 106 calculates the compression ratio D27 as "0.091" from (32,767/360,000).
- the compression unit 107 acquires the fluorescent signal data D25 from the color conversion unit 104 (S301). Then, the compression unit 107 acquires the compression range H from the compression range setting unit 105 (S302). In this manner, the fluorescent signal data D25 and the compression range H shown in FIG. 20 are acquired by steps S301 and S302. As shown in FIG.
- the compression range H is the frame numbers "2001" to "5000".
- the compression unit 107 acquires the compression ratio D27 from the compression ratio calculation unit 106 (S303). As described above, in the example shown in this embodiment, the compression ratio D27 is "0.091". Then, in step S304, the compression unit 107 determines whether the frame to be processed is included in the compression range H.
- step S304 the frames corresponding to frame numbers "3800” to “3820” that make up the fluorescent signal P6 are included in the compression range H. Therefore, "Yes” is determined in step S304, and the compression unit 107 proceeds to the processing of step S305.
- step S304 the compression unit 107 determines whether the fluorescence signal intensity of the frame being processed is greater than "32767". For frames having a fluorescence signal intensity greater than "32767”, the compression unit 107 rounds down the fluorescence signal intensity to "32767” (S307). As described above, no compression is performed in step S307. Furthermore, for frames having a fluorescence signal intensity equal to or less than "32767", the compression unit 107 leaves the fluorescence signal intensity unchanged (S308). The compression unit 107 performs the processes of steps S306 to S308 for each frame of the electrophoretic image EP (fluorescence signal data D25) that is outside the compression range H.
- the compression unit 107 performs the processes of steps S306 to S308 for each frame of the electrophoretic image EP (fluorescence signal data D25) that is outside the compression range H.
- steps S304 to S308 is performed for each frame constituting the fluorescence signal data D25.
- an electrophoretic image EP2 corresponding to the compressed fluorescence signal data D28 is generated.
- the dashed line V1 indicates a value equivalent to the maximum signal intensity D26 in FIG. 20 (the fluorescence signal intensity of the compressed fluorescence signal P6).
- the fluorescence signal data D25 is compressed so that the value equivalent to the maximum signal intensity D26 in FIG. 20 becomes the maximum value of the signal intensity that can be used in the secondary analysis.
- the maximum value of the signal intensity that can be used in the secondary analysis is "32676".
- the dashed line V1 corresponds to the maximum value of the signal intensity that can be used in the secondary analysis.
- the compression unit 107 performs the processing of steps S306 to S308.
- the fluorescence signal P shown in the fluorescence signals P1 to P3 has a shape in which the value above "32676" is missing.
- Patent Literature 1 describes a method for switching between hardware binning and software binning, but does not describe a means for enabling values output from electrophoresis system 1 to be used in secondary analysis.
- the fluorescence signal intensity is processed to be "32767". This makes it possible to make the fluorescence signal intensity of all frames of the output compressed fluorescence signal data D28 equal to or less than "32767". This makes secondary analysis possible.
- the fluorescence signal data D25 is compressed in accordance with the fluorescence signal P resulting from the DNA being analyzed. This makes it possible to minimize the compression rate D27. By minimizing the compression rate D27, it is possible to maintain a small fluorescence signal P. Minimizing the compression rate D27 means that the minimum compression rate D27 is calculated.
- Non-Patent Document 1 describes that data is compressed at a fixed compression rate D27 so that values that can be output by electrophoresis system 1 fall within the range of values that can be input to secondary analysis software.
- the data output by electrophoresis system 1 includes a fluorescent signal P of a reagent called a primer, which is used for amplifying DNA.
- primers are added in excess compared to the DNA to be analyzed, so the fluorescent signal intensity is high.
- primers are shorter than the DNA to be analyzed, so they are detected earlier than the DNA to be analyzed.
- the fluorescent signal intensity acquired by the electrophoresis system 1 becomes significantly larger than the range of values that can be input to the secondary analysis software due to the influence of the fluorescent signal P resulting from the primers. Therefore, when compression is performed at the fixed compression rate D27 described in Non-Patent Document 1, the compression rate D27 in the direction of the fluorescent signal intensity becomes large, and the information on the DNA to be analyzed that has a minute fluorescent signal intensity may become small.
- Patent Document 2 describes the selection and processing of data points for experimental data.
- the selection of data points can be thought of as the selection of the horizontal axis when the experimental data is graphed.
- Patent Document 2 also describes the deletion of data points and the normalization of the vertical axis (processing of the vertical axis) when the experimental data is graphed, based on the selection of data points.
- Patent Document 2 also describes a method for reducing data points by removing clutter. However, Patent Document 2 does not describe a method for removing fluorescence caused by primers that increases signal intensity in the data output by the electrophoresis system 1.
- the first embodiment relates to the selection of an analysis range based on primers specific to electrophoresis (selection of the horizontal axis) and the compression of data in the analysis range (processing of the vertical axis).
- the compression ratio D27 can be minimized by separating the fluorescent signal P caused by the primer from the fluorescent signal P caused by the DNA to be analyzed.
- the horizontal axis of the graph related to the experimental data is selected by deleting data points. Then, in Patent Document 2, the spectrum at each data point (a graph in which the horizontal axis is wavelength and the vertical axis is signal intensity) is compared with a specific shape, and data of data points that do not match the specific shape are deleted.
- the horizontal axis is selected by setting the range to be used in the analysis (compression range H). Specifically, in Embodiment 1-1, the range to be used in the secondary analysis (compression range H) is determined from the characteristics of the fluorescent signal that arises uniquely in the pretreatment of electrophoresis, known as primers.
- the purpose of processing the vertical axis is to make it easier to view on the GUI.
- the vertical axis is normalized (not necessarily compressed) to achieve processing of the vertical axis.
- normalization is performed, so information on the signal intensity ratio between signal peaks is lost.
- the purpose of processing (compression) the vertical axis is to place the values within a range that can be used in secondary analysis without losing information on minute signals such as the fluorescent signal P caused by DNA.
- the maximum signal intensity D26 for the range to be analyzed is compressed to a value that can be used in secondary analysis. Since the entire fluorescent signal data D25 is compressed uniformly, information on the fluorescent signal intensity ratio between peaks of the fluorescent signal P can be maintained. This is because the fluorescent signal intensity ratio is important in secondary analysis.
- the compression range setting unit 105 can distinguish between the fluorescent signal P caused by the primer and the fluorescent signal P caused by the DNA to be analyzed.
- the compression range setting unit 105 sets the compression range H, and the compression ratio calculation unit 106 sets the compression ratio D27 according to the compression range H. This allows the compression ratio calculation unit 106 to minimize the compression ratio D27.
- the fluorescent signal intensity of the fluorescent signals P1 to P3 caused by the primers is "786420", which is much larger than the fluorescent signal intensity of the fluorescent signals P4 to P7 caused by the DNA.
- the compression ratio calculation unit 106 obtains the maximum signal intensity D26 based on the fluorescent signal P6 caused by the DNA to be analyzed, and calculates the compression ratio D27 based on this maximum signal intensity D26. In this way, an appropriate compression ratio D27 can be calculated.
- the compression rate D27 is "0.091", which is smaller than the compression rate D27 of "0.042" in accordance with Non-Patent Document 1. This makes the secondary analysis easier because the fluorescent signals P4 to P7 caused by DNA do not become excessively small in the compressed fluorescent signal data D28 to be passed to the secondary analysis.
- the compression ratio D27 can be minimized based on the characteristics of the fluorescent signal P resulting from the DNA being analyzed. While maintaining a minute signal such as the fluorescent signal P resulting from DNA, the fluorescent signal data D25 can be compressed to a range of values that can be input into the secondary analysis software.
- the method described in embodiment 1-1 can be realized by modifying the program of the processing device 10.
- the method described in embodiment 1-1 can be realized without modifying the hardware configuration of the electrophoresis device 20 or the processing device 10. Therefore, the method described in embodiment 1-1 can be realized without modifying the configuration of the electrophoresis device 20, which allows for cost savings.
- the electrophoretic image EP of the analysis sample D10 generated in step S102 of Fig. 15 is assumed to be the electrophoretic image EP1 shown in Fig. 19. Also, it is assumed that software binning has been performed on the analysis sample signal D11 of bin B in the frame in which the maximum signal intensity D26 of the fluorescent signal P6 in Fig. 20 was obtained, as shown in Fig. 12. In the example shown in Fig. 20, the frame in which the maximum signal intensity D26 was obtained is the frame with frame number "3810.” Also, it is assumed that software binning is performed according to Fig. 14.
- the value of the compressed fluorescent light signal data D28 after compression by the process of FIG. 18 implemented by the compression unit 107 is "32767". Also output to the external memory 30 are the analysis sample signal D11, the compressed fluorescent signal data D28 according to this embodiment, and the compression ratio D27 ("0.091" in this embodiment).
- the user can also compare the value of the analysis sample signal D11 for a particular frame with the value of the fluorescent signal compression data D28 for that frame and the compression rate D27.
- the value of the analysis sample signal D11 for a particular frame is, for example, "360000" as shown in FIG. 12.
- the value of the fluorescent signal compression data D28 for that frame is, for example, "32767” as shown in FIG. 12.
- the fluorescent signal intensity of the fluorescent signal data D25 can be kept within the range of values that can be input to the secondary analysis software.
- the compression rate D27 is determined based on the maximum signal intensity value D26 of the fluorescent signal P in the compression range H and the upper limit value used in the secondary analysis software. This allows the primary analysis file output by the electrophoresis system 1 to be appropriately analyzed by the secondary analysis software.
- the primary analysis file is data output by the processing device 10.
- the fluorescent signal P is separated into analysis target/non-analysis target, and only the fluorescent signal P in the analysis target range is compressed. This prevents the compression rate D27 from becoming too high, and makes it possible to maintain the information of minute fluorescent signal P.
- the compression range setting unit 105 detects the type of the fluorescent signal P based on at least one of the width, area, and the last frame (end frame number) containing the fluorescent signal P.
- the types are the fluorescent signal P caused by the DNA to be analyzed, and the fluorescent signal P caused by the primer. In this way, it is possible to distinguish between the fluorescent signal P caused by the DNA to be analyzed and the fluorescent signal P caused by the primer.
- FIGS. 22 and 23 are diagrams showing examples of electrophoretic images EP.
- the electrophoretic data processing method for the electrophoretic image EP including the fluorescent signal P caused by the primers has been described.
- a method of processing electrophoretic data for an electrophoretic image EP fluorescence signal data D25
- the processing shown in the first-1 embodiment can also be applied to the fluorescence signal data D25 that does not include a primer.
- the system configuration and operation in the 1-2 embodiment are similar to those in the 1-1 embodiment, and therefore the system configuration and operation (flowchart) in the 1-2 embodiment will not be illustrated.
- FIG. 22 shows an electrophoretic image EP3 (EP) of a sample D10 to be analyzed.
- the sample D10 to be analyzed contains only a fluorescent signal P due to the DNA to be analyzed, and does not contain a fluorescent signal P due to a primer that is not the target of analysis.
- the first threshold, the second threshold and the third threshold are the same as those in the first embodiment.
- the compression range setting unit 105 acquires the fluorescent signal data D25 from the color conversion unit 104 (S101).
- the electrophoretic image EP3 (EP) drawn by the compression range setting unit 105 in step S102 is assumed to be as shown in Figure 22. As shown in Figure 22, the electrophoretic image EP3 includes seven fluorescent signals P (P8 to P14).
- the numbers with leading lines on the horizontal axis at the bottom of the page are frame numbers.
- the electrophoretic image EP3 shown in FIG. 22 has a range of frame numbers from “0" to "5000”.
- Fluorescence signal P8 is present in frame numbers "300” to “320” and has an area of "30000000”.
- Fluorescence signal P9 is present in frame numbers "1100” to "1130” and has an area of "2000000”.
- Fluorescence signal P10 is present in frame numbers "2000” to "2020” and has an area of "800000”.
- Fluorescence signal P11 is present in frame numbers "2700" to "2720” and has an area of "2500000".
- Fluorescence signal P12 is present in frame numbers “3175” to “3200” and has an area of "1000000”.
- Fluorescence signal P13 is present in frame numbers “3800” to “3820” and has an area of "3000000”.
- Fluorescence signal P14 is present in frame numbers "4300” to "4320” and has an area of "500000”.
- the compression range setting unit 105 searches through these fluorescence signals P, starting from frame number "1," and processes the first detected fluorescence signal P8.
- the fluorescence signal P8 has a start frame number of "300” and an end frame number of "320", and therefore a frame width of "20" frames. Therefore, the frame width of the fluorescence signal P8 is less than the first threshold ("50" frames in this embodiment). Therefore, "No" is determined in step S103, and the compression range setting unit 105 proceeds to step S107.
- the compression range setting unit 105 assigns a marker JY to be analyzed to the fluorescence signal P8 as shown in FIG. 22 (detecting it as a first fluorescence signal).
- step S108 the compression range setting unit 105 determines whether the processing of the fluorescence signal P8 has been completed for all of the fluorescence signals P.
- the fluorescent signal P shown in the electrophoretic image EP3 in FIG. 22 is not all fluorescent signal P8. Therefore, "No" is determined in step S108, and the compression range setting unit 105 performs the processing from step S103 onwards on the next fluorescent signal P9.
- step S106 the compression range setting unit 105 assigns the analysis target marker JY to the fluorescence signals P9 to P14, in the same manner as the fluorescence signal P8 (detecting them as distinct from the first fluorescence signal).
- step S108 the compression range setting unit 105 determines whether or not processing of all fluorescence signals P has been completed by processing fluorescence signal P14.
- the electrophoretic image EP3 in FIG. 22 includes all fluorescence signals P8 to P14. Therefore, "Yes" is determined in step S108, and the compression range setting unit 105 proceeds to step S109.
- step S109 it is determined whether or not there is any fluorescence signal P that is not the subject of analysis. All of the fluorescence signals P contained in the electrophoretic image EP3 in FIG. 22 are fluorescence signals P that are the subject of analysis, and do not include any fluorescence signals P that are not the subject of analysis. Therefore, "No" is determined in step S109, and the compression range setting unit 105 proceeds to step S111.
- step S111 the compression range H is determined. As described above, in the example shown in the first and second embodiments, all frames are set as the compression range H because the example does not include any fluorescent signals P that are not the subject of analysis. Therefore, the compression range setting unit 105 sets frame numbers "1" to "5000" of the electrophoretic image EP3 as the compression range H.
- step S112 the compression range setting unit 105 outputs the set compression range H to the compression ratio calculation unit 106 and the compression unit 107.
- the compression range setting unit 105 can set the compression range H even for the fluorescence signal data D25 that does not include the fluorescence signal P that is not the subject of analysis and is caused by primers.
- the compression rate calculation unit 106 acquires the fluorescence signal data D25 from the color conversion unit 104 (S201).
- the compression rate calculation unit 106 acquires the compression range H from the compression range setting unit 105 (S202).
- the compression range H is the frame numbers "1" to "5000”.
- the compression rate calculation unit 106 acquires the maximum signal intensity value D26 of the fluorescence signal data D25 included in the compression range H.
- the maximum signal intensity value D26 of the fluorescence signal data D25 included in the frame numbers "1" to "5000” is "360000".
- step S204 the compression ratio calculation unit 106 calculates the compression ratio D27.
- the maximum signal strength value D26 is "360000”
- the compression unit 107 acquires the fluorescent light signal data D25 from the color conversion unit 104 (S301). Then, the compression unit 107106 acquires the compression range H from the compression range setting unit 105 (S302). In the first and second embodiments, as described above, the compression range H is the frame numbers "1" to "5000”. Next, the compression unit 107 acquires the compression ratio D27 from the compression ratio calculation unit 106 (S303). In the first and second embodiments, the compression ratio D27 is "0.091" as described above.
- the compression unit 107 selects frames in ascending order of frame number, and determines in step S304 whether the frame to be processed is included in the compression range H. 22, all of the frames constituting fluorescence signals P8 to P14 are included in compression range H. Therefore, the compression unit 107 determines "Yes" in step S304 for all of fluorescence signals P8 to P14. The compression unit 107 then proceeds to step S305, where it multiplies the fluorescence signal intensity of the frame being processed by the compression rate D27 (S305). As a result, the fluorescence signal intensity of the frame corresponding to maximum signal intensity value D26 is compressed to "32767", or "360000 x 0.091".
- step S305 generates an electrophoretic image EP4 (EP) shown in FIG. 23.
- step S310 the compression unit 107 outputs the electrophoretic image EP4 shown in FIG. 23 as compressed fluorescent signal data D28.
- the dashed line V2 indicates a value equivalent to the maximum signal intensity D26 in FIG. 22 (fluorescent signal intensity of the fluorescent signal P13).
- the fluorescent signal data D25 is compressed so that the value equivalent to the maximum signal intensity D26 in FIG. 22 becomes the maximum signal intensity that can be used in secondary analysis (in this embodiment, "32676").
- the dashed line V2 corresponds to the maximum signal intensity that can be used in secondary analysis.
- the processing device 10 can perform compression processing by the process shown in the first embodiment even on electrophoretic images EP (fluorescence signal data D25) that do not contain fluorescent signals P due to primers.
- the compression range H is determined by classifying the fluorescent signal P based on the characteristics of the fluorescent signal P that is not the analysis target and is caused by the primer.
- the compression range H is determined based on the characteristics of the fluorescent signal P and the characteristics of the size standard.
- FIG. 24 is a diagram showing the configuration of a processing device 10 according to the second embodiment.
- the configuration differs from that shown in Fig. 4 in that the analysis target sample D10a is a mixture of DNA to be analyzed, primers, and size standards.
- the method of setting the compression range H of the compression range setting unit 105 is different from that of the first embodiment.
- the other configurations are the same as those in Fig. 4.
- the size standard is a sample (DNA) with a known base length and containing multiple fluorescent signals P.
- the size standard allows the base length of the DNA to be analyzed to be known.
- the number of fluorescent signals P resulting from the size standard is also known.
- the size standard is mixed into the sample to be analyzed D10a before use. In other words, the sample to be analyzed D10a in the second embodiment contains the size standard.
- the base length range of DNA containing the size standard is set to be wider than the base length range including the DNA to be analyzed. In other words, the fluorescent signal P resulting from the size standard is detected in a wider range than the fluorescent signal P resulting from the DNA to be analyzed.
- the frame number at which the fluorescent signal P resulting from the size standard is detected is greater than the frame number at which the fluorescent signal P resulting from the primer is detected (it is detected at a later timing). Furthermore, a dye of a different color from the DNA to be analyzed is used for the size standard.
- compression range H determination process 25 is a flowchart showing the procedure of the compression range determination process, which is the compression range setting step performed by the compression range setting unit 105 in the second embodiment.
- FIG. 4 will be referred to as appropriate.
- the compression range setting unit 105 acquires the fluorescent light signal data D25 from the color conversion unit 104 (S401).
- step S401 the compression range setting unit 105 acquires the fluorescent light signal data D25 for all frames.
- the compression range setting unit 105 draws (generates) an electrophoretic image EP (see FIG. 16) of the fluorescent signal data D25 (S402). As in the first-1 embodiment, the electrophoretic image EP is generated for each electrophoresis.
- the compression range setting unit 105 selects one of the fluorescent signals P contained in the generated electrophoretic image EP.
- the method of selecting the fluorescent signal P is the same as in the 1-1 embodiment.
- the compression range setting unit 105 determines whether or not the color of the selected fluorescent signal P is the color used for the size standard (the color of the size standard) (S403).
- the color of the size standard is the color of the dye used in the size standard. As described above, dyes of different colors are used for the size standard and the DNA to be analyzed. Therefore, the compression range setting unit 105 can distinguish the fluorescent signal P caused by the size standard and the fluorescent signal P caused by the DNA to be analyzed by color.
- Whether or not the color is that of the size standard is determined based on the color information in the fluorescent signal P.
- the compression range setting unit 105 selects the next fluorescent signal P (S404) and performs the processing from step S403 onwards.
- the compression range setting unit 105 assigns the size standard mark JS (FIG. 26) to the fluorescent signal P (S405). In other words, the compression range setting unit 105 assigns the mark JS to the fluorescent signal P that has been determined to be due to the size standard.
- the fluorescent signal P to which the size standard marker JS has not been added has been detected as a fluorescent signal P originating from the DNA to be analyzed.
- the fluorescent signal P to which the size standard marker JS has been added is a first fluorescent signal originating from the DNA to be analyzed.
- the fluorescent signal P originating from the DNA to be analyzed is the first fluorescent signal.
- the fluorescent signal P to which the size standard marker JS has been added has been detected as a fluorescent signal P originating from the size standard.
- the fluorescent signal P to which the size standard marker JS has been added is a second fluorescent signal originating from something other than the analysis target.
- the fluorescent signal P originating from the size standard is the second fluorescent signal. In this way, the compression range setting unit 105 detects the fluorescent signal P originating from the size standard as the second fluorescent signal.
- the compression range setting unit 105 distinguishes and detects the fluorescent signal P originating from the DNA to be analyzed and the fluorescent signal P originating from the size standard based on the color information of the fluorescent signal P.
- the compression range setting unit 105 determines whether processing has been completed for all fluorescence signals P in the electrophoretic image EP (S406).
- the compression range setting unit 105 selects the next fluorescence signal P (S407) and performs processing from step S403 onwards.
- the compression range setting unit 105 assigns numbers to the fluorescence signals P to which the size standard mark JS has been assigned (S408). At this time, the compression range setting unit 105 assigns numbers starting from "1" to the fluorescence signals P to which the size standard mark JS has been assigned in ascending order of frame numbers.
- the compression range setting unit 105 proceeds to step S410. If the maximum value of the assigned number is not the same as the number specified as the size standard (S409 ⁇ No), the compression range setting unit 105 deletes the mark JS (S411). At this time, the compression range setting unit 105 deletes the size standard mark JS for the fluorescent signal P that has been assigned a number larger than the specified number. The compression range setting unit 105 then proceeds to step S410. Note that the number of fluorescent signals P to which the size standard mark JS has been assigned will not be less than the specified number of size standards.
- step S410 the compression range setting unit 105 sets the compression range H.
- the compression range setting unit 105 obtains the start frame number of the fluorescent signal P with the smallest frame number among the fluorescent signals P to which the size standard mark JS has been added. This start frame number is called the minimum frame number.
- the compression range setting unit 105 obtains the end frame number of the fluorescent signal P with the largest frame number among the fluorescent signals P to which the size standard mark JS has been added. This end frame number is called the maximum frame number.
- the compression range setting unit 105 sets the range from the minimum frame number to the maximum frame number as the compression range H.
- the frame range in which the fluorescent signal P (second fluorescent signal) to which the size standard mark JS is added is detected is set as the compression range H.
- the compression range setting unit 105 outputs the compression range H set in step S410 to the compression ratio calculation unit 106 and the compression unit 107 (S412).
- compression ratio calculation process and compression process In the 2-1 embodiment, the procedure of the compression ratio calculation process performed by the compression ratio calculation unit 106 is similar to the process shown in Fig. 17, so illustration and description in the 2-1 embodiment are omitted. Also, the procedure of the compression process performed by the compression unit 107 in the 2-1 embodiment is similar to the process shown in Fig. 18, so description in the 2-1 embodiment is omitted.
- the fluorescent signal P caused by the size standard does not need to be compressed, unlike the fluorescent signal P caused by the primer. This is because the fluorescent signal P caused by the size standard is smaller than the fluorescent signal P caused by DNA. In other words, the fluorescent signal P caused by the size standard can be kept within the range of values output by the compression unit 107 without compression, by paying attention to the amount added to the analysis target sample D10a.
- the fluorescent signal intensity of the fluorescent signal P resulting from the size standard decreases. In that case, the user may not be able to recognize the fluorescent signal P resulting from the size standard. This may lead the user to mistakenly believe that the size standard is not included.
- the fluorescent signal P of the size standard is not compressed, the fluorescent signal intensity displayed by the fluorescent signal P caused by the size standard does not decrease. Therefore, there is no risk of the user mistakingly determining that the size standard is not included.
- FIG. 26 to 28 are diagrams showing examples of electrophoretic images EP. 26 to 28 show electrophoretic images EP5 and EP6 (EP) of the analysis sample D10a.
- the fluorescent signal P due to the size standard is composed of four fluorescent signals P.
- the fluorescent signal P due to the size standard is not limited to being composed of four fluorescent signals P.
- the fluorescent signal P having the color of the size standard is displayed by a dashed line.
- the electrophoretic image EP5 shown in FIG. 26 includes fluorescent signals P (P18, P20, P22) resulting from the DNA being analyzed.
- the electrophoretic image EP5 also includes fluorescent signals P (P15, P16) resulting from primers not being analyzed, and fluorescent signals P (P17, P19, P21, P23) resulting from size standards.
- the compression range setting unit 105 acquires the fluorescence signal data D25 from the color conversion unit 104 (S401).
- Fig. 26 shows the electrophoretic image EP5 that the compression range setting unit 105 rendered in step S402.
- the compression range setting unit 105 selects one of the fluorescence signals P contained in the generated electrophoretic image EP. That is, the compression range setting unit 105 searches among these fluorescence signals P, starting from frame number "1," and performs processing on the fluorescence signal P15 that is detected first.
- the compression range setting unit 105 determines whether the color of the selected fluorescence signal P is the color used in the size standard (the color of the size standard) (S403).
- the first fluorescent signal P15 to be selected is not the color of the size standard. Therefore, the result of the determination in step S403 is "No.” Then, in step S404, the compression range setting unit 105 selects the next fluorescent signal P16 (S404) and performs the processing from step S403 onward.
- the fluorescent signal P16 next to fluorescent signal P15 is the color of the size standard. Therefore, "Yes” is determined in step S403, and the compression range setting unit 105 assigns the size standard mark JS to the fluorescent signal P16 as shown in Figure 26 (S405).
- the fluorescent signal P16 is a fluorescent signal P caused by a primer. However, because the color of this fluorescent signal P16 is the same as that of the size standard, it was mistakenly recognized as a fluorescent signal P caused by the size standard. The correction of this erroneous recognition will be described later.
- step S406 it is determined whether or not processing of all fluorescence signals P has been completed by processing fluorescence signal P16.
- the electrophoretic image EP5 in FIG. 26 does not include all fluorescence signals P15 and P16. Therefore, "No" is determined in step S406, and the compression range setting unit 105 selects the next fluorescence signal P17 (S407) and performs processing from step S403 onwards.
- the size standard mark JS is not added to the fluorescent signals P15, P18, P20, and P22 (they are detected as the first fluorescent signal).
- the size standard mark JS is added to the fluorescent signals P16, P17, P19, P21, and P23 (they are detected as the second fluorescent signal).
- the compression range setting unit 105 determines "Yes" in step S406.
- the compression range setting unit 105 assigns numbers to the fluorescence signals P to which the size standard marks JS have been assigned, in order from the largest frame number (S408).
- the fluorescence signal P23 is assigned the size standard number "1" (JS1 in FIG. 26).
- the fluorescence signal P21 is assigned the size standard number "2" (JS2 in FIG. 26).
- the fluorescence signal P19 is assigned the number "3" (JS3 in FIG. 26), and the fluorescence signal P17 is assigned the number "4" (JS4 in FIG. 26).
- the fluorescence signal P16 is assigned the size standard number "5" (JS5 in FIG. 26).
- the compression range setting unit 105 determines whether the maximum value of the numbers assigned in step S408 is the same as the specified number of size standards (S409).
- the maximum value of the numbers assigned in step S408 is "5" (JS5).
- the number specified as size standards is four. Therefore, the maximum value of the assigned numbers is not the same as the specified number of size standards. Therefore, the compression range setting unit 105 determines "No" in step S409.
- the compression range setting unit 105 deletes the size standard mark JS from the fluorescent signal P that has been assigned a number greater than the specified number for the size standard (S411).
- the fluorescent signal P16 in FIG. 27 is assigned a "5" (JS5), which is greater than the specified number of size standards, "4". Therefore, the compression range setting unit 105 deletes the size standard mark JS assigned to the fluorescent signal P16.
- the compression range setting unit 105 then proceeds to step S410. In this way, the fluorescent signal P16 that has been erroneously recognized as a fluorescent signal P caused by a size standard is removed from the fluorescent signal P caused by a size standard.
- the compression range setting unit 105 assigns numbers to the fluorescence signals P to which the size standard mark JS has been assigned, in order from the largest frame number.
- the compression range setting unit 105 may assign numbers to the fluorescence signals P to which the size standard mark JS has been assigned, in order from the smallest frame number (corresponding frame number).
- the compression range setting unit 105 calculates the difference value between the number of detected fluorescence signals P having the color of the size standard and the specified number of size standards. Then, the compression range setting unit 105 deletes the size standard mark JS in order from the smallest number by the difference value.
- step S411 If, in step S411, the number of fluorescent signals P to which a mark JS has been added exceeds the number of size standards being used, the compression range setting unit 105 deletes the mark JS added to the fluorescent signals P. At this time, the compression range setting unit 105 deletes the excess mark JS added to the fluorescent signals P, starting from the smallest corresponding frame number among the fluorescent signals P to which a mark JS has been added in the fluorescent signal data D25.
- the compression range setting unit 105 acquires the frame number "2000", which is the start frame number of the fluorescent signal P17, as the minimum frame number. Moreover, the compression range setting unit 105 acquires the end frame number of the fluorescent signal P23 to which the size standard mark JS has been added as the maximum frame number.
- the end frame number of the fluorescent signal P23 to which the size standard mark JS has been added is the frame number "4500". Then, the compression range setting unit 105 sets the range from the minimum frame number to the maximum frame number as the compression range H (S410). In the example shown in FIG. 27, frame numbers "2000" to "4500" are set as the compression range H.
- the compression range setting unit 105 sets the frame range in which the fluorescent signal P with the size standard mark JS is detected as the compression range H.
- the compression range setting unit 105 outputs the compression range H (frame numbers "2000" to "4500” in the example shown in FIG. 27) to the compression ratio calculation unit 106 and the compression unit 107 (step S412).
- the compression range setting unit 105 utilizes the characteristic that the fluorescent signal P caused by the primer is detected earlier than the DNA to be analyzed and the size standard to set the compression range H. Furthermore, the compression range setting unit 105 utilizes the characteristics of the fluorescent signal P caused by the size standard to set the compression range H.
- the characteristics of the fluorescent signal P caused by the size standard used are as follows: (1) The number of fluorescent signals P caused by the size standards is known. (2) The fluorescent signal P due to the size standard is detected in a wider range than the fluorescent signal P due to the DNA to be analyzed. (3) The fluorescent signal P due to the size standard is detected later than the fluorescent signal P due to the primer.
- the second-1 embodiment by utilizing the above features (1) to (3), it is possible to distinguish between the fluorescent signal P caused by the primer and the fluorescent signal P caused by the DNA to be analyzed, and to set the compression range H. Based on the above property (3), the range in which the fluorescent signal P caused by the size standard is detected is set as the compression range H, and the fluorescent signal P caused by the primer is excluded from the compression range H.
- the compression unit 107 acquires the fluorescence signal data D25 from the color conversion unit 104 (S301).
- the compression unit 107106 acquires the compression range H from the compression range setting unit 105 (S302). It is assumed that the fluorescence signal data D25 and compression range H shown in Fig. 27 have been acquired through steps S301 and S303.
- frame numbers "2000" to "4500” are set as the compression range H, as shown in Fig. 27.
- the compression unit 107 acquires the compression ratio D27 from the compression ratio calculation unit 106 (S303). As described above, in the second embodiment, the compression ratio D27 is "0.091". Then, in step S304, the compression unit 107 determines whether the frame being processed is included in the compression range H.
- step S305 compression unit 107 multiplies the fluorescence signal intensity of the frame to be processed by compression rate D27.
- step S304 in FIG. 16 the compression unit 107 determines whether the fluorescence signal intensity of the frame being processed is greater than "32767". For frames having a fluorescence signal intensity greater than "32767”, the compression unit 107 rounds down the fluorescence signal intensity to "32767" (S307). As described above, no compression is performed in step S307. Furthermore, for frames having a fluorescence signal intensity equal to or less than "32767", the compression unit 107 leaves the fluorescence signal intensity unchanged (S308). The compression unit 107 performs the processes of steps S306 to S308 for each frame of the electrophoretic image EP (fluorescence signal data D25) that is outside the compression range H.
- electrophoretic image EP fluorescence signal data D25
- step S310 electrophoretic image EP6 (EP) shown in FIG. 28 is output as compressed fluorescent signal data D28.
- dashed line V3 indicates a value equivalent to maximum signal intensity D26 in FIG. 27 (fluorescent signal intensity of fluorescent signal P22).
- the fluorescent signal data D25 is compressed so that the value equivalent to maximum signal intensity D26 in FIG. 28 becomes the maximum value of signal intensity that can be used in secondary analysis (in this embodiment, "32676").
- dashed line V3 corresponds to the maximum value of signal intensity that can be used in secondary analysis.
- the numerical values "2000" and "4500" written with leading lines on the horizontal axis below the page are frame numbers.
- steps S304 to S308 is performed for each frame constituting the fluorescence signal data D25.
- an electrophoretic image EP2 corresponding to the compressed fluorescence signal data D28, as shown in FIG. 28, is generated.
- the dashed line V3 indicates the value equivalent to the maximum signal intensity D26 in FIG. 27 (the fluorescence signal intensity of the compressed fluorescence signal P6).
- the fluorescence signal data D25 is compressed so that the value equivalent to the maximum signal intensity D26 in FIG. 20 becomes the maximum value of the signal intensity that can be used in the secondary analysis.
- the maximum value of the signal intensity that can be used in the secondary analysis is "32676".
- the compression unit 107 For the area outside the compression range H, the compression unit 107 performs the processing of steps S306 to S308. As a result, the fluorescence signal P shown in the fluorescence signals P15 and P16 has a shape in which the value above "32676" is missing.
- the characteristics of the size standard are utilized, so that even when a size standard is used, the fluorescence signal data D25 can be compressed to a range of values that can be input to the secondary analysis software while maintaining a small signal by minimizing the compression ratio D27.
- the fluorescent signal P caused by the DNA to be analyzed and the fluorescent signal P caused by the size standard are detected separately based on the color information of the fluorescent signal P. In this way, it is possible to easily distinguish between the fluorescent signal P caused by the DNA to be analyzed and the fluorescent signal P caused by the size standard.
- the compression range setting unit 105 determines whether the number of fluorescent signals P to which the size standard mark JS is attached exceeds the number of size standards being used. Then, the compression range setting unit 105 deletes the excess mark JS attached to the fluorescent signals P from the smaller corresponding frame numbers among the fluorescent signals P to which the mark JS is attached in the fluorescent signal data D25. Because the color is the same as that of the size standard, a fluorescent signal P that is actually due to a primer may be erroneously detected as a fluorescent signal P due to a size standard. Even in such a case, the erroneous detection can be corrected by performing the process described above.
- FIGS. 29 and 30 are diagrams showing examples of electrophoretic images EP.
- the characteristics of the fluorescent signal P caused by the size standard are utilized, and a data processing method for the electrophoretic image EP (fluorescent signal data D25) including the fluorescent signal P caused by the primer is described.
- the characteristics of the fluorescent signal P that constitutes the size standard are utilized.
- a method of processing electrophoretic data for an electrophoretic image EP (fluorescent signal data D25) that does not include the fluorescent signal P caused by the primer is described.
- the electrophoretic image EP drawn in step S402 in FIG. 25 is the electrophoretic image EP7 (EP) shown in FIG. 29.
- FIG. 29 shows the electrophoretic image EP7 of the analysis target sample D10.
- the fluorescent signal data D25 includes the fluorescent signal P caused by the DNA to be analyzed, and the fluorescent signal P caused by the size standard.
- the fluorescent signal data D25 does not include the fluorescent signal P caused by the primers not to be analyzed.
- the size standard is composed of four fluorescent signals P. Then, it is assumed that the color of the fluorescent signal P caused by the size standard is displayed by a dashed line in the electrophoretic image EP7.
- the compression range setting unit 105 acquires the fluorescent signal data D25 from the color conversion unit 104 (S401).
- Fig. 29 shows an electrophoretic image EP7 drawn by the compression range setting unit 105 in step S402.
- the electrophoretic image EP7 includes seven fluorescent signals P.
- the compression range setting unit 105 searches among these fluorescent signals P, starting from frame number "1," and performs processing on the fluorescent signal P24 that is detected first.
- This fluorescent signal P24 is the color of the size standard. Therefore, "Yes" is determined in step S403, and the compression range setting unit 105 assigns the size standard mark JS to the fluorescent signal P24 (S405).
- step S406 the compression range setting unit 105 determines whether or not the processing of all the fluorescence signals P has been completed by processing the fluorescence signal P24.
- the electrophoretic image EP7 in FIG. 29 does not entirely include the fluorescence signal P24. Therefore, the compression range setting unit 105 determines "No" in step S406. Then, the compression range setting unit 105 selects the next detected fluorescence signal P25 (S407) and performs the processing from step S403 onwards.
- the compression range setting unit 105 determines "No" in step S403. Then, the compression range setting unit 105 selects the next detected fluorescent signal P26 in step S404 (S404), and performs the processing from step S403 onward.
- the same processing as for the fluorescent signals P24 and P25 described above is repeated for the fluorescent signals P26 to P30.
- the size standard mark JS is not added to the fluorescent signals P25, P27, and P29 (they are detected as the first fluorescent signal).
- the size standard mark JS is added to the fluorescent signals P24, P26, P28, and P30 (they are detected as the second fluorescent signal).
- step S405 determines "Yes" in step S406.
- the compression range setting unit 105 assigns numbers to the fluorescence signals P to which the size standard marker JS has been assigned, in order from the largest frame number (S408).
- the fluorescence signal P30 is assigned the number "1" (JS1).
- the fluorescence signal P28 is assigned the number "2" (JS2)
- the fluorescence signal P26 is assigned the number "3” (JS3)
- the fluorescence signal P24 is assigned the number "4" (JS4).
- the compression range setting unit 105 determines whether the maximum value of the numbers assigned in step S408 is the same as the specified number of size standards (S409). In this embodiment, the maximum value of the numbers assigned in step S408 is "4". On the other hand, the number specified as size standards is four. Therefore, the compression range setting unit 105 determines "Yes" in step S409 and proceeds to step S410.
- the compression range setting unit 105 refers to frame number "2000”, which is the start frame number of fluorescent signal P24, as the minimum frame number. Furthermore, frame number "4500”, which is the end frame number of fluorescent signal P30, as the maximum frame number. The compression range setting unit 105 then sets the range from the minimum frame number to the maximum frame number as the compression range H (S410).
- the compression range setting unit 105 sets the frame range in which the fluorescent signal P with the size standard mark JS is detected as the compression range H.
- the compression range setting unit 105 outputs the compression range H set in step S410.
- the compression range setting unit 105 outputs frame number "2000" to frame number "4500” as the compression range H to the compression ratio calculation unit 106 and the compression unit 107.
- the compression rate calculation unit 106 acquires the fluorescence signal data D25 from the color conversion unit 104 (S201).
- the compression rate calculation unit 106 acquires the compression range H from the compression range setting unit 105 (S202).
- the compression range H is the frame numbers "2000" to "5000”.
- the compression rate calculation unit 106 acquires the maximum signal intensity value D26 of the fluorescence signal data D25 included in the compression range H. As shown in Fig. 29, the maximum signal intensity value D26 of the fluorescence signal data D25 included in the frame numbers "1" to "5000” is "360000".
- step S204 the compression ratio calculation unit 106 calculates the compression ratio D27.
- the maximum signal strength value D26 is "360000”
- the compression unit 107 acquires the fluorescent light signal data D25 from the color conversion unit 104 (S301).
- the compression unit 107 acquires the compression range H from the compression range setting unit 105 (S302).
- the compression range H is the frame numbers "2000" to "5000”.
- the compression unit 107 acquires the compression ratio D27 from the compression ratio calculation unit 106 (S303). As described above, in the 2-2 embodiment, the compression ratio D27 is set to "0.091".
- the compression unit 107 determines whether or not the frame to be processed is included in the compression range H in step S304 in FIG. 29, all of the frames constituting fluorescence signals P24 to P30 are included in compression range H. Therefore, the compression unit 107 determines "Yes" in step S304 for all of the frames constituting fluorescence signals P24 to P30. The compression unit 107 then proceeds to step S305, where it multiplies the fluorescence signal intensity of the frame being processed by the compression rate D27 (S305). As a result, the fluorescence signal intensity of the frame corresponding to maximum signal intensity value D26 is compressed to "32767", or "360000 x 0.091".
- step S305 the compression unit 107 generates the electrophoretic image EP8 shown in FIG. 30 as compressed fluorescent signal data D28. Then, in step S310, the compression unit 107 outputs the generated compressed fluorescent signal data D28.
- dashed line V4 indicates a value equivalent to the maximum signal intensity D26 in FIG. 29 (fluorescent signal intensity of fluorescent signal P29). Then, as shown in FIG. 30, the fluorescent signal data D25 is compressed so that the value equivalent to the maximum signal intensity D26 in FIG. 29 becomes the maximum value of signal intensity that can be used in secondary analysis (in this embodiment, "32676").
- dashed line V4 corresponds to the maximum value of signal intensity that can be used in secondary analysis.
- the electrophoretic image EP that does not contain the fluorescent signal P caused by the primer can also be compressed by the same process as the 2-1 embodiment.
- the compression ratio D27 can be minimized even when the electrophoresis does not include a fluorescent signal caused by the primers. This makes it possible to compress the fluorescent signal data D25 to a range of values that can be input to the secondary analysis software while maintaining a small signal such as the fluorescent signal P caused by DNA.
- FIG. 31 is a diagram showing an example of a secondary analysis screen 300 displayed in this embodiment.
- the secondary analysis screen 300 shown in Fig. 31 is displayed by the secondary analysis software on an output device of a computer running the secondary analysis software when the secondary analysis is performed.
- the output device that outputs the secondary analysis screen 300 shown in Fig. 31 may be, or may not be, the output device 155 shown in Fig. 5.
- an image of the compressed fluorescent signal data D28 is displayed on the secondary analysis screen 300.
- images of the compressed fluorescent signal data D28 shown in Fig. 23, Fig. 28, or Fig. 30 may also be displayed.
- the user performs secondary analysis by referring to the fluorescent signals P25, P27, and P29 derived from DNA displayed on the secondary analysis screen 300.
- the DNA-derived fluorescent signals P25, P27, and P29 which have a minute fluorescent signal intensity compared to the primer-derived fluorescent signals P1 to P3, are displayed at an appropriate size. This allows the user to perform an appropriate secondary analysis.
- the present invention is not limited to the above-described embodiments, and includes various modified examples.
- the above-described embodiments have been described in detail to clearly explain the present invention, and are not necessarily limited to having all of the configurations described. It is also possible to replace part of the configuration of one embodiment with the configuration of another embodiment, and it is also possible to add the configuration of another embodiment to the configuration of one embodiment. It is also possible to add, delete, or replace part of the configuration of each embodiment with other configurations.
- the fluorescence signal data D25 is compressed within the compression range H, and the area outside the compression range H is not compressed.
- the fluorescence signal data D25 may be compressed uniformly at the compression rate D27.
- the above-mentioned configurations, functions, etc. may be realized in hardware by designing some or all of them as integrated circuits, for example.
- the above-mentioned configurations, functions, etc. may be realized in software by a processor such as a CPU interpreting and executing a program that realizes each function.
- Information such as the program, table, file, etc. that realizes each function can be stored in a HD, or in a recording device such as memory 151 or SSD, or a recording medium such as an IC (Integrated Circuit) card, an SD (Secure Digital) card, or a DVD (Digital Versatile Disc).
- the control lines and information lines are those that are considered necessary for the explanation, and not all control lines and information lines in the product are necessarily shown. In reality, it can be considered that almost all components are connected to each other.
- Electrophoresis system 10 Processing device (electrophoresis data processing device) 20 Electrophoresis device 30 External memory 101 Signal integration unit (software binning processing unit) 102 Fluorescence calibration unit (fluorescence signal data generation unit) 103 Pseudo inverse matrix generator (fluorescence signal data generator) 104 Color conversion unit (fluorescence signal data generation unit) 105 Compression range setting section 106 Compression ratio calculation section 107 Compression section 155 Output device 211 Light receiving section 211A Light receiving element 212 Horizontal register section 212A Horizontal register 213 Summing gate 300 Secondary analysis screen B, B1 to BN Bins C, C1 to CL Soft bins D10 Sample to be analyzed (primers are mixed in) D10a Sample to be analyzed (primers and size standards are mixed) D11: Analysis sample signal D12: Analysis sample integrated signal D25: Fluorescence signal data D26: Maximum signal intensity (maximum value of fluorescence signal intensity included in the compression range) D27 Compression ratio D28 Fluorescence signal compression data EP
Landscapes
- Health & Medical Sciences (AREA)
- Life Sciences & Earth Sciences (AREA)
- Chemical & Material Sciences (AREA)
- Molecular Biology (AREA)
- Physics & Mathematics (AREA)
- Analytical Chemistry (AREA)
- Biochemistry (AREA)
- General Health & Medical Sciences (AREA)
- General Physics & Mathematics (AREA)
- Immunology (AREA)
- Pathology (AREA)
- Electrochemistry (AREA)
- Chemical Kinetics & Catalysis (AREA)
- Nuclear Medicine, Radiotherapy & Molecular Imaging (AREA)
- Investigating, Analyzing Materials By Fluorescence Or Luminescence (AREA)
Abstract
Description
その他の解決手段は実施形態中において適宜記載する。
以下、本発明の実施の形態を図面に基づいて詳細に説明する。なお、実施の形態を説明するための全図において、同一部には原則として同一の符号を付し、その繰り返しの説明は省略する。
<第1-1実施形態>
[システム構成]
図1は、第1-1実施形態に係る電気泳動システム1の構成例の概要を示す図である。
図1に示されるように、電気泳動システム1は、電気泳動データ処理装置である処理装置10と、電気泳動装置20と外部メモリ30とを有する。外部メモリ30とは、USB(Universal Serial Bus)メモリや、外付けHD(Hard Disk)等である。
電気泳動装置20は、マルチキャピラリ電気泳動装置であり、ポンプユニット21と、高圧電源22と、恒温槽23と、蛍光検出装置200と、キャピラリアレイ240を有する。また、電気泳動装置20は、サンプルトレイ250と、搬送器260とを有する。
ポンプユニット21は、それぞれのキャピラリ241の内部に電気泳動媒体M(例えば、ポリマ)を注入する。これによって、それぞれのキャピラリ241の内部が、電気泳動媒体Mによって満たされる。
蛍光検出位置24は、サンプルが電気泳動される経路上に設けられる。蛍光検出位置24で、サンプルに励起光R1(図2参照)が照射される。
図1では、処理装置10の概略が示されている。
処理装置10は、ソフトウェアビニング処理部である信号積算部101、蛍光校正部102、色変換部104、圧縮範囲設定部105、圧縮率算出部106、圧縮部107等を有する。処理装置10の詳細な構成については、後記して説明する。
外部メモリ30に対して行われる処理については後記する。
図2は、第1-1実施形態における蛍光検出装置200の構成の概要を示す図である。
図2に示されるように、蛍光検出装置200は、励起光源201と、シャッタ202と、励起光レンズ203とを有する。また、蛍光検出装置200は、光学フィルタ204と、蛍光レンズ205と、回折格子206と、CCDイメージセンサ210とを有する。さらに、蛍光検出装置200は、制御装置220と、変換装置230とを有する。
シャッタ202は、所定間隔毎に開閉を繰り返す。つまり、シャッタ202の開放時に、励起光源201から照射される励起光R1がキャピラリ241に照射される。そして、シャッタ202が閉鎖されると、キャピラリ241への励起光R1の照射が遮断される。シャッタ202が閉じられた状態からシャッタ202が開放状態となり、再びシャッタ202を閉じるまでの期間をフレームと称する。
蛍光レンズ205は、光学フィルタ204を通過した蛍光R2を集光する。
回折格子206は、蛍光レンズ205により集光された蛍光R2を波長毎に分光する。
CCDイメージセンサ210は、回折格子206によって分光された蛍光R2を受光し、蛍光R2の強度に応じた電荷を出力する。
デジタル変換部232は、電荷変換部231から出力されたアナログ信号をデジタル信号に変換する。そして、デジタル変換部232は、変換したデジタル信号を処理装置10へ出力する。
まず、サンプルがサンプル容器251に収容される。そして、高圧電源22によって、それぞれのキャピラリ241の両端に高電圧が印加されることで、サンプルはサンプル容器251からキャピラリ241内へと移動する。これによって、サンプルは蛍光検出位置24を介して排出容器25へ向かってキャピラリ241の内部を移動する(図1の矢印:電気泳動)。サンプルが電気泳動されると、サンプルとしてのDNA断片の塩基長に応じて移動速度が異なるため、塩基長の短いDNA断片から順に蛍光検出位置24に到達する。励起光源201から出射され、シャッタ202を通過し、励起光レンズ203にて集光された励起光R1が、蛍光検出位置24に到達したサンプルに対して照射される。DNA断片に付加している蛍光標識は励起光R1が照射されることで励起し、蛍光R2を発する。蛍光R2は光学フィルタ204を通過し、蛍光レンズ205にて集光され、回折格子206で波長毎に分光される。
図3は、第1-1実施形態におけるCCDイメージセンサ210の構成の概要を示す図である。適宜、図2を参照する。
図3に示されるように、CCDイメージセンサ210は、受光部211と、水平レジスタ部212と、サミングゲート213とを有する。
受光部211は、格子状に配置された複数の受光素子211Aを有する。それぞれの受光素子211Aは、回折格子206によって波長毎に分光された蛍光R2を受光する面である。つまり、受光素子211Aは、電気泳動システム1に備えられているキャピラリ241から発せられる蛍光R2が回折格子206によって分光された光を受光する。受光素子211Aは、蛍光R2を受光すると、蛍光R2の強度に応じた信号電荷を蓄積する。また、受光部211は、パルス線L1で制御装置220と接続されている。受光部211を構成するそれぞれの受光素子211Aに蓄積された信号電荷は、パルス線L1を通じた制御装置220の指示に応じて信号電荷を出力する。受光素子211Aによる信号電荷の出力の詳細については後記する。
図4は、第1-1実施形態に係る処理装置10の構成を示す図である。適宜、図1及び図2を参照する。
処理装置10は、信号積算部101、蛍光校正部102、擬似逆行列生成部103、色変換部104を有する。また、処理装置10は、圧縮範囲設定部105、圧縮率算出部106、圧縮部107を有する。前記したように、信号積算部101は、ソフトウェアビニング処理部を構成する。また、蛍光校正部102、擬似逆行列生成部103、色変換部104は、蛍光信号データ生成部を構成する。
図5は、処理装置10のハードウェア構成例を示す図である。
図5に示すように、処理装置10は、メモリ151、演算装置152、記憶装置153、入力装置154、出力装置155、通信装置156を備える。
メモリ151は、RAM(Random Access Memory)等で構成される。演算装置152は、CPU(Central Processing Unit)や、GPU(Graphic Processing Unit)等で構成される。記憶装置153は、HD(Hard Disk)や、SSD(Solid State Drive)等で構成される。入力装置154は、キーボードや、ボタン等で構成される。出力装置155は、ディスプレイ等で構成される。なお、入力装置154と、出力装置155は、タッチパネルディスプレイ等で一体となっていてもよい。
図6~図10は分光された蛍光R2(図2参照)をデジタル信号に変換する動作を説明するための図である。適宜図2を参照する。また、図6~図8において(さらに図3において)、受光素子211Aに示されている破線は、ビンBを示している。ビンBについては後記するが、複数の受光素子211Aがまとめられ、疑似的意に1個の受光素子211Aとみなされるものである。
図11は、制御装置220がパルスを印加するタイミングを示す図である。
図11では、紙面上から順に、受光部211に印加されるパルスのタイミング、水平レジスタ部212に印加されるパルスのタイミング、サミングゲート213に印加されるパルスのタイミングを示している。
図12は、ソフトビンCの生成を示す図である。
図12では、1つのフレームにおいて、デジタル信号がビンB毎に積算されることで、ソフトビンCが生成されることが示されている。信号積算部101は、入力されたビンBに関するデジタル信号を積算することにより、複数のビンBを、さらに疑似的に1個のビンBとして扱うことができる。このように複数のビンBを疑似的に1個のビンBとして扱うことはソフトウェアビニングと称される。また、疑似的に結合されたビンBはソフトビンCと称される。図14はソフトビンCを構成するビンBの例を示す表である。なお、ソフトウェアビニングする領域は図12及び図14に示す例に限定しなくてもよい。ソフトウェアビニングする領域を変更する(可変とする)ことにより、CCDイメージセンサ210の感度を変更することができる。つまりソフトビンCの大きさは可変である。
図15は、第1-1実施形態において、圧縮範囲設定部105が行う圧縮範囲設定ステップである圧縮範囲決定処理の手順を示すフローチャートである。また、図16は、電気泳動像EPの例を示す図である。適宜、図4を参照する。
圧縮範囲決定処理では、DNAに起因する蛍光信号Pを適切に圧縮するため、プライマに起因する蛍光信号Pと、DNAに起因する蛍光信号Pとを分けることを目的としている。
続いて、圧縮範囲設定部105は、生成した電気泳動像EPに含まれる蛍光信号Pのうち、1つを選択する。この際、圧縮範囲設定部105は、図16に示す電気泳動像EPをフレーム番号「1」から「5000」に向かってサーチし、蛍光信号強度が所定の値以上となっている範囲のフレーム番号を取得する。圧縮範囲設定部105は、この範囲のフレーム番号に相当する蛍光信号強度を、1つの蛍光信号Pとして選択する。
すべてのフレームについて、処理が完了している場合(S108→Yes)、圧縮範囲設定部105は、分析対象外の蛍光信号Pが検出されたか否かを判定する(S109)。つまり、ステップS109で、圧縮範囲設定部105は、分析対象外の目印JNが付与された蛍光信号Pが検出されたか否かを判定する。
図17は、第1-1実施形態において圧縮率算出部106が行う圧縮率算出ステップである圧縮率算出処理の手順を示すフローチャートである。適宜、図4を参照する。
初めに、圧縮率算出部106は、色変換部104から蛍光信号データD25を取得する(S201)。
次に、圧縮率算出部106は、圧縮範囲設定部105から圧縮範囲Hを取得する(S202)。
続いて、圧縮率算出部106は、蛍光信号データD25の電気泳動像EP(図16参照)を描画(生成)する。そして、圧縮率算出部106は、圧縮範囲Hに含まれる蛍光信号データD25のうち、最大の蛍光信号強度である信号強度最大値D26を取得する(S203)。ステップS203の具体的な処理について後記する。信号強度最大値D26は、圧縮範囲Hに含まれる蛍光信号データD25のうち、最大の蛍光信号強度である。即ち、信号強度最大値D26は、圧縮範囲Hに含まれる蛍光信号強度の最大値である。
図18は、第1-1実施形態において圧縮部107が行う圧縮ステップである圧縮処理の手順を示すフローチャートである。適宜、図4を参照する。
初めに、圧縮部107は、色変換部104から蛍光信号データD25を取得する(S301)。
次に、圧縮部107は、圧縮範囲設定部105から圧縮範囲Hを取得する(S302)。
続いて、圧縮部107は、圧縮率算出部106から圧縮率D27を取得する(S303)。
そして、圧縮部107は、取得した蛍光信号データD25を構成するフレームを1つ選択する。そして、圧縮部107は、選択したフレームが圧縮範囲Hに含まれるか否かを判定する(S304)。フレームの選択は、フレーム番号の小さい順に行われるとよい。
すべてのフレームについてステップS304~S308の処理が完了していない場合(S309→No)、圧縮部107は、ステップS304の処理に戻る。そして、圧縮部107は、次のフレームについてステップS304~S308の処理を行う。
続いて、図19~図21を参照して、第1-1実施形態の作用を説明する。なお、図19~図21では、分析対象サンプルD10の電気泳動像EP1,EP2(EP)が示されている。分析対象サンプルD10には、分析対象のDNAに起因する蛍光信号Pと、分析対象外のプライマに起因する蛍光信号Pが含まれる。
また、第1閾値は図15のステップS103で用いられるものであり、図19で示す例では第1閾値として「50」フレームが設定されているものとする。第2閾値は図15のステップS104で用いられるものであり、図19で示す例では前記したように第2閾値として「10000000」が設定されているものとする。第3閾値は図15のステップS105で用いられるものであり、図19で示す例では、前記したように第3閾値として「2500」フレームが設定されているものとする。
まず、図3、図15、図19及び図20を参照して圧縮範囲設定部105による作用を説明する。以下の文において、ステップ番号は図15で使用されているステップ番号である。
前記したように、圧縮範囲設定部105は色変換部104から蛍光信号データD25を取得する(S101)。圧縮範囲設定部105がステップS102で図19に示す電気泳動像EP1(EP)が描画されるものとする。図19において、下部に示されている数値はフレーム番号を示している。例えば、蛍光信号P1(P)は、フレーム番号「300」~「800」の間に存在している。他の蛍光信号P2~P7(P)も同様である。また、フレーム番号「5000」は、電気泳動像EP1(即ち、蛍光信号データD25)における最後のフレーム番号である。
続いて、図4や、図17や、図20を参照して、圧縮率算出部106による作用を説明する。以下の文で、ステップ番号は図17で使用されているステップ番号である。
圧縮率算出部106は色変換部104から蛍光信号データD25を取得する(S201)。続いて、圧縮率算出部106は圧縮範囲設定部105から圧縮範囲Hを取得する(S202)。図20に示すように、本実施形態で示す例では、圧縮範囲Hはフレーム番号「2001」~「5000」である。このように、ステップS201及びステップS202により、圧縮率算出部106は、図20に示す蛍光信号データD25及び圧縮範囲Hを取得する。圧縮率算出部106は、ステップS203で圧縮範囲Hに含まれる蛍光信号データD25の蛍光信号強度の最大値(信号強度最大値D26)を取得する。図20より、フレーム番号「2001」~「5000」における蛍光信号強度の信号強度最大値D26は「360000」である。
続いて、図4や、図18や、図21を参照して、圧縮部107による作用を説明する。以下の文でステップ番号は図18で使用されているステップ番号である。なお、図20及び図21において、紙面下横軸に引き出し線とともに記載されている「2000」、「2001」はフレーム番号である。
圧縮部107は色変換部104から蛍光信号データD25を取得する(S301)。続いて圧縮部107は圧縮範囲設定部105から圧縮範囲Hを取得する(S302)。このように、ステップS301及びステップS302により、図20に示す蛍光信号データD25及び圧縮範囲Hが取得される。図20に示すように、本実施形態に示す例では、圧縮範囲Hは、フレーム番号「2001」~「5000」である。続いて、圧縮部107は圧縮率算出部106から圧縮率D27を取得する(S303)。前記したように、本実施形態で示す例において、圧縮率D27は「0.091」である。そして、圧縮部107は、ステップS304で、処理対象となっているフレームが圧縮範囲Hに含まれるか否か判定する。
特許文献1では、ハードウェアビニングとソフトウェアビニングを切り替える手法が記載されている。しかしながら、特許文献1には、電気泳動システム1の出力する値を二次解析で使用できるようにする手段が記載されていない。
しかしながら、第1-1実施形態によれば、プライマに起因する蛍光信号Pと、分析対象のDNAに起因する蛍光信号Pを分別することにより圧縮率D27を最小化することができる。
本実施形態の図15のステップS102で生成した分析対象サンプルD10の電気泳動像EPが図19に示す電気泳動像EP1とする。また、図20の蛍光信号P6の信号強度最大値D26が取得されたフレームにおけるビンBの分析対象サンプル信号D11が図12に示すようなソフトウェアビニングが行われているものとする。図20に示す例では、信号強度最大値D26が取得されたフレームは、フレーム番号「3810」のフレームである。また、図14に従ってソフトウェアビニングが実施されるとする。
また、外部メモリ30には、分析対象サンプル信号D11、本実施形態による蛍光信号圧縮データD28、圧縮率D27(本実施形態では「0.091」)が出力される。
続いて、図22及び図23を参照して本発明の第1-2実施形態を説明する。
図22及び図23は、電気泳動像EPの例を示す図である。
第1-1実施形態では、プライマに起因する蛍光信号Pを含む電気泳動像EPにおける電気泳動データ処理方法を説明した。
これに対して、第1-2実施形態では、プライマに起因する蛍光信号Pを含まない電気泳動像EP(蛍光信号データD25)における電気泳動データ処理方法を説明する。第1-2実施形態では、第1-1実施形態で示す処理は、プライマを含まない蛍光信号データD25に対しても適用可能であることを示す。
第1-2実施形態におけるシステム構成及び動作は第1-1実施形態と同様である。従って、第1-2実施形態におけるシステム構成及び動作(フローチャート)の図示を省略する。
図15のステップS102で描画された電気泳動像EPが図22に示す電気泳動像EP3であった場合について説明する。なお、図22では、分析対象サンプルD10の電気泳動像EP3(EP)が示されている。分析対象サンプルD10には、分析対象のDNAに起因する蛍光信号Pのみが含まれ、分析対象外のプライマに起因する蛍光信号Pは含まれないものとする。
また第1閾値、第2閾値、第3閾値は第1-1実施形態と同様とする。
図3、図15、図22を参照して、圧縮範囲設定部105による作用を説明する。また、以下の文において、ステップ番号は図15で使用されているステップ番号である。
圧縮範囲設定部105は色変換部104から蛍光信号データD25を取得する(S101)。圧縮範囲設定部105によってステップS102で描画された電気泳動像EP3(EP)が図22に示すものとする。図22に示すように電気泳動像EP3は7つの蛍光信号P(P8~P14)を含むものとする。
続いて、図4、図17、図22を参照して、圧縮率算出部106による作用を説明する。以下の文において、ステップ番号は図17で使用されているステップ番号である。
圧縮率算出部106は色変換部104から蛍光信号データD25を取得する(S201)。続いて、圧縮率算出部106は圧縮範囲設定部105から圧縮範囲Hを取得する(S202)。第1-2本実施形態では、図22に示すようにフレーム番号「1」~「5000」が圧縮範囲Hである。圧縮率算出部106は、ステップS203で圧縮範囲Hに含まれる蛍光信号データD25の信号強度最大値D26を取得する。図22に示されようにフレーム番号「1」~「5000」に含まれる蛍光信号データD25の信号強度最大値D26は「360000」である。
続いて、図3、図18、図22及び図23を参照して、圧縮部107による作用を説明する。以下の文においてステップ番号は図18で使用されているステップ番号である。
圧縮部107は色変換部104から蛍光信号データD25を取得する(S301)。そして、圧縮部107106は圧縮範囲設定部105から圧縮範囲Hを取得する(S302)。第1-2実施形態では、前記したようにフレーム番号「1」~「5000」が圧縮範囲Hとなる。続いて、圧縮部107は圧縮率算出部106から圧縮率D27を取得する(S303)。第1-2実施形態では、前記したように圧縮率D27は「0.091」である。
図22を参照すると、蛍光信号P8~P14を構成するフレームはいずれも圧縮範囲Hに含まれる。従って、蛍光信号P8~P14のいずれについても、圧縮部107は、ステップS304で「Yes」と判定する。そして、圧縮部107は、ステップS305に進み、処理対象となっているフレームの蛍光信号強度に圧縮率D27を乗算する(S305)。これにより信号強度最大値D26に該当するフレームの蛍光信号強度は「360000×0.091」により「32767」に圧縮される。
第1-2実施形態によれば、第1-1実施形態の効果に加えて、蛍光信号データD25がプライマに起因する蛍光信号を含まない場合でも第1-1実施形態と同様の効果を奏することができる。つまり、蛍光信号データD25がプライマに起因する蛍光信号Pを含まない場合でも圧縮率D27を最小化することで微小信号を維持しつつ、二次解析ソフトウェアに入力できる値の範囲に圧縮することができる。
続いて、図25~図30を参照して、本発明の第2実施形態について説明する。
第1実施形態では、プライマに起因する分析対象外の蛍光信号Pの特徴に基づき、蛍光信号Pを分別することで、圧縮範囲Hが決定されている。第2実施形態では、蛍光信号Pの特徴及びサイズスタンダードの特徴に基づき、圧縮範囲Hが決定される。
[システム構成]
図24は、第2-1実施形態に係る処理装置10の構成を示す図である。
図24において、分析対象サンプルD10aが、分析対象となるDNA、プライマ、サイズスタンダードの混合液である点が、図4に示す構成と異なっている。また、図24に示す処理装置10でぇあ、圧縮範囲設定部105の圧縮範囲Hの設定方法が第1実施形態と異なっている。それ以外の構成は、図4と同様である。
図25を参照して、第2-1実施形態における電気泳動データ処理方法の処理手順を説明する。
(圧縮範囲H決定処理)
図25は、第2-1実施形態において圧縮範囲設定部105が行う圧縮範囲設定ステップである圧縮範囲決定処理の手順を示すフローチャートである。適宜、図4を参照する。
初めに、圧縮範囲設定部105は、色変換部104から蛍光信号データD25を取得する(S401)。ステップS401で、圧縮範囲設定部105は、すべてのフレームに関する蛍光信号データD25を取得する。
付与された番号の最大値が、サイズスタンダードとして規定されている個数と同じではない場合(S409→No)、圧縮範囲設定部105は、目印JSの削除を行う(S411)。この際、圧縮範囲設定部105は、圧縮範囲設定部105は、規定の個数より大きい番号が付与されている蛍光信号Pについて、サイズスタンダードの目印JSを削除する。そして、圧縮範囲設定部105は、ステップS410に進む。なお、サイズスタンダードの目印JSが付与されている蛍光信号Pの数が、サイズスタンダードの規定の個数より少なくなることはない。
第2-1実施形態において、圧縮率算出部106が行う圧縮率算出処理の手順は図17に示す処理と同様であるため、第2-1実施形態での図示及び説明を省略する。また、第2-1実施形態において圧縮部107が行う圧縮処理の手順は、図18に示す処理と同様であるため、第2-1実施形態での説明を省略する。
続いて、図18、図25~図28を参照して、第2-1実施形態の作用を説明する。
図26~図28は、電気泳動像EPの例を示す図である。
なお、図26~図28では、分析対象サンプルD10aの電気泳動像EP5,EP6(EP)が示されている。また、第2実施形態(第2-1実施形態及び第2-2実施形態)において、サイズスタンダードに起因する蛍光信号Pは4本の蛍光信号Pから構成されるものとする。なお、サイズスタンダードに起因する蛍光信号Pは4本の蛍光信号Pから構成されるものに限らない。また、図26~図28に示すように電気泳動像EPにおいて、サイズスタンダードの色を有する蛍光信号Pは一点鎖線で表示されるものとする。
図25~図27を参照して、圧縮範囲設定部105による作用を説明する。なお、以下の文において、ステップ番号は図25で使用されているステップ番号である。
まず、圧縮範囲設定部105は色変換部104から蛍光信号データD25を取得する(S401)。圧縮範囲設定部105がステップS402で描画した電気泳動像EP5を図26に示す。そして、圧縮範囲設定部105は、生成した電気泳動像EPに含まれる蛍光信号Pのうち、1つを選択する。即ち、圧縮範囲設定部105は、これらの蛍光信号Pのうち、フレーム番号「1」からサーチして、最初に検出される蛍光信号P15について処理を行う。その後、圧縮範囲設定部105は、選択した蛍光信号Pについて、色がサイズスタンダードで使用されている色(サイズスタンダードの色)であるか否かを判定する(S403)。
(1)サイズスタンダードに起因する蛍光信号Pの個数が既知。
(2)サイズスタンダードに起因する蛍光信号Pは分析対象のDNAに起因する蛍光信号Pより広い範囲に検出される。
(3)サイズスタンダードに起因する蛍光信号Pはプライマに起因する蛍光信号Pよりも遅く検出される。
第2-1実施形態において、圧縮率算出部106による作用は、第1-1実施形態と同様である。従って、第2-1実施形態における圧縮率算出部106による作用の図示及び説明を省略する。第2-1実施形態でも、圧縮率D27は、「0.091」と算出される。
次に、図18、図27及び図28を参照して、圧縮部107による作用を説明する。なお、以下の説明において、ステップ番号は図18で使用されているステップ番号である。
初めに、圧縮部107は色変換部104から蛍光信号データD25を取得する(S301)。続いて、圧縮部107106は圧縮範囲設定部105から圧縮範囲Hを取得する(S302)。ステップS301及びステップS303により、図27に示す蛍光信号データD25及び圧縮範囲Hが取得されたものとする。第2-1実施形態では、図27に示すようにフレーム番号「2000」~フレーム番号「4500」が圧縮範囲Hとして設定されている。
第2-1実施形態によれば、第1-1実施形態の効果に加えて、サイズスタンダードの特徴が利用されている。これにより、サイズスタンダードが用いられている場合でも、圧縮率D27を最小化することで微小信号を維持しつつ、蛍光信号データD25を、二次解析ソフトウェアに入力できる値の範囲に圧縮することができる。
続いて、図25、図29及び図30を参照して本発明の第2-2実施形態を説明する。
図29及び図30は、電気泳動像EPの例を示す図である。
第2-1実施形態では、サイズスタンダードに起因する蛍光信号Pの特徴を利用している。これにより、プライマに起因する蛍光信号Pを含む電気泳動像EP(蛍光信号データD25)におけるデータ処理方法が説明されている。
第2-2実施形態において、図25のステップS402で描画された電気泳動像EPが図29に示す電気泳動像EP7(EP)であった場合について説明する。なお、図29では、分析対象サンプルD10の電気泳動像EP7が示されている。蛍光信号データD25には、分析対象のDNAに起因する蛍光信号P、及び、サイズスタンダードに起因する蛍光信号Pが含まれている。一方、蛍光信号データD25には、分析対象外のプライマに起因する蛍光信号Pを含まれていないものとする。なお、第2-2実施形態において、サイズスタンダードは4本の蛍光信号Pから構成されているものとする。そして、電気泳動像EP7において、サイズスタンダードに起因する蛍光信号Pの色は一点鎖線で表示されるものとする。
図25及び図29を参照して、第2-2実施形態における圧縮範囲設定部105による作用を説明する。以下の記載において、ステップ番号は図25に示すステップ番号である。
初めに、圧縮範囲設定部105は色変換部104から蛍光信号データD25を取得する(S401)。圧縮範囲設定部105がステップS402で描画した電気泳動像EP7を図29に示す。図29に示すように電気泳動像EP7は7つの蛍光信号Pを含んでいる。そして圧縮範囲設定部105は、これらの蛍光信号Pのうち、フレーム番号「1」からサーチして、最初に検出される蛍光信号P24について処理を行う。この蛍光信号P24は、サイズスタンダードの色である。従って、ステップS403で「Yes」が判定され、圧縮範囲設定部105は、蛍光信号P24にサイズスタンダードの目印JSを付与する(S405)。
次に、図17及び図29を参照して、圧縮率算出部106による作用を説明する。以下の記載において、ステップ番号は図17に示すステップ番号である。
初めに、圧縮率算出部106は色変換部104から蛍光信号データD25を取得する(S201)。続いて、圧縮率算出部106は圧縮範囲設定部105から圧縮範囲Hを取得する(S202)。前記したように、第2-2実施形態ではフレーム番号「2000」~「5000」が圧縮範囲Hである。圧縮率算出部106は、ステップS203で圧縮範囲Hに含まれる蛍光信号データD25の信号強度最大値D26を取得する。図29に示すように、フレーム番号「1」~「5000」に含まれる蛍光信号データD25の信号強度最大値D26は「360000」である。
次に、図18、図29及び図30を参照して、圧縮部107による作用を説明する。以下の記載において、ステップ番号は図18に示すステップ番号である。
初めに、圧縮部107は色変換部104から蛍光信号データD25を取得する(S301)。続いて圧縮部107は圧縮範囲設定部105から圧縮範囲Hを取得する(S302)。前記したように、第2-2実施形態ではフレーム番号「2000」~「5000」が圧縮範囲Hである。続いて、圧縮部107は圧縮率算出部106から圧縮率D27を取得する(S303)。前記したように、第2-2実施形態では圧縮率D27として「0.091」が設定されている。
図29を参照すると、蛍光信号P24~P30を構成するフレームはいずれも圧縮範囲Hに含まれる。従って、蛍光信号P24~P30を構成するフレームのいずれについても、圧縮部107は、ステップS304で「Yes」と判定する。そして、圧縮部107は、ステップS305に進み、処理対象となっているフレームの蛍光信号強度に圧縮率D27を乗算する(S305)。これにより信号強度最大値D26に該当するフレームの蛍光信号強度は「360000×0.091」により「32767」に圧縮される。
第2-2実施形態によれば、第2-1実施形態の効果に加えて、電気泳動においてプライマに起因する蛍光信号を含まない場合でも、圧縮率D27を最小化することができる。これにより、DNAに起因する蛍光信号Pのような微小信号を維持しつつ、蛍光信号データD25を、二次解析ソフトウェアに入力できる値の範囲に圧縮することができる。
図31は、本実施形態で表示される二次解析画面300の例を示す図である。
図31に示す二次解析画面300は、二次解析が行われる際に二次解析ソフトウェアによって、二次解析ソフトウェアが実行されているコンピュータの出力装置に表示されるものである。なお、図31に示す二次解析画面300を出力する出力装置は、図5に示す出力装置155であってもよいし、そうでなくてもよい。
図31に示すように、二次解析画面300には蛍光信号圧縮データD28の画像が表示されている。なお、図31では、図21に示す蛍光信号圧縮データD28の画像が表示されているが、図23、図28、図30に示す蛍光信号圧縮データD28の画像が表示されてもよい。ユーザは、二次解析画面300に表示されているDNAに由来する蛍光信号P25,P27,P29を参照して二次解析を行う。
また、各実施形態において、制御線や情報線は説明上必要と考えられるものを示しており、製品上必ずしもすべての制御線や情報線を示しているとは限らない。実際には、ほとんどすべての構成が相互に接続されていると考えてよい。
10 処理装置(電気泳動データ処理装置)
20 電気泳動装置
30 外部メモリ
101 信号積算部(ソフトウェアビニング処理部)
102 蛍光校正部(蛍光信号データ生成部)
103 擬似逆行列生成部(蛍光信号データ生成部)
104 色変換部(蛍光信号データ生成部)
105 圧縮範囲設定部
106 圧縮率算出部
107 圧縮部
155 出力装置
211 受光部
211A 受光素子
212 水平レジスタ部
212A 水平レジスタ
213 サミングゲート
300 二次解析画面
B,B1~BN ビン
C,C1~CL ソフトビン
D10 分析対象サンプル(プライマが混合されている)
D10a 分析対象サンプル(プライマ、サイズスタンダードが混合されている)
D11 分析対象サンプル信号
D12 分析対象サンプル積算信号
D25 蛍光信号データ
D26 信号強度最大値(圧縮範囲に含まれる蛍光信号強度の最大値)
D27 圧縮率
D28 蛍光信号圧縮データ
EP,EP1~EP8 電気泳動像
H 圧縮範囲
JN 目印
JS,JS1~JS5 目印(第2の蛍光信号と判定された蛍光信号に対して付与される目印)
JY,JN 目印
P 蛍光信号
P1~P3 蛍光信号(第2の蛍光信号)
P4~P14 蛍光信号(第1の蛍光信号)
P15,P16 蛍光信号
P17,P19,P21,P23,P24,P26,P28,P30 蛍光信号(第2の蛍光信号)
P18,P20,P22,P25,P27,P29 蛍光信号(第1の蛍光信号)
V1~V4 破線(二次解析で使用可能な信号強度の最大値に相当)
S101~S112 圧縮範囲設定処理(圧縮範囲設定ステップ)
S201~S205 圧縮率算出処理(圧縮率算出ステップ)
S301~S310 圧縮処理(圧縮ステップ)
S401~S412 圧縮範囲設定処理(圧縮範囲設定ステップ)
Claims (9)
- 電気泳動装置と、
前記電気泳動装置から、ハードウェアビニングが施された分析対象サンプルに関する信号である分析対象サンプル信号と、ハードウェアビニングが施されたマトリクススタンダードに関する信号であるマトリクススタンダード信号を取得し、前記分析対象サンプル信号及び前記マトリクススタンダード信号に対し、ソフトウェアビニングを行うソフトウェアビニング処理部と、
前記ソフトウェアビニングが行われた前記分析対象サンプル信号、及び、前記ソフトウェアビニングが行われた前記マトリクススタンダード信号を基に、フレーム毎における蛍光信号強度に関するデータである蛍光信号データを生成する蛍光信号データ生成部と、
前記蛍光信号データに含まれる蛍光信号について、分析対象に起因する第1の蛍光信号と、分析対象以外に起因する第2の蛍光信号とを区別して検出し、当該検出の結果に基づいて前記蛍光信号データのフレームに対して圧縮範囲を設定する圧縮範囲設定部と、
前記圧縮範囲に含まれる前記蛍光信号強度の最大値と、二次解析で使用可能な信号強度の最大値とを基に、圧縮率を算出する圧縮率算出部と、
前記圧縮率を基に、前記蛍光信号データを圧縮することで、蛍光信号圧縮データを生成し、生成した前記蛍光信号圧縮データを出力する圧縮部と、
を有することを特徴とする電気泳動システム。 - 前記第2の蛍光信号は、プライマに起因する蛍光信号であり、
前記圧縮範囲設定部は、
前記第2の蛍光信号が検出されているフレームより後のフレームから前記圧縮範囲を設定する
ことを特徴とする請求項1に記載の電気泳動システム。 - 前記圧縮範囲設定部は、
前記蛍光信号データに含まれる蛍光信号について、前記蛍光信号の幅、面積、前記蛍光信号を含む最後の前記フレームのうち、少なくとも1つを基に、前記プライマに起因する前記第2の蛍光信号と、前記第1の蛍光信号とを区別して検出する
ことを特徴とする請求項2に記載の電気泳動システム。 - 前記圧縮範囲設定部は、
サイズスタンダードに起因する蛍光信号を前記第2の蛍光信号として検出し、
前記第2の蛍光信号が検出されるフレーム範囲を前記圧縮範囲として設定する
ことを特徴とする請求項1に記載の電気泳動システム。 - 前記圧縮範囲設定部は、
前記蛍光信号の色情報に基づいて、前記第1の蛍光信号と、前記第2の蛍光信号とを区別して検出する
ことを特徴とする請求項4に記載の電気泳動システム。 - 前記圧縮範囲設定部は、
前記第2の蛍光信号と判定された前記蛍光信号に対して、目印を付与し、
前記目印を付与されている前記蛍光信号の数が、使用されている前記サイズスタンダードの数を超過している場合、前記蛍光信号データにおいて、前記目印を付与された前記蛍光信号のうち、該当するフレーム番号の小さい方から、超過分だけ、前記蛍光信号に付与されている前記目印を削除し、
前記目印が付与されている前記蛍光信号が検出されるフレーム範囲を前記圧縮範囲として設定する
ことを特徴とする請求項5に記載の電気泳動システム。 - 前記圧縮部は、
前記蛍光信号圧縮データに加えて、前記分析対象サンプル信号、及び、前記圧縮率を出力する
ことを特徴とする請求項1に記載の電気泳動システム。 - 電気泳動装置から、ハードウェアビニングが施された分析対象サンプルに関する信号である分析対象サンプル信号と、ハードウェアビニングが施されたマトリクススタンダードに関する信号であるマトリクススタンダード信号を取得し、前記分析対象サンプル信号及び前記マトリクススタンダード信号に対し、ソフトウェアビニングを行うソフトウェアビニング処理部と、
前記ソフトウェアビニングが行われた前記分析対象サンプル信号、及び、前記ソフトウェアビニングが行われた前記マトリクススタンダード信号を基に、フレーム毎における蛍光信号強度に関するデータである蛍光信号データを生成する蛍光信号データ生成部と、
前記蛍光信号データに含まれる蛍光信号について、分析対象に起因する第1の蛍光信号と、分析対象以外に起因する第2の蛍光信号とを区別して検出し、当該検出の結果に基づいて前記蛍光信号データのフレームに対して圧縮範囲を設定する圧縮範囲設定部と、
前記圧縮範囲に含まれる前記蛍光信号強度の最大値と、二次解析で使用可能な信号強度の最大値とを基に、圧縮率を算出する圧縮率算出部と、
前記圧縮率を基に、前記蛍光信号データを圧縮することで、蛍光信号圧縮データを生成し、生成した前記蛍光信号圧縮データを出力する圧縮部と、
を有することを特徴とする電気泳動データ処理装置。 - 電気泳動装置から、ハードウェアビニングが施された分析対象サンプルに関する信号である分析対象サンプル信号と、ハードウェアビニングが施されたマトリクススタンダードに関する信号であるマトリクススタンダード信号を取得し、前記分析対象サンプル信号及び前記マトリクススタンダード信号に対し、ソフトウェアビニングが行われた前記分析対象サンプル信号、及び、前記ソフトウェアビニングが行われた前記マトリクススタンダード信号を基に、フレーム毎における蛍光信号強度に関するデータである蛍光信号データを生成する電気泳動システムが、
前記蛍光信号データに含まれる蛍光信号について、分析対象に起因する第1の蛍光信号と、分析対象以外に起因する第2の蛍光信号とを区別して検出し、当該検出の結果に基づいて前記蛍光信号データのフレームに対して圧縮範囲を設定する圧縮範囲設定ステップと、
前記圧縮範囲に含まれる前記蛍光信号強度の最大値と、二次解析で使用可能な信号強度の最大値とを基に、圧縮率を算出する圧縮率算出ステップと、
前記圧縮率を基に、前記蛍光信号データを圧縮することで、蛍光信号圧縮データを生成し、生成した前記蛍光信号圧縮データを出力する圧縮ステップと、
を実行することを特徴とする電気泳動データ処理方法。
Priority Applications (5)
| Application Number | Priority Date | Filing Date | Title |
|---|---|---|---|
| DE112023005475.4T DE112023005475T5 (de) | 2023-06-16 | 2023-06-16 | Elektrophorese-system, elektrophoresedaten¬verarbeitungseinrichtung und elektrophoresedaten¬verarbeitungsverfahren |
| PCT/JP2023/022453 WO2024257345A1 (ja) | 2023-06-16 | 2023-06-16 | 電気泳動システム、電気泳動データ処理装置、及び、電気泳動データ処理方法 |
| JP2025527191A JPWO2024257345A1 (ja) | 2023-06-16 | 2023-06-16 | |
| CN202380093737.XA CN120677374A (zh) | 2023-06-16 | 2023-06-16 | 电泳系统、电泳数据处理装置以及电泳数据处理方法 |
| GB2513506.2A GB2642900A (en) | 2023-06-16 | 2023-06-16 | Electrophoresis system, electrophoresis data processing device, and electrophoresis data processing method |
Applications Claiming Priority (1)
| Application Number | Priority Date | Filing Date | Title |
|---|---|---|---|
| PCT/JP2023/022453 WO2024257345A1 (ja) | 2023-06-16 | 2023-06-16 | 電気泳動システム、電気泳動データ処理装置、及び、電気泳動データ処理方法 |
Publications (1)
| Publication Number | Publication Date |
|---|---|
| WO2024257345A1 true WO2024257345A1 (ja) | 2024-12-19 |
Family
ID=93851627
Family Applications (1)
| Application Number | Title | Priority Date | Filing Date |
|---|---|---|---|
| PCT/JP2023/022453 Ceased WO2024257345A1 (ja) | 2023-06-16 | 2023-06-16 | 電気泳動システム、電気泳動データ処理装置、及び、電気泳動データ処理方法 |
Country Status (5)
| Country | Link |
|---|---|
| JP (1) | JPWO2024257345A1 (ja) |
| CN (1) | CN120677374A (ja) |
| DE (1) | DE112023005475T5 (ja) |
| GB (1) | GB2642900A (ja) |
| WO (1) | WO2024257345A1 (ja) |
Citations (3)
| Publication number | Priority date | Publication date | Assignee | Title |
|---|---|---|---|---|
| JP2015049179A (ja) * | 2013-09-03 | 2015-03-16 | 株式会社日立ハイテクノロジーズ | キャピラリアレイ電気泳動装置および蛍光検出装置ならびに蛍光信号強度取得方法 |
| WO2023007567A1 (ja) * | 2021-07-27 | 2023-02-02 | 株式会社日立ハイテク | マルチキャピラリ電気泳動装置 |
| WO2023058105A1 (ja) * | 2021-10-05 | 2023-04-13 | 株式会社日立ハイテク | 電気泳動データ処理装置、及び、電気泳動データ処理方法 |
-
2023
- 2023-06-16 WO PCT/JP2023/022453 patent/WO2024257345A1/ja not_active Ceased
- 2023-06-16 CN CN202380093737.XA patent/CN120677374A/zh active Pending
- 2023-06-16 JP JP2025527191A patent/JPWO2024257345A1/ja active Pending
- 2023-06-16 GB GB2513506.2A patent/GB2642900A/en active Pending
- 2023-06-16 DE DE112023005475.4T patent/DE112023005475T5/de active Pending
Patent Citations (3)
| Publication number | Priority date | Publication date | Assignee | Title |
|---|---|---|---|---|
| JP2015049179A (ja) * | 2013-09-03 | 2015-03-16 | 株式会社日立ハイテクノロジーズ | キャピラリアレイ電気泳動装置および蛍光検出装置ならびに蛍光信号強度取得方法 |
| WO2023007567A1 (ja) * | 2021-07-27 | 2023-02-02 | 株式会社日立ハイテク | マルチキャピラリ電気泳動装置 |
| WO2023058105A1 (ja) * | 2021-10-05 | 2023-04-13 | 株式会社日立ハイテク | 電気泳動データ処理装置、及び、電気泳動データ処理方法 |
Also Published As
| Publication number | Publication date |
|---|---|
| JPWO2024257345A1 (ja) | 2024-12-19 |
| GB2642900A (en) | 2026-01-28 |
| CN120677374A (zh) | 2025-09-19 |
| DE112023005475T5 (de) | 2025-11-27 |
Similar Documents
| Publication | Publication Date | Title |
|---|---|---|
| US8392126B2 (en) | Method and system for determining the accuracy of DNA base identifications | |
| JP7822944B2 (ja) | インデックス配列の人工知能ベースのベースコール | |
| KR102667912B1 (ko) | 미세부수체 불안정성을 결정하기 위한 시스템 및 방법 | |
| NL1016034C2 (nl) | Werkwijze en systeem voor het identificeren en kwantificeren van chemische componenten van een te onderzoeken mengsel van materialen. | |
| CN117274739B (zh) | 碱基识别方法及其训练集构建方法、基因测序仪及介质 | |
| US10041884B2 (en) | Nucleic acid analyzer and nucleic acid analysis method using same | |
| CN117392673B (zh) | 碱基识别方法及装置、基因测序仪及介质 | |
| CN109564189B (zh) | 电泳图谱分析 | |
| US5098536A (en) | Method of improving signal-to-noise in electropherogram | |
| US8831316B2 (en) | Point source detection | |
| JP5810078B2 (ja) | 核酸定量方法 | |
| Adelman et al. | Automated detection and removal of capillary electrophoresis artifacts due to spectral overlap | |
| CN112513618A (zh) | 生物聚合物分析方法及生物聚合物分析装置 | |
| US20180374212A1 (en) | Object Classification in Digital Images | |
| JPWO2007013551A1 (ja) | 光強度測定方法および光強度測定装置 | |
| CN120677374A (zh) | 电泳系统、电泳数据处理装置以及电泳数据处理方法 | |
| Cobon et al. | The proteomics of ageing | |
| Bryan et al. | Sparse recovery of imaging transcriptomics data | |
| CN114414542A (zh) | 用于基因检测的荧光信号检测方法、装置、介质及设备 | |
| WO2018213555A1 (en) | Methods and systems for assessing the presence of allelic dropout using machine learning algorithms | |
| CN119861055B (zh) | 一种dna荧光光谱串扰修正的方法及系统 | |
| GB2639501A (en) | Electrophoresis data processing device and electrophoresis data processsing method | |
| EP4466529A1 (en) | System for adaptive spectral calibration | |
| US20220333179A1 (en) | Biochip detection method, device, and apparatus | |
| Guo et al. | 9-Color STR Typing Method Based on Multi-Stage Calibration |
Legal Events
| Date | Code | Title | Description |
|---|---|---|---|
| 121 | Ep: the epo has been informed by wipo that ep was designated in this application |
Ref document number: 23941647 Country of ref document: EP Kind code of ref document: A1 |
|
| ENP | Entry into the national phase |
Ref document number: 2025527191 Country of ref document: JP Kind code of ref document: A |
|
| WWE | Wipo information: entry into national phase |
Ref document number: 2025527191 Country of ref document: JP |
|
| WWE | Wipo information: entry into national phase |
Ref document number: 202380093737.X Country of ref document: CN |
|
| ENP | Entry into the national phase |
Ref document number: 202513506 Country of ref document: GB Kind code of ref document: A Free format text: PCT FILING DATE = 20230616 |
|
| WWE | Wipo information: entry into national phase |
Ref document number: 2513506.2 Country of ref document: GB |
|
| WWE | Wipo information: entry into national phase |
Ref document number: 112023005475 Country of ref document: DE |
|
| WWE | Wipo information: entry into national phase |
Ref document number: 2513506.2 Country of ref document: GB |
|
| WWP | Wipo information: published in national office |
Ref document number: 202380093737.X Country of ref document: CN |
|
| WWP | Wipo information: published in national office |
Ref document number: 112023005475 Country of ref document: DE |
|
| WWP | Wipo information: published in national office |
Ref document number: 2513506.2 Country of ref document: GB |
|
| WWE | Wipo information: entry into national phase |
Ref document number: 11202505290R Country of ref document: SG |
|
| WWP | Wipo information: published in national office |
Ref document number: 11202505290R Country of ref document: SG |
|
| 122 | Ep: pct application non-entry in european phase |
Ref document number: 23941647 Country of ref document: EP Kind code of ref document: A1 |