WO2024252945A1 - 蛍光プローブおよび蛍光プローブを用いた観察方法 - Google Patents
蛍光プローブおよび蛍光プローブを用いた観察方法 Download PDFInfo
- Publication number
- WO2024252945A1 WO2024252945A1 PCT/JP2024/019022 JP2024019022W WO2024252945A1 WO 2024252945 A1 WO2024252945 A1 WO 2024252945A1 JP 2024019022 W JP2024019022 W JP 2024019022W WO 2024252945 A1 WO2024252945 A1 WO 2024252945A1
- Authority
- WO
- WIPO (PCT)
- Prior art keywords
- intensity
- fluorescence
- fluorescent probe
- fluorescent
- image
- Prior art date
- Legal status (The legal status is an assumption and is not a legal conclusion. Google has not performed a legal analysis and makes no representation as to the accuracy of the status listed.)
- Ceased
Links
Images






Classifications
-
- G—PHYSICS
- G01—MEASURING; TESTING
- G01N—INVESTIGATING OR ANALYSING MATERIALS BY DETERMINING THEIR CHEMICAL OR PHYSICAL PROPERTIES
- G01N21/00—Investigating or analysing materials by the use of optical means, i.e. using sub-millimetre waves, infrared, visible or ultraviolet light
- G01N21/62—Systems in which the material investigated is excited whereby it emits light or causes a change in wavelength of the incident light
- G01N21/63—Systems in which the material investigated is excited whereby it emits light or causes a change in wavelength of the incident light optically excited
- G01N21/64—Fluorescence; Phosphorescence
Definitions
- the present invention relates to a fluorescent probe using diamond having a luminescent center and an observation method using the fluorescent probe.
- a complex defect called a nitrogen vacancy center In the crystal structure of diamond, a complex defect called a nitrogen vacancy center can be seen.
- This nitrogen vacancy center is a pair of a nitrogen atom that replaces a carbon atom in the crystal lattice, and a vacancy (where a carbon atom is missing) that exists in the position adjacent to the nitrogen atom, and is also called an NV center (Nitrogen Vacancy center).
- NV center Nitrogen Vacancy center
- complex defects called silicon vacancy centers and germanium vacancy centers can be seen in the crystal structure of diamond. These complex defects, including NV centers, are called color centers or luminescence centers.
- Diamonds have unique optical and magnetic properties that stem from these luminescent centers. As a substance made of carbon atoms, diamonds are considered to have extremely low toxicity to living organisms and are highly biocompatible. As their surface can easily be chemically modified, diamonds are not only used as materials for quantum information devices and electronic circuit devices, but are also finding expanding applications in diagnosis, treatment, and imaging in the biomedical field. For example, diamonds that have such luminescent centers can be introduced into living cells, and the interior of the cells can be observed using a fluorescent microscope or confocal laser microscope.
- Patent Document 1 discloses that a diamond having an NV center is introduced into a cell as a fluorescent probe, and two-dimensional visual observation of the fluorescence intensity emitted from the fluorescent probe inside the cell is performed.
- Autofluorescence is known to be one of the problems with the signal-to-noise ratio (S/N ratio) when observing fluorescence, and in Patent Document 1, autofluorescence is eliminated by utilizing the fact that the fluorescence intensity emitted from a diamond having an NV center decreases during electron spin magnetic resonance (ESR). Magnetic resonance is induced by irradiating the diamond having an NV center with microwaves at a specific frequency using a high-frequency oscillator.
- ESR electron spin magnetic resonance
- Non-Patent Document 1 discloses in vitro biosensing for highly sensitive detection of viruses using fluorescent nanodiamonds functionalized with biomolecules. Autofluorescence is eliminated by observing modulation by microwaves.
- the objective of the present invention is to provide an improved fluorescent probe that makes it possible to eliminate or reduce autofluorescence in diamonds that have luminescent centers without irradiating them with microwaves.
- the fluorescent probe in which the relationship between the intensity of the irradiated light and the intensity of the emitted fluorescence is nonlinear, is irradiated with light at first and second intensities I1 and I2 to create first and second fluorescent images F1 and F2 , and the difference in fluorescent intensity between the first and second fluorescent images F1 and F2 is calculated.
- This makes it possible to observe a fluorescent image in which the autofluorescence has been removed or reduced, without irradiating the fluorescent probe with microwaves for generating magnetic resonance.
- the autofluorescence has been removed or reduced, and the intensity of the fluorescence emitted from the fluorescent probe is relatively emphasized.
- the present invention for solving the above problems includes, for example, the following aspects.
- (Item 1) A fluorescent probe in which the surface of a diamond particle containing a luminescent center is coated with a substance that absorbs light and releases heat.
- (Item 2) Item 2.
- (Item 3) Item 3.
- (Item 4) Item 4.
- Item 5 Item 4.
- Item 6) Item 6.
- An observation method using a fluorescent probe comprising: (Item 8)
- the enhanced image creating step includes: Item 8.
- the second fluorescence image generating step generates the second fluorescence image from fluorescence emitted from the fluorescent probe and passing through a wavelength filter; Item 9.
- the wavelength filter is a long-pass filter that transmits light with a wavelength longer than the wavelength of the zero phonon line of the luminescence center contained in the fluorescent probe.
- the first fluorescence image generating step generates the first fluorescence image from fluorescence emitted from the fluorescent probe and passing through a wavelength filter; Item 9.
- the wavelength filter is a short-pass filter that transmits light with a wavelength shorter than the wavelength of the zero phonon line of the luminescence center contained in the fluorescent probe.
- the present invention provides an improved fluorescent probe that makes it possible to eliminate or reduce autofluorescence in diamonds having luminescent centers without irradiating them with microwaves.
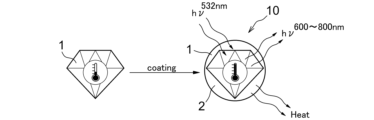
- FIG. 1 is a schematic diagram for explaining an overview of a fluorescent probe according to an embodiment.
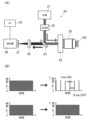
- FIG. 1 is a diagram for explaining an apparatus used for fluorescence observation.
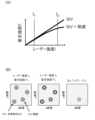
- FIG. 1 is a diagram for explaining a method of fluorescence observation.
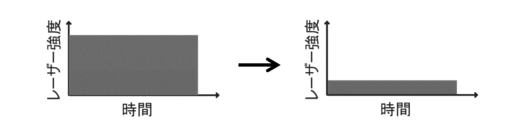
- FIG. 1 is a diagram for explaining the function of an analog acousto-optical modulator (AOM).
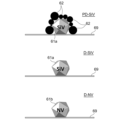
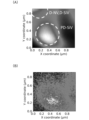
- FIG. 2 is a schematic diagram showing three types of fluorescent probes prepared on a glass substrate as examples and comparative examples in Examples 1 to 3. 1 shows fluorescent images observed in Example 1, which are fluorescent images obtained by fluorescent observation using fluorescent probes according to the examples and comparative examples.
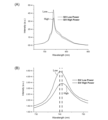
- Example 1 is a spectrum measured in Example 1, which is a spectrum of fluorescence emitted from PD-SiV, the fluorescent probe according to the example, the surface of which is coated with polydopamine.
- 1 is a spectrum measured in Example 1, which is a spectrum of fluorescence emitted from PD-SiV, the fluorescent probe according to the example, the surface of which is coated with polydopamine.
- 1 shows a spectrum measured in Example 1, and is a spectrum of fluorescence emitted from D-SiV, which has an uncoated surface and is a fluorescent probe according to a comparative example.
- Example 1 shows a spectrum measured in Example 1, and is a spectrum of fluorescence emitted from D-NV, which is a fluorescent probe according to a comparative example and has an uncoated surface.
- 1 shows a spectrum measured in Example 1, and is a spectrum of fluorescence emitted from D-NV, which is a fluorescent probe according to a comparative example and has an uncoated surface.
- 13 shows fluorescent images observed in Example 2, which are fluorescent images obtained by fluorescent observation using fluorescent probes according to the example and comparative example.
- 1 is a spectrum measured in Example 2, which is a spectrum of fluorescence emitted from PD-SiV, the fluorescent probe according to the example, the surface of which is coated with polydopamine.
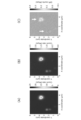
- 13 is a fluorescent image obtained by fluorescent observation using the fluorescent probe according to Example 3. This is the fluorescence spectrum labeled "PD-SiV" in FIG. These are the fluorescence spectra labeled "Bkg1" or "Bkg2" in FIG. 13 shows fluorescence images obtained by fluorescence observation using the fluorescent probe of Example 3, where the fluorescent probe is irradiated with light of different intensities. Of the fluorescence images shown in FIG. 18, this is a fluorescence image including the portions indicated by the labels "Bkg1" and "Bkg2" in FIG.
- [Fluorescent probe] 1 is a schematic diagram for explaining an overview of a fluorescent probe according to one embodiment.
- the surface of a diamond particle 1 having a luminescence center is coated with a substance 2 that absorbs light and releases heat.
- the diamond 1 used in the fluorescent probe 10 is a diamond having a luminescent center.
- the luminescent center emits fluorescence when irradiated with light of an excitation wavelength.
- the types of luminescent center include, for example, NV centers (nitrogen-vacancy centers), SiV centers (silicon-vacancy centers), and GeV centers (germanium-vacancy centers).
- the luminescent center is a SiV center.
- the size of diamond 1 is, for example, nano-sized or micro-sized. Nano-sized nanodiamonds with an average particle size of, for example, less than about 200 nm to about 5 nm are preferred, but the size of diamond 1 is not limited as long as it can be used as a fluorescent probe. In this embodiment, diamond 1 is a microdiamond with an average particle size of about 1 ⁇ m.
- the substance 2 coated on the surface of the diamond 1 is a substance that absorbs light and releases heat.
- the substance 2 that absorbs light and releases heat can be a substance such as dye molecules, graphene, graphite, carbon nanotubes, polymer compounds, metal nanoparticles, organic nanoparticles, and inorganic nanoparticles that can be coated on the surface of the diamond 1.
- the surface of the diamond 1 is coated with polydopamine (PDA), a polymer compound.
- PDA polydopamine
- Polydopamine is a polymerized form of dopamine, an amino acid derivative that is the raw material for producing melanin.
- the surface of the diamond particle 1 is coated with a substance 2 that absorbs light and releases heat, so when light is irradiated onto the fluorescent probe 10, the temperature inside the diamond 1 rises and the spectrum of the fluorescence emitted from the luminescence center changes. This increases the change in the emission wavelength and emission intensity of the luminescence center, creating a nonlinearity between the intensity of the irradiated light and the intensity of the emitted fluorescence. This nonlinearity increases as the intensity of the light irradiated onto the fluorescent probe 10 increases.
- the wavelength of the light irradiated to the fluorescent probe 10 is approximately 500 nm to 700 nm, and the wavelength of the fluorescence emitted from the SiV center at this time is approximately 700 nm to approximately 800 nm. In this embodiment, the wavelength of the light irradiated to the fluorescent probe 10 is approximately 532 nm.
- free radicals can be added to the coating of the fluorescent probe 10. This promotes the temperature increase of the substance 2 due to the irradiation of light, increases the change in the luminescence intensity of the luminescence center, and further increases the nonlinearity that occurs between the intensity of the irradiated light and the intensity of the emitted fluorescence.
- the organic compound TEMPO is added to the coating as a substance that functions as a free radical.
- TEMPO is an abbreviation for 2,2,6,6-tetramethylpiperidine 1-oxyl.
- the fluorescent probe 10 When the fluorescent probe 10 is irradiated with light including the excitation wavelength of the emission center in accordance with the observation method described below, and a fluorescent image of the fluorescence emitted from the fluorescent probe 10 is created, it is possible to create a fluorescent image in which the intensity of the fluorescence emitted from the fluorescent probe 10 is relatively enhanced and the autofluorescence has been removed or reduced, as shown in the fluorescent images in Fig. 6(B) and Fig. 12(B).
- the fluorescent images in Fig. 6(A) and Fig. 12(A) correspond to the second fluorescent image F2 in the observation method described below.
- FIGS. 2A and 2B are diagrams for explaining an apparatus used in fluorescence observation, in which (A) is a diagram showing a schematic configuration of the apparatus, and (B) is a diagram for explaining the function of an acousto-optical modulator (AOM).
- AOM acousto-optical modulator
- an observation device 20 includes a light source 21, which is a laser generating device, an acousto-optical modulator (AOM) 22 that outputs pulsed light, a dichroic mirror 23, a piezo stage 24, an objective lens 25, a condenser lens 26, a pinhole 27, a detector 28, and a data processor 29.
- the observation device 20 creates first and second fluorescent images F1 and F2 by irradiating a sample 100 with light at first and second intensities I1 and I2 , and creates a fluorescent image of the sample 100 in which autofluorescence has been removed or reduced by taking the difference in fluorescent intensity between the first and second fluorescent images F1 and F2 .
- the observation device 20 can be configured using, for example, a confocal laser microscope.
- the continuous wave laser light emitted from the light source 21 passes through the AOM 22 and is pulsed, then reflected by the dichroic mirror 23, and focused on the sample 100 by the objective lens 25.
- the sample 100 includes a fluorescent probe 10 according to one embodiment, and the light emitted from the sample 100, i.e., the fluorescent probe 10, passes through the objective lens 25 and the dichroic mirror 23, is focused by the focusing lens 26, passes through a pinhole 27, and the intensity is detected by the detection unit 28 composed of a photodiode.
- the light intensity data detected by the detection unit 28 is processed by the data processing unit 29 connected to the detection unit 28.
- the position of the objective lens 25 relative to the sample 100 is changed by the piezo stage 24, and the focusing position of the light relative to the sample 100 is scanned. This creates a two-dimensional fluorescent image of the sample 100.
- the detection unit 28 is composed of a spectrometer
- the data processing unit 29 creates a spectrum of the fluorescence emitted from the fluorescent probe 10.
- the wavelength of the light irradiated from the light source 21 includes a wavelength capable of exciting the luminescence center of diamond 1, which is the fluorescent probe 10 contained in the sample 100.
- the luminescence center of diamond 1 is a SiV center
- the light source 21 irradiates continuous wave laser light with a wavelength of about 532 nm (green).
- the AOM 22 is a digital AOM, and the timing at which the AOM 22 outputs a pulse is controlled by controlling the voltage signal applied to the AOM 22.
- the dichroic mirror 23 is a long pass mirror of about 552 nm in this embodiment.
- the data processing unit 29 includes a processor for processing data and a memory for recording data.
- the data processing unit 29 can be configured using various information terminal devices such as a known general-purpose computer, a notebook PC, or a tablet terminal.
- the graph on the left side shows the change over time in the laser light intensity before passing through the AOM 22
- the graph on the right side shows the change over time in the laser light intensity after passing through the AOM 22.
- the upper graph shows the case in which the laser light is irradiated with a first intensity I1
- the lower graph shows the case in which the laser light is irradiated with a second intensity I2 .
- the AOM 22 which outputs a pulsed continuous wave laser beam, controls the density of the output pulses to vary the intensity of the irradiated light per unit time, as shown in the graph on the right.
- the AOM 22 irradiates the sample 100 with light at a plurality of different intensities I1 and I2 .
- the continuous wave laser beam is pulsed by the AOM 22 and irradiated with a first intensity I1 , and is irradiated as a continuous wave with a second intensity I2 .
- [Observation method] 3A is a diagram for explaining a method of fluorescence observation.
- (A) is a graph showing the relationship between the intensity of light irradiated onto a fluorescent probe and the intensity of fluorescence emitted from the fluorescent probe.
- (B) is a schematic diagram for explaining that autofluorescence is removed by taking the difference in fluorescence intensity between multiple fluorescent images F1 and F2 having different intensities.
- An observation method using a fluorescent probe includes the steps of: a first fluorescent image creating step of irradiating the fluorescent probe with light at a first intensity to create a first fluorescent image; a second fluorescence image creating step of irradiating the fluorescent probe with light at a second intensity higher than the first intensity to create a second fluorescence image; an enhanced image creating step of calculating a difference in fluorescence intensity between the first fluorescent image and the second fluorescent image and creating an enhanced image in which the intensity of the fluorescence emitted from the fluorescent probe when the fluorescent probe is irradiated with light at the second intensity is relatively enhanced; Includes.
- the enhanced image creation step corrects the fluorescence intensity of one of the first and second fluorescent images based on the ratio between the first intensity and the second intensity, and creates the enhanced image by taking the difference in fluorescence intensity between the corrected one fluorescent image and the other fluorescent image.
- the fluorescent probe 10 has a nonlinear relationship between the intensity of the irradiated light and the intensity of the emitted fluorescence.
- the light and autofluorescence from a diamond particle 1, which has a bare luminescence center and is not coated on the surface with a substance 2 that absorbs light and releases heat does not have as large a nonlinearity between the intensity of the irradiated light and the intensity of the emitted fluorescence as the fluorescent probe 10 does, and compared to the fluorescent probe 10, has an approximately linear relationship between the intensity of the irradiated light and the intensity of the emitted fluorescence.
- the fluorescent probe 10 having such nonlinearity is irradiated with light at first and second intensities I1 and I2 to create first and second fluorescent images F1 and F2 , and the difference in fluorescent intensity is calculated between the created first and second fluorescent images F1 and F2 .
- an example of an observation method using the fluorescent probe 10 is shown.
- light emitted from the light source 21 is focused at a certain position on the surface of the sample 100.
- light is irradiated at the focused position on the surface of the sample 100 with a first intensity I1 , light emitted from the sample 100 is detected, and a first fluorescent intensity is detected.
- light is irradiated at the same focused position with a second intensity I2 higher than the first intensity I1 , light emitted from the sample 100 is detected, and a second fluorescent intensity is detected.
- first and second fluorescence images F 1 (x, y) and F 2 (x, y) are created, respectively, corresponding to the raster scanned planar area on the sample 100, as shown in FIG. 3(B).
- the first and second fluorescent images F1 , F2 contain light emitted from various emission sources, not limited to the fluorescence emitted from the fluorescent probe 10 coated with the substance 2 that absorbs light and releases heat.
- the first and second fluorescent images F1 , F2 contain, for example, fluorescence from a diamond particle 1 having a bare luminescence center whose surface is not coated with the substance 2 that absorbs light and releases heat, and autofluorescence, which is unintentional fluorescence from cells.
- nonlinearity occurs between the intensity of the irradiated light and the intensity of the emitted fluorescence.
- the intensity of the irradiated light changes between the first fluorescent image F1 and the second fluorescent image F2 , and the second intensity I2 is higher than the first intensity I1 . Therefore, in the second fluorescent image F2 , the light emitted from the fluorescent probe 10 is captured at a lower intensity than in the first fluorescent image F1 .
- the light and autofluorescence from the diamond particle 1 having a bare luminescence center whose surface is not coated with the substance 2 that absorbs light and releases heat are captured at a higher intensity in the second fluorescent image F2 than in the first fluorescent image F1 , as the intensity of the irradiated light increases from the first intensity I1 to the second intensity I2 . Therefore, when the difference in fluorescence intensity is taken between the first and second fluorescence images F1 (x,y) and F2 (x,y), the light from the bare diamond particle 1 having the luminescent center and the autofluorescence are removed, and only the light emitted from the fluorescent probe 10 remains in the image.
- the intensity of the irradiated light is corrected between the first and second fluorescent images F 1 and F 2 , and then the difference in the fluorescent intensity between these first and second fluorescent images F 1 (x, y) and F 2 (x, y) is calculated.
- the intensity correction of the irradiated light is performed by correcting the fluorescent intensity of one of the first fluorescent image F 1 and the second fluorescent image F 2 based on the ratio between the first intensity I 1 and the second intensity I 2 , and calculating the difference in the fluorescent intensity between the corrected one fluorescent image and the other fluorescent image .
- the intensity correction of the irradiated light can be expressed as
- the fluorescent probe according to one embodiment is a fluorescent probe that makes it possible to eliminate or reduce autofluorescence without irradiating a diamond having a luminescent center with microwaves.
- the fluorescent probe 10 is a diamond particle 1 having a luminescence center, the surface of which is coated with a substance 2 that absorbs light and releases heat. This allows nonlinearity to be generated between the intensity of light irradiated onto the fluorescent probe 10 and the intensity of the fluorescence emitted from the fluorescent probe.
- a fluorescent probe in which the relationship between the intensity of the irradiated light and the intensity of the emitted fluorescence is nonlinear, with first and second intensities I 1 and I 2 , first and second fluorescent images F 1 and F 2 are created, and the difference in fluorescent intensity between the first and second fluorescent images F 1 and F 2 created is taken.
- the fluorescent probe according to one embodiment makes it possible to eliminate or reduce autofluorescence without irradiating a diamond having a luminescence center with microwaves.
- the fluorescent probe according to one embodiment has advantageous effects in the application examples exemplified below, for example, compared to fluorescent probes of a type that involve microwave irradiation to eliminate autofluorescence.
- the fluorescent probe in fluorescence observation using the fluorescent probe according to one embodiment, if a laser light source that irradiates light with a wavelength in the near-infrared region called the biological NIR window (approximately 620-950 nm) wavelength is used as an excitation light source, fluorescence observation is possible in deep tissues, deep inside the human body, and at the whole-body level where microwaves cannot reach. This is an advantageous effect compared to a type of fluorescent probe that irradiates microwaves to remove autofluorescence.
- the SiV center when the SiV center is used as the emission center of diamond, it is advantageous because the SiV center is excited and emits fluorescence even with irradiation light with a long wavelength of approximately 600 nm or more.
- the fluorescent probe according to one embodiment can increase the light absorption efficiency, so it is expected to be used as a new contrast agent or imaging agent for photoacoustic imaging.
- the fluorescent probe according to one embodiment can also be used in photothermal therapy (hyperthermia).
- a fluorescent probe can be administered to a patient, and the probe can be confirmed by fluorescence when it reaches a deep lesion site due to the EPR effect (enhancing vascular permeability and retention effect), while at the same time, the high light absorption efficiency of the probe can be utilized to increase the amount of light irradiation, allowing selective heating and thermotherapy of the lesion site.
- the second intensity I2 is higher than the first intensity I1 , and the fluorescent probe 10 is irradiated with light in the order of the first intensity I1 and the second intensity I2 ( I2 > I1 ), but the order of irradiating the fluorescent probe 10 with light is not limited to this.
- the second intensity I2 may be higher than the first intensity I1
- the fluorescent probe 10 may be irradiated with light in the order of the second intensity I2 ( I2 > I1 ) and the first intensity I1. That is, in the observation method using a fluorescent probe according to one embodiment, the order of performing the first fluorescent image creation step and the second fluorescent image creation step may be interchanged.
- the observation method using a fluorescent probe described in the claims also includes in the claims an aspect in which the order of performing the first fluorescent image creation step and the second fluorescent image creation step is interchanged.
- FIG. 4 is a diagram for explaining the function of an analog acousto-optical modulator (AOM).
- AOM analog acousto-optical modulator
- the sample 100 is irradiated with light at a plurality of different intensities I 1 and I 2 by controlling the density of the pulse output by using the AOM 22 to increase and decrease the intensity of the irradiated light per unit time, but the method of making the intensity of the irradiated light a plurality of different intensities I 1 and I 2 is not limited to this.
- the intensity of the continuous wave laser light may be increased and decreased using an analog AOM.
- the analog AOM 22 can increase and decrease the intensity of the output light depending on the voltage applied.
- the light emitted from the sample 100 is detected as it is to create a fluorescence image, but the light emitted from the sample 100 and passing through a wavelength filter may be detected to create a fluorescence image.
- the wavelength filter may be disposed, for example, on the optical line between the dichroic mirror 23 and the detection unit 28.
- the peak wavelength of the emitted fluorescence from the luminescence center including the SiV center shifts to the long wavelength side with an increase in temperature.
- the second fluorescence image F 2 is created by irradiating light with a second intensity I 2 higher than the first intensity I 1 , if the second fluorescence image F 2 is created with light passing through a long pass filter having an edge near the wavelength peak of the zero phonon line, which is disposed at the above-mentioned position on the optical line, the long pass filter transmits wavelengths longer than the wavelength of the zero phonon line of the luminescence center, and the signal-to-noise ratio can be further improved.
- the signal-to-noise ratio can be further improved by creating the first fluorescence image F1 using light that passes through a short-pass filter having an edge near the wavelength peak of the zero-phonon line.
- Example 1 a fluorescent probe according to the present invention was actually produced, and fluorescence observation was performed using the produced fluorescent probe.
- FIG. 5 is a schematic diagram showing three types of fluorescent probes prepared on a glass substrate as examples and comparative examples in Examples 1 to 3.
- a fluorescent probe according to the examples of the present invention a fluorescent probe (hereinafter also referred to as PD-SiV) in which the surface of a microdiamond 61a having a SiV center is coated with polydopamine (PDA) 62 was prepared on a glass substrate 69.
- PDA polydopamine
- two types of fluorescent probes were prepared on the same glass substrate 69.
- a microdiamond 61a having a SiV center hereinafter also referred to as D-SiV
- the surface of the microdiamond 61a having a SiV center is not coated with polydopamine (PDA).
- a microdiamond 61b having an NV center (hereinafter also referred to as D-NV) was prepared.
- the surface of the microdiamond 61b having an NV center is not coated with polydopamine (PDA).
- PDA polydopamine
- the fluorescent probe according to the embodiment was prepared on a glass substrate by the following procedure. First, the solvent of the microdiamond was replaced with a Tris-HCl buffer (pH about 8.5) using an ultracentrifuge. Next, 4 mg of TEMPO was added to the buffer, and the TEMPO was dissolved by ice bath ultrasonic treatment. The ice bath ultrasonic treatment was performed for a total of 10 minutes in an on-off cycle of 10 seconds on and 10 seconds off. Next, 0.5 mg of dopamine hydrochloride ((HO) 2 C 6 H 3 CH 2 CH 2 NH 2.HCl ) powder was added to the buffer.
- dopamine hydrochloride ((HO) 2 C 6 H 3 CH 2 CH 2 NH 2.HCl ) powder was added to the buffer.
- the polymerization reaction started at the stage where the dopamine hydrochloride powder was added, and polydopamine (PDA) coating on the microdiamond surface started. During this time, the reaction mixture was continuously subjected to ice bath ultrasonic treatment in the above-mentioned repeated cycle. Two hours after the start of coating, the mixture was washed to remove the reactant (dopamine hydrochloride), and the coating reaction was temporarily stopped. The coated microdiamonds were collected by adding ultrapure water and then repeating the separation process using an ultracentrifuge (approximately 9000 rpm, 10 minutes) three times.
- This coating reaction on the diamond surface was repeated 1 to 5 times to create an optimal polydopamine film thickness that allows observation even with weak laser light intensity.
- the coating reaction time per reaction was set to a relatively short period of 2 hours.
- the microdiamonds used were SiV microdiamonds manufactured by Adamas Nanotechnologies, Inc. in the United States.
- Fluorescence observation was performed using the prepared fluorescent probe. Fluorescence observation was performed by irradiating the fluorescent probe prepared on a glass substrate with light at first and second intensities to create first and second fluorescent images with different intensities, correcting the intensity of the irradiated light, and then taking the difference in fluorescent intensity between the first and second fluorescent images created.
- the intensity of the irradiated light was set to first intensity ⁇ second intensity.
- the wavelength of the light irradiated to the fluorescent probe was approximately 532 nm.
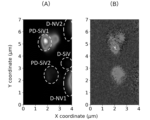
- Figure 6 shows the fluorescence images observed in Example 1, which were obtained by fluorescence observation using a fluorescent probe.
- A is a second fluorescence image obtained when the prepared fluorescent probe was irradiated with light at a second intensity higher than the first intensity.
- B is a fluorescence image obtained by taking the difference in fluorescence intensity between the first and second fluorescence images after correcting for the intensity of the irradiated light.
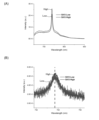
- Figures 7 and 8 are spectra measured in Example 1, and are the spectra of fluorescence emitted from PD-SiV, a fluorescent probe according to the Example, whose surface is coated with polydopamine.
- (B) is an enlarged view of the fluorescence spectrum shown in (A) near the peak wavelength.
- the detected fluorescence intensity decreases as the intensity of the irradiated light increases (from low to high). This confirmed that the relationship between the intensity of the irradiated light and the intensity of the emitted fluorescence is nonlinear for the fluorescent probe according to the Example. It was also confirmed that the wavelength at which the intensity peaks shifts to the longer wavelength side as the intensity of the irradiated light increases.
- Figure 9 shows the spectrum measured in Example 1, which is the spectrum of fluorescence emitted from D-SiV, a fluorescent probe according to the first comparative example, whose surface is not coated.
- (B) is an enlarged view of the peak wavelength of the fluorescence spectrum shown in (A). As shown in the fluorescence spectrum in Figure 9 (B), it was confirmed that the detected fluorescence intensity did not decrease even when the intensity of the irradiated light increased (from low to high). The detected fluorescence intensity increased slightly as the intensity of the irradiated light increased. Additionally, no shift in the wavelength at which the intensity peaked was confirmed even when the intensity of the irradiated light increased.
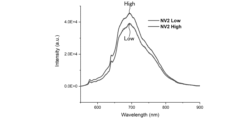
- FIGS. 10 and 11 show the spectra measured in Example 1, and are the spectra of fluorescence emitted from D-NV, a fluorescent probe according to the second comparative example, whose surface is not coated.
- the fluorescence spectra in FIG. 10 and FIG. 11 it was confirmed that the detected fluorescence intensity did not decrease even when the intensity of the irradiated light increased (from low to high).
- the detected fluorescence intensity increased slightly as the intensity of the irradiated light increased. Additionally, no shift in the wavelength at which the intensity peaked was confirmed even when the intensity of the irradiated light increased.
- Example 2 as in Example 1, fluorescent observation was performed using the prepared fluorescent probe.
- the fluorescent probe of the example was newly prepared on a different glass substrate from that of Example 1 by the same preparation method as in Example 1.
- the microdiamonds used for preparation were also SiV microdiamonds manufactured by Adamas Nanotechnologies, Inc. in the United States, the same as in Example 1. Fluorescent observation was also performed using the prepared fluorescent probe in the same manner as in Example 1.
- FIG. 12 shows the fluorescence images observed in Example 2, which were obtained by fluorescence observation using a fluorescent probe.
- A is a second fluorescence image obtained when the prepared fluorescent probe was irradiated with light at a second intensity higher than the first intensity.
- B is a fluorescence image obtained by taking the difference in fluorescence intensity between the first and second fluorescence images after correcting for the intensity of the irradiated light.
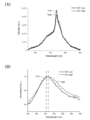
- FIG. 13 shows the spectrum measured in Example 2, which is the spectrum of fluorescence emitted from PD-SiV, a fluorescent probe according to the Example, whose surface is coated with polydopamine.
- (B) is an enlarged view of the fluorescence spectrum shown in (A) near the peak wavelength.
- the detected fluorescence intensity decreases as the intensity of the irradiated light increases (from low to high).
- the relationship between the intensity of the irradiated light and the intensity of the emitted fluorescence is nonlinear. It was also confirmed that as the intensity of the irradiated light increases, the wavelength at which the intensity peaks also shifts to the longer wavelength side.
- FIG. 14 shows the spectra measured in Example 2, and is the spectrum of the fluorescence emitted from D-SiV, the surface of which is uncoated, which is a fluorescent probe according to a comparative example, or the spectrum of the fluorescence emitted from D-NV, the surface of which is uncoated.
- (B) is an enlarged view of the vicinity of the peak wavelength of the fluorescence spectrum shown in (A). As shown in the fluorescence spectrum in (B), it was confirmed that the detected fluorescence intensity did not decrease even when the intensity of the irradiated light increased (from low to high). The detected fluorescence intensity increased slightly as the intensity of the irradiated light increased. Additionally, no shift in the wavelength at which the intensity peaked was confirmed even when the intensity of the irradiated light increased.
- Example 3 as in Example 1, a fluorescent probe according to the present invention was actually produced, and fluorescence observation was performed using the produced fluorescent probe.
- nanodiamonds which are even smaller in size than the microdiamonds used in Examples 1 and 2, were used.
- the nanodiamond used was a SiV nanodiamond obtained by a detonation method.
- the SiV nanodiamond was prepared by the following procedure. Silicon-doped nanodiamonds were produced using about 1 kg of an explosive composition containing 100 parts by mass of an explosive containing trinitrotoluene (TNT) and cyclotrimethylenetrinitramine (RDX) and 1 part by mass of triphenylsilanol as a heteroatom compound, according to a conventional method for producing nanodiamonds.
- TNT trinitrotoluene
- RDX cyclotrimethylenetrinitramine
- triphenylsilanol triphenylsilanol as a heteroatom compound
- the obtained Si-doped nanodiamond particles were subjected to high-speed mapping and 738 nm bright spot imaging using a micro-Raman spectrometer (trade name: Microscopic Laser Raman Spectrophotometer LabRAM HR Evolution, manufactured by Horiba, Ltd.), and the fluorescence intensity and number of bright spots (center, middle layer, outer periphery) were measured. Furthermore, the average size of the primary particles was measured based on the Scherrer formula by powder X-ray diffraction (XRD) using a fully automatic multipurpose X-ray diffractometer (manufactured by Rigaku Co., Ltd.).
- XRD powder X-ray diffraction
- the amount of Si introduced was measured by XRF using a fluorescent X-ray analyzer ZSX Primus IV manufactured by Rigaku Co., Ltd.
- the peak area ratio of sp 2 carbon to sp 3 carbon was measured by micro-Raman spectroscopy using a micro-Raman spectrometer (trade name: Microscopic Laser Raman Spectrophotometer LabRAM HR Evolution, manufactured by Horiba, Ltd.).
- a 325 nm laser was used for the measurement, and the peak areas of sp 2 carbon were measured by referring to the areas of the peaks appearing near 1250 cm -1 and 1328 cm -1 , and the peak areas of sp 3 carbon were measured by referring to the areas of the peaks appearing near 1500 cm -1 and 1590 cm -1 .
- the average particle size of the nanodiamonds produced was about 10.8 nm.
- the fluorescent probe using nanodiamonds having a SiV center according to Example 3 was prepared on a glass substrate in the same manner as in Example 1, except that the ice bath ultrasonic treatment was continued until TEMPO was dissolved (typically for about 10 minutes). The average particle size of the nanodiamonds used in the preparation was about 10.8 nm. Fluorescence observation using the prepared fluorescent probe was also performed in the same manner as in Example 1. However, unlike Example 1, in Example 3, the laser intensity during fluorescence observation was set so that the first intensity I1 was higher than the second intensity I2 ( I1 > I2 ).
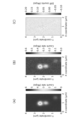
- FIG. 15 is a fluorescent image obtained by fluorescent observation using the fluorescent probe according to Example 3.
- the fluorescent image in FIG. 15 is a first fluorescent image obtained when the prepared fluorescent probe is irradiated with light at a first intensity I 1 (I 1 >I 2 ).
- I 1 I 1 >I 2
- three fluorescent lights were confirmed on the glass substrate within the field of view. Of these, one was from PD-SiV, which is the fluorescent probe according to Example 3. From the consideration of FIG. 17 described later, it is considered that the remaining two fluorescent lights are not from the prepared fluorescent probe according to Example 3, and therefore in the following explanation, these two fluorescent lights are labeled "Bkg1" and "Bkg2".
- FIG 16 is the fluorescence spectrum labeled "PD-SiV" in Figure 15.
- (B) is an enlarged view of the fluorescence spectrum shown in (A) near the peak wavelength. Note that in (B), the fluorescence intensity is normalized so that the maximum value is 1. As shown in the fluorescence spectrum of (A), it was confirmed that the detected fluorescence intensity increases when the intensity of the irradiated light decreases (from high to low). This confirmed that the relationship between the intensity of the irradiated light and the intensity of the emitted fluorescence is also nonlinear for the fluorescent probe of Example 3. Additionally, as shown in the fluorescence spectrum of (B), it was confirmed that the wavelength at which the intensity peaks also shifts to the lower wavelength side when the intensity of the irradiated light decreases.
- FIG. 17 shows the fluorescence spectrum labeled "Bkg1” or “Bkg2” in FIG. 15.
- (A) is the fluorescence spectrum labeled "Bkg1” in FIG. 15, and
- (B) is the fluorescence spectrum labeled "Bkg2” in FIG. 15.
- the detected fluorescence intensity did not increase even when the intensity of the irradiated light was reduced (from High to Low).
- the detected fluorescence intensity decreased slightly when the intensity of the irradiated light was reduced. Additionally, no shift in the wavelength at which the intensity peaked was confirmed even when the intensity of the irradiated light was reduced.
- FIG. 18 shows fluorescence images obtained by fluorescence observation using the fluorescent probe of Example 3, each of which is obtained when the fluorescent probe is irradiated with light at different intensities.
- A is a first fluorescence image obtained when the prepared fluorescent probe is irradiated with light at a first intensity.
- B is a second fluorescence image obtained when the prepared fluorescent probe is irradiated with light at a second intensity lower than the first intensity.
- C is a fluorescence image obtained by taking the difference in fluorescence intensity between the first and second fluorescence images after correcting the intensity of the irradiated light.
- FIG. 19 is a fluorescence image of the fluorescence image shown in FIG. 18 that includes the portions labeled "Bkg1" and "Bkg2" in FIG. 15.
- the fluorescent probe of Example 3 which uses nanodiamonds that are even smaller in size than the microdiamonds used in Examples 1 and 2, also has a nonlinear relationship between the intensity of the irradiated light and the intensity of the emitted fluorescence, just like Examples 1 and 2.
- the fluorescent probe is produced using SiV nanodiamonds obtained by the detonation method, but the nanodiamonds used to produce the fluorescent probe are not limited to those obtained by the detonation method.
- Methods other than the detonation method for doping a foreign element (e.g., Si) into nanodiamonds include, for example, the high pressure and high temperature (HPHT) method, the CVD method, and the implosion method.
- SiV microdiamonds or SiV nanodiamonds can be produced by introducing Si elements when synthesizing diamond, or by later injecting Si ions into diamond particles that do not contain Si elements. Microdiamonds or nanodiamonds having complex defects obtained by these methods can be used to produce fluorescent probes.
Landscapes
- Health & Medical Sciences (AREA)
- Nuclear Medicine, Radiotherapy & Molecular Imaging (AREA)
- Physics & Mathematics (AREA)
- Life Sciences & Earth Sciences (AREA)
- Chemical & Material Sciences (AREA)
- Analytical Chemistry (AREA)
- Biochemistry (AREA)
- General Health & Medical Sciences (AREA)
- General Physics & Mathematics (AREA)
- Immunology (AREA)
- Pathology (AREA)
- Investigating, Analyzing Materials By Fluorescence Or Luminescence (AREA)
- Luminescent Compositions (AREA)
Abstract
発光中心を有するダイヤモンドへマイクロ波を照射することなく自家蛍光を除去または低減することを可能とするための、改良された蛍光プローブを提供する。蛍光プローブ(10)は、発光中心を有するダイヤモンド粒子(1)の表面に、光を吸収して熱を放出する物質(2)がコーティングされている。蛍光プローブ(10)に照射される光の強度と蛍光プローブ(10)から放出する蛍光の強度との関係は非線形である。
Description
本発明は、発光中心を有するダイヤモンドを用いた蛍光プローブおよび蛍光プローブを用いた観察方法に関する。
ダイヤモンドの結晶構造において、窒素-空孔中心と呼ばれる複合欠陥が見られることがある。この窒素-空孔中心は、結晶格子の炭素原子の位置に置き換わる形で入った窒素原子と、その窒素原子の隣接位置に存在する(炭素原子が抜けている)空孔との対からなるもので、NV中心(Nitrogen Vacancy center)とも呼ばれている。ダイヤモンドの結晶構造には、NV中心以外にも、珪素-空孔中心(Silicon Vacancy center)と呼ばれる複合欠陥や、ゲルマニウム-空孔中心(Germanium Vacancy center)と呼ばれる複合欠陥が見られることがある。NV中心を含むこれら複合欠陥は、色中心または発光中心と呼ばれている。
ダイヤモンドは、このような発光中心に由来するユニークな光学特性や磁気的特性を有している。炭素原子からなる物質であることから、ダイヤモンドは生体への毒性が極めて低いと考えられており、生体適合性も高い。表面への化学修飾も容易であることから、ダイヤモンドは、量子情報素子や電子回路素子の材料としての利用にとどまらず、生物医学の分野における診断や治療、イメージングに用途が拡大している。例えばこのような発光中心を有するダイヤモンドを生体の細胞内に導入し、蛍光顕微鏡や共焦点レーザ顕微鏡等を用いて細胞の内部を観察することが行われている。
例えば特許文献1には、NV中心を有するダイヤモンドを蛍光プローブとして細胞内部に取り入れて、細胞内部の蛍光プローブから放出される蛍光強度の二次元的な視野観察を行うことが開示されている。自家蛍光は、蛍光を観察する際の信号雑音比(S/N比)の問題の一つとして知られており、特許文献1では、自家蛍光は、NV中心を有するダイヤモンドから放出される蛍光強度が電子スピン磁気共鳴(ESR)時に減少することを利用して除去されている。磁気共鳴は、NV中心を有するダイヤモンドに、高周波発振器を用いて特定の周波数でマイクロ波を照射することにより生じさせている。
また例えば非特許文献1には、生体分子で官能基化した蛍光ナノダイヤモンドを用いてウイルスを高感度に検出するための、in vitroバイオセンシングが開示されている。自家蛍光は、マイクロ波による変調を観測することにより除去されている。
Miller, B.S., Bezinge, L., Gliddon, H.D. et al. "Spin-enhanced nanodiamond biosensing for ultrasensitive diagnostics", Nature 587, 588-593 (2020). https://doi.org/10.1038/s41586-020-2917-1
自家蛍光を除去するために、これまではマイクロ波を発生し照射する装置が用いられている。発光中心を有するダイヤモンドを蛍光プローブとして利用することをさらに促進するために、自家蛍光をより簡便に除去または低減することが求められている。
本発明は、発光中心を有するダイヤモンドへマイクロ波を照射することなく自家蛍光を除去または低減することを可能とするための、改良された蛍光プローブを提供することを課題とする。
本発明者らは、上記課題を解決するために鋭意検討を進めていたところ、図1に示すように、発光中心を有するダイヤモンド粒子の表面に、光を吸収して熱を放出する物質をコーティングしたものを蛍光プローブとして用いると、図3(A)に示すように、蛍光プローブに照射する光の強度と蛍光プローブから放出される蛍光の強度との間に非線形性が生じていることを見出した。
よって、図3(B)に観察方法の要点を示すように、照射される光の強度と放出する蛍光の強度との関係が非線形であるこのような蛍光プローブに、第1および第2の強度I1,I2で光を照射することにより、第1および第2の蛍光画像F1,F2を作成し、作成したそれら第1および第2の蛍光画像F1,F2の間で蛍光強度の差分をとる。これにより、磁気共鳴を生じさせるためのマイクロ波を蛍光プローブへ照射することなく、自家蛍光を除去または低減した蛍光画像を観察することができる。図6(B)や図12(B)に示すように、蛍光強度の差分をとった蛍光画像では自家蛍光が除去または低減されており、蛍光プローブから放出される蛍光の強度が相対的に強調されている。
すなわち、上記課題を解決するための本発明は、例えば以下に示す態様を含む。
(項1)
発光中心を有するダイヤモンド粒子の表面に、光を吸収して熱を放出する物質がコーティングされている蛍光プローブ。
(項2)
照射される光の強度と放出する蛍光の強度との関係が非線形である、項1に記載の蛍光プローブ。
(項3)
前記コーティングにフリーラジカルが加えられている、項1または2に記載の蛍光プローブ。
(項4)
前記物質は、色素分子、グラフェン、グラファイト、カーボンナノチューブ、高分子化合物、金属ナノ粒子、有機ナノ粒子、および無機ナノ粒子の少なくとも一つを含む、項1から3のいずれか一項に記載の蛍光プローブ。
(項5)
前記物質はポリドーパミンである、項1から3のいずれか一項に記載の蛍光プローブ。
(項6)
前記発光中心は珪素-空孔複合欠陥である、項1から5のいずれか一項に記載の蛍光プローブ。
(項7)
項1から6のいずれか一項に記載の蛍光プローブに第1の強度で光を照射して、第1の蛍光画像を作成する第1の蛍光画像作成ステップと、
前記蛍光プローブに前記第1の強度より高い第2の強度で光を照射して、第2の蛍光画像を作成する第2の蛍光画像作成ステップと、
前記第1の蛍光画像と前記第2の蛍光画像との間で蛍光強度の差分をとり、前記蛍光プローブに前記第2の強度で光を照射したときに前記蛍光プローブから放出される蛍光の強度が相対的に強調された強調画像を作成する強調画像作成ステップと、
を含む、蛍光プローブを用いた観察方法。
(項8)
前記強調画像作成ステップは、
前記第1の強度と前記第2の強度との比率に基づいて、前記第1の蛍光画像および前記第2の蛍光画像の一方の蛍光強度を補正し、補正した一方の蛍光画像と他方の蛍光画像との間で蛍光強度の差分をとることにより、前記強調画像を作成する、項7に記載の観察方法。
(項9)
前記第2の蛍光画像作成ステップは、前記蛍光プローブから放出されて波長フィルタを通過する蛍光から前記第2の蛍光画像を作成し、
前記波長フィルタは、前記蛍光プローブに含まれる発光中心のゼロフォノン線の波長より長波長を透過するロングパスフィルタである、項7または8に記載の観察方法。
(項10)
前記第1の蛍光画像作成ステップは、前記蛍光プローブから放出されて波長フィルタを通過する蛍光から前記第1の蛍光画像を作成し、
前記波長フィルタは、前記蛍光プローブに含まれる発光中心のゼロフォノン線の波長より短波長を透過するショートパスフィルタである、項7または8に記載の観察方法。
(項1)
発光中心を有するダイヤモンド粒子の表面に、光を吸収して熱を放出する物質がコーティングされている蛍光プローブ。
(項2)
照射される光の強度と放出する蛍光の強度との関係が非線形である、項1に記載の蛍光プローブ。
(項3)
前記コーティングにフリーラジカルが加えられている、項1または2に記載の蛍光プローブ。
(項4)
前記物質は、色素分子、グラフェン、グラファイト、カーボンナノチューブ、高分子化合物、金属ナノ粒子、有機ナノ粒子、および無機ナノ粒子の少なくとも一つを含む、項1から3のいずれか一項に記載の蛍光プローブ。
(項5)
前記物質はポリドーパミンである、項1から3のいずれか一項に記載の蛍光プローブ。
(項6)
前記発光中心は珪素-空孔複合欠陥である、項1から5のいずれか一項に記載の蛍光プローブ。
(項7)
項1から6のいずれか一項に記載の蛍光プローブに第1の強度で光を照射して、第1の蛍光画像を作成する第1の蛍光画像作成ステップと、
前記蛍光プローブに前記第1の強度より高い第2の強度で光を照射して、第2の蛍光画像を作成する第2の蛍光画像作成ステップと、
前記第1の蛍光画像と前記第2の蛍光画像との間で蛍光強度の差分をとり、前記蛍光プローブに前記第2の強度で光を照射したときに前記蛍光プローブから放出される蛍光の強度が相対的に強調された強調画像を作成する強調画像作成ステップと、
を含む、蛍光プローブを用いた観察方法。
(項8)
前記強調画像作成ステップは、
前記第1の強度と前記第2の強度との比率に基づいて、前記第1の蛍光画像および前記第2の蛍光画像の一方の蛍光強度を補正し、補正した一方の蛍光画像と他方の蛍光画像との間で蛍光強度の差分をとることにより、前記強調画像を作成する、項7に記載の観察方法。
(項9)
前記第2の蛍光画像作成ステップは、前記蛍光プローブから放出されて波長フィルタを通過する蛍光から前記第2の蛍光画像を作成し、
前記波長フィルタは、前記蛍光プローブに含まれる発光中心のゼロフォノン線の波長より長波長を透過するロングパスフィルタである、項7または8に記載の観察方法。
(項10)
前記第1の蛍光画像作成ステップは、前記蛍光プローブから放出されて波長フィルタを通過する蛍光から前記第1の蛍光画像を作成し、
前記波長フィルタは、前記蛍光プローブに含まれる発光中心のゼロフォノン線の波長より短波長を透過するショートパスフィルタである、項7または8に記載の観察方法。
本発明によると、発光中心を有するダイヤモンドへマイクロ波を照射することなく自家蛍光を除去または低減することを可能とするための、改良された蛍光プローブを提供することができる。
以下、本発明の実施形態を、添付の図面を参照して詳細に説明する。なお、以下の説明および図面において、同じ符号は同じまたは類似の構成要素を示すこととし、よって、同じまたは類似の構成要素に関する重複した説明を省略する。
[蛍光プローブ]
図1は、一実施形態に係る蛍光プローブの概要を説明するための模式的な図である。一実施形態に係る蛍光プローブ10は、発光中心を有するダイヤモンド粒子1の表面に、光を吸収して熱を放出する物質2がコーティングされている。
図1は、一実施形態に係る蛍光プローブの概要を説明するための模式的な図である。一実施形態に係る蛍光プローブ10は、発光中心を有するダイヤモンド粒子1の表面に、光を吸収して熱を放出する物質2がコーティングされている。
蛍光プローブ10に用いるダイヤモンド1は、発光中心を有するダイヤモンドである。発光中心は、励起波長の光が照射されると蛍光を放出する。発光中心の種類は、例えばNV中心(窒素-空孔中心)や、SiV中心(珪素-空孔中心)、GeV中心(ゲルマニウム-空孔中心)である。本実施形態では、発光中心はSiV中心である。
ダイヤモンド1のサイズは、例えばナノサイズやマイクロサイズである。粒子の平均粒径が例えば約200nm未満から約5nm程度であるナノサイズのナノダイヤモンドが好ましいが、蛍光プローブとして用いることができる限りダイヤモンド1のサイズは制限されない。本実施形態では、ダイヤモンド1のサイズは、粒子の平均粒径が約1μmのマイクロダイヤモンドである。
ダイヤモンド1の表面にコーティングする物質2は、光を吸収して熱を放出する物質である。例示的には、光を吸収して熱を放出する物質2として、色素分子、グラフェン、グラファイト、カーボンナノチューブ、高分子化合物、金属ナノ粒子、有機ナノ粒子、および無機ナノ粒子等の物質をダイヤモンド1の表面にコーティングすることができる。本実施形態では、高分子化合物であるポリドーパミン(PDA)をダイヤモンド1の表面にコーティングする。ポリドーパミンは、メラニンを生成する原料となるアミノ酸誘導体ドーパミンを重合させたものである。
光を吸収して熱を放出する物質2がダイヤモンド粒子1の表面にコーティングされていることにより、蛍光プローブ10に光が照射されるとダイヤモンド1の内部の温度が上昇し、発光中心から放出される蛍光のスペクトルが変化する。これにより、発光中心の発光波長および発光強度の変化が増大し、照射される光の強度と放出する蛍光の強度との間に非線形性が生じる。この非線形性は、蛍光プローブ10に照射される光の強度が増大するとより増大する。
発光中心としてSiV中心を用いる場合、蛍光プローブ10に照射する光の波長は約500nm~700nmであり、このときにSiV中心から放出される蛍光の波長は約700nm~約800nmである。本実施形態では、蛍光プローブ10に照射する光の波長は約532nmである。
好ましくは、蛍光プローブ10のコーティングにフリーラジカルを加えることができる。これにより、光の照射による物質2の高温化が促進し、発光中心の発光強度の変化が増大し、照射される光の強度と放出する蛍光の強度との間に生じる非線形性がより増大する。本実施形態では、フリーラジカルとして機能する物質として、有機化合物のTEMPOをコーティングに加える。TEMPOは、2,2,6,6-テトラメチルピペリジン 1-オキシル (2,2,6,6-tetramethylpiperidine 1-oxyl)の略称である。
後述する観察方法に沿って、蛍光プローブ10に発光中心の励起波長を含む光を照射して、蛍光プローブ10から放出される蛍光の蛍光画像を作成すると、図6(B)や図12(B)の蛍光画像に示すように、蛍光プローブ10から放出される蛍光の強度が相対的に強調されて、自家蛍光が除去または低減された蛍光画像を作成することができる。図6(A)や図12(A)の蛍光画像は、後述する観察方法でいう第2の蛍光画像F2に相当する。
[観察装置]
図2は、蛍光観察に用いる装置を説明するための図である。(A)は、装置の概略的な構成を模式的に示す図である。(B)は、音響光学変調素子(AOM)の機能を説明するための図である。
図2は、蛍光観察に用いる装置を説明するための図である。(A)は、装置の概略的な構成を模式的に示す図である。(B)は、音響光学変調素子(AOM)の機能を説明するための図である。
図2(A)に示すように、一実施形態に係る観察装置20は、レーザ発生装置である光源21と、光をパルス化して出力する音響光学変調素子22(Acoustic Optical Modulator: AOM)と、ダイクロイックミラー23と、ピエゾステージ24と、対物レンズ25と、集光レンズ26と、ピンホール27と、検出部28と、データ処理部29とを備えている。観察装置20は、第1および第2の強度I1,I2で試料100に光を照射することにより、第1および第2の蛍光画像F1,F2を作成し、作成したそれら第1および第2の蛍光画像F1,F2の間で蛍光強度の差分をとることにより、自家蛍光が除去または低減された試料100の蛍光画像を作成する。観察装置20は、例えば共焦点レーザ顕微鏡を用いて構成することができる。
光源21から照射される連続波レーザ光は、AOM22を通過してパルス化された後、ダイクロイックミラー23で反射されて、対物レンズ25により試料100上に集光される。試料100には、一実施形態に係る蛍光プローブ10が含まれており、試料100からすなわち蛍光プローブ10から放出される光は、対物レンズ25およびダイクロイックミラー23を通過した後、集光レンズ26で集光されて、ピンホール27を通過した後、フォトダイオードで構成される検出部28において強度が検出される。検出部28において検出された光の強度データは、検出部28に接続されたデータ処理部29において処理される。試料100に対する対物レンズ25の位置はピエゾステージ24により変化され、試料100に対する光の集光位置がスキャンされる。これにより、試料100の二次元の蛍光画像が作成される。検出部28が分光器で構成される場合、データ処理部29は、蛍光プローブ10から放出される蛍光のスペクトルを作成する。
光源21から照射される光の波長は、試料100に含まれている蛍光プローブ10であるダイヤモンド1の発光中心を励起可能な波長を含む。本実施形態では、ダイヤモンド1の発光中心はSiV中心であり、光源21は波長が約532nm(緑色)の連続波レーザ光を照射する。AOM22はデジタル式のAOMであり、AOM22に印加する電圧信号を制御することにより、AOM22がパルスを出力するタイミングが制御される。ダイクロイックミラー23は、本実施形態では約552nmのロングパスである。データ処理部29は、データを処理するプロセッサとデータを記録するメモリとを備える。データ処理部29は、公知の汎用コンピュータや、ノートブックPC、タブレット端末等の種々の情報端末装置を用いて構成することができる。
図2(B)を参照し、AOM22が複数の異なる強度I1,I2で試料100に光を照射する態様の一例を説明する。図中、左側に示すグラフは、AOM22を通過する前のレーザ光強度の時間変化を示し、右側に示すグラフは、AOM22を通過した後のレーザ光強度の時間変化を示している。上段はレーザ光を第1の強度I1で照射するケースを示し、下段はレーザ光を第2の強度I2で照射するケースを示している。
本実施形態では、連続波レーザ光をパルス化して出力するAOM22が、出力するパルスの粗密を制御することにより、右側のグラフに示すように、単位時間あたりの照射光強度に強弱をつける。これにより、AOM22は、複数の異なる強度I1,I2で試料100に光を照射する。本実施形態では、連続波レーザ光は、AOM22によりパルス化されて第1の強度I1で照射され、連続波のまま第2の強度I2で照射される。例示的にはm、レーザ光の強度は、第1の強度I1=200μW、第2の強度I2=2000μWであり、第1の強度I1<第2の強度I2である。
[観察方法]
図3は、蛍光観察の方法を説明するための図である。(A)は、蛍光プローブに照射する光の強度と蛍光プローブから放出される蛍光の強度との関係を示すグラフである。(B)は、強度が異なる複数の蛍光画像F1,F2の間で蛍光強度の差分をとることにより自家蛍光が除去されることを説明するための模式的な図である。
図3は、蛍光観察の方法を説明するための図である。(A)は、蛍光プローブに照射する光の強度と蛍光プローブから放出される蛍光の強度との関係を示すグラフである。(B)は、強度が異なる複数の蛍光画像F1,F2の間で蛍光強度の差分をとることにより自家蛍光が除去されることを説明するための模式的な図である。
一実施形態に係る蛍光プローブを用いた観察方法は、
蛍光プローブに第1の強度で光を照射して、第1の蛍光画像を作成する第1の蛍光画像作成ステップと、
前記蛍光プローブに前記第1の強度より高い第2の強度で光を照射して、第2の蛍光画像を作成する第2の蛍光画像作成ステップと、
前記第1の蛍光画像と前記第2の蛍光画像との間で蛍光強度の差分をとり、前記蛍光プローブに前記第2の強度で光を照射したときに前記蛍光プローブから放出される蛍光の強度が相対的に強調された強調画像を作成する強調画像作成ステップと、
を含む。
蛍光プローブに第1の強度で光を照射して、第1の蛍光画像を作成する第1の蛍光画像作成ステップと、
前記蛍光プローブに前記第1の強度より高い第2の強度で光を照射して、第2の蛍光画像を作成する第2の蛍光画像作成ステップと、
前記第1の蛍光画像と前記第2の蛍光画像との間で蛍光強度の差分をとり、前記蛍光プローブに前記第2の強度で光を照射したときに前記蛍光プローブから放出される蛍光の強度が相対的に強調された強調画像を作成する強調画像作成ステップと、
を含む。
照射光の強度補正を行う場合、前記強調画像作成ステップは、前記第1の強度と前記第2の強度との比率に基づいて、前記第1の蛍光画像および前記第2の蛍光画像の一方の蛍光強度を補正し、補正した一方の蛍光画像と他方の蛍光画像との間で蛍光強度の差分をとることにより、前記強調画像を作成する。
図3(A)に示すように、一実施形態に係る蛍光プローブ10は、照射される光の強度と放出する蛍光の強度との間に非線形性を有している。これに対し、光を吸収して熱を放出する物質2が表面にコーティングされていないベア(bare)な発光中心を有するダイヤモンド粒子1からの光や自家蛍光は、照射される光の強度と放出する蛍光の強度との間に蛍光プローブ10ほどの大きな非線形性が生じておらず、蛍光プローブ10との比較では、照射される光の強度と放出する蛍光の強度との間に概ね線形性の関係を有している。
一実施形態に係る観察方法では、このような非線形性を有する蛍光プローブ10に、第1および第2の強度I1,I2で光を照射することにより、第1および第2の蛍光画像F1,F2を作成し、作成したそれら第1および第2の蛍光画像F1,F2の間で蛍光強度の差分をとる。これにより、磁気共鳴を生じさせるためのマイクロ波を蛍光プローブへ照射することなく、自家蛍光を除去または低減する。
図2(A)および図3(B)を参照し、蛍光プローブ10を用いた観察方法の一例を示す。まず、光源21から照射される光を、試料100表面の或る位置に集光させる。次に、試料100表面のその集光位置に第1の強度I1で光を照射して、試料100から放出される光を検出し、第1の蛍光強度を検出する。引き続きそのままの集光位置に、第1の強度I1より高い第2の強度I2で光を照射して、試料100から放出される光を検出し、第2の蛍光強度を検出する。その後、ピエゾステージ24を用いて対物レンズ25の位置を変えながら、試料100上の光の集光位置をスキャンして、第1の蛍光強度および第2の蛍光強度の検出を各ピクセル毎に繰り返す。試料100に対する光の集光位置を例えばラスタースキャンすると、図3(B)に示すように、試料100上のラスタースキャンした平面領域に対応する、第1および第2の蛍光画像F1(x,y),F2(x,y)がそれぞれ作成される。
第1および第2の蛍光画像F1,F2には、光を吸収して熱を放出する物質2がコーティングされている蛍光プローブ10から放出される蛍光に限らず、様々な放出源から放出される光が含まれている。第1および第2の蛍光画像F1,F2には、例えば、光を吸収して熱を放出する物質2が表面にコーティングされていない、ベアな発光中心を有するダイヤモンド粒子1からの蛍光や、細胞からの意図しない蛍光である自家蛍光が含まれている。
一実施形態に係る蛍光プローブ10では、図3(A)を参照して説明したように、照射される光の強度と放出する蛍光の強度との間に非線形性が生じている。そして、第1の蛍光画像F1と第2の蛍光画像F2とでは、照射光の強度が変化しており、第2の強度I2は第1の強度I1より高い。よって、第2の蛍光画像F2では、蛍光プローブ10から放出される光は、第1の蛍光画像F1と比較して低い強度で写っている。これに対し、光を吸収して熱を放出する物質2が表面にコーティングされていないベアな発光中心を有するダイヤモンド粒子1からの光や自家蛍光は、第1の強度I1から第2の強度I2へ照射光の強度が増大することに伴い、第2の蛍光画像F2では、第1の蛍光画像F1と比較して強い強度で写っている。したがって、第1および第2の蛍光画像F1(x,y),F2(x,y)の間で蛍光強度の差分を取ると、発光中心を有するベアなダイヤモンド粒子1からの光や自家蛍光は除去されて、蛍光プローブ10から放出される光のみが画像内に残る。
好ましくは、第1および第2の蛍光画像F1,F2の間で照射光の強度補正を行ったうえで、これら第1および第2の蛍光画像F1(x,y),F2(x,y)の間で蛍光強度の差分を取る。照射光の強度補正は、第1の強度I1と第2の強度I2との比率に基づいて、第1の蛍光画像F1および第2の蛍光画像F2の一方の蛍光強度を補正し、補正した一方の蛍光画像と他方の蛍光画像との間で蛍光強度の差分をとることにより行う。例えば、第1および第2の蛍光画像F1,F2のうち、第1の蛍光画像F1の蛍光強度を補正して、第1および第2の蛍光画像F1,F2の間で蛍光強度の差分をとる場合、照射光の強度補正は|(I2/I1)F1-F2|と表すことができる。
以上、一実施形態に係る蛍光プローブは、発光中心を有するダイヤモンドへマイクロ波を照射することなく自家蛍光を除去または低減することを可能とする蛍光プローブである。
一実施形態に係る蛍光プローブ10は、発光中心を有するダイヤモンド粒子1の表面に、光を吸収して熱を放出する物質2をコーティングしたものである。これにより、蛍光プローブ10に照射する光の強度と蛍光プローブから放出される蛍光の強度との間に非線形性を生じさせることができる。照射される光の強度と放出する蛍光の強度との関係が非線形であるこのような蛍光プローブに、第1および第2の強度I1,I2で光を照射することにより、第1および第2の蛍光画像F1,F2を作成し、作成したそれら第1および第2の蛍光画像F1,F2の間で蛍光強度の差分をとる。これにより、磁気共鳴を生じさせるためのマイクロ波を蛍光プローブへ照射することなく、自家蛍光を除去または低減した蛍光画像を観察することが可能となる。マイクロ波の照射が不要になると、観察に用いる装置を小型化することが可能となる。これにより、例えば細胞やウイルスを対象した蛍光観察を行う際に、従来から用いている蛍光顕微鏡や共焦点レーザ顕微鏡等をそのまま用いて、S/N比が向上した蛍光画像を観察することが可能となる。蛍光プローブを用いる蛍光画像の観察は、ウイルス検出や抗原抗体検査(イムノアッセイ)において行われており、一実施形態に係る蛍光プローブ10は、これらウイルス検出やイムノアッセイにおいて利用することができる。
このように、一実施形態に係る蛍光プローブによると、発光中心を有するダイヤモンドへマイクロ波を照射することなく自家蛍光を除去または低減することが可能となる。一実施形態に係る蛍光プローブは、自家蛍光を除去するためにマイクロ波の照射を伴うタイプの蛍光プローブと比較して、例えば以下に例示する応用例において有利な効果を奏する。
例えば、一実施形態に係る蛍光プローブを用いる蛍光観察において、生体NIRウィンドウ(約620-950nm)波長と呼ばれる近赤外域の波長の光を照射するレーザ光源を励起光源として使用すれば、マイクロ波が届かない組織深部や人体深部、ホールボディレベルにおいて、蛍光観察が可能となる。これは、自家蛍光を除去するためにマイクロ波の照射を伴うタイプの蛍光プローブと比較した有利な効果である。特に、ダイヤモンドの発光中心としてSiV中心を用いる場合には、SiV中心は、約600nm以上の波長が長い照射光であっても励起し蛍光を発するので有利である。また、一実施形態に係る蛍光プローブによると、光の吸収効率を高める事が可能となるため、光音響イメージングの新たな造影剤やイメージング剤としての利用が期待される。また、一実施形態に係る蛍光プローブは、光温熱療法(ハイパーサーミア)にも用いる事が可能である。例えば蛍光プローブを患者に投与し、EPR効果(血管透過性・滞留性亢進効果)で深部病変部位に到達したプローブを蛍光で確認し、同時にプローブの光吸収効率の高さを利用して光照射量を上げることで病変部位の選択的加熱・温熱治療が可能である。
[その他の形態]
以上、本発明を特定の実施形態によって説明したが、本発明は上記した実施形態に限定されるものではない。
以上、本発明を特定の実施形態によって説明したが、本発明は上記した実施形態に限定されるものではない。
上記実施形態では、蛍光プローブを用いた観察方法において、第2の強度I2が第1の強度I1より高く、第1の強度I1および第2の強度I2(I2>I1)の順で蛍光プローブ10に光を照射しているが、蛍光プローブ10に光を照射する順序はこれに制限されない。他の実施形態では、第2の強度I2が第1の強度I1より高く、第2の強度I2(I2>I1)および第1の強度I1の順で蛍光プローブ10に光を照射してもよい。すなわち、一実施形態に係る蛍光プローブを用いた観察方法において、第1の蛍光画像作成ステップおよび第2の蛍光画像作成ステップを行う順序は入れ替わってもよい。請求の範囲に記載の蛍光プローブを用いた観察方法は、これら第1の蛍光画像作成ステップおよび第2の蛍光画像作成ステップを行う順序を入れ替えた態様も、請求の範囲に含む。
図4は、アナログ式の音響光学変調素子(AOM)の機能を説明するための図である。上記実施形態では、図2(B)の右側の上段および下段のグラフに示すように、AOM22を用いて出力するパルスの粗密を制御して、単位時間あたりの照射光強度に強弱をつけることにより、複数の異なる強度I1,I2で試料100に光を照射しているが、照射光の強度を複数の異なる強度I1,I2にする方法はこれに制限されない。例えば図4に例示するように、アナログ式のAOMを用いて連続波レーザ光の強度に強弱をつけてもよい。アナログ式のAOM22は、印加される電圧に応じて、出力光の強度に強弱をつけることができる。
上記実施形態では、試料100から放出される光をそのまま検出して蛍光画像を作成しているが、試料100から放出されて波長フィルタを通過する光を検出して、蛍光画像を作成してもよい。波長フィルタは、例えばダイクロイックミラー23から検出部28の間の光学ラインに配置すればよい。後述する実施例においても言及するように、SiV中心を含む発光中心は、放出する蛍光のピーク波長が、温度上昇に伴って長波長側にシフトする。したがって、第1の強度I1より高い第2の強度I2で光を照射して第2の蛍光画像F2を作成する際に、光学ラインの上記した位置に配置されている、ゼロフォノン線の波長ピーク付近にエッジを有するロングパスフィルタを透過する光で第2の蛍光画像F2を作成すれば、ロングパスフィルタは発光中心のゼロフォノン線の波長より長波長を透過するので、信号雑音比をさらに向上することができる。同様に、第1の強度I1で光を照射して第1の蛍光画像F1を作成する際に、ゼロフォノン線の波長ピーク付近にエッジを有するショートパスフィルタを透過する光で第1の蛍光画像F1を作成すれば、信号雑音比をさらに向上することができる。
以下に本発明の実施例を示し、本発明の特徴をより明確にする。
実施例1では、本発明に係る蛍光プローブを実際に作製し、作製した蛍光プローブを用いて蛍光観察を行った。
図5は、実施例1ないし実施例3において、実施例および比較例としてガラス基板上に作製した3種類の蛍光プローブを模式的に表す図である。本発明の実施例に係る蛍光プローブとして、SiV中心を有するマイクロダイヤモンド61aの表面にポリドーパミン(PDA)62をコーティングした蛍光プローブ(以下、PD-SiVとも記載する)を、ガラス基板69上に作製した。比較例として、2種類の蛍光プローブを同じガラス基板69上に作製した。第1の比較例に係る蛍光プローブとして、SiV中心を有するマイクロダイヤモンド61a(以下、D-SiVとも記載する)を作製した。第1の比較例に係る蛍光プローブでは、SiV中心を有するマイクロダイヤモンド61aの表面にポリドーパミン(PDA)をコーティングしていない。第2の比較例に係る蛍光プローブとして、NV中心を有するマイクロダイヤモンド61b(以下、D-NVとも記載する)を作製した。第2の比較例に係る蛍光プローブでは、NV中心を有するマイクロダイヤモンド61bの表面にポリドーパミン(PDA)をコーティングしていない。なお後述するように、実施例3では、実施例1,2において用いたマイクロダイヤモンド61aよりもさらにサイズが小さいナノダイヤモンドを用いた。
実施例に係る蛍光プローブは、次に説明する手順でガラス基板上に作製した。まず、超遠心機を用いて、マイクロダイヤモンドの溶媒をトリス塩酸緩衝液(pH約8.5)に置換した。次に、4mgのTEMPOを緩衝液に加え、アイスバス超音波処理によりTEMPOを溶解させた。アイスバス超音波処理は、オンが10秒でオフが10秒のオンオフ繰り返しのサイクルで、合計10分間行った。次に、0.5mgの塩酸ドーパミン((HO)2C6H3CH2CH2NH2・HCl)粉末を緩衝液に加えた。塩酸ドーパミン粉末を加えた段階から重合反応が開始し、マイクロダイヤモンド表面へのポリドーパミン(PDA)コーティングが開始した。この間、上記した繰り返しのサイクルで、反応混合物にアイスバス超音波処理を継続して行った。コーティングの開始から2時間後に、混合物を洗浄して反応物(塩酸ドーパミン)を除去し、コーティング反応を一旦停止した。コーティングされたマイクロダイヤモンドは、超純水を加えてから超遠心機による分離作業(約9000rpm、10分間)を3回繰り返すことで回収した。ダイヤモンド表面へのこのようなコーティング反応を1~5回繰り返し行って、ポリドーパミンの膜厚を、弱いレーザ光強度であっても観察が可能な最適な膜厚に作製した。なお、分子間の凝集を防ぐために、1回あたりのコーティング反応時間は比較的短時間な2時間とした。マイクロダイヤモンドは、米国 Adamas Nanotechnologies, Inc. 製のSiVマイクロダイヤモンドを用いた。
次に、作製した蛍光プローブを用いて蛍光観察を行った。蛍光観察は、ガラス基板上に作製した蛍光プローブに第1および第2の強度で光を照射して、強度が異なる第1および第2の蛍光画像を作成し、照射光の強度補正を行ったうえで、作成したそれら第1および第2の蛍光画像の間で蛍光強度の差分をとることにより行った。照射光の強度は第1の強度<第2の強度とした。蛍光プローブに照射する光の波長は約532nmであった。
図6は、実施例1において観察された蛍光画像であり、蛍光プローブを用いた蛍光観察により得られた蛍光画像である。(A)は、作製した蛍光プローブに第1の強度より高い第2の強度で光を照射したときの第2の蛍光画像である。(B)は、照射光の強度補正を行ったうえで、第1および第2の蛍光画像の間で蛍光強度の差分をとった蛍光画像である。
(A)の蛍光画像に破線の枠で示すように、視野内には、ガラス基板上に5つの蛍光が確認された。このうち、実施例に係るPD-SiVからの蛍光は2つであり、第1の比較例に係るD-SiVからの蛍光は1つであり、第2の比較例に係るD-NVからの蛍光は2つであった。
(A)および(B)の間で蛍光画像を対比した。(B)の蛍光画像に示されているように、実施例に係る蛍光プローブであるPD-SiVからの蛍光は、2つとも強度が相対的に強調されていることが確認された。これに対し、比較例に係る蛍光プローブである、D-SiVからの蛍光およびD-NVからの蛍光はどれも、ほぼ消失しているか、または、強度が相対的に低減されていることが確認された。
次に、視野内のガラス基板上に確認されている5つの蛍光のそれぞれについて、蛍光スペクトルを測定した。蛍光スペクトルの測定結果を図7~図11に示す。なお、図7~図11の蛍光スペクトルでは、スペクトルの形を比較し易いように縦軸に示す蛍光強度を調整しており、測定された蛍光強度そのままの値ではない。
図7および図8は、実施例1において測定されたスペクトルであり、実施例に係る蛍光プローブである、ポリドーパミンで表面がコーティングされているPD-SiVから放出される蛍光のスペクトルである。(B)は(A)に示す蛍光スペクトルのピーク波長付近での拡大図である。図7(B)および図8(B)の蛍光スペクトルに示すように、照射光の強度が増大(LowからHighへ)すると、検出される蛍光強度が低下することが確認された。これにより、実施例に係る蛍光プローブについて、照射される光の強度と放出する蛍光の強度との関係が非線形であることが確認された。あわせて、照射光の強度が増大すると、強度がピークとなる波長も長波長側にシフトしていることが確認された。
図9は、実施例1において測定されたスペクトルであり、第1の比較例に係る蛍光プローブである、表面がコーティングされていないD-SiVから放出される蛍光のスペクトルである。(B)は(A)に示す蛍光スペクトルのピーク波長付近での拡大図である。図9(B)の蛍光スペクトルに示すように、照射光の強度が増大(LowからHighへ)しても、検出される蛍光強度が低下していないことが確認された。検出される蛍光強度は、照射光の強度が増大すると僅かに増大していた。あわせて、照射光の強度が増大しても、強度がピークとなる波長のシフトは確認されなかった。
図10および図11は、実施例1において測定されたスペクトルであり、第2の比較例に係る蛍光プローブである、表面がコーティングされていないD-NVから放出される蛍光のスペクトルである。図10および図11の蛍光スペクトルに示すように、照射光の強度が増大(LowからHighへ)しても、検出される蛍光強度が低下していないことが確認された。検出される蛍光強度は、照射光の強度が増大すると僅かに増大していた。あわせて、照射光の強度が増大しても、強度がピークとなる波長のシフトは確認されなかった。
以上、実施例に係る蛍光プローブについて、照射される光の強度と放出する蛍光の強度との関係が非線形であることが確認された。実施例に係る蛍光プローブを用いた蛍光観察によると、強度が異なる複数の蛍光画像の間で蛍光強度の差分をとることにより、実施例に係る蛍光プローブ以外からの蛍光はどれも、ほぼ消失しているか、または、強度が相対的に低減されていることが確認された。
実施例2でも実施例1と同様に、作製した蛍光プローブを用いて蛍光観察を行った。実施例2では、実施例に係る蛍光プローブを、実施例1と同じ作製方法により、実施例1とは異なる別のガラス基板上に新たに作製した。作製に用いるマイクロダイヤモンドも、実施例1と同じ米国 Adamas Nanotechnologies, Inc. 製 のSiVマイクロダイヤモンドとした。作製した蛍光プローブを用いた蛍光観察も、実施例1と同様に行った。
図12は、実施例2において観察された蛍光画像であり、蛍光プローブを用いた蛍光観察により得られた蛍光画像である。(A)は、作製した蛍光プローブに第1の強度より高い第2の強度で光を照射したときの第2の蛍光画像である。(B)は、照射光の強度補正を行ったうえで、第1および第2の蛍光画像の間で蛍光強度の差分をとった蛍光画像である。
(A)および(B)の間で蛍光画像を対比した。(B)の蛍光画像に示されているように、実施例に係る蛍光プローブであるPD-SiVからの蛍光は強度が相対的に強調されていることが確認された。これに対し、比較例に係る蛍光プローブである、D-SiVからの蛍光またはD-NVからの蛍光は、ほぼ消失しているか、または、強度が相対的に低減されていることが確認された。
次に、視野内のガラス基板上に確認されている蛍光のそれぞれについて、蛍光スペクトルを測定した。蛍光スペクトルの測定結果を図13~図14に示す。なお、図13~図14の蛍光スペクトルも、図7~図11同様、スペクトルの形を比較し易いように縦軸に示す蛍光強度を調整しており、測定された蛍光強度そのままの値ではない。
図13は、実施例2において測定されたスペクトルであり、実施例に係る蛍光プローブである、ポリドーパミンで表面がコーティングされているPD-SiVから放出される蛍光のスペクトルである。(B)は(A)に示す蛍光スペクトルのピーク波長付近での拡大図である。(B)の蛍光スペクトルに示すように、照射光の強度が増大(LowからHighへ)すると、検出される蛍光強度が低下することが確認された。これにより、実施例に係る蛍光プローブについて、照射される光の強度と放出する蛍光の強度との関係が非線形であることが確認された。あわせて、照射光の強度が増大すると、強度がピークとなる波長も長波長側にシフトしていることが確認された。
図14は、実施例2において測定されたスペクトルであり、比較例に係る蛍光プローブである、表面がコーティングされていないD-SiVから放出される蛍光の、または、表面がコーティングされていないD-NVから放出される蛍光のスペクトルである。(B)は(A)に示す蛍光スペクトルのピーク波長付近での拡大図である。(B)の蛍光スペクトルに示すように、照射光の強度が増大(LowからHighへ)しても、検出される蛍光強度が低下していないことが確認された。検出される蛍光強度は、照射光の強度が増大すると僅かに増大していた。あわせて、照射光の強度が増大しても、強度がピークとなる波長のシフトは確認されなかった。
以上、実施例に係る蛍光プローブについて、照射される光の強度と放出する蛍光の強度との関係が非線形であることが確認された。実施例に係る蛍光プローブを用いた蛍光観察によると、強度が異なる複数の蛍光画像の間で蛍光強度の差分をとることにより、実施例に係る蛍光プローブ以外からの蛍光はどれも、ほぼ消失しているか、または、強度が相対的に低減されていることが確認された。
実施例3でも実施例1と同様に、本発明に係る蛍光プローブを実際に作製し、作製した蛍光プローブを用いて蛍光観察を行った。実施例3では、実施例1,2において用いたマイクロダイヤモンドよりもさらにサイズが小さいナノダイヤモンドを用いた。
実施例3において、ナノダイヤモンドは、爆轟法により得られるSiVナノダイヤモンドを用いた。SiVナノダイヤモンドは次の手順により調製した。
トリニトロトルエン(TNT)とシクロトリメチレントリニトラミン(RDX)を含む爆薬100質量部に、異原子化合物としてトリフェニルシラノールを1質量部又は添加した爆薬組成物約1kgを使用し、ナノダイヤモンド製造の常法に従い、ケイ素ドープナノダイヤモンドを製造した。得られたケイ素ドープナノダイヤモンドについて、以下の処理(i)~(iv)を行った。なお、爆薬中のトリフェニルシラノールの添加量は1質量%であった。
(i)混酸処理
濃硫酸:濃硝酸=11:1(重量比)の混酸2800gに爆轟試験で得たナノダイヤモンド15gを加え、撹拌しながら150℃で10時間処理した。
(ii)アルカリ処理
8Nの水酸化ナトリウム水溶液100mLに混酸処理したナノダイヤモンド1gを加え、撹拌しながら70℃で8時間処理した。
(iii)気相酸化処理
得られたSiドープナノダイヤモンド原料をガス雰囲気炉において、570℃、4%酸素雰囲気において2時間気相酸化処理を行い、Siドープナノダイヤモンド粒子を得た。
得られたSiドープナノダイヤモンド粒子について、顕微ラマン分光装置(商品名:顕微レーザーラマン分光光度計LabRAM HR Evolution、堀場製作所株式会社製)を用いて高速マッピング、738nm輝点イメージングを行い、蛍光強度、輝点数(中心部、中間層、外周部)を測定した。さらに、全自動多目的X線回折装置(株式会社リガク製)を用いた粉末X線回折法(XRD)により一次粒子の平均サイズをシェラーの式に基づき測定した。さらに、Si導入量を蛍光X線分析装置ZSX Primus IV 株式会社リガク製を用いたXRFにより測定した。さらに、sp2炭素とsp3炭素のピーク面積比を顕微ラマン分光装置(商品名:顕微レーザーラマン分光光度計 LabRAM HR Evolution、堀場製作所株式会社製)を用いて、顕微ラマン分光法により測定した。測定には325nmのレーザーを使用し、sp2炭素のピーク面積は1250cm-1と1328cm-1付近に現れるピークの面積を参照し、sp3炭素のピーク面積は1500cm-1と1590cm-1付近に現れるピークの面積を参照した。作製したナノダイヤモンドの平均粒径は約10.8nmであった。
(iv)高温長時間混酸処理
濃硫酸:濃硝酸=3:1(重量比)の混酸に気相酸化処理(iii)で得られたナノダイヤモンド粒子を加え、130℃で72時間混酸処理を行った。混酸処理したナノダイヤモンドは遠心分離により、回収し、純水で繰り返し洗浄を行った。洗浄後回収したナノダイヤモンドは乾燥工程を行って、ナノダイヤモンド粉体を得た。
トリニトロトルエン(TNT)とシクロトリメチレントリニトラミン(RDX)を含む爆薬100質量部に、異原子化合物としてトリフェニルシラノールを1質量部又は添加した爆薬組成物約1kgを使用し、ナノダイヤモンド製造の常法に従い、ケイ素ドープナノダイヤモンドを製造した。得られたケイ素ドープナノダイヤモンドについて、以下の処理(i)~(iv)を行った。なお、爆薬中のトリフェニルシラノールの添加量は1質量%であった。
(i)混酸処理
濃硫酸:濃硝酸=11:1(重量比)の混酸2800gに爆轟試験で得たナノダイヤモンド15gを加え、撹拌しながら150℃で10時間処理した。
(ii)アルカリ処理
8Nの水酸化ナトリウム水溶液100mLに混酸処理したナノダイヤモンド1gを加え、撹拌しながら70℃で8時間処理した。
(iii)気相酸化処理
得られたSiドープナノダイヤモンド原料をガス雰囲気炉において、570℃、4%酸素雰囲気において2時間気相酸化処理を行い、Siドープナノダイヤモンド粒子を得た。
得られたSiドープナノダイヤモンド粒子について、顕微ラマン分光装置(商品名:顕微レーザーラマン分光光度計LabRAM HR Evolution、堀場製作所株式会社製)を用いて高速マッピング、738nm輝点イメージングを行い、蛍光強度、輝点数(中心部、中間層、外周部)を測定した。さらに、全自動多目的X線回折装置(株式会社リガク製)を用いた粉末X線回折法(XRD)により一次粒子の平均サイズをシェラーの式に基づき測定した。さらに、Si導入量を蛍光X線分析装置ZSX Primus IV 株式会社リガク製を用いたXRFにより測定した。さらに、sp2炭素とsp3炭素のピーク面積比を顕微ラマン分光装置(商品名:顕微レーザーラマン分光光度計 LabRAM HR Evolution、堀場製作所株式会社製)を用いて、顕微ラマン分光法により測定した。測定には325nmのレーザーを使用し、sp2炭素のピーク面積は1250cm-1と1328cm-1付近に現れるピークの面積を参照し、sp3炭素のピーク面積は1500cm-1と1590cm-1付近に現れるピークの面積を参照した。作製したナノダイヤモンドの平均粒径は約10.8nmであった。
(iv)高温長時間混酸処理
濃硫酸:濃硝酸=3:1(重量比)の混酸に気相酸化処理(iii)で得られたナノダイヤモンド粒子を加え、130℃で72時間混酸処理を行った。混酸処理したナノダイヤモンドは遠心分離により、回収し、純水で繰り返し洗浄を行った。洗浄後回収したナノダイヤモンドは乾燥工程を行って、ナノダイヤモンド粉体を得た。
実施例3に係るSiV中心を有するナノダイヤモンドを用いた蛍光プローブは、アイスバス超音波処理をTEMPOが溶解するまで継続(典型的には約10分間)する点以外は、実施例1と同じ手順でガラス基板上に作製した。作製に用いたナノダイヤモンドの平均粒径は約10.8nmであった。作製した蛍光プローブを用いた蛍光観察も、実施例1と同様に行った。ただし実施例3では実施例1と異なり、蛍光観察時のレーザ強度は、第1の強度I1を第2の強度I2より高く(I1>I2)した。
図15は、実施例3に係る蛍光プローブを用いた蛍光観察により得られた蛍光画像である。図15の蛍光画像は、作製した蛍光プローブに第1の強度I1(I1>I2)で光を照射したときの第1の蛍光画像である。図中の蛍光画像に破線の枠で示すように、視野内には、ガラス基板上に3つの蛍光が確認された。このうち、実施例3に係る蛍光プローブであるPD-SiVからの蛍光は1つであった。後述する図17に関する考察から、残り2つの蛍光は作製した実施例3に係る蛍光プローブからの蛍光ではないと考えられることから、以下の説明ではこれら2つの蛍光にはラベル「Bkg1」、「Bkg2」を付して説明する。
図16は、図15中にラベル「PD-SiV」で示す蛍光のスペクトルである。(B)は(A)に示す蛍光スペクトルのピーク波長付近での拡大図である。なお(B)では蛍光強度の最大値が1になるように規格化している。(A)の蛍光スペクトルに示すように、照射光の強度が低下(HighからLowへ)すると、検出される蛍光強度が増大することが確認された。これにより、実施例3に係る蛍光プローブについても、照射される光の強度と放出する蛍光の強度との関係が非線形であることが確認された。あわせて(B)の蛍光スペクトルに示すように、照射光の強度が低下すると、強度がピークとなる波長も低波長側にシフトしていることが確認された。
図17は、図15中にラベル「Bkg1」または「Bkg2」で示す蛍光のスペクトルである。(A)は図15中にラベル「Bkg1」で示す蛍光のスペクトルであり、(B)は図15中にラベル「Bkg2」で示す蛍光のスペクトルである。(A)および(B)の蛍光スペクトルに示すように、ラベル「Bkg1」および「Bkg2」を付した蛍光については、照射光の強度が低下(HighからLowへ)しても、検出される蛍光強度が増大していないことが確認された。検出される蛍光強度は、照射光の強度が低下すると僅かに低下していた。あわせて、照射光の強度が低下しても、強度がピークとなる波長のシフトは確認されなかった。
図18は、実施例3に係る蛍光プローブを用いた蛍光観察により得られた蛍光画像であり、蛍光プローブに異なる強度で光を照射したときのそれぞれの蛍光画像である。(A)は、作製した蛍光プローブに第1の強度で光を照射したときの第1の蛍光画像である。(B)は、作製した蛍光プローブに第1の強度より低い第2の強度で光を照射したときの第2の蛍光画像である。(C)は、照射光の強度補正を行ったうえで、第1および第2の蛍光画像間で蛍光強度の差分をとった蛍光画像である。なお(C)の蛍光画像において、右側の矢印で示す蛍光は、図15中にラベル「PD-SiV」で示す蛍光であり、左側の矢印で示す蛍光は、図15中にラベル「Bkg1」および「Bkg2」で示す蛍光である。
図18の蛍光画像について考察する。照射光の強度と検出される蛍光強度との変化を蛍光画像(A)ないし(C)にわたって確認したところ、図15中にラベル「PD-SiV」で示す蛍光に対応する、(C)の蛍光画像において右側の矢印で示す蛍光は、相対的な蛍光強度が非線形で変化していることが確認された。
図19は、図18に示す蛍光画像のうち、図15中にラベル「Bkg1」および「Bkg2」で示す部分を含む蛍光画像である。
図19の蛍光画像について考察する。照射光の強度と検出される蛍光強度との変化を蛍光画像(A)ないし(C)にわたって確認したところ、蛍光強度の変化は概ね直線的であり、照射される光の強度と放出する蛍光の強度との間に概ね線形性の関係があることが確認された。すなわち図15中にラベル「Bkg1」および「Bkg2」で示す蛍光については、強度が異なる複数の蛍光画像の間で蛍光強度の差分をとることにより、蛍光がほぼ消失していることが確認された。
以上、実施例1,2において用いたマイクロダイヤモンドよりもさらにサイズが小さいナノダイヤモンドを用いた実施例3に係る蛍光プローブについても、実施例1,2と同様に、照射される光の強度と放出する蛍光の強度との関係が非線形であることが確認された。
なお実施例3では、爆轟法により得られるSiVナノダイヤモンドを用いて蛍光プローブを作製しているが、蛍光プローブの作製に用いるナノダイヤモンドは、爆轟法により得られるものに制限されない。ナノダイヤモンドへ異元素(例えばSi)をドーピングする爆轟法以外の方法としては、例えば高温高圧(High Pressure and High Temperature, HPHT)法や、CVD法、爆縮法などがある。例示するこれらの方法では、ダイヤモンドを合成するときにSi元素を導入することにより、または、Si元素を含有しないダイヤモンド粒子に対して後からSiイオンを注入することなどにより、SiVマイクロダイヤモンドまたはSiVナノダイヤモンドを作製することができる。蛍光プローブの作製には、これらの方法により得られる複合欠陥を有するマイクロダイヤモンドまたはナノダイヤモンドを用いることができる。
1 ダイヤモンド
2 光を吸収して熱を放出する物質
10 蛍光プローブ
20 観察装置
21 光源
22 音響光学変調素子(AOM)
23 ダイクロイックミラー
24 ピエゾステージ
25 対物レンズ
26 集光レンズ
27 ピンホール
28 検出部
29 データ処理部
61a SiV中心を有するダイヤモンド
61b NV中心を有するダイヤモンド
62 ポリドーパミン(PDA)
69 ガラス基板
100 試料
2 光を吸収して熱を放出する物質
10 蛍光プローブ
20 観察装置
21 光源
22 音響光学変調素子(AOM)
23 ダイクロイックミラー
24 ピエゾステージ
25 対物レンズ
26 集光レンズ
27 ピンホール
28 検出部
29 データ処理部
61a SiV中心を有するダイヤモンド
61b NV中心を有するダイヤモンド
62 ポリドーパミン(PDA)
69 ガラス基板
100 試料
Claims (10)
- 発光中心を有するダイヤモンド粒子の表面に、光を吸収して熱を放出する物質がコーティングされている蛍光プローブ。
- 照射される光の強度と放出する蛍光の強度との関係が非線形である、請求項1に記載の蛍光プローブ。
- 前記コーティングにフリーラジカルが加えられている、請求項1に記載の蛍光プローブ。
- 前記物質は、色素分子、グラフェン、グラファイト、カーボンナノチューブ、高分子化合物、金属ナノ粒子、有機ナノ粒子、および無機ナノ粒子の少なくとも一つを含む、請求項1に記載の蛍光プローブ。
- 前記物質はポリドーパミンである、請求項1に記載の蛍光プローブ。
- 前記発光中心は珪素-空孔複合欠陥である、請求項1に記載の蛍光プローブ。
- 請求項1から6のいずれか一項に記載の蛍光プローブに第1の強度で光を照射して、第1の蛍光画像を作成する第1の蛍光画像作成ステップと、
前記蛍光プローブに前記第1の強度より高い第2の強度で光を照射して、第2の蛍光画像を作成する第2の蛍光画像作成ステップと、
前記第1の蛍光画像と前記第2の蛍光画像との間で蛍光強度の差分をとり、前記蛍光プローブに前記第2の強度で光を照射したときに前記蛍光プローブから放出される蛍光の強度が相対的に強調された強調画像を作成する強調画像作成ステップと、
を含む、蛍光プローブを用いた観察方法。 - 前記強調画像作成ステップは、
前記第1の強度と前記第2の強度との比率に基づいて、前記第1の蛍光画像および前記第2の蛍光画像の一方の蛍光強度を補正し、補正した一方の蛍光画像と他方の蛍光画像との間で蛍光強度の差分をとることにより、前記強調画像を作成する、請求項7に記載の観察方法。 - 前記第2の蛍光画像作成ステップは、前記蛍光プローブから放出されて波長フィルタを通過する蛍光から前記第2の蛍光画像を作成し、
前記波長フィルタは、前記蛍光プローブに含まれる発光中心のゼロフォノン線の波長より長波長を透過するロングパスフィルタである、請求項7に記載の観察方法。 - 前記第1の蛍光画像作成ステップは、前記蛍光プローブから放出されて波長フィルタを通過する蛍光から前記第1の蛍光画像を作成し、
前記波長フィルタは、前記蛍光プローブに含まれる発光中心のゼロフォノン線の波長より短波長を透過するショートパスフィルタである、請求項7に記載の観察方法。
Priority Applications (1)
| Application Number | Priority Date | Filing Date | Title |
|---|---|---|---|
| JP2025526048A JPWO2024252945A1 (ja) | 2023-06-05 | 2024-05-23 |
Applications Claiming Priority (2)
| Application Number | Priority Date | Filing Date | Title |
|---|---|---|---|
| JP2023-092423 | 2023-06-05 | ||
| JP2023092423 | 2023-06-05 |
Publications (1)
| Publication Number | Publication Date |
|---|---|
| WO2024252945A1 true WO2024252945A1 (ja) | 2024-12-12 |
Family
ID=93795483
Family Applications (1)
| Application Number | Title | Priority Date | Filing Date |
|---|---|---|---|
| PCT/JP2024/019022 Ceased WO2024252945A1 (ja) | 2023-06-05 | 2024-05-23 | 蛍光プローブおよび蛍光プローブを用いた観察方法 |
Country Status (3)
| Country | Link |
|---|---|
| JP (1) | JPWO2024252945A1 (ja) |
| TW (1) | TW202506958A (ja) |
| WO (1) | WO2024252945A1 (ja) |
Citations (4)
| Publication number | Priority date | Publication date | Assignee | Title |
|---|---|---|---|---|
| WO2010084381A1 (en) * | 2009-01-21 | 2010-07-29 | Eppendorf Ag | Detection and/or quantification method of target molecules on a solid support |
| JP2016008961A (ja) * | 2014-06-26 | 2016-01-18 | ルネサスエレクトロニクス株式会社 | 磁気計測装置 |
| JP3215716U (ja) * | 2015-04-09 | 2018-04-12 | ビカンタ コーポレイション | 蛍光ナノダイヤモンドを使用した撮像システムおよびその方法 |
| JP2021134127A (ja) * | 2020-02-28 | 2021-09-13 | 株式会社ダイセル | 蛍光ナノダイヤモンドの製造方法 |
-
2024
- 2024-05-23 WO PCT/JP2024/019022 patent/WO2024252945A1/ja not_active Ceased
- 2024-05-23 JP JP2025526048A patent/JPWO2024252945A1/ja active Pending
- 2024-05-31 TW TW113120229A patent/TW202506958A/zh unknown
Patent Citations (4)
| Publication number | Priority date | Publication date | Assignee | Title |
|---|---|---|---|---|
| WO2010084381A1 (en) * | 2009-01-21 | 2010-07-29 | Eppendorf Ag | Detection and/or quantification method of target molecules on a solid support |
| JP2016008961A (ja) * | 2014-06-26 | 2016-01-18 | ルネサスエレクトロニクス株式会社 | 磁気計測装置 |
| JP3215716U (ja) * | 2015-04-09 | 2018-04-12 | ビカンタ コーポレイション | 蛍光ナノダイヤモンドを使用した撮像システムおよびその方法 |
| JP2021134127A (ja) * | 2020-02-28 | 2021-09-13 | 株式会社ダイセル | 蛍光ナノダイヤモンドの製造方法 |
Also Published As
| Publication number | Publication date |
|---|---|
| JPWO2024252945A1 (ja) | 2024-12-12 |
| TW202506958A (zh) | 2025-02-16 |
Similar Documents
| Publication | Publication Date | Title |
|---|---|---|
| Edmonds et al. | Characterisation of CVD diamond with high concentrations of nitrogen for magnetic-field sensing applications | |
| Ding et al. | Luminescent carbon quantum dots and their application in cell imaging | |
| Khan et al. | Water-soluble green-emitting carbon nanodots with enhanced thermal stability for biological applications | |
| Pyo et al. | Enhanced luminescence of Au 22 (SG) 18 nanoclusters via rational surface engineering | |
| de Yro et al. | Hydrothermal synthesis of carbon quantum dots from biowaste for bio-imaging | |
| Liu et al. | Green synthesis of fluorescent carbon dots as an effective fluorescence probe for morin detection | |
| Carbonati et al. | NIR emitting GdVO4: Nd nanoparticles for bioimaging: The role of the synthetic pathway | |
| Rubim et al. | Raman spectroscopy as a powerful technique in the characterization of ferrofluids | |
| Fang et al. | Preparation and characterization of ion-irradiated nanodiamonds as photoacoustic contrast agents | |
| Erushin et al. | Laser-induced damage threshold of sulfur-containing crystals of barium chalcogenides: E. Erushin et al. | |
| El-Dahshan et al. | Hydrothermal microwave synthesis of water soluble NIR-II emitting Ag 2 S quantum dots | |
| Meir et al. | NIR-to-visible upconversion in quantum dots via a ligand induced charge transfer state | |
| Haupt et al. | Pdots, a new type of nanoparticle, bind to m THPC via their lipid modified surface and exhibit very high FRET efficiency between the core and the sensitizer | |
| CN109825293B (zh) | 碳化钛纳米片作为上转换材料的应用 | |
| Nocito et al. | Photochemical synthesis, characterization, and electrochemical sensing properties of CD–AuNP nanohybrids | |
| CN108559497B (zh) | 产生二次谐波的掺杂石墨烯量子点及其制备方法和应用 | |
| TW202506958A (zh) | 螢光探針及使用螢光探針之觀察方法 | |
| Lim et al. | Luminescent oxygen-sensing films with improved sensitivity based on light scattering by TiO2 particles | |
| Cho et al. | Predictable incorporation of nitrogen into carbon dots: insights from pinacol rearrangement and iminium ion cyclization | |
| JP2007521473A (ja) | 標本の疾病および生理学的状態の検出のためのストークスシフト放射分光法 | |
| Torregrosa-Rivero et al. | Are carbon dots cluster-triggered luminogens? How through-space interaction arrangement influence the optical properties of carbon dots | |
| Hada et al. | Gold nanoclusters performing as contrast agents for non-invasive imaging of tissue-like phantoms via two-photon excited fluorescence lifetime imaging | |
| Nancy et al. | Green synthesis of graphene oxide/Ag nanocomposites via laser ablation in water for SERS applications | |
| JP2004167316A (ja) | ナノ粒子化処理に用いるレーザ光照射条件の決定方法及び決定装置並びにナノ粒子の製造方法並びにナノ粒子の粒径分布推定方法 | |
| Zhao et al. | Rare-earth doped CaF2 nanocrystals for dual-modal short-wavelength infrared fluorescence and photoacoustic imaging |
Legal Events
| Date | Code | Title | Description |
|---|---|---|---|
| 121 | Ep: the epo has been informed by wipo that ep was designated in this application |
Ref document number: 24819177 Country of ref document: EP Kind code of ref document: A1 |
|
| ENP | Entry into the national phase |
Ref document number: 2025526048 Country of ref document: JP Kind code of ref document: A |
|
| WWE | Wipo information: entry into national phase |
Ref document number: 2025526048 Country of ref document: JP |
|
| NENP | Non-entry into the national phase |
Ref country code: DE |