WO2024247595A1 - 設計支援システム、及び設計支援方法 - Google Patents
設計支援システム、及び設計支援方法 Download PDFInfo
- Publication number
- WO2024247595A1 WO2024247595A1 PCT/JP2024/016704 JP2024016704W WO2024247595A1 WO 2024247595 A1 WO2024247595 A1 WO 2024247595A1 JP 2024016704 W JP2024016704 W JP 2024016704W WO 2024247595 A1 WO2024247595 A1 WO 2024247595A1
- Authority
- WO
- WIPO (PCT)
- Prior art keywords
- state
- quality
- data
- distribution model
- state distribution
- Prior art date
- Legal status (The legal status is an assumption and is not a legal conclusion. Google has not performed a legal analysis and makes no representation as to the accuracy of the status listed.)
- Ceased
Links
Images






Classifications
-
- G—PHYSICS
- G05—CONTROLLING; REGULATING
- G05B—CONTROL OR REGULATING SYSTEMS IN GENERAL; FUNCTIONAL ELEMENTS OF SUCH SYSTEMS; MONITORING OR TESTING ARRANGEMENTS FOR SUCH SYSTEMS OR ELEMENTS
- G05B13/00—Adaptive control systems, i.e. systems automatically adjusting themselves to have a performance which is optimum according to some preassigned criterion
- G05B13/02—Adaptive control systems, i.e. systems automatically adjusting themselves to have a performance which is optimum according to some preassigned criterion electric
- G05B13/04—Adaptive control systems, i.e. systems automatically adjusting themselves to have a performance which is optimum according to some preassigned criterion electric involving the use of models or simulators
- G05B13/048—Adaptive control systems, i.e. systems automatically adjusting themselves to have a performance which is optimum according to some preassigned criterion electric involving the use of models or simulators using a predictor
-
- G—PHYSICS
- G05—CONTROLLING; REGULATING
- G05B—CONTROL OR REGULATING SYSTEMS IN GENERAL; FUNCTIONAL ELEMENTS OF SUCH SYSTEMS; MONITORING OR TESTING ARRANGEMENTS FOR SUCH SYSTEMS OR ELEMENTS
- G05B17/00—Systems involving the use of models or simulators of said systems
- G05B17/02—Systems involving the use of models or simulators of said systems electric
Definitions
- the present invention relates to a design support system and a design support method.
- pilot plant tests a pilot plant of a similar scale to the full-scale plant is constructed, and the operating conditions and operation methods are determined, and the instrumentation system is designed.
- full-scale plant design the plant is designed and operated based on the technology established in the pilot plant. Note that bench tests and pilot tests may be integrated into other phases.
- the specifications of the equipment, facilities, manufacturing processes, etc. vary greatly between these phases.
- the manufacturing process is a reaction process
- the volume of the reactor can increase by tens or hundreds of times as the phase progresses.
- Scaling up is a time-consuming task. For example, if the reaction conditions devised in lab experiments cannot be reproduced in bench tests, it becomes necessary to redesign the physical properties or yield in the lab experiments, resulting in significant rework. Furthermore, pilot plant tests are large in capacity and take a long time to produce, so the work can take anywhere from six months to a year and a half. For this reason, scale-up is a bottleneck in product development for chemical manufacturers and material manufacturers.
- Non-Patent Document 1 discloses a method for optimizing plant operating conditions with as few experiments as possible to manufacture the desired product immediately after completing verification in pilot plant tests and starting production in the manufacturing equipment of the plant. Specifically, it discloses a method for obtaining good quality with a small number of experiments by using a combination of transfer learning and Gaussian process regression to build a model (quality prediction model) that predicts the average and variance of quality from the operating conditions, and by conducting experiments under conditions that are likely to increase the objective function while taking the variance into account.
- a model quality prediction model
- Non-Patent Document 1 requires that the number of outputs of the quality prediction model be the same for pilot plants and full-scale plants. In other words, the number of KPIs and their components to be optimized must be the same before and after scale-up. However, when scaling up from laboratory testing, the number of KPIs and their components often differs. For example, in bench equipment, pilot plants, and full-scale plants, it is necessary to optimize the yield by taking into account heat transfer delay and temperature or concentration unevenness, but in laboratory testing, these are generally not included in the items to be considered. Also, in laboratory testing, quality items are considered as single variables, but there may be cases where multiple statistics related to quality items (average, maximum, minimum, etc.) are optimized at bench, pilot, and full-scale plant scales. In such cases, the method in Non-Patent Document 1 cannot be applied.
- Non-Patent Document 1 a method could be considered in which a first-principles simulation is performed on a plant scale (such as a coupled simulation of fluid and reaction in the case of a reaction process, or a kneading simulation in the case of an extrusion process) to precisely estimate conditions such as concentration and temperature within the process, and then quality is estimated based on the results.
- a plant scale such as a coupled simulation of fluid and reaction in the case of a reaction process, or a kneading simulation in the case of an extrusion process
- the above simulation requires an enormous computational load, making it difficult to repeat trials while changing conditions such as equipment specifications and operating conditions, or to perform a simulation of the entire time period from the start to the end of production.
- the present invention has been made in light of this background, and its purpose is to provide a design support system and a design support method that are capable of designing a process for obtaining deliverables of appropriate quality in the process of producing deliverables that are each carried out at different scales.
- One aspect of the present invention for solving the above problem includes a storage device for storing a quality prediction model in which data representing a state and data representing a process performed on raw materials in the state are input, and data representing the quality of an end product obtained from the raw materials after the process is output; a state distribution model construction process for acquiring information on the state of each position in the spatial domain when a process is performed on raw materials distributed in the spatial domain, calculating a value representing the non-uniformity of the state in the spatial domain based on each acquired information, inputting process design parameters that are data defining a process performed on the raw materials present in the spatial domain based on the calculated value representing the non-uniformity and the data defining the process, and generating a state distribution model in which data representing the non-uniformity of the state in the spatial domain during or after execution of the process is output; and a process for setting values of the process design parameters and inputting the set values of the process design parameters into the state distribution model.
- the design support system is equipped with a control device that executes a state distribution model execution process that acquires data values representing the non-uniformity of the state in the spatial domain related to the process design parameter for which the value was set by inputting the acquired data values representing the non-uniformity of the state in the spatial domain, during or after the execution of the process indicated by the value of the set process design parameter, a manufacturing quality prediction process that identifies multiple states that can be taken in the spatial domain from the acquired data values representing the non-uniformity of the state in the spatial domain, and acquires quality parameters of the product obtained from the raw material after the process indicated by the value of the set process design parameter by inputting each data representing each identified state and the value of the set process design parameter into the quality prediction model for each state, and a parameter search process that changes the value of the set process design parameter based on each acquired quality parameter so that the quality of the product obtained from the raw material falls within a predetermined range.
- a process design can be performed to obtain a product of appropriate quality in processes for producing a product carried out at different scales. Configurations and effects other than those described above will become apparent from the following description of the embodiments.
- FIG. 1 is a diagram illustrating an example of a configuration of a design support system according to an embodiment of the present invention.
- FIG. 13 is a diagram showing an example of laboratory experiment data.
- FIG. 1 is a diagram illustrating an example of a configuration of a plant experiment.
- FIG. 2 is a diagram showing an example of plant experiment data obtained by a plant experiment.
- FIG. 1 is a diagram illustrating an example of CAE simulation data.
- FIG. 13 is a diagram illustrating an example of a state distribution model database.
- FIG. 2 is a diagram illustrating an example of hardware included in an information processing device constituting the design support system.
- FIG. 11 is a flow diagram illustrating an example of a first process design parameter determination process.
- FIG. 13 is a diagram showing an example of a state distribution model construction screen.
- FIG. 11 is a flow diagram illustrating details of a state distribution model construction process.
- FIG. 11 is a flow diagram illustrating details of a state distribution generation process.
- FIG. 11 is a flow diagram illustrating details of a manufacturing quality prediction process.
- FIG. 11 is a flow diagram illustrating details of a process search process.
- FIG. 13 is a diagram illustrating an example of a process search screen.
- FIG. 11 is a flow diagram illustrating details of a state distribution model regeneration process.
- FIG. 11 is a diagram illustrating an example of manufacturing performance data.
- FIG. 11 is a flow diagram illustrating an example of a second process design parameter determination process.
- the design support system is used when conducting small-scale experiments (for example, small-scale trial production at the beaker level having a spatial area where a small-scale process is carried out, such as a laboratory experiment.
- small-scale experiments may also be referred to as laboratory experiments
- large-scale tests large-scale testing or production of a product in a large-scale device having a spatial area where a large-scale process is carried out, such as bench testing, pilot plant testing, and actual plant design (operation).
- large-scale production may also be referred to as plant experiments) for the development and production of a product (end product, such as resin or fiber) produced by carrying out a specified process (physical or chemical process) on raw materials.
- the design support system constructs a state distribution model that calculates values (in this embodiment, the average value and variance values when the internal state is considered as a random variable) that represent the non-uniformity of the distribution of the internal state (spatial distribution of elements that affect the quality of the end product, such as temperature) of a spatial domain having a predetermined size in which a process is executed, based on the result data of an actually performed plant experiment (large-scale test) or data obtained by executing a coupled simulation (hereinafter also referred to as a spatial process model) using a coupled model described below (hereinafter referred to as CAE (Computer Aided Engineering) simulation data).
- the state distribution model outputs the distribution value of the internal state of the spatial domain in the manufacture of products at various scales (under various equipment sizes and operating conditions). However, in this case, only a small amount of data may be obtained from the plant experiment or coupled simulation.
- the design support system builds a quality prediction model that predicts the quality (hardness, etc.) of the product obtained from the raw materials based on actual data from laboratory experiments (small-scale experiments) that were conducted on a small scale such that it was not necessary to consider the distribution of internal conditions as described above.
- the design support system sets the external conditions of the large-scale test (for example, the size or shape of the plant equipment, mixing conditions, or plant operating conditions; hereafter referred to as process design parameters), and inputs the set process design parameters into a state distribution model to output values that represent the heterogeneity or range of distribution of the internal state of the plant due to the large-scale test (in this embodiment, the average value and variance value when the internal state is considered as a random variable).
- the design support system 1 samples the state value (temperature value) based on this heterogeneity value, and inputs each sampled value and the corresponding process design parameter into a quality prediction model to predict the quality of the product manufactured under that state (temperature) and process design parameters.
- the design support system can search for process design parameters that take into account the variability in the predicted values of the quality of products manufactured in large-scale testing, and that will ensure that the quality of the manufactured products falls within a specified range and satisfy plant constraints, etc.
- the process carried out on the raw materials is assumed to be a reaction process, but the present invention can be widely applied to other types of processes such as other physical processes (mixing processes, etc.).
- it may be a manufacturing process for continuous products such as chemicals, pharmaceuticals, or steel.
- It may also be a process involving equipment or facilities where it is important to understand the internal state, such as an energy plant such as a thermal power plant.
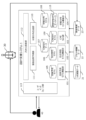
- FIG. 1 is a diagram showing an example of the configuration of a design support system 1 according to this embodiment.
- the design support system 1 is connected to laboratory experiment data 21, which stores experimental data from small-scale experiments, plant experiment data 22, which stores experimental data from large-scale tests, and manufacturing performance data 23, which stores data on the manufacturing performance of products actually manufactured on a full scale in a reactor 30, which will be described later, etc.
- the design support system 1 also stores a quality prediction model 105, a reaction characteristic model 106, CAE simulation data 107, a state distribution model 108, a CAE simulation model 109, and a state distribution model database 115.
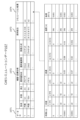
- (Lab experimental data) 2 is a diagram showing an example of the lab experiment data 21.
- the lab experiment data 21 is data that stores the experimental conditions and experimental results of small-scale experiments. Specifically, the lab experiment data 21 stores, for each small-scale experiment, an experiment ID 211 for identifying the experiment, experimental conditions 212 for the experiment, reaction characteristics 213 for the experiment, and quality 214 of the product obtained by the experiment in association with each other.
- the experimental conditions 212 and reaction characteristics 213 are data related to the raw materials or the process performed on the raw materials.
- the experimental conditions 212 include the composition of the raw materials used in the experiment (ingredients and their blending), the reaction temperature, and the reaction time.
- the reaction characteristics 213 include the reaction rate, reaction heat, and solution viscosity measured by an experiment under those experimental conditions.
- the quality 214 includes the hardness and elongation of the material obtained by an experiment under those experimental conditions. Note that the data items described here are only examples.
- the experimental conditions 212 and reaction characteristics 213 can be parameters that represent the contents of various physical or chemical processes. Furthermore, the quality 214 can be parameters that represent various physical or chemical properties of the product.
- the laboratory experimental data 21 is used to generate the quality prediction model 105 and the reaction characteristic model 106.
- FIG. 3 is a diagram showing an example of a configuration of a plant experiment.
- FIG. 4 is a diagram showing an example of plant experiment data 22 obtained by a plant experiment.
- thermometers 51-55 are installed at various locations inside a vessel (reactor 30) having a spatial region capable of containing raw materials.
- a predetermined operation system or control system information processing (for example, this may be design support system 1) measures the temperatures of the thermometers 51-55 at predetermined time intervals while operating the reactor 30, and registers the temperatures in the plant experiment data 22.
- An operator may also register the measured temperatures in the plant experiment data 22 while operating the reactor 30. It is preferable to set the positions of the thermometers 51-55 so that the temperature values measured at each position vary.
- the plant experiment data 22 is data that associates, for each plant experiment, the plant experiment ID 221, the equipment specifications 222 in the plant experiment, the composition of the raw materials in the plant experiment (raw material mix 223), and the plant experiment results 224.
- the plant experiment results 224 include parameters (temperatures) measured by the sensors (e.g., thermometers 51-55) at each time. Note that the time and temperature in the plant experiment results 224 are data with the same structure as the time and temperature in the simulation results 1074 in the CAE simulation data 107 described below, although the data granularity is different.
- the plant experiment data 22 is used to generate the state distribution model 108.
- Fig. 5 is a diagram showing an example of CAE simulation data 107.
- the CAE simulation data 107 is a database that records the execution results of a coupled simulation model in which a CAE simulation model 109 and a reaction characteristic model 106 are coupled. Specifically, the CAE simulation data 107 stores, for each coupled simulation, an ID 1071 for identifying the coupled simulation, an equipment and facility specification 1072 that is data that specifies a reaction process, a raw material composition (raw material blend 1073) set as an input value in the coupled simulation, and a result 1074 of the coupled simulation in association with each other.
- the equipment specification 1072 is data related to the vessel (reactor) in which the process is carried out or the device, equipment, or facility used in the process (hereinafter, these reactors, devices, equipment, and facilities are collectively referred to as devices), which is set as an input value in the coupled simulation.
- the equipment specification 1072 includes, for example, the shape of the reactor, the radius of the reactor, the height of the reactor, the shape of the stirring blades to be installed in the reactor, the area of the stirring blades, and the heat removal method to be set in the reactor.
- the raw material blend 1073 includes the components of the raw materials and their blending ratio.
- the simulation result 1074 includes the flow velocity (three-dimensional flow velocity), temperature, and viscosity at each position (three-dimensional position coordinates) of the reactor at each time.
- (State distribution model database) 6 is a diagram showing an example of the state distribution model database 115.
- the state distribution model database 115 stores data sources for generating each state distribution model 108.
- the state distribution model database 115 has each of the following data: the ID of the state distribution model 108, the type of data used to generate the state distribution model 108 (learning data source 1152), information identifying the contents of the data source (learning data ID 1153), and model data 1154 storing the contents of the state distribution model 108.
- the learning data source 1152 is data indicating, for example, either the CAE simulation data 107 or the plant experiment data 22.
- the learning data ID 1153 is information identifying a specific data source in the CAE simulation data 107 or the plant experiment data 22 (specifically, the data ID 2111 of the plant experiment data 22 or the data ID 1071 of the CAE simulation data 107).
- the design support system 1 has various functional units (programs) including a quality prediction model construction unit 101, a reaction characteristic model construction unit 102, a CAE simulation unit 103, a state distribution model construction unit 104, a state distribution generation unit 110, a manufacturing quality prediction unit 111, a process search unit 112, and a user interface unit 113.
- functional units including a quality prediction model construction unit 101, a reaction characteristic model construction unit 102, a CAE simulation unit 103, a state distribution model construction unit 104, a state distribution generation unit 110, a manufacturing quality prediction unit 111, a process search unit 112, and a user interface unit 113.
- the quality prediction model construction unit 101 generates a quality prediction model 105 that predicts the quality of the product (end product) to be manufactured based on the specified experimental conditions and the reaction characteristics of the raw materials, based on the data from the small-scale experiment.
- the quality prediction model 105 is a model that receives data representing a state (temperature) and data representing a reaction process (experimental conditions 212 and reaction characteristics 213 of laboratory experiment data 21) to be performed on raw materials in that state, and outputs data representing the quality of the product generated from the raw materials in that reaction process. Note that in this embodiment, the quality prediction model 105 is assumed to be generated and stored in advance.
- the quality prediction model 105 is generated based on the laboratory experimental data 21. That is, the input values of the quality prediction model 105 are data corresponding to the experimental conditions 212 and the reaction characteristics 213 of the laboratory experimental data 21. The output values of the quality prediction model 105 are data corresponding to the quality 214 of the laboratory experimental data 21.
- the reaction characteristic model constructing section 102 generates a reaction characteristic model 106 .
- the reaction characteristic model 106 is a model that calculates the change in characteristics from the start to the end of a reaction in a large-scale test.
- the reaction characteristic model 106 is a model that uses the composition of raw materials, the reaction temperature, or the reaction time as input values, and uses the reaction rate, the reaction heat, or the solution viscosity as output values.
- the reaction characteristic model 106 is generated based on a predetermined machine learning algorithm on the basis of the lab experimental data 21.
- the reaction characteristic model 106 is a model trained by a neural network (CNN: Convolutional Neural Network, etc.) having, for example, an input layer to which an input value is input, one or more intermediate layers (hidden layers) that extract and output feature values from the input values, and an output layer that outputs output values from the feature values.
- CNN Convolutional Neural Network, etc.
- the reaction characteristic model 106 is generated by machine learning using, for example, the experimental conditions 212 (corresponding to the input values) and reaction characteristics 213 (corresponding to the output values) of the lab experimental data 21 as teacher data.
- reaction characteristic model 106 is generated and stored in advance.
- the reaction characteristic model 106 may be, for example, a mathematical formula with a predetermined reaction stoichiometric formula, chemical descriptors, or molecular weight distribution as input variables, and a reaction rate, reaction heat, or viscosity as output variables.
- the CAE simulation unit 103 stores a CAE simulation model 109.
- the CAE simulation unit 103 executes the CAE simulation model 109 to generate CAE simulation data 107.
- the CAE simulation model 109 is a model that predicts the fluid behavior inside a reactor in a large-scale test. Specifically, the CAE simulation model 109 uses the reactor specifications (shape, etc.) as input values and includes governing equations (Navier-Stokes equations) that calculate the state (temperature, viscosity, etc.) at each position at each time inside the reactor after the material movement process (fluid movement) in the reactor.
- the reactor specifications shape, etc.
- governing equations Naviier-Stokes equations
- the CAE simulation unit 103 executes a coupled simulation model that combines the CAE simulation model 109 and the reaction characteristics model 106.
- the coupled simulation model is a model in which data that defines the process (flow reaction process) of the raw materials distributed in the spatial domain of the reactor is input, and the state of the raw materials at each position in the reactor at each time after the start of the flow reaction process is output.
- reaction characteristic model construction unit 102 generates the coupled simulation model in advance based on the state distribution model database 115.
- the coupled simulation model may include a different type of simulation model from the models described above. For example, if the process for manufacturing a product includes an extrusion process, it may include a kneading simulation model. In addition, in a process that does not involve a chemical reaction (for example, a steel manufacturing process), the reaction characteristic model construction unit 102 and the reaction characteristic model 106 are not necessary, and the coupled simulation model may be composed of only the CAE simulation model 109.
- the state distribution model construction unit 104 generates a state distribution model 108 using the CAE simulation data 107 or the plant experiment data 22.
- the state distribution model 108 receives data on the composition of the raw materials (ingredients of the raw materials and their blending ratios) and data (process design parameters) that define the process to be performed on the raw materials present in the reactor, and outputs data that represents the non-uniformity of the state inside the reactor at each time after the start of the process (during or after the process is executed).
- the process design parameters in the input values are data that define the manufacturing process.
- they are the specifications of the equipment (shape or size, etc.) or the operating conditions (process method such as stirring method or cooling method, or time profile of the state for smooth reaction, etc.), but are not limited to these.
- the output value which is data representing the non-uniformity of the state distribution model 108, is a parameter of a state whose distribution may change or vary depending on the execution of the process, and becomes an input value of the quality prediction model 105.
- the output value of the state distribution model 108 is the temperature inside the reactor, but is not limited to this, and may be, for example, the concentration or density of the raw material or product in the reactor.
- the data representing the non-uniformity is a probability distribution (mean and variance), but data representing other non-uniformities may also be used.
- the state of each position in a three-dimensional space is calculated individually, but in this embodiment, the state (variation) of each position is expressed by a probability distribution, which is a parameter that can represent the state of each position as a whole, thereby reducing the cost associated with calculating the state of each position or storing data.
- the state distribution model 108 has a probability density function f 0 (y(t)) of a state (here, temperature), for example, expressed by the following equation 1, and further has the function of generating a state y(t) by sampling according to the probability density at time t.
- state y(t) is the state value at time t
- ⁇ (t) is the variance of state y(t) at time t
- ⁇ (t) is the average of state y(t) at time t.
- Equation 2 the time evolution of ⁇ (t) and ⁇ (t) is determined by the variance, mean, and process design parameters (external inputs) at past times prior to time t, as shown in Equation 2.
- ⁇ (t) is an external input at time t, and corresponds to a process design parameter.
- ⁇ (t) is a vector consisting of equipment specification data (fixed value data regardless of time t) and process operation amount (variable value depending on time t). d is the degree.
- Equation 1 and Equation 2 are for the case where state y is a single variable, similar descriptions are possible for multivariate cases.
- the state distribution generation unit 110 inputs the raw material composition (raw material mix, etc.) and the values of the process design parameters into the state distribution model 108 generated by the state distribution model construction unit 104, and outputs data (i.e., the mean and variance) that represent the distribution (non-uniformity) of the state inside the reactor at each time after the start of the process.
- data i.e., the mean and variance
- the manufacturing quality prediction unit 111 calculates (samples) multiple specific state values that can be taken inside the reactor from the data representing the distribution (non-uniformity) of states inside the reactor output by the state distribution generation unit 110, and predicts the quality of the product that will be generated after the process is completed by inputting the state data, the composition of the raw materials, and the process design parameters into the quality prediction model 105.
- the manufacturing quality prediction unit 111 randomly samples temperature data based on the mean and variance, and inputs the sampled temperature data into the quality prediction model 105 to predict quality (hardness and elongation), thereby identifying the quality variation (histogram or probability density function) in the target process.
- the process search unit 112 searches for process design parameter contents and raw material composition that will cause the quality predicted by the manufacturing quality prediction unit 111 to fall within a specified range.
- the process search unit 112 can search for process design parameter contents and raw material composition by performing optimization that considers quality variability and also considers specified KPIs or constraints to search for the probability (percentage) that the quality of the end product will fall within a specified range.
- the user interface unit 113 has a function (input function) of receiving parameters required for a series of processes performed by the design support system 1 from the user 40, and a function (output function) of providing the user 40 with calculation results, control results, etc.
- the input function accepts information input from the user 40 using, for example, a keyboard, a touch panel, a voice input device, a gaze detection device, etc.
- the output function outputs information via, for example, a monitor display, a printer, a voice synthesizer, etc.
- the user interface unit 113 may be provided in an information processing device different from the design support system 1.
- This information processing device is, for example, a personal computer such as a laptop type, notebook type, tablet type, or desktop type operated by the user 40, a smartphone, or a wearable terminal such as a goggle type or wristwatch type.
- the information processing device 200 includes, for example, a processor 201 (control device), a memory 202, an external storage device 203, a communication device 204, an output device 205, an input device 206, and a read/write device 207, and these devices are connected to each other via a communication line 208.
- the processor 201 is not limited to a CPU (Central Processing Unit), but may be other devices having a calculation function.
- the external storage device 203 is, for example, a device that stores a relatively large amount of data in a rewritable manner, such as a hard disk device, a flash memory device, an optical magnetic disk device, or an optical disk device.
- the communication device 204 is configured as a NIC (Network Interface Card), etc., and communicates with external devices via a communication network CN (a wireless or wired communication network such as the Internet, a LAN (Local Area Network), a WAN, or a dedicated line).
- the output device 205 is a device used by the user interface unit 113, such as a monitor display or a printer.
- the input device 206 is a device used by the user interface unit 113, such as a keyboard, a pointing device, or a touch panel.
- the read/write device 207 reads and writes information from a storage medium MM that non-temporarily stores a computer program.
- the communication line 208 may be a system bus that connects within one computer, or a communication network that connects multiple computers.
- the design support system 1 can be realized by providing the main functions of the design support system 1 on multiple computers and connecting these computers to each other via a communication network.
- the various data stored in the design support system 1 or used for processing can be used by the processor 201 reading it from the memory 202 or the external storage device 203.
- the functions of each functional unit possessed by the design support system 1 can be realized by the processor 201 loading a specific computer program stored in the external storage device 203 into the memory 202 and executing it.
- the above-mentioned specific computer program may be stored (downloaded) into the external storage device 203 from the storage medium MM via the read/write device 207 or from the network via the communication device 204, and then loaded onto the memory 202 and executed by the processor 201.
- the computer program may be loaded directly onto the memory 202 from the storage medium MM via the read/write device 207 or from the network via the communication device 204, and then executed by the processor 201.
- the design support system 1 is configured by one information processing device, but all or part of these functions may be distributed across one or more computers, such as a cloud, and each function of the design support system 1 may be realized by communicating with each other via a network. Next, the processing performed by the design support system 1 will be described.
- the process design parameter determination process (hereinafter referred to as the first process design parameter determination process) when generating a state distribution model 108 based on a CAE simulation model 109.
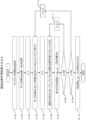
- FIG. 8 is a flow diagram illustrating an example of the first process design parameter determination processing.
- the design support system 1 sets fixed values of process design parameters assuming a plant experiment (S801).
- the user interface unit 113 may accept input of fixed values to be set in a large-scale test from the user 40, or may receive fixed values from a database prepared in advance.
- the user interface unit 113 sets the reactor shape to "cylinder,” the stirring blade shape to “propeller,” and the cooling method to "jacket” as fixed values of the process design parameters.
- the design support system 1 sets multiple combinations of various values based on the fixed values of the process design parameters, and executes a coupled simulation using the multiple combinations that have been set as input values (S802).
- the CAE simulation unit 103 receives input from the user 40 of various values of the process design parameters to be set in the large-scale test.
- the design support system 1 executes the coupled simulation by inputting each of the values set above into the coupled simulation model (CAE simulation model 109 and reaction characteristic model 106).
- the design support system 1 stores the data output by the coupled simulation model in CAE simulation data 107.
- the design support system 1 executes a state distribution model construction process S803 to generate a state distribution model 108 based on the CAE simulation data 107 stored in S802. Details of the state distribution model construction process S803 will be described later.
- the design support system 1 sets candidate values (external inputs ⁇ 0, ⁇ 1, ...) of the process design parameters in order to search for the process design parameters (S804).
- the design support system 1 may set a value obtained by adding a predetermined increase or decrease value to the nominal value of the condition value of the process design parameter (with noise added), or may accept input of an initial value from the user 40.
- the design support system 1 executes a state distribution generation process S805 in which the state distribution (average and variance) in the reactor is calculated by inputting the candidate values of the process design parameters set in S804 into the state distribution model 108 generated in S803 and executing the state distribution model 108.
- the details of the state distribution generation process S805 will be described later.
- FIG. 9 is a diagram showing an example of a state distribution model construction screen 1200 displayed by the design support system 1. As shown in FIG.
- the state distribution model construction screen 1200 has a precondition input field 1201 that accepts input of the raw material composition and fixed values of the process design parameters from the user, a design parameter input field 1202 that accepts input of combinations of values of the process design parameters from the user, and a state distribution model construction specification field 1203 that is specified by the user when generating a state distribution model 108 based on the data entered in the precondition input field 1201 and the design parameter input field 1202.
- the state distribution model construction screen 1200 also has a design parameter setting field 1208 that accepts input from the user of a combination of values of process design parameters to be used as input values for the generated state distribution model 108, a state distribution model execution specification field 1204 that is specified by the user when executing the state distribution model 108 based on the input values entered in the design parameter setting field 1208, a graph display field 1205 that displays a graph showing the execution results of the state distribution model 108, and a quality prediction display field 1206, which will be described later.
- a design parameter setting field 1208 that accepts input from the user of a combination of values of process design parameters to be used as input values for the generated state distribution model 108
- a state distribution model execution specification field 1204 that is specified by the user when executing the state distribution model 108 based on the input values entered in the design parameter setting field 1208, a graph display field 1205 that displays a graph showing the execution results of the state distribution model 108, and a quality prediction display field 1206, which will be described later.
- the graph displayed in the graph display field 1205 has time (elapsed time from the start of the reaction) on the horizontal axis and the state inside the reactor (here, temperature) on the vertical axis.
- This graph includes a first graph 1209 showing a range of state values and a second graph 1210 showing changes in the average value within that range.
- This graph also includes a time series graph (sample path graph 1211) of a virtual state (temperature) generated by connecting values 1212 sampled at each time from the range shown by the first graph 1209. The sampled values 1212 and the sample path will be described in detail later.
- the graph display field 1205 also displays a state limit value 1215 (in this figure, the upper limit of temperature). Details of the limit value 1215 will be described later.
- the design support system 1 executes a manufacturing quality prediction process S806 that predicts the quality of each product to be manufactured by inputting information on each state sampled from the distribution of states output in S805 into the quality prediction model 105.
- the manufacturing quality prediction process S806 will be described in detail later.
- the design support system 1 executes a process search processing step S807 to evaluate the quality of the process design parameters and raw material composition set in S804 from each quality (quality distribution) of the product predicted in the manufacturing quality prediction processing step S806.
- the process search unit 112 inputs the quality distribution, process design parameters, and raw material composition into a predetermined objective function that evaluates the quality of the process design parameters, etc., and obtains their values.
- the process search processing step S807 will be described in detail later.
- the process of S809 is executed, and if the change in the value of the objective function acquired in S807 exceeds the predetermined value (S808: NO), the process search unit 112 repeats the process of S804 to set different process design parameters.
- the optimization problem may be solved using other optimization methods, such as the greedy method or random search.
- the design support system 1 executes a state distribution model regeneration process S809 that updates the state distribution model 108 based on the process design parameters changed in the process search process S807. Details of the state distribution model regeneration process S809 will be described later. This completes the first process design parameter determination process.
- FIG. 10 is a flow diagram illustrating the state distribution model construction process S803 in detail.
- the CAE simulation unit 103 extracts one target process design parameter from the CAE simulation data 107 that meets the conditions set in S801 (S901).
- the CAE simulation unit 103 extracts data for a data ID in which the reactor shape is cylindrical, the stirring blade shape is a propeller, and the cooling method is a jacket from the CAE simulation data 107.
- the CAE simulation unit 103 acquires the simulation results 1074 (spatial distribution of temperature at each time) from the CAE simulation data 107 relating to the coupled simulation performed based on the process design parameters extracted in S901 and the set raw material configuration (raw material mix) (S902).
- the CAE simulation unit 103 randomly samples multiple positions from the simulation result 1074 obtained in S902, obtains the temperature time series at the multiple positions, and generates multiple virtual temperature time series (sample paths), and stores the generated sample paths as learning data (S903).
- the CAE simulation unit 103 may perform sampling automatically, or may accept a specification of the data to be sampled (sampled values 1212) from the user 40 on the state distribution model construction screen 1200.
- the number of data to be sampled at each time may be constant, or may be a number according to the variance.
- the CAE simulation unit 103 generates a stochastic process model for state values y(t 0 )...y(t n-1 ) at each time point t as shown in Equation 3-5 based on the learning data stored in S903 (S904).
- This identification can be performed using a stochastic identification method such as Gaussian process regression.
- N N is an N-dimensional normal distribution
- Equation 4 is the mean of each time point
- Equation 5 is the covariance matrix between time points.
- ⁇ is the mean
- V is the variance.
- the CAE simulation unit 103 checks whether all target process design parameters have been extracted in S901 (S905). If all target process design parameters have been extracted in S901 (S905: YES), the CAE simulation unit 103 executes the process of S906, and if there are process design parameters that have not been extracted in S901 (S905: NO), the CAE simulation unit 103 repeats the process of S902 to select those process design parameters.
- the CAE simulation unit 103 identifies the state distribution model 108 shown in Equation 6 based on the stochastic process model generated by the above processing, the state (mean ⁇ (t), variance V(t, t)) obtained from S902, and the process design parameters (external input data) (S906). This ends the state distribution model construction processing S803.
- the state distribution model 108 can be identified by a general system identification method, such as ARX model identification or Hammerstein-Wiener model identification. This makes it possible to grasp how the state distribution changes when the process design parameters change.
- the component (first component) related to the mean ⁇ (t) in Equation 6 can also be identified by determining the structure of a differential equation from a theoretical equation for reaction heat based on the energy balance law and reaction rate equations, and estimating its parameters using the mean ⁇ (t), variance V(t, t), and external input data.
- the range of values that the mean ⁇ (t) can take is limited, so it is expected that it will also be easier to predict state distributions for process design parameters in unknown areas (i.e., areas where CAE simulation has not been performed).
- FIG. 11 is a flow diagram illustrating details of the state distribution generation process S805.
- the state distribution generation unit 110 acquires the process design parameters acquired in S804 as external inputs (S1001).
- the state distribution generation unit 110 also sets initial values for the state (temperature) distribution (mean ⁇ (t) and variance V(t, t)) (S1002).
- the initial value for the state (temperature) average is set to, for example, the initial condition at the time of product manufacture (initial temperature, etc.).
- the initial value for the state (temperature) variance is set to zero since there is no unevenness.
- the state distribution generation unit 110 calculates the average and variance of the state (temperature) at each time by integrating the state distribution model shown in Equation 6 in the time direction based on the initial values of the external input and state (temperature) distribution set in S1001 and S1002, respectively (S1003). This ends the state distribution generation process S805.
- FIG. 12 is a flow diagram illustrating the details of the manufacturing quality prediction process S806.
- the manufacturing quality prediction unit 111 sets the number of sampling times Ns (S1101).
- the number of sampling times is the number of times to sample the state value at each time.
- the manufacturing quality prediction unit 111 sets the number of sampling times Ns, for example, by reading values recorded in a setting file created in advance by the user 40.
- the product quality prediction unit 111 also sets the total number Nt of times (sample time points) for which quality prediction is performed and the sample time points ( T1 , T2 , ..., TNt ). Specifically, the product quality prediction unit 111 specifies the possible range of sample time points (time range from the start of the reaction to the end of the reaction) based on the reaction time in the laboratory experiment data 21. The product quality prediction unit 111 then sets Nt by accepting input of each sample time point within this range from the user 40.
- the manufacturing quality prediction unit 111 sets the index i for counting sampling to 1 (S1103) and executes the process of S1104.
- the manufacturing quality prediction unit 111 sets the index j for the sample time to 1 (S1105) and executes the process of S1106.
- the production quality prediction unit 111 inputs the state value y( tj ) at the sample time Tj and a preset composition of the raw materials into the quality prediction model 105 and executes the quality prediction model 105 to calculate (predict) the quality Q of the product.
- Q is [ q1 , q2 , ..., qk ] T
- qk is the value of the quality k (e.g., hardness, elongation) at the completion of the process.
- the manufacturing quality prediction unit 111 stores the calculated quality Q (S1107).
- the manufacturing quality prediction unit 111 outputs the distribution of quality Q calculated by the above process in the form of a histogram, probability density function, etc. (S1110).
- the manufacturing quality prediction unit 111 displays a graph 1213 relating to hardness and a graph 1214 relating to elongation in the quality prediction display field 1206 of the state distribution model construction screen 1200.
- the graph 1213 relating to hardness is a graph with the hardness value on the horizontal axis and the probability (probability density) of the occurrence of that hardness value on the vertical axis.
- the graph 1214 relating to elongation is a graph with the elongation value on the horizontal axis and the probability (probability density) of the occurrence of that elongation value on the vertical axis.
- FIG. 13 is a flow diagram illustrating the process search processing S807 in detail.
- the process search unit 112 acquires data indicating the range of acceptable products (the range of required product quality) (S1301).
- the process search unit 112 accepts input of the upper limit and the lower limit of the range of non-defective products from the user 40.
- the process search unit 112 accepts input of the upper limit (q1 ,max , q2 ,max ) and the lower limit (q2 ,max , q2 ,min ) of the hardness q1 and the elongation q2 from the user 40.
- the process search unit 112 calculates the defect rate (P(q1), P( q2) , ...), which is the probability (proportion) that each quality q1 , q2, ... falls outside the range of non-defective products, based on the quality Q calculated in the manufacturing quality prediction process S806 and the range of non-defective products acquired in S1301 (S1302).
- the process search unit 112 calculates the defect rate using the following formula 7.
- the process search unit 112 Based on the defect rate calculated in S1302, the process search unit 112 generates an objective function whose value decreases as the defect rate decreases, and a constraint condition equation related to the objective function. In this embodiment, the process search unit 112 generates an objective function related to each defect rate shown in the following formula 8, and a constraint condition equation related to the state of the device shown in formula 9.
- ⁇ is an external input
- Tmin is the minimum temperature
- Tmax is the maximum temperature
- T is the temperature.
- T may be the average temperature, the maximum temperature (used for comparison with Tmax), or the minimum temperature (used for comparison with Tmin).
- the process search unit 112 may automatically generate the objective function and the constraint condition equation, or may accept input of the objective function and the constraint condition equation from the user 40.
- the process search unit 112 performs a search calculation to change the external inputs ⁇ 0 , ⁇ 1 , ... so that the value of the objective function is minimized while satisfying the constraint condition equation (S1303).
- the change of the external input ⁇ in the search calculation can be performed, for example, by storing the calculated value of the objective function, calculating the gradient with respect to the external inputs ⁇ 0 , ⁇ 1 , ..., and changing the external inputs ⁇ 0 , ⁇ 1 , ... in the direction in which the gradient is steepest.
- reactor shape, agitator shape, cooling method, raw material combination, and blending ratio are fixed and process design parameters are searched for.
- these may also be searched for.
- the reactor shape, agitator shape, cooling method, and raw material combination are generally discrete variables, so the optimization problem shown in S1303 becomes a mixed integer programming problem. For this reason, it will be executed using a solver different from the one shown in this embodiment.
- FIG. 14 is a diagram showing an example of a process search screen 1400 displayed on the design support system 1 in the process search processing S807.
- the process search screen 1400 includes a quality range input section 1401 that accepts input of the quality range (upper and lower limits) of the product for each type of quality from the user 40, an objective function definition section 1402 that displays the objective function or attaches input of the objective function from the user 40, a constraint condition definition section 1403 that displays information required for generating the constraint condition formula (e.g., the range (upper and lower limits) of the state (temperature)) or accepts input of information required for generating the constraint condition formula from the user 40, and a process search execution section 1404 that is selected by the user when executing a search calculation.
- a quality range input section 1401 that accepts input of the quality range (upper and lower limits) of the product for each type of quality from the user 40
- an objective function definition section 1402 that displays the objective function or attaches input of the objective function from the user 40
- a constraint condition definition section 1403 that displays information required for generating the constraint condition formula (e.g., the range (upper and lower limits)
- the process search screen 1400 also includes a graph display section 1405 that displays a graph of the distribution of each quality of the product calculated during the search calculation process, a defect rate display section 1406 that displays the defect rate calculated during the search calculation process, and a process design parameter display section 1407 that displays the values of the process design parameters calculated by the search calculation.
- Graph display section 1405 displays graph 1408 for each type of product quality, with the horizontal axis representing the quality value and the vertical axis representing the probability (probability density) of that quality value. Graph 1408 also displays the range (upper and lower limits) of each quality.
- FIG. 15 is a flow diagram illustrating details of the state distribution model regeneration process S809.
- the user After executing the process search process S807, the user refers to the process search screen 1400 to check the predicted quality of the product to be manufactured, and determines the process design parameters (e.g., specifications of the actual plant equipment) to be set in the large-scale test, and performs test manufacturing or actual manufacturing of the product (S1501).
- process design parameters e.g., specifications of the actual plant equipment
- the process search unit 112 records the manufactured product and the adopted process design parameters in the manufacturing performance data 23 described below (S1502).
- the process search unit 112 may accept data input from the user 40, or may automatically acquire data from a predetermined experiment management system (for example, a DCS that operates the reactor 30).
- the production history data 23 stores a data ID 231, a product type 232 which is the type of raw material of the product, a model 233 which is data on the specifications of the device used to manufacture the product, operation data 234 which is data on the operating conditions used in manufacturing the product, and quality 235 of the manufactured product in association with each other.
- the product type 232 is data on the combination of the composition (mixture) of the raw materials.
- the operation data 234 is, for example, time-series data on the target value given to the control device, the operation amount given to the process by the control device, or the controlled amount that is the object of the control of the process.
- the target value is the target temperature of the reactor
- the operation amount is the cold water temperature of the jacket for temperature control
- the controlled amount is the temperature (i.e., the state) inside the reactor.
- Quality 235 is not necessarily specific to each production run of a product, but is data only for the product that was inspected. In general, there is variation in quality inspection values, so a range can be stored.
- the hardness range of the product quality falls outside the acceptable range set in S1301.
- the state distribution model 108 generated in the state distribution model regeneration process S809 is unreliable.
- the process search unit 112 modifies the process design parameters based on the specification from the user 40 or automatically (S1503).
- the process search unit 112 adds the manufacturing performance data 23 and the process design parameters linked thereto to the plant experiment data 22, and re-learns the state distribution model 108 based on the plant experiment data 22 to which the data has been added, to regenerate a new state distribution model 108.
- the process search unit 112 executes the process search process S807 again based on the new state distribution model 108.
- the accuracy of the state distribution model 108 and the prediction of product quality improves as actual manufacturing is repeated, enabling the user 40 to make appropriate designs without having to repeat trial-and-error simulations.
- the process design parameter determination process (hereinafter referred to as the second process design parameter determination process) when generating the state distribution model 108 based on the plant experiment data 22 instead of the CAE simulation model 109.
- FIG. 17 is a flow diagram illustrating an example of the second process design parameter determination processing.
- S1701 The processing of S1701 is the same as S801 in the first process design parameter determination processing.
- the design support system 1 acquires data on the results of the conducted plant experiment (measurement data from thermometers 51 to 55) from the reactor 30, and stores the acquired data in the plant experiment data 22 (S1702).
- the state distribution model construction unit 104 generates the state distribution model 108 based on the plant experiment data 22 in the same manner as in S803 (S1703).
- the subsequent processing of S1704 to S1708 is the same as the processing of S804 to S808.
- the state distribution model 108 may be generated based on both the CAE simulation model 109 and the plant experiment data 22. In this case, the time granularity of both data is made to match.
- the design support system 1 of this embodiment calculates values (average and variance) representing the non-uniformity of the state in the reactor based on the temperature at each position inside the reactor when the raw materials distributed in the reactor (specifically, the spatial domain of the reactor 30 used in the experiment or the spatial domain set in the coupled simulation) are processed, and generates a state distribution model 108 into which process design parameters are input based on the calculated values representing the non-uniformity and the data defining the process, and data (average and variance) representing the non-uniformity of the state in the reactor after the process is output.
- the design support system 1 then inputs the set process design parameter values into the state distribution model 108 to obtain data values representing the non-uniformity of the state in the reactor during or after the process is executed, samples a plurality of states that can be taken in the reactor from the values of the data (average and variance) representing the non-uniformity, and inputs the sampled state data and the process design parameter values for each state into the quality prediction model 105 to obtain the quality parameters (hardness and elongation) of the product. Then, based on each quality parameter, the design support system 1 changes the values of the process design parameters so that the product quality falls within a specified range.
- the design support system 1 predicts the quality of the product by inputting the process design parameters and the values of each state data sampled from the random variables into the quality prediction model 105 and running it, and can determine appropriate values for the process design parameters based on this quality data.
- the quality prediction model 105 which is based on small-scale experiments, for example, and the process design parameters can be determined based on this.
- the design support system 1 of this embodiment makes it possible to design processes for producing deliverables of appropriate quality in processes for producing deliverables that are carried out at different scales. For example, it becomes possible to design processes that keep quality-related KPIs within a specified range while limiting the number of experiments or simulations performed in each process and the number of re-experiments in small-scale processes, leading to reduced lead times in scale-up operations.
- the design support system 1 of this embodiment generates a state distribution model 108 into which at least one of the composition of the raw materials, the specifications of the equipment used in the process, or the operating conditions of the equipment used in the process is input.
- the design support system 1 of this embodiment stores a quality prediction model 105 related to a process that is carried out on a smaller scale than the process related to the process design parameters in the state distribution model 108.
- the design support system 1 of this embodiment calculates the variability (probability density) of the quality of the deliverable and the probability (defect rate) that the quality is within a specified range based on the quality parameters of each state obtained by executing the state distribution model 108, and outputs information on the calculated probability distribution and defect rate (graph display section 1405 of the process search screen 1400).
- the design support system 1 of this embodiment changes the values of the process design parameters based on each quality parameter of each state obtained by executing the state distribution model 108 so that the quality of the end product obtained from the raw materials falls within a specified range and satisfies specified constraints (operating conditions, constraint conditions), and outputs information regarding the range of the quality of the end product when the values of the process design parameters are changed (graph display section 1405 or defect rate display section 1406 of the process search screen 1400).
- the design support system 1 of this embodiment acquires the state of each position in the reactor during and after the process is executed by inputting the contents of the process performed on the raw materials into a coupled simulation model, calculates values (average and variance) representing the non-uniformity based on the acquired state of each position inside the reactor, and generates a state distribution model 108 based on the calculated values representing the non-uniformity.
- the state distribution model 108 can be easily generated.
- the design support system 1 of this embodiment calculates values (mean and variance) representing the non-uniformity based on the state of each position in the reactor during or after the execution of a specified process (plant experiment), and generates a state distribution model 108 based on the calculated values representing the non-uniformity.
- design support system 1 of this embodiment generates a state distribution model 108 by Gaussian process regression.
- the design support system 1 of this embodiment acquires product quality data after test manufacturing or actual manufacturing is performed using the changed process design parameters, generates new process parameters based on the acquired quality data, and regenerates the state distribution model 108 based on the generated parameters.
- the prediction accuracy of the state of the state distribution model 108 can be improved.
- design support system 1 of this embodiment further changes the values of the process design parameters that were previously set based on the regenerated state distribution model 108.
- the accuracy of the state distribution model 108 and the prediction of product quality improves, making it possible to design appropriate process design parameters without repeating trial-and-error simulations.
- design support system 1 of this embodiment processes processes including reaction processes performed on raw materials.
- the design support system 1 of this embodiment receives data that defines the reaction process of the raw materials distributed in the reactor, and generates a coupled simulation model that includes a reaction characteristics model 106 that outputs the state of the raw materials at each position in the reactor during and after the reaction process is being executed.
- the quality prediction model 105 of this embodiment is a model to which data representing the composition of the raw materials (mixing ratio, etc.) is further input, and the design support system 1 obtains product quality parameters by further inputting the data representing the composition of the raw materials into the quality prediction model 105, and changes the process design parameters and the composition of the raw materials.
- the present invention is not limited to the above-described embodiments, and can be implemented using any components without departing from the spirit of the invention.
- the above-described embodiments and modifications are merely examples, and the present invention is not limited to these contents as long as the characteristics of the invention are not impaired.
- the present invention is not limited to these contents.
- Other aspects conceivable within the scope of the technical concept of the present invention are also included within the scope of the present invention.
- each device of this embodiment may be provided in other devices.
- each program of each device may be provided in another device, a program may consist of multiple programs, or multiple programs may be integrated into a single program.
- operating conditions other than those described in this embodiment may be used as process design parameters.
- target values in the production performance data 23 such as the target temperature of the reactor
- process design parameters may be used as process design parameters.
- Operating conditions are generally defined as a time series, but the state distribution model 108 defined by Equation 6 to Equation 8 can accept external inputs for each time, so various operating conditions can be included in the process design parameters and process design parameters can be searched for.
Landscapes
- Engineering & Computer Science (AREA)
- Physics & Mathematics (AREA)
- General Physics & Mathematics (AREA)
- Automation & Control Theory (AREA)
- Health & Medical Sciences (AREA)
- Artificial Intelligence (AREA)
- Computer Vision & Pattern Recognition (AREA)
- Evolutionary Computation (AREA)
- Medical Informatics (AREA)
- Software Systems (AREA)
- Management, Administration, Business Operations System, And Electronic Commerce (AREA)
- Testing And Monitoring For Control Systems (AREA)
Priority Applications (2)
| Application Number | Priority Date | Filing Date | Title |
|---|---|---|---|
| CN202480015384.6A CN120813911A (zh) | 2023-05-31 | 2024-04-30 | 设计辅助系统以及设计辅助方法 |
| EP24815079.9A EP4653969A1 (en) | 2023-05-31 | 2024-04-30 | Design assistance system and design assistance method |
Applications Claiming Priority (2)
| Application Number | Priority Date | Filing Date | Title |
|---|---|---|---|
| JP2023-090509 | 2023-05-31 | ||
| JP2023090509A JP2024172655A (ja) | 2023-05-31 | 2023-05-31 | 設計支援システム、及び設計支援方法 |
Publications (1)
| Publication Number | Publication Date |
|---|---|
| WO2024247595A1 true WO2024247595A1 (ja) | 2024-12-05 |
Family
ID=93657397
Family Applications (1)
| Application Number | Title | Priority Date | Filing Date |
|---|---|---|---|
| PCT/JP2024/016704 Ceased WO2024247595A1 (ja) | 2023-05-31 | 2024-04-30 | 設計支援システム、及び設計支援方法 |
Country Status (4)
| Country | Link |
|---|---|
| EP (1) | EP4653969A1 (https=) |
| JP (1) | JP2024172655A (https=) |
| CN (1) | CN120813911A (https=) |
| WO (1) | WO2024247595A1 (https=) |
Cited By (1)
| Publication number | Priority date | Publication date | Assignee | Title |
|---|---|---|---|---|
| CN120893912A (zh) * | 2025-09-26 | 2025-11-04 | 江西省天驰高速科技发展有限公司 | 一种高速公路热熔标线质量分析方法及系统 |
Citations (3)
| Publication number | Priority date | Publication date | Assignee | Title |
|---|---|---|---|---|
| JP2019152986A (ja) * | 2018-03-01 | 2019-09-12 | 国立研究開発法人産業技術総合研究所 | 探索装置、探索方法及び製造システム |
| JP2022500778A (ja) * | 2018-09-18 | 2022-01-04 | バイエル、アクチエンゲゼルシャフトBayer Aktiengesellschaft | 製造工程の生成物である化合物および/または化合物製剤の品質を予測するシステムおよび方法 |
| JP2022092297A (ja) * | 2020-12-10 | 2022-06-22 | 昭和電工マテリアルズ株式会社 | 設計支援装置、設計支援方法及び設計支援プログラム |
Family Cites Families (1)
| Publication number | Priority date | Publication date | Assignee | Title |
|---|---|---|---|---|
| JP7564081B2 (ja) | 2021-12-17 | 2024-10-08 | 株式会社クボタ | 自動走行制御システム |
-
2023
- 2023-05-31 JP JP2023090509A patent/JP2024172655A/ja active Pending
-
2024
- 2024-04-30 CN CN202480015384.6A patent/CN120813911A/zh active Pending
- 2024-04-30 EP EP24815079.9A patent/EP4653969A1/en active Pending
- 2024-04-30 WO PCT/JP2024/016704 patent/WO2024247595A1/ja not_active Ceased
Patent Citations (3)
| Publication number | Priority date | Publication date | Assignee | Title |
|---|---|---|---|---|
| JP2019152986A (ja) * | 2018-03-01 | 2019-09-12 | 国立研究開発法人産業技術総合研究所 | 探索装置、探索方法及び製造システム |
| JP2022500778A (ja) * | 2018-09-18 | 2022-01-04 | バイエル、アクチエンゲゼルシャフトBayer Aktiengesellschaft | 製造工程の生成物である化合物および/または化合物製剤の品質を予測するシステムおよび方法 |
| JP2022092297A (ja) * | 2020-12-10 | 2022-06-22 | 昭和電工マテリアルズ株式会社 | 設計支援装置、設計支援方法及び設計支援プログラム |
Non-Patent Citations (1)
| Title |
|---|
| See also references of EP4653969A1 * |
Cited By (1)
| Publication number | Priority date | Publication date | Assignee | Title |
|---|---|---|---|---|
| CN120893912A (zh) * | 2025-09-26 | 2025-11-04 | 江西省天驰高速科技发展有限公司 | 一种高速公路热熔标线质量分析方法及系统 |
Also Published As
| Publication number | Publication date |
|---|---|
| CN120813911A (zh) | 2025-10-17 |
| EP4653969A1 (en) | 2025-11-26 |
| JP2024172655A (ja) | 2024-12-12 |
Similar Documents
| Publication | Publication Date | Title |
|---|---|---|
| Yuan et al. | Smart manufacturing for the oil refining and petrochemical industry | |
| CN116802741A (zh) | 逆合成系统和方法 | |
| Ge | Active learning strategy for smart soft sensor development under a small number of labeled data samples | |
| JP6484449B2 (ja) | 予測装置、予測方法および予測プログラム | |
| Idoko et al. | Mathematical modeling and simulations using software like MATLAB, COMSOL and Python | |
| Dinh et al. | Dynamic operability analysis for process design and control of modular natural gas utilization systems | |
| Hänsch et al. | A workflow for the sustainable development of closure models for bubbly flows | |
| Papavasileiou et al. | Equation-based and data-driven modeling strategies for industrial coating processes | |
| CN107516148B (zh) | 系统建模优化方法及存储介质 | |
| Buisson et al. | Towards an integrated machine-learning framework for model evaluation and uncertainty quantification | |
| WO2024247595A1 (ja) | 設計支援システム、及び設計支援方法 | |
| JP7559762B2 (ja) | 情報処理装置、情報処理方法、及びプログラム | |
| Zhao et al. | Using machine-learning-aided computational fluid dynamics to facilitate design of experiments | |
| Jia et al. | Hybrid of simulated annealing and SVM for hydraulic valve characteristics prediction | |
| Lejarza et al. | Discovering governing equations via moving horizon learning: The case of reacting systems | |
| Agarwal et al. | Parameter identification and uncertainty propagation of hydrogel coupled diffusion-deformation using POD-based reduced-order modeling | |
| Miao et al. | Surrogate model development for digital experiments in welding | |
| Heitzig et al. | Computer-aided modeling framework for efficient model development, analysis, and identification: Combustion and reactor modeling | |
| Rojek et al. | Chemical mixing simulations with integrated AI accelerator | |
| Frömbgen et al. | Uncertainty quantification for in silico chemistry | |
| Agarwal et al. | Generating data-driven models from molecular-level kinetic models: A kinetic model speedup strategy | |
| Oubari et al. | A Meta-VAE for Multi-component Industrial Systems Generation | |
| JP2024018309A (ja) | 設計支援装置、設計支援方法及び設計支援プログラム | |
| Schoeneberger et al. | Explaining and integrating machine learning models with rigorous simulation | |
| Ulissi et al. | Practical Application of Machine Learning in Catalysis |
Legal Events
| Date | Code | Title | Description |
|---|---|---|---|
| 121 | Ep: the epo has been informed by wipo that ep was designated in this application |
Ref document number: 24815079 Country of ref document: EP Kind code of ref document: A1 |
|
| WWE | Wipo information: entry into national phase |
Ref document number: 202480015384.6 Country of ref document: CN |
|
| WWP | Wipo information: published in national office |
Ref document number: 202480015384.6 Country of ref document: CN |
|
| WWP | Wipo information: published in national office |
Ref document number: 2024815079 Country of ref document: EP |
|
| NENP | Non-entry into the national phase |
Ref country code: DE |