WO2024214260A1 - 解析装置、解析方法及び解析プログラム - Google Patents
解析装置、解析方法及び解析プログラム Download PDFInfo
- Publication number
- WO2024214260A1 WO2024214260A1 PCT/JP2023/015088 JP2023015088W WO2024214260A1 WO 2024214260 A1 WO2024214260 A1 WO 2024214260A1 JP 2023015088 W JP2023015088 W JP 2023015088W WO 2024214260 A1 WO2024214260 A1 WO 2024214260A1
- Authority
- WO
- WIPO (PCT)
- Prior art keywords
- symbol table
- virtual machine
- analysis
- execution
- instruction
- Prior art date
- Legal status (The legal status is an assumption and is not a legal conclusion. Google has not performed a legal analysis and makes no representation as to the accuracy of the status listed.)
- Ceased
Links
Images










Classifications
-
- G—PHYSICS
- G06—COMPUTING OR CALCULATING; COUNTING
- G06F—ELECTRIC DIGITAL DATA PROCESSING
- G06F11/00—Error detection; Error correction; Monitoring
- G06F11/30—Monitoring
- G06F11/34—Recording or statistical evaluation of computer activity, e.g. of down time, of input/output operation ; Recording or statistical evaluation of user activity, e.g. usability assessment
-
- G—PHYSICS
- G06—COMPUTING OR CALCULATING; COUNTING
- G06F—ELECTRIC DIGITAL DATA PROCESSING
- G06F21/00—Security arrangements for protecting computers, components thereof, programs or data against unauthorised activity
- G06F21/50—Monitoring users, programs or devices to maintain the integrity of platforms, e.g. of processors, firmware or operating systems
- G06F21/55—Detecting local intrusion or implementing counter-measures
- G06F21/56—Computer malware detection or handling, e.g. anti-virus arrangements
Definitions
- the present invention relates to an analysis device, an analysis method, and an analysis program.
- Script analysis techniques are used for a variety of purposes, such as compiler optimization for just-in-time (JIT) compilation, software testing and debugging, fuzzing, and malware analysis.
- variable information is one of the important elements in analyzing a script. What variables a script holds when it is executed is important information for understanding the function of the script.
- variable information here includes information such as how many variables there are in what scope, what values each variable holds, which code section reads and writes to which variable, etc. To obtain this type of variable information, it is necessary to analyze the script.
- analysis support functions such as debuggers and bytecode disassemblers are provided, and in some cases they can be used. However, if such functions are not available, it is necessary to analyze the script independently to obtain variable information, which is not easy.
- Dynamic analysis is a technique that analyzes the behavior of the program by actually executing it and observing its behavior.
- Static analysis is a technique that analyzes the function of the program by interpreting its meaning without executing it. These analysis techniques are used to obtain branch information.
- obfuscation involves applying conversions that make a program difficult to interpret, primarily to hinder static analysis.
- part of the script is encoded or encrypted, and then dynamically decoded or decrypted at run time before execution. In such cases, the type of script that will be executed is not clear until execution time. This makes static analysis of the script difficult.
- Script execution method Scripts are executed by a crypto engine (also called an interpreter). Scripts are generally converted into bytecodes at runtime, and the bytecodes are interpreted and executed by a virtual machine (VM). For this reason, scripts are analyzed before execution, and the bytecodes are analyzed at execution.
- a crypto engine also called an interpreter
- VM virtual machine
- a symbol table is a table that stores information such as the names of variables and subroutines, and is created in the semantic analysis phase.
- a symbol table in a script engine generally holds information on name, type (variable, subroutine, etc.), scope, attributes (depending on the type, e.g., constant, variable, type, etc.), and value. Access to such a symbol table is realized through a VM command prepared for that purpose (hereinafter referred to as a symbol table VM command).
- the first is the memory location of the symbol table and the code that allocates the memory area for the symbol table.
- the second is the structure of the symbol table.
- the third is a list of the opcodes of the symbol table VM instructions.
- the fourth is the operands of the symbol table VM instructions, in particular which operands are responsible for identifying the scope and variables.
- Non-Patent Document 1 a method has been proposed to analyze executable binary programs and restore the data structure. According to the method described in Non-Patent Document 1, it is possible to restore part of the symbol table and obtain variable information.
- Non-Patent Document 1 does not target the symbol table held by the script engine, and does not realize the structure of the symbol table specific to scripts or the analysis of the symbol table VM commands mentioned above, so there is an issue that it cannot be directly applied.
- the present invention has been made in consideration of the above, and aims to provide an analysis device, analysis method, and analysis program that can analyze the symbol table of a VM and analyze VM commands that access the symbol table, even for script engines of a wide variety of script languages whose specifications are unknown, and obtain information on variables managed by the symbol table.
- the analysis device of the present invention is characterized by having a first analysis unit that analyzes the virtual machine of the script engine based on an execution trace obtained by executing a test script while monitoring the binary of the script engine, and detects a symbol table that holds information about variables based on the analysis result, and a second analysis unit that analyzes the virtual machine of the script engine, collects virtual machine instructions based on the analysis result, and analyzes the collected virtual machine instructions based on the analysis result.
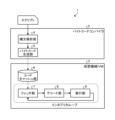
- FIG. 1 is a diagram illustrating an example of the configuration of a script engine.
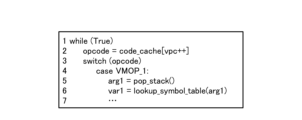
- FIG. 2 is a diagram showing pseudo code of a VM included in the script engine.
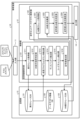
- FIG. 3 is a diagram illustrating an example of a configuration of an analysis device according to an embodiment.
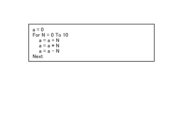
- FIG. 4 is a diagram showing an example of a first test script used for detecting a virtual program counter (VPC).
- FIG. 5 is a diagram showing an example of the second test script.
- FIG. 6 is a diagram showing an example of the third test script.
- FIG. 7 is a diagram showing an example of the fourth test script.
- FIG. 8 is a diagram showing an example of the fourth test script.
- FIG. 9 illustrates an example of an execution trace.
- FIG. 10 is a diagram illustrating an example of a VM execution trace.
- FIG. 10 is a diagram illustrating an example of a VM execution trace.
- FIG. 11 is a diagram showing an example of the structure of a symbol table.
- FIG. 12 is a diagram for explaining the processing of the symbol table detection unit.
- FIG. 13 is a diagram for explaining the processing of the symbol table VM command analysis unit.
- FIG. 14 is a diagram for explaining the processing of the symbol table VM command analysis unit.
- FIG. 15 is a diagram illustrating the process of the VM instruction boundary detection unit.
- FIG. 16 is a diagram illustrating the process of the virtual program counter detection unit.
- FIG. 17 is a diagram illustrating the process of the dispatcher detection unit.
- FIG. 18 is a diagram illustrating the process of the code cache detection unit.
- FIG. 19 is a flowchart illustrating a processing procedure of the analysis process according to the embodiment.
- FIG. 12 is a diagram for explaining the processing of the symbol table detection unit.
- FIG. 13 is a diagram for explaining the processing of the symbol table VM command analysis unit.
- FIG. 14 is a diagram for explaining the processing of the symbol table
- FIG. 20 is a flowchart illustrating the procedure of the execution trace acquisition process shown in FIG.
- FIG. 21 is a flowchart illustrating a processing procedure of the VM instruction boundary detection processing illustrated in FIG.
- FIG. 22 is a diagram for explaining the process of the virtual program counter detection unit shown in FIG.
- FIG. 23 is a diagram for explaining the process of the dispatcher detection unit shown in FIG.
- FIG. 24 is a flowchart illustrating the processing procedure of the code cache detection processing shown in FIG.
- FIG. 25 is a flowchart showing the processing procedure of the symbol table detection processing shown in FIG.
- FIG. 26 is a flowchart illustrating the procedure of the VM execution trace acquisition process illustrated in FIG. 19 .
- FIG. 27 is a flowchart illustrating the procedure of the VM command collection process illustrated in FIG.
- FIG. 28 is a flowchart showing the processing procedure of the symbol table VM command determination processing shown in FIG.
- FIG. 29 is a flowchart showing the processing procedure of the symbol table VM command analysis processing shown in FIG.
- FIG. 30 is a flowchart showing the processing procedure of the symbol table VM command analysis processing shown in FIG.
- FIG. 31 is a diagram illustrating an example of a computer that implements the analysis device by executing a program.
- An analysis device executes a test script while monitoring the binary of a script engine, and acquires a branch trace and a memory access trace as an execution trace.
- the analysis device analyzes a virtual machine (VM) based on the execution trace, and acquires, as architecture information, a VM instruction boundary, a virtual program counter (VPC), a dispatcher, and a code cache in which executed VM instructions are stored. Then, the analysis device detects a symbol table that holds information about variables based on the analysis result of the VM of the script engine.
- VM virtual machine
- VPC virtual program counter
- the analysis device analyzes the instruction set architecture, which is the system of instructions for the virtual machine.
- the analysis device executes the test script while monitoring the VPC and dispatcher, and obtains a VM execution trace.
- the analysis device collects VM instructions by analyzing the VM execution trace. Of the collected VM instructions, the analysis device determines which symbol table VM instructions access a symbol table based on the results of the VM analysis of the script engine, and analyzes the access destination of the symbol table VM instruction. In this way, the analysis device obtains information on variables managed by the symbol table.
- Figure 1 is a diagram for explaining an example of the configuration of a script engine.
- script engine 1 has a bytecode compiler 2 and a VM 3.
- bytecode compiler 2 has a syntax analysis unit 4 and a bytecode generation unit 5.
- VM 3 has a code cache unit 6, a fetch unit 7, a decode unit 8, and an execution unit 9. These fetch unit 7, decode unit 8, and execution unit 9 are executed repeatedly and are called an interpreter loop. Then, script engine 1 accepts the input of a script.
- the syntax analysis unit 4 receives the script as input, and through lexical and syntactic analysis generates an Abstract Syntax Tree (AST), which it outputs to the bytecode generation unit 5.
- the bytecode generation unit 5 receives the AST as input, converts it into bytecode, and stores it in the code cache unit 6.
- the fetch unit 7 fetches the VM opcode from the code cache unit 6 and outputs it to the decode unit 8.
- the VM opcode refers to the opcode portion of the VM instruction.
- the decode unit 8 receives the VM opcode as input, interprets the VM opcode using a decoder/dispatcher, and dispatches it to the corresponding program.
- the execution unit 9 executes the program corresponding to the VM instruction. The contents written in the script are executed by executing the VM instructions one after another through a repeated interpreter loop.
- FIG 2 is a diagram showing pseudocode of the VM of the script engine.
- the pseudocode first initializes the VPC (line 1).
- the while loop is the interpreter loop (lines 2 to 7).
- the fetch unit 7 obtains the VM opcode of the VM instruction at the position pointed to by the VPC in the code cache that holds the bytecode (line 3).
- the decoder uses a Switch statement to interpret the VM instruction (line 4), and the dispatcher calls the instruction handler based on the VM opcode (lines 5 and on).
- the instruction handler then performs the operation corresponding to the instruction. Input and output are performed using a virtual stack and virtual registers (line 6), and constants and variables are referenced via a symbol table (line 7).
- Fig. 3 is a diagram illustrating an example of the configuration of the analysis device 10 according to the embodiment.
- the analysis device 10 has an input unit 11, a control unit 12, a storage unit 13, and an output unit 14.
- the analysis device 10 accepts input of a test script and a script engine binary.
- the input unit 11 is composed of input devices such as a keyboard and a mouse, and accepts information input from the outside and inputs it to the control unit 12.
- the input unit 11 also has a communication interface for sending and receiving various information to and from other devices connected via a wired connection or a network, etc., and accepts input of information sent from other devices.
- the input unit 11 accepts input of test scripts and script engine binaries, and outputs them to the control unit 12.
- the test scripts are scripts that are input when dynamically analyzing the script engine to obtain an execution trace and a VM execution trace, and include a first test script for VM analysis, a second test script for symbol table detection, and a third test script and a fourth test script for symbol table VM command analysis.
- the script engine binary is an executable file that constitutes the script engine.
- the script engine binary may be composed of multiple executable files.
- test script configuration Let us explain about test scripts.
- a test script is a script that is input when dynamically analyzing a script engine. This test script focuses on the number of branch instruction executions and memory reads and writes, and is used to capture the difference in the behavior of the script engine that occurs when the test script is executed a different number of times. This test script is prepared before the analysis and is created manually. Creating it requires knowledge of the specifications of the target script language.
- FIG. 4 shows an example of a first test script used to detect VPCs.
- the first test script uses a repetitive process (line 2).
- the first test script changes the execution conditions and generates differences by increasing or decreasing the number of repetitions (line 2) and the number of repeated statements (lines 3 to 5) in the test script.
- the first test script is subject to processing from the execution trace acquisition process to the code cache detection process, which will be described later.
- FIG. 5 is a diagram showing an example of a second test script.
- a characteristic value is used to enable matching of values in order to detect the symbol table.
- it is "3735928559".
- FIG. 6 is a diagram showing an example of a third test script.
- the third test script is a test script that accesses variables (e.g., "a” and "b") of two different scopes (e.g., "func1" and "func2"). From the memory access trace by the third test script, the difference between each part accessed during the execution of each symbol table VM instruction of the first combination is compared with the position of the operand to determine whether the difference is an operand that specifies a symbol table.
- FIGS. 7 and 8 are diagrams showing an example of a fourth test script.
- the fourth test script is a test script that accesses two different variables (e.g., "a" and "b") in the same scope. From the memory access trace by the fourth test script, the difference between each part accessed during the execution of each symbol table VM instruction of the second combination is compared with the position of the operand to determine whether the difference is an operand that specifies a variable. Note that both the third and fourth test scripts are subject to the execution trace acquisition process, VM execution trace acquisition process, and symbol table VM instruction analysis process described below.
- the storage unit 13 is realized by a semiconductor memory element such as a RAM (Random Access Memory) or a flash memory, or a storage device such as a hard disk or an optical disk, and stores the processing program that operates the analysis device 10 and data used during execution of the processing program.
- the storage unit 13 has an execution trace database (DB) 131, a VM execution trace DB 133, and an architecture information DB 132 that stores architecture information acquired by the virtual machine analysis unit 121 and the instruction set architecture analysis unit 122 (described later).
- the execution trace DB 131 and the VM execution trace DB 133 store the execution traces and VM execution traces acquired by the execution trace acquisition unit 1211 and the VM execution trace acquisition unit 1221, respectively.
- the execution trace DB 131 and the VM execution trace DB 133 are managed by the analysis device 10.
- the execution trace DB 131 and the VM execution trace DB 133 may be managed by another device (such as a server), in which case the execution trace acquisition unit 1211 (described later) and the VM execution trace acquisition unit 1221 (described later) output the acquired execution traces and VM execution traces to a management server or the like for the execution trace DB 131 and the VM execution trace DB 133 via the communication interface of the output unit 14, and store them in the execution trace DB 131 and the VM execution trace DB 133.
- Fig. 9 is a diagram showing an example of an execution trace.
- the execution trace is composed of a branch trace and a memory access trace.
- Fig. 9 shows an excerpt of an execution trace. The configuration of the execution trace will be explained below with reference to Fig. 6.
- Trace indicates whether the log line is a branch trace or a memory access trace.
- a branch trace log line has the format shown, for example, in lines 1 to 10 of Figure 9, and consists of three elements: type, src, and dst.
- type indicates whether the executed branch instruction was a call instruction, a jmp instruction, or a ret instruction.
- src indicates the address of the branch source, and dst indicates the address of the branch destination.
- a log line of a memory access trace has the format shown, for example, in lines 11 to 13 of Figure 9, and consists of three elements: type, target, and value.
- Type indicates whether the memory access is a read or write.
- Target indicates the memory address that is the target of the memory access. Value stores the result of the memory access.
- VM Execution Trace Configuration Next, a VM execution trace will be described.
- Fig. 10 is a diagram showing an example of a VM execution trace. As described above, a VM execution trace is a record of a VM opcode and a VPC. Fig. 10 shows a part of a VM execution trace. The configuration of a VM execution trace will be described below with reference to Fig. 10.
- a log line of a VM execution trace is, for example, in the format shown in Figure 10, and consists of two elements: vpc and vmop (vm opcode).
- vpc indicates the value of the VPC.
- vmop indicates the value of the VM opcode that is virtually assigned to each pointer that points to the beginning of the VM instruction handler to be executed, obtained from the pointer cache.
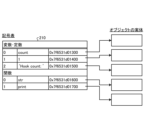
- Figure 11 is a diagram showing an example of the structure of a symbol table.
- the symbol table has information about variables and constants, and information about functions.
- the first column shows ordinal numbers
- the second column shows information indicating variables, constants, or functions
- the third row shows the address of the object entity.
- the control unit 12 has an internal memory for storing programs that define various processing procedures and the necessary data, and executes various processes using these.
- the control unit 12 is an electronic circuit such as a CPU (Central Processing Unit) or an MPU (Micro Processing Unit).
- the control unit 12 has a virtual machine analysis unit 121 (first analysis unit) and an instruction set architecture analysis unit 122 (second analysis unit).
- the virtual machine analysis unit 121 analyzes the VM of the script engine.
- the virtual machine analysis unit 121 obtains multiple execution traces by changing the conditions at run time, analyzes the multiple execution traces using differential execution analysis, and obtains the VPC.
- the virtual machine analysis unit 121 also analyzes the script engine binary to obtain the boundaries and dispatchers of VM instructions.
- the virtual machine analysis unit 121 detects a code cache from the execution trace.
- the VM instructions to be executed are stored in the code cache.
- the virtual machine analysis unit 121 detects a symbol table.
- the virtual machine analysis unit 121 has an execution trace acquisition unit 1211 (first acquisition unit), a VM instruction boundary detection unit 1212 (first detection unit), a virtual program counter detection unit 1213 (second detection unit), a dispatcher detection unit 1214 (third detection unit), a code cache detection unit 1215 (fourth detection unit), and a symbol table detection unit 1216 (fifth detection unit).
- the execution trace acquisition unit 1211 accepts the first to fourth test scripts and the script engine binary as input.
- the execution trace acquisition unit 1211 acquires an execution trace by executing the first to fourth test scripts while monitoring the execution of the script engine binary.
- An execution trace consists of a branch trace and a memory access trace.
- a branch trace records the type of branch instruction at the time of execution, the branch source address, and the branch destination address.
- a memory access trace records the type of memory operation at the time of execution (read/write), and the memory address and value of the operation target. It is known that branch traces and memory access traces can be obtained by hooking a memory operation instruction, inserting code for log output, and executing it.
- the execution trace obtained by the execution trace acquisition unit 1211 is stored in the execution trace DB 131.
- the execution trace acquisition unit 1211 acquires an API (Application Programming Interface) trace when acquiring an execution trace, and stores it in the execution trace DB 131.
- the API trace is a record of the system API called during execution and its arguments.
- the VM instruction boundary detection unit 1212 clusters the execution trace for the first test script to detect the boundaries of each VM instruction.
- the VM instruction boundary detection unit 1212 clusters the execution trace and detects clusters with a threshold or more of execution counts as VM instructions. In clustering, consecutive code regions that are executed multiple times are detected. For example, executed instructions that are close to each other in code may be grouped together, common subsequences of executed code blocks may be found, or other methods may be used.
- the analysis device 10 detects the start and end points of consecutive instruction sequences that make up the detected VM instruction as boundaries.
- the VM instruction boundaries detected here are used in VPC detection and dispatcher detection.
- the virtual program counter detection unit 1213 extracts and analyzes the execution trace for the first test script stored in the execution trace DB 131 to detect the VPC.
- the virtual program counter detection unit 1213 analyzes multiple execution traces using differential execution analysis focusing on the number of memory reads and the boundaries of each VM instruction detected by the VM instruction boundary detection unit 1212 to detect the VPC.
- the virtual program counter detection unit 1213 uses the fact that a read into the memory that holds the VPC always occurs after the execution of each VM instruction, and detects the VPC by discovering the destination of this read.
- the virtual program counter detection unit 1213 uses differential execution analysis that focuses on the number of memory reads to detect VPCs.
- the virtual program counter detection unit 1213 compares execution traces of multiple test scripts acquired using the first test script, and finds memories for which the number of memory reads changes in proportion to both the increase or decrease in the number of repetitions and the number of repeated statements.
- the virtual program counter detection unit 1213 then refers to the boundaries of each VM instruction detected by the VM instruction boundary detection unit 1212, and narrows down the memory values that have been read to those that always point to the start point of the VM instruction.
- the virtual program counter detection unit 1213 detects this memory as a VPC.
- the dispatcher detection unit 1214 extracts each VM instruction portion from the script engine binary based on the boundaries of the VM instructions detected by the VM instruction boundary detection unit 1212, and detects the portions with high similarity between each VM instruction as dispatchers.
- the dispatcher is realized by referencing the pointer cache and jumping to the pointer of the next VM instruction handler.
- Dispatchers are placed in a distributed manner at the rear of each VM instruction handler, and the code therein is generally highly identical.
- the analysis device detects dispatchers using a specified method by searching for code with high similarity that exists at the rear of such VM instruction handlers. To detect the portions with high similarity, for example, a sequence alignment algorithm or other methods may be used.
- the code cache detection unit 1215 detects a code cache, which is a cache in which virtual machine instructions to be executed are stored, from the VM execution trace based on the execution trace, VPC, and VM execution trace.
- the code cache detection unit 1215 detects the memory area pointed to by the VPC as a code cache from the VM execution trace.
- the code cache detection unit 1215 detects the code location from which the memory allocation function that allocated this code cache was called from the execution trace.
- the code cache detection unit 1215 detects all memory areas allocated at this code location from the VM execution trace as code caches.
- the code cache detection unit 1215 detects code locations that are writing to the code cache from the execution trace.
- the code cache detection unit 1215 detects writing by these code locations in the execution trace as updates to the code cache. Note that in this embodiment, the code cache is not directly used for detecting the symbol table and analyzing the symbol table VM instructions, so the code cache detection unit 1215 and the code cache detection process described below can be omitted.
- the symbol table detection unit 1216 detects architecture information of the symbol table that holds information about variables based on the analysis results of the VM of the script engine.
- the symbol table detection unit 1216 detects the position of the symbol table in the memory area and the structure of the symbol table using the second test script in which the characteristic value is used and the memory access trace by the second test script.
- the symbol table detection unit 1216 detects the position of the symbol table in the memory area and the structure that references the characteristic value based on the storage location of the characteristic value in the memory area and the reference source to the characteristic value from the memory access trace of the second test script. Since the value appears in the memory access trace when the symbol table is created ((1) in FIG. 12), the symbol table detection unit 1216 detects variables in the symbol table by matching the characteristic value of the second test script ((2) in FIG. 12).
- the symbol table detection unit 1216 detects an area where references are concentrated in the structure that references the characteristic value as the symbol table ((3) in FIG. 12). Specifically, the symbol table detection unit 1216 detects the code part that secures the memory area of the symbol table from the API trace. The symbol table detection unit 1216 outputs the location of the symbol table in the memory area and the code portion that reserves that area.
- the instruction set architecture analysis unit 122 analyzes the instruction set architecture, which is the system of instructions for the VM of the script engine.
- the instruction set architecture analysis unit 122 analyzes the VM of the script engine, and collects VM instructions based on the analysis results of the VM of the script engine. Based on the analysis results of the VM of the script engine, the instruction set architecture analysis unit 122 determines, from among the collected VM instructions, symbol table VM instructions that access a symbol table, and analyzes the access destination of the symbol table VM instruction.
- the instruction set architecture analysis unit 122 has a VM execution trace acquisition unit 1221 (second acquisition unit), a VM instruction collection unit 1222 (first collection unit), a symbol table VM instruction determination unit 1223 (first determination unit), and a symbol table VM instruction analysis unit 1224 (second analysis unit).
- the VM execution trace acquisition unit 1221 accepts the test script and the script engine binary as input.
- the VM execution trace acquisition unit 1221 acquires the VM execution trace by monitoring the VPC and the pointer of the VM instruction handler dispatched by the dispatcher.
- the VM execution trace acquisition unit 1221 acquires the VM execution trace, which is the execution trace executed on the VM, by executing the third and fourth test scripts while monitoring the execution of the script engine binary.
- the VM execution trace acquisition unit 1221 links the pointer to the VM instruction with the VM instruction, and virtually assigns a VM opcode as an identifier to each.
- a VM execution trace is an execution trace executed in a VM, in which a VM opcode is virtually assigned as an identifier, and in which a pointer to the executed VM handler and a VPC are recorded.
- a VM execution trace is a record of a pointer to an executed VM instruction handler and a VPC.
- a VM execution trace is composed of a VPC and a VM opcode for each executed VM instruction.
- the recording of a VPC can be achieved by monitoring the memory of the VPC detected by the virtual program counter detection unit 1213.
- a VM opcode is an identifier virtually assigned to each of a pointer to a VM instruction and a VM instruction that are linked together.
- the VM execution trace acquired by the VM execution trace acquisition unit 1221 is stored in the VM execution trace DB 133.
- the VM instruction collection unit 1222 accepts the VPC and dispatcher as input, executes the test script while monitoring the VPC and dispatcher, and obtains the VM execution trace.
- the VM instruction collection unit 1222 collects VM instructions from the VM execution trace.
- the symbol table VM instruction determination unit 1223 determines that, among the VM instructions collected by the VM instruction collection unit 1222, a VM instruction that accessed the symbol table memory area during VM execution is a symbol table VM instruction.
- the symbol table VM instruction determination unit 1223 determines that, among the VM instructions that accessed the symbol table memory area, a VM instruction that commands a read is a read symbol table VM instruction.
- the symbol table VM instruction determination unit 1223 determines that, among the VM instructions that accessed the symbol table memory area, a VM instruction that commands a write is a write symbol table VM instruction.
- the symbol table VM instruction determination unit 1223 outputs a list indicating the VM instructions determined to be symbol table VM instructions and their types based on the determination results for each VM instruction.
- the symbol table VM instruction analyzer 1224 retrieves and analyzes the VM execution trace stored in the VM execution trace DB 133. For a combination of two symbol table VM instructions retrieved from the VM execution trace, if the difference between the parts accessed during the execution of each symbol table VM instruction of the combination in the memory access trace exists at the position of the operand, the symbol table VM instruction analyzer 1224 determines that the difference is the operand of the symbol table VM instruction. The operand of the VM instruction can be found from the VPC and opcode of the VM instruction.
- Operands are generally located next to the opcode in memory, i.e., between the current opcode and the next opcode, such as "[opcode A][operand 1][operand 2][opcode B]", so if the VPC and opcode are known, the position of the operand can be found.
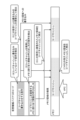
- FIG. 13 is a diagram explaining the processing of the symbol table VM command analyzer 1224.
- the symbol table VM command analyzer 1224 determines the operand that specifies the symbol table by using a memory access trace by a third test script that accesses variables in two different scopes ((1) in FIG. 13) and a VM execution trace.
- the symbol table VM instruction analyzer 1224 extracts from the memory access trace by the third test script, for a first combination of two symbol table VM instructions extracted from the VM execution trace by the third test script, the parts accessed during the execution of each symbol table VM instruction of the first combination. If the difference between the two extracted parts exists at the position of the operand, the symbol table VM instruction analyzer 1224 determines that the difference is an operand that specifies a symbol table ((2) in FIG. 13).
- FIG. 14 is a diagram explaining the processing of the symbol table VM command analyzer 1224.
- the symbol table VM command analyzer 1224 uses a memory access trace by a fourth test script that accesses two different variables in the same scope ((1) in FIG. 14) and a VM execution trace to determine the operand that specifies the variable.
- the symbol table VM instruction analyzer 1224 extracts from the memory access trace by the fourth test script the parts accessed during the execution of each symbol table VM instruction of the second combination of two symbol table VM instructions extracted from the VM execution trace by the fourth test script. If the difference between the two extracted parts exists at the position of the operand, the symbol table VM instruction analyzer 1224 determines that the difference is an operand that specifies a variable ((2) in FIG. 14).
- the symbol table VM command analysis unit 1224 outputs information on operands that specify a symbol table and information on operands that specify a variable.
- the output unit 14 is, for example, a liquid crystal display or a printer, and outputs various information including information related to the analysis device 10.
- the output unit 14 may also be an interface that handles the input and output of various data between an external device and the output unit 14, and may output various information to the external device.
- the VM instruction boundary detection unit 1212 detects the boundaries of each VM instruction. At this time, the VM instruction boundary detection unit 1212 detects VM instructions and their boundaries for threaded code type VMs, which do not have an interpreter loop and therefore make it difficult to grasp the boundaries of VM instructions. Specifically, the VM instruction boundary detection unit 1212 extracts execution traces from the execution trace DB 131. Then, as shown in FIG. 15, the VM instruction boundary detection unit 1212 clusters the execution traces using a predetermined method, and detects clusters with a threshold or more of execution counts as VM instructions (e.g., VM instruction handlers 1 to 3). The VM instruction boundary detection unit 1212 detects the start and end points of the consecutive instruction strings that make up a VM instruction as boundaries.
- VM instructions e.g., VM instruction handlers 1 to 3
- the virtual program counter detection unit 1213 detects the VPC and the pointer cache. The detection of the virtual program counter is realized by analyzing the memory access trace log of the acquired execution trace. The virtual program counter detection unit 1213 uses differential execution analysis focusing on the number of times memory is read.
- FIG. 16 is a diagram for explaining the processing of the virtual program counter detection unit 1213.
- the virtual program counter detection unit 1213 detects as a VPC a memory value that has been read and that always points to the start point of a VM instruction. Specifically, the virtual program counter detection unit 1213 compares the VPC's pointing destination with the address of the VM instruction handler, and narrows it down to matching memory areas ((2) in FIG. 16).
- the dispatcher detection unit 1214 detects a dispatcher by analyzing the binary of the script engine using a predetermined method.
- FIG. 17 is a diagram for explaining the process of the dispatcher detection unit 1214.
- the dispatcher detection unit 1214 detects dispatchers. Based on the boundaries of VM instructions detected by the VM instruction boundary detection unit 1212, the dispatcher detection unit 1214 extracts each VM instruction portion from the script engine binary. Then, based on the assumption that the similarity of dispatcher code is high (FIG. 17 (1)), the dispatcher detection unit 1214 calculates the similarity between the codes of each VM instruction and detects the portion with high similarity between all VM instructions as the dispatcher. The dispatcher detection unit 1214 can detect the code that is commonly executed in the latter half of the VM instructions as the dispatcher (FIG. 17 (1)).
- the code cache detection unit 1215 detects the memory area pointed to by the VPC as a code cache from the VM execution trace ((1) in FIG. 18).
- the code cache detection unit 1215 detects the code location that called the memory allocation function that allocated this code cache from the execution trace ((2) in FIG. 18). The code cache detection unit 1215 detects all memory areas allocated at this code location from the VM execution trace as code caches ((3) in FIG. 18).
- the code cache detection unit 1215 detects the code location that is writing to the code cache from the execution trace ((4) in FIG. 18). The code cache detection unit 1215 detects the writing by this code location from the VM execution trace as an update to the code cache ((5) in FIG. 18).
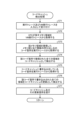
- Fig. 19 is a flowchart showing the procedure of the analysis process according to the embodiment.
- the input unit 11 receives a test script and a script engine binary as input (step S1).
- the test script includes a test script.
- the execution trace acquisition unit 1211 performs an execution trace acquisition process in which the test script is executed while monitoring the binary of the script engine to acquire branch traces and memory access traces (step S2).
- the VM instruction boundary detection unit 1212 detects VM instructions and performs VM instruction boundary detection processing to detect VM instruction boundaries (step S3).
- the virtual program counter detection unit 1213 extracts and analyzes the execution trace for the first test script stored in the execution trace DB 131, and performs virtual program counter detection processing to discover the VPC (step S4).
- the dispatcher detection unit 1214 performs dispatcher detection processing to extract each VM command portion from the script engine binary and detect the portion with high similarity between each VM command as a dispatcher (step S5).
- the code cache detection unit 1215 performs a code cache detection process based on the execution trace and VPC to detect the area of the code location from which the memory allocation function was called as a code cache, and to detect the area in which writing is being done to the code location area as an update to the code cache (step S6).
- the symbol table detection unit 1216 performs a symbol table detection process to detect architecture information of the symbol table using the second test script and the memory access trace by the second test script (step S7).
- the VM execution trace acquisition unit 1221 receives the test script and the script engine binary as input, and executes the test script while monitoring the execution of the script engine binary, thereby performing a VM execution trace acquisition process to acquire a VM execution trace (step S8).
- the VM instruction collection unit 1222 performs a VM instruction collection process to collect VM instructions from the VM execution trace (step S9).
- the symbol table VM instruction determination unit 1223 performs a symbol table VM instruction determination process to determine that a VM instruction that accessed the symbol table memory area during VM execution is a symbol table VM instruction among the VM instructions collected by the VM instruction collection unit 1222 (step S10).
- the symbol table VM instruction analysis unit 1224 analyzes the operands of the symbol table VM instruction to be analyzed, and performs a symbol table VM instruction analysis process to determine the operands that specify the symbol table and the operands that specify the variables (step S11).
- the output unit 14 outputs the symbol table detected in step S7 and the information on the symbol table VM commands analyzed in steps S10 and S11 (step S12).
- FIG. 20 is a flowchart showing the processing procedure of the execution trace acquisition process shown in Fig. 19.
- the execution trace acquisition unit 1211 receives a test script and a script engine binary as input (step S21). Then, the execution trace acquisition unit 1211 hooks the received script engine to acquire a branch trace (step S22). The execution trace acquisition unit 1211 also hooks the received script engine to acquire a memory access trace (step S23).
- the execution trace acquisition unit 1211 inputs the test script received in this state into the script engine and executes it (step S24), and stores the execution trace acquired thereby in the execution trace DB 131 (step S25).
- the execution trace acquisition unit 1211 determines whether or not all of the input test scripts have been executed (step S26). If all of the input test scripts have been executed (step S26: Yes), the execution trace acquisition unit 1211 ends the process. On the other hand, if all of the input test scripts have not been executed (step S26: No), the execution trace acquisition unit 1211 returns to the execution of the first test script in step S24 and continues the process.
- Fig. 21 is a flowchart showing the processing procedure of the VM instruction boundary detection process shown in Fig. 19.
- the VM instruction boundary detection unit 1212 extracts execution traces from the execution trace DB 131 (step S31).
- the VM instruction boundary detection unit 1212 clusters the execution traces using a predetermined method (step S32). Any method may be used for clustering.
- the VM instruction boundary detection unit 1212 detects clusters whose execution count is equal to or exceeds a threshold as VM instructions (step S33). Then, the VM instruction boundary detection unit 1212 determines the start and end points of the continuous instruction sequence that constitutes the VM instruction as boundaries (step S34). The VM instruction boundary detection unit 1212 outputs the VM instruction boundary as a return value (step S35), and ends the VM instruction boundary detection process.
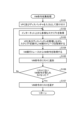
- Fig. 22 is a flowchart showing the processing procedure of the virtual program counter detection process shown in Fig. 19.
- the virtual program counter detection unit 1213 extracts one execution trace by the test script from the execution trace DB 131 (step S41). Next, the virtual program counter detection unit 1213 focuses on memory access traces among the execution traces, and counts up the number of reads for each memory read destination (step S42).
- the virtual program counter detection unit 1213 receives as input the test script used to obtain the execution trace (step S43), analyzes the test script, and obtains the number of repetitions and the number of repeated statements (step S44).
- the virtual program counter detection unit 1213 extracts from the execution trace DB 131 another execution trace by a test script with a different number of repetitions or number of repeated statements (step S45). Then, the virtual program counter detection unit 1213 focuses on the memory access trace and counts the number of reads for each memory read destination (step S46). The virtual program counter detection unit 1213 also receives as input the test script used to obtain the execution trace (step S47), analyzes the test script, and obtains the number of repetitions and the number of repeated statements (step S48).
- the virtual program counter detection unit 1213 narrows down the memory read destinations to only those whose read counts change in proportion to the number of repetitions or the increase or decrease in the number of repeated statements (step S49). Furthermore, the virtual program counter detection unit 1213 narrows down the memory read destinations narrowed down in step S49 to those whose read memory values always point to the start point of the VM instruction (step S50).
- the virtual program counter detection unit 1213 determines whether the memory read destinations have been narrowed down to only one (step S51). If the virtual program counter detection unit 1213 has not narrowed down the memory read destinations to only one (step S51: No), the process returns to step S45, where the virtual program counter detection unit 1213 retrieves the next execution trace and continues processing. On the other hand, if the virtual program counter detection unit 1213 has narrowed down the memory read destinations to only one (step S51: Yes), the virtual program counter detection unit 1213 stores the narrowed down memory read destination in the architecture information DB 132 as a virtual program counter (step S52), and ends processing.
- Fig. 23 is a flowchart showing the processing procedure of the dispatcher detection process shown in Fig. 19.
- the dispatcher detection unit 1214 receives the script engine binary as input (step S61).
- the dispatcher detection unit 1214 receives the boundaries of VM commands from the VM command boundary detection unit 1212 (step S62).
- the dispatcher detection unit 1214 extracts each VM instruction portion from the script engine binary based on the boundaries of the VM instructions received from the VM instruction boundary detection unit 1212 (step S63).
- the dispatcher detection unit 1214 calculates the similarity between the codes of each VM instruction using a predetermined method (step S64). Any method for calculating the similarity may be used as long as it is a method that can calculate the similarity between codes.
- the dispatcher detection unit 1214 extracts the part with high similarity among all VM commands based on the similarity calculated in step S64 (step S65). The dispatcher detection unit 1214 then determines whether it is the end part of the VM command (step S66).
- step S66: No If it is not the end of the VM command (step S66: No), the dispatcher detection unit 1214 returns to step S65 and continues processing. If it is the end of the VM command (step S66: Yes), the dispatcher detection unit 1214 outputs the extracted part as a dispatcher (step S67) and ends processing.
- Fig. 24 is a flowchart showing the processing procedure of the code cache detection process shown in Fig. 19.
- the code cache detection unit 1215 When the code cache detection unit 1215 receives an execution trace and a VM execution trace as input (step S71), it acquires the memory area pointed to by the VPC from the VM execution trace (step S72). The VM execution trace is acquired by the VM execution trace acquisition unit 1221.
- the code cache detection unit 1215 obtains from the execution trace the code location of the caller of the memory allocation function that allocated the memory area obtained in step S72 (step S73).
- the code cache detection unit 1215 detects, from the VM execution trace, all areas allocated at the code location obtained in step S73 as code caches (step S74).
- the code cache detection unit 1215 acquires the code location that is writing to the code cache from the execution trace (step S75). The code cache detection unit 1215 detects all areas in the VM execution trace that are written to at the code location acquired in step S75 as code cache updates (step S76). The code cache detection unit 1215 returns the detected code cache and its updated location (step S77), and ends the code cache detection process.
- Fig. 25 is a flowchart showing the processing procedure of the symbol table detection process shown in Fig. 19.
- the symbol table detection unit 1216 receives as input the second test script and a memory access trace by the second test script (step S81). The symbol table detection unit 1216 extracts characteristic values used in the second test script (step S82).
- the symbol table detection unit 1216 detects the storage location in memory of the characteristic value extracted in step S82 by matching the characteristic value from the memory access trace received in step S81 (step S83).
- the symbol table detection unit 1216 detects structures that reference the characteristic values detected in step S83 from the memory access trace (step S84). Since it is possible to determine which pointers reference which areas from the memory access trace, the symbol table detection unit 1216 can detect what kind of structure is present by connecting the reference relationships between the values in the memory access trace. The symbol table detection unit 1216 may also detect structures by employing existing methods for analyzing the structure of structures.
- the symbol table detection unit 1216 detects the memory area where references to multiple values are grouped together as a location in the symbol table memory area (step S85).
- the symbol table detection unit 1216 extracts function calls for memory allocation from the API trace (step S86). By detecting the code location that made the "function call for memory allocation" as the "code that allocates memory for the symbol table,” and by monitoring this code location and recording the address of the allocated memory, the location of the symbol table in memory can be determined each time a new symbol table is created.
- the symbol table detection unit 1216 detects from the API trace the code that reserves a memory area containing a symbol table, i.e., the code portion that reserves the memory area for the symbol table (step S87).
- the symbol table detection unit 1216 makes it possible to identify the position of the symbol table in the memory area and the code portion that reserves that area, and outputs this as a symbol table (step S88).
- Fig. 26 is a flowchart showing the procedure of the VM execution trace acquisition process shown in Fig. 19.
- the VM execution trace acquisition unit 1221 receives a test script and a script engine binary as input (step S91). Then, the VM execution trace acquisition unit 1221 applies a hook to the received script engine to record the VPC and VM opcode (step S92).
- the VM execution trace acquisition unit 1221 inputs the received test script in this state into the script engine for execution (step S93), and stores the VM execution trace acquired thereby in the VM execution trace DB 133 (step S94).
- the VM execution trace acquisition unit 1221 determines whether or not all of the input test scripts have been executed (step S95). If all of the input test scripts have been executed (step S95: Yes), the VM execution trace acquisition unit 1221 ends the process. If all of the input test scripts have not been executed (step S95: No), the VM execution trace acquisition unit 1221 returns to the execution of the test scripts in step S93 and continues the process.
- Fig. 27 is a flowchart showing the procedure of the VM command collection process shown in Fig. 19.
- the VM command collection unit 1222 receives the VPC and dispatcher as input (step S101) and acquires various scripts from the Internet (step S102).
- the VM command collection unit 1222 executes the scripts while monitoring the VPC and dispatcher, and acquires a VM execution trace (step S103).
- the VM instruction collection unit 1222 acquires VM instructions from the VM execution trace (step S104) and adds them to a list of VM instructions (step S105). If the VM instruction collection unit 1222 finds a VM instruction that is not in the list (step S106: No), it returns to step S102. If the VM instruction collection unit 1222 finds no VM instructions that are not in the list (step S106: Yes), it returns the list of VM instructions (step S107) and ends the VM instruction collection process.
- Fig. 28 is a flowchart showing the processing procedure of the symbol table VM command determination process shown in Fig. 19.
- the symbol table VM instruction determination unit 1223 receives as input the VM execution trace and memory access trace from the VM execution trace DB 133 (step S111).
- the symbol table VM instruction determination unit 1223 receives as input the position in the memory area of the symbol table detected in the symbol table detection process (step S112).
- the symbol table VM instruction determination unit 1223 extracts one VM instruction from the VM execution trace (step S113).
- the VM instruction consists of a VPC value and a VM opcode value.
- the symbol table VM instruction determination unit 1223 checks the memory area accessed during execution of the extracted VM instruction (step S114) and determines whether or not the memory area of the symbol table was accessed (step S115).
- step S115 If the symbol table memory area is not accessed (step S115: No), the symbol table VM command determination unit 1223 determines that the VM command extracted in step S113 is not a symbol table VM command (step S116).
- step S115 If the symbol table memory area is accessed (step S115: Yes), the symbol table VM command determination unit 1223 determines whether the VM command extracted in step S113 was a read command (step S117).
- step S117 If it is a read (step S117: Yes), the symbol table VM command determination unit 1223 determines that the VM command extracted in step S113 is a read symbol table VM command (step S118).
- step S117 determines that the VM command extracted in step S113 is a write symbol table VM command (step S119).
- the symbol table VM instruction determination unit 1223 determines whether or not all VM instructions in the VM execution trace have been confirmed to be symbol table VM instructions (step S120).
- step S120 If it has not been confirmed whether all VM instructions are symbol table VM instructions (step S120: No), the symbol table VM instruction determination unit 1223 extracts the next VM instruction from the VM execution trace (step S121) and proceeds to step S114 to continue processing.
- the symbol table VM instruction determination unit 1223 outputs a list of the opcodes of the VM instructions determined to be symbol table VM instructions (step S122) and ends the symbol table VM instruction determination process.
- Fig. 29 and Fig. 30 are flowcharts showing the processing procedure of the symbol table VM command analysis process shown in Fig. 19.
- the symbol table VM command analysis unit 1224 receives as input the memory access trace and VM execution trace from the third test script (step S131).
- the symbol table VM instruction analysis unit 1224 extracts a combination of two symbol table VM instructions from the VM execution trace received in step S131 (step S132).
- the symbol table VM instruction analysis unit 1224 extracts the combination of symbol table VM instructions by referring to the list of VM instructions determined to be symbol table VM instructions output in the symbol table VM instruction determination process.
- the symbol table VM instruction analysis unit 1224 extracts the parts accessed during the execution of each symbol table VM instruction from the memory access trace received in step S131 (step S133).
- the symbol table VM command analysis unit 1224 compares the parts extracted in step S133 and extracts the differences (step S134).
- the symbol table VM command analysis unit 1224 determines whether the difference exists at the operand position (step S135).
- step S135 the symbol table VM instruction analysis unit 1224 determines whether or not all symbol table VM instructions of the VM execution trace input received in step S131 have been processed (step S136).
- step S136 If the symbol table VM command analysis unit 1224 has not processed all the symbol table VM commands in the VM execution trace (step S136: No), it extracts the next combination of symbol table VM commands from the VM execution trace input received in step S131 (step S137). Then, the symbol table VM command analysis unit 1224 proceeds to the processing of step S133.
- step S135 If the difference exists at the operand position (step S135: Yes), the symbol table VM command analyzer 1224 determines that the difference is an operand that specifies the symbol table (step S138).
- step S136 If not all symbol table VM commands of the VM execution trace received as input in step S131 have been processed (step S136: Yes), or after processing in step S138, the symbol table VM command analysis unit 1224 receives as input the memory access trace and VM execution trace by the fourth test script (step S139).
- the symbol table VM instruction analysis unit 1224 extracts a combination of two symbol table VM instructions from the VM execution trace received in step S139 (step S140).
- the symbol table VM instruction analysis unit 1224 extracts the parts accessed during the execution of each symbol table VM instruction from the memory access trace received in step S139 (step S141).
- the symbol table VM command analysis unit 1224 compares the parts extracted in step S141 and extracts the differences (step S142).
- the symbol table VM command analysis unit 1224 determines whether the difference exists at the operand position (step S143).
- step S143 the symbol table VM instruction analysis unit 1224 determines whether or not all symbol table VM instructions of the VM execution trace input received in step S139 have been processed (step S144).
- step S144 If the symbol table VM command analysis unit 1224 has not processed all the symbol table VM commands in the VM execution trace (step S144: No), it extracts the next combination of symbol table VM commands from the VM execution trace input received in step S139 (step S145). Then, the symbol table VM command analysis unit 1224 proceeds to the processing of step S141.
- step S143 If the difference exists at the operand position (step S143: Yes), the symbol table VM command analyzer 1224 determines that the difference exists as an operand that specifies a variable (step S146).
- step S144 If all symbol table VM commands have been processed (step S144: Yes), or after processing of step S146, the symbol table VM command analysis unit 1224 outputs information on the operands that specify the symbol table and information on the operands that specify the variables based on the determination results of steps S138 and S146 (step S147).
- the analysis device 10 executes the test script while monitoring the binary of the script engine, and acquires the branch trace and the memory access trace as the execution trace. Based on the execution trace, the analysis device 10 analyzes the VM of the script engine, and acquires the architecture information of the VPC, the dispatcher, the code cache, and the symbol table.
- the analysis device 10 detects the location in the memory area of the symbol table and the structure that references the characteristic value based on the storage location in the memory area of the characteristic value and the reference source of the characteristic value from the memory access trace of the second test script in which the characteristic value is used.Then, the analysis device 10 detects the code location that secures the memory area of the symbol table from the API trace.
- the analysis device 10 obtains the location of the symbol table in the memory area, the code location that allocates the memory area for the symbol table, and the structure of the symbol table as architectural information for the symbol table.
- the analysis device 10 analyzes the instruction set architecture, which is the system of instructions for the virtual machine. For example, the analysis device 10 collects VM instructions based on the analysis results of the VM of the script engine, determines which of the collected VM instructions are symbol table VM instructions, and analyzes the access destination of the symbol table VM instructions.
- the analysis device 10 executes the test script while monitoring the VPC and the dispatcher to obtain a VM execution trace. By analyzing this VM execution trace, the analysis device 10 collects VM instructions, determines which VM instructions access the symbol table, and analyzes the access destination.
- the analysis device 10 determines that the difference is the operand of the symbol table VM instruction. Based on this determination, the analysis device 10 obtains a list of opcodes of the symbol table VM instructions, the operands that specify the symbol table, information about the operands that specify the symbol table, and information about the operands that specify the variables.
- the analysis device 10 can detect various architectural information through analysis based on the acquisition of execution traces and VM execution traces, even for script engines whose VM internal specifications are unknown, and can obtain symbol table information without requiring manual reverse engineering.
- the analysis device 10 can automatically analyze symbol tables for a variety of script engines as long as a test script is prepared, making it possible to obtain variable information without the need for individual design or execution.
- the analysis device 10 is able to analyze variables even for scripts written in various scripting languages, enabling a more detailed understanding of behavior.
- the analysis device 10 according to the present embodiment is able to clarify variable information for script engines in a wide variety of scripting languages by analyzing the script engine and acquiring symbol table information.
- the analysis device 10 is useful for obtaining symbol table information in a wide variety of script engines, and is suitable for performing analysis even on scripts for which analysis of variable information is difficult due to the absence of analysis support functions such as a debugger or unknown internal specifications of the VM.
- Each component of the analysis device 10 shown in Fig. 3 is a functional concept, and does not necessarily have to be physically configured as shown in the figure.
- the specific form of distribution and integration of the functions of the analysis device 10 is not limited to that shown in the figure, and all or part of it can be functionally or physically distributed or integrated in any unit depending on various loads, usage conditions, etc.
- each process performed by the analysis device 10 may be realized, in whole or in part, by a CPU and a program that is analyzed and executed by the CPU. Furthermore, each process performed by the analysis device 10 may be realized as hardware using wired logic.
- [program] 31 is a diagram showing an example of a computer in which analysis device 10 is realized by executing a program.
- Computer 1000 has, for example, memory 1010 and CPU 1020.
- Computer 1000 also has hard disk drive interface 1030, disk drive interface 1040, serial port interface 1050, video adapter 1060, and network interface 1070. Each of these components is connected by bus 1080.
- the memory 1010 includes a ROM 1011 and a RAM 1012.
- the ROM 1011 stores a boot program such as a BIOS (Basic Input Output System).
- BIOS Basic Input Output System
- the hard disk drive interface 1030 is connected to a hard disk drive 1090.
- the disk drive interface 1040 is connected to a disk drive 1100.
- a removable storage medium such as a magnetic disk or optical disk is inserted into the disk drive 1100.
- the serial port interface 1050 is connected to a mouse 1110 and a keyboard 1120, for example.
- the video adapter 1060 is connected to a display 1130, for example.
- the hard disk drive 1090 stores, for example, an OS 1091, an application program 1092, a program module 1093, and program data 1094. That is, the program that defines each process of the analysis device 10 is implemented as a program module 1093 in which code executable by the computer 1000 is written.
- the program module 1093 is stored, for example, in the hard disk drive 1090.
- a program module 1093 for executing processes similar to the functional configuration of the analysis device 10 is stored in the hard disk drive 1090.
- the hard disk drive 1090 may be replaced by an SSD (Solid State Drive).
- the setting data used in the processing of the above-mentioned embodiment is stored as program data 1094, for example, in memory 1010 or hard disk drive 1090.
- the CPU 1020 reads the program module 1093 or program data 1094 stored in memory 1010 or hard disk drive 1090 into RAM 1012 as necessary and executes it.
- the program module 1093 and program data 1094 may not necessarily be stored in the hard disk drive 1090, but may be stored in a removable storage medium, for example, and read by the CPU 1020 via the disk drive 1100 or the like.
- the program module 1093 and program data 1094 may be stored in another computer connected via a network (such as a LAN (Local Area Network), WAN (Wide Area Network)).
- the program module 1093 and program data 1094 may then be read by the CPU 1020 from the other computer via the network interface 1070.
Landscapes
- Engineering & Computer Science (AREA)
- General Engineering & Computer Science (AREA)
- Theoretical Computer Science (AREA)
- Computer Security & Cryptography (AREA)
- Computer Hardware Design (AREA)
- Physics & Mathematics (AREA)
- General Physics & Mathematics (AREA)
- Software Systems (AREA)
- Quality & Reliability (AREA)
- General Health & Medical Sciences (AREA)
- Virology (AREA)
- Health & Medical Sciences (AREA)
- Debugging And Monitoring (AREA)
Priority Applications (2)
| Application Number | Priority Date | Filing Date | Title |
|---|---|---|---|
| PCT/JP2023/015088 WO2024214260A1 (ja) | 2023-04-13 | 2023-04-13 | 解析装置、解析方法及び解析プログラム |
| JP2025513731A JPWO2024214260A1 (https=) | 2023-04-13 | 2023-04-13 |
Applications Claiming Priority (1)
| Application Number | Priority Date | Filing Date | Title |
|---|---|---|---|
| PCT/JP2023/015088 WO2024214260A1 (ja) | 2023-04-13 | 2023-04-13 | 解析装置、解析方法及び解析プログラム |
Publications (1)
| Publication Number | Publication Date |
|---|---|
| WO2024214260A1 true WO2024214260A1 (ja) | 2024-10-17 |
Family
ID=93059016
Family Applications (1)
| Application Number | Title | Priority Date | Filing Date |
|---|---|---|---|
| PCT/JP2023/015088 Ceased WO2024214260A1 (ja) | 2023-04-13 | 2023-04-13 | 解析装置、解析方法及び解析プログラム |
Country Status (2)
| Country | Link |
|---|---|
| JP (1) | JPWO2024214260A1 (https=) |
| WO (1) | WO2024214260A1 (https=) |
Citations (3)
| Publication number | Priority date | Publication date | Assignee | Title |
|---|---|---|---|---|
| JP2013254320A (ja) * | 2012-06-06 | 2013-12-19 | Nec Corp | 実行トレース表示装置、実行トレース表示方法及び実行トレース表示プログラム |
| WO2022079840A1 (ja) * | 2020-10-14 | 2022-04-21 | 日本電信電話株式会社 | 解析機能付与装置、解析機能付与方法および解析機能付与プログラム |
| WO2022180702A1 (ja) * | 2021-02-24 | 2022-09-01 | 日本電信電話株式会社 | 解析機能付与装置、解析機能付与プログラム及び解析機能付与方法 |
-
2023
- 2023-04-13 JP JP2025513731A patent/JPWO2024214260A1/ja active Pending
- 2023-04-13 WO PCT/JP2023/015088 patent/WO2024214260A1/ja not_active Ceased
Patent Citations (3)
| Publication number | Priority date | Publication date | Assignee | Title |
|---|---|---|---|---|
| JP2013254320A (ja) * | 2012-06-06 | 2013-12-19 | Nec Corp | 実行トレース表示装置、実行トレース表示方法及び実行トレース表示プログラム |
| WO2022079840A1 (ja) * | 2020-10-14 | 2022-04-21 | 日本電信電話株式会社 | 解析機能付与装置、解析機能付与方法および解析機能付与プログラム |
| WO2022180702A1 (ja) * | 2021-02-24 | 2022-09-01 | 日本電信電話株式会社 | 解析機能付与装置、解析機能付与プログラム及び解析機能付与方法 |
Also Published As
| Publication number | Publication date |
|---|---|
| JPWO2024214260A1 (https=) | 2024-10-17 |
Similar Documents
| Publication | Publication Date | Title |
|---|---|---|
| Hu et al. | Binary code clone detection across architectures and compiling configurations | |
| Cesare et al. | Classification of malware using structured control flow | |
| Li et al. | Steelix: program-state based binary fuzzing | |
| US7409717B1 (en) | Metamorphic computer virus detection | |
| JP7517585B2 (ja) | 解析機能付与装置、解析機能付与プログラム及び解析機能付与方法 | |
| Sun et al. | {KSG}: Augmenting kernel fuzzing with system call specification generation | |
| EP1297401B1 (en) | Histogram-based virus detection | |
| Hu et al. | Cross-architecture binary semantics understanding via similar code comparison | |
| JP2006185211A (ja) | プログラム解析装置、テスト実行装置、その解析方法及びプログラム | |
| Chen et al. | Brick: A binary tool for run-time detecting and locating integer-based vulnerability | |
| WO2023067668A1 (ja) | 解析機能付与方法、解析機能付与装置及び解析機能付与プログラム | |
| Chen et al. | IntFinder: Automatically detecting integer bugs in x86 binary program | |
| US20220164446A1 (en) | Process wrapping method for evading anti-analysis of native codes, recording medium and device for performing the method | |
| WO2024214263A1 (ja) | 解析機能付与装置、解析機能付与方法及び解析機能付与プログラム | |
| KR20150111610A (ko) | 스택 기반 소프트웨어 유사도 평가 방법 및 장치 | |
| Mallissery et al. | Pervasive micro information flow tracking | |
| JP7838662B2 (ja) | 脆弱性発見装置、脆弱性発見方法及び脆弱性発見プログラム | |
| WO2024214260A1 (ja) | 解析装置、解析方法及び解析プログラム | |
| KR102421394B1 (ko) | 하드웨어와 소프트웨어 기반 트레이싱을 이용한 악성코드 탐지 장치 및 방법 | |
| WO2023067663A1 (ja) | 解析機能付与方法、解析機能付与装置及び解析機能付与プログラム | |
| JP7800716B2 (ja) | 解析機能付与装置、解析機能付与方法および解析機能付与プログラム | |
| WO2024214261A1 (ja) | 解析装置、解析方法及び解析プログラム | |
| WO2024214264A1 (ja) | 解析装置、解析方法及び解析プログラム | |
| WO2023067665A1 (ja) | 解析機能付与方法、解析機能付与装置及び解析機能付与プログラム | |
| WO2024214262A1 (ja) | 解析機能付与装置、解析機能付与方法及び解析機能付与プログラム |
Legal Events
| Date | Code | Title | Description |
|---|---|---|---|
| 121 | Ep: the epo has been informed by wipo that ep was designated in this application |
Ref document number: 23933036 Country of ref document: EP Kind code of ref document: A1 |
|
| ENP | Entry into the national phase |
Ref document number: 2025513731 Country of ref document: JP Kind code of ref document: A |
|
| WWE | Wipo information: entry into national phase |
Ref document number: 2025513731 Country of ref document: JP |
|
| NENP | Non-entry into the national phase |
Ref country code: DE |
|
| 122 | Ep: pct application non-entry in european phase |
Ref document number: 23933036 Country of ref document: EP Kind code of ref document: A1 |