WO2024201796A1 - 因果探索プログラム,因果探索方法および因果探索装置 - Google Patents
因果探索プログラム,因果探索方法および因果探索装置 Download PDFInfo
- Publication number
- WO2024201796A1 WO2024201796A1 PCT/JP2023/012838 JP2023012838W WO2024201796A1 WO 2024201796 A1 WO2024201796 A1 WO 2024201796A1 JP 2023012838 W JP2023012838 W JP 2023012838W WO 2024201796 A1 WO2024201796 A1 WO 2024201796A1
- Authority
- WO
- WIPO (PCT)
- Prior art keywords
- causal
- variables
- group
- search
- results
- Prior art date
- Legal status (The legal status is an assumption and is not a legal conclusion. Google has not performed a legal analysis and makes no representation as to the accuracy of the status listed.)
- Ceased
Links
Images





Classifications
-
- G—PHYSICS
- G06—COMPUTING OR CALCULATING; COUNTING
- G06N—COMPUTING ARRANGEMENTS BASED ON SPECIFIC COMPUTATIONAL MODELS
- G06N5/00—Computing arrangements using knowledge-based models
- G06N5/01—Dynamic search techniques; Heuristics; Dynamic trees; Branch-and-bound
-
- G—PHYSICS
- G06—COMPUTING OR CALCULATING; COUNTING
- G06F—ELECTRIC DIGITAL DATA PROCESSING
- G06F18/00—Pattern recognition
- G06F18/20—Analysing
- G06F18/23—Clustering techniques
-
- G—PHYSICS
- G06—COMPUTING OR CALCULATING; COUNTING
- G06N—COMPUTING ARRANGEMENTS BASED ON SPECIFIC COMPUTATIONAL MODELS
- G06N7/00—Computing arrangements based on specific mathematical models
- G06N7/01—Probabilistic graphical models, e.g. probabilistic networks
Definitions
- the present invention relates to a causal discovery program, a causal discovery method, and a causal discovery device.
- causality is required rather than correlation. Specifically, causality is used to estimate problems such as, "Which design parameter x should be changed and how should it be changed in order to reduce product defect rate y?" or "What sales measure x should be implemented and to what extent in order to increase customer purchase rate y?"
- causal discovery Inferring causal relationships from data can be called causal discovery.
- One method of causal discovery is to find the causal relationship between desired variables by imposing some assumption on the causal relationship between variables, and then estimating the causal relationship that best fits the data from the observed values while satisfying that assumption.
- SEM structural equation model
- Typical SEMs include the Linear non-Gaussian acyclic model (LiNGAM) and the Additive noise causal model (ANM).
- LiNGAM Linear non-Gaussian acyclic model
- ANM Additive noise causal model
- LiNGAM for example, DirectLiNGAM is used as the estimation algorithm
- ANM for example, RESIT is used as the estimation algorithm.
- causal relationships are expressed by equations.
- causal relationships are expressed by linear equations.
- ANM causal relationships are expressed by additive noise model equations.
- the estimation algorithm may behave in an unexpected way, and there is a risk that not only will the estimation be correct, but the conventional causal discovery method itself may not work properly.
- the present invention aims to make it possible to estimate causal relationships between variables even when the number of samples is insufficient relative to the number of variables.
- this causal search program causes a computer to execute a process of classifying multiple variables into two or more groups based on the similarity of the variables in a joint distribution, performing a causal search between the representative variables determined for each of the two or more groups, performing a causal search between the variables contained in each of the two or more groups, and outputting the results of the causal search between the representative variables and the results of the causal search between the variables contained in each of the groups.
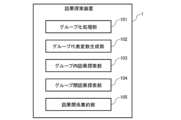
- 1 is a diagram illustrating a schematic configuration of a causal exploration device according to an embodiment
- 1 is a block diagram showing an example of a hardware (HW) configuration of a computer that realizes the functions of a causal exploration device as an example of an embodiment.
- 1 is a diagram illustrating hierarchical clustering performed by a grouping processing unit of a causal exploration device as an example of an embodiment
- FIG. 11 is a diagram illustrating a process performed by a grouping processing unit of a causal exploration device as an example of an embodiment.
- 1 is a diagram for explaining causal discovery by an intra-group causal discovery unit of a causal discovery device as an example of an embodiment
- 11 is a diagram for explaining a process of an intra-group causal search unit of a causal search device as an example of an embodiment
- FIG. 11 is a diagram for explaining a process of an inter-group causal exploration unit of a causal exploration device as an example of an embodiment
- FIG. 1 is a diagram for explaining a process of a causal relationship summarizing unit of a causal search device as an example of an embodiment
- 1 is a diagram for explaining a process of a causal relationship summarizing unit of a causal search device as an example of an embodiment
- 1 is a diagram for explaining a process of a causal relationship summarizing unit of a causal search device as an example of an embodiment
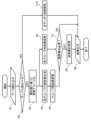
- 1 is a flowchart illustrating a process of a causal exploration device as an example of an embodiment.
- FIG. 1 is a diagram illustrating an overview of a process performed by a causal exploration device as an example of an embodiment.
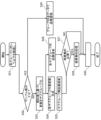
- 12 is a flowchart for explaining a modified example of the process in step S6 of the flowchart shown in FIG. 11.
- FIG. 1 is a diagram illustrating a schematic configuration of a causal exploration device 1 according to an embodiment.
- the causal exploration device 1 is an information processing device that performs causal exploration by estimating causal relationships between given variables from observed values (data) of those variables.
- the causal exploration device 1 may be called a data analysis device 1.
- FIG. 2 is a block diagram showing an example of the hardware (HW) configuration of a computer 10 that realizes the functions of the causal exploration device 1 as an example of an embodiment.
- HW hardware
- the computer 10 may, as a HW configuration, illustratively include a processor 10a, a graphics processing unit 10b, a memory 10c, a storage unit 10d, an IF (Interface) unit 10e, an IO (Input/Output) unit 10f, and a reading unit 10g.
- Processor 10a is an example of a processing unit that performs various controls and calculations, and corresponds to a control unit. Processor 10a may be connected to each block in computer 10 via bus 10j so that they can communicate with each other. Processor 10a may be a multiprocessor including multiple processors, a multicore processor having multiple processor cores, or a configuration having multiple multicore processors.
- Examples of the processor 10a include integrated circuits (ICs) such as a CPU, MPU, APU, DSP, ASIC, and FPGA. Note that a combination of two or more of these integrated circuits may be used as the processor 10a.
- ICs integrated circuits
- MPU is an abbreviation for Micro Processing Unit
- APU is an abbreviation for Accelerated Processing Unit
- DSP is an abbreviation for Digital Signal Processor
- ASIC is an abbreviation for Application Specific IC
- FPGA is an abbreviation for Field-Programmable Gate Array.
- the graphics processing device 10b controls the screen display of output devices such as monitors in the IO section 10f.
- Examples of the graphics processing device 10b include various types of arithmetic processing devices, such as a GPU (Graphics Processing Unit), APU, DSP, ASIC, or integrated circuits (ICs) such as FPGA.
- Memory 10c is an example of HW that stores various data, programs, and other information.
- Examples of memory 10c include volatile memory such as DRAM (Dynamic Random Access Memory) and/or non-volatile memory such as PM (Persistent Memory).
- the memory unit 10d is an example of HW that stores various data, programs, and other information.
- Examples of the memory unit 10d include various types of storage devices such as magnetic disk devices such as HDDs (Hard Disk Drives), semiconductor drive devices such as SSDs (Solid State Drives), and non-volatile memories.
- Examples of non-volatile memories include flash memory, SCM (Storage Class Memory), and ROM (Read Only Memory).
- the memory unit 10d may store a program 10h (causal search program) that realizes all or part of the various functions of the computer 10.
- the processor 10a of the causal exploration device 1 can implement the functions of each component of the causal exploration device 1, which will be described later, by expanding the program 10h stored in the storage unit 10d into the memory 10c and executing it.
- the storage unit 10d may also store various data that each component of the causal exploration device 1 generates during processing.
- the IF unit 10e is an example of a communication IF that controls the connection and communication between the computer 10 and other computers.
- the IF unit 10e may include an adapter that complies with a LAN (Local Area Network) such as Ethernet (registered trademark) or optical communications such as FC (Fibre Channel).
- the adapter may be compatible with either or both of wireless and wired communication methods.
- the causal exploration device 1 may be connected to other information processing devices via the IF unit 10e and a network so that they can communicate with each other.
- the program 10h may be downloaded from the network to the computer 10 via the communication IF and stored in the memory unit 10d.
- the IO unit 10f may include one or both of an input device and an output device. Examples of input devices include a keyboard, a mouse, a touch panel, etc. Examples of output devices include a monitor, a projector, a printer, etc.
- the IO unit 10f may also include a touch panel that combines an input device and a display device. The output device may be connected to the graphics processing device 10b.
- the reading unit 10g is an example of a reader that reads out data and program information recorded on the recording medium 10i.
- the reading unit 10g may include a connection terminal or device to which the recording medium 10i can be connected or inserted.
- Examples of the reading unit 10g include an adapter that complies with the Universal Serial Bus (USB), a drive device that accesses a recording disk, and a card reader that accesses a flash memory such as an SD card.
- the recording medium 10i may store a program 10h, and the reading unit 10g may read the program 10h from the recording medium 10i and store it in the memory unit 10d.
- Examples of the recording medium 10i include non-transitory computer-readable recording media such as magnetic/optical disks and flash memories.
- Examples of magnetic/optical disks include flexible disks, CDs (Compact Discs), DVDs (Digital Versatile Discs), Blu-ray Discs, and HVDs (Holographic Versatile Discs).
- Examples of flash memories include semiconductor memories such as USB memories and SD cards.
- HW in computer 10 may be increased or decreased (for example, adding or deleting any block), divided, or integrated in any combination, or buses may be added or deleted, etc., as appropriate.
- the causal exploration device 1 may illustratively comprise functions as a grouping processing unit 101, a group representative variable generation unit 102, an intra-group causal exploration unit 103, an inter-group causal exploration unit 104, and a causal relationship aggregation unit 105. These functions may be realized by the hardware of a computer 10 (see Fig. 2).
- the grouping processing unit 101 performs grouping (clustering) by collecting multiple variables that are similar in terms of causal relationships based on the similarity in the joint distribution of the multiple variables and classifying them into two or more groups (variable groups).
- the grouping processing unit 101 ideally, it is desirable to group together variables that can be considered the same in terms of true causal relationships. Although this depends on the assumed SEM and its estimation method, it is desirable to group together variables that will have as little impact as possible when grouped together. For example, it is desirable to group together variables that are connected to the same cause variable(s) and effect variable(s) into one group, or to group together independent variables that are neither the cause nor the result of other variables into one group.
- the grouping processing unit 101 estimates the true causal relationship based on the difference in the joint distribution of variables, and realizes grouping.
- the similarity can be determined by the degree of change in joint distribution when these variables are swapped. For example, if p(x,y,z,w) is similar to p(y,x,z,w) in which the variables x and y are swapped, then it can be determined that these x and y are similar from the perspective of joint distribution.
- the grouping processing unit 101 classifies multiple variables into two or more groups by determining the similarity between two variables (x, y) based on the degree of change in the joint distribution of (y, x) when these variables are swapped.
- the grouping processing unit 101 determines the similarity of a distribution p(x,y,z) of a variable set consisting of two or more variables selected from among a plurality of variables, according to the degree of change in the joint distribution of the distribution p(y,x,z) obtained by swapping some of the variables (x,y).
- the grouping processing unit 101 may first calculate the similarity between two variables and then perform hierarchical clustering, etc.
- the grouping processing unit 101 calculates the similarity for each pair of two variables (x, y).
- the grouping processing unit 101 may, for example, determine the similarity using a first method based on the difference in values between samples.
- the grouping processing unit 101 calculates the sum of the differences in values for each sample i using the following formula (1). This first method does not take into account interactions with other variables, but is simple and has low calculation costs.
- the grouping processor 101 may obtain the similarity using a second method based on deviation from a normal distribution.
- the grouping processing unit 101 may calculate the deviation value when each distribution is assumed to follow a normal distribution, and use the difference in values between the two distributions.
- the deviation value may be calculated using a normality confirmation procedure or test.
- the difference in the deviation values can be calculated using the squared error between the deviation values (or a vector of multiple types of deviation values).
- the grouping processing unit 101 may determine that the distributions p(x,y,z) and p(y,x,z) are similar from the perspective of joint distribution, for example, if the difference between the deviation value between the original distribution p(x,y,z) and the normal distribution and the deviation value between the distribution p(y,x,z) obtained by swapping the target pair (x,y) with respect to the original distribution p(x,y,z) and the normal distribution is less than a predetermined threshold.
- the grouping processing unit 101 performs hierarchical clustering for multiple variables based on the calculated similarity.
- FIG. 3 is a diagram illustrating hierarchical clustering by the grouping processing unit 101 of the causal exploration device 1 as an example of an embodiment.
- the vertical axis represents similarity, and shows an example of clustering variables x, y, and z based on similarity.
- the grouping processing unit 101 performs hierarchical clustering based on the similarity between every two variables, and then, when the desired number of variables is determined in subsequent processing (described in detail later), it realizes clustering that matches that number.
- FIG. 4 is a diagram showing the processing by the grouping processing unit 101 of the causal exploration device 1 as an example of an embodiment.
- each solid white circle represents a variable
- this Figure 4 shows an example in which the grouping processing unit 101 divides 11 variables into three groups (see dashed lines).
- the grouping processing unit 101 may regroup the multiple variables included in the group. This makes it possible to make the number of variables included in one group less than the threshold.
- the grouping processing unit 101 may group multiple variables and set, for each variable, information regarding the group to which the variable belongs. In addition, such grouping information is stored in a specified storage area of the storage unit 10d, etc.
- the group representative variable generation unit 102 sets a representative variable for each of the multiple groups set by the grouping processing unit 101.
- a representative variable is a variable that represents the group to which it belongs, and one representative variable is set for each group.
- the group representative variable generation unit 102 may set the representative variable using, for example, one of two methods, a first representative variable setting method and a second representative variable setting method, which are shown below.
- the group representative variable generation unit 102 sets one variable in the group as the representative variable.
- the group representative variable generation unit 102 when creating a new variable would make interpretation difficult, such as when the variable value has a clear meaning, it is desirable for the group representative variable generation unit 102 to set the representative variable using the first representative variable setting method.
- the group representative variable generation unit 102 may set the most upstream variable in the causal order within the group as the representative variable.
- the group representative variable generation unit 102 may cause the intra-group causal search unit 103, described below, to perform a causal search within the group in advance, and may set the most upstream variable as the representative based on the causal order between the variables within the group obtained as a result of the causal search.
- Downstream variables are influenced by upstream variables, but not vice versa, so by using the most upstream variable as a representative variable, it is possible to reduce the negative influence that the representative variable receives from other variables.
- the group representative variable generation unit 102 may select any one of these multiple upstream variables and set it as the representative variable.
- the order of causality within a group can be obtained from the results of a causal search performed by the intra-group causal search unit 103, which will be described later.
- the group representative variable generation unit 102 generates a new representative variable from a set of variables within the group.
- variables have similar meanings or are continuous measured values, and the variables can be interpreted by performing averaging or median calculations, it is desirable to set the representative variable using the second representative variable setting method.
- the group representative variable generation unit 102 may calculate the average or median of multiple variables (variable group) included in the group and set it as the representative variable.
- the group representative variable generation unit 102 may calculate the average or median of these multiple upstream variables and set them as the representative variable.
- the information on the representative variables set by the group representative variable generation unit 102 is stored in a specified storage area of the storage unit 10d.
- the intra-group causal search unit 103 performs causal search on the set of variables that make up each group for each of the multiple groups set by the grouping processing unit 101.
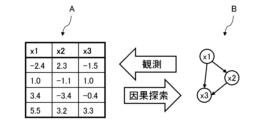
- FIG. 5 is a diagram for explaining causal discovery by the intra-group causal discovery unit 103 of the causal discovery device 1 as an example of an embodiment.
- symbol A indicates observed values for three variables x1 to x3
- symbol B illustrates the causal relationships for variables x1 to x3 estimated from the observed values shown in symbol A.
- symbol B in Figure 5 the causal relationships are indicated by arrows connecting the variables.
- FIG. 6 is a diagram for explaining the processing of the intra-group causal exploration unit 103 of the causal exploration device 1 as an example of an embodiment.
- symbol A indicates multiple grouped variables, and multiple variables indicated by solid open circles are included in one of multiple groups indicated by dot-dash circles.
- Symbol B indicates the state after causal exploration has been performed in each group, and within each group, multiple variables are connected by arrows indicating the causal relationships obtained as a result of the causal exploration.
- Information indicating the results of the causal search performed by the intra-group causal search unit 103 is stored in a specified storage area, etc., of the storage unit 10d.
- the inter-group causal search unit 104 performs causal search between the multiple representative variables set by the group representative variable generation unit 102.
- the multiple representative variables are values that represent the groups. Therefore, the causal search performed by the inter-group causal search unit 104 between the representative variables is equivalent to performing a causal search between multiple groups.
- the inter-group causal search unit 104 may perform causal search between multiple groups using a known method similar to that used by the intra-group causal search unit 103.
- Causal search for multiple representative variables can be performed using a known method, and the description thereof will be omitted.
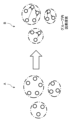
- FIG. 7 is a diagram for explaining the processing of the inter-group causal exploration unit 104 of the causal exploration device 1 as an example of an embodiment.
- symbol A indicates multiple grouped variables, similar to symbol A in Figure 6.
- Symbol B indicates the state after causal exploration has been performed on each representative variable (see the shaded circles) of the multiple groups shown in symbol A, with the multiple representative variables (groups) connected by dotted arrows indicating the causal relationships obtained as a result of the causal exploration.
- Information indicating the results of the causal search performed by the inter-group causal search unit 104 is stored in a specified storage area, etc., of the storage unit 10d.
- the causal relationship aggregation unit 105 aggregates the results of the causal search performed by the intra-group causal search unit 103 on the groups of variables that make up each group, and the results of the causal search performed by the inter-group causal search unit 104 on multiple groups. In this way, the causal relationship aggregation unit 105 generates hierarchical estimated causal relationships.
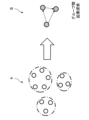
- FIG. 8 is a diagram for explaining the processing of the causal relationship aggregation unit 105 of the causal exploration device 1 as an example of an embodiment.
- symbol A indicates the causal search results by the inter-group causal search unit 104.
- symbol B indicates the causal search results by the intra-group causal search unit 103.
- Symbol C indicates an example in which the causal search results by the inter-group causal search unit 104 shown by symbol A and the causal search results by the intra-group causal search unit 103 shown by symbol B are combined.
- the causal relationship aggregation unit 105 may aggregate the results of the causal search by, for example, performing a process for each group that connects the most upstream variable in the causal order of a group downstream of the group to the most downstream variable in the causal order within the group based on the results of the causal search within each group performed by the intra-group causal search unit 103. Note that the upstream group and the downstream group can be determined based on the causal order obtained as a result of the causal search by the inter-group causal search unit 104.
- variable furthest downstream in the causal order may be referred to as the most downstream variable
- variable furthest upstream in the causal order may be referred to as the most upstream variable
- FIG. 9 is a diagram for explaining the processing of the causal relationship aggregation unit 105 of the causal exploration device 1 as an example of an embodiment.
- the symbol A indicates the results of the causal search by the intra-group causal search unit 103 and the causal search results by the inter-group causal search unit 104 for each variable in two groups (see symbols P1 and P2).
- the causal relationships obtained as a result of the causal search within a group are indicated by solid arrows, and the causal relationships obtained as a result of the causal search between groups are indicated by dotted lines.
- symbol B shows an example in which the causal search results by the intra-group causal search unit 103 shown in symbol A and the causal search results by the inter-group causal search unit 104 are aggregated.
- results of the causal search are aggregated by connecting the most downstream variable (see symbol P3) in the upstream group (see symbol P1) to the most upstream variable (see symbol P4) in the downstream group (see symbol P2) of the group (see symbol P1).
- the causal relationship summarization unit 105 may, for example, connect variables by drawing arrows between them on a graph, and use a model or the like to specify (estimate) what kind of formula the causal relationship between these connected variables follows.
- the model used may be, for example, a linear model such as LiNGAM, or a nonlinear model such as ANM, and can be implemented with various modifications.
- the causal relationship summarization unit 105 assigns a formula for the causal relationship to the arrow.
- one or more most downstream variables in the upstream group may be connected to each of these most upstream variables.
- causal relationships may be distributed from the most downstream variable in the upstream group to multiple most upstream variables in the downstream group.
- the value is distributed to multiple causal relationships in the process of propagating values based on the causal relationships. For example, the impact of changing the upstream is analyzed, and the degree of change is distributed downstream.
- the distribution may be performed, for example, using a method that uses a causal equation, or a method that distributes the degree of influence propagation during analysis, and can be modified as appropriate.
- a method that distributes the degree of influence propagation during analysis the change in the upstream variable is appropriately divided and passed downstream during the analysis.
- each of these downstream variables may be connected to one or more upstream variables in the downstream group.
- causal relationships may be concentrated from multiple downstream variables in the upstream group to the upstream variable of the downstream group.
- the causal relationship aggregation unit 105 may perform a process for each group that links all variables in a group to all variables in groups downstream of the group, based on the results of the causal exploration within each group performed by the intra-group causal exploration unit 103.
- FIG. 10 is a diagram for explaining the processing of the causal relationship aggregation unit 105 of the causal exploration device 1 as an example of an embodiment, and shows another example of a method for aggregating the results of causal exploration.
- symbol A indicates the results of causal search by the intra-group causal search unit 103 and the results of causal search by the inter-group causal search unit 104 for each variable in two groups (see symbols P1 and P2).
- the results of causal search within a group are indicated by solid arrows, and the results of causal search between groups are indicated by dotted lines.
- symbol B shows an example of aggregating the causal search results by the intra-group causal search unit 103 shown in symbol A and the causal search results by the inter-group causal search unit 104, and shows an example of aggregating using a method different from the method shown in Figure 9.
- the results of the causal search are aggregated by connecting all variables in an upstream group (see symbol P1) to all variables in a downstream group (see symbol P2) of the group (see symbol P1).
- causal relationship aggregation unit 105 it is not necessary for the causal relationship aggregation unit 105 to aggregate the results of the causal search performed by the intra-group causal search unit 103 on the set of variables constituting each group and the results of the causal search performed by the inter-group causal search unit 104 on multiple groups.
- the aggregation of the causal search results may be performed as necessary, and does not have to be performed if it is not necessary.
- a user may input a setting to that effect in advance and store the input result as a flag in a specified storage area of the storage unit 10d, etc.
- the causal relationship aggregation unit 105 may refer to this flag to determine whether to aggregate the causal search results by the intra-group causal search unit 103 and the causal search results by the inter-group causal search unit 104.
- the causal search results aggregated by the causal relationship aggregation unit 105, or the causal search results by the intra-group causal search unit 103 and the causal search results by the inter-group causal search unit 104 may be presented to the user. These causal search results may be presented to the user, for example, by outputting them to an output device such as a monitor (not shown).
- the user may then perform analysis directly on the causal relationships represented in a hierarchical structure, for example.
- FIG. 12 is a diagram showing an overview of processing by the causal exploration device 1 as an example of an embodiment.
- each solid white circle indicates a variable
- FIG. 12 shows an example in which the grouping processing unit 101 performs data analysis on 11 variables.
- step S1 the causal exploration device 1 reads multiple data (observed values) to be analyzed.
- the read data is stored in a specified memory area of the memory unit 10d.
- step S2 the causal exploration device 1 checks whether the number of samples is sufficient for the number of variables. For example, the causal exploration device 1 may determine whether the number of samples is sufficient by judging whether the number of samples is equal to or greater than a threshold that is set in advance based on the number of variables. For example, the threshold may be equal to the number of variables.
- step S2 If the number of samples is less than the threshold, i.e., if there are not enough samples (see NO route in step S2), proceed to step S3.
- step S3 the grouping processing unit 101 performs grouping by classifying the multiple variables into multiple groups that are similar in terms of causal relationships based on the similarity in the joint distribution of the multiple variables (see symbol P1 in Figure 12).
- step S4 the group representative variable generation unit 102 sets a representative variable for each of the multiple groups set by the grouping processing unit 101.
- step S5 the inter-group causal search unit 104 performs a causal search between the multiple representative variables set by the group representative variable generation unit 102. That is, the inter-group causal search unit 104 performs a causal search between multiple groups (inter-group causal search) (see symbol P2 in FIG. 12). After that, the process proceeds to step S7.
- step S6 the intra-group causal search unit 103 performs a causal search (intra-group causal search) on the set of variables that make up each group for each of the multiple groups set by the grouping processing unit 101 (see symbol P3 in Figure 12).
- steps S4 and S5 or the processing of step S6 may be performed first. Furthermore, the processing of steps S4 and S5 and the processing of step S6 may be performed in parallel, and may be modified as appropriate.
- step S7 the causal relationship aggregation unit 105 checks whether it is necessary to aggregate the results of the causal search performed by the intra-group causal search unit 103 on the set of variables that make up each group and the results of the causal search performed by the inter-group causal search unit 104 on multiple groups.
- the causal relationship aggregation unit 105 checks whether the results of the causal search need to be aggregated by referring to a flag indicating whether the user wants to output the results of the causal search for multiple variables as a single causal relationship (graph).
- step S7 If the result of the check in step S7 indicates that the results of the causal search need to be aggregated (see the YES route in step S7), proceed to step S8.
- step S8 the causal relationship aggregation unit 105 aggregates the results of the causal search performed by the intra-group causal search unit 103 on the set of variables that make up each group and the results of the causal search performed by the inter-group causal search unit 104 on multiple groups (see symbol P4 in Figure 12).
- step S8 is skipped and the process moves to step S9.
- step S2 determines whether there are a sufficient number of samples, i.e., the number of data is equal to or greater than the threshold.
- step S10 all data is used to perform causal exploration for the variables.
- the causal exploration device 1 performs causal exploration for the variables using all data read in step S1.
- the causal exploration device 1 may perform causal exploration using a known causal exploration method. Then, the process proceeds to step S9.
- step S9 the causal search results are output and presented to the user.
- the results of the causal search performed by the intra-group causal search unit 103 on the set of variables that make up each group and the results of the causal search performed by the inter-group causal search unit 104 on multiple groups are output.
- the causal relationship aggregation unit 105 aggregates the causal search results, these causal search results are output in an aggregated state.
- causal relationship aggregation unit 105 if the causal relationship aggregation unit 105 has not aggregated the causal search results, these causal search results are output in an unaggregated state. Then, the process ends.
- the grouping processing unit 101 performs grouping by collecting multiple variables that are similar in terms of causal relationships and classifying them into two or more groups (variable groups). Then, the intra-group causal exploration unit 103 performs causal exploration on the variable groups that make up each of the multiple groups set by the grouping processing unit 101.
- the inter-group causal search unit 104 also performs causal search between the multiple representative variables set by the group representative variable generation unit 102.
- the causal relationship aggregation unit 105 then aggregates the results of the causal search performed by the intra-group causal search unit 103 on the variable groups that make up each group and the results of the causal search performed by the inter-group causal search unit 104 between the multiple groups.
- the causal exploration for the group of variables that make up each group performed by the intra-group causal exploration unit 103 can be used for analysis.
- the group representative variable generation unit 102 sets a representative variable for each group, and the inter-group causal search unit 104 performs causal search for these representative variables. This makes it easy to realize causal search between multiple groups.
- the grouping processing unit 101 groups similar variables from the viewpoint of causal relationships based on the similarity of the joint distribution of the variables, thereby grouping multiple variables, and it is possible to group multiple variables without reducing the estimation accuracy of the causal search.
- the grouping processing unit 101 can perform grouping with low computational cost by calculating the similarity using the first method based on the difference in values between samples.
- the grouping processing unit 101 can perform grouping that is more appropriate from the perspective of causal exploration by calculating the similarity using a second method based on deviation from a normal distribution.
- the intra-group causal search unit 103 when the intra-group causal search unit 103 performs a causal search on variables within each group, there may be cases where the number of samples within that group is still small.
- the grouping processing unit 101 may further group the variables in the group.
- the multiple groups created by further grouping the variables in the group may be called subgroups. Also, dividing a group into multiple subgroups may be called subgrouping.
- the intra-group causal search unit 103 and the inter-group causal search unit 104 may perform causal searches within and outside the subgroups, and, if necessary, the causal relationship aggregation unit 105 may perform aggregation processing.
- these processes may be performed recursively. In other words, if these processes result in a subgroup with even fewer samples, the above processes may be applied to that subgroup again.
- step S6 of the flowchart shown in FIG. 11 A modified example of the process in step S6 of the flowchart shown in FIG. 11 will be explained with reference to the flowchart (steps S21 to S30) shown in FIG. 13.
- step S21 a loop process is started in which the control up to step S30 is repeatedly performed for all groups generated by the grouping processing unit 101.
- the intra-group causal exploration unit 103 checks whether the number of samples is sufficient.
- the causal exploration device 1 may determine whether the number of samples is sufficient by judging whether the number of samples is equal to or greater than a threshold that is set in advance based on the number of variables in the group.
- the threshold may be equal to the number of variables.
- step S23 If the number of samples is less than the threshold, i.e., if there are not enough samples (see NO route in step S22), proceed to step S23.
- step S23 the grouping processing unit 101 performs grouping by classifying the multiple variables into multiple subgroups that are similar in terms of causal relationships based on the similarity in the joint distribution of the multiple variables, in accordance with instructions from the intra-group causal search unit 103.
- step S24 the group representative variable generation unit 102 sets a representative variable for each of the multiple subgroups set by the grouping processing unit 101 in accordance with instructions from the intra-group causal search unit 103.
- step S25 the inter-group causal search unit 104 performs a causal search between the multiple representative variables set by the group representative variable generation unit 102 in accordance with instructions from the intra-group causal search unit 103. After that, the process proceeds to step S27.
- step S26 the intra-group causal search unit 103 performs causal search on the set of variables that constitute each subgroup for each of the multiple subgroups set by the grouping processing unit 101.
- steps S24 and S25 or the processing of step S26 may be performed first. Furthermore, the processing of steps S24 and S25 and the processing of step S26 may be performed in parallel, and may be modified as appropriate.
- step S27 the causal relationship aggregation unit 105, in accordance with instructions from the intra-group causal search unit 103, checks whether it is necessary to aggregate the results of the causal search performed by the intra-group causal search unit 103 on the groups of variables that make up each subgroup and the results of the causal search performed by the inter-group causal search unit 104 on multiple subgroups.
- the causal relationship aggregation unit 105 checks whether the results of the causal search need to be aggregated by referring to a flag indicating whether the user wants to output the results of the causal search for multiple variables as a single causal relationship (graph).
- step S27 If the result of the check in step S27 indicates that the results of the fruit search need to be aggregated (see the YES route in step S27), proceed to step S28.
- step S28 the causal relationship aggregation unit 105, following instructions from the intra-group causal search unit 103, aggregates the results of the causal search performed by the intra-group causal search unit 103 on the groups of variables that make up each subgroup, and the results of the causal search performed by the inter-group causal search unit 104 between multiple subgroups.
- step S28 is skipped and the process proceeds to step S30.
- step S22 determines whether there are a sufficient number of samples, i.e., the number of data is equal to or greater than the threshold (see the YES route in step S22). If the check in step S22 shows that there are a sufficient number of samples, i.e., the number of data is equal to or greater than the threshold (see the YES route in step S22), the process proceeds to step S29.
- step S29 a causal search is performed on the variables using all the data.
- the causal search device 1 may perform a causal search using a known causal search method. Then, the process proceeds to step S30.
- step S30 loop end processing corresponding to step S21 is performed. When processing for all groups is completed, this flow ends.
Landscapes
- Engineering & Computer Science (AREA)
- Theoretical Computer Science (AREA)
- Physics & Mathematics (AREA)
- Data Mining & Analysis (AREA)
- General Physics & Mathematics (AREA)
- General Engineering & Computer Science (AREA)
- Artificial Intelligence (AREA)
- Evolutionary Computation (AREA)
- Computing Systems (AREA)
- Mathematical Physics (AREA)
- Software Systems (AREA)
- Computational Mathematics (AREA)
- Mathematical Analysis (AREA)
- Algebra (AREA)
- Pure & Applied Mathematics (AREA)
- Mathematical Optimization (AREA)
- Probability & Statistics with Applications (AREA)
- Life Sciences & Earth Sciences (AREA)
- Bioinformatics & Cheminformatics (AREA)
- Bioinformatics & Computational Biology (AREA)
- Computer Vision & Pattern Recognition (AREA)
- Evolutionary Biology (AREA)
- Computational Linguistics (AREA)
- Management, Administration, Business Operations System, And Electronic Commerce (AREA)
Abstract
同時分布上での変数の類似性に基づき複数の変数を2つ以上のグループに分類し、2つ以上のグループそれぞれについて決定された代表変数の間の因果探索を行ない、2つ以上のグループそれぞれについて、各グループに含まれる変数の間の因果探索を行ない、代表変数の間の因果探索の結果と各グループに含まれる変数の間の因果探索の結果とを出力することにより、変数の数に対してサンプル数が不十分な場合においても、変数間の因果関係を推定できるようにする。
Description
本発明は、因果探索プログラム,因果探索方法および因果探索装置に関する。
昨今、与えられた変数の観測値から、それらの変数間の因果関係を推定する試みが盛んに行なわれている。
因果関係とは、単なる相関関係とは異なり、変数値の変化の関係性を表す。
例えば、xとyとに正の(もしくは負の)相関関係がある場合には、xの値が大きい(もしくは小さい)ときに、yの値も大きい(もしくは小さい)となる。
これに対して、xからyに正の(もしくは負の)因果関係がある場合には、xの値を増やす(もしくは減らす)と、yの値も増える(もしくは減る)。
なお、上記の例は、相関関係および因果関係がいずれも線形の関係性である場合について示す。非線形の関係性も存在し、その場合は、単に「正の」もしくは「負の」ではなく、その非線形関係に従った関係になる。
例えば、データマイニングや機械学習の分析結果に基づき値の変更を伴う施策立案を試みる場合には、相関関係ではなく因果関係が必要となる。具体的には、例えば、製品の不良品率yを下げるためには、どの設計パラメータxをどう変更すればよいか?といった問題に対する推定や、顧客購買率yを上げるためには、どういう営業施策xをその程度打てば良いか?といった問題に対する推定には、因果関係が用いられる。
データから因果関係を推定することを因果探索といってよい。因果探索のひとつの方法として、変数間の因果関係に何らかの仮定を課し、その仮定を満たしつつ、最もデータに当てはまる因果関係を観測値から推定することで、所望の変数間の因果関係を求める方法がある。
前記因果探索の方法において、変数間の因果関係を表す数式や、直接観測できない潜在変数の分布などに関する仮定をまとめたモデルを構造方程式モデル(Structural Equation Modeling:SEM)といってよい。SEMにおいては、観測変数と因果関係を持つような潜在変数を導入する。
代表的なSEMとして、例えば、Linear non-Gaussian acyclic model (LiNGAM)やAdditive noise causal model (ANM)が知られている。
LiNGAM においては、推定アルゴリズムとして、例えば、DirectLiNGAMが用いられ、ANMにおいては、推定アルゴリズムとして、例えば、RESITが用いられる。
SEMにおいては因果関係は式で表され、例えば、LiNGAMにおいては因果関係が線形式で表される。また、ANMにおいては因果関係が加法ノイズモデルの式で表される。
しかしながら、このような従来の因果探索手法は、観測変数の数や推定すべきモデルパラメータの数などに対してサンプル数(観測値の数)が必要数に満たない場合に適用できない。仮定するSEMの種類や、その具体的な推定アルゴリズムにもよるが、従来の因果探索手法には、例えば、およそ変数の数に対して10倍から100倍程度のサンプル数が必要とされる。
従来の因果探索手法においては、特に、サンプル数が必要数に満たない状況下では、推定アルゴリズムの想定外の挙動を引き起こし、正しい推定どころか従来の因果探索手法自体が正しく動かないおそれがある。
これは、例えば、アルゴリズム内部の反復処理において、徐々に各変数の差が縮退していき、その結果として、サンプル数に依存したある数の変数間の因果関係までしか推定できず、それ以外の変数を区別できなくなることが理由として考えられる。また、因果関係の式モデルのパラメータ数が多いため、少サンプル数下ではモデルへの過適合が起こり、結果として適合残差を元に因果関係を推定するアルゴリズムが機能しないことも理由として考えられる。
そこで、何らかの方法で事前に変数の数を減らすことが有効であるが、このように変数の数を減らすことは、別の問題を誘発しうる。
例えば、サンプル数が変数の数未満(サンプル数<変数の数)のような状況では、非常に多くの変数を削減する必要があり、仮に削減できたとしても、有用な分析結果とならない恐れがある。
また、手法の挙動の観点からも、適切な因果関係を推定するためには、できるだけ関係する変数は観測値として含める方が望ましい。
1つの側面では、本発明は、変数の数に対してサンプル数が不十分な場合においても、変数間の因果関係を推定できるようにすることを目的とする。
このため、この因果探索プログラムは、同時分布上での変数の類似性に基づき複数の変数を2つ以上のグループに分類し、前記2つ以上のグループそれぞれについて決定された代表変数の間の因果探索を行ない、前記2つ以上のグループそれぞれについて、各グループに含まれる変数の間の因果探索を行ない、前記代表変数の間の因果探索の結果と前記各グループに含まれる変数の間の因果探索の結果とを出力する処理をコンピュータに実行させる。
一実施形態によれば、変数の数に対してサンプル数が不十分な場合においても、変数間の因果関係を推定することができる。
以下、図面を参照して本因果探索プログラム,因果探索方法および因果探索装置にかかる実施の形態を説明する。ただし、以下に示す実施形態はあくまでも例示に過ぎず、実施形態で明示しない種々の変形例や技術の適用を排除する意図はない。すなわち、本実施形態を、その趣旨を逸脱しない範囲で種々変形して実施することができる。また、各図は、図中に示す構成要素のみを備えるという趣旨ではなく、他の機能等を含むことができる。
(A)構成
図1は実施形態の一例としての因果探索装置1の構成を模式的に示す図である。
図1は実施形態の一例としての因果探索装置1の構成を模式的に示す図である。
因果探索装置1は、与えられた変数の観測値(データ)から、それらの変数間の因果関係を推定することで因果探索を行なう情報処理装置である。因果探索装置1をデータ分析装置1といってよい。
〔A-1〕ハードウェア構成例
図2は実施形態の一例としての因果探索装置1の機能を実現するコンピュータ10のハードウェア(HW)構成例を示すブロック図である。因果探索装置1の機能を実現するHWリソースとして、複数のコンピュータが用いられる場合は、各コンピュータが図2に例示するHW構成を備えてよい。
図2は実施形態の一例としての因果探索装置1の機能を実現するコンピュータ10のハードウェア(HW)構成例を示すブロック図である。因果探索装置1の機能を実現するHWリソースとして、複数のコンピュータが用いられる場合は、各コンピュータが図2に例示するHW構成を備えてよい。
図2に示すように、コンピュータ10は、HW構成として、例示的に、プロセッサ10a、グラフィック処理装置10b、メモリ10c、記憶部10d、IF(Interface)部10e、IO(Input / Output)部10f、および読取部10gを備えてよい。
プロセッサ10aは、種々の制御や演算を行なう演算処理装置の一例であり、制御部に相当する。プロセッサ10aは、コンピュータ10内の各ブロックとバス10jで相互に通信可能に接続されてよい。なお、プロセッサ10aは、複数のプロセッサを含むマルチプロセッサであってもよいし、複数のプロセッサコアを有するマルチコアプロセッサであってもよく、或いは、マルチコアプロセッサを複数有する構成であってもよい。
プロセッサ10aとしては、例えば、CPU、MPU、APU、DSP、ASIC、FPGA等の集積回路(IC;integrated circuit)が挙げられる。なお、プロセッサ10aとして、これらの集積回路の2以上の組み合わせが用いられてもよい。CPUはCentral Processing Unitの略称であり、MPUはMicro Processing Unitの略称である。APUはAccelerated Processing Unitの略称である。DSPはDigital Signal Processorの略称であり、ASICはApplication Specific ICの略称であり、FPGAはField-Programmable Gate Arrayの略称である。
グラフィック処理装置10bは、IO部10fのうちのモニタ等の出力装置に対する画面表示制御を行なう。グラフィック処理装置10bとしては、種々の演算処理装置、例えば、GPU(Graphics Processing Unit)、APU、DSP、ASIC又はFPGA等の集積回路(IC)が挙げられる。
メモリ10cは、種々のデータやプログラム等の情報を格納するHWの一例である。メモリ10cとしては、例えばDRAM(Dynamic Random Access Memory)等の揮発性メモリ、および、PM(Persistent Memory)等の不揮発性メモリ、の一方または双方が挙げられる。
記憶部10dは、種々のデータやプログラム等の情報を格納するHWの一例である。記憶部10dとしては、HDD(Hard Disk Drive)等の磁気ディスク装置、SSD(Solid State Drive)等の半導体ドライブ装置、不揮発性メモリ等の各種記憶装置が挙げられる。不揮発性メモリとしては、例えば、フラッシュメモリ、SCM(Storage Class Memory)、ROM(Read Only Memory)等が挙げられる。
記憶部10dは、コンピュータ10の各種機能の全部若しくは一部を実現するプログラム10h(因果探索プログラム)を格納してよい。
例えば、因果探索装置1のプロセッサ10aは、記憶部10dに格納されたプログラム10hをメモリ10cに展開して実行することにより、後述する因果探索装置1を構成する各部としての機能を実現できる。また、記憶部10dは、因果探索装置1を構成する各部が処理の過程で生成する各種データを記憶してもよい。
IF部10eは、本コンピュータ10と他のコンピュータとの間の接続及び通信の制御等を行なう通信IFの一例である。例えば、IF部10eは、イーサネット(登録商標)等のLAN(Local Area Network)、或いは、FC(Fibre Channel)等の光通信等に準拠したアダプタを含んでよい。当該アダプタは、無線及び有線の一方又は双方の通信方式に対応してよい。
例えば、因果探索装置1は、IF部10e及びネットワークを介して、他の情報処理装置と相互に通信可能に接続されてよい。なお、プログラム10hは、当該通信IFを介して、ネットワークからコンピュータ10にダウンロードされ、記憶部10dに格納されてもよい。
IO部10fは、入力装置、及び、出力装置、の一方又は双方を含んでよい。入力装置としては、例えば、キーボード、マウス、タッチパネル等が挙げられる。出力装置としては、例えば、モニタ、プロジェクタ、プリンタ等が挙げられる。また、IO部10fは、入力装置及び表示装置が一体となったタッチパネル等を含んでもよい。出力装置は、グラフィック処理装置10bに接続されてよい。
読取部10gは、記録媒体10iに記録されたデータやプログラムの情報を読み出すリーダの一例である。読取部10gは、記録媒体10iを接続可能又は挿入可能な接続端子又は装置を含んでよい。読取部10gとしては、例えば、USB(Universal Serial Bus)等に準拠したアダプタ、記録ディスクへのアクセスを行なうドライブ装置、SDカード等のフラッシュメモリへのアクセスを行なうカードリーダ等が挙げられる。なお、記録媒体10iにはプログラム10hが格納されてもよく、読取部10gが記録媒体10iからプログラム10hを読み出して記憶部10dに格納してもよい。
記録媒体10iとしては、例示的に、磁気/光ディスクやフラッシュメモリ等の非一時的なコンピュータ読取可能な記録媒体が挙げられる。磁気/光ディスクとしては、例示的に、フレキシブルディスク、CD(Compact Disc)、DVD(Digital Versatile Disc)、ブルーレイディスク、HVD(Holographic Versatile Disc)等が挙げられる。フラッシュメモリとしては、例示的に、USBメモリやSDカード等の半導体メモリが挙げられる。
上述したコンピュータ10のHW構成は例示である。従って、コンピュータ10内でのHWの増減(例えば任意のブロックの追加や削除)、分割、任意の組み合わせでの統合、または、バスの追加若しくは削除等は適宜行なわれてもよい。
〔A-2〕機能構成例
図1に示すように、因果探索装置1は、例示的に、グループ化処理部101,グループ代表変数生成部102,グループ内因果探索部103,グループ間因果探索部104および因果関係集約部105としての機能を備えてよい。これらの機能は、コンピュータ10のハードウェア(図2参照)により実現されてよい。
図1に示すように、因果探索装置1は、例示的に、グループ化処理部101,グループ代表変数生成部102,グループ内因果探索部103,グループ間因果探索部104および因果関係集約部105としての機能を備えてよい。これらの機能は、コンピュータ10のハードウェア(図2参照)により実現されてよい。
グループ化処理部101は、複数の変数についての同時分布上での類似性に基づき、複数の変数を因果関係の観点から類似するものどうしを集めて、2つ以上のグループ(変数群)に分類することで、グルーピング(クラスタリング)を行なう。
グループ化処理部101においては、理想的には、真の因果関係の上で同一視してもよいものをまとめることが望ましい。仮定するSEMやその推定手法に依存するが、できるだけまとめても影響が少ない変数をまとめることが望ましい。例えば、同じ原因変数(群)と結果変数(群)とつながっている変数群を一つのグループにまとめたり、他の変数の原因にも結果にもなってない独立な変数群を一つのグループにまとめることが望ましい。
しかしながら、推定前の段階で真の因果関係はわからないので、このようなグルーピングを実現することは難しい。
そこで、本因果探索装置1においては、グループ化処理部101は、変数の同時分布の違いに基づいて、真の因果関係を推定してグループ化を実現する。
ここで、変数の同時分布が類似している変数群は、因果関係の上で類似していると推測できる。そこで、ある2変数x,yについて、これらの変数を入れ替えたときの同時分布の変化の度合いで類似性を定めることができる。例えば、p(x,y,z,w)と、変数x,yを入れ替えたp(y,x,z,w)とが似ている場合に、これらのxとyとは同時分布の観点から類似していると判断してよい。
グループ化処理部101は、ある2変数(x,y)について、これらの変数を入れ替えたとき(y,x)の同時分布の変化の度合いで類似性を定める処理で、複数の変数を2つ以上のグループに分類する処理を実現する。
グループ化処理部101は、複数の変数の中から選択した2つ以上の変数による変数群に対して、その分布p(x,y,z)に対して、この変数群中の一部(x,y)を入れ替えた分布 p(y,x,z)の同時分布上における変化の度合いに応じて、類似性を定めるのである。
グループ化処理部101は、2変数ずつの類似度を最初に計算し、階層型クラスタリング等をしてよい。
以下に、3変数(x, y, z)の場合を例に、グループ化処理部101による分布の類似性に基づくグループ化手法を説明する。
グループ化処理部101は、2変数組(x,y)ごとに類似度を計算する。
ここで、元の分布p(x,y,z)と、対象のペア(x,y)を入れ替えた分布p(y,x,z)との差を類似度(逆類似度)とする。以下、s=[x,y,z],t=[y,x,z]と表す。
グループ化処理部101は、例えば、サンプル間の値の差に基づく第1の手法を用いて類似度を求めてよい。
第1の手法においては、グループ化処理部101は、サンプルiごとの値の差分の総和を以下の式(1)を用いて算出する。この第1の手法によれば、他の変数との作用が考慮されないが、単純で計算コストがよい。

第2の手法においては、グループ化処理部101は、各分布が正規分布に従うとした場合のズレの値を計算し、2分布間での値の差を利用してよい。ズレの値は、正規性の確認手順や検定を用いて計算してよい。
ズレの値の差は、ズレの値(もしくはそれを複数種類並べたベクトル)間の二乗誤差等で計算してよい。
グループ化処理部101は、例えば、元の分布p(x,y,z)と正規分布とのズレの値と、元の分布p(x,y,z)に対して対象のペア(x,y)を入れ替えた分布 p(y,x,z)と正規分布とのズレの値との差が所定の閾値以下である場合に、分布p(x,y,z)と分布 p(y,x,z)とは同時分布の観点から類似していると判断してよい。
本第2の手法によれば、多くの因果探索手法が正規分布からのずれを手掛かりとするため、その情報を明に利用することで、より因果探索の観点から適した類似度となる。
さらに、グループ化処理部101は、算出した類似度に基づいて、複数の変数に対する階層型クラスタリングを行なう。
図3は実施形態の一例としての因果探索装置1のグループ化処理部101による階層型クラスタリングを例示する図である。
この図3において、縦軸は類似度を示しており、変数x,y,zを類似度に基づいてクラスタリングする例を示している。
グループ化処理部101は、2変数毎の類似度に基づき階層型クラスタリングを行なっておくことで、後続する処理(詳細は後述)において所望の変数の数が決まった際に、それに合わせたクラスタリングを実現する。
図4は実施形態の一例としての因果探索装置1のグループ化処理部101による処理を示す図である。
この図4において、符号Aはグルーピング前の複数の変数を、符号Bはグルーピング後の複数の変数を、それぞれ示している。
図4中において、実線の白抜き丸はそれぞれ変数を示しており、この図4においては、グループ化処理部101が11個の変数を3つのグループ(一点鎖線参照)にグループ分けする例を示している。
また、グループ化処理部101は、生成した複数のグループにおいて、グループに含まれる変数の数が閾値以上の場合に、当該グループに含まれる複数の変数に対して、再度グルーピングを行なってよい。これにより、1つのグループ内に含まれる変数の数を閾値未満にすることができる。
グループ化処理部101は、複数の変数をグループ分けすることで、各変数に対して当該変数が属するグループに関する情報を設定してよい。また、このようなグループ分けの情報は、記憶部10dの所定の記憶領域等に記憶される。
グループ代表変数生成部102は、グループ化処理部101が設定した複数のグループのそれぞれに対して代表変数を設定する。
代表変数は、当該代表変数が属するグループを代表する変数であり、グループ毎に1つの代表変数が設定される。
グループ代表変数生成部102は、例えば、以下に示す第1の代表変数設定方法と第2の代表変数設定方法との2つの手法のうちいずれかの手法を用いて代表変数を設定してよい。
第1の代表変数設定方法においては、グループ代表変数生成部102は、グループ内の1つの変数を代表変数として設定する。
例えば、変数の値に明確な意味があるなど、新たに変数を作ることで解釈等が難しくなる場合に、グループ代表変数生成部102は、第1の代表変数設定方法を用いて代表変数を設定することが望ましい。
例えば、グループ代表変数生成部102は、グループ内における因果の順序の最上流変数を代表変数としてよい。この場合、グループ代表変数生成部102は、後述するグループ内因果探索部103に予めグループ内の因果探索を実施させ、当該因果探索の結果として得られたグループ内の変数間の因果の順序に基づき、最上流の変数を代表としてよい。
下流の変数は上流の変数からの影響を受けるが、逆はそうではないので、最上流の変数を代表変数として用いることで、当該代表変数が他の変数から受ける悪影響を低減することができる。
また、最上流の変数が複数検出された場合には、グループ代表変数生成部102は、これらの複数の最上流の変数の中から任意の1つの変数を選択して、代表変数として設定してよい。
なお、グループ内における因果の順序は、後述するグループ内因果探索部103による因果探索の結果から取得することができる。
第2の代表変数設定方法においては、グループ代表変数生成部102は、グループ内の変数群から新たに代表変数を生成する。
例えば、変数が類似した意味を有する場合や連続値の測定値である場合など、平均処理や中央値の算出処理などを行なっても変数の解釈が可能な場合には、第2の代表変数設定方法を用いて代表変数を設定することが望ましい。
例えば、グループ代表変数生成部102は、グループ内に含まれる複数の変数(変数群)の平均値や中央値を算出して代表変数として設定してよい。
また、グループ内において最上流の変数が複数検出された場合には、グループ代表変数生成部102は、これらの複数の最上流変数の平均値や中央値を算出して代表変数として設定してよい。
グループ代表変数生成部102が設定した代表変数の情報は、記憶部10dの所定の記憶領域等に記憶される。
グループ内因果探索部103は、グループ化処理部101が設定した複数のグループのそれぞれに対して、各グループを構成する変数群に対して因果探索を行なう。
因果探索では,変数間の因果関係に何らかの仮定を課し、その仮定を満たしつつ、最もデータに当てはまる因果関係を観測値から推定することで、所望の変数間の因果関係を求める。
図5は実施形態の一例としての因果探索装置1のグループ内因果探索部103による因果探索を説明するための図である。
図5に示す例において、符号Aは3つの変数x1~x3についての観測値を示し、符号Bは符号Aに示す観測値から推定した、変数x1~x3についての因果関係を例示する。この図5の符号Bにおいては、因果関係を変数間を接続する矢印で示す。
各グループの変数群に対する因果探索は、既知の手法を用いて行なうことができ、その詳細な説明は省略する。
図6は実施形態の一例としての因果探索装置1のグループ内因果探索部103の処理を説明するための図である。
この図6において、符号Aはグルーピングされた複数の変数を示しており、実線の白抜き丸で示される複数の変数が、一点鎖線の丸で示す複数のグループのいずれかに含まれている。また、符号Bは各グループのそれぞれにおいて因果探索を行なった状態を示しており、各グループ内において、複数の変数間が因果探索の結果得られた因果関係を示す矢印で連結されている。
グループ内因果探索部103が行なった因果探索の結果を示す情報は、記憶部10dの所定の記憶領域等に記憶される。
グループ間因果探索部104は、グループ代表変数生成部102が設定した複数の代表変数間の因果探索を行なう。
複数の代表変数は、それぞれグループを代表する値である。従って、グループ間因果探索部104が代表変数間において行なう因果探索は、複数のグループ間において因果探索を行なうことと同意である。
グループ間因果探索部104はグループ内因果探索部103と同様の既知の手法を用いて、複数のグループ間における因果探索を行なってよい。複数の代表変数に対する因果探索は、既知の手法を用いて行なうことができ、その説明は省略する。
図7は実施形態の一例としての因果探索装置1のグループ間因果探索部104の処理を説明するための図である。
この図7において、符号Aは、図6の符号Aと同様に、グルーピングされた複数の変数を示している。また、符号Bは符号Aに示した複数のグループの各代表変数(斜線を付した丸参照)に対して因果探索を行なった状態を示しており、複数の代表変数(グループ)間が因果探索の結果得られた因果関係を示す点線矢印で連結されている。
グループ間因果探索部104が行なった因果探索の結果を示す情報は、記憶部10dの所定の記憶領域等に記憶される。
因果関係集約部105は、グループ内因果探索部103が各グループを構成する変数群に対して行なった因果探索の結果と、グループ間因果探索部104が複数のグループ間に対して行なった因果探索の結果とを集約する。これにより、因果関係集約部105は、階層型の推定された因果関係を生成する。
図8は実施形態の一例としての因果探索装置1の因果関係集約部105の処理を説明するための図である。
この図8において、符号Aはグループ間因果探索部104による因果探索結果を示す。また、符号Bはグループ内因果探索部103による因果探索結果を示す。符号Cは、符号Aに示したグループ間因果探索部104による因果探索結果と、符号Bに示したグループ内因果探索部103による因果探索結果とを集約した例を示す。
因果関係集約部105は、例えば、グループ内因果探索部103によって行なわれた各グループ内の因果探索の結果に基づいて、グループ内における因果の順序の最下流の変数に、当該グループの下流側のグループにおける因果の順序の最上流の変数をつなげる処理を、各グループに対してそれぞれ行なうことで、因果探索の結果の集約を行なってよい。なお、上流側のグループと下流側のグループとは、グループ間因果探索部104の因果探索の結果得られる因果の順序に基づいて判断することができる。
以下、因果の順序における最下流の変数を最下流変数といってよく、因果の順序における最上流の変数を最上流変数といってよい。
図9は実施形態の一例としての因果探索装置1の因果関係集約部105の処理を説明するための図である。
この図9において、符号Aは、2つのグループ(符号P1,P2参照)の各変数に対する、グループ内因果探索部103による因果探索結果と、グループ間因果探索部104による因果探索結果とを示す。この符号Aにおいては、グループ内における因果探索の結果得られた因果関係を実線矢印で示し、グループ間に対する因果探索の結果得られた因果関係を点線で示す。
また、符号Bは、符号Aに示したグループ内因果探索部103による因果探索結果とグループ間因果探索部104による因果探索結果とを集約した例を示す。
この図9に符号Bで示す例においては、上流側のグループ(符号P1参照)内における最下流変数(符号P3参照)に、当該グループ(符号P1参照)の下流側のグループ(符号P2参照)における最上流変数(符号P4参照)をつなげることで、因果探索結果の集約を行なっている。
因果関係集約部105は、例えば、グラフ上において変数間に矢印を引くことで、これらの変数をつなげ、これらのつないだ変数間がどのような式に従う因果関係になっているかをモデル等を用いて規定(推定)してよい。使用するモデルとして、例えば、LiNGAMのような線形モデルを用いてもよく、また、ANMのような非線形モデルを用いてもよく、種々変形して実施することができる。因果関係集約部105は、当該矢印に対して因果関係の式を割り当てる。
例えば、上流側のグループと下流側のグループとの間に線形関係がある場合において、これらの上流側のグループの変数と下流側のグループの変数とをつなぐ際には、因果関係集約部105は、グラフ上で変数間に矢印を引き、この矢印が示す因果関係の式として線形式を割り当ててよい。
一例として、上流グループαと下流グループβがα→βとして推定されている場合において、このとき、β=5.0×α+eのような、係数5の線形関係にあると推定されているとする。これらαとβにそれぞれ含まれる変数xとyをつなぎたいとしたときに、一つの方法としては,グラフ上でxからyに矢印をつなぎ、かつその矢印が示す因果関係の式として,y=5.0×x+e1のように、係数5の線形式を割り当てる。
なお、下流側のグループにおいて、当該グループ内における最上流変数が複数ある場合には、これら最上流変数のそれぞれに対して、上流側のグループ内における最下流の1つ以上の変数をつなげてよい。すなわち、上流側のグループ内における最下流変数から、下流側のグループの複数の最上流変数に対して因果関係の分配を行なってよい。
この分配においては、グラフ構造だけでなく因果関係の関数まで推定されている場合に、因果関係に基づいて値を伝播させる処理において、複数の因果関係に値を分配させる。例えば、上流を変化させたときの影響を分析し,下流にその変化の度合いを分配する。
分配は、例えば、因果関係の式を用いて分配する手法を用いてもよく、また、分析時に影響の伝播の度合いを分配する手法を用いてもよく、適宜、変形して実施することができる。分析時に影響の伝播の度合いを分配させる手法においては、分析時に、上流変数の変化分を適宜分割して、下流に流すように分析を行なう。
また、上流側のグループにおいて、当該グループ内における最下流変数が複数ある場合には、これら最下流変数のそれぞれから、下流側のグループ内における1つ以上の最上流の変数をつなげてよい。すなわち、上流側のグループ内における複数の最下流変数から、下流側のグループの最上流変数に対して因果関係の集中を行なってよい。
また、因果関係集約部105は、因果探索結果の集約方法の他の例として、グループ内因果探索部103によって行われた各グループ内の因果探索の結果に基づいて、グループ内における全ての変数に、当該グループの下流側のグループにおける全ての変数をつなげる処理を、各グループに対してそれぞれ行なってよい。
図10は実施形態の一例としての因果探索装置1の因果関係集約部105の処理を説明するための図であり、因果探索結果の集約方法の他の例を示す。
この図10において、符号Aは、図9の符号Aと同様に、2つのグループ(符号P1,P2参照)の各変数に対する、グループ内因果探索部103による因果探索結果と、グループ間因果探索部104による因果探索結果とを示す。この符号Aにおいては、グループ内における因果探索の結果を実線矢印で示し、グループ間に対する因果探索の結果を点線で示す。
また、符号Bは、符号Aに示したグループ内因果探索部103による因果探索結果と、グループ間因果探索部104による因果探索結果とを集約した例を示すものであり、図9に示した手法とは異なる手法を用いて集約する例を示す。
この図10に符号Bで示す例においては、上流側のグループ(符号P1参照)内における全ての変数に、当該グループ(符号P1参照)の下流側のグループ(符号P2参照)における全ての変数をそれぞれつなげることで、因果探索結果の集約を行なっている。
なお、因果関係集約部105による、グループ内因果探索部103が各グループを構成する変数群に対して行なった因果探索の結果と、グループ間因果探索部104が複数のグループ間に対して行なった因果探索の結果との集約は必ずしも行なう必要はない。すなわち、因果探索結果の集約は、必要に応じて行なえばよく、不要な場合には行なわなくともよい。
例えば、ユーザは、複数の変数に対する因果探索の結果を1つの因果関係(グラフ)として出力することを希望する場合には、予めその旨の設定入力を行ない、その入力結果をフラグとして記憶部10dの所定の記憶領域等に記憶してよい。
因果関係集約部105は、このフラグを参照することで、グループ内因果探索部103による因果探索結果と、グループ間因果探索部104による因果探索結果とを集約するか否かを判断してよい。
因果関係集約部105により集約された因果探索結果、もしくは、グループ内因果探索部103による因果探索結果とグループ間因果探索部104による因果探索結果とは、ユーザに対して提示されてよい。これらの因果探索結果は、例えば、図示しないモニタ等の出力装置に出力することでユーザに提示してもよい。
ユーザは提示された因果探索結果に基づき、例えば、階層型構造で表される因果関係上でそのまま分析を行なってよい。
(B)動作
上述の如く構成された実施形態の一例としての因果探索装置1の処理を、図12を参照しながら図11に示すフローチャート(ステップS1~S10)に従って説明する。
上述の如く構成された実施形態の一例としての因果探索装置1の処理を、図12を参照しながら図11に示すフローチャート(ステップS1~S10)に従って説明する。
なお、図12は、実施形態の一例としての因果探索装置1による処理の概要を示す図である。図12中において、実線の白抜き丸はそれぞれ変数を示しており、この図12においては、グループ化処理部101が11個の変数に対してデータ分析を行なう例を示している。
ステップS1において、因果探索装置1は、分析対象の複数のデータ(観測値)の読み込みを行なう。読み込まれたデータは、記憶部10dの所定の記憶領域等に記憶される。
ステップS2において、因果探索装置1は、変数の数に対してサンプル数が十分あるかを確認する。例えば、因果探索装置1は、サンプル数が変数の数に基づいて予め設定される閾値以上であるかを判断することで、サンプル数が十分あるかを判断してよい。例えば、閾値=変数の数であってよい。
サンプル数が閾値未満の場合、すなわち、サンプル数が十分にない場合には(ステップS2のNOルート参照)、ステップS3に移行する。
ステップS3において、グループ化処理部101が、複数の変数についての同時分布上での類似性に基づき、複数の変数を因果関係の観点から類似する複数のグループに分類することで、グルーピングを行なう(図12の符号P1参照)。
ステップS4において、グループ代表変数生成部102が、グループ化処理部101が設定した複数のグループのそれぞれに対して代表変数を設定する。
ステップS5において、グループ間因果探索部104が、グループ代表変数生成部102が設定した複数の代表変数間の因果探索を行なう。すなわち、グループ間因果探索部104は、複数のグループ間において因果探索(グループ間因果探索)を行なう(図12の符号P2参照)。その後、処理はステップS7に移行する。
また、ステップS6において、グループ内因果探索部103が、グループ化処理部101が設定した複数のグループのそれぞれに対して、各グループを構成する変数群に対して因果探索(グループ内因果探索)を行なう(図12の符号P3参照)。
なお、ステップS4,S5の処理と、ステップS6の処理とはいずれを先に行なってもよい。また、これらのステップS4,S5の処理と、ステップS6の処理とを並行して実施してもよく、適宜変更して実施することができる。
ステップS7において、因果関係集約部105は、グループ内因果探索部103が各グループを構成する変数群に対して行なった因果探索の結果と、グループ間因果探索部104が複数のグループ間に対して行なった因果探索の結果とを集約する必要があるかを確認する。
例えば、因果関係集約部105は、ユーザが複数の変数に対する因果探索の結果を1つの因果関係(グラフ)として出力するか否かを示すフラグを参照することで、因果探索の結果を集約する必要があるかを確認する。
ステップS7における確認の結果、因果探索の結果を集約する必要がある場合には(ステップS7のYESルート参照)、ステップS8に移行する。
ステップS8において、因果関係集約部105は、グループ内因果探索部103が各グループを構成する変数群に対して行なった因果探索の結果と、グループ間因果探索部104が複数のグループ間に対して行なった因果探索の結果とを集約する(図12の符号P4参照)。
また、ステップS7における確認の結果、因果探索の結果を集約する必要がない場合には(ステップS7のNOルート参照)、ステップS8をスキップしてステップS9に移行する。
一方、ステップS2における確認の結果、サンプル数が十分にある場合、すなわち、データ数が閾値以上の場合には、ステップS10に移行する。
ステップS10においては、全てのデータを用いて変数に対する因果探索を行なう。因果探索装置1はステップS1において読み込んだ全てのデータを用いて変数の因果探索を行なう。このステップS10において、本因果探索装置1は、既知の因果探索手法を用いて因果探索を行なってよい。その後、ステップS9に移行する。
ステップS9において、因果探索結果が出力され、ユーザに提示される。例えば、グループ内因果探索部103が各グループを構成する変数群に対して行なった因果探索の結果と、グループ間因果探索部104が複数のグループ間に対して行なった因果探索の結果とが出力される。この際、因果関係集約部105が因果探索結果の集約を行なった場合には、これらの因果探索結果は、集約された状態で出力される。
また、因果関係集約部105が因果探索結果の集約を行っていない場合には、これらの因果探索結果は、集約されない状態で出力される。その後、処理を終了する。
(C)効果
このように、本発明の一実施形態としての因果探索装置1によれば、グループ化処理部101が、複数の変数を因果関係の観点から類似するものどうしを集めて、2つ以上のグループ(変数群)に分類することで、グルーピングを行なう。そして、グループ内因果探索部103が、グループ化処理部101が設定した複数のグループのそれぞれに対して、各グループを構成する変数群に対して因果探索を行なう。
このように、本発明の一実施形態としての因果探索装置1によれば、グループ化処理部101が、複数の変数を因果関係の観点から類似するものどうしを集めて、2つ以上のグループ(変数群)に分類することで、グルーピングを行なう。そして、グループ内因果探索部103が、グループ化処理部101が設定した複数のグループのそれぞれに対して、各グループを構成する変数群に対して因果探索を行なう。
これにより、グループ内因果探索部103が因果探索を行なう対象の変数を削減し、サンプル数が少ない場合であっても推定精度を低下させることなく因果探索を実現することができる。
また、グループ間因果探索部104が、グループ代表変数生成部102が設定した複数の代表変数間の因果探索を行なう。そして、因果関係集約部105が、グループ内因果探索部103が各グループを構成する変数群に対して行なった因果探索の結果と、グループ間因果探索部104が複数のグループ間に対して行なった因果探索の結果とを集約する。
これにより、全変数に対する因果探索の分析処理を1つの因果関係(グラフ)として取得することができる。
なお、全変数に対する因果探索の分析処理を1つの因果関係(グラフ)として取得する必要がない場合には、グループ内因果探索部103による各グループを構成する変数群に対する因果探索を分析に利用すればよい。
また、グループ代表変数生成部102が各グループのそれぞれに対して代表変数を設定し、グループ間因果探索部104が、これらの代表変数に対して因果探索を行なう。これにより、複数のグループ間における因果探索を容易に実現することができる。
グループ化処理部101が、変数の同時分布の類似性に基づき、因果関係の観点から類似する変数どうしをグループ化することで、複数の変数のグルーピングを行なうことで、因果探索の推定精度を低下させることなく、複数の変数のグルーピングを行なうことができる。
グループ化処理部101が、サンプル間の値の差に基づく第1の手法を用いて類似度を求めることで、少ない計算コストでグルーピングを行なうことができる。
また、グループ化処理部101が、正規分布とのずれに基づく第2の手法を用いて類似度を求めることで、より因果探索の観点から適したグルーピングを行なうことができる。
(D)その他
そして、開示の技術は上述した実施形態に限定されるものではなく、本実施形態の趣旨を逸脱しない範囲で種々変形して実施することができる。本実施形態の各構成および各処理は、必要に応じて取捨選択することができ、あるいは適宜組み合わせてもよい。
そして、開示の技術は上述した実施形態に限定されるものではなく、本実施形態の趣旨を逸脱しない範囲で種々変形して実施することができる。本実施形態の各構成および各処理は、必要に応じて取捨選択することができ、あるいは適宜組み合わせてもよい。
上述した実施形態において、グループ内因果探索部103が各グループ内の変数に対して因果探索を行なう際に、当該グループ内において依然としてサンプル数が少ないケースも考えられる。
その場合に、当該グループ内の変数に対して、グループ化処理部101が更なるグループ化を行なってもよい。グループ内の変数を更にグルーピングして作成した複数のグループをサブグループといってよい。また、グループを複数のサブグループにグループ分けすることをサブグループ化といってよい。
そして、グループ内因果探索部103およびグループ間因果探索部104が、サブグループ内外の因果探索,および、必要に応じて因果関係集約部105による集約処理を行なってよい。
また、これらの処理は再帰的に行なってよい。すなわちこれらの処理の結果、さらに依然としてサンプルが少ないサブグループができたとして、そのサブグループに対して再度、上記処理を適用してよい。
図11に示したフローチャートのステップS6における処理の変形例を、図13に示すフローチャート(ステップS21~S30)に従って説明する。
ステップS21においては、グループ化処理部101が生成した全てのグループに対して、ステップS30までの制御を繰り返し実施するループ処理を開始する。
ステップS22において、グループ内因果探索部103は、サンプル数が十分あるかを確認する。例えば、因果探索装置1は、サンプル数がグループ内の変数の数に基づいて予め設定される閾値以上であるかを判断することで、サンプル数が十分あるかを判断してよい。例えば、閾値=変数の数であってよい。
サンプル数が閾値未満の場合、すなわち、サンプル数が十分にない場合には(ステップS22のNOルート参照)、ステップS23に移行する。
ステップS23において、グループ化処理部101が、グループ内因果探索部103からの指示に従って、複数の変数についての同時分布上での類似性に基づき、複数の変数を因果関係の観点から類似する複数のサブグループに分類することで、グルーピングを行なう。
ステップS24において、グループ代表変数生成部102が、グループ内因果探索部103からの指示に従って、グループ化処理部101が設定した複数のサブグループのそれぞれに対して代表変数を設定する。
ステップS25において、グループ間因果探索部104が、グループ内因果探索部103からの指示に従って、グループ代表変数生成部102が設定した複数の代表変数間の因果探索を行なう。その後、処理はステップS27に移行する。
また、ステップS26において、グループ内因果探索部103が、グループ化処理部101が設定した複数のサブグループのそれぞれに対して、各サブグループを構成する変数群に対して因果探索を行なう。
なお、ステップS24,S25の処理と、ステップS26の処理とはいずれを先に行なってもよい。また、これらのステップS24,S25の処理と、ステップS26の処理とを並行して実施してもよく、適宜変更して実施することができる。
ステップS27において、因果関係集約部105は、グループ内因果探索部103からの指示に従って、グループ内因果探索部103が各サブグループを構成する変数群に対して行なった因果探索の結果と、グループ間因果探索部104が複数のサブグループ間に対して行なった因果探索の結果とを集約する必要があるかを確認する。
例えば、因果関係集約部105は、ユーザが複数の変数に対する因果探索の結果を1つの因果関係(グラフ)として出力するか否かを示すフラグを参照することで、因果探索の結果を集約する必要があるかを確認する。
ステップS27における確認の結果、果探索の結果を集約する必要がある場合には(ステップS27のYESルート参照)、ステップS28に移行する。
ステップS28において、因果関係集約部105は、グループ内因果探索部103からの指示に従って、グループ内因果探索部103が各サブグループを構成する変数群に対して行なった因果探索の結果と、グループ間因果探索部104が複数のサブグループ間に対して行なった因果探索の結果とを集約する。
また、ステップS27における確認の結果、果探索の結果を集約する必要がない場合には(ステップS27のNOルート参照)、ステップS28をスキップしてステップS30に移行する。
一方、ステップS22における確認の結果、サンプル数が十分にある場合、すなわち、データ数が閾値以上の場合には(ステップS22のYESルート参照)、ステップS29に移行する。
ステップS29においては、全てのデータを用いて変数に対する因果探索を行なう。因果探索装置1は、このステップS29において、本因果探索装置1は、既知の因果探索手法を用いて因果探索を行なってよい。その後、ステップS30に移行する。
ステップS30において、ステップS21に対応するループ端処理が実施される。ここで、全グループに対しての処理が完了すると、本フローが終了する。
また、上述した開示により本実施形態を当業者によって実施・製造することが可能である。
1 因果探索装置
10 コンピュータ
10a プロセッサ
10b グラフィック処理装置
10c メモリ
10d 記憶部
10e IF部
10f IO部
10g 読取部
10h プログラム
10i 記録媒体
10j バス
101 グループ化処理部
102 グループ代表変数生成部
103 グループ内因果探索部
104 グループ間因果探索部
105 因果関係集約部
10 コンピュータ
10a プロセッサ
10b グラフィック処理装置
10c メモリ
10d 記憶部
10e IF部
10f IO部
10g 読取部
10h プログラム
10i 記録媒体
10j バス
101 グループ化処理部
102 グループ代表変数生成部
103 グループ内因果探索部
104 グループ間因果探索部
105 因果関係集約部
Claims (18)
- 同時分布上での変数の類似性に基づき複数の変数を2つ以上のグループに分類し、
前記2つ以上のグループそれぞれについて決定された代表変数の間の因果探索を行ない、
前記2つ以上のグループそれぞれについて、各グループに含まれる変数の間の因果探索を行ない、
前記代表変数の間の因果探索の結果と前記各グループに含まれる変数の間の因果探索の結果とを出力する
処理をコンピュータに実行させることを特徴とする因果探索プログラム。 - 前記同時分布上での変数の類似性に基づき複数の変数を2つ以上のグループに分類する処理は、
ある2変数について、これらの変数を入れ替えたときの同時分布の変化の度合いで類似性を定める処理を含むことを特徴とする請求項1に記載の因果探索プログラム。 - 前記同時分布上での変数の類似性に基づき複数の変数を2つ以上のグループに分類する処理は、
各分布が正規分布に従うとした場合のズレの値を計算し、2分布間での値の差に基づいて類似性を定める処理を含むことを特徴とする請求項1に記載の因果探索プログラム。 - 前記代表変数の間の因果探索の結果と前記各グループに含まれる変数の間の因果探索の結果とを結合して、前記複数の変数全体に対する因果探索の結果を出力する、
処理を前記コンピュータに実行させることを特徴とする請求項1~3のいずれか1項に記載の因果探索プログラム。 - 前記代表変数の間の因果探索の結果と前記各グループに含まれる変数の間の因果探索の結果とを結合する処理は、
前記代表変数の間の因果探索の結果において上流のグループに属する変数のうち最下流の変数と、当該上流のグループの下流のグループに属する変数のうち最上流の変数とをつなげる処理を含むことを特徴とする請求項1~3のいずれか1項に記載の因果探索プログラム。 - 前記代表変数の間の因果探索の結果と前記各グループに含まれる変数の間の因果探索の結果とを結合する処理は、
前記代表変数の間の因果探索の結果において上流のグループに属する全ての変数と、当該上流のグループの下流のグループに属する全ての変数とをつなげる処理を含むことを特徴とする請求項1~3のいずれか1項に記載の因果探索プログラム。 - 同時分布上での変数の類似性に基づき複数の変数を2つ以上のグループに分類し、
前記2つ以上のグループそれぞれについて決定された代表変数の間の因果探索を行ない、
前記2つ以上のグループそれぞれについて、各グループに含まれる変数の間の因果探索を行ない、
前記代表変数の間の因果探索の結果と前記各グループに含まれる変数の間の因果探索の結果とを出力する
処理をコンピュータが実行することを特徴とする因果探索方法。 - 前記同時分布上での変数の類似性に基づき複数の変数を2つ以上のグループに分類する処理は、
ある2変数について、これらの変数を入れ替えたときの同時分布の変化の度合いで類似性を定める処理を含むことを特徴とする請求項7に記載の因果探索方法。 - 前記同時分布上での変数の類似性に基づき複数の変数を2つ以上のグループに分類する処理は、
各分布が正規分布に従うとした場合のズレの値を計算し、2分布間での値の差に基づいて類似性を定める処理を含むことを特徴とする請求項7に記載の因果探索方法。 - 前記代表変数の間の因果探索の結果と前記各グループに含まれる変数の間の因果探索の結果とを結合して、前記複数の変数全体に対する因果探索の結果を出力する、
処理を前記コンピュータが実行することを特徴とする請求項7~9のいずれか1項に記載の因果探索方法。 - 前記代表変数の間の因果探索の結果と前記各グループに含まれる変数の間の因果探索の結果とを結合する処理は、
前記代表変数の間の因果探索の結果において上流のグループに属する変数のうち最下流の変数と、当該上流のグループの下流のグループに属する変数のうち最上流の変数とをつなげる処理を含むことを特徴とする請求項7~9のいずれか1項に記載の因果探索方法。 - 前記代表変数の間の因果探索の結果と前記各グループに含まれる変数の間の因果探索の結果とを結合する処理は、
前記代表変数の間の因果探索の結果において上流のグループに属する全ての変数と、当該上流のグループの下流のグループに属する全ての変数とをつなげる処理を含むことを特徴とする請求項7~9のいずれか1項に記載の因果探索方法。 - 同時分布上での変数の類似性に基づき複数の変数を2つ以上のグループに分類し、
前記2つ以上のグループそれぞれについて決定された代表変数の間の因果探索を行ない、
前記2つ以上のグループそれぞれについて、各グループに含まれる変数の間の因果探索を行ない、
前記代表変数の間の因果探索の結果と前記各グループに含まれる変数の間の因果探索の結果とを出力する
処理を実行する制御部を含むことを特徴とする因果探索装置。 - 前記同時分布上での変数の類似性に基づき複数の変数を2つ以上のグループに分類する処理は、
ある2変数について、これらの変数を入れ替えたときの同時分布の変化の度合いで類似性を定める処理を含むことを特徴とする請求項13に記載の因果探索装置。 - 前記同時分布上での変数の類似性に基づき複数の変数を2つ以上のグループに分類する処理は、
各分布が正規分布に従うとした場合のズレの値を計算し、2分布間での値の差に基づいて類似性を定める処理を含むことを特徴とする請求項13に記載の因果探索装置。 - 前記制御部が、
前記代表変数の間の因果探索の結果と前記各グループに含まれる変数の間の因果探索の結果とを結合して、前記複数の変数全体に対する因果探索の結果を出力する、
処理を実行することを特徴とする請求項13~15のいずれか1項に記載の因果探索装置。 - 前記代表変数の間の因果探索の結果と前記各グループに含まれる変数の間の因果探索の結果とを結合する処理は、
前記代表変数の間の因果探索の結果において上流のグループに属する変数のうち最下流の変数と、当該上流のグループの下流のグループに属する変数のうち最上流の変数とをつなげる処理を含むことを特徴とする請求項13~15のいずれか1項に記載の因果探索装置。 - 前記代表変数の間の因果探索の結果と前記各グループに含まれる変数の間の因果探索の結果とを結合する処理は、
前記代表変数の間の因果探索の結果において上流のグループに属する全ての変数と、当該上流のグループの下流のグループに属する全ての変数とをつなげる処理を含むことを特徴とする請求項13~15のいずれか1項に記載の因果探索装置。
Priority Applications (1)
| Application Number | Priority Date | Filing Date | Title |
|---|---|---|---|
| PCT/JP2023/012838 WO2024201796A1 (ja) | 2023-03-29 | 2023-03-29 | 因果探索プログラム,因果探索方法および因果探索装置 |
Applications Claiming Priority (1)
| Application Number | Priority Date | Filing Date | Title |
|---|---|---|---|
| PCT/JP2023/012838 WO2024201796A1 (ja) | 2023-03-29 | 2023-03-29 | 因果探索プログラム,因果探索方法および因果探索装置 |
Publications (1)
| Publication Number | Publication Date |
|---|---|
| WO2024201796A1 true WO2024201796A1 (ja) | 2024-10-03 |
Family
ID=92903589
Family Applications (1)
| Application Number | Title | Priority Date | Filing Date |
|---|---|---|---|
| PCT/JP2023/012838 Ceased WO2024201796A1 (ja) | 2023-03-29 | 2023-03-29 | 因果探索プログラム,因果探索方法および因果探索装置 |
Country Status (1)
| Country | Link |
|---|---|
| WO (1) | WO2024201796A1 (ja) |
Citations (2)
| Publication number | Priority date | Publication date | Assignee | Title |
|---|---|---|---|---|
| JP2019145160A (ja) * | 2016-10-21 | 2019-08-29 | 日本電気株式会社 | 表示方法、表示装置、および、プログラム |
| JP2022029347A (ja) * | 2020-08-04 | 2022-02-17 | 富士通株式会社 | 特徴量選択プログラム、装置、及び方法 |
-
2023
- 2023-03-29 WO PCT/JP2023/012838 patent/WO2024201796A1/ja not_active Ceased
Patent Citations (2)
| Publication number | Priority date | Publication date | Assignee | Title |
|---|---|---|---|---|
| JP2019145160A (ja) * | 2016-10-21 | 2019-08-29 | 日本電気株式会社 | 表示方法、表示装置、および、プログラム |
| JP2022029347A (ja) * | 2020-08-04 | 2022-02-17 | 富士通株式会社 | 特徴量選択プログラム、装置、及び方法 |
Non-Patent Citations (1)
| Title |
|---|
| YUAN TAO; GANG LI; ZHAOHUI ZHANG; QIN S. JOE: "Deep causal mining for plant-wide oscillations with multilevel Granger causality analysis", 2016 AMERICAN CONTROL CONFERENCE (ACC), AMERICAN AUTOMATIC CONTROL COUNCIL (AACC), 6 July 2016 (2016-07-06), pages 5056 - 5061, XP032933477, DOI: 10.1109/ACC.2016.7526155 * |
Similar Documents
| Publication | Publication Date | Title |
|---|---|---|
| CN103885911B (zh) | 用于实施信道均衡训练的多道方法 | |
| US20140181339A1 (en) | Equalization coefficient search algorithm | |
| US7930163B2 (en) | Modeling a storage environment at various times | |
| CN103605647B (zh) | 用于测试设备参数的系统、方法和计算机程序产品 | |
| US20230112096A1 (en) | Diverse clustering of a data set | |
| US20220107847A1 (en) | Computing system for determining quality of virtual machine telemetry data | |
| CN114676272A (zh) | 多媒体资源的信息处理方法、装置、设备及存储介质 | |
| JP2022077760A (ja) | 情報処理プログラム、装置、及び方法 | |
| CN116303100B (zh) | 一种基于大数据平台的文件集成测试方法及系统 | |
| WO2014034557A1 (ja) | テキストマイニング装置、テキストマイニング方法及びコンピュータ読み取り可能な記録媒体 | |
| US8327196B2 (en) | Identifying an optimized test bit pattern for analyzing electrical communications channel topologies | |
| JP6792159B2 (ja) | 並列処理パラメータ決定プログラム、並列処理パラメータ決定方法、および並列処理管理装置 | |
| WO2024201796A1 (ja) | 因果探索プログラム,因果探索方法および因果探索装置 | |
| CN115917557A (zh) | 基于机器学习的系统架构确定 | |
| JP2020144592A (ja) | 推定プログラム、装置、および方法 | |
| US11281475B2 (en) | Reusable asset performance estimation | |
| US20180336473A1 (en) | Detection of data offloading through instrumentation analysis | |
| JP7544272B2 (ja) | 分散学習方法、分散学習システム、サーバ、プログラム | |
| WO2024047735A1 (ja) | 公平性評価プログラム、公平性評価方法、及び、情報処理装置 | |
| WO2024042714A1 (ja) | プログラム,情報処理装置,情報処理方法および学習済みdnnモデル | |
| US20230237036A1 (en) | Data modification method and information processing apparatus | |
| JP7601236B2 (ja) | 情報処理装置および情報処理方法 | |
| CN116018584A (zh) | 单变量密度估计方法 | |
| JP7619487B2 (ja) | 分散計算方法、分散計算装置及びプログラム | |
| JP7740378B2 (ja) | 信号処理装置、信号処理方法、プログラム |
Legal Events
| Date | Code | Title | Description |
|---|---|---|---|
| 121 | Ep: the epo has been informed by wipo that ep was designated in this application |
Ref document number: 23930434 Country of ref document: EP Kind code of ref document: A1 |
|
| NENP | Non-entry into the national phase |
Ref country code: DE |
|
| 122 | Ep: pct application non-entry in european phase |
Ref document number: 23930434 Country of ref document: EP Kind code of ref document: A1 |