WO2024150737A1 - 信号処理装置、信号処理方法及び記録媒体 - Google Patents
信号処理装置、信号処理方法及び記録媒体 Download PDFInfo
- Publication number
- WO2024150737A1 WO2024150737A1 PCT/JP2024/000171 JP2024000171W WO2024150737A1 WO 2024150737 A1 WO2024150737 A1 WO 2024150737A1 JP 2024000171 W JP2024000171 W JP 2024000171W WO 2024150737 A1 WO2024150737 A1 WO 2024150737A1
- Authority
- WO
- WIPO (PCT)
- Prior art keywords
- sar image
- simulated
- target
- information
- predicted
- Prior art date
- Legal status (The legal status is an assumption and is not a legal conclusion. Google has not performed a legal analysis and makes no representation as to the accuracy of the status listed.)
- Ceased
Links
Images



Classifications
-
- G—PHYSICS
- G01—MEASURING; TESTING
- G01S—RADIO DIRECTION-FINDING; RADIO NAVIGATION; DETERMINING DISTANCE OR VELOCITY BY USE OF RADIO WAVES; LOCATING OR PRESENCE-DETECTING BY USE OF THE REFLECTION OR RERADIATION OF RADIO WAVES; ANALOGOUS ARRANGEMENTS USING OTHER WAVES
- G01S13/00—Systems using the reflection or reradiation of radio waves, e.g. radar systems; Analogous systems using reflection or reradiation of waves whose nature or wavelength is irrelevant or unspecified
- G01S13/88—Radar or analogous systems specially adapted for specific applications
- G01S13/89—Radar or analogous systems specially adapted for specific applications for mapping or imaging
- G01S13/90—Radar or analogous systems specially adapted for specific applications for mapping or imaging using synthetic aperture techniques, e.g. synthetic aperture radar [SAR] techniques
-
- G—PHYSICS
- G01—MEASURING; TESTING
- G01N—INVESTIGATING OR ANALYSING MATERIALS BY DETERMINING THEIR CHEMICAL OR PHYSICAL PROPERTIES
- G01N21/00—Investigating or analysing materials by the use of optical means, i.e. using sub-millimetre waves, infrared, visible or ultraviolet light
- G01N21/84—Systems specially adapted for particular applications
-
- G—PHYSICS
- G03—PHOTOGRAPHY; CINEMATOGRAPHY; ANALOGOUS TECHNIQUES USING WAVES OTHER THAN OPTICAL WAVES; ELECTROGRAPHY; HOLOGRAPHY
- G03B—APPARATUS OR ARRANGEMENTS FOR TAKING PHOTOGRAPHS OR FOR PROJECTING OR VIEWING THEM; APPARATUS OR ARRANGEMENTS EMPLOYING ANALOGOUS TECHNIQUES USING WAVES OTHER THAN OPTICAL WAVES; ACCESSORIES THEREFOR
- G03B15/00—Special procedures for taking photographs; Apparatus therefor
-
- G—PHYSICS
- G03—PHOTOGRAPHY; CINEMATOGRAPHY; ANALOGOUS TECHNIQUES USING WAVES OTHER THAN OPTICAL WAVES; ELECTROGRAPHY; HOLOGRAPHY
- G03B—APPARATUS OR ARRANGEMENTS FOR TAKING PHOTOGRAPHS OR FOR PROJECTING OR VIEWING THEM; APPARATUS OR ARRANGEMENTS EMPLOYING ANALOGOUS TECHNIQUES USING WAVES OTHER THAN OPTICAL WAVES; ACCESSORIES THEREFOR
- G03B15/00—Special procedures for taking photographs; Apparatus therefor
- G03B15/02—Illuminating scene
- G03B15/03—Combinations of cameras with lighting apparatus; Flash units
- G03B15/05—Combinations of cameras with electronic flash apparatus; Electronic flash units
-
- G—PHYSICS
- G03—PHOTOGRAPHY; CINEMATOGRAPHY; ANALOGOUS TECHNIQUES USING WAVES OTHER THAN OPTICAL WAVES; ELECTROGRAPHY; HOLOGRAPHY
- G03B—APPARATUS OR ARRANGEMENTS FOR TAKING PHOTOGRAPHS OR FOR PROJECTING OR VIEWING THEM; APPARATUS OR ARRANGEMENTS EMPLOYING ANALOGOUS TECHNIQUES USING WAVES OTHER THAN OPTICAL WAVES; ACCESSORIES THEREFOR
- G03B15/00—Special procedures for taking photographs; Apparatus therefor
- G03B15/02—Illuminating scene
- G03B15/06—Special arrangements of screening, diffusing, or reflecting devices, e.g. in studio
- G03B15/07—Arrangements of lamps in studios
-
- G—PHYSICS
- G03—PHOTOGRAPHY; CINEMATOGRAPHY; ANALOGOUS TECHNIQUES USING WAVES OTHER THAN OPTICAL WAVES; ELECTROGRAPHY; HOLOGRAPHY
- G03B—APPARATUS OR ARRANGEMENTS FOR TAKING PHOTOGRAPHS OR FOR PROJECTING OR VIEWING THEM; APPARATUS OR ARRANGEMENTS EMPLOYING ANALOGOUS TECHNIQUES USING WAVES OTHER THAN OPTICAL WAVES; ACCESSORIES THEREFOR
- G03B17/00—Details of cameras or camera bodies; Accessories therefor
- G03B17/56—Accessories
- G03B17/561—Support related camera accessories
-
- G—PHYSICS
- G06—COMPUTING OR CALCULATING; COUNTING
- G06T—IMAGE DATA PROCESSING OR GENERATION, IN GENERAL
- G06T7/00—Image analysis
- G06T7/50—Depth or shape recovery
- G06T7/55—Depth or shape recovery from multiple images
-
- G—PHYSICS
- G01—MEASURING; TESTING
- G01N—INVESTIGATING OR ANALYSING MATERIALS BY DETERMINING THEIR CHEMICAL OR PHYSICAL PROPERTIES
- G01N21/00—Investigating or analysing materials by the use of optical means, i.e. using sub-millimetre waves, infrared, visible or ultraviolet light
- G01N21/84—Systems specially adapted for particular applications
- G01N2021/8466—Investigation of vegetal material, e.g. leaves, plants, fruits
-
- G—PHYSICS
- G06—COMPUTING OR CALCULATING; COUNTING
- G06T—IMAGE DATA PROCESSING OR GENERATION, IN GENERAL
- G06T2207/00—Indexing scheme for image analysis or image enhancement
- G06T2207/10—Image acquisition modality
- G06T2207/10028—Range image; Depth image; 3D point clouds
Definitions
- the present invention relates to a signal processing device, a signal processing method, and a recording medium.
- a SAR image is a complex image in which each pixel value constituting the SAR image contains a complex value representing the amplitude and phase of a backscattered signal observed using, for example, a SAR (synthetic aperture radar).
- Patent Document 1 discloses an interferometric synthetic aperture radar device that emits radio waves from a flying object toward the ground and extracts topographical changes by receiving reflected waves from the ground.
- This interferometric synthetic aperture radar device has two antennas, a transmitting/receiving unit, an image processing unit, an interference processing unit, and a topographical change analysis processing unit.
- two antennas emit radio waves to the ground and simultaneously receive reflected waves from the ground.
- the transmitter/receiver unit simultaneously outputs transmitted waves to the two antennas and simultaneously inputs received waves.
- the image processor performs SAR reconstruction processing on the received output signal from the transmitter/receiver unit.
- the interference processor causes interference between the output signal from the image processor and outputs a three-dimensional image.
- the terrain change analysis processor extracts terrain changes in real time by comparing the three-dimensional image data acquired in real time by the interference processor with three-dimensional image data of the same area previously acquired by the interference processor.
- Patent Document 1 describes how contour maps are obtained based on phase contrast images for each piece of data acquired at different times, and changes are detected based on the contour maps corresponding to the different times.
- Patent Document 2 discloses a technology that generates a reconstructed image by performing synthetic aperture processing on radar image data captured by a SAR (synthetic aperture radar mounted on a satellite) using a radar analysis device, and then performs differential processing on the obtained image to analyze changes in the earth's surface.
- SAR synthetic aperture radar mounted on a satellite
- a differential calculation unit calculates the difference in microwave backscattering intensity, thereby calculating the difference in multiple characteristic values (scattering intensity, amount of ground change, etc.) that represent the state of the ground surface that is the subject of imaging.
- Patent document 3 discloses a computer-implemented method for determining coherency between composite images having phase and amplitude components. Patent document 3 describes that this coherency can be determined based on the amplitude components of the images.
- Patent document 4 discloses a method for detecting at least one target in an image (I) obtained by a SAR.
- the image (I) includes a set of pixels, each pixel having a magnitude assigned to it.
- Patent document 5 discloses a method for processing synthetic aperture radar (SAR) image data that includes a plurality of frames for each of a plurality of image geometries. The method includes, for each image geometry, applying change detection to the frames corresponding to that image geometry to generate a plurality of change products.
- SAR synthetic aperture radar
- the received signal corresponding to that area may change significantly due to the effects of noise, even if no change occurs in that area.
- SNR signal-to-noise ratio
- Patent Documents 1 to 5 contain no mention of noise contained in the received signal used to generate the SAR image. Therefore, with the techniques described in Patent Documents 1 to 5, there is a risk that the accuracy of detecting changes in the target area may decrease if the received signal changes significantly due to the effects of noise, etc.
- one example of the objective of the present invention is to provide a signal processing device, a signal processing method, a program, etc. that solves the problem of accurately detecting changes in a target area using SAR images.
- a simulated SAR image generating means generates simulated information including a simulated SAR image composed of predicted values of each pixel predicted to be obtained when a target region in a steady state is observed, and predicted reliability information indicating the reliability of the predicted values of each pixel; and an evaluation calculation means for calculating an evaluation index for evaluating a target SAR image to be analyzed using the simulation information.
- One or more computers generating simulated information including a simulated SAR image composed of predicted values of each pixel predicted to be obtained when observing a target region in a steady state, and predicted reliability information indicating the reliability of the predicted values of each pixel;
- the simulated information is used to determine an evaluation index for evaluating a target SAR image to be analyzed.
- generating simulated information including a simulated SAR image composed of predicted values of each pixel predicted to be obtained when observing a target region in a steady state, and predicted reliability information indicating the reliability of the predicted values of each pixel;
- a program is provided for executing the step of determining an evaluation index for evaluating a target SAR image to be analyzed using the simulation information.
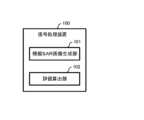
- FIG. 1 is a diagram showing an overview of a signal processing device according to a first embodiment
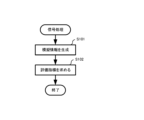
- FIG. 1 is a diagram showing an overview of a signal processing method according to a first embodiment
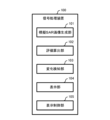
- FIG. 2 is a diagram illustrating an example of a functional configuration of a signal processing device according to a first embodiment.
- FIG. 4 is a diagram showing a first example of simulation information according to the first embodiment.
- FIG. 11 is a diagram showing a second example of simulation information according to the first embodiment.
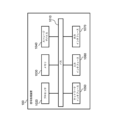
- 1 is a diagram illustrating an example of a physical configuration of a signal processing device according to a first embodiment. 4 is a flowchart illustrating an example of signal processing according to the first embodiment.
- FIG. 4 is a diagram illustrating an example of a display screen according to the first embodiment.
- FIG. 1 is a diagram showing an overview of a signal processing method according to a first embodiment.
- FIG. 2 is a diagram illustrating an example of a functional configuration of a signal processing device according to a first embodiment.
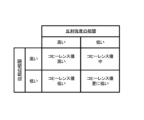
- FIG. 13 is a diagram showing the correlation between reflection intensity and phase and the coherence value in a typical coherent change detection technique.
- FIG. 13 is a diagram showing an overview of a signal processing system SPS according to a second embodiment.
- FIG. 11 is a diagram illustrating an example of the configuration of a signal processing system SPS according to a second embodiment.
- 10 is a flowchart illustrating an example of signal processing according to a second embodiment.
- 1 is a diagram for explaining an example of estimating a complex reflection intensity distribution of an azimuth-range position using SAR tomography.
- FIG. FIG. 13 is a diagram illustrating an example of a functional configuration of an evaluation calculation unit according to a fourth embodiment. 13 is a flowchart illustrating a detailed example of an evaluation index acquisition process according to the fourth embodiment.
- FIG. 13 is a diagram illustrating an example of the functional configuration of an evaluation calculation unit according to a fifth embodiment. 13 is a flowchart illustrating a detailed example of an evaluation index acquisition process according to the
- FIG. 1 is a diagram showing an overview of a signal processing device 100 according to embodiment 1.
- the signal processing device 100 includes a simulated SAR image generating unit 101 and an evaluation calculating unit 102.
- the simulated SAR image generator 101 generates simulated information including a simulated SAR image composed of predicted values for each pixel that are predicted to be obtained when observing a target area in a steady state, and prediction reliability information indicating the reliability of the predicted values for each pixel.
- the evaluation calculation unit 102 uses the simulation information to determine an evaluation index for evaluating the target SAR image that is the subject of analysis.
- This signal processing device 100 makes it possible to accurately detect changes in a target area using SAR images.
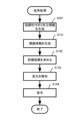
- FIG. 2 is a diagram showing an overview of the signal processing method according to the first embodiment.
- the simulated SAR image generator 101 generates simulated information including a simulated SAR image composed of predicted values of each pixel that are predicted to be obtained when observing a target area in a steady state, and prediction reliability information indicating the reliability of the predicted values of each pixel (step S101).
- the evaluation calculation unit 102 uses the simulation information to determine an evaluation index for evaluating the target SAR image to be analyzed (step S102).
- This signal processing method makes it possible to accurately detect changes in the target area using SAR images.
- the signal processing device 100 is a device for detecting a change in a target region using a target SAR image that is an analysis target.
- the target SAR image is the SAR image to be analyzed.
- the SAR image is a complex image in which the pixel values that make up the SAR image contain complex values that represent reflection intensity and phase.
- the target SAR image may be appropriately selected from, for example, observed SAR images.
- observed SAR images In this embodiment, an example in which there is one target SAR image will be described. Note that there may be multiple target SAR images.
- An observational SAR image is a two-dimensional complex image generated based on the received signal of an airborne SAR (synthetic aperture radar) mounted on an airborne vehicle such as a satellite or aircraft.
- the received signal is, for example, a signal (e.g., microwave) transmitted from the airborne SAR and reflected by the ground surface in the target area, and indicates an observation value including a reflection intensity component and a phase component.
- an observational SAR image is a complex image composed of the observation values of each pixel that actually observed the target area.
- the observational value of an observational SAR image is a complex value including a reflection intensity component and a phase component.
- the signal processing device 100 includes a simulated SAR image generating unit 101, an evaluation calculation unit 102, a change detection unit 103, a display unit 104, and a display control unit 105.
- the simulated SAR image generating unit 101 generates simulated information including a simulated SAR image and predicted reliability information indicating the reliability of the simulated SAR image.
- the simulated SAR image is a two-dimensional complex image composed of predicted values for each pixel that are predicted to be obtained when observing a target area in a steady state under the same observation conditions as the target SAR image.
- the observation conditions include at least one of the following: the position of the SAR flying object when the observation value corresponding to the target SAR image is observed, the coordinate position of the target area, the resolution, etc.
- the predicted value for each pixel corresponds to the pixel value of the simulated SAR image and includes, for example, complex values representing the reflection intensity and phase components of the predicted received signal (i.e., the predicted signal).
- the steady state is a state in which there is no change in the target area, or even if there is a change in the target area, the change is not detectable.
- Prediction reliability information indicates the reliability of the predicted values of each pixel that makes up the simulated SAR image.
- Fig. 5 is a diagram showing a second example of simulated information relating to embodiment 1.
- FIG. 4 is a diagram showing a first example of simulation information according to the first embodiment.
- the figure shows a predicted value and a predicted distribution associated with a pixel included in a simulated SAR image. That is, the figure shows an example in which prediction reliability information includes a predicted distribution (probabilistic distribution of predicted values).
- the average value P of the predicted distribution shown in the figure corresponds to the predicted value.
- the average value P of the predicted distribution is expressed as Rpe j ⁇ p , where Rp is the reflection intensity component and ⁇ p is the phase component.
- e Napier's constant.
- j is an imaginary unit.
- the predicted distribution is a distribution shown by 1 ⁇ , 2 ⁇ , and 3 ⁇ dotted circles, with ⁇ being the standard deviation.
- the direction perpendicular to the paper surface is the axis showing the probability.
- FIG. 5 is a diagram showing a second example of simulated information according to the first embodiment.
- Each of FIGS. 5(a) and (b) is a diagram showing the predicted value and standard deviation of each pixel included in the simulated SAR image. This predicted value is, for example, the average value P of the predicted distribution. In other words, this figure shows that the prediction reliability information is an example of a statistical index of the predicted distribution.
- the predicted value may be a value other than the mean value P of the predicted distribution.
- the prediction reliability information may include at least one of the following: a predicted distribution indicating a probabilistic distribution of the predicted value of each pixel, a statistical index of the predicted distribution, and the probability of the predicted value associated with each pixel.
- the statistical index may be at least one of the mean value, mode, variance, standard deviation, confidence interval, etc., for example.
- the evaluation calculation unit 102 calculates an evaluation index for evaluating the target SAR image, using the simulation information generated by the simulated SAR image generation unit 101. That is, the evaluation calculation unit 102 calculates the evaluation index, using the simulated SAR image and the predicted reliability information.
- the evaluation index is an index that evaluates the target SAR image that is the subject of analysis.
- the evaluation index is, for example, an index that probabilistically evaluates the degree to which the observed values that make up the target SAR image are consistent with the predicted values that make up the simulated SAR image.
- the evaluation index is calculated for each corresponding pixel in the simulated SAR image and the target SAR image, and is typically multiple.
- the change detection unit 103 detects changes in the target area using the evaluation index calculated by the evaluation calculation unit 102.
- the evaluation index is a numerical value
- the change detection unit 103 detects changes in the target area based on the result of comparing the evaluation index with a predetermined threshold value.
- the display unit 104 displays various information under the control of the display control unit 105.
- the display control unit 105 causes the display unit 104 to display, for example, a simulated SAR image, a target SAR image, an evaluation index, detection results regarding changes in the target area, and the like.
- the signal processing device 100 physically includes, for example, a bus 1010, a processor 1020, a memory 1030, a storage device 1040, a network interface 1050, an input interface 1060, and an output interface 1070.
- the bus 1010 is a data transmission path for the processor 1020, memory 1030, storage device 1040, network interface 1050, input interface 1060, and output interface 1070 to transmit and receive data to and from each other.
- the method of connecting the processor 1020 and other components to each other is not limited to bus connection.
- the processor 1020 is a processor realized by a CPU (Central Processing Unit) or a GPU (Graphics Processing Unit).
- Memory 1030 is a main storage device realized by a RAM (Random Access Memory) or the like.
- Storage device 1040 is an auxiliary storage device realized by a hard disk drive (HDD), a solid state drive (SSD), a memory card, or a read only memory (ROM).
- Storage device 1040 stores program modules for realizing the functions of the device that includes it.
- Processor 1020 loads each of these program modules into memory 1030 and executes them to realize the function corresponding to that program module.
- the network interface 1050 is an interface for connecting a device equipped with it to the network NT.
- the input interface 1060 is an interface through which the user inputs information.
- the input interface 1060 is composed of, for example, a touch panel, a keyboard, a mouse, etc.
- the output interface 1070 is an interface for presenting information to the user.
- the output interface 1070 is composed of, for example, a liquid crystal panel, an organic EL (Electro-Luminescence) panel, etc.
- Example of operation of the signal processing device 100 according to the first embodiment 7 is a flowchart showing an example of signal processing according to the first embodiment.
- the signal processing is processing for detecting a change in a target region using a target SAR image that is an analysis target.
- the signal processing device 100 starts the signal processing upon receiving, for example, an instruction from a user. This instruction may include information for identifying the target SAR image.
- the trigger for starting the signal processing is not limited to this.
- the signal processing may be repeatedly performed in real time on the target SAR image that observes the target area.
- Step S101 Example of simulation information generation process
- the simulated SAR image generating unit 101 generates simulated information (step S101).
- the simulated SAR image generating unit 101 acquires reliable 3D information and generates simulated information using the acquired reliable 3D information.
- the simulated information includes a simulated SAR image and prediction reliability information that indicates the reliability of the predicted value of each pixel that constitutes the simulated SAR image.
- the reliable three-dimensional information includes three-dimensional information and estimated reliability information that indicates the reliability of the three-dimensional information.
- the three-dimensional information is information that includes a three-dimensional image.
- the three-dimensional information includes a three-dimensional complex image that is reconstructed using steady-state observation SAR images.
- a detailed example of such reliable three-dimensional information will be described in other embodiments.
- the information (source information) that is the source for generating the simulated information is not limited to reliable 3D information.
- the source information may be information that indicates the steady state of the target area, such as a steady-state image based on observations by another flying object SAR.
- the source information may include one or more of the temperature, displacement, etc. of the target area.
- an observation SAR image is obtained based on observations by a flying object SAR.
- the position of the flying object SAR changes from moment to moment, and the direction in which the flying object SAR observes the target area also changes. If the observation values corresponding to the observation SAR image are observed at different times, the observation conditions, such as the position of the flying object SAR, will change. Therefore, if the observation time is different, the observation SAR image will change slightly even if a steady-state target area is observed.
- step S101 the simulated SAR image generating unit 101 generates a simulated SAR image using three-dimensional information (such as a three-dimensional image) generated using a steady-state observed SAR image. This makes it possible to generate a simulated SAR image with the same observation conditions as the target SAR image.
- three-dimensional information such as a three-dimensional image
- a three-dimensional image is composed of multiple three-dimensional elements (hereinafter also referred to as “voxels") and includes a value (hereinafter also referred to as "voxel value”) associated with each of the multiple voxels.
- the voxel value generally includes uncertainty due to SNR, layover phenomenon, etc.
- the layover phenomenon is a phenomenon in which the positional relationship is reversed between high and low altitude locations in a SAR image.
- the layover phenomenon is a cause of uncertainty that occurs when a three-dimensional image is generated using observed SAR images.
- the reliable 3D information includes reliability information that indicates the likelihood of such voxel values.
- the above-mentioned estimated reliability information is an example of reliability information when the voxel values are estimated values described in other embodiments.
- the simulated SAR image generating unit 101 can generate prediction reliability information that indicates the reliability of the predicted value of each pixel that constitutes the generated simulated SAR image.
- reliability information contained in such reliable 3D information is the estimated reliability information described above.
- a detailed example of the estimated reliability information will be described in other embodiments together with a detailed example of reliable 3D information.
- the simulated SAR image generating unit 101 may generate multiple simulated SAR images having the same target conditions as each of the multiple target SAR images. The simulated SAR image generating unit 101 may then generate multiple pieces of simulated information corresponding to each of the multiple target SAR images by generating predicted reliability information corresponding to each of the simulated SAR images.
- Step S102 Example of evaluation index acquisition process
- the evaluation calculation unit 102 uses the simulation information generated in step S101 to calculate an evaluation index for evaluating the target SAR image (step S102).
- the evaluation calculation unit 102 compares the target SAR image with the simulated SAR image (observed values and predicted values). In this comparison, the evaluation calculation unit 102 uses prediction reliability information to evaluate the change in the target SAR image relative to the simulated SAR image. Then, as a result of the comparison, the evaluation calculation unit 102 calculates an evaluation index.
- evaluation index may be any index that evaluates the target SAR image using simulated information, and is not limited to the examples given in this embodiment and other embodiments.
- Step S103 Example of change detection process
- the change detection unit 103 detects a change in the target region using the evaluation index calculated in step S103 (step S103).
- the change detection unit 103 compares the evaluation index with a threshold value. For example, in step S102, when the evaluation calculation unit 102 compares pixel values (predicted values and observed values) for each corresponding pixel in the target SAR image and the simulated SAR image, an evaluation index for each pixel constituting the target SAR image is obtained. In this case, the change detection unit 103 compares each of the evaluation indexes with a threshold value for each pixel constituting the target SAR image.
- the threshold value may be determined in advance and may be common to all pixels, for example.
- the change detection unit 103 determines that a change has occurred in a pixel whose evaluation index is equal to or less than a threshold value, and detects a change in an area of the target area corresponding to that pixel.
- the method of detecting changes is not limited to this.
- the change detection unit 103 may determine that a change has occurred in a pixel whose evaluation index is equal to or greater than a threshold value, and detect a change in an area of the target area corresponding to that pixel.
- Step S104 Example of display process
- the display control unit 105 causes the display unit 104 to display a display screen (step S104).
- the display screen includes, for example, the simulated SAR images, step evaluation indexes and detection results, and target SAR images obtained in each of steps S101 to S103.
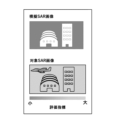
- FIG. 8 is a diagram showing an example of a display screen according to the first embodiment.
- the display screen shown in the figure includes a simulated SAR image and a target SAR image.
- the evaluation index for each pixel calculated in step S102 is expressed, for example, by color.
- the display screen may include predicted reliability information for each pixel.
- the display screen is not limited to these and may be changed as appropriate.
- the signal processing device 100 includes the simulated SAR image generating unit 101 and the evaluation calculation unit 102.
- the simulated SAR image generating unit 101 generates simulated information including a simulated SAR image composed of predicted values of each pixel predicted to be obtained when a target region in a steady state is observed, and prediction reliability information indicating the reliability of the predicted values of each pixel.
- the evaluation calculation unit 102 uses the simulated information to obtain an evaluation index for evaluating the target SAR image that is the analysis target.
- an evaluation index for the target SAR image can be obtained using the simulated SAR image and the predicted reliability information. Therefore, the target SAR image can be evaluated taking into account the reliability of the simulated SAR image. Therefore, it becomes possible to accurately detect changes in the target area using the SAR image.
- Coherent change detection technology detects minute changes from a steady state based on the value of complex correlation (coherence), which indicates the similarity between SAR images.
- coherence value when the coherence value is high, it is determined that the similarity of the intensity and phase between the SAR images is high and that there is no change in the local region. On the other hand, when the coherence value is low, it is determined that the similarity of the intensity and phase between the SAR images is low and that a change has occurred in the local region.
- Such a coherence value can be said to be an index that shows the correlation of the reflection intensity and phase in the local region between the SAR images.
- the coherence value is likely to be low due to the effects of noise. Therefore, even if no change has occurred in the area, general coherent change detection technology may erroneously determine that there has been a change.
- SNR signal-to-noise ratio
- the target SAR image can be evaluated taking into account the reliability of the simulated SAR image, such as in areas with a low signal-to-noise ratio (SNR).
- SNR signal-to-noise ratio
- the target SAR image can be evaluated taking into account the ambiguity of the predicted value in the simulated SAR image corresponding to that area. This makes it possible to obtain an evaluation index that can accurately detect changes in the area. Therefore, it becomes possible to accurately detect changes in the target area using the SAR image.
- each of the simulated SAR image and the target SAR image is a two-dimensional complex image.
- SAR images are two-dimensional complex images. Therefore, by using this configuration, it is possible to apply it to general SAR images and accurately detect changes in the target area.
- the predicted value for each pixel is a complex value containing a reflection intensity component and a phase component that are predicted to be obtained when observing the target area in a steady state under the same observation conditions as the target SAR image.
- the prediction reliability information includes at least one of a prediction distribution indicating a probabilistic distribution of the predicted value, a statistical index of the prediction distribution, and a probability of being a predicted value.
- the target SAR image can be evaluated while taking into account the reliability of the simulated SAR image. Therefore, it becomes possible to accurately detect changes in the target area using the SAR image.
- the target SAR image is composed of the observed values of each pixel that actually observed the target area.
- the evaluation indices are indices that probabilistically evaluate the degree to which the observed values that make up the target SAR image are consistent with the predicted values that make up the simulated SAR image.
- the signal processing device 100 further includes a change detection unit 103 that uses an evaluation index to detect changes in the target region.
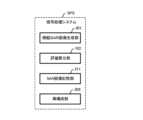
- the signal processing system SPS includes a simulated SAR image generating unit 101, an evaluation calculating unit 102, an SAR image storage unit 211, and a reconstructing unit 206.
- the simulated SAR image generating unit 101 generates simulated information including a simulated SAR image composed of predicted values of each pixel that are predicted to be obtained when observing a target area in a steady state, and predicted reliability information indicating the reliability of the predicted values of each pixel.
- the simulated SAR image generating unit 101 generates simulated information using reliable 3D information and the observation conditions when the actual measured values are observed.
- the evaluation calculation unit 102 uses the simulation information to determine an evaluation index for evaluating the target SAR image that is the subject of analysis.
- the SAR image storage unit 211 is a storage unit for storing an observed SAR image of a target area that is composed of observation values obtained by observing the target area using a synthetic aperture radar.
- the reconstruction unit 206 uses multiple observed SAR images to generate reliable 3D information that includes 3D information and estimated reliability information.
- the three-dimensional information includes estimates of the reflection intensity and phase for each of the three-dimensional elements that make up the target region.
- the estimation reliability information indicates the reliability of the estimates for each of the three-dimensional elements.
- This signal processing system SPS makes it possible to accurately detect changes in the target area using SAR images.
- the signal processing system SPS is a system for detecting a change in a target region using a target SAR image that is an analysis target.
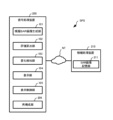
- the signal processing system SPS includes a signal processing device 200 and an information processing device 210.
- the signal processing device 200 and the information processing device 210 are connected to each other via a network NT that is configured using a wired or wireless connection or a combination of these.
- the signal processing device 200 and the information processing device 210 transmit and receive information to each other via the network NT.
- the information processing device 210 includes a SAR image storage unit 211.
- the SAR image storage unit 211 is a storage unit for storing an observed SAR image of a target area.
- the SAR image storage unit 211 stores an observed SAR image of a target area in a steady state.
- the SAR image storage unit 211 may further store the observation conditions when the observed SAR image was observed, in association with the observed SAR image.
- the SAR image storage unit 211 may further store an observed SAR image in which the target area is observed in a state that is not a steady state (i.e., a state in which there is a change from the steady state).
- the information stored in the SAR image storage unit 211 may be generated by the information processing device 210, or may be generated by an external device (not shown).
- the signal processing device 200 functionally comprises a simulated SAR image generation unit 101 replacing the simulated SAR image generation unit 101 in embodiment 1, an evaluation calculation unit 102 similar to embodiment 1, a change detection unit 103, a display unit 104 and a display control unit 105, and a reconstruction unit 206.
- the signal processing device 200 may further include a SAR image storage unit 211.
- the signal processing system SPS does not need to include the information processing device 210.
- the simulated SAR image generating unit 101 generates simulated information using the reliable 3D information generated by the reconstruction unit 206 and the observation conditions when the actual measured values are observed.
- the simulated SAR image generating unit 101 may be configured in the same manner as the simulated SAR image generating unit 101 according to the first embodiment, except that the reliable 3D information for generating the simulated information is obtained from the reconstruction unit 206.
- the reconstruction unit 206 generates the above-mentioned reliable 3D information using multiple observation SAR images in a steady state. Note that the reconstruction unit 206 may generate the above-mentioned reliable 3D information using not only multiple observation SAR images in a steady state, but also one or multiple observation SAR images in a non-steady state.
- the signal processing system SPS according to this embodiment is physically composed of a signal processing device 200 and an information processing device 210 connected via a network NT.
- Each of the signal processing device 200 and the information processing device 210 is composed of a physically different single device.
- Each of the signal processing device 200 and the information processing device 210 may be physically configured in the same manner as the signal processing device 100 according to the first embodiment.
- the signal processing device 200 and the information processing device 210 may be physically configured as a single device, in which case the signal processing device 200 and the information processing device 210 may be connected using an internal bus 1010 instead of the network NT.
- one or both of the signal processing device 200 and the information processing device 210 may be physically configured as multiple devices connected via an appropriate communication line such as the network NT.
- (Operation example of the signal processing system SPS according to the second embodiment) 12 is a flowchart showing an example of signal processing according to embodiment 2.
- the signal processing according to this embodiment includes three-dimensional information generation processing (step S201) in addition to the processing included in the signal processing according to embodiment 1.
- Step S201 Example of three-dimensional information generation process
- the reconstruction unit 206 generates reliable 3D information including 3D information and estimated reliability information using a plurality of observed SAR images (step S201).
- the reconstruction unit 206 acquires a plurality of combinations of observed SAR images in a steady state stored in the SAR image storage unit 211 and the associated observation conditions. Note that the reconstruction unit 206 may acquire one or more combinations of observed SAR images in a non-steady state and the associated observation conditions.
- the reconstruction unit 206 generates reliable 3D information using the acquired observation SAR images and observation conditions.
- the reliable three-dimensional information includes three-dimensional information and estimated reliability information indicating the reliability of the three-dimensional information.
- the three-dimensional information includes a three-dimensional image.
- the three-dimensional image includes voxel values corresponding to each of the multiple voxels that make up the three-dimensional image.
- the voxel values are, for example, complex values including reflection intensity and phase.
- the voxel values may be a three-dimensional complex reflection intensity distribution.
- the three-dimensional information may further include temperature, displacement, etc.
- the three-dimensional image may be represented by three-dimensional point cloud data including information on the reflection intensity and phase of each point.
- the elevation direction is, for example, a direction perpendicular to the azimuth-range plane (the plane formed by the direction of travel and line of sight of the aircraft carrying the SAR).
- the three-dimensional image contains multiple voxel values in a three-dimensional space having azimuth, range, and elevation directions.
- Each voxel value contains reflection intensity (estimated value of reflection intensity) and phase (estimated value of phase).
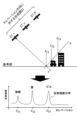
- Figure 13 is a diagram for explaining an example of estimating the complex reflection intensity distribution of a voxel located at an azimuth-range position x using SAR tomography.
- x is a vector quantity, and the same applies below.
- s represents the elevation direction.
- the plane perpendicular to the direction s is the azimuth-range plane.
- the azimuth-range position x is the intersection of the axis representing the elevation direction in FIG. 13 and the axis representing the line of sight of the satellite ST, which is the flying object.
- satellites ST_1...ST_n, ST_N in the figure represent satellites ST at different times.
- N is an integer greater than 1.
- n is an integer greater than 1 and less than or equal to N.
- the reconstruction unit 206 uses multiple observation SAR images to estimate, for each pixel, a complex reflection intensity distribution that indicates the height, reflection intensity, and phase of buildings that are constantly present throughout the observation period.
- the reconstruction unit 206 combines the complex reflection intensities obtained for each pixel to generate a three-dimensional image that includes a three-dimensional complex reflection intensity distribution in the target area.
- the reconstruction unit 206 uses multiple observation SAR images based on observations from slightly different orbits to generate a three-dimensional image of a three-dimensional steady state. Therefore, the reconstruction unit 206 acquires multiple observation SAR images.
- the top part of Figure 13 shows the first to Nth observations by the SAR satellite.
- N corresponds to the total number of observations.
- the first to Nth observations shown in Figure 13 correspond to a synthetic aperture in the elevation direction.
- the relationship between the received signal (complex signal) recorded at the pixel corresponding to the azimuth-range position x and the complex reflection intensity distribution at that pixel is expressed, for example, by the following equation (1).
- g obs (x, n) represents the received signal (complex signal) recorded at the pixel corresponding to the azimuth-range position x.
- r(x, n) represents the steering vector at the pixel corresponding to the azimuth-range position x.
- ⁇ (x, n) is a vector representing the complex reflection intensity distribution at the pixel corresponding to the azimuth-range position x.
- the steering vector r(x, n) can be obtained, for example, from the shooting conditions and is expressed by the following equation (2).
- kn an altitude-phase conversion coefficient (a coefficient for converting between phase and altitude)
- the steering vector may be expressed by a formula other than formula (2).
- a steering vector that takes into account the effects of temperature and displacement may be used.
- j is the imaginary unit.
- ⁇ is the constant of the circumference of a circle.
- Exp represents an exponential function with Napier's constant as the base.
- C represents a complex number.
- the reconstruction unit 206 determines the complex reflection intensity distribution ⁇ of the building by determining the complex reflection intensity distribution so that N observation data images of the target area including the building and the like match N steering vectors.
- the lower part of Figure 13 shows an example of the absolute value
- the vertical axis of the graph shown in the lower part of Figure 13 is the reflection intensity, which corresponds to the absolute value
- the horizontal axis of the graph shows the elevation position.
- the complex reflection intensities calculated for each pixel in this manner can be combined to generate a three-dimensional image that includes a three-dimensional complex reflection intensity distribution in the target area.
- the reconstruction unit 206 generates reliable 3D information using SAR tomography or the like.
- the reliable 3D information may be either first reliable 3D information or second reliable 3D information, as exemplified below. Note that the reliable 3D information is not limited to these.
- the difference between the received signal and the predicted signal may be evaluated using the difference between the received signal and the predicted signal (e.g., the squared difference, the absolute difference, etc.).
- the estimated reliability information may include the difference between the received signal and the predicted signal.
- the difference between the received signal and the predicted signal may be evaluated using a function that adds a term expressing the complexity of the reconstructed three-dimensional information to the difference between the received signal and the predicted signal.
- the estimated reliability information may include a value (e.g., the value of a loss function in LASSO regression, Ridge regression, etc.) that uses a function that adds a term expressing the complexity of the reconstructed three-dimensional information to the difference between the received signal and the predicted signal.
- Equation (3) can be given as an example of a loss function.
- ⁇ p represents the Lp norm, and ⁇ represents a regularization constant.
- the difference between the received signal and the predicted signal may be evaluated using cross-validation.
- Cross-validation is a method for evaluating the generalization performance of the reconstructed three-dimensional information by using a received signal different from the received signal used to generate the three-dimensional information for evaluating the difference from the predicted value.
- the estimated reliability information may include a value indicating the generalization performance of the reconstructed three-dimensional information by using a received signal different from the received signal used to generate the three-dimensional information for evaluating the difference from the predicted value.
- a received signal that is different from the received signal used to generate the three-dimensional information is a received signal that is not used to reconstruct the three-dimensional information.
- the value obtained by cross-validation is, for example, a value obtained by evaluating the difference between a predicted signal and a received signal for a received signal that is not used to reconstruct the three-dimensional information.
- ⁇ 2 represents the L2 norm.
- g obs (x, m) represents the received signal obtained in the m-th observation, i.e., the received signal not used in reconstructing the three-dimensional information.
- r(x, m) ⁇ (x) represents a predicted signal predicted based on the three-dimensional information reconstructed from N ⁇ 1 observations excluding the m-th observation.
- the reconstruction unit 206 may obtain the estimation reliability information by evaluating how likely each estimated value in the three-dimensional information is among the possible values. This evaluation may be expressed, for example, using the parameters (variance, confidence interval, etc.) of the posterior distribution of each estimated value obtained by Bayesian estimation, the shape of the posterior distribution, etc.
- the estimation reliability information may include a value indicating how likely each estimated value in the three-dimensional information is among the possible values.
- the second reliable three-dimensional information may include a function expressing the relationship between the reflection intensity and the phase of each of the three-dimensional elements and the likelihood of each of them. That is, the reconstruction unit 206 may obtain, as the reliable three-dimensional information, a function expressing the relationship between the reflection intensity and the phase of each of the three-dimensional elements and the likelihood of each of them.
- the function expressing the relationship between the reflection intensity and the phase and the likelihood of each is, for example, the posterior distribution
- the statistical indices may include at least one of a statistical measure of the posterior distribution, a candidate set of posteriorly sampled 3D information (intensity and phase estimates), and at least one of a mean, a mode, a variance, a standard deviation, and a confidence interval.
- Step S101 according to the second embodiment: Example of simulation information generation process
- the simulated SAR image generating unit 101 generates simulated information (step S101).
- step S101 the simulated SAR image generating unit 101 generates simulated information using the reliable 3D information generated in step S201.
- the simulated SAR image generating unit 101 obtains a steering vector from the measurement conditions of the target SAR image and generates simulated information from the reliable 3D information.
- the simulated SAR image generating unit 101 may obtain predicted reliability information by statistical processing using the simulated SAR image and the estimated reliability information.
- the simulated SAR image generating unit 101 may estimate multiple simulated complex signal candidates estimated from the reliable 3D information and the likelihood of each of the multiple simulated complex signal candidates.
- the simulated SAR image generating unit 101 may then select or generate a plausible simulated complex signal as the reliability information. For example, a function expressing the relationship between the reflection intensity and phase for each of the three-dimensional elements and their respective probabilities is input to the simulated SAR image generating unit 101.
- the plausible simulated complex signal is, for example, a simulated complex signal that has the highest probability when a predicted signal in the simulated SAR image is estimated under the conditions of the input function.
- Steps S102 to S104 may be similar to those described in embodiment 1.
- reliable 3D information can be generated using multiple observed SAR images. This reliable 3D information can then be used to generate simulated information, which can then be used to find an evaluation index for the target SAR image.
- the signal processing device 200 includes the reconstruction unit 206 .
- the reconstruction unit 206 uses multiple observed SAR images to generate reliable 3D information that includes 3D information and estimated reliability information.
- the 3D information includes estimated values of reflection intensity and phase for each of the 3D elements that make up the target region.
- the estimated reliability information indicates the reliability of the estimated value for each of the 3D elements.
- the simulated SAR image generating unit 101 generates simulated information using the reliable 3D information and the observation conditions when the actual measured values are observed (target SAR image).
- the target SAR image may be one or more.
- the target SAR image may include, for example, one or more appropriately specified observation SAR images stored in the SAR image storage unit 211, and may include a new observation SAR image not stored in the SAR image storage unit 211.
- reliable 3D information can be generated using multiple observed SAR images.
- simulated information can be generated using the reliable 3D information, and an evaluation index for the target SAR image can be obtained using the simulated information. Therefore, the target SAR image can be evaluated taking into account the reliability of the simulated SAR image. Therefore, it becomes possible to accurately detect changes in the target area using the SAR image.
- the reconstruction unit 206 obtains estimated reliability information by evaluating the difference between the received signal and the predicted signal predicted from the three-dimensional information for each of the reflection intensity and phase.
- the target SAR image can be evaluated taking into account the reliability of the simulated SAR image. This makes it possible to accurately detect changes in the target area using the SAR image.
- the reconstruction unit 206 obtains the estimation reliability information by evaluating how likely each estimated value in the three-dimensional information is among the possible values.
- the target SAR image can be evaluated taking into account the reliability of the simulated SAR image. This makes it possible to accurately detect changes in the target area using the SAR image.
- the simulated SAR image generating unit 101 obtains predicted reliability information by statistical processing using the simulated SAR image and estimated reliability information.
- the reconstruction unit 206 obtains, as reliable 3D information, a function that represents the relationship between the reflection intensity and phase for each 3D element and their respective likelihoods.
- the target SAR image can be evaluated taking into account the reliability of the simulated SAR image. This makes it possible to accurately detect changes in the target area using the SAR image.
- the simulated SAR image generating unit 101 estimates multiple simulated complex signal candidates estimated from reliable 3D information and the likelihood of each of the multiple simulated complex signal candidates, and selects or generates a plausible simulated complex signal as reliability information.
- the evaluation index is the posterior probability that an observation value is observed for each corresponding pixel in the simulated SAR image and the target SAR image.
- the evaluation calculation unit 102 uses the simulated information and the target SAR image to calculate an evaluation index for each corresponding pixel.
- Each evaluation index is a posterior probability that an observation value is observed for each corresponding pixel in the simulated SAR image and the target SAR image.
- Step S102 Example of evaluation index acquisition process
- the evaluation calculation unit 102 uses the simulation information and the target SAR image to calculate an evaluation index (posterior probability) for each corresponding pixel (step S102).
- the evaluation calculation unit 102 may calculate, as the posterior probability, the conditional probability that an observation value included in the target SAR image will be observed under measurement conditions corresponding to the predictive distribution.
- the evaluation calculation unit 102 may obtain the posterior probability by normalizing the distance between the observed value and the predicted value on the complex plane by the standard deviation of the predicted distribution.
- the observed value corresponds to the pixel value of each pixel of the target SAR image.
- the predicted value corresponds to the pixel value of each pixel of the simulated SAR image.
- the predicted distribution may be assumed to be a circularly symmetric complex normal distribution.
- the method for calculating the posterior probability is not limited to these.
- the evaluation calculation unit 102 and the evaluation index acquisition process (step S102) according to this embodiment may be applied to, for example, embodiment 2.
- each of the evaluation indices is a posterior probability that the observation value is observed for each corresponding pixel in the simulated SAR image and the target SAR image.
- the evaluation calculation unit 102 calculates the evaluation index for each corresponding pixel by using the simulated information and the target SAR image.
- the simulated SAR image and predicted reliability information can be used to determine the posterior probability as an evaluation index for the target SAR image. Therefore, the target SAR image can be evaluated taking into account the reliability of the simulated SAR image. Therefore, it becomes possible to accurately detect changes in the target area using the SAR image.
- the evaluation index is a joint probability that an observation value is observed for each corresponding pixel in the simulated SAR image and a plurality of target SAR images.
- the evaluation index is a joint probability that an observation value is observed for each corresponding pixel in the simulated SAR image and a plurality of target SAR images.
- the evaluation calculation unit 102 calculates a number of evaluation indices.
- Each of the multiple evaluation indices is the joint probability that an observation value is observed for each corresponding pixel in the simulated SAR image and the multiple target SAR images.
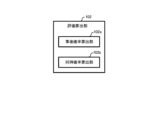
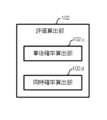
- FIG. 14 is a diagram showing an example of the functional configuration of the evaluation calculation unit 102 according to the fourth embodiment.
- the evaluation calculation unit 102 according to this embodiment includes a posterior probability calculation unit 102a and a joint probability calculation unit 102b.
- the posterior probability calculation unit 102a uses the simulation information and each of the multiple target SAR images to calculate the posterior probability that an observation value will be observed for each corresponding pixel.
- the joint probability calculation unit 102b calculates an evaluation index for each corresponding pixel by combining the posterior probabilities calculated using each of the multiple target SAR images for each corresponding pixel.
- Step S102 Example of evaluation index acquisition process
- the evaluation calculation unit 102 calculates, as an evaluation index, the joint probability that observed values are observed for each corresponding pixel in the simulated SAR image and multiple target SAR images (step S102).
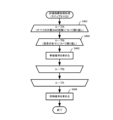
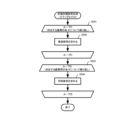
- FIG. 15 is a flowchart showing a detailed example of the evaluation index acquisition process (step S102) according to the fourth embodiment.
- the posterior probability calculation unit 102a repeats steps S402 to S403 for each of all target SAR images (step S401; loop A).
- the posterior probability calculation unit 102a repeats step S403 for each corresponding pixel between the target SAR image and the simulated SAR image to be processed (step S402; loop B).
- the posterior probability calculation unit 102a uses the simulation information and the target SAR image to be processed in loop A to calculate the posterior probability that an observation value corresponding to a pixel to be processed in loop B will be observed (step S403).
- the method for calculating the posterior probability in step S403 may be, for example, any of the methods used in step S102 of embodiment 3. Note that the method for calculating the posterior probability is not limited to the method described in embodiment 3.
- the posterior probability calculation unit 102a can use the simulation information and each of the multiple target SAR images to calculate the posterior probability that an observation value will be observed for each corresponding pixel.
- the joint probability calculation unit 102b combines the posterior probabilities calculated using each of the multiple target SAR images for each corresponding pixel. As a result, the joint probability calculation unit 102b calculates the joint probability for each corresponding pixel in the multiple target SAR images as an evaluation index (step S404).
- This joint probability is the probability that corresponding pixel-by-pixel observations are observed simultaneously in multiple target SAR images under conditions in which simulated SAR images of the target area are obtained.
- evaluation calculation unit 102 and the evaluation index acquisition process (step S102) according to this embodiment may also be applied to, for example, embodiment 2.
- each of the evaluation indexes is the joint probability that an observation value is observed for each corresponding pixel in the simulated SAR image and multiple target SAR images.
- the evaluation calculation unit 102 includes a posterior probability calculation unit 102a and a joint probability calculation unit 102b.
- the posterior probability calculation unit 102a uses the simulation information and each of the multiple target SAR images to calculate the posterior probability that an observation value will be observed for each corresponding pixel.
- the joint probability calculation unit 102b calculates an evaluation index for each corresponding pixel by combining the posterior probabilities calculated using each of the multiple target SAR images for each corresponding pixel.
- the simulated SAR image and predicted reliability information can be used to determine the joint probability as an evaluation index for multiple target SAR images. Therefore, multiple target SAR images can be evaluated with greater accuracy, taking into account the reliability of the simulated SAR image. This makes it possible to accurately detect changes in the target area using the SAR image.
- the evaluation index is the joint probability that observed values are observed for each corresponding pixel group in the simulated SAR image and the target SAR image.
- the evaluation calculation unit 102 calculates a number of evaluation indices.
- Each of the multiple evaluation indices is the joint probability that an observation value is observed for each corresponding pixel group in the simulated SAR image and the target SAR image.
- FIG. 16 is a diagram showing an example of the functional configuration of the evaluation calculation unit 102 according to the fifth embodiment.
- the evaluation calculation unit 102 according to this embodiment includes a posterior probability calculation unit 102c and a joint probability calculation unit 102d.
- the posterior probability calculation unit 102c uses the simulation information and the target SAR image to calculate the posterior probability that an observation value will be observed for each corresponding pixel in the simulated SAR image and the target SAR image.
- the joint probability calculation unit 102d calculates an evaluation index for each corresponding pixel group between the simulated SAR image and the target SAR image by combining the posterior probabilities calculated for each pixel constituting the corresponding pixel group.
- the corresponding pixel groups in the simulated SAR image and the target SAR image may be composed of a plurality of pixels within one or more predetermined ranges.
- the predetermined ranges may be determined, for example, so as to include the entire simulated SAR image and the entire target SAR image without overlapping each other.
- the multiple predetermined ranges may overlap each other partially, or may not overlap each other at all. Furthermore, the one or more predetermined ranges may be determined for a portion of a corresponding area of the simulated SAR image and the target SAR image.
- Step S102 Example of evaluation index acquisition process
- the evaluation calculation unit 102 calculates, as an evaluation index, the joint probability that an observation value is observed for each corresponding pixel group in the simulated SAR image and the target SAR image (step S102).
- FIG. 17 is a flowchart showing a detailed example of the evaluation index acquisition process (step S102) according to the fifth embodiment.
- the posterior probability calculation unit 102c repeats step S502 for each corresponding pixel between the simulated SAR image and the target SAR image included in the simulation information (step S501; loop C).
- the posterior probability calculation unit 102c uses the simulation information and the target SAR image to calculate the posterior probability that an observation value corresponding to a pixel that is the processing target in loop C will be observed (step S502).
- the method for calculating the posterior probability in step S502 may be, for example, any of the methods used in step S102 in embodiment 3. Note that the method for calculating the posterior probability is not limited to the method described in embodiment 3.
- the posterior probability calculation unit 102c can use the simulation information and the target SAR image to calculate the posterior probability that an observation value will be observed for each corresponding pixel in the simulated SAR image and the target SAR image.
- the joint probability calculation unit 102d repeats step S504 for each corresponding pixel group between the simulated SAR image and the target SAR image (step S503; loop D).
- the joint probability calculation unit 102d combines the posterior probabilities calculated in step S502 for each pixel constituting the pixel group to be processed. In this way, the joint probability calculation unit 102d calculates an evaluation index for the pixel group to be processed (step S504).
- the joint probability calculation unit 102d can calculate the joint probability that an observation value is observed for each corresponding pixel group in the simulated SAR image and the target SAR image.
- This joint probability is the probability that the observed values of a group of pixels contained in the target SAR image are observed simultaneously under the conditions under which a simulated SAR image of the target area is obtained.
- evaluation calculation unit 102 and the evaluation index acquisition process (step S102) according to this embodiment may also be applied to, for example, embodiment 2.
- each of the evaluation indices is the joint probability that the observation value is observed for each corresponding pixel group in the simulated SAR image and the target SAR image.
- the evaluation calculation unit 102 includes a posterior probability calculation unit 102c and a joint probability calculation unit 102d.
- the posterior probability calculation unit 102c uses the simulation information and the target SAR image to calculate the posterior probability that an observation value will be obtained for each corresponding pixel.
- the joint probability calculation unit 102d calculates an evaluation index for each corresponding pixel group by combining the posterior probabilities calculated for each pixel that constitutes the pixel group for each corresponding pixel group.
- the simulated SAR image and predicted reliability information can be used to determine the joint probability as an evaluation index for the pixel groups contained in the target SAR image. Therefore, multiple target SAR images can be evaluated with greater accuracy, taking into account the reliability of the simulated SAR image. This makes it possible to accurately detect changes in the target area using the SAR image.
- a simulated SAR image generating means for generating simulated information including a simulated SAR image composed of predicted values of each pixel predicted to be obtained when a target region in a steady state is observed, and predicted reliability information indicating the reliability of the predicted values of each pixel; and an evaluation calculation means for calculating an evaluation index for evaluating a target SAR image to be analyzed using the simulation information.
- the signal processing device according to 1., wherein each of the simulated SAR image and the target SAR image is a two-dimensional complex image. 3. The signal processing device according to 1.
- the predicted value of each pixel is a complex value including a reflection intensity component and a phase component predicted to be obtained when the target area in the steady state is observed under the same observation conditions as those of the target SAR image.
- the prediction reliability information includes at least one of a prediction distribution indicating a probabilistic distribution of the prediction value, a statistical index of the prediction distribution, and a probability of the prediction value.
- the target SAR image is composed of observed values of each pixel that actually observes the target area;
- the evaluation index is a plurality of indexes, 5.
- the signal processing device according to any one of 1.
- evaluation index is an index that probabilistically evaluates a degree to which the observed values constituting the target SAR image are consistent with the predicted values constituting the simulated SAR image.
- Each of the evaluation indexes is a posterior probability that the observation value is observed for each corresponding pixel in the simulated SAR image and the target SAR image; 5.
- the evaluation calculation means calculates the evaluation index for each of the corresponding pixels by using the simulation information and the target SAR image. 7.
- Each of the evaluation indexes is a joint probability that the observation value is observed for each corresponding pixel in the simulated SAR image and the plurality of target SAR images;
- the evaluation calculation means includes: a posterior probability calculation means for calculating a posterior probability that the observation value is observed for each of the corresponding pixels using the simulation information and each of the plurality of target SAR images; and a joint probability calculation means for calculating the evaluation index for each of the corresponding pixels by combining the posterior probabilities calculated using each of the plurality of target SAR images for each of the corresponding pixels.
- Each of the evaluation indices is a joint probability that the observation value is observed for each corresponding pixel group in the simulated SAR image and the target SAR image;
- the evaluation calculation means includes: a posterior probability calculation means for calculating a posterior probability of obtaining the observed value for each of the corresponding pixels by using the simulation information and the target SAR image; and a joint probability calculation means for calculating, for each of the corresponding pixel groups, the evaluation index for each of the corresponding pixel groups by combining the posterior probabilities calculated for each pixel constituting the corresponding pixel group.
- a reconstruction means is further provided for generating reliable three-dimensional information including three-dimensional information including estimated values of reflection intensity and phase for each of three-dimensional elements constituting the target region, and estimated reliability information indicating the reliability of the estimated values for each of the three-dimensional elements, using a plurality of observed SAR images; 10.
- the signal processing device according to any one of 1. to 9., wherein the simulated SAR image generating means generates the simulated information by using the reliable three-dimensional information and observation conditions when the actual measurement values are observed.
- the reconstruction means determines the estimated reliability information by evaluating a difference between a received signal and a predicted signal predicted from the three-dimensional information, for each of reflection intensity and phase. 12.
- the signal processing device determines the estimation reliability information by evaluating how likely each estimated value in the three-dimensional information is among possible values.
- the simulated SAR image generating means determines the predicted reliability information by statistical processing using the simulated SAR image and the estimated reliability information.
- the reconstruction means obtains, as the reliable three-dimensional information, a function expressing a relationship between the reflection intensity and phase for each of the three-dimensional elements and the likelihood of each of them.
- the signal processing device wherein the simulated SAR image generating means estimates a plurality of simulated complex signal candidates estimated from the reliable three-dimensional information and likelihoods of each of the plurality of simulated complex signal candidates, and selects or generates a plausible simulated complex signal as the reliability information. 16.
- a simulated SAR image generating means for generating simulated information including a simulated SAR image composed of predicted values of each pixel predicted to be obtained when observing a target region in a steady state, and predicted reliability information indicating the reliability of the predicted values of each pixel; an evaluation calculation means for calculating an evaluation index for evaluating a target SAR image to be analyzed using the simulation information; and a SAR image storage means for storing the observed SAR image of the target area, the observed SAR image being composed of observation values obtained by observing the target area using a synthetic aperture radar.
- a reconstruction means for generating reliable three-dimensional information, using a plurality of the observed SAR images, the reliable three-dimensional information including three-dimensional information including estimated values of reflection intensity and phase for each of the three-dimensional elements constituting the target region, and estimated reliability information indicating the reliability of the estimated values for each of the three-dimensional elements;
- the simulated SAR image generating means generates the simulated information by using the reliable three-dimensional information and observation conditions when the actual measured values are observed. 17.
- One or more computers generating simulated information including a simulated SAR image composed of predicted values of each pixel predicted to be obtained when observing a target region in a steady state, and predicted reliability information indicating the reliability of the predicted values of each pixel;
- the signal processing method further comprises: determining an evaluation index for evaluating a target SAR image to be analyzed using the simulated information.
- 18. The signal processing method according to 17., in which each of the simulated SAR image and the target SAR image is a two-dimensional complex image.
- 19. The signal processing method according to 17. or 18., wherein the predicted value for each pixel is a complex value including a reflection intensity component and a phase component predicted to be obtained when the target area in the steady state is observed under the same observation conditions as those for the target SAR image.
- the signal processing method includes at least one of a prediction distribution indicating a probabilistic distribution of the prediction value, a statistical indicator of the prediction distribution, and a probability of the prediction value.
- the target SAR image is composed of observed values of each pixel that actually observes the target area,
- the evaluation index is a plurality of indexes, 21.
- the signal processing method according to any one of 17. to 20., wherein the evaluation index is an index that probabilistically evaluates the degree to which the observed values constituting the target SAR image are consistent with the predicted values constituting the simulated SAR image. 22.
- Each of the evaluation indexes is a posterior probability that the observation value is observed for each corresponding pixel in the simulated SAR image and the target SAR image, 22.
- Each of the evaluation indexes is a joint probability that the observation value is observed for each corresponding pixel in the simulated SAR image and the plurality of target SAR images, In obtaining the evaluation index, determining, for each of the corresponding pixels, a posterior probability that the observed value is observed using the simulated information and each of the plurality of target SAR images; 22.
- the signal processing method further comprising combining the posterior probabilities calculated using each of the plurality of target SAR images for each of the corresponding pixels to calculate the evaluation index for each of the corresponding pixels.
- Each of the evaluation indices is a joint probability that the observation value is observed for each corresponding pixel group in the simulated SAR image and the target SAR image, In obtaining the evaluation index, determining, for each of the corresponding pixels, a posterior probability of obtaining the observed value using the simulated information and the target SAR image; 22.
- the signal processing method further comprising: determining the evaluation index for each of the corresponding pixel groups by combining the posterior probabilities determined for each pixel constituting the corresponding pixel group. 25.
- the signal processing method according to any one of 17.
- generating reliable three-dimensional information including three-dimensional information including estimated values of reflection intensity and phase for each of three-dimensional elements constituting the target region, and estimated reliability information indicating the reliability of the estimated values of each of the three-dimensional elements; 26.
- the signal processing method according to any one of 17. to 25., wherein generating the simulated information comprises generating the simulated information using the reliable three-dimensional information and observation conditions when the actual measured values are observed. 27.
- the signal processing method is obtained by evaluating a difference between a received signal and a predicted signal predicted from the three-dimensional information for each of reflection intensity and phase.
- the estimated reliability information is obtained by evaluating how likely each estimated value in the three-dimensional information is among possible values. 29.
- generating the reliable three-dimensional information comprises obtaining, as the reliable three-dimensional information, a function expressing a relationship between the reflection intensity and phase for each of the three-dimensional elements and a likelihood of each of them.
- generating the simulated information comprises estimating a plurality of simulated complex signal candidates estimated from the reliable three-dimensional information and estimating likelihoods of each of the plurality of simulated complex signal candidates, and selecting or generating a plausible simulated complex signal as the reliability information.
- 33. The program according to 32., in which each of the simulated SAR image and the target SAR image is a two-dimensional complex image.
- 34 The program according to 32. or 33., wherein the predicted value for each pixel is a complex value including a reflection intensity component and a phase component predicted to be obtained when the target area in the steady state is observed under the same observation conditions as those for the target SAR image.
- the prediction reliability information includes at least one of a prediction distribution indicating a probabilistic distribution of the prediction value, a statistical index of the prediction distribution, and a probability of the prediction value.
- the target SAR image is constructed from observation values of each pixel that actually observes the target area,
- the evaluation index is a plurality of indexes, 36.
- the evaluation index is an index that probabilistically evaluates the degree to which the observed values constituting the target SAR image are consistent with the predicted values constituting the simulated SAR image. 37.
- Each of the evaluation indexes is a posterior probability that the observation value is observed for each corresponding pixel in the simulated SAR image and the target SAR image, 36.
- the program according to claim 35, wherein the step of calculating the evaluation index includes calculating the evaluation index for each of the corresponding pixels using the simulation information and the target SAR image. 38.
- Each of the evaluation indexes is a joint probability that the observation value is observed for each corresponding pixel in the simulated SAR image and the plurality of target SAR images, In obtaining the evaluation index, determining, for each of the corresponding pixels, a posterior probability that the observed value is observed using the simulated information and each of the plurality of target SAR images; 36.
- the program according to claim 35 further comprising: combining the posterior probabilities calculated using each of the plurality of target SAR images for each of the corresponding pixels to calculate the evaluation index for each of the corresponding pixels.
- Each of the evaluation indices is a joint probability that the observation value is observed for each corresponding pixel group in the simulated SAR image and the target SAR image, In obtaining the evaluation index, determining, for each of the corresponding pixels, a posterior probability of obtaining the observed value using the simulated information and the target SAR image; 36.
- the program according to claim 35 further comprising: determining the evaluation index for each of the corresponding pixel groups by combining the posterior probabilities determined for each pixel constituting the corresponding pixel group. 40.
- the method further includes generating, using a plurality of observed SAR images, reliable three-dimensional information including three-dimensional information including estimated values of reflection intensity and phase for each of three-dimensional elements constituting the target region, and estimated reliability information indicating the reliability of the estimated values for each of the three-dimensional elements, 32.
- the program according to 41. wherein in generating the reliable three-dimensional information, the estimated reliability information is obtained by evaluating a difference between a received signal and a predicted signal predicted from the three-dimensional information for each of reflection intensity and phase. 43. The program according to 41., wherein in generating the reliable three-dimensional information, the estimated reliability information is obtained by evaluating how likely each estimated value in the three-dimensional information is among possible values. 44. The program according to claim 42 or 43, wherein in generating the simulated information, the predicted reliability information is obtained by statistical processing using the simulated SAR image and the estimated reliability information. 45.
- the program according to 41. wherein in generating the reliable three-dimensional information, a function expressing a relationship between the reflection intensity and phase of each of the three-dimensional elements and the likelihood of each is obtained as the reliable three-dimensional information.
- generating the simulated information includes estimating a plurality of simulated complex signal candidates estimated from the reliable three-dimensional information and likelihoods of each of the plurality of simulated complex signal candidates, and selecting or generating a plausible simulated complex signal as the reliability information.
Landscapes
- Physics & Mathematics (AREA)
- Engineering & Computer Science (AREA)
- General Physics & Mathematics (AREA)
- Remote Sensing (AREA)
- Radar, Positioning & Navigation (AREA)
- Computer Vision & Pattern Recognition (AREA)
- Electromagnetism (AREA)
- Theoretical Computer Science (AREA)
- Computer Networks & Wireless Communication (AREA)
- Life Sciences & Earth Sciences (AREA)
- Analytical Chemistry (AREA)
- Chemical & Material Sciences (AREA)
- Biochemistry (AREA)
- Pathology (AREA)
- Immunology (AREA)
- Health & Medical Sciences (AREA)
- General Health & Medical Sciences (AREA)
- Radar Systems Or Details Thereof (AREA)
- Studio Devices (AREA)
- Image Input (AREA)
Priority Applications (2)
| Application Number | Priority Date | Filing Date | Title |
|---|---|---|---|
| JP2024570184A JP7871904B2 (ja) | 2023-01-10 | 2024-01-09 | 信号処理装置、信号処理方法及びプログラム |
| US19/144,542 US20260219385A1 (en) | 2023-01-10 | 2024-01-09 | Signal processing apparatus, signal processing method, and non-transitory computer readable medium |
Applications Claiming Priority (2)
| Application Number | Priority Date | Filing Date | Title |
|---|---|---|---|
| JP2023-001674 | 2023-01-10 | ||
| JP2023001674 | 2023-01-10 |
Publications (1)
| Publication Number | Publication Date |
|---|---|
| WO2024150737A1 true WO2024150737A1 (ja) | 2024-07-18 |
Family
ID=91897980
Family Applications (1)
| Application Number | Title | Priority Date | Filing Date |
|---|---|---|---|
| PCT/JP2024/000171 Ceased WO2024150737A1 (ja) | 2023-01-10 | 2024-01-09 | 信号処理装置、信号処理方法及び記録媒体 |
Country Status (4)
| Country | Link |
|---|---|
| US (1) | US20260219385A1 (cg-RX-API-DMAC7.html) |
| JP (1) | JP7871904B2 (cg-RX-API-DMAC7.html) |
| FR (1) | FR3148888B3 (cg-RX-API-DMAC7.html) |
| WO (1) | WO2024150737A1 (cg-RX-API-DMAC7.html) |
Cited By (2)
| Publication number | Priority date | Publication date | Assignee | Title |
|---|---|---|---|---|
| CN120580303A (zh) * | 2025-08-01 | 2025-09-02 | 银河航天(北京)网络技术有限公司 | 一种针对sar图像的地理编码方法、装置及存储介质 |
| WO2026133948A1 (ja) * | 2024-12-19 | 2026-06-25 | 日本電気株式会社 | 情報処理装置、情報処理方法及び記録媒体 |
Citations (3)
| Publication number | Priority date | Publication date | Assignee | Title |
|---|---|---|---|---|
| WO2008016153A1 (fr) * | 2006-08-03 | 2008-02-07 | Pasco Corporation | procédé de prise en charge de contre-mesures pour une catastrophe |
| US20120319893A1 (en) * | 2011-06-20 | 2012-12-20 | California Institute Of Technology | Damage proxy map from interferometric synthetic aperture radar coherence |
| WO2022269754A1 (ja) * | 2021-06-22 | 2022-12-29 | 日本電気株式会社 | 画像解析装置および画像解析方法 |
-
2024
- 2024-01-09 WO PCT/JP2024/000171 patent/WO2024150737A1/ja not_active Ceased
- 2024-01-09 US US19/144,542 patent/US20260219385A1/en active Pending
- 2024-01-09 JP JP2024570184A patent/JP7871904B2/ja active Active
- 2024-05-16 FR FR2405008A patent/FR3148888B3/fr active Active
Patent Citations (3)
| Publication number | Priority date | Publication date | Assignee | Title |
|---|---|---|---|---|
| WO2008016153A1 (fr) * | 2006-08-03 | 2008-02-07 | Pasco Corporation | procédé de prise en charge de contre-mesures pour une catastrophe |
| US20120319893A1 (en) * | 2011-06-20 | 2012-12-20 | California Institute Of Technology | Damage proxy map from interferometric synthetic aperture radar coherence |
| WO2022269754A1 (ja) * | 2021-06-22 | 2022-12-29 | 日本電気株式会社 | 画像解析装置および画像解析方法 |
Cited By (2)
| Publication number | Priority date | Publication date | Assignee | Title |
|---|---|---|---|---|
| WO2026133948A1 (ja) * | 2024-12-19 | 2026-06-25 | 日本電気株式会社 | 情報処理装置、情報処理方法及び記録媒体 |
| CN120580303A (zh) * | 2025-08-01 | 2025-09-02 | 银河航天(北京)网络技术有限公司 | 一种针对sar图像的地理编码方法、装置及存储介质 |
Also Published As
| Publication number | Publication date |
|---|---|
| US20260219385A1 (en) | 2026-07-30 |
| JPWO2024150737A1 (cg-RX-API-DMAC7.html) | 2024-07-18 |
| FR3148888A3 (fr) | 2024-11-22 |
| FR3148888B3 (fr) | 2025-05-02 |
| JP7871904B2 (ja) | 2026-06-09 |
Similar Documents
| Publication | Publication Date | Title |
|---|---|---|
| EP3805794B1 (en) | Analysis of sar data using neural networks | |
| US8482453B2 (en) | Identification and analysis of persistent scatterers in series of SAR images | |
| Kim et al. | Structural displacement estimation through multi-rate fusion of accelerometer and RTK-GPS displacement and velocity measurements | |
| Kurtz et al. | Sea ice thickness, freeboard, and snow depth products from Operation IceBridge airborne data | |
| US7446705B1 (en) | Method and apparatus for determining parameters for a parametric expression characterizing the phase of an acquired signal | |
| Gerg et al. | GPU acceleration for synthetic aperture sonar image reconstruction | |
| Rebmeister et al. | Geocoding of ground-based SAR data for infrastructure objects using the Maximum A Posteriori estimation and ray-tracing | |
| CN106526593A (zh) | 基于sar严密成像模型的子像素级角反射器自动定位方法 | |
| CN117289268A (zh) | 时序InSAR监测数据的大气延迟校正方法、系统与计算机可读介质 | |
| CN111721241A (zh) | 一种GNSS-InBSAR和GB-InSAR跨系统融合三维形变测量方法 | |
| Chen et al. | A novel knowledge-learning coupling method for InSAR phase unwrapping of large surface displacements in coal mining areas | |
| Ma et al. | Two-dimensional horizontal displacement estimation for building structures by fusing acceleration and sparse point clouds | |
| CN116699662B (zh) | 一种基于gnss-r的海上目标定位方法及系统 | |
| JP7750405B2 (ja) | 信号処理装置および信号処理方法 | |
| KR102928144B1 (ko) | 온 보드 처리를 위한 위성 sar 영상 측지좌표 추정 장치 및 방법 | |
| Zhong et al. | Three-dimensional positions of scattering centers reconstruction from multiple SAR images based on radargrammetry | |
| Kurtz et al. | Sea ice thickness, freeboard, and snow depth products from Operation IceBridge airborne data | |
| Baumann-Ouyang et al. | Estimating 3D displacement vectors from line-of-sight observations with application to MIMO-SAR | |
| EP4661760A1 (en) | Universally trained model for detecting objects using common class sensor devices | |
| Haddad et al. | Gradient descent glrt detector for urban tomographic sar applications | |
| Danilicheva et al. | Retrieval of surface currents from sequential satellite radar images | |
| Liu et al. | Underwater Acoustic Round-Trip Navigation Algorithm Utilizing Depth Constraint and RTS Smoothing | |
| Chanut et al. | Automatic tracking rockfall precursory movements in 3D point clouds using the new L-ICP method | |
| Yamaguchi et al. | Change detection robust to orbital variation using bayesian sar tomography | |
| Adeli et al. | Very high resolution parametric and non-parametric sartomography methods for monitoring urban areas structures |
Legal Events
| Date | Code | Title | Description |
|---|---|---|---|
| 121 | Ep: the epo has been informed by wipo that ep was designated in this application |
Ref document number: 24741510 Country of ref document: EP Kind code of ref document: A1 |
|
| ENP | Entry into the national phase |
Ref document number: 2024570184 Country of ref document: JP Kind code of ref document: A |
|
| WWE | Wipo information: entry into national phase |
Ref document number: 2024570184 Country of ref document: JP |
|
| NENP | Non-entry into the national phase |
Ref country code: DE |
|
| 122 | Ep: pct application non-entry in european phase |
Ref document number: 24741510 Country of ref document: EP Kind code of ref document: A1 |