WO2024095331A1 - 運転技能評価方法、運転技能評価システム、および記録媒体 - Google Patents
運転技能評価方法、運転技能評価システム、および記録媒体 Download PDFInfo
- Publication number
- WO2024095331A1 WO2024095331A1 PCT/JP2022/040769 JP2022040769W WO2024095331A1 WO 2024095331 A1 WO2024095331 A1 WO 2024095331A1 JP 2022040769 W JP2022040769 W JP 2022040769W WO 2024095331 A1 WO2024095331 A1 WO 2024095331A1
- Authority
- WO
- WIPO (PCT)
- Prior art keywords
- data
- image
- time series
- vehicle
- density estimation
- Prior art date
- Legal status (The legal status is an assumption and is not a legal conclusion. Google has not performed a legal analysis and makes no representation as to the accuracy of the status listed.)
- Ceased
Links
Images










Classifications
-
- G—PHYSICS
- G06—COMPUTING OR CALCULATING; COUNTING
- G06V—IMAGE OR VIDEO RECOGNITION OR UNDERSTANDING
- G06V20/00—Scenes; Scene-specific elements
- G06V20/50—Context or environment of the image
- G06V20/59—Context or environment of the image inside of a vehicle, e.g. relating to seat occupancy, driver state or inner lighting conditions
- G06V20/597—Recognising the driver's state or behaviour, e.g. attention or drowsiness
-
- B—PERFORMING OPERATIONS; TRANSPORTING
- B60—VEHICLES IN GENERAL
- B60W—CONJOINT CONTROL OF VEHICLE SUB-UNITS OF DIFFERENT TYPE OR DIFFERENT FUNCTION; CONTROL SYSTEMS SPECIALLY ADAPTED FOR HYBRID VEHICLES; ROAD VEHICLE DRIVE CONTROL SYSTEMS FOR PURPOSES NOT RELATED TO THE CONTROL OF A PARTICULAR SUB-UNIT
- B60W40/00—Estimation or calculation of non-directly measurable driving parameters for road vehicle drive control systems not related to the control of a particular sub unit, e.g. by using mathematical models
- B60W40/08—Estimation or calculation of non-directly measurable driving parameters for road vehicle drive control systems not related to the control of a particular sub unit, e.g. by using mathematical models related to drivers or passengers
- B60W40/09—Driving style or behaviour
-
- G—PHYSICS
- G06—COMPUTING OR CALCULATING; COUNTING
- G06V—IMAGE OR VIDEO RECOGNITION OR UNDERSTANDING
- G06V10/00—Arrangements for image or video recognition or understanding
- G06V10/70—Arrangements for image or video recognition or understanding using pattern recognition or machine learning
- G06V10/74—Image or video pattern matching; Proximity measures in feature spaces
- G06V10/75—Organisation of the matching processes, e.g. simultaneous or sequential comparisons of image or video features; Coarse-fine approaches, e.g. multi-scale approaches; using context analysis; Selection of dictionaries
- G06V10/751—Comparing pixel values or logical combinations thereof, or feature values having positional relevance, e.g. template matching
-
- B—PERFORMING OPERATIONS; TRANSPORTING
- B60—VEHICLES IN GENERAL
- B60W—CONJOINT CONTROL OF VEHICLE SUB-UNITS OF DIFFERENT TYPE OR DIFFERENT FUNCTION; CONTROL SYSTEMS SPECIALLY ADAPTED FOR HYBRID VEHICLES; ROAD VEHICLE DRIVE CONTROL SYSTEMS FOR PURPOSES NOT RELATED TO THE CONTROL OF A PARTICULAR SUB-UNIT
- B60W2420/00—Indexing codes relating to the type of sensors based on the principle of their operation
- B60W2420/40—Photo, light or radio wave sensitive means, e.g. infrared sensors
- B60W2420/403—Image sensing, e.g. optical camera
-
- B—PERFORMING OPERATIONS; TRANSPORTING
- B60—VEHICLES IN GENERAL
- B60W—CONJOINT CONTROL OF VEHICLE SUB-UNITS OF DIFFERENT TYPE OR DIFFERENT FUNCTION; CONTROL SYSTEMS SPECIALLY ADAPTED FOR HYBRID VEHICLES; ROAD VEHICLE DRIVE CONTROL SYSTEMS FOR PURPOSES NOT RELATED TO THE CONTROL OF A PARTICULAR SUB-UNIT
- B60W2420/00—Indexing codes relating to the type of sensors based on the principle of their operation
- B60W2420/90—Single sensor for two or more measurements
- B60W2420/905—Single sensor for two or more measurements the sensor being an xyz axis sensor
-
- B—PERFORMING OPERATIONS; TRANSPORTING
- B60—VEHICLES IN GENERAL
- B60W—CONJOINT CONTROL OF VEHICLE SUB-UNITS OF DIFFERENT TYPE OR DIFFERENT FUNCTION; CONTROL SYSTEMS SPECIALLY ADAPTED FOR HYBRID VEHICLES; ROAD VEHICLE DRIVE CONTROL SYSTEMS FOR PURPOSES NOT RELATED TO THE CONTROL OF A PARTICULAR SUB-UNIT
- B60W2520/00—Input parameters relating to overall vehicle dynamics
- B60W2520/10—Longitudinal speed
-
- B—PERFORMING OPERATIONS; TRANSPORTING
- B60—VEHICLES IN GENERAL
- B60W—CONJOINT CONTROL OF VEHICLE SUB-UNITS OF DIFFERENT TYPE OR DIFFERENT FUNCTION; CONTROL SYSTEMS SPECIALLY ADAPTED FOR HYBRID VEHICLES; ROAD VEHICLE DRIVE CONTROL SYSTEMS FOR PURPOSES NOT RELATED TO THE CONTROL OF A PARTICULAR SUB-UNIT
- B60W2520/00—Input parameters relating to overall vehicle dynamics
- B60W2520/10—Longitudinal speed
- B60W2520/105—Longitudinal acceleration
-
- B—PERFORMING OPERATIONS; TRANSPORTING
- B60—VEHICLES IN GENERAL
- B60W—CONJOINT CONTROL OF VEHICLE SUB-UNITS OF DIFFERENT TYPE OR DIFFERENT FUNCTION; CONTROL SYSTEMS SPECIALLY ADAPTED FOR HYBRID VEHICLES; ROAD VEHICLE DRIVE CONTROL SYSTEMS FOR PURPOSES NOT RELATED TO THE CONTROL OF A PARTICULAR SUB-UNIT
- B60W2520/00—Input parameters relating to overall vehicle dynamics
- B60W2520/12—Lateral speed
- B60W2520/125—Lateral acceleration
-
- B—PERFORMING OPERATIONS; TRANSPORTING
- B60—VEHICLES IN GENERAL
- B60W—CONJOINT CONTROL OF VEHICLE SUB-UNITS OF DIFFERENT TYPE OR DIFFERENT FUNCTION; CONTROL SYSTEMS SPECIALLY ADAPTED FOR HYBRID VEHICLES; ROAD VEHICLE DRIVE CONTROL SYSTEMS FOR PURPOSES NOT RELATED TO THE CONTROL OF A PARTICULAR SUB-UNIT
- B60W2520/00—Input parameters relating to overall vehicle dynamics
- B60W2520/14—Yaw
Definitions
- This disclosure relates to a driving skill evaluation method and driving skill evaluation system for evaluating a driver's driving skills, as well as a recording medium on which software for evaluating a driver's driving skills is recorded.
- Patent Document 1 discloses a technology that evaluates the driving skills of a driver based on the longitudinal acceleration and lateral acceleration when the vehicle turns.
- a driving skill evaluation method includes generating a kernel density estimation image based on time series data of a first parameter corresponding to a directional change in the vehicle's traveling direction and time series data of a second parameter indicating the square of the jerk in the vehicle's traveling direction, and evaluating the driving skill of a driver of the vehicle by comparing the kernel density estimation image with a reference image.
- the driving skill evaluation system includes an image generation circuit and an evaluation circuit.
- the image generation circuit generates a kernel density estimation image based on time series data of a first parameter corresponding to a directional change in the vehicle's traveling direction and time series data of a second parameter indicating the square of the jerk in the vehicle's traveling direction.
- the evaluation circuit evaluates the driving skill of the vehicle driver by comparing the kernel density estimation image with a reference image.
- a recording medium has recorded thereon software that causes a processor to generate a kernel density estimation image based on time series data of a first parameter corresponding to a directional change in the vehicle's traveling direction and time series data of a second parameter indicating the square of the jerk in the vehicle's traveling direction, and to evaluate the driving skill of the vehicle's driver by comparing the kernel density estimation image with a reference image.
- FIG. 1 is an explanatory diagram illustrating an example of the configuration of a driving skill evaluation system in which a driving skill evaluation method according to an embodiment of the present disclosure is used;
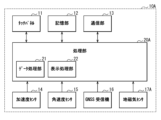
- FIG. 2 is a block diagram illustrating a configuration example of the smartphone illustrated in FIG. 1 .
- 2 is a block diagram illustrating an example of a configuration of a server device 30 illustrated in FIG. 1.
- 4 is an explanatory diagram illustrating data stored in a storage unit 32 shown in FIG. 3.
- 5 is an explanatory diagram illustrating an example of yaw angular velocity data and curve data illustrated in FIG. 4 .
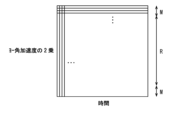
- 5 is an image diagram showing an example of a kernel density estimation image indicated by the image data shown in FIG. 4.
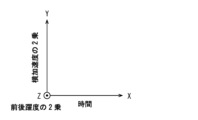
- FIG. 7 is an explanatory diagram illustrating an example of parameters in the kernel density estimation image shown in FIG.
- FIG. 2 is an explanatory diagram illustrating a configuration example of the data processing system illustrated in FIG. 1 .
- 9 is a block diagram illustrating an example of a configuration of the in-vehicle device illustrated in FIG. 8 .
- 9 is a block diagram illustrating an example of a configuration of the information processing device illustrated in FIG. 8.
- 9 is a flowchart illustrating an example of an operation of the information processing device illustrated in FIG. 8 .
- 10 is another flowchart illustrating an example of an operation of the information processing device illustrated in FIG. 8 .
- 10 is another flowchart illustrating an example of an operation of the information processing device illustrated in FIG. 8 .
- 10 is another flowchart illustrating an example of an operation of the information processing device illustrated in FIG. 8 .
- 10 is another flowchart illustrating an example of an operation of the information processing device illustrated in FIG. 8 .
- FIG. 8 is another flowchart illustrating an example of an operation of the information processing device illustrated in FIG. 8 .
- FIG. 15 is an explanatory diagram illustrating an example of a process for generating the preprocessed image shown in FIG. 14 .
- 10 is another flowchart illustrating an example of an operation of the information processing device illustrated in FIG. 8 .
- FIG. 9 is an explanatory diagram illustrating an operation example of the information processing device illustrated in FIG. 8 .
- 10 is another flowchart illustrating an example of an operation of the information processing device illustrated in FIG. 8 .
- 2 is a flowchart illustrating an example of an operation of the server device illustrated in FIG. 1 .
- 10 is another flowchart illustrating an example of an operation of the server device illustrated in FIG. 1 .
- FIG. 4 is an explanatory diagram illustrating an example of time-series data of longitudinal acceleration.
- FIG. 4 is an explanatory diagram illustrating an example of time-series data of longitudinal acceleration.
- FIG. 13 is an explanatory diagram illustrating an example of parameters in a kernel density estimation image according to a modified example.
- FIG. 13 is an explanatory diagram illustrating an example of parameters in a kernel density estimation image according to another modified example.
- FIG. 13 is an explanatory diagram illustrating an example of parameters in a kernel density estimation image according to another modified example.
- FIG. 13 is an explanatory diagram illustrating an example of parameters in a kernel density estimation image according to another modified example.
- FIG. 13 is an image diagram illustrating an example of a kernel density estimation image according to another modified example.
- FIG. 26 is an explanatory diagram illustrating an example of parameters in the kernel density estimation image shown in FIG. 25 .
- FIG. 13 is a block diagram illustrating a configuration example of a smartphone according to another modified example.
- FIG. 1 shows an example of the configuration of a driving skill evaluation system 1 in which a driving skill evaluation method according to an embodiment is used.
- the driving skill evaluation system 1 includes a smartphone 10, a server device 30, and a data processing system 2.
- Smartphone 10 is a high-function mobile phone, and is fixedly installed inside vehicle 9 in a predetermined orientation relative to vehicle 9. Smartphone 10 collects driving data of vehicle 9. Smartphone 10 is connected to the Internet (not shown) by communicating with a mobile phone base station (not shown), for example, via mobile phone communication.
- the server device 30 is an information processing device.
- the server device 30 evaluates the driving skills of the driver of the vehicle 9 based on the driving data of the vehicle 9.
- the server device 30 is connected to the Internet (not shown).
- the server device 30 is capable of communicating with the smartphone 10 via the Internet.
- the data processing system 2 includes an information processing device and generates data to be used in the evaluation of driving skills.
- the data processing system 2 is connected to the Internet (not shown).
- the data processing system 2 is capable of communicating with the server device 30 via the Internet.
- the driver to be evaluated drives the vehicle 9 in an evaluation area with many curves, including mountain roads, and the smartphone 10 collects driving data of the vehicle 9 and transmits the driving data to the server device 30.
- This driving data includes information on the acceleration in the traveling direction of the vehicle 9 (longitudinal acceleration), information on the yaw angular velocity of the vehicle 9, and information on the position of the vehicle 9.
- the server device 30 detects multiple curves on the driving route on which the vehicle 9 has traveled based on the time series data of the yaw angular velocity of the vehicle 9.
- the server device 30 then generates a kernel density estimation image for each of the multiple curves based on the time series data of the longitudinal acceleration and the time series data of the yaw angular velocity.
- the server device 30 evaluates the driving skill of the driver by comparing the kernel density estimation image generated by the server device 30 with the kernel density estimation image of an experienced driver generated by the data processing system 2 and registered in advance in the server device 30 for each of the multiple curves.
- the smartphone 10 then presents the evaluation result of the driving skill to the driver. This allows the driver to obtain an objective evaluation of their driving skills using the driving skill evaluation system 1.
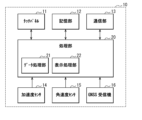
- FIG. 2 shows an example configuration of a smartphone 10.
- the smartphone 10 has a touch panel 11, a memory unit 12, a communication unit 13, an acceleration sensor 14, an angular velocity sensor 15, a GNSS (Global Navigation Satellite System) receiver 16, and a processing unit 20.
- GNSS Global Navigation Satellite System
- the touch panel 11 is a user interface and includes, for example, a touch sensor and a display device such as a liquid crystal display or an organic EL (Electro Luminescence) display.
- the touch panel 11 accepts operations by the user of the smartphone 10 and displays the processing results of the smartphone 10.
- the storage unit 12 is a non-volatile memory and is configured to store program data for various application software.
- application software related to the driving skill evaluation system 1 is installed on the smartphone 10.
- the program data for this application software is stored in the storage unit 12.
- the communication unit 13 is configured to communicate with a mobile phone base station by performing mobile phone communication. As a result, the communication unit 13 communicates with a server device 30 connected to the Internet via the mobile phone base station.
- the acceleration sensor 14 is configured to detect acceleration in three directions in the coordinate system of the smartphone 10.
- the angular velocity sensor 15 is configured to detect three angular velocities (yaw angular velocity, roll angular velocity, and pitch angular velocity) in the coordinate system of the smartphone 10.
- the GNSS receiver 16 is configured to acquire the position of the vehicle 9 on the ground using a GNSS such as the Global Positioning System (GPS).
- GPS Global Positioning System
- the processing unit 20 is configured to control the operation of the smartphone 10, and is configured using, for example, one or more processors, one or more memories, etc.
- the processing unit 20 collects time series data of acceleration detected by the acceleration sensor 14, time series data of angular velocity detected by the angular velocity sensor 15, and time series data of the position of the vehicle 9 obtained by the GNSS receiver 16.
- the processing unit 20 can operate as a data processing unit 21 and a display processing unit 22 by executing application software related to the driving skill evaluation system 1 installed in the smartphone 10.
- the data processing unit 21 is configured to perform a predetermined data processing based on the detection results of the acceleration sensor 14 and the angular velocity sensor 15.
- the predetermined data processing includes, for example, filtering the time series data of acceleration detected by the acceleration sensor 14 and filtering the time series data of angular velocity detected by the angular velocity sensor 15.
- the filtering is processing using a low-pass filter.
- the communication unit 13 transmits the time series data of acceleration and the time series data of angular velocity processed by the data processing unit 21 to the server device 30 together with the time series data of the position of the vehicle 9 obtained by the GNSS receiver 16.
- the display processing unit 22 is configured to perform display processing based on the data indicating the evaluation results of the driving skills transmitted from the server device 30.
- the touch panel 11 is configured to display the evaluation results of the driving skills.
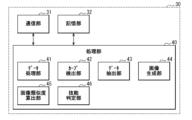
- FIG. 3 shows an example of the configuration of the server device 30.
- the server device 30 has a communication unit 31, a storage unit 32, and a processing unit 40.
- the communication unit 31 is configured to communicate with the smartphone 10 via the Internet by performing network communication.
- the memory unit 32 includes, for example, a hard disk drive (HDD) or a solid state drive (SSD), and is configured to store program data for various software.
- HDD hard disk drive
- SSD solid state drive
- server software related to the driving skill evaluation system 1 is installed in the server device 30.
- the program data for this software is stored in the memory unit 32.
- the memory unit 32 also stores various data used by this software.
- FIG. 4 shows an example of data stored in the storage unit 32 and used by the server software.
- the storage unit 32 stores area data DAR, multiple data sets DS (data set DSA and multiple data sets DSB), and evaluation target curve data DTC. These data are generated by the data processing system 2 and stored in the storage unit 32.
- the area data DAR is data that indicates the evaluation area in which driving skills are evaluated.
- the evaluation area can be set to an area with many curves, such as an area that includes mountain roads.
- This area data DAR includes, for example, data on the latitude and longitude of the evaluation area.
- Each of the multiple data sets DS is data corresponding to driving data obtained by an experienced driver driving a vehicle in an area indicated by the area data DAR.
- the multiple data sets DS may include data corresponding to multiple pieces of driving data related to different experienced drivers, or may include data corresponding to multiple pieces of driving data related to a single experienced driver.
- Each of the multiple data sets DS includes acceleration data DA, yaw angular velocity data DY, curve data DC, and multiple image data DP.
- the acceleration data DA is time-series data of the acceleration in the direction of travel (longitudinal acceleration) of a vehicle driven by an experienced driver.
- the yaw angular velocity data DY is time series data of the yaw angular velocity of a vehicle driven by an experienced driver.
- the curve data DC includes curve numbers for multiple curves on the road.
- the curve data DC is generated based on the yaw angular velocity data DY.
- the curve numbers for multiple curves are set in correspondence with the time series data of the yaw angular velocity in the yaw angular velocity data DY.
- FIG. 5 shows an example of yaw angular velocity data DY and curve data DC.
- the yaw angular velocity changes according to the curve of the road.
- the curve data DC includes curve numbers ("1" to "9” in FIG. 5) set based on the time series data of the yaw angular velocity.
- the curve numbers of multiple curves are set in correspondence with the time series data of the yaw angular velocity in the yaw angular velocity data DY.
- the multiple image data DP are image data of kernel density estimation images for multiple curves.
- FIG. 6 shows an example of a kernel density estimation image for a curve.
- FIG. 7 shows the coordinate axes of the kernel density estimation image shown in FIG. 6.
- the horizontal axis (X-axis) of this kernel density estimation image indicates time, and the vertical axis (Y-axis) indicates the square of the yaw angular acceleration.
- the yaw angular acceleration is the time derivative of the yaw angular velocity.
- the pixel value (Z-axis) of the kernel density estimation image indicates the square of the longitudinal jerk.
- the longitudinal jerk is the time derivative of the longitudinal acceleration.
- a darker image portion indicates a larger value of the square of the longitudinal jerk
- a lighter image portion indicates a smaller value of the square of the longitudinal jerk.
- This kernel density estimation image can change depending on the driving skill of the driver.
- a plurality of kernel density estimation images corresponding to a plurality of curves are stored as a plurality of image data DP.
- the data set DSA and each of the multiple data sets DSB thus contain acceleration data DA, yaw angular velocity data DY, curve data DC, and multiple image data DP.
- the data processing system 2 adjusts the curve numbers of the curve data DC in each of the multiple data sets DSB based on the curve data DC in the data set DSA. That is, since the curve numbers are generated based on the yaw angular velocity data DY, it is possible that a different curve number will be assigned to a certain curve depending on the yaw angular velocity data DY.
- the data processing system 2 uses the data set DSA as sample data, and adjusts the curve numbers of the curve data DC in each of the multiple data sets DSB based on the curve data DC in the data set DSA. As a result, the curve numbers of the same curves in the curve data DC of the multiple data sets DSB are adjusted to be the same.
- the evaluation target curve data DTC is data indicating the curve numbers of the multiple curves that are the evaluation targets for the driving skill evaluation among the multiple curves in the area indicated by the area data DAR.
- the memory unit 32 stores multiple data sets DS, evaluation target curve data DTC, and area data DAR for each of the multiple areas.
- the processing unit 40 (FIG. 3) is configured to control the operation of the server device 30, and is configured using, for example, one or more processors, one or more memories, etc.
- the processing unit 40 can operate as a data processing unit 41, a curve detection unit 42, a data extraction unit 43, an image generation unit 44, an image similarity calculation unit 45, and a skill judgment unit 46 by executing server software related to the driving skill evaluation system 1 installed in the server device 30.
- the data processing unit 41 is configured to generate acceleration data DA1 and yaw angular velocity data DY1 by performing a predetermined data processing based on the time series data of acceleration, time series data of angular velocity, and time series data of the position of the vehicle 9 received by the communication unit 31.
- the predetermined data processing includes, for example, a process of checking whether the vehicle 9 is traveling in the evaluation target area based on the time series data of the position of the vehicle 9, a process of generating time series data of acceleration in the traveling direction of the vehicle 9 (longitudinal acceleration) by performing coordinate transformation based on the time series data of acceleration obtained by the smartphone 10, a process of generating time series data of the yaw angular velocity of the vehicle 9 by performing coordinate transformation based on the time series data of angular velocity obtained by the smartphone 10, a filter process for the time series data of the longitudinal acceleration, and a filter process for the time series data of the yaw angular velocity.
- the filter process is a process using a low-pass filter.
- the curve detection unit 42 is configured to generate curve data DC1 by detecting multiple curves based on the yaw angular velocity data DY1 generated by the data processing unit 41.
- the data extraction unit 43 is configured to extract time series data of longitudinal acceleration included in the acceleration data DA1, which is related to multiple curves that are the subject of the driving skill evaluation, based on the evaluation target curve data DTC stored in the memory unit 32, and to extract time series data of yaw angular velocity included in the yaw angular velocity data DY1, which is related to multiple curves that are the subject of the driving skill evaluation.
- the image generation unit 44 is configured to generate a plurality of kernel density estimation images for the plurality of curves based on the time series data of longitudinal acceleration and the time series data of yaw angular velocity for the plurality of curves extracted by the data extraction unit 43, thereby generating a plurality of image data DP1. Specifically, the image generation unit 44 performs kernel density estimation processing based on the time series data of longitudinal acceleration and the time series data of yaw angular velocity for one curve, thereby generating a kernel density estimation image of that curve. In the kernel density estimation processing, original data including data that has not yet been observed is estimated as density data based on actual measurement data.
- the image generation unit 44 performs this processing for each of the plurality of curves, thereby generating a plurality of kernel density estimation images. In this manner, the image generation unit 44 is configured to generate a plurality of image data DP1 for the plurality of curves.
- the image similarity calculation unit 45 is configured to calculate an average value of image similarities (average similarity) based on the multiple kernel density estimation images generated by the image generation unit 44 and the multiple kernel density estimation images included in the multiple data sets DS stored in the storage unit 32. Specifically, the image similarity calculation unit 45 calculates image similarities for each curve by comparing the kernel density estimation image generated by the image generation unit 44 with the multiple kernel density estimation images included in the multiple data sets DS. The image similarity calculation unit 45 calculates multiple image similarities by performing this process for each of the multiple curves. The image similarity calculation unit 45 then calculates an average value (average similarity) of these multiple image similarities.
- the skill assessment unit 46 is configured to assess the driving skill of the driver of the vehicle 9 based on the average similarity calculated by the image similarity calculation unit 45.
- the communication unit 31 is configured to transmit data indicating the evaluation result of the driving skill generated by the skill assessment unit 46 to the smartphone 10.
- the multiple data sets DS, evaluation target curve data DTC, and area data DAR stored in the storage unit 32 are generated by the data processing system 2. This data processing system 2 will be described below.
- FIG. 8 shows an example of the configuration of the data processing system 2.
- the data processing system 2 includes an in-vehicle device 110 and an information processing device 130.
- the in-vehicle device 110 is a device installed in a vehicle 109 driven by an experienced driver.
- the information processing device 130 is a so-called personal computer.
- FIG. 9 shows an example of the configuration of the in-vehicle device 110.
- the in-vehicle device 110 has an acceleration sensor 114, a yaw angular velocity sensor 115, a GNSS receiver 116, and a processing unit 120.
- the acceleration sensor 114 is configured to detect the acceleration in the direction of travel of the vehicle 109 (longitudinal acceleration).
- the yaw angular velocity sensor 115 is configured to detect the yaw angular velocity of the vehicle 109.
- the GNSS receiver 116 is configured to obtain the position of the vehicle 109 on the ground using a GNSS such as GPS.
- the processing unit 120 is a so-called ECU (Electronic Control Unit) and is configured using, for example, one or more processors and one or more memories.
- the processing unit 120 collects time series data of longitudinal acceleration detected by the acceleration sensor 114, time series data of yaw angular velocity detected by the yaw angular velocity sensor 115, and time series data of the position of the vehicle 109 obtained by the GNSS receiver 116.
- the engineer stores the time series data collected by the processing unit 120 in an external recording medium such as a semiconductor memory.
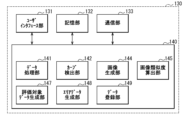
- FIG. 10 shows an example of the configuration of the information processing device 130.
- the information processing device 130 reads data recorded on an external recording medium based on the engineer's operation, and generates multiple data sets DS, evaluation target curve data DTC, and area data DAR to be stored in the storage unit 32 of the server device 30 based on the read data.
- the information processing device 130 includes a user interface unit 131, a storage unit 132, a communication unit 133, and a processing unit 140.
- the user interface unit 131 includes, for example, a keyboard, a mouse, and a display unit such as a liquid crystal display or an organic EL display.
- the user interface unit 131 accepts operations by a user of the information processing device 130 (an engineer in this example), and displays the processing results of the information processing device 130.
- the storage unit 132 includes, for example, an HDD or SSD, and is configured to store program data for various software.
- software related to the data processing system 2 is installed in the information processing device 130.
- the program data for this software is stored in the storage unit 132.
- the communication unit 133 is configured to communicate with the server device 30 via the Internet by performing network communication.
- the processing unit 140 is configured to control the operation of the information processing device 130, and is configured using, for example, one or more processors, one or more memories, etc.
- the processing unit 140 can operate as a data processing unit 141, a curve detection unit 142, an image generation unit 144, an image similarity calculation unit 145, an evaluation target data generation unit 147, an area data generation unit 148, and a data registration unit 149 by executing software related to the data processing system 2 installed in the information processing device 130.
- the data processing unit 141 is configured to generate acceleration data DA and yaw angular velocity data DY by performing a predetermined data processing based on the time series data of longitudinal acceleration and the time series data of yaw angular velocity read from the external recording medium.
- the predetermined data processing includes, for example, filtering the time series data of longitudinal acceleration, filtering the time series data of yaw angular velocity, and processing for generating area data DAR based on the operation of an engineer.
- the filtering is processing using a low-pass filter.
- the curve detection unit 142 is configured to generate curve data DC by detecting multiple curves based on the yaw angular velocity data DY generated by the data processing unit 141.
- the processing of the curve detection unit 142 is similar to the processing of the curve detection unit 42 in the server device 30.
- the image generating unit 144 is configured to generate a plurality of image data DP by generating a plurality of kernel density estimation images for the plurality of curves based on the time series data of longitudinal acceleration and the time series data of yaw angular velocity for the plurality of curves.
- the processing of the image generating unit 144 is similar to the processing of the image generating unit 44 in the server device 30.
- the image similarity calculation unit 145 is configured to calculate the image similarity based on a plurality of kernel density estimated images.
- the image similarity calculation process in the image similarity calculation unit 145 is similar to the image similarity calculation process in the image similarity calculation unit 45 of the server device 30.
- the evaluation target data generation unit 147 is configured to generate evaluation target curve data DTC by determining multiple curves that are targets for evaluating driving skills based on the processing results of the image similarity calculation unit 145.
- the area data generation unit 148 is configured to generate area data DAR, which is data indicating the area to be evaluated, based on the engineer's operations.
- the data registration unit 149 is configured to store in the memory unit 132 a data set DS including acceleration data DA, yaw angular velocity data DY, curve data DC, and multiple image data DP, evaluation target curve data DTC, and area data DAR.
- the data processing system 2 generates multiple data sets DS, evaluation target curve data DTC, and area data DAR based on the driving data of the skilled driver.
- the data processing system 2 then transmits the multiple data sets DS, evaluation target curve data DTC, and area data DAR to the server device 30.
- the server device 30 then stores these data in the storage unit 32.
- the image generation unit 44 corresponds to a specific example of an "image generation circuit” in the present disclosure.
- the image similarity calculation unit 45 and the skill assessment unit 46 correspond to a specific example of an "evaluation circuit” in the present disclosure.
- the square of the yaw angular acceleration corresponds to a specific example of a "first parameter” in the present disclosure.
- the square of the forward/backward jerk corresponds to a specific example of a "second parameter” in the present disclosure.
- the kernel density estimation image indicated by the image data DP of the dataset DS stored in the memory unit 32 corresponds to a specific example of a "reference image” in the present disclosure.
- the driving skill evaluation system 1 generates multiple data sets DS, evaluation target curve data DTC, and area data DAR based on driving data when an experienced driver drives the vehicle 109.
- an experienced driver drives the vehicle 109 of the data processing system 2, and the processing unit 120 of the in-vehicle device 110 collects driving data of the vehicle 109.
- the engineer stores the driving data collected by the processing unit 120 in an external recording medium such as a semiconductor memory.
- the information processing device 130 generates acceleration data DA, yaw angular velocity data DY, curve data DC, and multiple image data DP based on this driving data, and stores a data set DS including these data in the storage unit 132.
- the information processing device 130 repeats this process to store multiple data sets DS in the storage unit 132.
- the information processing device 130 also generates evaluation target curve data DTC, which is data indicating multiple curves that are the subject of evaluation of driving skills, based on the multiple data sets DS, and generates area data DAR, which is data indicating the evaluation target area, based on the engineer's operation, and stores these data in the storage unit 132. Then, the information processing device 130 transmits the multiple data sets DS, the evaluation target curve data DTC, and the area data DAR to the server device 30.
- the server device 30 stores the multiple data sets DS, the evaluation target curve data DTC, and the area data DAR transmitted from the information processing device 130 in the storage unit 32.
- the driving skill evaluation system 1 evaluates the driving skill of a driver using the multiple data sets DS, evaluation target curve data DTC, and area data DAR generated in this manner by an experienced driver driving the vehicle 109.
- the smartphone 10 collects driving data of the vehicle 9 while the driver to be evaluated drives the vehicle 9.
- the smartphone 10 then transmits the collected driving data to the server device 30.
- the server device 30 generates acceleration data DA1, yaw angular velocity data DY1, curve data DC1, and multiple image data DP1 based on this driving data.
- the server device 30 calculates an average value (average similarity) of image similarities based on multiple kernel density estimation images indicated by the multiple image data DP1 and multiple kernel density estimation images indicated by multiple image data DP included in multiple data sets DS stored in the storage unit 32, and judges the driving skill of the driver of the vehicle 9 based on this average similarity.
- the server device 30 transmits data indicating the evaluation result of the driving skill to the smartphone 10.
- the smartphone 10 displays the judgment result of the driving skill transmitted from the server device 30.
- the data processing system 2 generates a plurality of data sets DS based on driving data obtained by an experienced driver driving the vehicle 109.
- the operation of generating the plurality of data sets DS will be described in detail below.
- the acceleration sensor 114 of the in-vehicle device 110 detects the acceleration in the traveling direction of the vehicle 109 (longitudinal acceleration), the yaw angular velocity sensor 115 detects the yaw angular velocity of the vehicle 109, and the GNSS receiver 116 acquires the position of the vehicle 109 on the ground.
- the processing unit 120 collects time series data of the longitudinal acceleration detected by the acceleration sensor 114, time series data of the yaw angular velocity detected by the yaw angular velocity sensor 115, and time series data of the position of the vehicle 109 obtained by the GNSS receiver 116.
- the engineer stores the time series data collected by the processing unit 120 in an external recording medium such as a semiconductor memory.
- the information processing device 130 generates a data set DS based on the time series data of the longitudinal acceleration, the time series data of the yaw angular velocity, and the time series data of the position of the vehicle 109 read from this external recording medium, and stores this data set DS in the storage unit 132. The operation of this information processing device 130 will be described in detail below.
- FIG. 11 shows an example of the operation of the information processing device 130 in the data processing system 2.
- the area data generation unit 148 has already generated the area data DAR based on the engineer's operation.
- the data processing unit 141 of the information processing device 130 uses the area data DAR stored in the storage unit 132 based on the time series data of the position of the vehicle 109 to check whether the vehicle 109 has traveled through the area to be evaluated (step S101). If the vehicle 109 has not traveled through the area to be evaluated ("N" in step S101), this process ends.
- step S101 If the vehicle 109 travels through the evaluation area ("Y" in step S101), the data processing unit 141 performs filter processing on the time series data of longitudinal acceleration and the time series data of yaw angular velocity in the evaluation area to generate acceleration data DA and yaw angular velocity data DY, respectively (step S102).
- the curve detection unit 142 generates curve data DC by performing a curve division process based on the yaw angular velocity data DY generated in step S102 (step S103).
- the curve division process includes the following two-stage process.
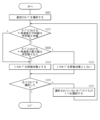
- FIG. 12 shows a specific example of the first stage of the curve division process.
- the curve detection unit 142 performs the process shown in FIG. 12 while sequentially reading the yaw angular velocities included in the yaw angular velocity data DY in chronological order.
- the curve detection unit 142 checks whether a yaw angular velocity equal to or greater than a predetermined value A (e.g., equal to or greater than 0.02 rad/sec.) continues for a period of equal to or greater than a predetermined time B (e.g., equal to or greater than 2 seconds) (step S201).
- a predetermined value A e.g., equal to or greater than 0.02 rad/sec.
- a predetermined time B e.g., equal to or greater than 2 seconds
- step S201 If the condition in step S201 is met ("Y" in step S201), the curve detection unit 142 checks whether the polarity of the yaw angular velocity is the same as the polarity of the yaw angular velocity at the immediately preceding curve, and whether the vehicle 109 has been traveling on a straight road for less than a predetermined time C (e.g., less than 9 seconds) after the immediately preceding curve (step S202).
- a predetermined time C e.g., less than 9 seconds
- step S203 the curve detection unit 142 detects a curve (step S203). That is, in step S201, the basic conditions for curve detection are met and the new curve is far from the previous curve, so the curve detection unit 142 detects a new curve in addition to the previous curve. The curve detection unit 142 assigns a curve number to the detected curve. Then, the process proceeds to step S205.
- step S202 determines that the previous curve continues (step S203). That is, in step S201, the basic conditions for curve detection are met, but since the distance from the previous curve is short, the previous curve is determined to continue. Then, the process proceeds to step S205.
- the curve detection unit 142 checks whether the yaw angular velocity is equal to or less than a predetermined value A (for example, equal to or less than 0.02 rad/sec) (step S205). In other words, the curve detection unit 142 checks whether the basic conditions for curve detection are no longer satisfied. If the yaw angular velocity is not equal to or less than the predetermined value A ("N" in step S205), the process of step S205 is repeated until the yaw angular velocity becomes equal to or less than the predetermined value A.
- a predetermined value A for example, equal to or less than 0.02 rad/sec
- the curve detection unit 142 checks whether the yaw angular velocity becomes equal to or greater than the predetermined value A (e.g., equal to or greater than 0.02 rad/sec) after the yaw angular velocity remains below the predetermined value A (e.g., less than 0.02 rad/sec) for less than a predetermined time B (e.g., less than 2 seconds) (step S206). If this condition is met ("Y" in step S206), the curve detection unit 142 determines that the previous curve is continuing (step S207).
- the predetermined value A e.g., equal to or greater than 0.02 rad/sec
- a predetermined time B e.g., less than 2 seconds
- the curve detection unit 142 determines that the driver has adjusted the steering operation immediately after the curve has ended, causing the vehicle 109 to wobble, and determines that the previous curve is continuing. Then, the process returns to step S205.
- step S206 If the condition of step S206 is not met ("N" in step S206), the curve detection unit 142 detects the end of the curve (step S208).
- the curve detection unit 142 checks whether all the yaw angular velocity data included in the yaw angular velocity data DY has been read (step S209). If all the data has not yet been read ("N" in step S209), the process returns to step S201.
- step S209 If all data has been read in step S209 ("Y" in step S209), this process ends.
- the curve detection unit 142 basically detects a curve when a yaw angular velocity equal to or greater than a predetermined value A (e.g., equal to or greater than 0.02 rad/sec) continues for a predetermined time period B or longer (e.g., 2 seconds or longer) (step S201).
- a predetermined value A e.g., equal to or greater than 0.02 rad/sec
- the curve detection unit 142 considers the previous curve to be continuing (steps S205 to S207). Also, when the straight road between two curves that turn in the same direction is short, the curve detection unit 142 considers these two curves to be one curve (steps S201, S202, S204).
- FIG. 13 shows a specific example of the second stage of curve division processing.
- the curve detection unit 142 performs this second stage of processing using the results of the first stage of processing. In this way, the curve detection unit 142 determines whether or not each of the multiple curves detected by the first stage of processing should be evaluated in the driving skill evaluation.
- the curve detection unit 142 selects the first curve from among the multiple curves obtained by the first stage of processing (step S221).
- the curve detection unit 142 checks whether the average value of the yaw angular velocity on the selected curve is less than a predetermined value D (e.g., less than 0.05 rad/sec.) (step S222).
- a predetermined value D e.g., less than 0.05 rad/sec.
- step S222 If, in step S222, the average value of the yaw angular velocity is less than the predetermined value D ("Y" in step S222), the curve detection unit 142 checks whether the maximum value of the yaw angular velocity is equal to or greater than a predetermined value E (e.g., equal to or greater than 0.07 rad/sec) (step S223).
- a predetermined value E e.g., equal to or greater than 0.07 rad/sec
- step S222 If in step S222 the average value of the yaw angular velocity is not less than the predetermined value D ("N" in step S222), or if in step S223 the maximum value of the yaw angular velocity is equal to or greater than the predetermined value E ("Y" in step S223), the curve detection unit 142 selects this curve as a target for the driving skill evaluation (step S224). Also, if in step S223 the maximum value of the yaw angular velocity is not equal to or greater than the predetermined value E ("N" in step S223), the curve detection unit 142 does not select this curve as a target for the driving skill evaluation (step S225).
- the curve detection unit 142 checks whether all the curves have been selected (step S226). If all the curves have not yet been selected ("N" in step S226), the curve detection unit 142 selects one of the unselected curves (step S227). Then, the process returns to step S221. The curve detection unit 142 repeats the process of steps S221 to S227 until all the curves have been selected.
- the curve detection unit 142 performs the curve division process to generate the curve data DC.
- the curve detection unit 142 checks whether there is sample data (step S104). Specifically, the curve detection unit 142 checks whether the data set DSA, which is the sample data, is stored in the storage unit 132.
- step S104 If there is no sample data in step S104 ("N" in step S104), the image generation unit 144 generates multiple image data DP by generating a kernel density estimation image for each of the multiple curves (step S105).
- Figure 14 shows an example of a process for generating a kernel density estimation image.
- the image generating unit 144 performs preprocessing (step S241). Specifically, the image generating unit 44 first calculates time series data of the longitudinal jerk by time-differentiating the time series data of the longitudinal acceleration included in the acceleration data DA, and calculates time series data of the square of the longitudinal jerk based on this time series data of the longitudinal jerk. The image generating unit 144 also calculates time series data of the yaw angular acceleration by time-differentiating the time series data of the yaw angular velocity included in the yaw angular velocity data DY, and calculates time series data of the square of the yaw angular acceleration based on this time series data of the yaw angular acceleration. The image generating unit 144 then generates a preprocessed image based on the time series data of the square of the longitudinal jerk and the time series data of the square of the yaw angular acceleration.
- FIG. 15 shows an example of a process for generating a preprocessed image.
- the horizontal axis (X-axis) of this preprocessed image indicates time, and the vertical axis (Y-axis) indicates the square of the yaw angular acceleration.
- the preprocessed image is divided into 100 regions in the X-axis direction and 100 regions in the Y-axis direction.
- the preprocessed image has 10,000 regions.
- the full scale in the X-axis direction in the preprocessed image is set to, for example, 5 seconds, assuming the travel time of the vehicle 109 around one curve.
- the full scale in the Y-axis direction in the preprocessed image is set based on the time series data of the square of the yaw angular acceleration.
- the value of the square of the yaw angular acceleration generally varies widely, and may become a value that deviates significantly due to, for example, detection accuracy. Therefore, in this example, the image generating unit 144 performs a process to remove the values that deviate significantly from the values of the square of the yaw angular acceleration.
- the image generating unit 44 can remove the values that deviate significantly by using, for example, a box-and-whisker plot.
- the image generating unit 144 finds the minimum and maximum values from the data from which the values that deviate significantly have been removed, and determines the full scale in the Y-axis direction so that the range R of values from the minimum value to the maximum value falls within the Y-axis direction of FIG. 15 with an appropriate margin M.
- the margin M can be, for example, about 3% of the width of the values from the minimum value to the maximum value.
- the image generator 144 maps the value of the square of the forward and backward jerk to 10,000 regions in the preprocessed image based on the time and the value of the square of the yaw angular acceleration.
- the image generating unit 144 sets the squared value of the forward and backward jerk for that piece of data as the value of that region. In the 10,000 regions where multiple pieces of data are mapped, the image generating unit 144 adds the squared values of the forward and backward jerk for those multiple pieces of data together and sets the summed value as the value of that region. In this way, the image generating unit 144 generates pixel values (Z axis) of the preprocessed image.
- the image generating unit 144 scales this pixel value so that it is an integer between 0 and 255, for example, and so that the larger the squared value of the forward and backward jerk, the smaller the pixel value, and so that the smaller the squared value of the forward and backward jerk, the larger the pixel value. In this way, the image generating unit 144 generates a preprocessed image.
- the image generating unit 144 performs kernel density estimation processing based on this preprocessed image, as shown in FIG. 14 (step S242).
- kernel density estimation processing original data including data that has not yet been observed is estimated as density data based on actual measurement data.
- the image generating unit 144 performs kernel density estimation processing using known techniques. In this way, the image generating unit 144 generates a kernel density estimated image.
- the image generation unit 144 generates multiple image data DP by generating a kernel density estimation image for each of the multiple curves.
- the data registration unit 149 stores the acceleration data DA and yaw angular velocity data DY generated in step S102, the curve data DC generated in step S103, and the multiple image data DP generated in step S105 in the storage unit 132 as a data set DSA (step S106). This ends the process.
- step S104 If sample data is available in step S104 ("Y" in step S104), the curve detection unit 142 corrects the curve data DC by identifying the correspondence of the curve based on the similarity between the yaw angular velocity data DY generated in step S102 and the yaw angular velocity data DY of the data set DSA stored in the memory unit 132 (step S107).
- FIG. 16 shows an example of the processing in step S107.
- the curve detection unit 142 identifies the entire driving section to be processed based on the yaw angular velocity data DY generated in step S102 and the yaw angular velocity data DY of the data set DSA (step S261). Specifically, the curve detection unit 142 identifies similar entire driving sections based on the yaw angular velocity data DY generated in step S102 and the yaw angular velocity data DY of the data set DSA using dynamic time wrapping (DTW). That is, since both of these yaw angular velocity data DY are time series data of yaw angular velocity in the evaluation target area, it is desirable that they are almost the same.
- DTW dynamic time wrapping
- the curve detection unit 142 uses the dynamic time warping method based on the yaw angular velocity data DY generated in step S102 and the yaw angular velocity data DY of the data set DSA to identify an entire driving section in which the number of curves is approximately the same. As a result, the yaw angular velocity data DY generated in step S102 and the yaw angular velocity data DY of the data set DSA can be compared with each other in this entire driving section. In this way, the curve detection unit 142 identifies the entire driving section to be processed.
- the curve detection unit 142 identifies the correspondence between the curves in the entire driving section to be processed obtained from the yaw angular velocity data DY generated in step S102 and the curves in the entire driving section to be processed obtained from the yaw angular velocity data DY of the dataset DSA (step S262). Specifically, the curve detection unit 142 identifies the correspondence between the curves by identifying multiple sections that are similar to each other using a dynamic time warping method based on the yaw angular velocity data DY generated in step S102 and the yaw angular velocity data DY of the dataset DSA.
- FIG. 17 shows an example of the processing of step S262, where (A) shows the yaw angular velocity data DY generated in step S102, and (B) shows the yaw angular velocity data DY of the data set DSA.
- This FIG. 17 shows the yaw angular velocity data DY for a portion of the driving section to be processed.
- the numbers indicate the curve numbers in the curve data DC.
- the curve detection unit 142 changes the curve number of the curve in portion W1 in the yaw angular velocity data DY (FIG. 17(A)) generated in step S102 from “6" to "6, 7, 8", and changes the curve numbers of the curves following this curve. That is, the curve detection unit 142 identifies the curve correspondence so that the curve numbers of the multiple curves in the yaw angular velocity data DY (FIG. 17(A)) generated in step S102 match the curve numbers of the multiple curves in the yaw angular velocity data DY (FIG. 17(B)) of the data set DSA. Then, the curve detection unit 142 corrects the curve data DC generated in step S103 based on the results of this processing.
- the curve detection unit 142 excludes curves with low similarity between the multiple curves in the yaw angular velocity data DY generated in step S102 and the multiple curves in the yaw angular velocity data DY of the data set DSA from the evaluation targets for the driving skill evaluation (step S263). Specifically, the curve detection unit 142 calculates the similarity between the multiple curves in the yaw angular velocity data DY generated in step S102 and the multiple curves in the yaw angular velocity data DY of the data set DSA that correspond to each other using a dynamic time warping method. Then, the curve detection unit 142 excludes curves with similarity lower than a predetermined amount from the evaluation targets for the driving skill evaluation.
- the curve detection unit 142 corrects the curve data DC by identifying the correspondence of the curve based on the similarity between the yaw angular velocity data DY generated in step S102 and the yaw angular velocity data DY of the data set DSA.
- the image generating unit 144 generates a plurality of image data DP by generating a kernel density estimation image for each of the plurality of curves (step S108). This process is similar to the process of step S105.
- the data registration unit 149 stores the acceleration data DA and yaw angular velocity data DY generated in step S102, the curve data DC generated in step S103 and corrected in step S107, and the multiple image data DP generated in step S108 as a data set DSB in the storage unit 132 (step S109). This ends the process.
- the data processing system 2 generates a data set DS including acceleration data DA, yaw angular velocity data DY, curve data DC, and multiple image data DP based on driving data obtained by an experienced driver driving the vehicle 109. By repeating this process, the data processing system 2 can generate multiple data sets DS based on multiple driving data.
- the data processing system 2 performs processing based on driving data obtained by an experienced driver driving the vehicle 109, but it is also possible to perform processing based on driving data obtained by an unskilled driver driving the vehicle 109. In this way, the data processing system 2 can obtain a kernel density estimation image related to the experienced driver and a kernel density estimation image related to the unskilled driver.
- This kernel density estimation image may change depending on the driving skill of the driver.
- the driving skill evaluation system 1 evaluates the driving skill of the driver based on the kernel density estimation image.
- FIG. 18 shows an example of a process for generating evaluation target curve data DTC.
- the data processing system 2 has already acquired multiple data sets DS related to an experienced driver and multiple data sets DS related to an unskilled driver.
- the evaluation target data generation unit 147 selects one of the multiple curves (step S301).
- the image similarity calculation unit 145 calculates an average value F1 of image similarities between multiple kernel density estimation images related to an experienced driver and multiple kernel density estimation images related to an unskilled driver for the selected curve (step S302). Specifically, the image similarity calculation unit 145 calculates image similarities of kernel density estimation images for all combinations between multiple kernel density estimation images related to one or more experienced drivers and multiple kernel density estimation images related to one or more unskilled drivers for the selected curve. Then, the image similarity calculation unit 145 calculates the average value F1 of these image similarities.
- the image similarity calculation unit 145 calculates the average value F2 of the image similarities between each of the multiple kernel density estimation images related to the skilled driver for the selected curve (step S303). Specifically, the image similarity calculation unit 145 calculates the image similarities of the kernel density estimation images for all combinations between each of the multiple kernel density estimation images related to one or more skilled drivers for the selected curve. Then, the image similarity calculation unit 145 calculates the average value F2 of these image similarities.
- the evaluation target data generating unit 147 checks whether there is a significant difference between the average values F1 and F2 (step S304). Specifically, if the difference between the average values F1 and F2 is equal to or greater than a predetermined amount, the evaluation target data generating unit 147 determines that there is a significant difference between the average values F1 and F2. If there is a significant difference between the average values F1 and F2 ("Y" in step S304), the evaluation target data generating unit 147 sets the curve selected in step S301 as the evaluation target for the driving skill evaluation (step S305). If there is no significant difference between the average values F1 and F2 ("N" in step S304), the evaluation target data generating unit 147 does not set the curve selected in step S301 as the evaluation target for the driving skill evaluation (step S306).
- the evaluation target data generation unit 147 checks whether all curves have been selected (step S307). If all curves have not yet been selected ("N" in step S307), the evaluation target data generation unit 147 selects one of the unselected curves (step S308). Then, the process returns to step S302. The evaluation target data generation unit 147 repeats the process of steps S302 to S308 until all curves have been selected.
- the evaluation target data generation unit 147 If all curves have been selected in step S307 ("Y" in step S307), the evaluation target data generation unit 147 generates evaluation target curve data DTC based on the processing results of steps S305 and S306 (step S309). Specifically, the evaluation target data generation unit 147 generates evaluation target curve data DTC including the curve numbers of the curves that are the evaluation targets for the driving skill evaluation in steps S305 and S306.
- the data processing system 2 generates the evaluation target curve data DTC based on the driving data obtained by an experienced driver and an unskilled driver driving the vehicle 109.
- the data processing system 2 transmits the multiple data sets DS, the evaluation target curve data DTC, and the area data DAR to the server device 30.
- the server device 30 stores these data in the storage unit 32.
- the processing unit 140 calculates the average values F1 and F2 in steps S302 to S304, and checks whether there is a significant difference between the average values F1 and F2 to determine whether the selected curve is to be evaluated, but this is not limited to the above.
- the processing unit 140 may determine whether the selected curve is to be evaluated by performing, for example, a non-parametric U-test based on the multiple image similarities used to calculate the average value F1 and the multiple image similarities used to calculate the average value F2, without using the average values F1 and F2.
- the image similarity calculation unit 145 calculates the image similarities of the kernel density estimation images for all combinations between the multiple kernel density estimation images related to one or more skilled drivers and the multiple kernel density estimation images related to one or more non-skilled drivers for the selected curve.
- the image similarity calculation unit 145 calculates the image similarity of the kernel density estimation image for all combinations between the multiple kernel density estimation images related to one or more skilled drivers for one selected curve.
- the evaluation target data generation unit 147 performs, for example, a non-parametric U-test process based on the multiple image similarities obtained in the first step and the multiple image similarities obtained in the subsequent steps to determine whether there is a significant difference between the multiple image similarities obtained in the first step and the multiple image similarities obtained in the subsequent steps. If there is a significant difference, the evaluation target data generation unit 147 sets the curve selected in step S301 as the evaluation target for the driving skill evaluation (step S305). If there is no significant difference ("N" in step S304), the evaluation target data generation unit 147 does not set the curve selected in step S301 as the evaluation target for the driving skill evaluation (step S306).
- the driving skill evaluation system 1 evaluates the driving skill of a driver based on driving data generated by the driver driving the vehicle 9, using a plurality of data sets DS, evaluation target curve data DTC, and area data DAR stored in the storage unit 32 of the server device 30. This operation will be described in detail below.
- the acceleration sensor 14 of the smartphone 10 in the vehicle 9 detects the acceleration in each of the three directions in the coordinate system of the smartphone 10
- the angular velocity sensor 15 detects each of the three angular velocities (yaw angular velocity, roll angular velocity, pitch angular velocity) in the coordinate system of the smartphone 10
- the GNSS receiver 16 obtains the position of the vehicle 9 on the ground.
- the data processing unit 21 performs predetermined data processing such as filtering based on the detection results of the acceleration sensor 14 and the detection results of the angular velocity sensor 15. Specifically, the data processing unit 21 performs filtering on the time series data of acceleration detected by the acceleration sensor 14, and performs filtering on the time series data of angular velocity detected by the angular velocity sensor 15. Note that this is not limited to this, and the data processing unit 21 may perform downsampling on the time series data that has been subjected to filtering.
- the communication unit 13 transmits the acceleration time series data and angular velocity time series data processed by the data processing unit 21 to the server device 30 together with the position time series data of the vehicle 9 obtained by the GNSS receiver 16.
- the communication unit 31 receives the data transmitted from the smartphone 10.
- the server device 30 evaluates the driver's driving skills based on the data received by the communication unit 31. The operation of the server device 30 will be described in detail below.
- FIGS. 19A and 19B show an example of the operation of the server device 30.
- the data processing unit 41 of the server device 30 uses the area data DAR stored in the storage unit 32 based on the time series data of the position of the vehicle 9 to check whether the vehicle 9 has traveled through the area to be evaluated (step S401). If the vehicle 9 has not traveled through the area to be evaluated ("N" in step S401), this process ends.
- the data processing unit 41 When the vehicle 9 travels through the evaluation area ("Y" in step S401), the data processing unit 41 performs coordinate transformation to generate time series data of longitudinal acceleration and time series data of yaw angular velocity (step S402). Specifically, the data processing unit 41 performs coordinate transformation based on the time series data of acceleration in the evaluation area to generate time series data of acceleration in the traveling direction of the vehicle 9 (longitudinal acceleration). The data processing unit 41 also performs coordinate transformation based on the time series data of angular velocity in the evaluation area to generate time series data of yaw angular velocity of the vehicle 9.
- the data processing unit 41 may perform upsampling processing on the time series data of acceleration and the time series data of angular velocity received by the communication unit 31, and perform coordinate transformation based on the time series data of longitudinal acceleration and the time series data of yaw angular velocity that have been subjected to upsampling processing.
- the data processing unit 41 performs filtering on the time series data of longitudinal acceleration and the time series data of yaw angular velocity generated in step S402 to generate acceleration data DA1 and yaw angular velocity data DY1, respectively (step S403).
- the curve detection unit 42 generates curve data DC1 by performing a curve division process based on the yaw angular velocity data DY1 generated in step S403 (step S404).
- This curve division process is similar to the process of step S103 shown in FIG. 11.
- the curve detection unit 42 corrects the curve data DC1 by identifying the correspondence of the curve based on the similarity between the yaw angular velocity data DY1 generated in step S403 and the yaw angular velocity data DY of the data set DSA stored in the storage unit 32 (step S405). This process is similar to the process of step S107 shown in FIG. 11.
- the data extraction unit 43 extracts time series data of longitudinal acceleration and time series data of yaw angular velocity related to the curve that is the evaluation target of the driving skill evaluation based on the evaluation target curve data DTC stored in the memory unit 32 (step S406). Specifically, the data extraction unit 43 extracts time series data of longitudinal acceleration related to the multiple curves used in the evaluation of the driving skill from the time series data of longitudinal acceleration included in the acceleration data DA1. In addition, the data extraction unit 43 extracts time series data of yaw angular velocity related to the multiple curves used in the evaluation of the driving skill from the time series data of yaw angular velocity included in the yaw angular velocity data DY1.
- the image generating unit 44 generates a plurality of image data DP by generating a kernel density estimation image for each of the plurality of curves based on the time series data of the longitudinal acceleration and the time series data of the yaw angular velocity extracted in step S406 (step S407). This process is similar to the process of step S108. In this step S406, the image generating unit 44 generates a kernel density estimation image for the curve that is the subject of the driving skill evaluation.
- the image similarity calculation unit 45 calculates an average value of image similarities (average similarity) based on the multiple kernel density estimation images generated in step S407 and the multiple kernel density estimation images included in the multiple data sets DS related to the skilled driver stored in the storage unit 32 (step S408). Specifically, the image similarity calculation unit 45 calculates the image similarity for each of the multiple curves by comparing the kernel density estimation image generated by the image generation unit 44 with the multiple kernel density estimation images included in the multiple data sets DS related to the skilled driver. The image similarity calculation unit 45 calculates multiple image similarities by performing this process for each of the multiple curves. Then, the image similarity calculation unit 45 calculates the average value (average similarity) of these multiple image similarities. In this example, the image similarity value is a positive value, and the more similar the kernel density estimation images are, the smaller the image similarity value is, and the more dissimilar the kernel density estimation images are, the larger the image similarity value is.
- the skill assessment unit 46 checks whether the number of curves detected by the curve detection unit 42 in steps S404 and S405 is equal to or greater than the predetermined number G1 (step S409). That is, when the curve detection unit 42 detects curves in steps S404 and S405, there may be cases where some curves cannot be detected depending on the yaw angular velocity data DY1. For example, if the driver's driving skill is low and the yaw angular velocity data DY1 differs greatly from the yaw angular velocity data DY of an experienced driver, the number of curves that cannot be detected may increase. Therefore, the skill assessment unit 46 checks whether the number of curves detected based on the yaw angular velocity data DY1 is equal to or greater than the predetermined number G1.
- step S409 If, in step S409, the number of detected curves is equal to or greater than the predetermined number G1 ("Y" in step S109), the skill assessment unit 46 checks whether the average similarity value calculated in step S408 is less than the threshold value G2 (step S410).
- step S410 determines that the driving skill of the driver of vehicle 9 is high (step S411). That is, since the average similarity value is less than the threshold value G2 in step S410, the kernel density estimation image of the driver resembles the kernel density estimation image of an experienced driver. Therefore, the skill assessment unit 46 determines that the driving skill of the driver of vehicle 9 is high.
- step S409 if the number of detected curves is not equal to or greater than the predetermined number G1 ("N" in step S409), or if the value of the average similarity is not less than the threshold value G2 ("N" in step S410), the skill assessment unit 46 determines that the skill level of the driver of the vehicle 9 is low (step S412). That is, in step S409, if the number of detected curves is not equal to or greater than the predetermined number G1, the difference between the yaw angular velocity data DY1 of the driver and the yaw angular velocity data DY of the skilled driver is large, so the skill assessment unit 46 determines that the driver's driving skill is low.
- step S410 if the value of the average similarity is not less than the threshold value G2, the kernel density estimation image of the driver is not similar to the kernel density estimation image of the skilled driver, so the skill assessment unit 46 determines that the driver's driving skill is low.
- the communication unit 31 of the server device 30 transmits data including the evaluation results of the driving skills to the smartphone 10.
- the communication unit 13 of the smartphone 10 receives the data transmitted from the smartphone 10.
- the display processing unit 22 performs display processing based on the data indicating the evaluation results of the driving skills transmitted from the server device 30.
- the touch panel 11 displays the evaluation results of the driving skills. This allows the driver to obtain an objective evaluation of his or her driving skills.
- the driving skill evaluation method in the driving skill evaluation system 1 includes generating a kernel density estimation image based on time series data of a first parameter (in this example, the square of the yaw angular velocity) corresponding to the change in the direction of travel of the vehicle 9 and time series data of a second parameter indicating the square of the jerk (forward and backward jerk) in the direction of travel of the vehicle 9, and evaluating the driving skill of the driver of the vehicle by comparing the kernel image estimation image with a reference image related to an experienced driver.
- the driving skill evaluation method can improve the evaluation accuracy of the driver's driving skill. That is, in the kernel density estimation process, original data including data that has not yet been observed is estimated as density data based on actual measurement data. Therefore, the kernel image estimation image can include the driver's original unique characteristics according to the driving skill of the driver. Therefore, in this driving skill evaluation method, the kernel image estimation image can be used to improve the evaluation accuracy of the driver's driving skill.
- the kernel density estimation image is generated based on the time series data of the second parameter indicating the square of the jerk in the traveling direction of the vehicle 9, so that the evaluation accuracy of the driver's driving skill can be improved. That is, for example, when the kernel density estimation image is generated based on the time series data of the acceleration (longitudinal acceleration) in the traveling direction of the vehicle 9, the pixel value of the preprocessed image may become negative, so that the kernel density estimation process cannot be performed.
- this longitudinal acceleration is easily affected by gravitational acceleration, for example, on a gradient, so that a trend occurs in the longitudinal acceleration.
- the kernel density estimation image is generated based on the time series data of the absolute value of this longitudinal acceleration, the kernel density estimation image is affected by gravitational acceleration, so that the evaluation accuracy of the driver's driving skill may be reduced.
- the kernel density estimation image is generated based on the time series data of the second parameter indicating the square of the jerk in the traveling direction of the vehicle 9 (longitudinal jerk).
- the longitudinal jerk is calculated by time-differentiating the longitudinal acceleration
- the square of this longitudinal jerk is calculated
- a kernel density estimation image is generated based on the time series data of the square of this longitudinal jerk.
- the time series data of the first parameter in this example, the square of the yaw angular velocity
- the time series data of the second parameter in this example, the square of the longitudinal jerk
- the time series data on the curve includes information about the various operations of the driver. Therefore, this driving skill evaluation method can improve the accuracy of the evaluation of the driver's driving skills.
- the first image direction in the kernel density estimation image indicates time
- the second image direction in the kernel density estimation image indicates the first parameter (in this example, the square of the yaw angular velocity)
- the pixel value of the kernel density estimation image is set to a value according to the data of the second parameter (in this example, the square of the longitudinal jerk).
- this driving skill evaluation method further includes presenting the evaluation results of the driver's driving skills to the driver. This allows the driver to obtain an objective evaluation of his or her driving skills. As a result, the driver can pay attention to his or her driving and improve his or her driving skills.
- the driving skill evaluation method includes generating a kernel density estimation image based on time series data of a first parameter corresponding to a directional change in the vehicle's direction of travel and time series data of a second parameter indicating the square of the jerk in the vehicle's direction of travel, and evaluating the driving skill of the vehicle's driver by comparing the kernel density estimation image with a reference image related to an experienced driver, thereby improving the accuracy of the evaluation of the driver's driving skill.
- a kernel density estimation image is generated based on time series data of a second parameter that indicates the square of the jerk in the vehicle's traveling direction, thereby improving the accuracy of the evaluation of the driver's driving skills.
- the time series data of the first parameter and the time series data of the second parameter are data obtained when the vehicle is traveling around a curve, which can improve the accuracy of the evaluation of the driver's driving skills.
- the first image direction in the kernel density estimation image indicates time
- the second image direction in the kernel density estimation image indicates a first parameter
- the pixel values of the kernel density estimation image correspond to the data of the second parameter
- the driving skill evaluation method further includes presenting the evaluation results of the driver's driving skills to the driver, so that the driver can obtain an objective evaluation of his or her driving skills. As a result, the driver can pay attention to his or her driving and improve his or her driving skills.
- the vertical axis (Y axis) of the kernel density estimation image indicates the square of the yaw angular acceleration, but is not limited to this.
- the vertical axis (Y axis) of the kernel density estimation image may indicate the yaw angular acceleration as shown in Fig. 21, or may indicate the absolute value of the yaw angular acceleration.
- the vertical axis (Y axis) of the kernel density estimation image may indicate the yaw angular velocity as shown in Fig. 22, or may indicate the absolute value of the yaw angular velocity.
- the vertical axis (Y axis) of the kernel density estimation image may indicate the square of the acceleration (lateral acceleration) in the direction intersecting the traveling direction of the vehicle as shown in Fig. 23, or may indicate the lateral acceleration as shown in Fig. 24, or may indicate the absolute value of the lateral acceleration.
- the vertical axis (Y axis) of the kernel density estimation image indicates the square of the yaw angular acceleration
- the pixel value (Z axis) of the kernel density estimation image indicates the square of the longitudinal jerk
- the vertical axis (Y axis) of the kernel density estimation image may indicate the square of the longitudinal jerk
- the pixel value (Z axis) of the kernel density estimation image may indicate the square of the yaw angular acceleration.
- Fig. 25 shows an example of a kernel density estimation image in a certain curve.
- FIG. 26 shows the coordinate axes of the kernel density estimation image shown in Fig. 25.
- the driving skill evaluation system 1 may be configured to perform processing based on both the kernel density estimation images shown in Figures 6 and 7 and the kernel density estimation images shown in Figures 25 and 26.
- the information processing device 130 of the data processing system 2 may determine whether to generate the kernel density estimation images shown in Figures 6 and 7 or the kernel density estimation images shown in Figures 25 and 26 based on the operation of an engineer.
- the information processing device 130 may also determine which of these kernel density estimation images to generate based on the acceleration data DA including time series data of longitudinal acceleration and the yaw angular velocity data DY including time series data of yaw angular velocity.
- the information processing device 130 checks whether the road on which the vehicle 109 has traveled is a road on which the speed of the vehicle 109 changes significantly based on the acceleration data DA and the yaw angular velocity data DY. Then, if the road on which the vehicle 109 has traveled is one on which the speed of the vehicle 109 changes significantly, the information processing device 130 decides to generate the kernel density estimation image shown in FIGS. 6 and 7, and if the road on which the vehicle 109 has traveled is not one on which the speed of the vehicle 109 changes significantly, the information processing device 130 decides to generate the kernel density estimation image shown in FIGS. 25 and 26.
- the information processing device 130 may determine to generate the kernel density estimation image shown in Figures 6 and 7 for all curves, or may determine to generate the kernel density estimation image shown in Figures 25 and 26 for all curves. Furthermore, the information processing device 130 may individually determine which kernel density estimation image to generate for each of the multiple curves, the kernel density estimation image shown in Figures 6 and 7 or the kernel density estimation image shown in Figures 25 and 26.
- the server device 30 If the kernel density estimation image for an experienced driver in the dataset DS is the kernel density estimation image shown in Figures 6 and 7, the server device 30 generates the kernel density estimation image shown in Figures 6 and 7 based on the driver's driving data, and if the kernel density estimation image for an experienced driver in the dataset DS is the kernel density estimation image shown in Figures 25 and 26, the server device 30 generates the kernel density estimation image shown in Figures 25 and 26 based on the driver's driving data.
- the pixel values (Z-axis) of the kernel density estimation image indicate the square of the yaw angular acceleration, but this is not limited to this. Instead, for example, as in variant example 1, the pixel values (Z-axis) of the kernel density estimation image may indicate the absolute value of the yaw angular acceleration, the square of the lateral acceleration, or the absolute value of the lateral acceleration.
- the smartphone 10 transmits the time series data of acceleration, the time series data of angular velocity, and the time series data of the position of the vehicle 9 to the server device 30, but this is not limited to this. Instead of this, for example, the smartphone 10 may further transmit the time series data of geomagnetism to the server device 30. This example will be described in detail below.
- FIG. 27 shows an example of the configuration of a smartphone 10A according to this modified example.
- the smartphone 10A has a geomagnetic sensor 17A and a processing unit 20A.
- the geomagnetic sensor 17A is configured to detect geomagnetism.
- the processing unit 20A collects time series data of acceleration detected by the acceleration sensor 14, time series data of angular velocity detected by the angular velocity sensor 15, time series data of the position of the vehicle 9 obtained by the GNSS receiver 16, and time series data of geomagnetism detected by the geomagnetic sensor 17A.
- the communication unit 13 transmits the time series data of acceleration and time series data of angular velocity processed by the data processing unit 21 to the server device 30 together with the time series data of the position of the vehicle 9 obtained by the GNSS receiver 16 and the time series data of geomagnetism detected by the geomagnetic sensor 17A.
- the data processing unit 41 of the server device 30 generates time series data of acceleration in the traveling direction of the vehicle 9 (longitudinal acceleration) by performing coordinate transformation based on the time series data of acceleration received by the communication unit 31. It also generates time series data of the yaw angular velocity of the vehicle 9 by performing coordinate transformation based on the time series data of angular velocity received by the communication unit 31. The data processing unit 41 then corrects the time series data of the longitudinal acceleration and the time series data of the yaw angular velocity based on the time series data of geomagnetic field received by the communication unit 31. This makes it possible to improve the accuracy of the time series data of the longitudinal acceleration and the time series data of the yaw angular velocity.
- the server device 30 evaluates the driving skills based on the driving data transmitted from the smartphone 10, but this is not limited to the above.
- the smartphone 10 may evaluate the driving skills based on the driving data.
- the processing unit 20 of the smartphone 10 may operate as a data processing unit 41, a curve detection unit 42, a data extraction unit 43, an image generation unit 44, an image similarity calculation unit 45, and a skill assessment unit 46.
- the storage unit 12 of the smartphone 10 stores a plurality of data sets DS (data set DSA and a plurality of data sets DSB), evaluation target curve data DTC, and area data DAR.
- the on-board device of the vehicle 9 may collect driving data of the vehicle 9 and evaluate the driving skill based on this driving data.
- the on-board device of the vehicle 9 collects time series data of longitudinal acceleration detected by an acceleration sensor, time series data of yaw angular velocity detected by a yaw angular velocity sensor, and time series data of the position of the vehicle 9 obtained by a GNSS receiver.
- the processing units of the on-board device of the vehicle 9 may operate as a data processing unit 41, a curve detection unit 42, a data extraction unit 43, an image generation unit 44, an image similarity calculation unit 45, and a skill determination unit 46.
- the storage unit of the on-board device stores a plurality of data sets DS (data set DSA and a plurality of data sets DSB), evaluation target curve data DTC, and area data DAR.
- a first image direction in the kernel density estimation image indicates time;
- the driving skill evaluation method according to any one of (1) to (3), wherein the first parameter is a parameter related to lateral acceleration.
- a first image direction in the kernel density estimation image indicates time;
- a second image direction in the kernel density estimation image indicates the second parameter, and pixel values of the kernel density estimation image are values corresponding to data of the first parameter.
- the driving skill evaluation method according to any one of (1) to (8), further comprising presenting an evaluation result of the driver's driving skill to the driver.
- an image generating circuit that generates a kernel density estimation image based on time series data of a first parameter corresponding to a directional change in a traveling direction of the vehicle and time series data of a second parameter indicating a square of a jerk in the traveling direction of the vehicle; and an evaluation circuit that evaluates the driving skill of a driver of the vehicle by comparing the kernel density estimation image with a reference image.
- (11) generating a kernel density estimation image based on time series data of a first parameter corresponding to a directional change in a traveling direction of the vehicle and time series data of a second parameter indicating a square of a jerk in the traveling direction of the vehicle; and evaluating the driving skill of a driver of the vehicle by comparing the kernel density estimation image with a reference image.
- At least one processor e.g., a central processing unit (CPU)), at least one application specific integrated circuit (ASIC), and/or at least one field programmable gate array (FPGA).
- the at least one processor may be configured to perform all or a portion of the various functions of the processing unit 40 shown in FIG. 3 by reading instructions from at least one non-transitory and tangible computer readable medium.
- Such media may take a variety of forms, including, but not limited to, various magnetic media such as hard disks, various optical media such as CDs or DVDs, various semiconductor memories such as volatile or non-volatile memories (i.e., semiconductor circuits). Volatile memories may include DRAM and SRAM.
- Non-volatile memories may include ROM and NVRAM.
- An ASIC is an integrated circuit (IC) specialized to perform all or a portion of the various functions of the processing unit 40 shown in FIG. 3.
- An FPGA is an integrated circuit designed to be configurable after manufacture to perform all or a portion of the various functions of the processing unit 40 shown in FIG. 3.
Landscapes
- Engineering & Computer Science (AREA)
- Physics & Mathematics (AREA)
- Theoretical Computer Science (AREA)
- General Physics & Mathematics (AREA)
- Multimedia (AREA)
- Computer Vision & Pattern Recognition (AREA)
- Computing Systems (AREA)
- Artificial Intelligence (AREA)
- Health & Medical Sciences (AREA)
- Databases & Information Systems (AREA)
- Evolutionary Computation (AREA)
- General Health & Medical Sciences (AREA)
- Medical Informatics (AREA)
- Software Systems (AREA)
- Automation & Control Theory (AREA)
- Mathematical Physics (AREA)
- Transportation (AREA)
- Mechanical Engineering (AREA)
- Traffic Control Systems (AREA)
Abstract
Description
[構成例]
図1は、一実施の形態に係る運転技能評価方法が用いられる運転技能評価システム1の一構成例を表すものである。運転技能評価システム1は、スマートフォン10と、サーバ装置30と、データ処理システム2とを備えている。
続いて、本実施の形態の運転技能評価システム1の動作および作用について説明する。
図1~4,8~10を参照して、運転技能評価システム1の動作を説明する。
以下に、運転技能評価システム1の動作について、詳細に説明する。
まず、データ処理システム2は、熟練ドライバが車両109を運転することにより得られた走行データに基づいて、複数のデータセットDSを生成する。以下に、複数のデータセットDSを生成する動作について詳細に説明する。
以上では、データ処理システム2は、熟練ドライバが車両109を運転することにより得られた走行データに基づいて、処理を行うようにしたが、例えば、非熟練ドライバが車両109を運転することにより得られた走行データに基づいて、処理を行うことも可能である。これにより、データ処理システム2は、熟練ドライバに係るカーネル密度推定画像と、非熟練ドライバに係るカーネル密度推定画像とを得ることができる。
運転技能評価システム1は、ドライバが車両9を運転することにより生成された走行データに基づいて、サーバ装置30の記憶部32に記憶された複数のデータセットDS、評価対象カーブデータDTC、およびエリアデータDARを用いて、そのドライバの運転技能を評価する。以下に、この動作について詳細に説明する。
以上のように本実施の形態では、運転技能評価方法は、車両の進行方向の方向変化に応じた第1のパラメータの時系列データ、および車両の進行方向の躍度の2乗を示す第2のパラメータの時系列データに基づいてカーネル密度推定画像を生成することと、カーネル画像推定画像を、熟練ドライバに係るリファレンス画像と比較することにより、車両のドライバの運転技能を評価することとを含むようにしたので、ドライバの運転技能の評価精度を高めることができる。
上記実施の形態では、図6,7に示したように、カーネル密度推定画像の縦軸(Y軸)はヨー角加速度の2乗を示すようにしたが、これに限定されるものではない。これに代えて、例えば、カーネル密度推定画像の縦軸(Y軸)は、図21に示すようにヨー角加速度を示してもよいし、ヨー角加速度の絶対値を示してもよい。また、例えば、カーネル密度推定画像の縦軸(Y軸)は、図22に示すようにヨー角速度を示してもよいし、ヨー角速度の絶対値を示してもよい。また、カーネル密度推定画像の縦軸(Y軸)は、図23に示すように車両の進行方向と交差する方向の加速度(横加速度)の2乗を示してもよいし、図24に示すように横加速度を示してもよいし、横加速度の絶対値を示してもよい。
上記実施の形態では、図6,7に示したように、カーネル密度推定画像の縦軸(Y軸)はヨー角加速度の2乗を示し、カーネル密度推定画像の画素値(Z軸)は前後躍度の2乗を示すようにしたが、これに限定されるものではない。これに代えて、例えば、図25,26に示すように、カーネル密度推定画像の縦軸(Y軸)は前後躍度の2乗を示し、カーネル密度推定画像の画素値(Z軸)はヨー角加速度の2乗を示すようにしてもよい。図25は、あるカーブにおけるカーネル密度推定画像の一例を表すものである。図26は、図25に示したカーネル密度推定画像の座標軸を表すものである。これにより、例えば、特に、車両9の速度の変化が小さい走行路において、ドライバの運転技能の評価精度を高めることができる。すなわち、例えば、起伏が緩やかな走行路では、車両9の速度の変化が小さく、前後躍度の2乗の値は大きく変化しにくいので、図6,7に示したカーネル密度推定画像の画素値は大きく変化しにくい。このような場合には、図25,26に示したカーネル密度推定画像を用いることにより、ドライバの運転技能の評価精度を高めることができる。
上記実施の形態では、図2に示したように、スマートフォン10は、加速度の時系列データ、角速度の時系列データ、および車両9の位置の時系列データをサーバ装置30に送信したが、これに限定されるものではない。これに代えて、例えば、スマートフォン10は、さらに、地磁気の時系列データをサーバ装置30に送信してもよい。以下に、この例について詳細に説明する。
また、これらの変形例のうちの2以上を組み合わせてもよい。
車両の進行方向の方向変化に応じた第1のパラメータの時系列データ、および前記車両の進行方向の躍度の2乗を示す第2のパラメータの時系列データに基づいてカーネル密度推定画像を生成することと、
前記カーネル密度推定画像をリファレンス画像と比較することにより、前記車両のドライバの運転技能を評価することと
を含む運転技能評価方法。
(2)
前記第1のパラメータの時系列データ、および前記第2のパラメータの時系列データは、前記車両がカーブを走行しているときのデータである
前記(1)に記載の運転技能評価方法。
(3)
前記カーネル密度推定画像における第1の画像方向は時間を示し、
前記カーネル密度推定画像における第2の画像方向は前記第1のパラメータを示し
前記カーネル密度推定画像の画素値は、前記第2のパラメータのデータに応じた値である
前記(1)または(2)に記載の運転技能評価方法。
(4)
前記第1のパラメータは、ヨー角速度に関するパラメータである
前記(1)から(3)のいずれかに記載の運転技能評価方法。
(5)
前記第1のパラメータは、ヨー角加速度に関するパラメータである
前記(4)に記載の運転技能評価方法。
(6)
前記第1のパラメータは、ヨー角加速度の2乗に関するパラメータである
前記(5)に記載の運転技能評価方法。
(7)
前記第1のパラメータは、横加速度に関するパラメータである
前記(1)から(3)のいずれかに記載の運転技能評価方法。
(8)
前記カーネル密度推定画像における第1の画像方向は時間を示し、
前記カーネル密度推定画像における第2の画像方向は前記第2のパラメータを示し
前記カーネル密度推定画像の画素値は、前記第1のパラメータのデータに応じた値である
前記(1)または(2)に記載の運転技能評価方法。
(9)
前記ドライバの運転技能の評価結果を前記ドライバに提示することをさらに含む
前記(1)から(8)のいずれかに記載の運転技能評価方法。
(10)
車両の進行方向の方向変化に応じた第1のパラメータの時系列データ、および前記車両の進行方向の躍度の2乗を示す第2のパラメータの時系列データに基づいてカーネル密度推定画像を生成する画像生成回路と、
前記カーネル密度推定画像をリファレンス画像と比較することにより、前記車両のドライバの運転技能を評価する評価回路と
を備えた運転技能評価システム。
(11)
車両の進行方向の方向変化に応じた第1のパラメータの時系列データ、および前記車両の進行方向の躍度の2乗を示す第2のパラメータの時系列データに基づいてカーネル密度推定画像を生成することと、
前記カーネル密度推定画像をリファレンス画像と比較することにより、前記車両のドライバの運転技能を評価することと
をプロセッサに行わせるソフトウェアが記録された
記録媒体。
Claims (11)
- 車両の進行方向の方向変化に応じた第1のパラメータの時系列データ、および前記車両の進行方向の躍度の2乗を示す第2のパラメータの時系列データに基づいてカーネル密度推定画像を生成することと、
前記カーネル密度推定画像をリファレンス画像と比較することにより、前記車両のドライバの運転技能を評価することと
を含む運転技能評価方法。 - 前記第1のパラメータの時系列データ、および前記第2のパラメータの時系列データは、前記車両がカーブを走行しているときのデータである
請求項1に記載の運転技能評価方法。 - 前記カーネル密度推定画像における第1の画像方向は時間を示し、
前記カーネル密度推定画像における第2の画像方向は前記第1のパラメータを示し
前記カーネル密度推定画像の画素値は、前記第2のパラメータのデータに応じた値である
請求項1に記載の運転技能評価方法。 - 前記第1のパラメータは、ヨー角速度に関するパラメータである
請求項1に記載の運転技能評価方法。 - 前記第1のパラメータは、ヨー角加速度に関するパラメータである
請求項4に記載の運転技能評価方法。 - 前記第1のパラメータは、ヨー角加速度の2乗に関するパラメータである
請求項5に記載の運転技能評価方法。 - 前記第1のパラメータは、横加速度に関するパラメータである
請求項1に記載の運転技能評価方法。 - 前記カーネル密度推定画像における第1の画像方向は時間を示し、
前記カーネル密度推定画像における第2の画像方向は前記第2のパラメータを示し
前記カーネル密度推定画像の画素値は、前記第1のパラメータのデータに応じた値である
請求項1に記載の運転技能評価方法。 - 前記ドライバの運転技能の評価結果を前記ドライバに提示することをさらに含む
請求項1に記載の運転技能評価方法。 - 車両の進行方向の方向変化に応じた第1のパラメータの時系列データ、および前記車両の進行方向の躍度の2乗を示す第2のパラメータの時系列データに基づいてカーネル密度推定画像を生成する画像生成回路と、
前記カーネル密度推定画像をリファレンス画像と比較することにより、前記車両のドライバの運転技能を評価する評価回路と
を備えた運転技能評価システム。 - 車両の進行方向の方向変化に応じた第1のパラメータの時系列データ、および前記車両の進行方向の躍度の2乗を示す第2のパラメータの時系列データに基づいてカーネル密度推定画像を生成することと、
前記カーネル密度推定画像をリファレンス画像と比較することにより、前記車両のドライバの運転技能を評価することと
をプロセッサに行わせるソフトウェアが記録された
記録媒体。
Priority Applications (3)
| Application Number | Priority Date | Filing Date | Title |
|---|---|---|---|
| PCT/JP2022/040769 WO2024095331A1 (ja) | 2022-10-31 | 2022-10-31 | 運転技能評価方法、運転技能評価システム、および記録媒体 |
| US18/716,843 US12552394B2 (en) | 2022-10-31 | 2022-10-31 | Driving skill evaluation method, driving skill evaluation system, and non-transitory recording medium |
| JP2024553955A JP7857421B2 (ja) | 2022-10-31 | 2022-10-31 | 運転技能評価方法、運転技能評価システム、および記録媒体 |
Applications Claiming Priority (1)
| Application Number | Priority Date | Filing Date | Title |
|---|---|---|---|
| PCT/JP2022/040769 WO2024095331A1 (ja) | 2022-10-31 | 2022-10-31 | 運転技能評価方法、運転技能評価システム、および記録媒体 |
Publications (1)
| Publication Number | Publication Date |
|---|---|
| WO2024095331A1 true WO2024095331A1 (ja) | 2024-05-10 |
Family
ID=90930004
Family Applications (1)
| Application Number | Title | Priority Date | Filing Date |
|---|---|---|---|
| PCT/JP2022/040769 Ceased WO2024095331A1 (ja) | 2022-10-31 | 2022-10-31 | 運転技能評価方法、運転技能評価システム、および記録媒体 |
Country Status (3)
| Country | Link |
|---|---|
| US (1) | US12552394B2 (ja) |
| JP (1) | JP7857421B2 (ja) |
| WO (1) | WO2024095331A1 (ja) |
Citations (2)
| Publication number | Priority date | Publication date | Assignee | Title |
|---|---|---|---|---|
| JP2011065527A (ja) * | 2009-09-18 | 2011-03-31 | Toyota Motor Corp | 運転評価システム、車載機及び情報処理センター |
| US20200356773A1 (en) * | 2019-05-09 | 2020-11-12 | Lyft, Inc. | Determining traffic control features based on telemetry patterns within digital image representations of vehicle telemetry data |
Family Cites Families (8)
| Publication number | Priority date | Publication date | Assignee | Title |
|---|---|---|---|---|
| JP5392686B2 (ja) * | 2011-09-26 | 2014-01-22 | トヨタ自動車株式会社 | 運転支援装置および方法 |
| US11249544B2 (en) * | 2016-11-21 | 2022-02-15 | TeleLingo | Methods and systems for using artificial intelligence to evaluate, correct, and monitor user attentiveness |
| US10984539B2 (en) * | 2018-07-03 | 2021-04-20 | Eys3D Microelectronics, Co. | Image device for generating velocity maps |
| CN108995653B (zh) * | 2018-07-06 | 2020-02-14 | 北京理工大学 | 一种驾驶员驾驶风格识别方法及系统 |
| JP7226938B2 (ja) | 2018-07-30 | 2023-02-21 | 本田技研工業株式会社 | 運転評価システム、運転評価方法、プログラム、及び媒体 |
| WO2023074116A1 (ja) * | 2021-10-25 | 2023-05-04 | パナソニックIpマネジメント株式会社 | 運転特性改善支援データの管理方法 |
| US20230219569A1 (en) * | 2022-01-10 | 2023-07-13 | Toyota Motor Engineering & Manufacturing North America, Inc. | Personalized vehicle operation for autonomous driving with inverse reinforcement learning |
| JP2025504596A (ja) * | 2022-01-24 | 2025-02-12 | カマル アッガーワル | 運転者の運転挙動を判定するためのスマートシステム |
-
2022
- 2022-10-31 US US18/716,843 patent/US12552394B2/en active Active
- 2022-10-31 WO PCT/JP2022/040769 patent/WO2024095331A1/ja not_active Ceased
- 2022-10-31 JP JP2024553955A patent/JP7857421B2/ja active Active
Patent Citations (2)
| Publication number | Priority date | Publication date | Assignee | Title |
|---|---|---|---|---|
| JP2011065527A (ja) * | 2009-09-18 | 2011-03-31 | Toyota Motor Corp | 運転評価システム、車載機及び情報処理センター |
| US20200356773A1 (en) * | 2019-05-09 | 2020-11-12 | Lyft, Inc. | Determining traffic control features based on telemetry patterns within digital image representations of vehicle telemetry data |
Also Published As
| Publication number | Publication date |
|---|---|
| JPWO2024095331A1 (ja) | 2024-05-10 |
| JP7857421B2 (ja) | 2026-05-12 |
| US20250050890A1 (en) | 2025-02-13 |
| US12552394B2 (en) | 2026-02-17 |
Similar Documents
| Publication | Publication Date | Title |
|---|---|---|
| CN111351502B (zh) | 用于从透视图生成环境的俯视图的方法,装置和计算机程序产品 | |
| JP6689966B2 (ja) | 減速縁石に基づく自律走行車の方向検出及び車線維持システム | |
| CN108162974B (zh) | 使用道路角度数据的车辆控制 | |
| JP2010509585A (ja) | 2次元及び3次元の正確な場所及び方位を判定する装置及び方法 | |
| US11971257B2 (en) | Method and apparatus with localization | |
| US20220057218A1 (en) | Method and apparatus for automatic generation of context-based guidance information from behavior and context-based machine learning models | |
| WO2020184013A1 (ja) | 車両制御装置 | |
| CN113465615A (zh) | 车道线的生成方法及相关装置 | |
| CN107576333A (zh) | 行驶线路显示装置、行驶线路显示方法,以及行驶线路显示程序 | |
| JP4869745B2 (ja) | 俯角算出装置、俯角算出方法、俯角算出プログラムおよび画像処理装置 | |
| CN114913500B (zh) | 位姿确定方法、装置、计算机设备和存储介质 | |
| JP2009068890A (ja) | 環境音圧記録装置、環境音圧記録方法及び環境音圧記録プログラム | |
| CN113029188B (zh) | 生成实时高精地图的方法及计算设备 | |
| CN116890847A (zh) | 车辆姿势评估 | |
| CN112967393B (zh) | 车辆移动轨迹的修正方法、装置、电子设备及存储介质 | |
| JP7857421B2 (ja) | 運転技能評価方法、運転技能評価システム、および記録媒体 | |
| WO2024095332A1 (ja) | 運転技能評価方法、運転技能評価システム、および記録媒体 | |
| JP7854570B2 (ja) | 運転技能評価方法、運転技能評価システム、および非一過性記録媒体 | |
| WO2024095333A1 (ja) | 運転技能評価方法、運転技能評価システム、および記録媒体 | |
| CN109710594B (zh) | 地图数据的有效性判断方法、装置及可读存储介质 | |
| CN120858269A (zh) | 用于在越野行驶时导航车辆的方法 | |
| WO2024095334A1 (ja) | 運転技能評価方法、運転技能評価システム、および記録媒体 | |
| US12633177B2 (en) | Driving skill evaluation method, driving skill evaluation system, and non-transitory recording medium | |
| US11449543B2 (en) | Method, apparatus, and computer program product for vehicle localization via amplitude audio features | |
| US20240418842A1 (en) | Using reference road segments to calibrate the response of vehicle sensor systems |
Legal Events
| Date | Code | Title | Description |
|---|---|---|---|
| WWE | Wipo information: entry into national phase |
Ref document number: 18716843 Country of ref document: US |
|
| 121 | Ep: the epo has been informed by wipo that ep was designated in this application |
Ref document number: 22964354 Country of ref document: EP Kind code of ref document: A1 |
|
| WWE | Wipo information: entry into national phase |
Ref document number: 2024553955 Country of ref document: JP |
|
| NENP | Non-entry into the national phase |
Ref country code: DE |
|
| 122 | Ep: pct application non-entry in european phase |
Ref document number: 22964354 Country of ref document: EP Kind code of ref document: A1 |
|
| WWG | Wipo information: grant in national office |
Ref document number: 18716843 Country of ref document: US |