WO2024048033A1 - Capacity deterioration estimation device - Google Patents
Capacity deterioration estimation device Download PDFInfo
- Publication number
- WO2024048033A1 WO2024048033A1 PCT/JP2023/023085 JP2023023085W WO2024048033A1 WO 2024048033 A1 WO2024048033 A1 WO 2024048033A1 JP 2023023085 W JP2023023085 W JP 2023023085W WO 2024048033 A1 WO2024048033 A1 WO 2024048033A1
- Authority
- WO
- WIPO (PCT)
- Prior art keywords
- charging
- rate
- capacity deterioration
- estimated
- storage battery
- Prior art date
Links
- 230000006866 deterioration Effects 0.000 title claims abstract description 257
- 238000005259 measurement Methods 0.000 claims abstract description 35
- 230000014509 gene expression Effects 0.000 claims abstract description 15
- 238000012937 correction Methods 0.000 claims description 45
- 230000005611 electricity Effects 0.000 claims description 10
- 238000004364 calculation method Methods 0.000 claims description 9
- 238000006243 chemical reaction Methods 0.000 claims description 9
- 238000000034 method Methods 0.000 description 35
- 238000010586 diagram Methods 0.000 description 14
- 230000008569 process Effects 0.000 description 11
- 230000008859 change Effects 0.000 description 9
- 238000007599 discharging Methods 0.000 description 8
- GELKBWJHTRAYNV-UHFFFAOYSA-K lithium iron phosphate Chemical compound [Li+].[Fe+2].[O-]P([O-])([O-])=O GELKBWJHTRAYNV-UHFFFAOYSA-K 0.000 description 4
- 238000004891 communication Methods 0.000 description 3
- 238000013459 approach Methods 0.000 description 2
- 238000012986 modification Methods 0.000 description 2
- 230000004048 modification Effects 0.000 description 2
- OKTJSMMVPCPJKN-UHFFFAOYSA-N Carbon Chemical compound [C] OKTJSMMVPCPJKN-UHFFFAOYSA-N 0.000 description 1
- HBBGRARXTFLTSG-UHFFFAOYSA-N Lithium ion Chemical compound [Li+] HBBGRARXTFLTSG-UHFFFAOYSA-N 0.000 description 1
- PXHVJJICTQNCMI-UHFFFAOYSA-N Nickel Chemical compound [Ni] PXHVJJICTQNCMI-UHFFFAOYSA-N 0.000 description 1
- 239000002253 acid Substances 0.000 description 1
- 230000008901 benefit Effects 0.000 description 1
- 230000005540 biological transmission Effects 0.000 description 1
- OJIJEKBXJYRIBZ-UHFFFAOYSA-N cadmium nickel Chemical compound [Ni].[Cd] OJIJEKBXJYRIBZ-UHFFFAOYSA-N 0.000 description 1
- 230000000694 effects Effects 0.000 description 1
- 238000005516 engineering process Methods 0.000 description 1
- 239000010439 graphite Substances 0.000 description 1
- 229910002804 graphite Inorganic materials 0.000 description 1
- 229910001416 lithium ion Inorganic materials 0.000 description 1
- 238000004519 manufacturing process Methods 0.000 description 1
- 229910000652 nickel hydride Inorganic materials 0.000 description 1
- 230000010287 polarization Effects 0.000 description 1
- 238000012545 processing Methods 0.000 description 1
Images


Classifications
-
- G—PHYSICS
- G01—MEASURING; TESTING
- G01R—MEASURING ELECTRIC VARIABLES; MEASURING MAGNETIC VARIABLES
- G01R31/00—Arrangements for testing electric properties; Arrangements for locating electric faults; Arrangements for electrical testing characterised by what is being tested not provided for elsewhere
- G01R31/36—Arrangements for testing, measuring or monitoring the electrical condition of accumulators or electric batteries, e.g. capacity or state of charge [SoC]
- G01R31/382—Arrangements for monitoring battery or accumulator variables, e.g. SoC
-
- G—PHYSICS
- G01—MEASURING; TESTING
- G01R—MEASURING ELECTRIC VARIABLES; MEASURING MAGNETIC VARIABLES
- G01R31/00—Arrangements for testing electric properties; Arrangements for locating electric faults; Arrangements for electrical testing characterised by what is being tested not provided for elsewhere
- G01R31/36—Arrangements for testing, measuring or monitoring the electrical condition of accumulators or electric batteries, e.g. capacity or state of charge [SoC]
- G01R31/385—Arrangements for measuring battery or accumulator variables
-
- G—PHYSICS
- G01—MEASURING; TESTING
- G01R—MEASURING ELECTRIC VARIABLES; MEASURING MAGNETIC VARIABLES
- G01R31/00—Arrangements for testing electric properties; Arrangements for locating electric faults; Arrangements for electrical testing characterised by what is being tested not provided for elsewhere
- G01R31/36—Arrangements for testing, measuring or monitoring the electrical condition of accumulators or electric batteries, e.g. capacity or state of charge [SoC]
- G01R31/389—Measuring internal impedance, internal conductance or related variables
-
- G—PHYSICS
- G01—MEASURING; TESTING
- G01R—MEASURING ELECTRIC VARIABLES; MEASURING MAGNETIC VARIABLES
- G01R31/00—Arrangements for testing electric properties; Arrangements for locating electric faults; Arrangements for electrical testing characterised by what is being tested not provided for elsewhere
- G01R31/36—Arrangements for testing, measuring or monitoring the electrical condition of accumulators or electric batteries, e.g. capacity or state of charge [SoC]
- G01R31/392—Determining battery ageing or deterioration, e.g. state of health
-
- H—ELECTRICITY
- H01—ELECTRIC ELEMENTS
- H01M—PROCESSES OR MEANS, e.g. BATTERIES, FOR THE DIRECT CONVERSION OF CHEMICAL ENERGY INTO ELECTRICAL ENERGY
- H01M10/00—Secondary cells; Manufacture thereof
- H01M10/42—Methods or arrangements for servicing or maintenance of secondary cells or secondary half-cells
- H01M10/48—Accumulators combined with arrangements for measuring, testing or indicating the condition of cells, e.g. the level or density of the electrolyte
-
- H—ELECTRICITY
- H02—GENERATION; CONVERSION OR DISTRIBUTION OF ELECTRIC POWER
- H02J—CIRCUIT ARRANGEMENTS OR SYSTEMS FOR SUPPLYING OR DISTRIBUTING ELECTRIC POWER; SYSTEMS FOR STORING ELECTRIC ENERGY
- H02J7/00—Circuit arrangements for charging or depolarising batteries or for supplying loads from batteries
-
- Y—GENERAL TAGGING OF NEW TECHNOLOGICAL DEVELOPMENTS; GENERAL TAGGING OF CROSS-SECTIONAL TECHNOLOGIES SPANNING OVER SEVERAL SECTIONS OF THE IPC; TECHNICAL SUBJECTS COVERED BY FORMER USPC CROSS-REFERENCE ART COLLECTIONS [XRACs] AND DIGESTS
- Y02—TECHNOLOGIES OR APPLICATIONS FOR MITIGATION OR ADAPTATION AGAINST CLIMATE CHANGE
- Y02E—REDUCTION OF GREENHOUSE GAS [GHG] EMISSIONS, RELATED TO ENERGY GENERATION, TRANSMISSION OR DISTRIBUTION
- Y02E60/00—Enabling technologies; Technologies with a potential or indirect contribution to GHG emissions mitigation
- Y02E60/10—Energy storage using batteries
Definitions
- the present invention relates to a capacity deterioration estimation device.
- Patent Documents 1 and 2 below describe techniques for estimating capacity deterioration of storage batteries. The descriptions of these documents are included as part of this specification.
- JP2019-021417A Japanese Patent Application Publication No. 2020-187050
- the present invention has been made in view of the above-mentioned circumstances, and an object of the present invention is to provide a capacity deterioration estimating device that can appropriately estimate the capacity deterioration of a storage battery.
- the capacity deterioration estimating device of the present invention includes a data receiving section that receives measurement results of the current value and the voltage value from a measuring section that measures the current value, voltage value, and temperature of the storage battery; a first capacity deterioration estimator, the first capacity deterioration estimator includes a first capacity deterioration rate that stores a relationship between a resistance deterioration rate of the storage battery and an estimated capacity deterioration rate that is an estimated value of the capacity deterioration rate.
- a second table that stores a relationship between a charging rate of the storage battery and a reference resistance value that is a resistance value at a predetermined temperature when the storage battery is not degraded; a function of reading a third table storing a relationship with a certain temperature conversion coefficient and a fourth table storing a relationship between the charging rate and the terminal open voltage of the storage battery from a table storage unit; a first relational expression that defines the relationship between the charging rate at the start of charging, which is the charging rate, the reference resistance value, and the resistance deterioration rate; and the charging rate at the end of charging, which is the charging rate at the end of charging, and the reference.
- a second relational expression that defines the relationship between the resistance value and the resistance deterioration rate, the charging rate at the start of charging, the charging rate at the end of charging, and the amount of electricity that is the amount of electricity from the start of charging to the end of charging; the first estimated capacity deterioration rate based on a third relational expression that determines the relationship between the first estimated capacity deterioration rate and a fourth relational expression that determines the relationship between the resistance deterioration rate and the first estimated capacity deterioration rate.
- FIG. 2 is a block diagram of a computer.
- FIG. 1 is a block diagram of a capacity deterioration rate estimation system according to a first embodiment. It is a figure which shows an example of the characteristic memorize
- FIG. 3 is a diagram showing an example of a control flowchart according to the first embodiment.
- FIG. 2 is a block diagram of a capacity deterioration rate estimation system according to a second embodiment.
- FIG. 3 is a diagram showing an example of the SOC-charging overvoltage characteristics of a storage battery using a lithium iron phosphate positive electrode when it is not degraded.
- Method #1 The storage battery is periodically charged to the full charge voltage, and the capacity of the storage battery is estimated based on the current integrated value when discharging from there to the discharge lower limit voltage.
- Method #2 First estimate the open circuit voltage (OCV) before and after charging and discharging, and then calculate the estimated charging rate (SOCv) before and after charging and discharging based on the relationship between the open circuit voltage (OCV) and SOC. . Then, the capacity of the storage battery is estimated based on the difference between estimated values before and after charging and discharging ( ⁇ SOCv) and the ratio of the amount of charge.
- Patent Document 1 is similar to method #2, and Patent Document 2 is similar to method #3.
- Method #1 is sometimes used as the true value of storage battery capacity.
- it is rare to discharge a storage battery from a fully charged voltage to a lower discharge limit voltage at which the battery cannot operate due to lack of power. Therefore, it is often difficult to perform measurements corresponding to method #1 frequently.
- method #2 since there is no need to discharge the storage battery to the lower discharge limit voltage, it is easy to obtain the measurement timing. Furthermore, since the resistance deterioration rate of the storage battery is relatively easy to measure, it is also easy to obtain the measurement timing for method #3.
- the resistance deterioration rate and the capacity deterioration rate do not necessarily have a unique relationship because they are affected by differences in load patterns, differences in storage battery manufacturing processes, and the like. Therefore, the estimation accuracy by method #3 basically tends to deteriorate as the deterioration progresses.
- the problem with method #2 is that there are not many timings at which sufficient accuracy can be obtained.
- the reference resistance for calculating the resistance deterioration rate has temperature dependence and SOC dependence. Therefore, if the SOC cannot be estimated correctly, the deviation in the reference resistance will be reflected as an error in the estimated value of the capacitance. Therefore, the embodiment described below realizes highly accurate and frequent estimation of the capacity deterioration rate for a storage battery in which the change in open circuit voltage (OCV) with respect to SOC is small in most SOC ranges.
- OCV open circuit voltage
- FIG. 1 is a block diagram of a computer 980 commonly used in the first to fourth embodiments.
- Capacity deterioration estimating device 110 see FIG. 2
- capacity deterioration estimating device 150 see FIG. 9
- the computer 980 includes a CPU 981, a storage unit 982, a communication I/F (interface) 983, an input/output I/F 984, and a media I/F 985.
- the storage unit 982 includes a RAM 982a, a ROM 982b, and an HDD 982c.
- Communication I/F 983 is connected to communication circuit 986.
- the input/output I/F 984 is connected to the input/output device 987.
- Media I/F 985 reads and writes data from recording medium 988 .
- the ROM 982b stores IPL (Initial Program Loader) and the like executed by the CPU.
- the HDD 982c stores control programs, various data, and the like.
- the CPU 981 implements various functions by executing control programs and the like read into the RAM 982a from the HDD 982c. Inside the capacity deterioration estimating device 110 (see FIG. 2) and the capacity deterioration estimating device 150 (see FIG. 8), which will be described later, functions realized by a control program and the like are shown as blocks.
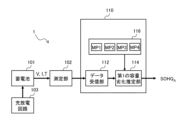
- FIG. 2 is a block diagram of the capacity deterioration rate estimation system 1 according to the first embodiment.
- the capacity deterioration rate estimation system 1 includes a storage battery 101, a measuring section 102, a charge/discharge circuit 103, and a capacity deterioration estimation device 110 (computer).
- the capacity deterioration estimating device 110 also includes a data receiving section 112 (data receiving means), a first capacity deterioration estimating section 114 (first capacity deterioration estimating means), a map storage section 116 (table storage section), It is equipped with
- the first capacity deterioration estimation unit 114 estimates capacity deterioration using the correlation between resistance deterioration and capacitance deterioration, and the details thereof will be described later.
- Examples of the storage battery 101 include, but are not limited to, a lithium ion battery, a lead acid battery, a nickel hydride battery, a nickel cadmium battery, and the like.
- the measurement unit 102 measures a current value I during charging and discharging of the storage battery 101, a voltage value V that is a terminal voltage, and a battery temperature T.
- the charging/discharging circuit 103 charges/discharges the storage battery 101 based on control by the capacity deterioration estimating device 110 .
- the data receiving section 112 receives the measurement results of the measuring section 102.
- the first capacity deterioration estimation unit 114 calculates an estimated capacity deterioration rate SOHQ A (first estimated capacity deterioration rate) that is an estimated value of the capacity deterioration rate SOHQ of the storage battery 101 based on the measurement results received by the data reception unit 112. Output.
- SOHQ A first estimated capacity deterioration rate
- the map storage unit 116 stores maps MP1, MP2, MP3, and MP4 (first, second, third, and fourth tables).
- the map MP1 stores in advance the relationship between the resistance deterioration rate SOHR and the estimated capacity deterioration rate SOHQ map (SOHR), which is an estimated value of the corresponding capacity deterioration rate SOHQ.
- FIG. 3 is a diagram showing an example of characteristics stored in map MP1.
- the horizontal axis is the resistance deterioration rate SOHR
- the vertical axis is the capacity deterioration rate SOHQ.
- an estimated value of the capacity deterioration rate SOHQ that is, an estimated capacity deterioration rate SOHQ map (SOHR) can be obtained using the resistance deterioration rate SOHR as an argument.
- the map MP2 stores the relationship between the reference resistance value R chg,ref,map , the SOC, and the charging rate C rate . That is, the reference resistance value R chg,ref,map is a function of the SOC and the charging rate C rate , and may be expressed as "R chg,ref,map (SOC, C rate )."
- the reference resistance value R chg,ref,map refers to the inside of the storage battery 101 at the reference temperature when the storage battery 101 is in an unused state or close to this (hereinafter referred to as undegraded state). It is the resistance value.
- the charging rate C rate is a value obtained by dividing the current value I by the initial rated capacity Q max.ini (rated capacity of the storage battery 101 when not degraded).
- the temperature condition at the reference resistance value R chg,ref,map is defined as the reference temperature. Although there are no particular restrictions on the reference temperature, in this embodiment it is set to 25°C.
- the reference resistance value R chg,ref,map is the resistance value x seconds after the start of charging. Here, the value of x can be arbitrarily determined.
- FIG. 4 is a diagram showing an example of characteristics stored in map MP2.
- the horizontal axis is the SOC
- the vertical axis is the reference resistance value R chg,ref,map .
- the reference resistance value R chg,ref,map can be determined using the SOC and the charging rate C rate as arguments.
- the reason why the charging rate C rate is included in the argument in the map MP2 is that the resistance value may not always be considered constant as in the Butler-Volmer equation. Depending on the battery, the resistance value may be considered constant even if the charging rate C rate changes. In this case, the argument may be only SOC.
- the map MP3 stores in advance the relationship between the temperature conversion coefficient K T,map (T) and the battery temperature T (unit: °C).
- the temperature conversion coefficient K T,map (T) indicates the ratio of the internal resistance value at the battery temperature T to the internal resistance value at the reference temperature of the storage battery 101.
- FIG. 5 is a diagram showing an example of characteristics stored in map MP3.
- the horizontal axis is the battery temperature T (unit:° C.)
- the vertical axis is the temperature conversion coefficient K T,map (T) when the reference temperature (25° C. in FIG. 5) is set to “1”.
- the temperature conversion coefficient K T,map (T) can also be determined using the battery temperature T (unit: °C) as an argument.
- the map MP4 stores in advance the relationship between the charging rate SOC of the battery and the open circuit voltage OCV.
- FIG. 6 is a diagram showing an example of the SOC-OCV characteristics of a storage battery using a lithium iron phosphate positive electrode, as a diagram showing an example of the characteristics stored in the map MP4.
- this storage battery is a preferable storage battery to apply to the storage battery 101 in this embodiment, it is not limited to the said storage battery type.
- the horizontal axis is SOC
- the vertical axis is open circuit voltage OCV.
- the amount of change in OCV with respect to SOC change is large in a region where SOC is 6% or less. Therefore, especially when the OCV immediately before the start of charging is low, the SOC at the start of charging can be determined with high accuracy based on the OCV.
- the SOC approaches 100% at the end of charging the amount of change in OCV with respect to the change in SOC is small. Therefore, when the SOC is around 100%, it is difficult to accurately estimate the SOC from the OCV. Therefore, in order to estimate the SOC at the end of charging, it is preferable to use charging overvoltage characteristics or resistance characteristics instead of SOC-OCV characteristics.
- the first capacity deterioration estimation unit 114 calculates the estimated capacity deterioration rate SOHQ A based on [Equation 1], [Equation 2], [Equation 3], and [Equation 4], which will be described later.
- [Equation 1] is a formula for calculating the resistance deterioration rate SOHR at the start of charging using the current, voltage, temperature at the start of charging, and maps MP2, MP3, and MP4 stored in the map storage unit 116.
- the numerator on the right side calculates the actual resistance value
- the denominator on the right side calculates the reference resistance value in an undegraded battery.
- CCV start is the CCV (Closed Circuit Voltage) at the start of charging, that is, the voltage value V when a load (not shown) is connected between the positive terminal and negative terminal (not shown) of the storage battery 101.
- the OCV map is a map value that determines the OCV according to the SOC, and the charging rate at the start of charging SOC start is the charging rate of the storage battery 101 at the time of starting charging. However, the charging rate at the start of charging SOC start is an unknown value at the time of starting charging.
- the charging rate C rate,start at the start of charging is the charging rate C rate at the start of charging.
- the reference resistance value R chg,ref,map (SOC, C rate,start ) is the internal resistance value R at the reference temperature when the storage battery 101 is not degraded, and corresponds to the charging rate C rate,start at the start of charging. It is a value.
- the charging start temperature T start is the battery temperature T at the time of starting charging.
- the temperature conversion coefficient K T,map (T start ) is a temperature conversion coefficient determined using the map MP3 described above.
- [Equation 2] is a formula for calculating the resistance deterioration rate SOHR at the end of charging using the current, voltage, temperature, and maps MP2, MP3, and MP4 stored in the map storage unit 116 at the end of charging.
- the numerator on the right side calculates the actual resistance value at the end of charging
- the denominator on the right side calculates the reference resistance value of the undegraded battery at the end of charging.
- CCV end , SOC end , C rate, end , and T end are the closed circuit voltage, charging rate, charging rate, and battery temperature at the end of charging, respectively. In this, SOC end becomes an unknown variable.
- Equation 3 is a formula for calculating the charging rate SOC end at the end of charging using the charging rate SOC start at the start of charging and the estimated capacity deterioration rate SOHQ A.
- t start is the time at the start of charging
- t end is the time at the end of charging
- the result of integrating the current between them is called the charging amount of electricity.
- Equation 4 is a formula for calculating the estimated capacity deterioration rate SOHQ A using the resistance deterioration rate SOHR and the map MP1 stored in the map storage unit 116.
- the first capacity deterioration estimating unit 114 calculates the four unknown variables in [Equation 1] to [Equation 4]: SOC start , SOC end , SOHR, SOHQ, In order to obtain , the simultaneous equations from [Math. 1] to [Math. 4] are numerically solved.
- the first capacity deterioration estimation unit 114 outputs the estimated value of the capacity deterioration rate SOHQ thus obtained as the estimated capacity deterioration rate SOHQ A.
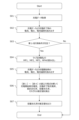
- FIG. 7 is an example of a flowchart of a control program executed in the capacity deterioration estimating device 110 in the first embodiment.
- the data receiving unit 112 acquires charging data from the measuring unit 102.
- charging data is time series information of current value I, voltage value V, and battery temperature T during charging and discharging.
- the first capacity deterioration estimation unit 114 reads out the current value I, voltage value V, and battery temperature T at the end of charging from the charging data.
- the first capacity deterioration estimating unit 114 determines whether the first measurement condition is satisfied based on the current value I, voltage value V, and battery temperature T at the end of charging. Determine whether or not.
- the first measurement condition is a condition that the storage battery 101 is "charged to near full charge", and more specifically, "the voltage immediately before the completion of charging of the storage battery 101 is a predetermined first threshold value". The condition is that the voltage exceeds the voltage.
- step S03 If the determination in step S03 is "No", this routine ends. On the other hand, if the determination is "Yes", the process proceeds to step S04.
- the first capacity deterioration estimation unit 114 reads maps MP1, MP2, MP3, and MP4 from the map storage unit 116.
- step S05 the first capacity deterioration estimating unit 114 reads out the current value I, voltage value V, and battery temperature T at the start of charging from the charging data.
- the first capacity deterioration estimating unit 114 numerically solves the simultaneous equations [Math. 1] to [Math. , the charging rate at the end of charging SOC end , the resistance deterioration rate SOHR, and the capacity deterioration rate SOHQ. More specifically, in step S06, the first capacity deterioration estimating unit 114 calculates a numerical solution to the above-mentioned simultaneous equations using the bisection method, Newton's method, or the like. Next, when the process proceeds to step S07, the first capacity deterioration estimation unit 114 outputs the estimated value of the capacity deterioration rate SOHQ as the estimated capacity deterioration rate SOHQ A.
- the second embodiment attempts to reduce capacity deterioration estimation errors caused by errors in various maps to be implemented, errors in charging data, etc. in the first embodiment. Therefore, if the predetermined second measurement condition is met by chance, the highly accurate estimated capacity deterioration value is used to perform offset correction on the estimated capacity deterioration value from next time onwards.
- the "second measurement condition” is a condition that the storage battery 101 is “charged from around 0% SOC to around full charge,” and more specifically, “the second measurement condition is that the storage battery 101 is charged from around 0% SOC to around full charge.”
- the voltage is below a predetermined second threshold voltage, and the voltage immediately before the completion of charging is above the above-mentioned first threshold voltage.”
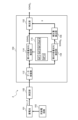
- FIG. 8 is a block diagram of a capacity deterioration rate estimation system 2 according to the second embodiment.
- the capacity deterioration rate estimation system 2 includes a storage battery 101, a measuring section 102, a charge/discharge circuit 103, and a capacity deterioration estimation device 150 (computer).
- the capacity deterioration estimating device 150 also includes a data receiving section 112, a first capacity deterioration estimating section 114, a map storage section 116, a second capacity deterioration estimating section 154, a correction amount calculating section 156, and a correction section. 152.
- the configurations of the storage battery 101, measuring section 102, charging/discharging circuit 103, data receiving section 112, first capacity deterioration estimating section 114, and map storage section 116 are those of the first embodiment (see FIG. 2). ).
- the map storage unit 116 stores a map MP10, which will be described later.
- the second capacity deterioration estimation unit 154 calculates an estimated capacity deterioration rate SOHQ B (second estimated capacity deterioration rate), which is an estimated value of the capacity deterioration rate SOHQ, when the second measurement condition described above is satisfied.
- SOHQ B second estimated capacity deterioration rate
- FIG. 9 is a diagram showing an example of the SOC-charging overvoltage ( ⁇ V) characteristic of a storage battery using a lithium iron phosphate positive electrode when it is not degraded.
- ⁇ V overvoltage
- the characteristic C51 in FIG. 9 is the characteristic of the charging overvoltage ⁇ V when the charging rate is 0.5 [CA]
- the characteristic C52 is the charging overvoltage ⁇ V when the charging rate is 0.02 [CA].
- a charging rate of 1 [CA] means a current density that charges the battery capacity in 1 hour.
- the SOC at the end of charging can be identified. That is, by determining the SOC immediately before the start of charging based on FIG. 6 and determining the SOC at the end of charging based on FIG. 9, the estimated capacity deterioration rate SOHQ B , which is the estimated value of the capacity deterioration rate SOHQ, is determined with high accuracy. be able to. Specifically, the estimated capacity deterioration rate SOHQ B can be obtained by numerically solving [Equation 5] below.
- the initial rated capacity Q max,ini is the rated capacity of the storage battery 101 when it is not degraded.
- CCV end is the CCV at the end of charging
- SOC is a function of charging overvoltage ⁇ V
- C rate is a function of charging rate [CA].
- the map MP10 stored in the map storage unit 116 defines the relationship between charging overvoltage ⁇ V, various charging rates C rate , and SOC.
- the charging rate estimated value SOC ⁇ v.map is an estimated value of the SOC obtained based on the charging overvoltage ⁇ V, the charging rate C rate , and the map MP10.
- the charging rate estimated value SOC v.map is the estimated value of the SOC obtained based on the OCV and the map MP4. Therefore, SOC v.map (OCV start ) is an estimated value of SOC at the start of charging.
- the estimated capacity deterioration rate SOHQ B calculated based on [Equation 5] is calculated when the OCV before charging belongs to a region where the amount of change is large and the voltage value V just before charging is completed is sufficiently high. becomes a highly valid value.
- a method for determining whether the estimated capacity deterioration rate SOHQ B has high validity for example, "the voltage value V immediately before the completion of charging is a predetermined threshold voltage Vth1 (first threshold voltage, for example, 3.56 V)” is used. or more” and “OCV (or voltage value V) immediately before charging starts is less than or equal to a predetermined threshold voltage Vth2 (second threshold voltage, e.g. 3.15V)”.
- Judgment can be made based on
- the second capacity deterioration estimation unit 154 outputs the estimated capacity deterioration rate SOHQ B on the condition that these two conditions are met, and outputs the estimated capacity deterioration rate SOHQ B when at least one of the conditions is not satisfied. No output.
- the indicators and threshold values described above are merely examples, and the present invention is not limited to combinations of these indicators and threshold values.
- the correction amount calculation unit 156 calculates the correction amount X based on the following [Equation 6] when the second capacity deterioration estimation unit 154 calculates the estimated capacity deterioration rate SOHQ B.
- the correction unit 152 calculates the estimated capacity deterioration rate SOHQ C (third estimated capacity deterioration rate) based on the following [Equation 7].
- the capacity deterioration estimating device 150 outputs this estimated capacity deterioration rate SOHQ C as an estimated value of the capacity deterioration rate SOHQ.
- the correction amount calculation unit 156 updates the correction amount X when the second capacity deterioration estimation unit 154 outputs the estimated capacity deterioration rate SOHQ B , but until then, the correction amount The correction amount X continues to be applied.
- the estimated capacity deterioration rate SOHQ B can be calculated based on the correction amount X. The accuracy of SOHQ C can be improved.
- the third embodiment is an attempt to further reduce capacity deterioration estimation errors caused by errors in various maps, errors in charging data, etc. in the first embodiment and the second embodiment. Therefore, if the second measurement condition mentioned above is met by chance (if charging is started in a region where the open circuit voltage change is large near SOC 0% and charging is completed near SOC 100%), the This method uses the highly accurate capacity deterioration estimated value to perform gain correction on the next and subsequent capacity deterioration estimated values.
- the configuration of the capacity deterioration rate estimation system of the third embodiment is similar to the capacity deterioration rate estimation system 2 of the second embodiment (see FIG. 8), except for the points described below.
- the correction amount calculation unit 156 calculates the estimated capacity deterioration rate SOHQ based on the following [Equation 8]. Then, the correction amount Y is calculated.
- the correction unit 152 calculates the estimated capacity deterioration rate SOHQ D (fourth estimated capacity deterioration rate) based on the following [Equation 9].
- the capacity deterioration estimation device 150 outputs this estimated capacity deterioration rate SOHQ D as an estimated value of the capacity deterioration rate SOHQ.
- the correction amount calculation section 156 updates the correction amount Y when the second capacity deterioration estimation section 154 outputs the estimated capacity deterioration rate SOHQ B , but until then, the correction amount calculation section 156 updates the correction amount Y.
- the correction amount Y continues to be applied.
- the estimated capacity deterioration rate SOHQ D can be calculated based on the correction amount Y. Therefore, even if the period during which the estimated capacity deterioration rate SOHQ B is not calculated is relatively long, the accuracy of the estimated capacity deterioration rate SOHQ D can be improved.
- the fourth embodiment reduces the capacity deterioration estimation error caused by the error in the implemented map MP1 in the first embodiment and the second embodiment. Therefore, the map MP1 is corrected using a highly accurate estimated capacity deterioration value obtained when the second measurement condition mentioned above is satisfied by chance.
- the configuration of the capacity deterioration rate estimation system of the fourth embodiment is similar to the capacity deterioration rate estimation system 2 of the second embodiment (see FIG. 8), except for the points described below.
- the correction unit 152 adds the correction amount X to all the table values of SOHQ corresponding to the SOHR region equal to or higher than the current SOHR in the map MP1.
- the correction unit 152 updates the table value of the map MP1.
- the estimated capacity deterioration rate SOHQ A after the map MP1 is updated may be referred to as the estimated capacity deterioration rate SOHQ E (fifth estimated capacity deterioration rate).
- the correction unit 152 does not correct the estimated capacity deterioration rate SOHQ E.
- the fifth capacity deterioration rate SOHQ E calculated using the updated map MP1 can be calculated. Note that the method for correcting map MP1 described above is just an example, and is not limited to the above method.
- the estimated capacity deterioration rate SOHQ E can be calculated based on the updated map MP1. Therefore, even if the period during which the estimated capacity deterioration rate SOHQ B is not calculated is relatively long, the accuracy of the estimated capacity deterioration rate SOHQ E can be improved.
- the capacity deterioration estimating devices 110 and 150 obtain the measurement results of the current value I and the voltage value V from the measurement unit 102 that measures the current value I and the voltage value V of the storage battery 101. and a first capacity deterioration estimator 114, the first capacity deterioration estimator 114 estimates the resistance deterioration rate SOHR and the capacity deterioration rate SOHQ of the storage battery 101.
- a first table (MP1) that stores the relationship between the capacity deterioration rate (SOHQ map (SOHR)), a reference resistance value (MP1) that is the resistance value at a predetermined temperature when the storage battery 101 is not degraded, and the charging rate SOC of the storage battery 101.
- a second table (MP2) that stores the relationship between the storage battery 101 temperature and the reference resistance value (R chg,ref,map ) and a temperature conversion coefficient (K T, map (T)) and a fourth table (MP4) that stores the relationship between the charging rate SOC and the open terminal voltage (OCV) of the storage battery 101.
- a first function that determines the relationship between the charging rate SOC start at the start of charging, which is the charging rate SOC at the start of charging, the reference resistance value (R chg,ref,map ), and the resistance deterioration rate SOHR.
- Equation 1 The second relationship that defines the relationship between the relational expression (Equation 1), the charging rate at the end of charging SOC end which is the charging rate at the end of charging, the reference resistance value (R chg,ref,map ), and the resistance deterioration rate SOHR Equation (Equation 2), the charging rate at the start of charging SOC start , the charging rate at the end of charging SOC end , the amount of electricity that is the amount of electricity from the start of charging to the end of charging, and the first estimated capacity deterioration rate (SOHQ A ), and a fourth relational expression (Equation 4) that defines the relationship between the resistance deterioration rate SOHR and the first estimated capacity deterioration rate (SOHQ A ).
- the second table (MP2) stores the relationship between the charging rate SOC, the reference resistance value (R chg,ref,map ), and the charging rate C rate for the storage battery 101
- the first relational expression (Equation 1) is the charging rate at the start of charging (C rate , start )
- the second relational expression (Equation 2) is the relationship between the charging rate at the end of charging SOC end , the reference resistance value (R chg,ref,map ), the resistance deterioration rate SOHR, and the end of charging. It is more preferable that the relationship between the charging rate C rate and the charging rate at the end of charging (C rate,end ) is determined. Thereby, capacity deterioration can be appropriately estimated even in the storage battery 101 whose reference resistance value (R chg,ref,map ) varies depending on the charging rate C rate .
- the first capacity deterioration estimation unit 114 calculates the first estimated capacity deterioration rate (SOHQ A ) on the condition that a predetermined first measurement condition is satisfied. Furthermore, it is more preferable that the first measurement condition is that the voltage immediately before the completion of charging of the storage battery 101 is equal to or higher than a predetermined first threshold voltage (Vth1). Thereby, by appropriately setting the first threshold voltage (Vth1), capacity deterioration of the storage battery 101 can be appropriately estimated only when the battery is close to a fully charged state.
- Vth1 a predetermined first threshold voltage
- the capacity deterioration estimating device 150 also includes a second capacity deterioration estimation unit that calculates a second estimated capacity deterioration rate (SOHQ B ) based on the voltage value V when a predetermined second measurement condition is satisfied. 154, a correction amount calculation unit 156 that calculates correction amounts X and Y based on the first and second estimated capacity deterioration rates (SOHQ A , SOHQ B ), and a first estimated capacity deterioration rate (SOHQ A ). It is more preferable to further include a correction unit 152 that calculates a third estimated capacity deterioration rate (SOHQ C ) based on the correction amounts X and Y. Thereby, a more appropriate third estimated capacity deterioration rate (SOHQ C ) can be obtained based on the second estimated capacity deterioration rate (SOHQ B ).
- SOHQ B second estimated capacity deterioration rate
- the capacity deterioration estimating device 150 also includes a second capacity deterioration estimation unit that calculates a second estimated capacity deterioration rate (SOHQ B ) based on the voltage value V when a predetermined second measurement condition is satisfied. 154, and a correction unit 152 that corrects the first table (MP1) based on the first and second estimated capacity deterioration rates (SOHQ A , SOHQ B ). Thereby, a more appropriate first estimated capacity deterioration rate (SOHQ A ) can be obtained based on the second estimated capacity deterioration rate (SOHQ B ).
- a second capacity deterioration estimation unit that calculates a second estimated capacity deterioration rate (SOHQ B ) based on the voltage value V when a predetermined second measurement condition is satisfied.
- a correction unit 152 that corrects the first table (MP1) based on the first and second estimated capacity deterioration rates (SOHQ A , SOHQ B ).
- the second capacity deterioration estimating unit 154 calculates a second estimated capacity deterioration rate (SOHQ B ) based on the charging rate at the start of charging SOC start , the charging rate at the end of charging SOC end , and the amount of electricity charged. It is more preferable to calculate it. Thereby, the second estimated capacity deterioration rate (SOHQ B ) can be calculated based on the charging rate at the start of charging SOC start , the charging rate at the end of charging SOC end , and the amount of electricity charged.
- SOHQ B second estimated capacity deterioration rate
- the second measurement condition is that the voltage value V immediately before the completion of charging of the storage battery 101 is equal to or higher than the first threshold voltage (Vth1), and the voltage value V immediately before the start of charging is a predetermined second threshold voltage ( It is more preferable that the voltage is Vth2) or less.
- the second estimated capacity deterioration rate (SOHQ B ) can be calculated when the variation range of the voltage value V is appropriate.
- the capacity deterioration estimating device 150 also includes a second capacity deterioration estimation unit 154 that calculates a second estimated capacity deterioration rate (SOHQ B ) based on the voltage value V when a predetermined measurement condition is satisfied; A correction amount calculation unit 156 that calculates correction amounts X and Y based on a first estimated capacity deterioration rate (SOHQ A ) and a second estimated capacity deterioration rate (SOHQ B ); Further comprising a correction unit 152 that calculates third to fifth estimated capacity deterioration rates (SOHQ C , SOHQ D , SOHQ E ) based on the deterioration rate (SOHQ A ) and the correction amounts X and Y. More preferred.
- a second capacity deterioration estimation unit 154 that calculates a second estimated capacity deterioration rate (SOHQ B ) based on the voltage value V when a predetermined measurement condition is satisfied
- a correction amount calculation unit 156 that calculates correction amounts X and Y based on a first estimated
- the second estimated capacity deterioration rate (SOHQ B ) calculated based on the voltage value is further used to obtain the final estimated capacity deterioration rate, for example, the third to fifth estimated capacity deterioration rates (SOHQ C , SOHQ D , SOHQ E ), it is possible to more appropriately estimate the capacity deterioration of the storage battery.
- the present invention is not limited to the embodiments described above, and various modifications are possible.
- the embodiments described above are exemplified to explain the present invention in an easy-to-understand manner, and are not necessarily limited to those having all the configurations described.
- the control lines and information lines shown in the figures are those considered necessary for explanation, and do not necessarily show all the control lines and information lines necessary on the product. In reality, almost all components may be considered to be interconnected. Possible modifications to the above embodiment include, for example, the following.
- the measuring unit 102 measures the battery temperature T of the storage battery 101, but if the battery temperature T is approximately constant, the measurement of the battery temperature T may be omitted.
- the various processes executed in the above embodiment may be executed by a server computer via a network (not shown), and the various data stored in the above embodiment may also be stored in the server computer. .
Abstract
The present invention makes it possible to suitably estimate deterioration of the capacity of a storage battery. To this end, a capacity deterioration estimation device (110) is provided with: a data reception unit (112) that receives a measurement result for a current value (I) and a voltage value (V) of a storage battery (101) from a measurement unit (102) for measuring the current value (I) and the voltage value (V); and a first capacity deterioration estimation unit (114), said first capacity deterioration estimation unit (114) being equipped with a function for reading out first to fourth tables (MP1 to MP4) from a table storage unit (116) and a function for calculating a first estimated capacity deterioration rate (SOHQA) on the basis of first to fourth relational expressions at the start of charging.
Description
本発明は、容量劣化推定装置に関する。
The present invention relates to a capacity deterioration estimation device.
例えば電気自動車等や蓄電池を用いる機器や設備における蓄電池システムの交換タイミングを適切に判断するために、蓄電池の容量劣化を推定することが好ましい。下記特許文献1、2には、蓄電池の容量劣化を推定する技術が記載されている。これら文献の記述は本願明細書の一部として包含される。
For example, in order to appropriately determine the timing of replacing a storage battery system in an electric vehicle or other device or facility using a storage battery, it is preferable to estimate the capacity deterioration of the storage battery. Patent Documents 1 and 2 below describe techniques for estimating capacity deterioration of storage batteries. The descriptions of these documents are included as part of this specification.
ところで、上述した技術において、蓄電池の容量劣化をより適切に推定したいという要望がある。
この発明は上述した事情に鑑みてなされたものであり、蓄電池の容量劣化を適切に推定できる容量劣化推定装置を提供することを目的とする。 By the way, in the above-mentioned technology, there is a desire to more appropriately estimate capacity deterioration of a storage battery.
The present invention has been made in view of the above-mentioned circumstances, and an object of the present invention is to provide a capacity deterioration estimating device that can appropriately estimate the capacity deterioration of a storage battery.
上記課題を解決するため本発明の容量劣化推定装置は、蓄電池の電流値と電圧値と温度とを計測する測定部から前記電流値と前記電圧値との測定結果を受信するデータ受信部と、第1の容量劣化推定部と、を備え、前記第1の容量劣化推定部は、前記蓄電池の抵抗劣化率と容量劣化率の推定値である推定容量劣化率との関係を記憶する第1のテーブルと、前記蓄電池の充電率と前記蓄電池の未劣化時の所定温度における抵抗値である基準抵抗値との関係を記憶する第2のテーブルと、前記蓄電池の温度と前記基準抵抗値に対する比率である温度換算係数との関係を記憶する第3のテーブルと、前記充電率と前記蓄電池の端子開放電圧との関係を記憶する第4のテーブルと、をテーブル記憶部から読み出す機能と、充電開始時における前記充電率である充電開始時充電率と前記基準抵抗値と前記抵抗劣化率との関係を定める第1の関係式と、充電終了時における前記充電率である充電終了時充電率と前記基準抵抗値と前記抵抗劣化率との関係を定める第2の関係式と、前記充電開始時充電率と前記充電終了時充電率と充電開始時から充電終了時までの電気量である充電電気量と第1の推定容量劣化率との関係を定める第3の関係式と、前記抵抗劣化率と前記第1の推定容量劣化率との関係を定める第4の関係式と、に基づいて前記第1の推定容量劣化率を算出する機能と、を備えることを特徴とする。
In order to solve the above problems, the capacity deterioration estimating device of the present invention includes a data receiving section that receives measurement results of the current value and the voltage value from a measuring section that measures the current value, voltage value, and temperature of the storage battery; a first capacity deterioration estimator, the first capacity deterioration estimator includes a first capacity deterioration rate that stores a relationship between a resistance deterioration rate of the storage battery and an estimated capacity deterioration rate that is an estimated value of the capacity deterioration rate. a second table that stores a relationship between a charging rate of the storage battery and a reference resistance value that is a resistance value at a predetermined temperature when the storage battery is not degraded; a function of reading a third table storing a relationship with a certain temperature conversion coefficient and a fourth table storing a relationship between the charging rate and the terminal open voltage of the storage battery from a table storage unit; a first relational expression that defines the relationship between the charging rate at the start of charging, which is the charging rate, the reference resistance value, and the resistance deterioration rate; and the charging rate at the end of charging, which is the charging rate at the end of charging, and the reference. a second relational expression that defines the relationship between the resistance value and the resistance deterioration rate, the charging rate at the start of charging, the charging rate at the end of charging, and the amount of electricity that is the amount of electricity from the start of charging to the end of charging; the first estimated capacity deterioration rate based on a third relational expression that determines the relationship between the first estimated capacity deterioration rate and a fourth relational expression that determines the relationship between the resistance deterioration rate and the first estimated capacity deterioration rate. A function of calculating an estimated capacity deterioration rate of.
本発明によれば、蓄電池の容量劣化を適切に推定できる。
According to the present invention, capacity deterioration of a storage battery can be appropriately estimated.
[実施形態の概要]
蓄電池の容量を推定する手法として、例えば以下の方式#1~#3が考えられる。
・方式#1:蓄電池を定期的に満充電電圧まで充電し、そこから放電下限電圧まで放電した際の電流積算値に基づいて蓄電池の容量を推定する。
・方式#2:充放電前後の開回路電圧(OCV)をまず推定した後、開回路電圧(OCV)とSOCとの関係に基づいて充放電前後の充電率の推定値(SOCv)を算出する。そして、充放電前後の推定値の差分(ΔSOCv)と充電電荷量の比率と、に基づいて蓄電池の容量を推定する。
・方式#3:蓄電池の抵抗劣化率と容量劣化率はある程度の相関を有することを利用して、比較的測定のしやすい抵抗劣化率に基づいて容量劣化率を推定する。 [Overview of embodiment]
As a method for estimating the capacity of a storage battery, the followingmethods # 1 to #3 can be considered, for example.
- Method #1: The storage battery is periodically charged to the full charge voltage, and the capacity of the storage battery is estimated based on the current integrated value when discharging from there to the discharge lower limit voltage.
・Method #2: First estimate the open circuit voltage (OCV) before and after charging and discharging, and then calculate the estimated charging rate (SOCv) before and after charging and discharging based on the relationship between the open circuit voltage (OCV) and SOC. . Then, the capacity of the storage battery is estimated based on the difference between estimated values before and after charging and discharging (ΔSOCv) and the ratio of the amount of charge.
- Method #3: Taking advantage of the fact that the resistance deterioration rate and capacity deterioration rate of a storage battery have a certain degree of correlation, the capacity deterioration rate is estimated based on the resistance deterioration rate, which is relatively easy to measure.
蓄電池の容量を推定する手法として、例えば以下の方式#1~#3が考えられる。
・方式#1:蓄電池を定期的に満充電電圧まで充電し、そこから放電下限電圧まで放電した際の電流積算値に基づいて蓄電池の容量を推定する。
・方式#2:充放電前後の開回路電圧(OCV)をまず推定した後、開回路電圧(OCV)とSOCとの関係に基づいて充放電前後の充電率の推定値(SOCv)を算出する。そして、充放電前後の推定値の差分(ΔSOCv)と充電電荷量の比率と、に基づいて蓄電池の容量を推定する。
・方式#3:蓄電池の抵抗劣化率と容量劣化率はある程度の相関を有することを利用して、比較的測定のしやすい抵抗劣化率に基づいて容量劣化率を推定する。 [Overview of embodiment]
As a method for estimating the capacity of a storage battery, the following
- Method #1: The storage battery is periodically charged to the full charge voltage, and the capacity of the storage battery is estimated based on the current integrated value when discharging from there to the discharge lower limit voltage.
・Method #2: First estimate the open circuit voltage (OCV) before and after charging and discharging, and then calculate the estimated charging rate (SOCv) before and after charging and discharging based on the relationship between the open circuit voltage (OCV) and SOC. . Then, the capacity of the storage battery is estimated based on the difference between estimated values before and after charging and discharging (ΔSOCv) and the ratio of the amount of charge.
- Method #3: Taking advantage of the fact that the resistance deterioration rate and capacity deterioration rate of a storage battery have a certain degree of correlation, the capacity deterioration rate is estimated based on the resistance deterioration rate, which is relatively easy to measure.
上述の特許文献1は方式#2に類するものであり、特許文献2は方式#3に類するものである。方式#1は、蓄電池容量の真値として用いられることがある。しかし、電気自動車のような実際のシステムにおいて、満充電電圧から電欠で動けなくなる放電下限電圧まで蓄電池を放電することは稀である。従って、方式#1に対応した測定を頻繁に行うことは困難な場合が多い。一方、方式#2は、放電下限電圧まで蓄電池を放電する必要が無いため、測定タイミングを取得しやすい。また、蓄電池の抵抗劣化率は比較的測定しやすいため、方式#3についても測定タイミングを取得しやすい。しかし、負荷パターンの違いや蓄電池の製造工程の違い等の影響を受けるため、抵抗劣化率と容量劣化率とは必ずしも一意に示される関係に無い。そのため、方式#3による推定精度は、基本的には劣化の進行とともに悪くなりやすい。
The above-mentioned Patent Document 1 is similar to method # 2, and Patent Document 2 is similar to method # 3. Method # 1 is sometimes used as the true value of storage battery capacity. However, in actual systems such as electric vehicles, it is rare to discharge a storage battery from a fully charged voltage to a lower discharge limit voltage at which the battery cannot operate due to lack of power. Therefore, it is often difficult to perform measurements corresponding to method # 1 frequently. On the other hand, in method # 2, since there is no need to discharge the storage battery to the lower discharge limit voltage, it is easy to obtain the measurement timing. Furthermore, since the resistance deterioration rate of the storage battery is relatively easy to measure, it is also easy to obtain the measurement timing for method # 3. However, the resistance deterioration rate and the capacity deterioration rate do not necessarily have a unique relationship because they are affected by differences in load patterns, differences in storage battery manufacturing processes, and the like. Therefore, the estimation accuracy by method # 3 basically tends to deteriorate as the deterioration progresses.
また、上述の方式#2,#3に共通して、例えばリン酸鉄リチウム正極と黒鉛負極とを組み合わせた蓄電池には適用が難しい場合が多い。これは、この種の蓄電池においては、ほとんどのSOC範囲で、SOCに対する開回路電圧(OCV)の変化が小さいためである。より詳細に述べると、まず方式#2においては、開回路電圧の推定誤差が僅かであっても、SOCvの推定誤差が大きくなるため、充放電前後のSOCが、何れもOCV変化の大きいSOC範囲内である必要がある。
Additionally, in common with the above methods # 2 and #3, it is often difficult to apply them to storage batteries that combine a lithium iron phosphate positive electrode and a graphite negative electrode, for example. This is because in this type of storage battery, the change in open circuit voltage (OCV) with respect to SOC is small over most of the SOC range. To explain in more detail, in method # 2, even if the estimation error of open circuit voltage is small, the estimation error of SOCv becomes large. Must be within.
このため、方式#2においては、充分な精度が得られるタイミングは、さほど多くないことが問題になる。また、方式#3において、抵抗劣化率を演算する上での基準抵抗は温度依存性とSOC依存性とを有する。従って、SOCが正しく推定できていない場合に、基準抵抗のズレが容量の推定値の誤差となって反映されてしまう。そこで、後述する実施形態は、ほとんどのSOC範囲で、SOCに対する開回路電圧(OCV)の変化が小さい蓄電池に対して、高精度かつ高頻度な容量劣化率の推定を実現するものである。
Therefore, the problem with method # 2 is that there are not many timings at which sufficient accuracy can be obtained. Further, in method # 3, the reference resistance for calculating the resistance deterioration rate has temperature dependence and SOC dependence. Therefore, if the SOC cannot be estimated correctly, the deviation in the reference resistance will be reflected as an error in the estimated value of the capacitance. Therefore, the embodiment described below realizes highly accurate and frequent estimation of the capacity deterioration rate for a storage battery in which the change in open circuit voltage (OCV) with respect to SOC is small in most SOC ranges.
[第1実施形態]
〈第1実施形態の構成〉
図1は、第1実施形態から第4実施形態において共通して用いられるコンピュータ980のブロック図である。後述する容量劣化推定装置110(図2参照)および容量劣化推定装置150(図9参照)は、図1に示すコンピュータ980を、1台または複数台備えている。
図1において、コンピュータ980は、CPU981と、記憶部982と、通信I/F(インタフェース)983と、入出力I/F984と、メディアI/F985と、を備える。ここで、記憶部982は、RAM982aと、ROM982bと、HDD982cと、を備える。通信I/F983は、通信回路986に接続される。入出力I/F984は、入出力装置987に接続される。メディアI/F985は、記録媒体988からデータを読み書きする。 [First embodiment]
<Configuration of first embodiment>
FIG. 1 is a block diagram of acomputer 980 commonly used in the first to fourth embodiments. Capacity deterioration estimating device 110 (see FIG. 2) and capacity deterioration estimating device 150 (see FIG. 9), which will be described later, include one or more computers 980 shown in FIG.
In FIG. 1, thecomputer 980 includes a CPU 981, a storage unit 982, a communication I/F (interface) 983, an input/output I/F 984, and a media I/F 985. Here, the storage unit 982 includes a RAM 982a, a ROM 982b, and an HDD 982c. Communication I/F 983 is connected to communication circuit 986. The input/output I/F 984 is connected to the input/output device 987. Media I/F 985 reads and writes data from recording medium 988 .
〈第1実施形態の構成〉
図1は、第1実施形態から第4実施形態において共通して用いられるコンピュータ980のブロック図である。後述する容量劣化推定装置110(図2参照)および容量劣化推定装置150(図9参照)は、図1に示すコンピュータ980を、1台または複数台備えている。
図1において、コンピュータ980は、CPU981と、記憶部982と、通信I/F(インタフェース)983と、入出力I/F984と、メディアI/F985と、を備える。ここで、記憶部982は、RAM982aと、ROM982bと、HDD982cと、を備える。通信I/F983は、通信回路986に接続される。入出力I/F984は、入出力装置987に接続される。メディアI/F985は、記録媒体988からデータを読み書きする。 [First embodiment]
<Configuration of first embodiment>
FIG. 1 is a block diagram of a
In FIG. 1, the
ROM982bには、CPUによって実行されるIPL(Initial Program Loader)等が格納されている。HDD982cには、制御プログラムや各種データ等が記憶されている。CPU981は、HDD982cからRAM982aに読み込んだ制御プログラム等を実行することにより、各種機能を実現する。後述する容量劣化推定装置110(図2参照)および容量劣化推定装置150(図8参照)の内部は、制御プログラム等によって実現される機能をブロックとして示したものである。
The ROM 982b stores IPL (Initial Program Loader) and the like executed by the CPU. The HDD 982c stores control programs, various data, and the like. The CPU 981 implements various functions by executing control programs and the like read into the RAM 982a from the HDD 982c. Inside the capacity deterioration estimating device 110 (see FIG. 2) and the capacity deterioration estimating device 150 (see FIG. 8), which will be described later, functions realized by a control program and the like are shown as blocks.
図2は、第1実施形態による容量劣化率推定システム1のブロック図である。
図2において、容量劣化率推定システム1は、蓄電池101と、測定部102と、充放電回路103と、容量劣化推定装置110(コンピュータ)と、を備えている。また、容量劣化推定装置110は、データ受信部112(データ受信手段)と、第1の容量劣化推定部114(第1の容量劣化推定手段)と、マップ記憶部116(テーブル記憶部)と、を備えている。第1の容量劣化推定部114は、抵抗劣化と容量劣化の相関関係を利用して容量劣化を推定するものであり、その詳細は後述する。 FIG. 2 is a block diagram of the capacity deteriorationrate estimation system 1 according to the first embodiment.
In FIG. 2, the capacity deteriorationrate estimation system 1 includes a storage battery 101, a measuring section 102, a charge/discharge circuit 103, and a capacity deterioration estimation device 110 (computer). The capacity deterioration estimating device 110 also includes a data receiving section 112 (data receiving means), a first capacity deterioration estimating section 114 (first capacity deterioration estimating means), a map storage section 116 (table storage section), It is equipped with The first capacity deterioration estimation unit 114 estimates capacity deterioration using the correlation between resistance deterioration and capacitance deterioration, and the details thereof will be described later.
図2において、容量劣化率推定システム1は、蓄電池101と、測定部102と、充放電回路103と、容量劣化推定装置110(コンピュータ)と、を備えている。また、容量劣化推定装置110は、データ受信部112(データ受信手段)と、第1の容量劣化推定部114(第1の容量劣化推定手段)と、マップ記憶部116(テーブル記憶部)と、を備えている。第1の容量劣化推定部114は、抵抗劣化と容量劣化の相関関係を利用して容量劣化を推定するものであり、その詳細は後述する。 FIG. 2 is a block diagram of the capacity deterioration
In FIG. 2, the capacity deterioration
蓄電池101は、リチウムイオン電池、鉛蓄電池、ニッケル水素電池、ニッケルカドミウム電池などが挙げられるが、これらに限定されない。測定部102は、蓄電池101の充放電時の電流値Iと、端子電圧である電圧値Vと電池温度Tと、を測定する。充放電回路103は、容量劣化推定装置110による制御に基づいて、蓄電池101を充放電する。データ受信部112は、測定部102の測定結果を受信する。第1の容量劣化推定部114は、データ受信部112が受信した測定結果に基づいて蓄電池101の容量劣化率SOHQの推定値である推定容量劣化率SOHQA(第1の推定容量劣化率)を出力する。
Examples of the storage battery 101 include, but are not limited to, a lithium ion battery, a lead acid battery, a nickel hydride battery, a nickel cadmium battery, and the like. The measurement unit 102 measures a current value I during charging and discharging of the storage battery 101, a voltage value V that is a terminal voltage, and a battery temperature T. The charging/discharging circuit 103 charges/discharges the storage battery 101 based on control by the capacity deterioration estimating device 110 . The data receiving section 112 receives the measurement results of the measuring section 102. The first capacity deterioration estimation unit 114 calculates an estimated capacity deterioration rate SOHQ A (first estimated capacity deterioration rate) that is an estimated value of the capacity deterioration rate SOHQ of the storage battery 101 based on the measurement results received by the data reception unit 112. Output.
マップ記憶部116は、マップMP1,MP2,MP3,MP4(第1,第2,第3および第4のテーブル)を記憶している。ここで、マップMP1は、抵抗劣化率SOHRと、これに対応する容量劣化率SOHQの推定値である推定容量劣化率SOHQmap(SOHR)と、の関係を予め記憶するものである。
The map storage unit 116 stores maps MP1, MP2, MP3, and MP4 (first, second, third, and fourth tables). Here, the map MP1 stores in advance the relationship between the resistance deterioration rate SOHR and the estimated capacity deterioration rate SOHQ map (SOHR), which is an estimated value of the corresponding capacity deterioration rate SOHQ.
図3は、マップMP1に記憶された特性の一例を示す図である。
図3において横軸は抵抗劣化率SOHRであり、縦軸は容量劣化率SOHQである。図3に示すように、マップMP1を用いることにより、抵抗劣化率SOHRを引数として、容量劣化率SOHQの推定値、すなわち推定容量劣化率SOHQmap(SOHR)を求めることができる。 FIG. 3 is a diagram showing an example of characteristics stored in map MP1.
In FIG. 3, the horizontal axis is the resistance deterioration rate SOHR, and the vertical axis is the capacity deterioration rate SOHQ. As shown in FIG. 3, by using the map MP1, an estimated value of the capacity deterioration rate SOHQ, that is, an estimated capacity deterioration rate SOHQ map (SOHR) can be obtained using the resistance deterioration rate SOHR as an argument.
また、マップMP2は、基準抵抗値Rchg,ref,mapと、SOCと、充電レートCrateと、の関係を記憶している。すなわち、基準抵抗値Rchg,ref,mapは、SOCと充電レートCrateとの関数であり、これを「Rchg,ref,map(SOC,Crate)」と表すことがある。
Furthermore, the map MP2 stores the relationship between the reference resistance value R chg,ref,map , the SOC, and the charging rate C rate . That is, the reference resistance value R chg,ref,map is a function of the SOC and the charging rate C rate , and may be expressed as "R chg,ref,map (SOC, C rate )."
ここで、基準抵抗値Rchg,ref,map(SOC,Crate)とは、蓄電池101が未使用状態またはこれに近い時(以下、未劣化時と呼ぶ)の、基準温度における蓄電池101の内部抵抗値である。また、充電レートCrateとは、電流値Iを、初期定格容量Qmax.ini(未劣化時の蓄電池101の定格容量)で除算した値である。この時、基準抵抗値Rchg,ref,mapにおける温度条件のことを基準温度とする。基準温度としては、特に制約は無いが本実施形態においては25℃とする。また、基準抵抗値Rchg,ref,mapは、充電開始後、x秒目の抵抗値である。ここで、xの値は任意に定めることができる。
Here, the reference resistance value R chg,ref,map (SOC, C rate ) refers to the inside of the storage battery 101 at the reference temperature when the storage battery 101 is in an unused state or close to this (hereinafter referred to as undegraded state). It is the resistance value. Further, the charging rate C rate is a value obtained by dividing the current value I by the initial rated capacity Q max.ini (rated capacity of the storage battery 101 when not degraded). At this time, the temperature condition at the reference resistance value R chg,ref,map is defined as the reference temperature. Although there are no particular restrictions on the reference temperature, in this embodiment it is set to 25°C. Further, the reference resistance value R chg,ref,map is the resistance value x seconds after the start of charging. Here, the value of x can be arbitrarily determined.
図4は、マップMP2に記憶された特性の一例を示す図である。
図4において横軸はSOCであり、縦軸は基準抵抗値Rchg,ref,mapである。図4に示すように、マップMP2を用いることにより、SOCと充電レートCrateとを引数として、基準抵抗値Rchg,ref,mapを求めることができる。マップMP2において、引数に充電レートCrateを入れている理由としては、バトラー・ボルマー式のように必ずしも抵抗値が一定と見なせない場合があるためである。電池によっては充電レートCrateが変わっても抵抗値が一定と見なせる場合もある。この場合には引数はSOCのみでもよい。 FIG. 4 is a diagram showing an example of characteristics stored in map MP2.
In FIG. 4, the horizontal axis is the SOC, and the vertical axis is the reference resistance value R chg,ref,map . As shown in FIG. 4, by using the map MP2, the reference resistance value R chg,ref,map can be determined using the SOC and the charging rate C rate as arguments. The reason why the charging rate C rate is included in the argument in the map MP2 is that the resistance value may not always be considered constant as in the Butler-Volmer equation. Depending on the battery, the resistance value may be considered constant even if the charging rate C rate changes. In this case, the argument may be only SOC.
また、マップMP3は、温度換算係数KT,map(T)と、電池温度T(単位:℃)との関係を予め記憶するものである。ここで、温度換算係数KT,map(T)とは、蓄電池101の基準温度における内部抵抗値に対する、電池温度Tにおける内部抵抗値の割合を示すものである。
Furthermore, the map MP3 stores in advance the relationship between the temperature conversion coefficient K T,map (T) and the battery temperature T (unit: °C). Here, the temperature conversion coefficient K T,map (T) indicates the ratio of the internal resistance value at the battery temperature T to the internal resistance value at the reference temperature of the storage battery 101.
図5は、マップMP3に記憶された特性の一例を示す図である。
図5において横軸は電池温度T(単位;℃)であり、縦軸は基準温度(図5においては25℃)を「1」とした場合の温度換算係数KT,map(T)ある。図5に示すように、マップMP1を用いることにより、電池温度T(単位;℃)を引数として、温度換算係数KT,map(T)を求めることもできる。 FIG. 5 is a diagram showing an example of characteristics stored in map MP3.
In FIG. 5, the horizontal axis is the battery temperature T (unit:° C.), and the vertical axis is the temperature conversion coefficient K T,map (T) when the reference temperature (25° C. in FIG. 5) is set to “1”. As shown in FIG. 5, by using the map MP1, the temperature conversion coefficient K T,map (T) can also be determined using the battery temperature T (unit: °C) as an argument.
また、マップMP4は、電池の充電率SOCと、開回路電圧OCVとの関係を予め記憶するものである。
図6は、マップMP4に記憶された特性の一例を示す図として、リン酸鉄リチウム正極を用いた蓄電池のSOC-OCV特性の一例を示す図である。なお、この蓄電池は、本実施形態における蓄電池101に適用するのに好ましい蓄電池であるが、前記の蓄電池種に限定されるものではない。
図6において横軸はSOCであり、縦軸は開回路電圧OCVである。 Moreover, the map MP4 stores in advance the relationship between the charging rate SOC of the battery and the open circuit voltage OCV.
FIG. 6 is a diagram showing an example of the SOC-OCV characteristics of a storage battery using a lithium iron phosphate positive electrode, as a diagram showing an example of the characteristics stored in the map MP4. In addition, although this storage battery is a preferable storage battery to apply to thestorage battery 101 in this embodiment, it is not limited to the said storage battery type.
In FIG. 6, the horizontal axis is SOC, and the vertical axis is open circuit voltage OCV.
図6は、マップMP4に記憶された特性の一例を示す図として、リン酸鉄リチウム正極を用いた蓄電池のSOC-OCV特性の一例を示す図である。なお、この蓄電池は、本実施形態における蓄電池101に適用するのに好ましい蓄電池であるが、前記の蓄電池種に限定されるものではない。
図6において横軸はSOCであり、縦軸は開回路電圧OCVである。 Moreover, the map MP4 stores in advance the relationship between the charging rate SOC of the battery and the open circuit voltage OCV.
FIG. 6 is a diagram showing an example of the SOC-OCV characteristics of a storage battery using a lithium iron phosphate positive electrode, as a diagram showing an example of the characteristics stored in the map MP4. In addition, although this storage battery is a preferable storage battery to apply to the
In FIG. 6, the horizontal axis is SOC, and the vertical axis is open circuit voltage OCV.
当該蓄電池のSOC-OCV特性C41によると、SOCが6%以下の領域において、SOC変化に対するOCVの変化量が大きい。従って、特に充電開始直前のOCVが低い場合には、OCVに基づいて、充電開始時のSOCを精度良く求めることができる。しかし、充電終了時にSOCが100%付近になると、SOCの変化に対するOCVの変化量が小さい。従って、SOCが100%付近である場合において、OCVからSOCを正確に推定することは難しい。そのため、充電終了時にSOCを推定するためには、SOC-OCV特性ではなく、充電時過電圧特性または抵抗特性を用いることが好ましい。
According to the SOC-OCV characteristic C41 of the storage battery, the amount of change in OCV with respect to SOC change is large in a region where SOC is 6% or less. Therefore, especially when the OCV immediately before the start of charging is low, the SOC at the start of charging can be determined with high accuracy based on the OCV. However, when the SOC approaches 100% at the end of charging, the amount of change in OCV with respect to the change in SOC is small. Therefore, when the SOC is around 100%, it is difficult to accurately estimate the SOC from the OCV. Therefore, in order to estimate the SOC at the end of charging, it is preferable to use charging overvoltage characteristics or resistance characteristics instead of SOC-OCV characteristics.
図1に戻り、第1の容量劣化推定部114は、後述する[数1]、[数2]、[数3]、[数4]に基づいて推定容量劣化率SOHQAを計算する。
Returning to FIG. 1, the first capacity deterioration estimation unit 114 calculates the estimated capacity deterioration rate SOHQ A based on [Equation 1], [Equation 2], [Equation 3], and [Equation 4], which will be described later.

[数1]は、充電開始時の電流や電圧、温度、マップ記憶部116に記憶されたマップMP2,MP3,MP4を用いて、充電開始時の抵抗劣化率SOHRを求める数式である。
[数1]において、右辺の分子は実際の抵抗値、右辺の分母は未劣化電池における基準抵抗値をそれぞれ計算している。 [Equation 1] is a formula for calculating the resistance deterioration rate SOHR at the start of charging using the current, voltage, temperature at the start of charging, and maps MP2, MP3, and MP4 stored in themap storage unit 116.
In [Equation 1], the numerator on the right side calculates the actual resistance value, and the denominator on the right side calculates the reference resistance value in an undegraded battery.
[数1]において、右辺の分子は実際の抵抗値、右辺の分母は未劣化電池における基準抵抗値をそれぞれ計算している。 [Equation 1] is a formula for calculating the resistance deterioration rate SOHR at the start of charging using the current, voltage, temperature at the start of charging, and maps MP2, MP3, and MP4 stored in the
In [Equation 1], the numerator on the right side calculates the actual resistance value, and the denominator on the right side calculates the reference resistance value in an undegraded battery.
CCVstartは、充電開始時のCCV(Closed Circuit Voltage;閉回路電圧)、すなわち、蓄電池101の正極端子および負極端子(図示略)の間に負荷(図示略)を接続した際の電圧値Vである。OCVmapは、SOCに応じてOCVを定めるマップ値であり、充電開始時充電率SOCstartは充電開始時における蓄電池101の充電率である。但し、充電開始時充電率SOCstartは、充電開始時には未知の値である。
CCV start is the CCV (Closed Circuit Voltage) at the start of charging, that is, the voltage value V when a load (not shown) is connected between the positive terminal and negative terminal (not shown) of the storage battery 101. be. The OCV map is a map value that determines the OCV according to the SOC, and the charging rate at the start of charging SOC start is the charging rate of the storage battery 101 at the time of starting charging. However, the charging rate at the start of charging SOC start is an unknown value at the time of starting charging.
また、充電開始時充電レートCrate,startは充電開始時の充電レートCrateである。また、Qratedは電池のSOHQ=100%の基準となる容量(定格容量など)である。また、基準抵抗値Rchg,ref,map(SOC,Crate,start)は、蓄電池101の未劣化時の基準温度における内部抵抗値Rであり、充電開始時充電レートCrate,startに対応する値である。充電開始温度Tstartは充電開始時における電池温度Tである。温度換算係数KT,map(Tstart)は前述したマップMP3を用いて求まる温度換算係数である。
Further, the charging rate C rate,start at the start of charging is the charging rate C rate at the start of charging. Moreover, Q rated is the capacity (rated capacity, etc.) that is the standard for SOHQ=100% of the battery. Further, the reference resistance value R chg,ref,map (SOC, C rate,start ) is the internal resistance value R at the reference temperature when the storage battery 101 is not degraded, and corresponds to the charging rate C rate,start at the start of charging. It is a value. The charging start temperature T start is the battery temperature T at the time of starting charging. The temperature conversion coefficient K T,map (T start ) is a temperature conversion coefficient determined using the map MP3 described above.

[数2]において、右辺の分子は充電終了時の実際の抵抗値、右辺の分母は充電終了時の未劣化電池における基準抵抗値をそれぞれ計算している。CCVend、SOCend、Crate,endおよびTendは、それぞれ、充電終了時の閉回路電圧、充電率、充電レートおよび電池温度である。この中でSOCendが未知変数になる。
In [Equation 2], the numerator on the right side calculates the actual resistance value at the end of charging, and the denominator on the right side calculates the reference resistance value of the undegraded battery at the end of charging. CCV end , SOC end , C rate, end , and T end are the closed circuit voltage, charging rate, charging rate, and battery temperature at the end of charging, respectively. In this, SOC end becomes an unknown variable.

[数3]の右辺第2項において、tstart は充電開始時の時刻、tend は充電終了時の時刻であり、両者間の電流の積分結果を充電電気量と呼ぶ。また、Qmax.ratedは、未劣化時における蓄電池101のSOHQ=100%の基準となる容量(定格容量など)である。
In the second term on the right side of [Equation 3], t start is the time at the start of charging, and t end is the time at the end of charging, and the result of integrating the current between them is called the charging amount of electricity. Moreover, Q max.rated is the capacity (rated capacity, etc.) that is the standard for SOHQ=100% of the
そして、第1の容量劣化推定部114(図1参照)は、[数1]から[数4]の中にある4つの未知変数であるSOCstartと、SOCendと、SOHRと、SOHQと、を求めるために[数1]から[数4]の連立方程式を数値的に解く。第1の容量劣化推定部114は、これにより求めた容量劣化率SOHQの推定値を推定容量劣化率SOHQAとして出力する。
Then, the first capacity deterioration estimating unit 114 (see FIG. 1) calculates the four unknown variables in [Equation 1] to [Equation 4]: SOC start , SOC end , SOHR, SOHQ, In order to obtain , the simultaneous equations from [Math. 1] to [Math. 4] are numerically solved. The first capacity deterioration estimation unit 114 outputs the estimated value of the capacity deterioration rate SOHQ thus obtained as the estimated capacity deterioration rate SOHQ A.
図7は、第1の実施形態における容量劣化推定装置110において実行される制御プログラムのフローチャートの一例である。
図7において処理がステップS01に進むと、データ受信部112は、測定部102から充電データを取得する。ここで、充電データとは、充放電時における電流値I、電圧値Vおよび電池温度Tの時系列情報である。 FIG. 7 is an example of a flowchart of a control program executed in the capacitydeterioration estimating device 110 in the first embodiment.
When the process proceeds to step S01 in FIG. 7, thedata receiving unit 112 acquires charging data from the measuring unit 102. Here, charging data is time series information of current value I, voltage value V, and battery temperature T during charging and discharging.
図7において処理がステップS01に進むと、データ受信部112は、測定部102から充電データを取得する。ここで、充電データとは、充放電時における電流値I、電圧値Vおよび電池温度Tの時系列情報である。 FIG. 7 is an example of a flowchart of a control program executed in the capacity
When the process proceeds to step S01 in FIG. 7, the
次に、処理がステップS02に進むと、第1の容量劣化推定部114は、充電データの中から、充電終了時の電流値I、電圧値Vおよび電池温度Tを読み出す。次に、処理がステップS03に進むと、第1の容量劣化推定部114は、充電終了時の電流値I、電圧値Vおよび電池温度Tに基づいて、第1の計測条件が満足されているか否かを判定する。ここで、第1の計測条件とは、蓄電池101が「満充電付近まで充電された」という条件であり、より具体的には、「蓄電池101の充電完了直前の電圧が所定の第1の閾値電圧以上になった」という条件である。
Next, when the process proceeds to step S02, the first capacity deterioration estimation unit 114 reads out the current value I, voltage value V, and battery temperature T at the end of charging from the charging data. Next, when the process proceeds to step S03, the first capacity deterioration estimating unit 114 determines whether the first measurement condition is satisfied based on the current value I, voltage value V, and battery temperature T at the end of charging. Determine whether or not. Here, the first measurement condition is a condition that the storage battery 101 is "charged to near full charge", and more specifically, "the voltage immediately before the completion of charging of the storage battery 101 is a predetermined first threshold value". The condition is that the voltage exceeds the voltage.
ステップS03において「No」と判定されると、本ルーチンが終了する。一方、「Yes」と判定されると、処理はステップS04に進む。ここでは、第1の容量劣化推定部114は、マップ記憶部116からマップMP1,MP2,MP3,MP4を読み出す。次に、処理がステップS05に進むと、第1の容量劣化推定部114は、充電データの中から、充電開始時の電流値I、電圧値Vおよび電池温度Tを読み出す。
If the determination in step S03 is "No", this routine ends. On the other hand, if the determination is "Yes", the process proceeds to step S04. Here, the first capacity deterioration estimation unit 114 reads maps MP1, MP2, MP3, and MP4 from the map storage unit 116. Next, when the process proceeds to step S05, the first capacity deterioration estimating unit 114 reads out the current value I, voltage value V, and battery temperature T at the start of charging from the charging data.
次に、処理がステップS06に進むと、第1の容量劣化推定部114は、後述する[数1]~[数4]の連立方程式を数値的に解くことにより、充電開始時充電率SOCstart、充電終了時充電率SOCend、抵抗劣化率SOHR、および容量劣化率SOHQの各推定値を算出する。より具体的には、ステップS06において、第1の容量劣化推定部114は、二分法、ニュートン法などによって上述した連立方程式の数値解を算出する。次に、処理がステップS07に進むと、第1の容量劣化推定部114は、容量劣化率SOHQの推定値を推定容量劣化率SOHQAとして出力する。
Next, when the process proceeds to step S06, the first capacity deterioration estimating unit 114 numerically solves the simultaneous equations [Math. 1] to [Math. , the charging rate at the end of charging SOC end , the resistance deterioration rate SOHR, and the capacity deterioration rate SOHQ. More specifically, in step S06, the first capacity deterioration estimating unit 114 calculates a numerical solution to the above-mentioned simultaneous equations using the bisection method, Newton's method, or the like. Next, when the process proceeds to step S07, the first capacity deterioration estimation unit 114 outputs the estimated value of the capacity deterioration rate SOHQ as the estimated capacity deterioration rate SOHQ A.
[第2実施形態]
次に、第2実施形態について説明する。第2実施形態は、第1実施形態において、実装する各種マップの誤差や、充電データの誤差等によって生じる容量劣化推定誤差を低減させようとするものである。そのため、偶発的に、所定の第2の計測条件が成立した場合に、精度の高い容量劣化推定値を用いて次回以降の容量劣化推定値をオフセット補正するものである。 [Second embodiment]
Next, a second embodiment will be described. The second embodiment attempts to reduce capacity deterioration estimation errors caused by errors in various maps to be implemented, errors in charging data, etc. in the first embodiment. Therefore, if the predetermined second measurement condition is met by chance, the highly accurate estimated capacity deterioration value is used to perform offset correction on the estimated capacity deterioration value from next time onwards.
ここで、「第2の計測条件」とは、蓄電池101が「SOCが0%付近から満充電付近まで充電された」という条件であり、より具体的には、「蓄電池101の充電開始直前の電圧が所定の第2の閾値電圧以下であり、充電完了直前の電圧が上述した第1の閾値電圧以上になった」という条件である。
Here, the "second measurement condition" is a condition that the storage battery 101 is "charged from around 0% SOC to around full charge," and more specifically, "the second measurement condition is that the storage battery 101 is charged from around 0% SOC to around full charge." The voltage is below a predetermined second threshold voltage, and the voltage immediately before the completion of charging is above the above-mentioned first threshold voltage."
図8は、第2実施形態による容量劣化率推定システム2のブロック図である。なお、以下の説明において、上述した第1実施形態の各部に対応する部分には同一の符号を付し、その説明を省略する場合がある。
図8において、容量劣化率推定システム2は、蓄電池101と、測定部102と、充放電回路103と、容量劣化推定装置150(コンピュータ)と、を備えている。また、容量劣化推定装置150は、データ受信部112と、第1の容量劣化推定部114と、マップ記憶部116と、第2の容量劣化推定部154と、補正量算出部156と、補正部152と、を備えている。 FIG. 8 is a block diagram of a capacity deteriorationrate estimation system 2 according to the second embodiment. In the following description, parts corresponding to those in the first embodiment described above may be denoted by the same reference numerals, and the description thereof may be omitted.
In FIG. 8, the capacity deteriorationrate estimation system 2 includes a storage battery 101, a measuring section 102, a charge/discharge circuit 103, and a capacity deterioration estimation device 150 (computer). The capacity deterioration estimating device 150 also includes a data receiving section 112, a first capacity deterioration estimating section 114, a map storage section 116, a second capacity deterioration estimating section 154, a correction amount calculating section 156, and a correction section. 152.
図8において、容量劣化率推定システム2は、蓄電池101と、測定部102と、充放電回路103と、容量劣化推定装置150(コンピュータ)と、を備えている。また、容量劣化推定装置150は、データ受信部112と、第1の容量劣化推定部114と、マップ記憶部116と、第2の容量劣化推定部154と、補正量算出部156と、補正部152と、を備えている。 FIG. 8 is a block diagram of a capacity deterioration
In FIG. 8, the capacity deterioration
上述した要素のうち、蓄電池101、測定部102、充放電回路103、データ受信部112、第1の容量劣化推定部114、およびマップ記憶部116の構成は第1実施形態のもの(図2参照)と同様である。但し、マップ記憶部116には、後述するマップMP10が記憶されている。第2の容量劣化推定部154は、上述した第2の計測条件が成立した場合に、容量劣化率SOHQの推定値である推定容量劣化率SOHQB(第2の推定容量劣化率)を求める。以下、推定容量劣化率SOHQBを求める方法について詳述する。
Among the above-mentioned elements, the configurations of the storage battery 101, measuring section 102, charging/discharging circuit 103, data receiving section 112, first capacity deterioration estimating section 114, and map storage section 116 are those of the first embodiment (see FIG. 2). ). However, the map storage unit 116 stores a map MP10, which will be described later. The second capacity deterioration estimation unit 154 calculates an estimated capacity deterioration rate SOHQ B (second estimated capacity deterioration rate), which is an estimated value of the capacity deterioration rate SOHQ, when the second measurement condition described above is satisfied. The method for determining the estimated capacity deterioration rate SOHQ B will be described in detail below.
図9は、リン酸鉄リチウム正極を用いた蓄電池の未劣化時におけるSOC-充電時過電圧(ΔV)特性の一例を示す図である。
蓄電池を充電している際には、分極現象により、蓄電池の電圧値VはOCVよりも高くなる。充電時における蓄電池の電圧値VからOCVを減算した値を充電時過電圧ΔVと呼ぶ。図9の特性C51は、充電レートを0.5[CA]、特性C52は、充電レートを0.02[CA]とした場合の充電時過電圧ΔVの特性である。なお、「1[CA]の充電レート」とは、電池容量を1時間で充電する電流密度を意味する。 FIG. 9 is a diagram showing an example of the SOC-charging overvoltage (ΔV) characteristic of a storage battery using a lithium iron phosphate positive electrode when it is not degraded.
When the storage battery is being charged, the voltage value V of the storage battery becomes higher than the OCV due to the polarization phenomenon. The value obtained by subtracting OCV from the voltage value V of the storage battery during charging is called overvoltage ΔV during charging. The characteristic C51 in FIG. 9 is the characteristic of the charging overvoltage ΔV when the charging rate is 0.5 [CA], and the characteristic C52 is the charging overvoltage ΔV when the charging rate is 0.02 [CA]. Note that "a charging rate of 1 [CA]" means a current density that charges the battery capacity in 1 hour.
特性C51,C52によると、SOCが100%に近づくにつれて、充電時過電圧ΔVは大きくなる。この特性を利用して、充電終了時のSOCを同定することができる。すなわち、充電開始直前のSOCを図6に基づいて求め、充電終了時のSOCを図9に基づいて求めることにより、容量劣化率SOHQの推定値である推定容量劣化率SOHQBを高い精度で求めることができる。具体的には、推定容量劣化率SOHQBは、下記の[数5]を数値的に解くことにより求めることができる。
According to characteristics C51 and C52, as the SOC approaches 100%, the charging overvoltage ΔV increases. Using this characteristic, the SOC at the end of charging can be identified. That is, by determining the SOC immediately before the start of charging based on FIG. 6 and determining the SOC at the end of charging based on FIG. 9, the estimated capacity deterioration rate SOHQ B , which is the estimated value of the capacity deterioration rate SOHQ, is determined with high accuracy. be able to. Specifically, the estimated capacity deterioration rate SOHQ B can be obtained by numerically solving [Equation 5] below.

[数5]において、初期定格容量Qmax,iniは、未劣化時の蓄電池101の定格容量である。また、CCVendとは、充電終了時のCCVであり、OCV(SOC=100%)とは、SOCが100%であるときのOCVである。但し、図6に示したSOC-OCV特性C41の例においては、SOCが70~100%の範囲では、OCVにほとんど変化は見られない。すなわち、充電終了時にSOCが70%以上であれば、OCV(SOC=100%)は、「充電終了時のOCV」と考えてよい。従って、「CCVend-OCV(SOC=100%)」は、充電終了時における充電時過電圧ΔV(図9参照)に対応する値である。但し、図9に示した充電時過電圧ΔVは未劣化時の値であるのに対して、「CCVend-OCV(SOC=100%)」は、一般的には劣化時の値である。そこで、この劣化時の値を「SOHR/100」で除算すると、その結果は未劣化時における充電時過電圧ΔVの推定値になる。
In [Equation 5], the initial rated capacity Q max,ini is the rated capacity of the storage battery 101 when it is not degraded. Further, CCV end is the CCV at the end of charging, and OCV (SOC=100%) is the OCV when the SOC is 100%. However, in the example of the SOC-OCV characteristic C41 shown in FIG. 6, there is almost no change in OCV in the SOC range of 70 to 100%. That is, if the SOC is 70% or more at the end of charging, the OCV (SOC=100%) may be considered "OCV at the end of charging." Therefore, "CCV end - OCV (SOC=100%)" is a value corresponding to the charging overvoltage ΔV (see FIG. 9) at the end of charging. However, while the charging overvoltage ΔV shown in FIG. 9 is a value when the battery is not degraded, "CCV end - OCV (SOC=100%)" is generally a value when the battery is degraded. Therefore, if this value at the time of deterioration is divided by "SOHR/100", the result becomes an estimated value of the charging overvoltage ΔV at the time of no deterioration.
図9によれば、SOCは、充電時過電圧ΔVと、Crateは充電レート[CA]と、の関数である。マップ記憶部116(図8参照)に記憶されているマップMP10は、充電時過電圧ΔVと、様々な充電レートCrateと、SOCとの関係を規定したものである。充電率推定値SOCΔv.mapは、充電時過電圧ΔVと、充電レートCrateと、マップMP10と、に基づいて求めたSOCの推定値である。また、[数5]において、充電率推定値SOCv.mapは、OCVと、マップMP4と、に基づいて求めたSOCの推定値である。従って、SOCv.map(OCVstart)は、充電開始時におけるSOCの推定値になる。
According to FIG. 9, SOC is a function of charging overvoltage ΔV, and C rate is a function of charging rate [CA]. The map MP10 stored in the map storage unit 116 (see FIG. 8) defines the relationship between charging overvoltage ΔV, various charging rates C rate , and SOC. The charging rate estimated value SOC Δv.map is an estimated value of the SOC obtained based on the charging overvoltage ΔV, the charging rate C rate , and the map MP10. Further, in [Equation 5], the charging rate estimated value SOC v.map is the estimated value of the SOC obtained based on the OCV and the map MP4. Therefore, SOC v.map (OCV start ) is an estimated value of SOC at the start of charging.
上述のように、[数5]に基づいて求めた推定容量劣化率SOHQBは、充電前のOCVはその変化量が大きい領域に属し、かつ、充電完了直前の電圧値Vが充分に高い場合に妥当性の高い値になる。推定容量劣化率SOHQBの妥当性が高いか否かを判定する手法の一例として、例えば、「充電完了直前の電圧値Vが所定の閾値電圧Vth1(第1の閾値電圧、例えば3.56V)以上である」、および「充電開始直前のOCV(または電圧値V)が所定の閾値電圧Vth2(第2の閾値電圧、例えば3.15V)以下である」という二つの条件を満たしたか否かに基づいて判定できる。
As mentioned above, the estimated capacity deterioration rate SOHQ B calculated based on [Equation 5] is calculated when the OCV before charging belongs to a region where the amount of change is large and the voltage value V just before charging is completed is sufficiently high. becomes a highly valid value. As an example of a method for determining whether the estimated capacity deterioration rate SOHQ B has high validity, for example, "the voltage value V immediately before the completion of charging is a predetermined threshold voltage Vth1 (first threshold voltage, for example, 3.56 V)" is used. or more” and “OCV (or voltage value V) immediately before charging starts is less than or equal to a predetermined threshold voltage Vth2 (second threshold voltage, e.g. 3.15V)”. Judgment can be made based on
第2の容量劣化推定部154は、これら二つの条件が満たされたことを条件として、推定容量劣化率SOHQBを出力し、少なくとも一方の条件が満たされない場合には推定容量劣化率SOHQBを出力しない。但し、以上に述べた指標および閾値は一例であり、本発明はこれらの指標および閾値の組み合わせに限定されるものではない。
The second capacity deterioration estimation unit 154 outputs the estimated capacity deterioration rate SOHQ B on the condition that these two conditions are met, and outputs the estimated capacity deterioration rate SOHQ B when at least one of the conditions is not satisfied. No output. However, the indicators and threshold values described above are merely examples, and the present invention is not limited to combinations of these indicators and threshold values.
補正量算出部156は、第2の容量劣化推定部154が推定容量劣化率SOHQBを算出した場合に、下記[数6]に基づいて補正量Xを算出する。

The correction amount calculation unit 156 calculates the correction amount X based on the following [Equation 6] when the second capacity deterioration estimation unit 154 calculates the estimated capacity deterioration rate SOHQ B.
また、補正部152は、下記[数7]に基づいて、推定容量劣化率SOHQC(第3の推定容量劣化率)を算出する。容量劣化推定装置150は、この推定容量劣化率SOHQCを容量劣化率SOHQの推定値として、出力する。補正量算出部156は、次に第2の容量劣化推定部154が推定容量劣化率SOHQBを出力した際に、補正量Xを更新するが、それまでは補正部152は、最後に計算された補正量Xを適用し続ける。

Further, the correction unit 152 calculates the estimated capacity deterioration rate SOHQ C (third estimated capacity deterioration rate) based on the following [Equation 7]. The capacity deterioration estimating device 150 outputs this estimated capacity deterioration rate SOHQ C as an estimated value of the capacity deterioration rate SOHQ. The correction amount calculation unit 156 updates the correction amount X when the second capacity deterioration estimation unit 154 outputs the estimated capacity deterioration rate SOHQ B , but until then, the correction amount The correction amount X continues to be applied.
特に、電気自動車等においては、一般的には、SOCが0%付近まで蓄電池101を放電される状況が頻繁に生じないため、推定容量劣化率SOHQBが算出される間隔は、長くなりやすい。このように、推定容量劣化率SOHQBが算出されない期間が比較的長い場合においても、本実施形態によれば、補正量Xに基づいて推定容量劣化率SOHQCを算出できるため、推定容量劣化率SOHQCの精度を向上させることができる。
In particular, in electric vehicles and the like, a situation in which the storage battery 101 is generally discharged to an SOC of around 0% does not occur frequently, so the interval at which the estimated capacity deterioration rate SOHQ B is calculated tends to be long. In this way, even if the period in which the estimated capacity deterioration rate SOHQ B is not calculated is relatively long, according to this embodiment, the estimated capacity deterioration rate SOHQ C can be calculated based on the correction amount X. The accuracy of SOHQ C can be improved.
[第3実施形態]
次に、第3実施形態の容量劣化率推定システムについて説明する。第3実施形態は、第1実施形態および第2実施形態において、各種マップの誤差や、充電データの誤差等によって生じる容量劣化推定誤差をさらに低減させようとするものである。そのため、偶発的に、上述した第2の計測条件が成立した場合に(SOC0%付近における開回路電圧変化が大きい領域から充電が開始され、かつ、SOC100%付近で充電が完了した場合に)得られる精度の高い容量劣化推定値を用いて、次回以降の容量劣化推定値をゲイン補正するものである。第3実施形態の容量劣化率推定システムの構成は、以下述べる点を除いて、第2実施形態の容量劣化率推定システム2(図8参照)と同様である。 [Third embodiment]
Next, a capacity deterioration rate estimation system according to a third embodiment will be described. The third embodiment is an attempt to further reduce capacity deterioration estimation errors caused by errors in various maps, errors in charging data, etc. in the first embodiment and the second embodiment. Therefore, if the second measurement condition mentioned above is met by chance (if charging is started in a region where the open circuit voltage change is large nearSOC 0% and charging is completed near SOC 100%), the This method uses the highly accurate capacity deterioration estimated value to perform gain correction on the next and subsequent capacity deterioration estimated values. The configuration of the capacity deterioration rate estimation system of the third embodiment is similar to the capacity deterioration rate estimation system 2 of the second embodiment (see FIG. 8), except for the points described below.
次に、第3実施形態の容量劣化率推定システムについて説明する。第3実施形態は、第1実施形態および第2実施形態において、各種マップの誤差や、充電データの誤差等によって生じる容量劣化推定誤差をさらに低減させようとするものである。そのため、偶発的に、上述した第2の計測条件が成立した場合に(SOC0%付近における開回路電圧変化が大きい領域から充電が開始され、かつ、SOC100%付近で充電が完了した場合に)得られる精度の高い容量劣化推定値を用いて、次回以降の容量劣化推定値をゲイン補正するものである。第3実施形態の容量劣化率推定システムの構成は、以下述べる点を除いて、第2実施形態の容量劣化率推定システム2(図8参照)と同様である。 [Third embodiment]
Next, a capacity deterioration rate estimation system according to a third embodiment will be described. The third embodiment is an attempt to further reduce capacity deterioration estimation errors caused by errors in various maps, errors in charging data, etc. in the first embodiment and the second embodiment. Therefore, if the second measurement condition mentioned above is met by chance (if charging is started in a region where the open circuit voltage change is large near
本実施形態による補正量算出部156は、上述した第2の計測条件が成立し、第2の容量劣化推定部154が推定容量劣化率SOHQBを算出した場合に、下記[数8]に基づいて補正量Yを算出する。

When the second measurement condition described above is satisfied and the second capacity deterioration estimation unit 154 calculates the estimated capacity deterioration rate SOHQ B , the correction amount calculation unit 156 according to the present embodiment calculates the estimated capacity deterioration rate SOHQ based on the following [Equation 8]. Then, the correction amount Y is calculated.
また、補正部152は、下記[数9]に基づいて、推定容量劣化率SOHQD(第4の推定容量劣化率)を算出する。容量劣化推定装置150は、この推定容量劣化率SOHQDを容量劣化率SOHQの推定値として、出力する。補正量算出部156は、次に第2の容量劣化推定部154が推定容量劣化率SOHQBを出力した際に、補正量Yを更新するが、それまでは補正部152は、最後に計算された補正量Yを適用し続ける。

Further, the correction unit 152 calculates the estimated capacity deterioration rate SOHQ D (fourth estimated capacity deterioration rate) based on the following [Equation 9]. The capacity deterioration estimation device 150 outputs this estimated capacity deterioration rate SOHQ D as an estimated value of the capacity deterioration rate SOHQ. The correction amount calculation section 156 updates the correction amount Y when the second capacity deterioration estimation section 154 outputs the estimated capacity deterioration rate SOHQ B , but until then, the correction amount calculation section 156 updates the correction amount Y. The correction amount Y continues to be applied.
本実施形態においても、補正量Yに基づいて推定容量劣化率SOHQDを算出できる。従って、推定容量劣化率SOHQBが算出されない期間が比較的長い場合においても、推定容量劣化率SOHQDの精度を向上させることができる。
Also in this embodiment, the estimated capacity deterioration rate SOHQ D can be calculated based on the correction amount Y. Therefore, even if the period during which the estimated capacity deterioration rate SOHQ B is not calculated is relatively long, the accuracy of the estimated capacity deterioration rate SOHQ D can be improved.
[第4実施形態]
次に、第4実施形態の容量劣化率推定システムについて説明する。第4実施形態は、第1実施形態および第2実施形態において、実装するマップMP1の誤差によって生じる容量劣化推定誤差を低減させるものである。そのため、偶発的に、上述した第2の計測条件が成立した場合に得られる精度の高い容量劣化推定値を用いてマップMP1を補正するものである。第4実施形態の容量劣化率推定システムの構成は、以下述べる点を除いて、第2実施形態の容量劣化率推定システム2(図8参照)と同様である。 [Fourth embodiment]
Next, a capacity deterioration rate estimation system according to a fourth embodiment will be described. The fourth embodiment reduces the capacity deterioration estimation error caused by the error in the implemented map MP1 in the first embodiment and the second embodiment. Therefore, the map MP1 is corrected using a highly accurate estimated capacity deterioration value obtained when the second measurement condition mentioned above is satisfied by chance. The configuration of the capacity deterioration rate estimation system of the fourth embodiment is similar to the capacity deteriorationrate estimation system 2 of the second embodiment (see FIG. 8), except for the points described below.
次に、第4実施形態の容量劣化率推定システムについて説明する。第4実施形態は、第1実施形態および第2実施形態において、実装するマップMP1の誤差によって生じる容量劣化推定誤差を低減させるものである。そのため、偶発的に、上述した第2の計測条件が成立した場合に得られる精度の高い容量劣化推定値を用いてマップMP1を補正するものである。第4実施形態の容量劣化率推定システムの構成は、以下述べる点を除いて、第2実施形態の容量劣化率推定システム2(図8参照)と同様である。 [Fourth embodiment]
Next, a capacity deterioration rate estimation system according to a fourth embodiment will be described. The fourth embodiment reduces the capacity deterioration estimation error caused by the error in the implemented map MP1 in the first embodiment and the second embodiment. Therefore, the map MP1 is corrected using a highly accurate estimated capacity deterioration value obtained when the second measurement condition mentioned above is satisfied by chance. The configuration of the capacity deterioration rate estimation system of the fourth embodiment is similar to the capacity deterioration
本実施形態によるマップ記憶部116に記憶されたマップMP1の補正方法の一例について説明する。補正部152は、上述した第2の計測条件が成立すると、マップMP1のうち、現在のSOHR以上のSOHR領域に対応するSOHQのテーブル値の全てに対して補正量Xを加算する。
An example of a method for correcting the map MP1 stored in the map storage unit 116 according to the present embodiment will be described. When the second measurement condition described above is satisfied, the correction unit 152 adds the correction amount X to all the table values of SOHQ corresponding to the SOHR region equal to or higher than the current SOHR in the map MP1.
すなわち、第2の計測条件が満足されると、補正部152は、マップMP1のテーブル値を更新する。マップMP1が更新された後の推定容量劣化率SOHQAを、推定容量劣化率SOHQE(第5の推定容量劣化率)と称することがある。このように、本実施形態では、マップMP1自体を補正するため、補正部152において補正量Xを推定容量劣化率SOHQEに加算すると、補正が二重となる。そこで、本実施形態においては、補正部152では、推定容量劣化率SOHQEを補正しない。これにより、更新されたマップMP1を用いて計算された第5の容量劣化率SOHQEを算出できる。なお、上記で説明したマップMP1の補正方法はあくまで一例であり、上記手法に限定されない。
That is, when the second measurement condition is satisfied, the correction unit 152 updates the table value of the map MP1. The estimated capacity deterioration rate SOHQ A after the map MP1 is updated may be referred to as the estimated capacity deterioration rate SOHQ E (fifth estimated capacity deterioration rate). In this manner, in this embodiment, in order to correct the map MP1 itself, when the correction amount X is added to the estimated capacity deterioration rate SOHQ E in the correction unit 152, the correction becomes double. Therefore, in the present embodiment, the correction unit 152 does not correct the estimated capacity deterioration rate SOHQ E. Thereby, the fifth capacity deterioration rate SOHQ E calculated using the updated map MP1 can be calculated. Note that the method for correcting map MP1 described above is just an example, and is not limited to the above method.
本実施形態においては、更新されたマップMP1に基づいて推定容量劣化率SOHQEを算出できる。従って、推定容量劣化率SOHQBが算出されない期間が比較的長い場合においても、推定容量劣化率SOHQEの精度を向上させることができる。
In this embodiment, the estimated capacity deterioration rate SOHQ E can be calculated based on the updated map MP1. Therefore, even if the period during which the estimated capacity deterioration rate SOHQ B is not calculated is relatively long, the accuracy of the estimated capacity deterioration rate SOHQ E can be improved.
[実施形態の効果]
以上のように上述の実施形態によれば、容量劣化推定装置110,150は、蓄電池101の電流値Iと電圧値Vとを計測する測定部102から電流値Iと電圧値Vとの測定結果を受信するデータ受信部112と、第1の容量劣化推定部114と、を備え、第1の容量劣化推定部114は、蓄電池101の抵抗劣化率SOHRと容量劣化率SOHQの推定値である推定容量劣化率(SOHQmap(SOHR))との関係を記憶する第1のテーブル(MP1)と、蓄電池101の充電率SOCと蓄電池101の未劣化時の所定温度における抵抗値である基準抵抗値(Rchg,ref,map)との関係を記憶する第2のテーブル(MP2)と、蓄電池101の温度と基準抵抗値(Rchg,ref,map)に対する比率である温度換算係数(KT,map(T))との関係を記憶する第3のテーブル(MP3)と、充電率SOCと蓄電池101の端子開放電圧(OCV)との関係を記憶する第4のテーブル(MP4)と、をテーブル記憶部(116)から読み出す機能と、充電開始時における充電率SOCである充電開始時充電率SOCstartと基準抵抗値(Rchg,ref,map)と抵抗劣化率SOHRとの関係を定める第1の関係式(数1)と、充電終了時における充電率SOCである充電終了時充電率SOCendと基準抵抗値(Rchg,ref,map)と抵抗劣化率SOHRとの関係を定める第2の関係式(数2)と、充電開始時充電率SOCstartと充電終了時充電率SOCendと充電開始時から充電終了時までの電気量である充電電気量と第1の推定容量劣化率(SOHQA)との関係を定める第3の関係式(数3)と、抵抗劣化率SOHRと第1の推定容量劣化率(SOHQA)との関係を定める第4の関係式(数4)と、に基づいて第1の推定容量劣化率(SOHQA)を算出する機能と、を備える。これにより、第1の推定容量劣化率(SOHQA)を算出できるため、蓄電池の容量劣化を適切に推定できる。 [Effects of embodiment]
As described above, according to the embodiments described above, the capacity deterioration estimating devices 110 and 150 obtain the measurement results of the current value I and the voltage value V from the measurement unit 102 that measures the current value I and the voltage value V of the storage battery 101. and a first capacity deterioration estimator 114, the first capacity deterioration estimator 114 estimates the resistance deterioration rate SOHR and the capacity deterioration rate SOHQ of the storage battery 101. A first table (MP1) that stores the relationship between the capacity deterioration rate (SOHQ map (SOHR)), a reference resistance value (MP1) that is the resistance value at a predetermined temperature when the storage battery 101 is not degraded, and the charging rate SOC of the storage battery 101. A second table (MP2) that stores the relationship between the storage battery 101 temperature and the reference resistance value (R chg,ref,map ) and a temperature conversion coefficient (K T, map (T)) and a fourth table (MP4) that stores the relationship between the charging rate SOC and the open terminal voltage (OCV) of the storage battery 101. A first function that determines the relationship between the charging rate SOC start at the start of charging, which is the charging rate SOC at the start of charging, the reference resistance value (R chg,ref,map ), and the resistance deterioration rate SOHR. The second relationship that defines the relationship between the relational expression (Equation 1), the charging rate at the end of charging SOC end which is the charging rate at the end of charging, the reference resistance value (R chg,ref,map ), and the resistance deterioration rate SOHR Equation (Equation 2), the charging rate at the start of charging SOC start , the charging rate at the end of charging SOC end , the amount of electricity that is the amount of electricity from the start of charging to the end of charging, and the first estimated capacity deterioration rate (SOHQ A ), and a fourth relational expression (Equation 4) that defines the relationship between the resistance deterioration rate SOHR and the first estimated capacity deterioration rate (SOHQ A ). and a function of calculating a first estimated capacity deterioration rate (SOHQ A ) based on the first estimated capacity deterioration rate (SOHQ A ). Thereby, the first estimated capacity deterioration rate (SOHQ A ) can be calculated, so that the capacity deterioration of the storage battery can be appropriately estimated.
以上のように上述の実施形態によれば、容量劣化推定装置110,150は、蓄電池101の電流値Iと電圧値Vとを計測する測定部102から電流値Iと電圧値Vとの測定結果を受信するデータ受信部112と、第1の容量劣化推定部114と、を備え、第1の容量劣化推定部114は、蓄電池101の抵抗劣化率SOHRと容量劣化率SOHQの推定値である推定容量劣化率(SOHQmap(SOHR))との関係を記憶する第1のテーブル(MP1)と、蓄電池101の充電率SOCと蓄電池101の未劣化時の所定温度における抵抗値である基準抵抗値(Rchg,ref,map)との関係を記憶する第2のテーブル(MP2)と、蓄電池101の温度と基準抵抗値(Rchg,ref,map)に対する比率である温度換算係数(KT,map(T))との関係を記憶する第3のテーブル(MP3)と、充電率SOCと蓄電池101の端子開放電圧(OCV)との関係を記憶する第4のテーブル(MP4)と、をテーブル記憶部(116)から読み出す機能と、充電開始時における充電率SOCである充電開始時充電率SOCstartと基準抵抗値(Rchg,ref,map)と抵抗劣化率SOHRとの関係を定める第1の関係式(数1)と、充電終了時における充電率SOCである充電終了時充電率SOCendと基準抵抗値(Rchg,ref,map)と抵抗劣化率SOHRとの関係を定める第2の関係式(数2)と、充電開始時充電率SOCstartと充電終了時充電率SOCendと充電開始時から充電終了時までの電気量である充電電気量と第1の推定容量劣化率(SOHQA)との関係を定める第3の関係式(数3)と、抵抗劣化率SOHRと第1の推定容量劣化率(SOHQA)との関係を定める第4の関係式(数4)と、に基づいて第1の推定容量劣化率(SOHQA)を算出する機能と、を備える。これにより、第1の推定容量劣化率(SOHQA)を算出できるため、蓄電池の容量劣化を適切に推定できる。 [Effects of embodiment]
As described above, according to the embodiments described above, the capacity
また、第2のテーブル(MP2)は、充電率SOCと基準抵抗値(Rchg,ref,map)と蓄電池101に対する充電レートCrateと、の関係を記憶するものであり、第1の関係式(数1)は、充電開始時充電率SOCstartと基準抵抗値(Rchg,ref,map)と抵抗劣化率SOHRと充電開始時における充電レートCrateである充電開始時充電レート(Crate,start)との関係を定めるものであり、第2の関係式(数2)は、充電終了時充電率SOCendと基準抵抗値(Rchg,ref,map)と抵抗劣化率SOHRと充電終了時における充電レートCrateである充電終了時充電レート(Crate,end)との関係を定めるものであると一層好ましい。これにより、充電レートCrateに応じて基準抵抗値(Rchg,ref,map)が変動する蓄電池101においても、容量劣化を適切に推定できる。
Further, the second table (MP2) stores the relationship between the charging rate SOC, the reference resistance value (R chg,ref,map ), and the charging rate C rate for the storage battery 101, and the first relational expression (Equation 1) is the charging rate at the start of charging (C rate , start ), and the second relational expression (Equation 2) is the relationship between the charging rate at the end of charging SOC end , the reference resistance value (R chg,ref,map ), the resistance deterioration rate SOHR, and the end of charging. It is more preferable that the relationship between the charging rate C rate and the charging rate at the end of charging (C rate,end ) is determined. Thereby, capacity deterioration can be appropriately estimated even in the storage battery 101 whose reference resistance value (R chg,ref,map ) varies depending on the charging rate C rate .
また、第1の容量劣化推定部114は、所定の第1の計測条件が満足されたことを条件として第1の推定容量劣化率(SOHQA)を算出すると一層好ましい。さらに、第1の計測条件は、蓄電池101の充電完了直前の電圧が所定の第1の閾値電圧(Vth1)以上であるという条件であると一層好ましい。これにより、第1の閾値電圧(Vth1)を適切に設定することにより、満充電状態に近い状態になった場合にのみ蓄電池101の容量劣化を適切に推定できる。
Further, it is more preferable that the first capacity deterioration estimation unit 114 calculates the first estimated capacity deterioration rate (SOHQ A ) on the condition that a predetermined first measurement condition is satisfied. Furthermore, it is more preferable that the first measurement condition is that the voltage immediately before the completion of charging of the storage battery 101 is equal to or higher than a predetermined first threshold voltage (Vth1). Thereby, by appropriately setting the first threshold voltage (Vth1), capacity deterioration of the storage battery 101 can be appropriately estimated only when the battery is close to a fully charged state.
また、容量劣化推定装置150は、所定の第2の計測条件が満たされた場合に、電圧値Vに基づいて第2の推定容量劣化率(SOHQB)を算出する第2の容量劣化推定部154と、第1および第2の推定容量劣化率(SOHQA,SOHQB)に基づいて、補正量X,Yを算出する補正量算出部156と、第1の推定容量劣化率(SOHQA)と、補正量X,Yと、に基づいて第3の推定容量劣化率(SOHQC)を算出する補正部152と、をさらに備えると一層好ましい。これにより、第2の推定容量劣化率(SOHQB)に基づいて、一層適切な第3の推定容量劣化率(SOHQC)を得ることができる。
The capacity deterioration estimating device 150 also includes a second capacity deterioration estimation unit that calculates a second estimated capacity deterioration rate (SOHQ B ) based on the voltage value V when a predetermined second measurement condition is satisfied. 154, a correction amount calculation unit 156 that calculates correction amounts X and Y based on the first and second estimated capacity deterioration rates (SOHQ A , SOHQ B ), and a first estimated capacity deterioration rate (SOHQ A ). It is more preferable to further include a correction unit 152 that calculates a third estimated capacity deterioration rate (SOHQ C ) based on the correction amounts X and Y. Thereby, a more appropriate third estimated capacity deterioration rate (SOHQ C ) can be obtained based on the second estimated capacity deterioration rate (SOHQ B ).
また、容量劣化推定装置150は、所定の第2の計測条件が満たされた場合に、電圧値Vに基づいて第2の推定容量劣化率(SOHQB)を算出する第2の容量劣化推定部154と、第1および第2の推定容量劣化率(SOHQA,SOHQB)に基づいて、第1のテーブル(MP1)を修正する補正部152と、をさらに備えても一層好ましい。これにより、第2の推定容量劣化率(SOHQB)に基づいて、一層適切な第1の推定容量劣化率(SOHQA)を得ることができる。
The capacity deterioration estimating device 150 also includes a second capacity deterioration estimation unit that calculates a second estimated capacity deterioration rate (SOHQ B ) based on the voltage value V when a predetermined second measurement condition is satisfied. 154, and a correction unit 152 that corrects the first table (MP1) based on the first and second estimated capacity deterioration rates (SOHQ A , SOHQ B ). Thereby, a more appropriate first estimated capacity deterioration rate (SOHQ A ) can be obtained based on the second estimated capacity deterioration rate (SOHQ B ).
また、第2の容量劣化推定部154は、充電開始時充電率SOCstartと、充電終了時充電率SOCendと、充電電気量と、に基づいて第2の推定容量劣化率(SOHQB)を算出すると一層好ましい。これにより、充電開始時充電率SOCstartと、充電終了時充電率SOCendと、充電電気量と、に基づいて第2の推定容量劣化率(SOHQB)を算出できる。
Further, the second capacity deterioration estimating unit 154 calculates a second estimated capacity deterioration rate (SOHQ B ) based on the charging rate at the start of charging SOC start , the charging rate at the end of charging SOC end , and the amount of electricity charged. It is more preferable to calculate it. Thereby, the second estimated capacity deterioration rate (SOHQ B ) can be calculated based on the charging rate at the start of charging SOC start , the charging rate at the end of charging SOC end , and the amount of electricity charged.
また、第2の計測条件は、蓄電池101の充電完了直前の電圧値Vが第1の閾値電圧(Vth1)以上であり、かつ、充電開始直前の電圧値Vが所定の第2の閾値電圧(Vth2)以下であるという条件であると一層好ましい。これにより、電圧値Vの変動範囲が適切な場合に第2の推定容量劣化率(SOHQB)を算出できる。
The second measurement condition is that the voltage value V immediately before the completion of charging of the storage battery 101 is equal to or higher than the first threshold voltage (Vth1), and the voltage value V immediately before the start of charging is a predetermined second threshold voltage ( It is more preferable that the voltage is Vth2) or less. Thereby, the second estimated capacity deterioration rate (SOHQ B ) can be calculated when the variation range of the voltage value V is appropriate.
また、容量劣化推定装置150は、所定の計測条件が満たされた場合に、電圧値Vに基づいて第2の推定容量劣化率(SOHQB)を算出する第2の容量劣化推定部154と、第1の推定容量劣化率(SOHQA)と、第2の推定容量劣化率(SOHQB)と、に基づいて、補正量X,Yを算出する補正量算出部156と、第1の推定容量劣化率(SOHQA)と、補正量X,Yと、に基づいて第3~第5の推定容量劣化率(SOHQC,SOHQD,SOHQE)を算出する補正部152と、をさらに備えると一層好ましい。これにより、電圧値に基づいて算出した第2の推定容量劣化率(SOHQB)をさらに用いて最終的な推定容量劣化率、例えば第3~第5の推定容量劣化率(SOHQC,SOHQD,SOHQE)を算出できるため、蓄電池の容量劣化を一層適切に推定できる。
The capacity deterioration estimating device 150 also includes a second capacity deterioration estimation unit 154 that calculates a second estimated capacity deterioration rate (SOHQ B ) based on the voltage value V when a predetermined measurement condition is satisfied; A correction amount calculation unit 156 that calculates correction amounts X and Y based on a first estimated capacity deterioration rate (SOHQ A ) and a second estimated capacity deterioration rate (SOHQ B ); Further comprising a correction unit 152 that calculates third to fifth estimated capacity deterioration rates (SOHQ C , SOHQ D , SOHQ E ) based on the deterioration rate (SOHQ A ) and the correction amounts X and Y. More preferred. As a result, the second estimated capacity deterioration rate (SOHQ B ) calculated based on the voltage value is further used to obtain the final estimated capacity deterioration rate, for example, the third to fifth estimated capacity deterioration rates (SOHQ C , SOHQ D , SOHQ E ), it is possible to more appropriately estimate the capacity deterioration of the storage battery.
[変形例]
本発明は上述した実施形態に限定されるものではなく、種々の変形が可能である。上述した実施形態は本発明を理解しやすく説明するために例示したものであり、必ずしも説明した全ての構成を備えるものに限定されるものではない。また、ある実施形態の構成の一部を他の実施形態の構成に置き換えることが可能であり、ある実施形態の構成に他の実施形態の構成を加えることも可能である。また、各実施形態の構成の一部について削除し、もしくは他の構成の追加・置換をすることが可能である。また、図中に示した制御線や情報線は説明上必要と考えられるものを示しており、製品上で必要な全ての制御線や情報線を示しているとは限らない。実際には殆ど全ての構成が相互に接続されていると考えてもよい。上記実施形態に対して可能な変形は、例えば以下のようなものである。 [Modified example]
The present invention is not limited to the embodiments described above, and various modifications are possible. The embodiments described above are exemplified to explain the present invention in an easy-to-understand manner, and are not necessarily limited to those having all the configurations described. Furthermore, it is possible to replace a part of the configuration of one embodiment with the configuration of another embodiment, and it is also possible to add the configuration of another embodiment to the configuration of one embodiment. Further, it is possible to delete a part of the configuration of each embodiment, or add or replace other configurations. Furthermore, the control lines and information lines shown in the figures are those considered necessary for explanation, and do not necessarily show all the control lines and information lines necessary on the product. In reality, almost all components may be considered to be interconnected. Possible modifications to the above embodiment include, for example, the following.
(1)上述した実施形態では、移動体用蓄電池への応用について説明した。しかし、本発明の適用分野はこれに限定されず、固定設備の蓄電池に本発明を適用することができる。
(1) In the embodiment described above, the application to a storage battery for a mobile object was explained. However, the field of application of the present invention is not limited to this, and the present invention can be applied to storage batteries in fixed facilities.
(2)上述した各実施形態において測定部102は蓄電池101の電池温度Tを計測したが、電池温度Tがほぼ一定である場合には、電池温度Tの計測を省略してもよい。
(2) In each of the embodiments described above, the measuring unit 102 measures the battery temperature T of the storage battery 101, but if the battery temperature T is approximately constant, the measurement of the battery temperature T may be omitted.
(3)上記実施形態における容量劣化推定装置110,150のハードウエアは一般的なコンピュータによって実現できるため、上述した各種処理を実行するプログラム等を記憶媒体に格納し、または伝送路を介して頒布してもよい。
(3) Since the hardware of the capacity deterioration estimating devices 110 and 150 in the above embodiments can be realized by a general computer, programs etc. that execute the various processes described above can be stored in a storage medium or distributed via a transmission path. You may.
(4)上述した各処理は、上記実施形態ではプログラムを用いたソフトウエア的な処理として説明したが、その一部または全部をASIC(Application Specific Integrated Circuit;特定用途向けIC)、あるいはFPGA(Field Programmable Gate Array)等を用いたハードウエア的な処理に置き換えてもよい。
(4) Each of the above-mentioned processes has been explained as a software process using a program in the above embodiment, but some or all of them can be implemented on an ASIC (Application Specific Integrated Circuit) or FPGA (Field It may also be replaced with hardware processing using a Programmable Gate Array) or the like.
(5)上記実施形態において実行される各種処理は、図示せぬネットワーク経由でサーバコンピュータが実行してもよく、上記実施形態において記憶される各種データも該サーバコンピュータに記憶させるようにしてもよい。
(5) The various processes executed in the above embodiment may be executed by a server computer via a network (not shown), and the various data stored in the above embodiment may also be stored in the server computer. .
[付記]
本件の基礎出願である日本国特許出願、特願2022-135627号において、[数5]は、下記[数5A]の通りであったので付記する。

[Additional notes]
In the Japanese patent application, Japanese Patent Application No. 2022-135627, which is the basic application of this case, [Math. 5] is as shown in [Math. 5A] below, so it is added.
本件の基礎出願である日本国特許出願、特願2022-135627号において、[数5]は、下記[数5A]の通りであったので付記する。
In the Japanese patent application, Japanese Patent Application No. 2022-135627, which is the basic application of this case, [Math. 5] is as shown in [Math. 5A] below, so it is added.
101 蓄電池
102 測定部
110,150 容量劣化推定装置(コンピュータ)
112 データ受信部
114 第1の容量劣化推定部
116 マップ記憶部(テーブル記憶部)
152 補正部
154 第2の容量劣化推定部
156 補正量算出部
I 電流値
V 電圧値
X,Y 補正量
MP1 マップ(第1のテーブル)
MP2 マップ(第2のテーブル)
MP3 マップ(第3のテーブル)
MP4 マップ(第4のテーブル)
OCV 開回路電圧(端子開放電圧)
SOC 充電率
Vth1 閾値電圧(第1の閾値電圧)
Vth2 閾値電圧(第2の閾値電圧)
SOHQ 容量劣化率
SOHR 抵抗劣化率
Crate 充電レート
SOHQA 推定容量劣化率(第1の推定容量劣化率)
SOHQB 推定容量劣化率(第2の推定容量劣化率)
SOHQC 推定容量劣化率(第3の推定容量劣化率)
SOHQD 推定容量劣化率(第4の推定容量劣化率)
SOHQE 推定容量劣化率(第5の推定容量劣化率)
SOCend 充電終了時充電率
SOCstart 充電開始時充電率 101Storage battery 102 Measuring unit 110, 150 Capacity deterioration estimation device (computer)
112Data receiving section 114 First capacity deterioration estimation section 116 Map storage section (table storage section)
152Correction unit 154 Second capacity deterioration estimation unit 156 Correction amount calculation unit I Current value V Voltage value X, Y Correction amount MP1 Map (first table)
MP2 map (second table)
MP3 map (third table)
MP4 map (4th table)
OCV open circuit voltage (terminal open circuit voltage)
SOC charging rate Vth1 threshold voltage (first threshold voltage)
Vth2 threshold voltage (second threshold voltage)
SOHQ Capacity deterioration rate SOHR Resistance deterioration rate C rate Charging rate SOHQ A Estimated capacity deterioration rate (first estimated capacity deterioration rate)
SOHQ B estimated capacity deterioration rate (second estimated capacity deterioration rate)
SOHQ C estimated capacity deterioration rate (third estimated capacity deterioration rate)
SOHQ D estimated capacity deterioration rate (fourth estimated capacity deterioration rate)
SOHQ E estimated capacity deterioration rate (fifth estimated capacity deterioration rate)
SOC end Charging rate at the end of charging SOC start Charging rate at the start of charging
102 測定部
110,150 容量劣化推定装置(コンピュータ)
112 データ受信部
114 第1の容量劣化推定部
116 マップ記憶部(テーブル記憶部)
152 補正部
154 第2の容量劣化推定部
156 補正量算出部
I 電流値
V 電圧値
X,Y 補正量
MP1 マップ(第1のテーブル)
MP2 マップ(第2のテーブル)
MP3 マップ(第3のテーブル)
MP4 マップ(第4のテーブル)
OCV 開回路電圧(端子開放電圧)
SOC 充電率
Vth1 閾値電圧(第1の閾値電圧)
Vth2 閾値電圧(第2の閾値電圧)
SOHQ 容量劣化率
SOHR 抵抗劣化率
Crate 充電レート
SOHQA 推定容量劣化率(第1の推定容量劣化率)
SOHQB 推定容量劣化率(第2の推定容量劣化率)
SOHQC 推定容量劣化率(第3の推定容量劣化率)
SOHQD 推定容量劣化率(第4の推定容量劣化率)
SOHQE 推定容量劣化率(第5の推定容量劣化率)
SOCend 充電終了時充電率
SOCstart 充電開始時充電率 101
112
152
MP2 map (second table)
MP3 map (third table)
MP4 map (4th table)
OCV open circuit voltage (terminal open circuit voltage)
SOC charging rate Vth1 threshold voltage (first threshold voltage)
Vth2 threshold voltage (second threshold voltage)
SOHQ Capacity deterioration rate SOHR Resistance deterioration rate C rate Charging rate SOHQ A Estimated capacity deterioration rate (first estimated capacity deterioration rate)
SOHQ B estimated capacity deterioration rate (second estimated capacity deterioration rate)
SOHQ C estimated capacity deterioration rate (third estimated capacity deterioration rate)
SOHQ D estimated capacity deterioration rate (fourth estimated capacity deterioration rate)
SOHQ E estimated capacity deterioration rate (fifth estimated capacity deterioration rate)
SOC end Charging rate at the end of charging SOC start Charging rate at the start of charging
Claims (8)
- 蓄電池の電流値と電圧値と温度とを計測する測定部から前記電流値と前記電圧値との測定結果を受信するデータ受信部と、第1の容量劣化推定部と、を備え、
前記第1の容量劣化推定部は、
前記蓄電池の抵抗劣化率と容量劣化率の推定値である推定容量劣化率との関係を記憶する第1のテーブルと、前記蓄電池の充電率と前記蓄電池の未劣化時の所定温度における抵抗値である基準抵抗値との関係を記憶する第2のテーブルと、前記蓄電池の温度と前記基準抵抗値に対する比率である温度換算係数との関係を記憶する第3のテーブルと、前記充電率と前記蓄電池の端子開放電圧との関係を記憶する第4のテーブルと、をテーブル記憶部から読み出す機能と、
充電開始時における前記充電率である充電開始時充電率と前記基準抵抗値と前記抵抗劣化率との関係を定める第1の関係式と、充電終了時における前記充電率である充電終了時充電率と前記基準抵抗値と前記抵抗劣化率との関係を定める第2の関係式と、前記充電開始時充電率と前記充電終了時充電率と充電開始時から充電終了時までの電気量である充電電気量と第1の推定容量劣化率との関係を定める第3の関係式と、前記抵抗劣化率と前記第1の推定容量劣化率との関係を定める第4の関係式と、に基づいて前記第1の推定容量劣化率を算出する機能と、を備える
ことを特徴とする容量劣化推定装置。 comprising: a data receiving unit that receives measurement results of the current value and the voltage value from a measuring unit that measures the current value, voltage value, and temperature of the storage battery; and a first capacity deterioration estimation unit;
The first capacity deterioration estimator includes:
A first table that stores a relationship between a resistance deterioration rate of the storage battery and an estimated capacity deterioration rate that is an estimated value of the capacity deterioration rate, and a charging rate of the storage battery and a resistance value at a predetermined temperature when the storage battery is not deteriorated. a second table that stores a relationship between a certain reference resistance value, a third table that stores a relationship between the temperature of the storage battery and a temperature conversion coefficient that is a ratio to the reference resistance value, and a third table that stores the relationship between the charging rate and the storage battery. a fourth table that stores the relationship between the terminal open circuit voltage and the terminal open circuit voltage;
a first relational expression that defines the relationship between the charging rate at the start of charging, which is the charging rate at the start of charging, the reference resistance value, and the resistance deterioration rate; and the charging rate at the end of charging, which is the charging rate at the end of charging. and a second relational expression that defines the relationship between the reference resistance value and the resistance deterioration rate, the charging rate at the start of charging, the charging rate at the end of charging, and the amount of electricity from the start of charging to the end of charging. Based on a third relational expression that determines the relationship between the amount of electricity and the first estimated capacity deterioration rate, and a fourth relational expression that determines the relationship between the resistance deterioration rate and the first estimated capacity deterioration rate. A capacity deterioration estimating device comprising: a function of calculating the first estimated capacity deterioration rate. - 前記第2のテーブルは、前記充電率と前記基準抵抗値と前記蓄電池に対する充電レートと、の関係を記憶するものであり、
前記第1の関係式は、前記充電開始時充電率と前記基準抵抗値と前記抵抗劣化率と充電開始時における前記充電レートである充電開始時充電レートとの関係を定めるものであり、
前記第2の関係式は、前記充電終了時充電率と前記基準抵抗値と前記抵抗劣化率と充電終了時における前記充電レートである充電終了時充電レートとの関係を定めるものである
ことを特徴とする請求項1に記載の容量劣化推定装置。 The second table stores the relationship between the charging rate, the reference resistance value, and the charging rate for the storage battery,
The first relational expression defines the relationship between the charging rate at the start of charging, the reference resistance value, the resistance deterioration rate, and the charging rate at the start of charging, which is the charging rate at the start of charging,
The second relational expression defines the relationship between the charging rate at the end of charging, the reference resistance value, the resistance deterioration rate, and the charging rate at the end of charging, which is the charging rate at the end of charging. The capacity deterioration estimating device according to claim 1. - 前記第1の容量劣化推定部は、所定の第1の計測条件が満足されたことを条件として第1の推定容量劣化率を算出する
ことを特徴とする請求項1に記載の容量劣化推定装置。 The capacity deterioration estimating device according to claim 1, wherein the first capacity deterioration estimation unit calculates the first estimated capacity deterioration rate on the condition that a predetermined first measurement condition is satisfied. . - 前記第1の計測条件は、前記蓄電池の充電完了直前の電圧が所定の第1の閾値電圧以上であるという条件である
ことを特徴とする請求項3に記載の容量劣化推定装置。 The capacity deterioration estimating device according to claim 3, wherein the first measurement condition is that the voltage of the storage battery immediately before completion of charging is equal to or higher than a predetermined first threshold voltage. - 所定の第2の計測条件が満たされた場合に、前記電圧値に基づいて第2の推定容量劣化率を算出する第2の容量劣化推定部と、
前記第1および第2の推定容量劣化率に基づいて、補正量を算出する補正量算出部と、
前記第1の推定容量劣化率と、前記補正量と、に基づいて第3の推定容量劣化率を算出する補正部と、をさらに備える
ことを特徴とする請求項1に記載の容量劣化推定装置。 a second capacity deterioration estimation unit that calculates a second estimated capacity deterioration rate based on the voltage value when a predetermined second measurement condition is satisfied;
a correction amount calculation unit that calculates a correction amount based on the first and second estimated capacity deterioration rates;
The capacity deterioration estimating device according to claim 1, further comprising: a correction unit that calculates a third estimated capacity deterioration rate based on the first estimated capacity deterioration rate and the correction amount. . - 所定の第2の計測条件が満たされた場合に、前記電圧値に基づいて第2の推定容量劣化率を算出する第2の容量劣化推定部と、
前記第1および第2の推定容量劣化率に基づいて、前記第1のテーブルを修正する補正部と、をさらに備える
ことを特徴とする請求項1に記載の容量劣化推定装置。 a second capacity deterioration estimation unit that calculates a second estimated capacity deterioration rate based on the voltage value when a predetermined second measurement condition is satisfied;
The capacity deterioration estimating device according to claim 1, further comprising: a correction unit that corrects the first table based on the first and second estimated capacity deterioration rates. - 前記第2の容量劣化推定部は、前記充電開始時充電率と、前記充電終了時充電率と、前記充電電気量と、に基づいて前記第2の推定容量劣化率を算出する
ことを特徴とする請求項5または6に記載の容量劣化推定装置。 The second capacity deterioration estimation unit calculates the second estimated capacity deterioration rate based on the charging rate at the start of charging, the charging rate at the end of charging, and the amount of electricity charged. The capacity deterioration estimating device according to claim 5 or 6. - 前記第2の計測条件は、前記蓄電池の充電完了直前の前記電圧値が第1の閾値電圧以上であり、かつ、充電開始直前の前記電圧値が所定の第2の閾値電圧以下であるという条件である
ことを特徴とする請求項7に記載の容量劣化推定装置。 The second measurement condition is that the voltage value immediately before the completion of charging of the storage battery is equal to or higher than a first threshold voltage, and the voltage value immediately before the start of charging is equal to or lower than a predetermined second threshold voltage. The capacity deterioration estimating device according to claim 7.
Applications Claiming Priority (2)
| Application Number | Priority Date | Filing Date | Title |
|---|---|---|---|
| JP2022135627 | 2022-08-29 | ||
| JP2022-135627 | 2022-08-29 |
Publications (1)
| Publication Number | Publication Date |
|---|---|
| WO2024048033A1 true WO2024048033A1 (en) | 2024-03-07 |
Family
ID=90099414
Family Applications (1)
| Application Number | Title | Priority Date | Filing Date |
|---|---|---|---|
| PCT/JP2023/023085 WO2024048033A1 (en) | 2022-08-29 | 2023-06-22 | Capacity deterioration estimation device |
Country Status (1)
| Country | Link |
|---|---|
| WO (1) | WO2024048033A1 (en) |
Citations (5)
| Publication number | Priority date | Publication date | Assignee | Title |
|---|---|---|---|---|
| WO2018179852A1 (en) * | 2017-03-30 | 2018-10-04 | 日立オートモティブシステムズ株式会社 | Storage battery control device and control method |
| JP2019103157A (en) * | 2017-11-28 | 2019-06-24 | 株式会社デンソー | Battery control system |
| WO2020218184A1 (en) * | 2019-04-26 | 2020-10-29 | 株式会社Gsユアサ | Estimation device and estimation method |
| WO2021049134A1 (en) * | 2019-09-11 | 2021-03-18 | 株式会社日立製作所 | Battery monitoring device and battery system |
| WO2022024994A1 (en) * | 2020-07-29 | 2022-02-03 | 日立建機株式会社 | Electric powered working machine |
-
2023
- 2023-06-22 WO PCT/JP2023/023085 patent/WO2024048033A1/en unknown
Patent Citations (5)
| Publication number | Priority date | Publication date | Assignee | Title |
|---|---|---|---|---|
| WO2018179852A1 (en) * | 2017-03-30 | 2018-10-04 | 日立オートモティブシステムズ株式会社 | Storage battery control device and control method |
| JP2019103157A (en) * | 2017-11-28 | 2019-06-24 | 株式会社デンソー | Battery control system |
| WO2020218184A1 (en) * | 2019-04-26 | 2020-10-29 | 株式会社Gsユアサ | Estimation device and estimation method |
| WO2021049134A1 (en) * | 2019-09-11 | 2021-03-18 | 株式会社日立製作所 | Battery monitoring device and battery system |
| WO2022024994A1 (en) * | 2020-07-29 | 2022-02-03 | 日立建機株式会社 | Electric powered working machine |
Similar Documents
| Publication | Publication Date | Title |
|---|---|---|
| CN110988690B (en) | Battery state of health correction method, device, management system and storage medium | |
| CN108369258B (en) | State estimation device and state estimation method | |
| CN110988720B (en) | Battery state of charge determining method, device, management system and storage medium | |
| US7095211B2 (en) | Battery gas gauge | |
| JP4511600B2 (en) | Apparatus, method and system for estimating current state and current parameters of electrochemical cell, and recording medium | |
| EP3064952B1 (en) | Energy storage device management apparatus, energy storage device management method, energy storage device module, energy storage device management program, and movable body | |
| WO2016059869A1 (en) | Secondary battery charge state estimation device and secondary battery charge state estimation method | |
| KR20190027609A (en) | Apparatus and method for estimating state of charge for battery and method thereof | |
| CN109143102B (en) | Method for estimating SOC (state of charge) of lithium battery through ampere-hour integration | |
| US20190004115A1 (en) | Battery state estimation device, battery control device, battery system, battery state estimation method | |
| CN110967644A (en) | Battery pack SOC correction method, battery management system and vehicle | |
| CN111707955B (en) | Method, apparatus and medium for estimating remaining life of battery | |
| US11835587B2 (en) | Method for determining full-charge capacity of battery pack, method for determining state of health of battery pack, system, and apparatus | |
| CN115808638A (en) | Charge state calculation method and device, storage medium and battery management system | |
| US11422196B2 (en) | Device for estimating state of charge of battery | |
| WO2024048033A1 (en) | Capacity deterioration estimation device | |
| CN113625174A (en) | Lithium ion battery SOC and capacity joint estimation method | |
| US20220285958A1 (en) | Method and device for estimating soc of battery pack, and battery management system | |
| CN115113061A (en) | Method and related device for correcting SOC of battery | |
| TW202410533A (en) | Capacity degradation estimation device | |
| CN113933730B (en) | SOH and battery residual value calculation method, device, equipment and medium | |
| CN114935722B (en) | Lithium battery side end collaborative management method based on digital twin | |
| CN117277520B (en) | SOC-SOH combined calculation method and device for new energy storage power station | |
| JP2023030328A (en) | Battery state estimation method and battery state estimation device | |
| He et al. | An Online OCV Calibration-Based Adaptive SOC Estimation Approach for Lithium Battery |
Legal Events
| Date | Code | Title | Description |
|---|---|---|---|
| 121 | Ep: the epo has been informed by wipo that ep was designated in this application |
Ref document number: 23859803 Country of ref document: EP Kind code of ref document: A1 |