WO2024034243A1 - 情報処理装置、制御システム、探索方法、および探索プログラム - Google Patents
情報処理装置、制御システム、探索方法、および探索プログラム Download PDFInfo
- Publication number
- WO2024034243A1 WO2024034243A1 PCT/JP2023/020964 JP2023020964W WO2024034243A1 WO 2024034243 A1 WO2024034243 A1 WO 2024034243A1 JP 2023020964 W JP2023020964 W JP 2023020964W WO 2024034243 A1 WO2024034243 A1 WO 2024034243A1
- Authority
- WO
- WIPO (PCT)
- Prior art keywords
- control
- feedback control
- value
- information processing
- search
- Prior art date
- Legal status (The legal status is an assumption and is not a legal conclusion. Google has not performed a legal analysis and makes no representation as to the accuracy of the status listed.)
- Ceased
Links
Images


Classifications
-
- F—MECHANICAL ENGINEERING; LIGHTING; HEATING; WEAPONS; BLASTING
- F23—COMBUSTION APPARATUS; COMBUSTION PROCESSES
- F23G—CREMATION FURNACES; CONSUMING WASTE PRODUCTS BY COMBUSTION
- F23G5/00—Incineration of waste; Incinerator constructions; Details, accessories or control therefor
- F23G5/50—Control or safety arrangements
-
- G—PHYSICS
- G05—CONTROLLING; REGULATING
- G05B—CONTROL OR REGULATING SYSTEMS IN GENERAL; FUNCTIONAL ELEMENTS OF SUCH SYSTEMS; MONITORING OR TESTING ARRANGEMENTS FOR SUCH SYSTEMS OR ELEMENTS
- G05B13/00—Adaptive control systems, i.e. systems automatically adjusting themselves to have a performance which is optimum according to some preassigned criterion
- G05B13/02—Adaptive control systems, i.e. systems automatically adjusting themselves to have a performance which is optimum according to some preassigned criterion electric
Definitions
- the present invention relates to a technique for adjusting control parameters in feedback control.
- Feedback control is a control method that controls input values so that output values and target values match, and has been used for a long time for automatic control of various devices. In order to perform appropriate feedback control, it is necessary to appropriately set control parameters, and techniques for appropriately setting control parameters are also conventionally known.
- Patent Document 1 discloses an exhaust gas denitrification control device that includes an injection amount feedback control means and a parameter adjustment means.
- the injection amount feedback control means calculates the injection amount of the removal material for removing nitrogen oxides from the combustion exhaust gas discharged from the combustion furnace.
- the parameter adjustment means adjusts the control parameters of the feedback control based on the furnace mouth temperature of the combustion furnace.
- the above conventional technology calculates appropriate control parameters for feedback control of the injection amount from the furnace mouth temperature on the premise that there is a correlation between the furnace mouth temperature and the denitrification rate, and between the furnace mouth temperature and the process delay. . Therefore, the above-mentioned conventional technology cannot be applied to anything other than feedback control of the blowing amount. As described above, there is no conventionally known method for adjusting control parameters that can be commonly applied to various types of feedback control. For this reason, control parameters for feedback control have often been determined based on the operator's experience and intuition.
- An object of one aspect of the present invention is to provide an information processing device and the like that can perform stable feedback control without being influenced by human subjectivity.
- an information processing device calculates a predicted distribution of a function that indicates a relationship between a control parameter in feedback control and a result of feedback control to which the control parameter is applied.
- the control device includes a predicted distribution calculation unit, and a search unit that searches for an optimal value candidate for the control parameter based on the predicted distribution.
- a control system includes a control device that performs feedback control on a device to be controlled, a control parameter in the feedback control, and a control parameter that applies the control parameter.
- an information processing device searches for candidates for the optimal value of the control parameter based on a predicted distribution of a function that indicates a relationship with the result of the feedback control, the control device applying the candidate to determine the optimal value of the control parameter. Feedback control is performed on the device.
- a search method is a search method executed by one or more information processing devices in order to solve the above problem, and includes a control parameter in feedback control and a search method in which the control parameter is applied.
- the method includes a predictive distribution calculation step of calculating a predictive distribution of a function indicating a relationship with the result of the feedback control, and a searching step of searching for an optimal value candidate for the control parameter based on the predictive distribution.
- FIG. 1 is a block diagram showing an example of the configuration of main parts of an information processing device according to an embodiment of the present invention.
- FIG. 1 is a diagram showing an overview of a control system including the information processing device.
- FIG. 3 is a diagram illustrating an example of a display screen that accepts input of result data. It is a figure showing an example of a display screen of a search result. It is a figure which shows the histogram of the measurement value (PV) measured in the period when feedback control was performed. It is a flowchart which shows an example of the process which the said information processing apparatus performs.
- PV measurement value
- FIG. 2 is a diagram showing an overview of the control system 9.
- the control system 9 includes an information processing device 1, a database 2, a control device 3, a device 4, and a measuring device 5. Note that the information processing device 1 may be installed in a remote location away from the control device 3 and the equipment 4.
- the information processing device 1 is a device for adjusting control parameters in the feedback control. Although details will be described later, the information processing device 1 searches for optimal value candidates for control parameters based on the predicted distribution of a function that indicates the relationship between a control parameter in feedback control and a result of feedback control to which the control parameter is applied. do.
- the user of the control system 9 can perform stable feedback control without being influenced by the subjectivity of the user.
- the control device 3 is a device that performs feedback control on the device 4 to be controlled. Specifically, the control device 3 performs feedback using PID (Proportional Integral Differential) control.
- PID control the manipulated variable (MV) is calculated using three elements: the deviation (DV: deviation) between the set value (SV: Set Value) and the measured value (PV: Process Value), the integral of DV, and the differentiation of DV. ) to determine.
- the formula for calculating the manipulated variable (MV) in PID control is expressed as follows.
- MV P ⁇ DV+(60/I) ⁇ (integral of DV)+(D/60) ⁇ (differential of DV)
- P, I, and D are control parameters that determine how much emphasis is placed on proportional control, integral control, and differential control, respectively.
- the information processing device 1 searches for optimal values of these control parameters. Note that the information processing device 1 does not necessarily need to search for optimal values for all of the control parameters P, I, and D, and may search for at least one of them.
- the operating end to which the manipulated variable (MV) calculated by the above calculation formula is applied is the device 4 or its component.
- the valve may be used as the operating end, and the opening degree of the valve may be used as the manipulated variable (MV).
- the inverter may be used as the operating end.
- the control device 3 determines the manipulated variable (MV) of each operating end, but in this case, the information processing device 1 determines the control parameter for each operating end.
- a candidate for the optimal value of may be detected.
- the information processing device 1 can detect at once a candidate for an optimal value of a control parameter used for controlling cooling and a candidate for an optimal value for a control parameter used for controlling heating.
- the information processing device 1 can also detect candidates for the optimal value of the control parameters used for heating control after detecting candidates for the optimal values of the control parameters used for controlling cooling.
- the information processing device 1 can also detect candidates for the optimal value of the control parameters used for cooling control after detecting candidates for the optimal values of the control parameters used for controlling heating.
- the information processing device 1 may detect optimal value candidates for the control parameters for each condition. For example, when the device 4 is operating under the first operating condition, the control device 3 controls the device 4 with a manipulated variable (MV) calculated using the first control parameter. On the other hand, when the device 4 is operating under the second operating condition, the control device 3 may control the device 4 with the manipulated variable (MV) calculated using the second control parameter. In this case, the information processing device 1 can detect each of the optimal value candidates for the first control parameter and the optimal value candidates for the second control parameter at the same time.
- MV manipulated variable
- the information processing device 1 can also detect an optimal value candidate for the second control parameter after detecting an optimal value candidate for the first control parameter. Similarly, the information processing device 1 can also detect an optimal value candidate for the first control parameter after detecting an optimal value candidate for the second control parameter.
- the plant process in the control system 9 is, for example, combustion, chemical reaction, or the like. Note that the control system 9 is not limited to plant processes, and can be applied to control any object.
- a measurement end in the control system 9 is for measuring a measured value (PV), and is realized by the measurement device 5, for example.
- the measuring device 5 may be configured according to the object to be measured. For example, if the measured value (PV) is a pressure, a pressure gauge may be used as the measuring device 5, and if the measured value (PV) is a temperature, a thermometer may be used as the measuring device 5.
- the measured value (PV) measured by the measuring device 5 is used to calculate the deviation (DV) as described above, and is also stored in the database 2 and used by the information processing device 1 to search for control parameters. Note that the database 2 may be included in the information processing device 1 or the control device 3.
- the control system 9 includes the control device 3 that performs feedback control on the device 4 to be controlled, and the information processing device 1.
- the information processing device 1 searches for candidates for optimal values of control parameters based on a predicted distribution of a function that indicates the relationship between a control parameter in feedback control and a result of feedback control to which the control parameter is applied.
- the control device 3 applies the candidates detected by the information processing device 1 to perform feedback control on the device 4 to be controlled. According to this control system 9, it becomes possible to perform stable feedback control without being influenced by human subjectivity. Furthermore, since the time required to examine control parameters can be reduced, it also contributes to improving the efficiency of management work for the control system 9.
- the feedback control for which the information processing device 1 detects candidates for optimal values of control parameters may be, for example, feedback control in a waste incineration facility.
- waste incineration facilities incinerate a wide variety of wastes, and the properties (for example, moisture content) of these wastes are not constant, so the operating conditions are constantly changing. For this reason, feedback control according to the operating conditions is required, but it has been difficult to perform highly accurate control due to factors such as the instability of the properties of the waste.
- candidates for the optimum value of the control parameter are searched based on the predicted distribution, so it is possible to perform stable feedback control.
- the device 4 is a device placed in the waste incineration facility.
- the device 4 may be an incinerator, a grate for transporting waste in the incinerator, a combustion air supply device, an exhaust gas treatment device, or the like.
- the waste incineration facility may be equipped with power generation equipment that generates electricity using the exhaust heat of the incinerator, and in this case, the equipment 4 is equipment related to the power generation equipment (for example, a boiler, etc.). It may be.
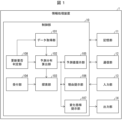
- FIG. 1 is a block diagram showing an example of the configuration of main parts of the information processing device 1.
- the information processing device 1 includes a control section 10 that centrally controls each section of the information processing device 1, and a storage section 11 that stores various data used by the information processing device 1.
- the information processing device 1 also includes a communication unit 12 for the information processing device 1 to communicate with other devices, an input unit 13 that receives input of various data to the information processing device 1, and an input unit 13 for the information processing device 1 to output various data. It is equipped with an output section 14 for outputting data.
- the control unit 10 also includes a data acquisition unit 101, a predicted distribution calculation unit 102, a search unit 103, a reception unit 104, a predicted value presentation unit 105, a reason presentation unit 106, a change mode presentation unit 107, and an update necessity determination unit. 108 are included.
- the data acquisition unit 101 acquires result data that associates control parameters in feedback control with results of feedback control to which the control parameters are applied. Further, after the search unit 103 detects a candidate for the optimal value of the control parameter, the data acquisition unit 101 acquires result data indicating the result of feedback control to which the candidate is applied.
- the predicted distribution calculation unit 102 calculates a predicted distribution of a function that indicates the relationship between a control parameter in feedback control and a result of feedback control to which the control parameter is applied. In addition, when the data acquisition unit 101 acquires new result data (indicating the result of feedback control to which the candidates detected by the search unit 103 are applied) after calculating the prediction distribution, the prediction distribution calculation unit 102 calculates the Update the predicted distribution using new result data.
- the search unit 103 searches for optimal value candidates for the control parameters based on the predicted distribution calculated by the predicted distribution calculation unit 102. Note that the details of the method of calculating and updating the predicted distribution and the method of searching for candidates will be described later.
- the reception unit 104 accepts a selection of whether the search unit 103 should focus on searching for candidates: around a value where the result of feedback control is known or in a range where the result of feedback control is unknown. . Note that the user's operation for the selection may be received via the input unit 13, for example. Then, when the reception unit 104 receives the above selection, the search unit 103 searches for candidates according to the selection.
- the reception unit 104 is not an essential configuration, when the information processing device 1 includes the reception unit 104, the user of the information processing device 1 performs a search focusing on the vicinity of a known value as a result of feedback control. You can choose that. In this case, it is possible to detect candidates that may be locally optimal solutions but can be expected to provide stable control results. Further, the user of the information processing device 1 can also choose to perform a search with emphasis on a range in which the result of feedback control is unknown. In this case, although there is a possibility that the control results will be hit or miss, candidates that can be expected to greatly contribute to the detection of the global optimal solution can be detected.
- the predicted value presentation unit 105 presents the predicted value as a result of feedback control to which the candidates detected by the search unit 103 are applied. Although details will be described later, the predicted value presentation unit 105 calculates the predicted value from the mean and variance of the predicted distribution.
- the predicted value presentation unit 105 is not an essential configuration, if the information processing device 1 is equipped with the predicted value presentation unit 105, it is possible to apply the predicted value of the result of feedback control to which the detected candidate is applied. It is possible to present useful information to the user as material for determining whether or not the application is accepted.
- the reason presentation unit 106 presents the reason why the candidate detected by the search unit 103 is valid. Although details will be described later, the reason presentation unit 106 specifies the reason based on the mean and variance of the prediction distribution.
- the reason presentation unit 106 is also not an essential configuration. However, when the information processing device 1 includes the reason presentation unit 106, it is possible to present to the user information useful as a basis for determining whether or not to apply the detected candidate, which is the reason why the detected candidate is valid. .
- the change mode presentation unit 107 presents information indicating how the manipulated variable (MV) for the device to be controlled changes when the candidate detected by the search unit 103 is applied. Although the details will be described later, the change mode presentation unit 107 determines which manipulated variable (MV) is based on the difference between the values of the control parameters to be compared (coefficients P, I, and D in the above calculation formula) and the candidate. Identify how things change.
- the change mode presentation unit 107 is also not an essential configuration. However, when the information processing device 1 includes the change mode presentation unit 107, the judgment as to whether or not to apply the detected candidate is information indicating how the amount of operation changes when the detected candidate is applied. Information useful as material can be presented to the user.
- the update necessity determination unit 108 acquires the results of the feedback control to which the candidates detected by the search unit 103 are applied, and performs a process of determining whether or not to update the predicted distribution based on the acquired results every predetermined period. Repeat.
- the update necessity determination unit 108 is not an essential configuration. However, if the information processing device 1 includes the update necessity determining unit 108, it is possible to automatically continue updating the predicted distribution and detecting candidates until the feedback control results in a desired result. Furthermore, when the feedback control results in a desired result, the updating of the predicted distribution and the detection of candidates can be automatically terminated. In addition, when the information processing device 1 includes the update necessity determination unit 108, when the feedback control result becomes desired and the result is no longer desired, the prediction distribution is updated and the candidate is updated. Detection can be restarted automatically.
- the update necessity determining unit 108 determines whether there is any problem in the operation of the device 4 after the candidate detected by the searching unit 103 is applied, and if it is determined that there is a problem, a process of changing the control parameters is performed. You can also go there. Thereby, even if the detected candidate is not valid, the influence can be kept to a minimum. Note that a processing block separate from the update necessity determination unit 108 may be provided to perform these processings.
- the information processing device 1 instead of finding a function that indicates the relationship between a control parameter and a control result, calculates a predicted distribution of the function, and based on the calculated predicted distribution, the information processing device 1 calculates the optimum value of the control parameter.
- the system uses a structure that searches for candidates.
- control parameters that are considered appropriate can be automatically determined from the predicted distribution.
- control parameters it becomes possible to perform stable feedback control without being influenced by human subjectivity.
- the predicted distribution calculation unit 102 uses the result data acquired by the data acquisition unit 101 to calculate a predicted distribution of a function indicating the relationship between the control parameters and the control results. Note that this function is hereinafter referred to as an evaluation function f( ⁇ ). Further, when new result data (for example, result data indicating the result of feedback control to which the candidate detected by the search unit 103 is applied) is acquired, the prediction distribution calculation unit 102 adjusts the result data so that the result data is reflected. Update the predicted distribution.
- control variable The relationship between the control variable and the control result is expressed using Gaussian noise ⁇ n ⁇ ⁇ (0, ⁇ ).
- K * k ( ⁇ , ⁇ )
- the parameters of the kernel function are ⁇ k .
- the average function ⁇ ( ⁇ ) indicates the average value of the evaluation function predicted from the result data.
- the variance function ⁇ ( ⁇ ) is the variance of the evaluation function predicted from the result data.
- ⁇ ( ⁇ ) indicates prediction uncertainty, and its value tends to increase in areas where result data are lacking. If ⁇ is large, it can be said that the prediction is uncertain, and it can be said that the result data necessary to increase the certainty of the prediction is insufficient.
- the kernel function included in the dispersion function ⁇ ( ⁇ ) and the parameter ⁇ k of the kernel function affect the calculation of the predicted distribution. When calculating the predicted distribution, the parameter ⁇ k is optimized.
- the optimization method is not particularly limited, and, for example, various optimization methods used in general Bayesian optimization may be applied.
- the search unit 103 searches for optimal control parameter candidates in order to find the optimal control parameters. Specifically, the search unit 103 maximizes the acquisition function a( ⁇ ) using the average function ⁇ ( ⁇ ) and the variance function ⁇ ( ⁇ ), as shown in formulas (4) and (5) below. Search for control parameters. The control parameters detected through this search become optimal control parameter candidates. This search is based on the UCB (Upper Confidence Bound) strategy.
- ⁇ in Equation (5) is a parameter for adjusting search and utilization.
- the accepting unit 104 accepts a selection of whether to perform the search with emphasis on the area around the value where the result of feedback control is known or the range where the result of feedback control is unknown
- the searching unit 103 selects ⁇ . is set to a value according to the accepted selection, and searches for candidates.
- optimal control parameter candidates may be searched for using a PI (Probability of Improvement) strategy or an EI (Expected Improvement) strategy.
- a case where a control parameter that minimizes the value of the evaluation function is determined as an optimal control parameter is, for example, a case where, for a task that is preferably completed in a short time, the time required to complete the task is set as the evaluation value.
- the optimal value candidates for the control parameters detected by the search unit 103 are presented to the user. Feedback control applying the candidate is then started, and measured values (PV) measured during the period in which the control is performed are accumulated in the database 2.
- PV measured values
- the update necessity determining unit 108 acquires from the database 2 a measured value (PV) indicating the result of feedback control to which the candidate detected by the searching unit 103 is applied, and updates the predicted distribution based on the acquired measured value (PV). Determine whether or not to do so. For example, the update necessity determination unit 108 calculates an evaluation value indicating the validity of the applied candidate using the acquired measurement value (PV), and if the calculated evaluation value is less than a predetermined threshold value, , it may be determined to update the predicted distribution.
- PV measured value
- the update necessity determination unit 108 may generate result data by associating the calculated evaluation value with the acquired measurement value.
- the data acquisition unit 101 acquires the generated result data and outputs it to the prediction distribution calculation unit 102 together with the previously acquired result data.
- the predicted distribution calculation unit 102 updates the predicted distribution using the newly acquired result data and the previously acquired result data.
- the evaluation value may be calculated by the update necessity determination unit 108 or the data acquisition unit 101, or by another device or a user. Further, a method for calculating the evaluation value will be described later.
- the search unit 103 searches for the optimal value of the control parameter based on the evaluation function configured based on the predicted distribution updated by the predicted distribution calculation unit 102. In this way, by repeatedly updating the predicted distribution and searching for the optimal value, it becomes possible to detect the optimal control parameter.
- the data acquisition unit 101 may display a display screen as shown in FIG. 3 and allow the user to input feedback control result data.
- FIG. 3 is a diagram showing an example of a display screen that accepts input of result data. As described below, by displaying such a display screen, the user can easily input result data necessary for optimization and make various settings.
- the display screen A1 shown in FIG. 3 includes an address input box A11, a reference button A12, a decision button A13, and a result data display area A14.
- Address input box A11 is for inputting an address specifying a file containing result data.
- the reference button A12 is used to refer to a file containing result data. The user can specify the file to be used by inputting the address of the file containing the result data into the address input box A11, or by operating the reference button A12 and specifying the reference destination.
- a CSV Common Separated Variables
- the user can confirm the file to be used by operating the OK button A13.
- the result data read from the confirmed file is displayed in the result data display area A14. That is, the data acquisition unit 101 reads result data (values of control parameters and their evaluation values) from the specified file, and displays these values in the result data display area A14.
- result data values of control parameters and their evaluation values
- each value of the control parameters P, I, and D and the evaluation value calculated from the measured value (PV) measured during the period when the feedback control to which the value was applied are applied. They are displayed in correspondence.
- the display destination of the display screen A1 is not particularly limited.
- the data acquisition unit 101 may display the display screen A1 on the output unit 14, or may display the display screen A1 on another display device that can communicate with the information processing device 1 by wire or wirelessly.
- A1 may be displayed.
- the process of displaying the display screen A1 may be performed by the reception unit 104, or a processing block that performs the process of displaying the display screen may be separately provided and the processing block may perform the process.
- the display screen A1 also includes various information for accepting optimization settings. Specifically, the display screen A1 includes a manufacturer specification box A15, a calculation parameter specification box A16, an affirmative button A17, and a negative button A18.
- the manufacturer specification box A15 is for specifying the manufacturer of the control system 9 (more specifically, the manufacturer of the DCS: Distributed Control System used in the control system 9).
- the method of expressing control parameters for PID control may differ depending on the manufacturer, by accepting the manufacturer's specifications, it is possible to optimize the control parameters expressed in a method according to the manufacturer.
- Calculation parameter specification box A16 specifies whether to focus on searching for optimal value candidates for control parameters: around values where the results of feedback control are known, or in areas where results of feedback control are unknown. This is for accepting selections.
- any value from 1 to 3 can be entered in the calculation parameter specification box A16.
- a value of "1" is a value that specifies that emphasis is placed on utilization, that is, that emphasis is placed on searching around a value for which the result of feedback control is known.
- a value of "3" is a value specifying that emphasis is placed on searching a range in which the result of feedback control is unknown.
- the value "2" is a value specifying that a standard search is performed that is neither biased toward utilization nor search. This allows the user to perform a search in a desired manner.
- the method of specifying the search mode is not limited to this example, and for example, the user may specify the value of ⁇ in the above-mentioned formula (5).
- the user checks whether the result data displayed in the result data display area A14 on the display screen A1 is appropriate. The user also confirms whether the input contents in the manufacturer specification box A15 and the calculation parameter specification box A16 in the "Settings" column are valid. Then, if the user determines that both are appropriate, the user operates the affirmation button A17. As a result, the prediction distribution calculation unit 102 starts calculating a prediction distribution, and subsequently the search unit 103 searches for candidates for optimal values of the control parameters. Furthermore, if the user wishes to cancel the optimization, he or she may operate the negative button A18.
- the search unit 103 may display a display screen as shown in FIG. 4 to present the search results to the user.
- FIG. 4 is a diagram showing an example of a search result display screen.
- the display screen A2 shown in FIG. 4 includes a candidate display area A21 that displays candidates for optimal values of control parameters detected by the search unit 103.
- the values of three control parameters P, I, and D are displayed in the candidate display area A21.
- the display screen A2 includes a "reference information” column.
- This column includes three items (A22 to A24): expected evaluation value, proposal reason, and change mode of the manipulated variable.
- the predicted evaluation value item A22 presents the predicted evaluation value calculated by the predicted value presentation unit 105 when the control parameters shown in the candidate display area A21 are applied. Specifically, the predicted value presentation unit 105 identifies the average and variance of the evaluation value when the control parameters detected as candidates are applied from the latest predicted distribution calculated by the predicted distribution calculation unit 102, and ⁇ standard deviation (square root of variance)" is calculated as the predicted value of the evaluation value. For example, if the average is 83 and the standard deviation is 12, the expected evaluation value will be "83 ⁇ 12" as shown in the figure. Note that the predicted value expressed using the standard deviation is only an example of reference information, and various information can be applied as the reference information. For example, the calculated variance value may be displayed as reference information.
- the proposal reason item A23 presents a reason why it is preferable to apply the control parameter shown in the candidate display area A21, which is specified by the reason presentation unit 106. Specifically, item A23 displays a message saying, "Although the certainty is low, a high score can be expected.” The content of the message may be determined based on the average and variance described above. For example, the reason presentation unit 106 may present a message to the effect that a high score can be expected if the average is greater than or equal to a predetermined threshold.
- the reason presentation unit 106 may determine the message to be presented according to a rule that if the variance is equal to or greater than a predetermined threshold, a message indicating that the certainty is low is presented, and if the variance is less than the threshold, a message is presented indicating that the certainty is high. In this case, a message as shown in FIG. 4 is presented when the average and variance are both greater than or equal to the threshold. On the other hand, if the average is greater than or equal to the threshold but the variance is less than the threshold, the reason presentation unit 106 may present a message to the effect that the certainty is high and a high score can be expected.
- the reason presenting unit 106 may present a message to the effect that a high score cannot be expected, but the certainty is high. Note that if the average is less than the threshold and the variance is greater than or equal to the threshold, the reason presentation unit 106 may display that there is no reason for the proposal or that it is desirable to add result data.
- the change mode item A24 of the operation amount presents the change mode of the operation amount (MV in FIG. 2) before and after applying the control parameter shown in the candidate display area A21, which is specified by the change mode presentation unit 107. There is. Specifically, the manipulated variable (MV) with respect to the deviation (DV) becomes larger, the amount of correction of the manipulated variable (MV) to make the deviation (DV) zero becomes larger, and the manipulated variable (MV) A message is displayed indicating that the rate of change will be slower.
- control parameters include the values of the coefficients P, I, and D in the calculation formula for the manipulated variable (MV) described above.
- feedback control calculates the manipulated variable (MV) for the device to be controlled from the deviation (DV) between the set value (SV) and the measured value (PV) and the above coefficient, as shown in the calculation formula. It is assumed that
- the change mode presentation unit 107 displays the image shown in FIG. A message indicating that the manipulated variable (MV) will increase may be presented.
- the change mode presentation unit 107 may present a message to the effect that the manipulated variable (MV) becomes smaller.
- the change mode presenting unit 107 determines the amount of operation (MV) to make the deviation (DV) zero, as shown in FIG. A message may be presented to the effect that the amount of correction will be increased. On the other hand, when I increases, the change mode presentation unit 107 may present a message to the effect that the correction amount becomes smaller.
- the change mode presentation unit 107 presents a message that the change speed of the manipulated variable (MV) becomes slower as shown in FIG. You may.
- the change mode presentation unit 107 may present a message to the effect that the change speed becomes faster.
- the user may operate the end button A25 to temporarily end the optimization. Thereafter, the control parameters shown in the candidate display area A21 are transmitted to the control device 3, and feedback control using the control parameters is performed.
- the evaluation value of the feedback control result may be appropriately used depending on the object, purpose, etc. of the feedback control.
- the information indicating the result of feedback control may include a value within a predetermined tolerance range among the measured values (PV) measured during the period in which the feedback control was performed. You may use the evaluation value which shows the ratio of the measured value (PV) which is. This makes it possible to stabilize the measured value (PV) by detecting a control parameter candidate with a high proportion of measured values within the allowable range and applying this to feedback control.
- calculation of the evaluation value may be performed by the data acquisition unit 101 or the update necessity determination unit 108. Additionally, a processing block for calculating evaluation values may be provided separately from these, or evaluation values (or result data including evaluation values) calculated by another device or user may be input to the information processing device 1. .
- the predetermined tolerance range is calculated by subtracting the standard deviation of the measured values (PV) measured during the period from the average value of the measured values (PV) measured during the period in which feedback control was performed.
- the range may be up to the value plus the above standard deviation.
- the range of "average value ⁇ standard deviation" may be set as the predetermined tolerance range. This makes it possible to perform a more stable evaluation than, for example, when the variance of measured values (PV) measured during the period is used as the evaluation value.
- FIG. 5 is a diagram showing a histogram of measured values (PV) measured during a period in which feedback control was performed.
- the histogram H shown in FIG. 5 divides the measured value (PV) into 10 classes according to the value, and shows the frequency of each class. In the histogram H, the frequency of the classes near the center is large, and the frequency becomes smaller as the classes are further away from the center.
- the measured values range from the average value of the measured values (PV) minus the standard deviation of the measured values (PV) to the value of the average value plus the standard deviation.
- PV is included in the four classes in the central part.
- the range from the value obtained by subtracting the standard deviation of the measured value (PV) from the average value of the measured value (PV) to the value obtained by adding the said standard deviation to the average value is defined as "average value ⁇ It can be expressed as the range of "standard deviation”.
- (Evaluation value) ⁇ Number of measured values (PV) included in the range of average value ⁇ standard deviation / Total number of measured values (PV) ⁇ ⁇ 100 Furthermore, since the evaluation value calculated using the above formula is based on the average value, even if the average value rises or falls due to factors such as the manipulated variable (MV) being too large or too small, the It will show a valid evaluation result without being influenced. Therefore, as described above, by applying the evaluation value, stable evaluation can be performed.
- the evaluation value is not limited to the above-mentioned example, as long as it is in accordance with the object or purpose of feedback control.
- the evaluation value may be the variance of the measured value (PV).
- FIG. 6 is a flowchart illustrating an example of a process executed by the information processing device 1.
- the data acquisition unit 101 acquires feedback control result data.
- the data acquisition unit 101 may display a display screen as shown in FIG. 3 and allow the user to input feedback control result data.
- the reception unit 104 may accept optimization settings. For example, as shown in Figure 3, the specific settings are based on the specification of the control system manufacturer, and whether the feedback control result is around a known value or the feedback control result is in an unknown range. It may also be a selection of whether to perform a search or the like.
- the prediction distribution calculation unit 102 uses the result data obtained in S1 to determine the relationship between the control parameter to be optimized and the result of feedback control to which the control parameter is applied. Calculate the predicted distribution of the function that represents .
- the predicted distribution is expressed by the above-mentioned formulas (1) to (3). Note that in the second and subsequent processes of S2, the previously calculated predicted distribution is updated.
- the search unit 103 searches for optimal value candidates for the control parameters based on the predicted distribution calculated in S2. More specifically, the search unit 103 searches for the value of the control parameter that maximizes the acquisition function. This process is expressed by the above-mentioned formulas (4) and (5). Note that if the reception unit 104 has accepted optimization settings in S1, the search unit 103 performs a search in accordance with the settings in S3.
- the search unit 103 outputs the results of the search performed in S3.
- the search unit 103 may present the detected candidates to the user by displaying a display screen as shown in FIG.
- reference information as shown in FIG. 4 may also be presented.
- the predicted value presentation unit 105 presents the predicted value calculated using the average and variance of the evaluation values when applying the candidates detected in S3.
- the reason presentation unit 106 determines a proposal reason using the above average and variance, and presents the determined proposal reason.
- the change mode presentation unit 107 identifies the change mode of the manipulated variable based on the difference between the value to be compared and the candidate detected in S3, and presents information indicating the specified change mode.
- the above-mentioned value to be compared is typically the latest one of the control parameters shown in the result data acquired in S1.
- the above-mentioned manipulated variable is MV in FIG.
- the update necessity determining unit 108 determines whether the control parameters applied by the control device 3 have been changed. For example, the update necessity determining unit 108 may check whether the control parameters have been changed by communicating with the control device 3, or the user may input an operation to the information processing device 1 indicating that the control parameters have been changed. It may be determined that the control parameter has been changed when the control parameter is changed. If the determination is YES in S5, the process proceeds to S6, and if the determination is NO in S5, the process in FIG. 6 ends.
- the search unit 103 may perform the following processing.
- the search unit 103 may notify the terminal device used by the user of the control device 3 of the candidates detected in S3, and prompt the user to change the control parameters.
- the user of the control device 3 who has confirmed the notification may perform an operation on the control device 3 to change the control parameters.
- the update necessity determining unit 108 may determine that the control parameters have been changed upon transmission of the above notification.
- the update necessity determining unit 108 determines whether there is any problem in the operation of the device 4 after the control parameter has been changed. For example, the update necessity determining unit 108 reads the measured value after the control parameter has been changed (PV in FIG. 2) from the database 2, and makes the determination in S6 based on whether the measured value is within a predetermined normal range. It's okay.
- the update necessity determining unit 108 changes the control parameters.
- the update necessity determining unit 108 may cause the user to change the control parameters by presenting a message urging the user to change the control parameters.
- the update necessity determining unit 108 may communicate with the control device 3 to change the control parameters. In this case, the update necessity determining unit 108 may instruct the control device 3 to return the control parameters to the values before the change, for example.
- the process of S6 may be repeatedly performed during a predetermined period (for example, one hour) after changing the control parameters. Thereby, even if the candidate detected in S3 is not valid and an abnormality occurs in the operation of the device 4, the influence can be kept to a minimum.
- the process in S8 is performed after a predetermined period of time has elapsed after the change in the control parameters has been confirmed, that is, after the determination in S5 is YES.
- the predetermined period may be set as appropriate depending on the manner in which the device 4 is used, and may be set to, for example, 24 hours.
- the update necessity determination unit 108 acquires the measured value (SV) measured during the predetermined period from the database 2.
- the update necessity determining unit 108 generates result data using the measured value (SV) obtained in S8.
- the update necessity determining unit 108 may calculate an evaluation value from the measured value (SV) acquired in S8, associate the changed control parameter with the calculated evaluation value, and generate result data.
- the update necessity determining unit 108 determines whether the prediction distribution needs to be updated based on the evaluation value included in the result data generated in S9. For example, the update necessity determining unit 108 may determine that the prediction distribution needs to be updated when the evaluation value satisfies a predetermined threshold. If the determination is NO in S10, the process returns to S8, and if the determination is YES in S10, the process returns to S1. After that, in S1, the data acquisition unit 101 acquires the result data generated in S9, and in the subsequent S2, the prediction distribution calculation unit 101 uses the result data acquired in S1 and the result data generated in S9. updates the predicted distribution.
- the search method executed by the information processing device 1 includes a prediction distribution calculation step (S2) and a search step (S3).
- the predicted distribution calculation step (S2) calculates a predicted distribution of a function indicating the relationship between a control parameter in feedback control and a result of feedback control to which the control parameter is applied.
- the search step (S3) searches for optimal value candidates for the control parameters based on the predicted distribution calculated in S2. Therefore, it becomes possible to perform stable feedback control without being influenced by human subjectivity.
- each process described in the above-described embodiment is arbitrary and is not limited to the above-mentioned example.
- the devices constituting the control system 9 can be changed as appropriate, as long as each process described in the above-described embodiments can be executed.
- each process shown in FIG. 6 does not necessarily need to be executed by one device, and the processes can be shared and executed by a plurality of arbitrary information processing devices (computers).
- the function of the information processing device 1 (hereinafter referred to as "device") is a program for making the computer function as the device, and the function of the computer as each control block of the device (particularly each part included in the control unit 10). This can be realized by a program (search program) for making it function.
- the device includes a computer having at least one control device (for example, a processor) and at least one storage device (for example, a memory) as hardware for executing the program.
- control device for example, a processor
- storage device for example, a memory
- the above program may be recorded on one or more computer-readable recording media instead of temporary.
- This recording medium may or may not be included in the above device. In the latter case, the program may be supplied to the device via any transmission medium, wired or wireless.
- each of the control blocks described above can also be realized by a logic circuit.
- a logic circuit for example, an integrated circuit in which a logic circuit functioning as each of the control blocks described above is formed is also included in the scope of the present invention.
- An information processing device includes a predicted distribution calculation unit that calculates a predicted distribution of a function indicating a relationship between a control parameter in feedback control and a result of feedback control to which the control parameter is applied;
- the present invention is configured to include a search unit that searches for a candidate for the optimal value of the control parameter based on the following.
- the information processing device may be configured such that in aspect 1 described above, the feedback control is feedback control applied in a waste incineration facility.
- the information processing device includes a data acquisition unit that acquires result data indicating a result of feedback control to which the candidate detected by the search unit is applied, and
- the distribution calculation unit may be configured to update the predicted distribution using the candidate and the result data.
- the information processing device is arranged such that in the search for the candidate, the result of feedback control is around a known value, and the result of feedback control is around a known value.
- the search unit may be configured to include a reception unit that receives a selection as to which of the following should be prioritized in the search, and the search unit searches for the candidates according to the selection received by the reception unit.
- the information processing device is configured such that, as information indicating the result of the feedback control, a predetermined value from among the measured values measured during the period in which the feedback control was performed is provided. It is also possible to use an evaluation value that indicates the percentage of measured values that are within the allowable range.
- the predetermined tolerance range is determined from an average value of the measurement values measured in the period in which the feedback control was performed.
- the average value may range from a value obtained by subtracting the standard deviation of the measured value to a value obtained by adding the standard deviation to the average value.
- the information processing device acquires a result of feedback control to which the candidate detected by the search unit is applied, and based on the acquired result,
- the configuration may include an update necessity determination unit that repeatedly performs a process of determining whether to update the predicted distribution at predetermined intervals.
- the information processing device is characterized in that in any one of aspects 1 to 7 above, the result of feedback control applying the candidate detected by the search unit, which is calculated from the mean and variance of the prediction distribution.
- the configuration may include a predicted value presenting section that presents a predicted value.
- the information processing device in any one of aspects 1 to 8 above, provides a reason for presenting a reason why the candidate detected by the search unit is valid based on the mean and variance of the prediction distribution. It is also possible to have a configuration including a presentation section.
- the control parameter is a coefficient by which a deviation between a set value and a measured value is multiplied in PID (Proportional Integral Differential) control;
- the feedback control includes at least one of a coefficient by which the integral of the deviation is multiplied and a coefficient by which the derivative of the deviation is multiplied, and the feedback control calculates the operation amount for the device to be controlled from the deviation and the coefficient, and information indicating how the operation amount changes when the search unit applies the candidate detected based on the updated predicted distribution based on the difference between the coefficient value and the candidate; It is also possible to have a configuration including a change mode presenting section that presents the change mode.
- a control system includes a control device that performs feedback control on a device to be controlled, a function that indicates a relationship between a control parameter in the feedback control, and a result of feedback control to which the control parameter is applied.
- an information processing device that searches for a candidate for the optimal value of the control parameter based on a predicted distribution of the control parameter, and the control device is configured to perform feedback control on the device to be controlled by applying the candidate.
- a search method is a search method executed by one or more information processing devices, and includes a function that indicates a relationship between a control parameter in feedback control and a result of feedback control to which the control parameter is applied.
- This method includes a predictive distribution calculation step of calculating a predictive distribution of the control parameter, and a searching step of searching for an optimal value candidate for the control parameter based on the predictive distribution.
- a search program according to aspect 13 of the present invention is a search program for causing a computer to function as the information processing apparatus according to aspect 1 above, and for causing the computer to function as the predicted distribution calculation section and the search section. It is an exploration program.
Landscapes
- Engineering & Computer Science (AREA)
- General Physics & Mathematics (AREA)
- General Engineering & Computer Science (AREA)
- Computer Vision & Pattern Recognition (AREA)
- Evolutionary Computation (AREA)
- Medical Informatics (AREA)
- Software Systems (AREA)
- Artificial Intelligence (AREA)
- Automation & Control Theory (AREA)
- Physics & Mathematics (AREA)
- Mechanical Engineering (AREA)
- Health & Medical Sciences (AREA)
- Feedback Control In General (AREA)
- Management, Administration, Business Operations System, And Electronic Commerce (AREA)
- Information Retrieval, Db Structures And Fs Structures Therefor (AREA)
- Incineration Of Waste (AREA)
Abstract
人の主観に左右されずに安定したフィードバック制御を行う。フィードバック制御における制御パラメータと、該制御パラメータを適用したフィードバック制御の結果との関係を示す関数の予測分布を算出する予測分布算出部(102)と、前記予測分布に基づいて前記制御パラメータの最適値の候補を探索する探索部(103)と、を備える。
Description
本発明は、フィードバック制御における制御パラメータを調整する技術に関する。
フィードバック制御は、出力値と目標値とを一致させるように入力値を制御するという制御手法であり、各種機器の自動制御に古くから用いられている。適切なフィードバック制御を行うためには、制御パラメータを適切に設定する必要があり、制御パラメータを適切に設定するための技術も従来から知られている。
例えば、下記の特許文献1には、吹込み量フィードバック制御手段とパラメータ調整手段とを備えた排ガス脱硝制御装置が開示されている。当該吹込み量フィードバック制御手段は、燃焼炉から排出される燃焼排ガスから窒素酸化物を除去するための除去物の吹込み量を算出する。また、パラメータ調整手段は、燃焼炉の炉口温度に基づいてフィードバック制御の制御パラメータを調整する。
上記従来技術は、炉口温度と脱硝率、および炉口温度とプロセス遅れのそれぞれに相関があることを前提として、炉口温度から吹込み量のフィードバック制御における適切な制御パラメータを求めるものである。そのため、上記従来技術は、吹き込み量のフィードバック制御以外に適用することはできない。このように、制御パラメータの調整手法として、様々なフィードバック制御に共通して適用可能な手法は従来知られていない。このため、フィードバック制御の制御パラメータは、オペレータの経験と勘を頼りに決定されることも多かった。
しかし、経験と勘を頼りに制御パラメータを決定する手法では、誰が制御パラメータを決定するかによって調整結果にばらつきが生じてしまい、安定したフィードバック制御を実現することは難しい。
本発明の一態様は、人の主観に左右されずに安定したフィードバック制御を行うことを可能にする情報処理装置等を提供することを目的とする。
上記の課題を解決するために、本発明の一態様に係る情報処理装置は、フィードバック制御における制御パラメータと、該制御パラメータを適用したフィードバック制御の結果との関係を示す関数の予測分布を算出する予測分布算出部と、前記予測分布に基づいて前記制御パラメータの最適値の候補を探索する探索部と、を備える。
また、本発明の一態様に係る制御システムは、上記の課題を解決するために、制御対象の機器に対してフィードバック制御を行う制御装置と、前記フィードバック制御における制御パラメータと、該制御パラメータを適用したフィードバック制御の結果との関係を示す関数の予測分布に基づいて前記制御パラメータの最適値の候補を探索する情報処理装置と、を含み、前記制御装置は、前記候補を適用して制御対象の前記機器に対するフィードバック制御を行う。
また、本発明の一態様に係る探索方法は、上記の課題を解決するために、1または複数の情報処理装置が実行する探索方法であって、フィードバック制御における制御パラメータと、該制御パラメータを適用したフィードバック制御の結果との関係を示す関数の予測分布を算出する予測分布算出ステップと、前記予測分布に基づいて前記制御パラメータの最適値の候補を探索する探索ステップと、を含む。
本発明の一態様によれば、人の主観に左右されずに安定したフィードバック制御を行うことが可能になる。
〔システム構成〕
本発明の一実施形態に係る制御システム9の概要を図2に基づいて説明する。図2は、制御システム9の概要を示す図である。図示のように、制御システム9には、情報処理装置1、データベース2、制御装置3、機器4、および計測装置5が含まれる。なお、情報処理装置1は、制御装置3や機器4から離れた遠隔地に設置されていてもよい。
本発明の一実施形態に係る制御システム9の概要を図2に基づいて説明する。図2は、制御システム9の概要を示す図である。図示のように、制御システム9には、情報処理装置1、データベース2、制御装置3、機器4、および計測装置5が含まれる。なお、情報処理装置1は、制御装置3や機器4から離れた遠隔地に設置されていてもよい。
制御システム9では、制御装置3による機器4のフィードバック制御が行われる。情報処理装置1は、当該フィードバック制御における制御パラメータを調整するための装置である。詳細は後述するが、情報処理装置1は、フィードバック制御における制御パラメータと、該制御パラメータを適用したフィードバック制御の結果との関係を示す関数の予測分布に基づいて制御パラメータの最適値の候補を探索する。
制御システム9のユーザは、情報処理装置1が検出した候補を、制御システム9におけるフィードバック制御に適用することにより、当該ユーザの主観に左右されずに安定したフィードバック制御を行うことが可能になる。
制御装置3は、上述のように、制御対象の機器4に対してフィードバック制御を行う装置である。具体的には、制御装置3は、PID(Proportional Integral Differential)制御によるフィードバックを行う。PID制御では、設定値(SV:Set Value)と計測値(PV:Process Value)との偏差(DV:deviation)、DVの積分、およびDVの微分の3つの要素により操作量(MV:Manipulated Variable)を決定する。PID制御における操作量(MV)の算出式は下記のように表される。
MV=P×DV+(60/I)×(DVの積分)+(D/60)×(DVの微分)
上記の算出式において、P、I、Dは、それぞれ比例制御、積分制御、および微分制御をどの程度重視するかを決定する制御パラメータである。適切なフィードバック制御を実現するためには、P、I、Dの値を適切に設定することが必要であり、情報処理装置1はこれらの制御パラメータの最適値を探索する。なお、情報処理装置1は、必ずしもP、I、Dの制御パラメータの全てについて最適値を探索する必要はなく、そのうち少なくとも1つを探索してもよい。
上記の算出式において、P、I、Dは、それぞれ比例制御、積分制御、および微分制御をどの程度重視するかを決定する制御パラメータである。適切なフィードバック制御を実現するためには、P、I、Dの値を適切に設定することが必要であり、情報処理装置1はこれらの制御パラメータの最適値を探索する。なお、情報処理装置1は、必ずしもP、I、Dの制御パラメータの全てについて最適値を探索する必要はなく、そのうち少なくとも1つを探索してもよい。
制御システム9において、上記の算出式で算出される操作量(MV)が適用される操作端は、機器4またはその構成要素である。例えば、機器4がバルブを備えている場合には当該バルブを操作端とし、バルブの開度を操作量(MV)としてもよい。また、例えば、機器4がインバータを備えている場合、当該インバータを操作端としてもよい。
なお、1つの機器4が複数の操作端を有している場合、制御装置3は各操作端の操作量(MV)を決定するが、この場合、情報処理装置1は各操作端について制御パラメータの最適値の候補を検出してもよい。例えば、機器4の温度制御を行う場合には、上述の算出式を用いて、冷却と加熱の2つの操作端のそれぞれについて操作量(MV)が算出される。この場合、情報処理装置1は、冷却の制御に用いられる制御パラメータの最適値の候補と、加熱の制御に用いられる制御パラメータの最適値の候補とのそれぞれを一度に検出することができる。無論、情報処理装置1は、冷却の制御に用いられる制御パラメータの最適値の候補を検出した後で、加熱の制御に用いられる制御パラメータの最適値の候補を検出することもできる。同様に、情報処理装置1は、加熱の制御に用いられる制御パラメータの最適値の候補を検出した後で、冷却の制御に用いられる制御パラメータの最適値の候補を検出することもできる。
また、同じ操作端を対象とする場合であっても、条件に応じて異なる制御パラメータを適用してもよい。この場合、情報処理装置1は、条件ごとに制御パラメータの最適値の候補を検出してもよい。例えば、制御装置3は、機器4が第1の運転条件で稼働しているときには、第1の制御パラメータを使用して算出された操作量(MV)で機器4を制御する。一方、制御装置3は、機器4が第2の運転条件で稼働しているときには、第2の制御パラメータを使用して算出された操作量(MV)で機器4を制御してもよい。この場合、情報処理装置1は、第1の制御パラメータの最適値の候補と、第2の制御パラメータの最適値の候補のそれぞれを一度に検出することができる。無論、情報処理装置1は、第1の制御パラメータの最適値の候補を検出した後で、第2の制御パラメータの最適値の候補を検出することもできる。同様に、情報処理装置1は、第2の制御パラメータの最適値の候補を検出した後で、第1の制御パラメータの最適値の候補を検出することもできる。
制御システム9におけるプラントプロセスは、例えば燃焼や化学反応等である。なお、制御システム9は、プラントプロセスに限られず、任意の対象についての制御に適用することができる。
制御システム9における計測端は、計測値(PV)を計測するためのものであり、例えば計測装置5により実現される。計測装置5は、計測対象に応じたものとすればよい。例えば計測値(PV)が圧力であれば計測装置5として圧力計を適用し、計測値(PV)が温度であれば計測装置5として温度計を適用すればよい。計測装置5で計測された計測値(PV)は、上述のように偏差(DV)の算出に用いられると共に、データベース2に記憶され、情報処理装置1による制御パラメータの探索に用いられる。なお、データベース2は、情報処理装置1または制御装置3が備えていてもよい。
以上のように、制御システム9は、制御対象の機器4に対してフィードバック制御を行う制御装置3と、情報処理装置1と、を含む。情報処理装置1はフィードバック制御における制御パラメータと、該制御パラメータを適用したフィードバック制御の結果との関係を示す関数の予測分布に基づいて制御パラメータの最適値の候補を探索する。制御装置3は、情報処理装置1が検出する候補を適用して制御対象の機器4に対するフィードバック制御を行う。この制御システム9によれば、人の主観に左右されずに安定したフィードバック制御を行うことが可能になる。また、制御パラメータの検討に要する時間も削減できるため、制御システム9の管理業務の効率化にも資する。
情報処理装置1が制御パラメータの最適値の候補を検出する対象とするフィードバック制御は、例えば、廃棄物焼却施設におけるフィードバック制御であってもよい。一般に、廃棄物焼却施設では、多種多様な廃棄物を焼却し、また、それら廃棄物の性状(例えば水分含量)も一定しないため、運転状況は常に変化する。このため、運転状況に応じたフィードバック制御が求められるが、廃棄物の性状の不安定さ等の要因により高精度な制御を行うことが難しかった。この点、情報処理装置1によれば、予測分布に基づいて制御パラメータの最適値の候補を探索するため、安定したフィードバック制御を行うことが可能になる。
なお、制御システム9が廃棄物焼却施設のフィードバック制御を行うものである場合、機器4は、廃棄物焼却施設に配置された機器となる。例えば、機器4は、焼却炉、焼却炉内で廃棄物を搬送する火格子、燃焼空気の供給装置、または排出ガスの処理装置等であってもよい。また、廃棄物焼却施設は、焼却炉の排熱を利用して発電を行う発電設備を備えたものであってもよく、この場合、機器4は、発電設備に関連する機器(例えばボイラ等)であってもよい。
〔情報処理装置の構成〕
図1に基づいて情報処理装置1の構成を説明する。図1は、情報処理装置1の要部構成の一例を示すブロック図である。図示のように、情報処理装置1は、情報処理装置1の各部を統括して制御する制御部10と、情報処理装置1が使用する各種データを記憶する記憶部11を備えている。また、情報処理装置1は、情報処理装置1が他の装置と通信するための通信部12、情報処理装置1に対する各種データの入力を受け付ける入力部13、および情報処理装置1が各種データを出力するための出力部14を備えている。また、制御部10には、データ取得部101、予測分布算出部102、探索部103、受付部104、予測値提示部105、理由提示部106、変化態様提示部107、および更新要否判定部108が含まれている。
図1に基づいて情報処理装置1の構成を説明する。図1は、情報処理装置1の要部構成の一例を示すブロック図である。図示のように、情報処理装置1は、情報処理装置1の各部を統括して制御する制御部10と、情報処理装置1が使用する各種データを記憶する記憶部11を備えている。また、情報処理装置1は、情報処理装置1が他の装置と通信するための通信部12、情報処理装置1に対する各種データの入力を受け付ける入力部13、および情報処理装置1が各種データを出力するための出力部14を備えている。また、制御部10には、データ取得部101、予測分布算出部102、探索部103、受付部104、予測値提示部105、理由提示部106、変化態様提示部107、および更新要否判定部108が含まれている。
データ取得部101は、フィードバック制御における制御パラメータと、該制御パラメータを適用したフィードバック制御の結果とを対応付けた結果データを取得する。また、探索部103が上記制御パラメータの最適値の候補を検出した後には、データ取得部101は、当該候補を適用したフィードバック制御の結果を示す結果データを取得する。
予測分布算出部102は、フィードバック制御における制御パラメータと、該制御パラメータを適用したフィードバック制御の結果との関係を示す関数の予測分布を算出する。また、予測分布算出部102は、予測分布を算出した後に、データ取得部101が新たな結果データ(探索部103が検出した候補を適用したフィードバック制御の結果を示すもの)を取得した場合、当該新たな結果データを用いて予測分布を更新する。
結果データの取得と予測分布の更新は必須の構成ではないが、当該構成により、更新後の予測分布に基づいた、より妥当性の高い制御パラメータの最適値の候補を検出することが可能になる。また、結果データの取得と予測分布の更新を繰り返すことができ、これにより、制御パラメータの候補を最適値または最適値により近い値として、高精度なフィードバック制御を実現することができる。
探索部103は、予測分布算出部102が算出する予測分布に基づいて制御パラメータの最適値の候補を探索する。なお、予測分布の算出および更新の方法と、候補の探索方法の詳細については後述する。
受付部104は、探索部103による候補の探索において、フィードバック制御の結果が既知の値の周辺と、フィードバック制御の結果が未知の範囲と、の何れを重視して探索を行うかの選択を受け付ける。なお、当該選択のためのユーザの操作は例えば入力部13を介して受け付ければよい。そして、探索部103は、受付部104が上記の選択を受け付けた場合、当該選択に従って候補を探索する。
受付部104は必須の構成ではないが、情報処理装置1が受付部104を備えている場合、情報処理装置1のユーザは、フィードバック制御の結果が既知の値の周辺を重視して探索を行うことを選択することができる。この場合、局所最適解である可能性はあるが安定した制御結果が期待できる候補を検出することができる。また、情報処理装置1のユーザは、フィードバック制御の結果が未知の範囲を重視して探索を行うことを選択することもできる。この場合、制御結果に当り外れが出る可能性はあるが、大域最適解の検出に大きく寄与することが期待できる候補を検出することができる。
予測値提示部105は、探索部103が検出した候補を適用したフィードバック制御の結果の予測値を提示する。詳細は後述するが、予測値提示部105は、予測分布の平均と分散から上記予測値を算出する。
予測値提示部105は必須の構成ではないが、情報処理装置1が予測値提示部105を備えている場合、検出された候補を適用したフィードバック制御の結果の予測値という当該候補を適用するか否かの判断材料として有用な情報をユーザに提示することができる。
理由提示部106は、探索部103が検出した候補が妥当である理由を提示する。詳細は後述するが、理由提示部106は、予測分布の平均と分散に基づいて上記理由を特定する。
理由提示部106も必須の構成ではない。しかし、情報処理装置1が理由提示部106を備えている場合、検出された候補が妥当である理由という当該候補を適用するか否かの判断材料として有用な情報をユーザに提示することができる。
変化態様提示部107は、探索部103が検出した候補を適用したときに、制御対象の機器に対する操作量(MV)がどのように変化するかを示す情報を提示する。詳細は後述するが、変化態様提示部107は、比較対象とする制御パラメータ(上述の算出式における係数P、I、D)の値と候補との差異に基づいて、操作量(MV)がどのように変化するかを特定する。
変化態様提示部107も必須の構成ではない。しかし、情報処理装置1が変化態様提示部107を備えている場合、検出された候補を適用したときの操作量がどのように変化するかを示す情報という当該候補を適用するか否かの判断材料として有用な情報をユーザに提示することができる。
更新要否判定部108は、探索部103が検出した候補を適用したフィードバック制御の結果を取得し、取得した当該結果に基づいて予測分布を更新するか否かを判定する処理を、所定期間毎に繰り返し行う。
更新要否判定部108は必須の構成ではない。しかし、情報処理装置1が更新要否判定部108を備えている場合、フィードバック制御の結果が所望のものとなるまで、予測分布の更新と候補の検出を自動で継続することができる。また、フィードバック制御の結果が所望のものとなったときに予測分布の更新と候補の検出を自動で終了することができる。また、情報処理装置1が更新要否判定部108を備えている場合、フィードバック制御の結果が所望のものとなった後、当該結果が所望のものではなくなったときに予測分布の更新と候補の検出を自動で再開することができる。
また、更新要否判定部108は、探索部103が検出した候補が適用された後の機器4の動作に問題がないか判定し、問題があると判定した場合には制御パラメータを変更させる処理についても行ってもよい。これにより、検出された候補が妥当でなかった場合に、その影響を最小限に留めることができる。なお、これらの処理は、更新要否判定部108とは別の処理ブロックを設けて当該処理ブロックに行わせてもよい。
ここで、フィードバック制御において、制御パラメータと該制御パラメータを適用したフィードバック制御の結果との関係を示す関数を求めることができれば、所望の結果が得られる制御パラメータを決定することは容易である。しかし、一般にはそのような関数を求めることは難しい。
そこで、情報処理装置1は、以上のように、制御パラメータと制御結果との関係を示す関数を求める代わりに、当該関数の予測分布を算出し、算出した予測分布に基づいて制御パラメータの最適値の候補を探索する、という構成を採用している。
これにより、制御パラメータと制御結果との関係を示す関数を求めることが難しい場合であっても、予測分布から妥当と考えられる制御パラメータを自動で決定することができる。そして、決定された制御パラメータを適用することにより、人の主観に左右されずに安定したフィードバック制御を行うことが可能になる。
〔予測分布の算出方法と最適値の候補の探索方法の詳細〕
予測分布算出部102による予測分布の算出方法(更新も含む)の詳細と、探索部103による最適値の候補の探索方法の詳細を以下説明する。なお、以下の説明は、ベイズ最適化における予測分布の算出方法と探索方法に関するものである。ただし、予測分布を用いて最適値の候補を探索するものであれば、以下の説明に係る方法以外の方法を適用することも可能である。
予測分布算出部102による予測分布の算出方法(更新も含む)の詳細と、探索部103による最適値の候補の探索方法の詳細を以下説明する。なお、以下の説明は、ベイズ最適化における予測分布の算出方法と探索方法に関するものである。ただし、予測分布を用いて最適値の候補を探索するものであれば、以下の説明に係る方法以外の方法を適用することも可能である。
フィードバック制御において最適化したい制御パラメータがN個ある場合、それらの制御パラメータは、

と表され、
それに対する評価値は、
それに対する評価値は、

と表される。
予測分布算出部102は、データ取得部101が取得する結果データを用いて、制御パラメータと制御結果との関係を示す関数の予測分布を算出する。なお、この関数を以下では評価関数f(θ)と呼ぶ。また、新たな結果データ(例えば、探索部103が検出した候補を適用したフィードバック制御の結果を示す結果データ)が取得されたときには、予測分布算出部102は、その結果データが反映されるように予測分布を更新する。
制御変数と制御結果との関係を、ガウスノイズεn~Ν(0,β)を用いて

と仮定すると、ガウス過程による評価関数の予測分布として以下の分布が得られる。



ここで、k*=k(θ,θ)であり、KΘは[KΘ]i,j=k(θi,θj)で得られるグラム行列である。また、

である。kΘ,*は、[kΘ,*]i=k(θi,θ)の縦ベクトルであり、k(・,・)は、カーネル関数である。ここではカーネル関数のパラメータをαkとする。
平均関数μ(θ)は、結果データから予測される評価関数の平均値を示す。また、分散関数σ(θ)は、結果データから予測される評価関数の分散である。σ(θ)は、予測の不確実性を示し、結果データが不足している領域ではその値が大きくなる傾向がある。σが大きいと、予測が不確実であるといえ、予測の確実性を上げるために必要な結果データが不足しているといえる。数式(3)から明らかなように、分散関数σ(θ)に含まれるカーネル関数およびカーネル関数のパラメータαkは、予測分布の算出に影響を与える。予測分布の算出の際には、パラメータαkの最適化が行われる。最適化の方法は特に限定されず、例えば一般的なベイズ最適化で適用されている各種の最適化手法を適用することもできる。
探索部103は、最適な制御パラメータを求めるために、最適な制御パラメータの候補を探索する。具体的には、探索部103は、後記数式(4)、(5)に示されるように、平均関数μ(θ)と分散関数σ(θ)を用いて獲得関数a(θ)を最大にする制御パラメータを探索する。この探索で検出された制御パラメータが、最適な制御パラメータの候補となる。この探索は、UCB(Upper Confidence Bound)戦略に基づいている。
数式(5)におけるκは探索と利用を調節するためのパラメータである。受付部104が、フィードバック制御の結果が既知の値の周辺と、フィードバック制御の結果が未知の範囲と、の何れを重視して探索を行うかの選択を受け付けた場合、探索部103は、κを受け付けた選択に応じた値に設定し、候補の探索を行う。
無論、他の方法で新たな制御パラメータを探索することも可能である。例えば、PI(Probability of Improvement)戦略や、EI(Expected Improvement)戦略で最適な制御パラメータの候補を探索してもよい。
なお、評価関数の値を最小化する制御パラメータを最適な制御パラメータとして求める場合には、獲得関数a(θ)を最小にする制御パラメータを探索すればよい。評価関数の値を最小化する制御パラメータを最適な制御パラメータとして求める場合とは、例えば短時間で完了させることが好ましいタスクについて、タスク完了までの所要時間を評価値とする場合等である。


探索部103が検出した制御パラメータの最適値の候補は、ユーザに提示される。そして、その候補を適用したフィードバック制御が開始され、当該制御が行われた期間に計測された計測値(PV)がデータベース2に蓄積される。
更新要否判定部108は、探索部103が検出した候補を適用したフィードバック制御の結果を示す計測値(PV)をデータベース2から取得し、取得した計測値(PV)に基づいて予測分布を更新するか否かを判定する。例えば、更新要否判定部108は、取得した計測値(PV)を用いて、適用された候補の妥当性を示す評価値を算出し、算出した評価値が所定の閾値未満であった場合に、予測分布を更新すると判定してもよい。
また、更新要否判定部108は、予測分布を更新すると判定した場合、算出した評価値と取得した計測値とを対応付けて結果データを生成してもよい。データ取得部101は、生成された結果データを取得し、それ以前に取得されていた結果データと共に予測分布算出部102に出力する。そして、予測分布算出部102は、新たに取得された結果データと、それ以前に取得されていた結果データとを用いて予測分布を更新する。なお、評価値の算出は更新要否判定部108またはデータ取得部101が行ってもよいし、他の装置またはユーザが行ってもよい。また、評価値の算出方法については後述する。
そして、探索部103は、予測分布算出部102による更新後の予測分布に基づいて構成される評価関数に基づき、制御パラメータの最適値を探索する。このように、予測分布の更新と最適値の探索とを繰り返すことにより、最適な制御パラメータを検出することが可能になる。
〔表示画面例(入力・設定)〕
データ取得部101は、図3のような表示画面を表示させて、フィードバック制御の結果データをユーザに入力させてもよい。図3は、結果データの入力を受け付ける表示画面の例を示す図である。以下説明するように、このような表示画面を表示させることにより、ユーザは、最適化に必要な結果データの入力や、各種設定を容易に行うことができる。
データ取得部101は、図3のような表示画面を表示させて、フィードバック制御の結果データをユーザに入力させてもよい。図3は、結果データの入力を受け付ける表示画面の例を示す図である。以下説明するように、このような表示画面を表示させることにより、ユーザは、最適化に必要な結果データの入力や、各種設定を容易に行うことができる。
図3に示す表示画面A1には、アドレス入力ボックスA11、参照ボタンA12、決定ボタンA13、および結果データ表示領域A14が含まれている。アドレス入力ボックスA11は結果データが入ったファイルを指定するアドレスを入力するためのものである。また、参照ボタンA12は、結果データが入ったファイルを参照するためのものである。ユーザは、結果データが入ったファイルのアドレスをアドレス入力ボックスA11に入力するか、または参照ボタンA12を操作した上で参照先を指定することにより、使用するファイルを指定することができる。例えば、CSV(Comma Separated Variables)形式のファイルを指定できるようにしてもよく、この場合、データ取得部101は、指定されたCSV形式のファイルから結果データを読み込めばよい。
そして、ユーザは、ファイルを指定した後、決定ボタンA13を操作して使用するファイルを確定させることができる。これにより、結果データ表示領域A14には、確定されたファイルから読み込まれた結果データが表示される。つまり、データ取得部101は、指定されたファイルから結果データ(制御パラメータの値とその評価値)を読み込み、それらの値を結果データ表示領域A14に表示させる。図3の例では、制御パラメータであるP、I、Dの各値と、その値を適用したフィードバック制御が適用されていた期間に計測された計測値(PV)から算出された評価値とが対応付けて表示されている。
なお、表示画面A1の表示先は特に限定されない。例えば、データ取得部101は、出力部14が表示装置であれば出力部14に表示画面A1を表示させてもよいし、情報処理装置1と有線または無線通信可能な他の表示装置に表示画面A1を表示させてもよい。また、表示画面A1を表示させる処理は受付部104が行ってもよいし、表示画面を表示させる処理を行う処理ブロックを別途設け、当該処理ブロックに行わせてもよい。
また、表示画面A1には、最適化の設定を受け付けるための各種情報も含まれている。具体的には、表示画面A1には、メーカ指定ボックスA15、計算パラメータ指定ボックスA16、肯定ボタンA17、および否定ボタンA18が含まれている。
メーカ指定ボックスA15は、制御システム9のメーカ(より詳細には制御システム9で使用されるDCS:Distributed Control Systemのメーカ)を指定するためのものである。メーカによってPID制御の制御パラメータの表現の仕方が異なる場合があるが、メーカの指定を受け付けることにより、そのメーカに応じた方式で表現された制御パラメータを最適化することができる。
計算パラメータ指定ボックスA16は、制御パラメータの最適値の候補の探索において、フィードバック制御の結果が既知の値の周辺と、フィードバック制御の結果が未知の範囲と、の何れを重視して探索を行うかの選択を受け付けるためのものである。
具体的には、計算パラメータ指定ボックスA16には、1から3の何れかの値を入力できるようになっている。「1」の値は、活用を重視すること、つまりフィードバック制御の結果が既知の値の周辺の探索を重視することを指定する値である。また、「3」の値は、フィードバック制御の結果が未知の範囲の探索を重視することを指定する値である。そして、「2」の値は、活用と探索のどちらにも偏らない標準的な探索を行うことを指定する値である。これにより、ユーザは、所望の態様で探索を行わせることができる。無論、探索の態様を指定する方法はこの例に限られず、例えば、上述の数式(5)におけるκの値をユーザに指定させてもよい。
ユーザは、表示画面A1において、結果データ表示領域A14に表示される結果データが妥当であるか確認する。また、ユーザは、「設定」の欄におけるメーカ指定ボックスA15および計算パラメータ指定ボックスA16への入力内容が妥当であるか確認する。そして、ユーザは、何れも妥当と判断した場合には肯定ボタンA17を操作する。これにより、予測分布算出部102による予測分布の算出が開始され、それに続いて探索部103による制御パラメータの最適値の候補の探索が行われる。また、ユーザは、最適化を中止する場合には、否定ボタンA18を操作すればよい。
〔表示画面例(結果表示)〕
探索部103は、図4のような表示画面を表示させて、探索の結果をユーザに提示してもよい。図4は、探索結果の表示画面の例を示す図である。図4に示す表示画面A2には、探索部103が検出した、制御パラメータの最適値の候補を表示する候補表示領域A21が含まれている。図4の例では、P、I、Dという3つの制御パラメータの値が候補表示領域A21に表示されている。
探索部103は、図4のような表示画面を表示させて、探索の結果をユーザに提示してもよい。図4は、探索結果の表示画面の例を示す図である。図4に示す表示画面A2には、探索部103が検出した、制御パラメータの最適値の候補を表示する候補表示領域A21が含まれている。図4の例では、P、I、Dという3つの制御パラメータの値が候補表示領域A21に表示されている。
また、表示画面A2には「参考情報」の欄が含まれている。当該欄には、予想評価値、提案理由、および操作量の変化態様の3つの項目(A22~A24)が含まれている。「参考情報」の表示は必須ではないが、候補表示領域A21に示される候補を適用するか否かの判断材料となるため表示することが好ましい。
予想評価値の項目A22には、予測値提示部105が算出する、候補表示領域A21に示される制御パラメータを適用した場合の評価値の予測値が提示されている。具体的には、予測値提示部105は、予測分布算出部102が算出した最新の予測分布から、候補として検出された制御パラメータを適用した場合の評価値の平均と分散を特定し、「平均±標準偏差(分散の平方根)」の値を評価値の予測値として算出する。例えば、平均が83、標準偏差が12である場合には、図示のように予想評価値は「83±12」となる。なお、標準偏差を用いて表される予測値は参考情報の一例にすぎず、参考情報としては様々な情報が適用可能である。例えば、算出された分散の値を参考情報として表示させてもよい。
提案理由の項目A23には、理由提示部106が特定する、候補表示領域A21に示される制御パラメータを適用することが好ましい理由が提示されている。具体的には、項目A23には「確実性は低いが、高得点が期待できる」とのメッセージが表示されている。メッセージの内容は、上述の平均および分散に基づいて決定すればよい。例えば、理由提示部106は、平均が所定の閾値以上であれば高得点が期待できる旨のメッセージを提示してもよい。理由提示部106は、分散が所定の閾値以上であれば確実性が低い旨、閾値未満であれば確実性が高い旨のメッセージを提示する、というルールに従って提示するメッセージを決定してもよい。この場合、平均と分散が何れも閾値以上である場合に図4に示すようなメッセージが提示される。一方、平均は閾値以上であるが、分散は閾値未満である場合には、理由提示部106は、確実性が高く、高得点が期待できる旨のメッセージを提示してもよい。また、平均と分散の何れもが閾値未満である場合には、理由提示部106は、高得点は期待できないが、確実性が高い旨のメッセージを提示してもよい。なお、平均が閾値未満で分散が閾値以上である場合には、理由提示部106は、提案理由がない旨、あるいは結果データを追加することが望ましい旨を表示してもよい。
操作量の変化態様の項目A24には、変化態様提示部107が特定する、候補表示領域A21に示される制御パラメータを適用する前後における操作量(図2のMV)の変化の態様が提示されている。具体的には、偏差(DV)に対する操作量(MV)が大きくなること、偏差(DV)をゼロにするための操作量(MV)の補正量が大きくなること、そして、操作量(MV)の変化速度が遅くなることを示すメッセージが表示されている。
なお、ここでは、制御パラメータが、上述した操作量(MV)の算出式における係数P、I、Dの値を含むことを想定している。また、フィードバック制御が、当該算出式に示されるように、設定値(SV)と計測値(PV)との偏差(DV)と上記係数から制御対象の機器に対する操作量(MV)を算出するものであることを想定している。
例えば、上記の3つの係数P、I、Dの最適化を行った場合、変化態様提示部107は、候補表示領域A21に示される制御パラメータを適用する前後でPが増加した場合、図4のように操作量(MV)が大きくなる旨のメッセージを提示してもよい。一方、Pが減少した場合には、変化態様提示部107は、操作量(MV)が小さくなる旨のメッセージを提示してもよい。
また、変化態様提示部107は、候補表示領域A21に示される制御パラメータを適用する前後でIが減少した場合、図4のように、偏差(DV)をゼロにするための操作量(MV)の補正量が大きくなる旨のメッセージを提示してもよい。一方、Iが増加した場合には、変化態様提示部107は、当該補正量が小さくなる旨のメッセージを提示してもよい。
また、変化態様提示部107は、候補表示領域A21に示される制御パラメータを適用する前後でDが減少した場合、図4のように操作量(MV)の変化速度が遅くなる旨のメッセージを提示してもよい。一方、Dが増加した場合には、変化態様提示部107は、当該変化速度が速くなる旨のメッセージを提示してもよい。
以上のような内容を確認した後、ユーザは、終了ボタンA25を操作し、最適化を一旦終了させればよい。この後、候補表示領域A21に示される制御パラメータが制御装置3に伝達され、当該制御パラメータを適用したフィードバック制御が行われる。
〔評価値について〕
フィードバック制御の結果の評価値は、フィードバック制御の対象や目的等に応じたものを適宜用いればよい。例えば、計測値(PV)を安定させることが好ましい場合には、フィードバック制御の結果を示す情報として、当該フィードバック制御が行われた期間に計測された計測値(PV)のうち所定の許容範囲内である計測値(PV)の割合を示す評価値を用いてもよい。これにより、許容範囲内の計測値の割合が高くなる制御パラメータの候補を検出し、これをフィードバック制御に適用することにより計測値(PV)を安定させることが可能になる。
フィードバック制御の結果の評価値は、フィードバック制御の対象や目的等に応じたものを適宜用いればよい。例えば、計測値(PV)を安定させることが好ましい場合には、フィードバック制御の結果を示す情報として、当該フィードバック制御が行われた期間に計測された計測値(PV)のうち所定の許容範囲内である計測値(PV)の割合を示す評価値を用いてもよい。これにより、許容範囲内の計測値の割合が高くなる制御パラメータの候補を検出し、これをフィードバック制御に適用することにより計測値(PV)を安定させることが可能になる。
なお、評価値の算出は、データ取得部101または更新要否判定部108が行ってもよい。また、これらとは別に評価値を算出する処理ブロックを設けてもよいし、他の装置またはユーザが算出した評価値(あるいは評価値を含む結果データ)を情報処理装置1に入力してもよい。
また、所定の許容範囲は、フィードバック制御が行われた期間に計測された計測値(PV)の平均値から当該期間に計測された計測値(PV)の標準偏差を引いた値から、上記平均値に上記標準偏差を加えた値までの範囲としてもよい。つまり、「平均値±標準偏差」の範囲を所定の許容範囲としてもよい。これにより、例えば当該期間に計測された計測値(PV)の分散を評価値とする場合と比べてより安定した評価を行うことができる。
これについて、図5に基づいて説明する。図5は、フィードバック制御が行われた期間に計測された計測値(PV)のヒストグラムを示す図である。図5に示されるヒストグラムHは、計測値(PV)をその値により10の階級に分けて、各階級の度数を示したものである。ヒストグラムHにおいては、中央付近の階級の度数が大きく、中央から離れた階級ほど度数が小さくなっている。
図示のように、ヒストグラムHにおいて、計測値(PV)の平均値から当該計測値(PV)の標準偏差を引いた値から、当該平均値に当該標準偏差を加えた値までの範囲の計測値(PV)は、その中央部分の4つの階級に含まれている。なお、ヒストグラムHにおいて、計測値(PV)の平均値から当該計測値(PV)の標準偏差を引いた値から、当該平均値に当該標準偏差を加えた値までの範囲は、「平均値±標準偏差」の範囲と換言できる。全計測値(PV)のうちこれらの階級に含まれる計測値(PV)の割合が高いほど、計測値(PV)が安定しているといえるから、下記の式で算出される評価値は、安定性を評価するものとして妥当であるといえる。
(評価値)={平均値±標準偏差の範囲に含まれる計測値(PV)の数/計測値(PV)の総数}×100
また、上記の式で算出される評価値は、平均値を基準としているため、例えば操作量(MV)が大きすぎる、あるいは小さすぎる等の要因により、平均値が上がったり下がったりした場合でも、その影響を受けることなく妥当な評価結果を示すものとなる。よって上述のように、当該評価値を適用することにより、安定した評価を行うことができる。
また、上記の式で算出される評価値は、平均値を基準としているため、例えば操作量(MV)が大きすぎる、あるいは小さすぎる等の要因により、平均値が上がったり下がったりした場合でも、その影響を受けることなく妥当な評価結果を示すものとなる。よって上述のように、当該評価値を適用することにより、安定した評価を行うことができる。
無論、評価値は、フィードバック制御の対象や目的等に応じたものであればよく、上述の例に限られない。例えば、計測値(PV)の分散を評価値としてもよい。
〔処理の流れ〕
情報処理装置1が実行する処理(探索方法)の流れを図6に基づいて説明する。図6は、情報処理装置1が実行する処理の一例を示すフローチャートである。
情報処理装置1が実行する処理(探索方法)の流れを図6に基づいて説明する。図6は、情報処理装置1が実行する処理の一例を示すフローチャートである。
S1では、データ取得部101が、フィードバック制御の結果データを取得する。例えば、データ取得部101は、図3に示したような表示画面を表示させ、フィードバック制御の結果データをユーザに入力させてもよい。また、この際に、受付部104は、最適化の設定を受け付けてもよい。具体的な設定内容は、例えば図3に示したような、制御システムのメーカの指定や、フィードバック制御の結果が既知の値の周辺とフィードバック制御の結果が未知の範囲との何れを重視して探索を行うかの選択等であってもよい。
S2(予測分布算出ステップ)では、予測分布算出部102が、S1で取得された結果データを用いて、最適化の対象となる制御パラメータと、該制御パラメータを適用したフィードバック制御の結果との関係を示す関数の予測分布を算出する。予測分布は上述の数式(1)~(3)で表される。なお、2回目以降のS2の処理では先に算出された予測分布の更新が行われる。
S3(探索ステップ)では、探索部103が、S2で算出された予測分布に基づいて制御パラメータの最適値の候補を探索する。より詳細には、探索部103は、獲得関数が最大となる制御パラメータの値を探索する。この処理は上述の数式(4)(5)で表される。なお、S1で受付部104が最適化の設定を受け付けていた場合、探索部103は、S3において、当該設定に従って探索を行う。
S4では、探索部103は、S3で行った探索の結果を出力する。例えば、探索部103は、図4に示したような表示画面を表示させることにより検出した候補をユーザに提示してもよい。
また、S4では、図4に示したような参考情報についても提示してもよい。この場合、予測値提示部105は、S3で検出された候補を適用したときの評価値の平均と分散を用いて算出した予測値を提示する。また、理由提示部106は、上記の平均と分散を用いて提案理由を決定し、決定した提案理由を提示する。そして、変化態様提示部107は、比較対象の値と、S3で検出された候補との差に基づき、操作量の変化態様を特定し、特定した変化態様を示す情報を提示する。上述の比較対象の値とは、典型的にはS1で取得された結果データに示される制御パラメータのうち最新のものである。上述の操作量とは図2のMVである。
S5では、更新要否判定部108が、制御装置3が適用する制御パラメータが変更されたか否かを判定する。例えば、更新要否判定部108は、制御装置3と通信することにより制御パラメータの変更の有無を確認してもよいし、ユーザが情報処理装置1に制御パラメータを変更した旨の入力操作を行った場合に制御パラメータが変更されたと判定してもよい。S5でYESと判定された場合にはS6の処理に進み、S5でNOと判定された場合には図6の処理は終了する。
また、例えば、情報処理装置1と制御装置3とが離れた位置に配置されており、異なるユーザがそれらを操作する場合、探索部103は、以下の処理を行ってもよい。探索部103は、S3で検出した候補を制御装置3のユーザが使用する端末装置に通知し、当該ユーザに制御パラメータの変更を促してもよい。この場合、当該通知を確認した制御装置3のユーザが、制御装置3に対して制御パラメータを変更する操作を行えばよい。この場合、更新要否判定部108は、上記の通知が送信されたことをもって、制御パラメータが変更されたと判定してもよい。
S6では、更新要否判定部108は、制御パラメータの変更後の機器4の動作に問題がないか判定する。例えば、更新要否判定部108は、制御パラメータの変更後の計測値(図2のPV)をデータベース2から読み出し、当該計測値が所定の正常範囲内であるか否かによりS6の判定を行ってもよい。
S6でYESと判定された場合にはS8の処理に進み、S6でNOと判定された場合にはS7の処理に進む。S7では、更新要否判定部108は、制御パラメータを変更させる。例えば、更新要否判定部108は、制御パラメータの変更を促すメッセージをユーザに提示することにより制御パラメータを変更させてもよい。また、例えば、更新要否判定部108は、制御装置3と通信して制御パラメータを変更させてもよい。この場合、更新要否判定部108は、例えば、制御パラメータを変更前の値に戻すように制御装置3に指示してもよい。
なお、S6の処理は、制御パラメータの変更後、所定期間(例えば1時間)の間に、繰り返し行うようにしてもよい。これにより、S3で検出された候補が妥当でなく、機器4の動作に異常が発生したような場合に、その影響を最小限に留めることができる。
S8の処理は、制御パラメータの変更が確認された後、つまりS5でYESと判定された後、所定期間が経過した後で行われる。当該所定期間は機器4の使用態様等に応じて適宜設定すればよく、例えば24時間等としてもよい。S8では、更新要否判定部108は、当該所定期間に計測された計測値(SV)をデータベース2から取得する。
S9では、更新要否判定部108は、S8で取得した計測値(SV)を用いて結果データを生成する。例えば、更新要否判定部108は、S8で取得した計測値(SV)から評価値を算出し、算出した評価値に変更後の制御パラメータを対応付けて結果データを生成してもよい。
S10では、更新要否判定部108は、S9で生成した結果データに含まれる評価値に基づいて、予測分布の更新の要否を判定する。例えば、更新要否判定部108は、評価値が所定の閾値満であった場合に、予測分布の更新が必要と判定してもよい。S10でNOと判定された場合にはS8の処理に戻り、S10でYESと判定された場合にはS1の処理に戻る。この後、S1では、S9で生成された結果データをデータ取得部101が取得し、続くS2では、S1で取得された結果データとS9で生成された結果データとを用いて予測分布算出部102が予測分布を更新する。
以上のように、情報処理装置1が実行する探索方法は、予測分布算出ステップ(S2)と、探索ステップ(S3)と、を含む。予測分布算出ステップ(S2)はフィードバック制御における制御パラメータと、該制御パラメータを適用したフィードバック制御の結果との関係を示す関数の予測分布を算出する。探索ステップ(S3)は、S2で算出された予測分布に基づいて制御パラメータの最適値の候補を探索する。よって、人の主観に左右されずに安定したフィードバック制御を行うことが可能になる。
〔変形例〕
上述の実施形態では、PID制御の制御パラメータの最適値の候補を探索する例を説明したが、情報処理装置1は、PID制御以外の任意のフィードバック制御における任意の制御パラメータの最適値の候補を探索することが可能である。
上述の実施形態では、PID制御の制御パラメータの最適値の候補を探索する例を説明したが、情報処理装置1は、PID制御以外の任意のフィードバック制御における任意の制御パラメータの最適値の候補を探索することが可能である。
また、上述の実施形態で説明した各処理の実行主体は任意であり、上述の例に限られない。つまり、上述の実施形態で説明した各処理を実行可能であれば、制御システム9を構成する装置は適宜変更することができる。例えば、図6に記載の各処理の実行主体は、必ずしも1つの装置である必要はなく、それらの処理を複数の任意の情報処理装置(コンピュータ)に分担させて実行することができる。
〔ソフトウェアによる実現例〕
情報処理装置1(以下、「装置」と呼ぶ)の機能は、当該装置としてコンピュータを機能させるためのプログラムであって、当該装置の各制御ブロック(特に制御部10に含まれる各部)としてコンピュータを機能させるためのプログラム(探索プログラム)により実現することができる。
情報処理装置1(以下、「装置」と呼ぶ)の機能は、当該装置としてコンピュータを機能させるためのプログラムであって、当該装置の各制御ブロック(特に制御部10に含まれる各部)としてコンピュータを機能させるためのプログラム(探索プログラム)により実現することができる。
この場合、上記装置は、上記プログラムを実行するためのハードウェアとして、少なくとも1つの制御装置(例えばプロセッサ)と少なくとも1つの記憶装置(例えばメモリ)を有するコンピュータを備えている。この制御装置と記憶装置により上記プログラムを実行することにより、上記各実施形態で説明した各機能が実現される。
上記プログラムは、一時的ではなく、コンピュータ読み取り可能な、1または複数の記録媒体に記録されていてもよい。この記録媒体は、上記装置が備えていてもよいし、備えていなくてもよい。後者の場合、上記プログラムは、有線または無線の任意の伝送媒体を介して上記装置に供給されてもよい。
また、上記各制御ブロックの機能の一部または全部は、論理回路により実現することも可能である。例えば、上記各制御ブロックとして機能する論理回路が形成された集積回路も本発明の範疇に含まれる。この他にも、例えば量子コンピュータにより上記各制御ブロックの機能を実現することも可能である。
本発明は上述した各実施形態に限定されるものではなく、請求項に示した範囲で種々の変更が可能であり、異なる実施形態にそれぞれ開示された技術的手段を適宜組み合わせて得られる実施形態についても本発明の技術的範囲に含まれる。
〔まとめ〕
本発明の態様1に係る情報処理装置は、フィードバック制御における制御パラメータと、該制御パラメータを適用したフィードバック制御の結果との関係を示す関数の予測分布を算出する予測分布算出部と、前記予測分布に基づいて前記制御パラメータの最適値の候補を探索する探索部と、を備える構成である。
本発明の態様1に係る情報処理装置は、フィードバック制御における制御パラメータと、該制御パラメータを適用したフィードバック制御の結果との関係を示す関数の予測分布を算出する予測分布算出部と、前記予測分布に基づいて前記制御パラメータの最適値の候補を探索する探索部と、を備える構成である。
本発明の態様2に係る情報処理装置は、上記の態様1において、前記フィードバック制御は、廃棄物焼却施設で適用されるフィードバック制御である構成としてもよい。
本発明の態様3に係る情報処理装置は、上記の態様1または2において、前記探索部が検出した前記候補を適用したフィードバック制御の結果を示す結果データを取得するデータ取得部を備え、前記予測分布算出部は、前記候補と前記結果データとを用いて前記予測分布を更新する構成としてもよい。
本発明の態様4に係る情報処理装置は、上記の態様1から3の何れかにおいて、前記候補の探索において、フィードバック制御の結果が既知の値の周辺と、フィードバック制御の結果が未知の範囲と、の何れを重視して探索を行うかの選択を受け付ける受付部を備え、前記探索部は、前記受付部が受け付けた選択に従って前記候補を探索する構成としてもよい。
本発明の態様5に係る情報処理装置は、上記の態様1から4の何れかにおいて、前記フィードバック制御の結果を示す情報として、当該フィードバック制御が行われた期間に計測された計測値のうち所定の許容範囲内である計測値の割合を示す評価値を用いる構成としてもよい。
本発明の態様6に係る情報処理装置は、上記の態様5において、前記所定の許容範囲は、前記フィードバック制御が行われた前記期間に計測された計測値の平均値から、当該期間に計測された前記計測値の標準偏差を引いた値から、前記平均値に前記標準偏差を加えた値までの範囲である構成としてもよい。
本発明の態様7に係る情報処理装置は、上記の態様1から6の何れかにおいて、前記探索部が検出した前記候補を適用したフィードバック制御の結果を取得し、取得した当該結果に基づいて前記予測分布を更新するか否かを判定する処理を、所定期間毎に繰り返し行う更新要否判定部を備える構成としてもよい。
本発明の態様8に係る情報処理装置は、上記の態様1から7の何れかにおいて、前記予測分布の平均と分散から算出された、前記探索部が検出した前記候補を適用したフィードバック制御の結果の予測値を提示する予測値提示部を備える構成としてもよい。
本発明の態様9に係る情報処理装置は、上記の態様1から8の何れかにおいて、前記予測分布の平均と分散に基づき、前記探索部が検出した前記候補が妥当である理由を提示する理由提示部を備える構成としてもよい。
本発明の態様10に係る情報処理装置は、上記の態様1から9の何れかにおいて、前記制御パラメータは、PID(Proportional Integral Differential)制御における、設定値と計測値との偏差に乗じる係数、当該偏差の積分に乗じる係数、および当該偏差の微分に乗じる係数の少なくとも何れかを含み、前記フィードバック制御は、前記偏差と前記係数から制御対象の機器に対する操作量を算出するものであり、比較対象とする前記係数の値と前記候補との差異に基づき、前記探索部が更新後の当該予測分布に基づいて検出した前記候補を適用したときに前記操作量がどのように変化するかを示す情報を提示する変化態様提示部を備える構成としてもよい。
本発明の態様11に係る制御システムは、制御対象の機器に対してフィードバック制御を行う制御装置と、前記フィードバック制御における制御パラメータと、該制御パラメータを適用したフィードバック制御の結果との関係を示す関数の予測分布に基づいて前記制御パラメータの最適値の候補を探索する情報処理装置と、を含み、前記制御装置は、前記候補を適用して制御対象の前記機器に対するフィードバック制御を行う構成である。
本発明の態様12に係る探索方法は、1または複数の情報処理装置が実行する探索方法であって、フィードバック制御における制御パラメータと、該制御パラメータを適用したフィードバック制御の結果との関係を示す関数の予測分布を算出する予測分布算出ステップと、前記予測分布に基づいて前記制御パラメータの最適値の候補を探索する探索ステップと、を含む方法である。
本発明の態様13に係る探索プログラムは、上記の態様1に記載の情報処理装置としてコンピュータを機能させるための探索プログラムであって、前記予測分布算出部および前記探索部としてコンピュータを機能させるための探索プログラムである。
1 情報処理装置
101 データ取得部
102 予測分布算出部
103 探索部
104 受付部
105 予測値提示部
106 理由提示部
107 変化態様提示部
108 更新要否判定部
3 制御装置
9 制御システム
101 データ取得部
102 予測分布算出部
103 探索部
104 受付部
105 予測値提示部
106 理由提示部
107 変化態様提示部
108 更新要否判定部
3 制御装置
9 制御システム
Claims (13)
- フィードバック制御における制御パラメータと、該制御パラメータを適用したフィードバック制御の結果との関係を示す関数の予測分布を算出する予測分布算出部と、
前記予測分布に基づいて前記制御パラメータの最適値の候補を探索する探索部と、を備える情報処理装置。 - 前記フィードバック制御は、廃棄物焼却施設で適用されるフィードバック制御である、請求項1に記載の情報処理装置。
- 前記探索部が検出した前記候補を適用したフィードバック制御の結果を示す結果データを取得するデータ取得部を備え、
前記予測分布算出部は、前記候補と前記結果データとを用いて前記予測分布を更新する、請求項1または2に記載の情報処理装置。 - 前記候補の探索において、フィードバック制御の結果が既知の値の周辺と、フィードバック制御の結果が未知の範囲と、の何れを重視して探索を行うかの選択を受け付ける受付部を備え、
前記探索部は、前記受付部が受け付けた選択に従って前記候補を探索する、請求項1または2に記載の情報処理装置。 - 前記フィードバック制御の結果を示す情報として、当該フィードバック制御が行われた期間に計測された計測値のうち所定の許容範囲内である計測値の割合を示す評価値を用いる、請求項1または2に記載の情報処理装置。
- 前記所定の許容範囲は、前記フィードバック制御が行われた前記期間に計測された計測値の平均値から当該期間に計測された前記計測値の標準偏差を引いた値から、前記平均値に前記標準偏差を加えた値までの範囲である、請求項5に記載の情報処理装置。
- 前記探索部が検出した前記候補を適用したフィードバック制御の結果を取得し、取得した当該結果に基づいて前記予測分布を更新するか否かを判定する処理を、所定期間毎に繰り返し行う更新要否判定部を備える、請求項1または2に記載の情報処理装置。
- 前記予測分布の平均と分散から算出された、前記探索部が検出した前記候補を適用したフィードバック制御の結果の予測値を提示する予測値提示部を備える、請求項1または2に記載の情報処理装置。
- 前記予測分布の平均と分散に基づき、前記探索部が検出した前記候補が妥当である理由を提示する理由提示部を備える、請求項1または2に記載の情報処理装置。
- 前記制御パラメータは、PID(Proportional Integral Differential)制御における、設定値と計測値との偏差に乗じる係数、当該偏差の積分に乗じる係数、および当該偏差の微分に乗じる係数の少なくとも何れかを含み、
前記フィードバック制御は、前記偏差と前記係数から制御対象の機器に対する操作量を算出するものであり、
比較対象とする前記係数の値と前記候補との差異に基づき、前記探索部が更新後の当該予測分布に基づいて検出した前記候補を適用したときに前記操作量がどのように変化するかを示す情報を提示する変化態様提示部を備える、請求項1または2に記載の情報処理装置。 - 制御対象の機器に対してフィードバック制御を行う制御装置と、
前記フィードバック制御における制御パラメータと、該制御パラメータを適用したフィードバック制御の結果との関係を示す関数の予測分布に基づいて前記制御パラメータの最適値の候補を探索する情報処理装置と、を含み、
前記制御装置は、前記候補を適用して制御対象の前記機器に対するフィードバック制御を行う、制御システム。 - 1または複数の情報処理装置が実行する探索方法であって、
フィードバック制御における制御パラメータと、該制御パラメータを適用したフィードバック制御の結果との関係を示す関数の予測分布を算出する予測分布算出ステップと、
前記予測分布に基づいて前記制御パラメータの最適値の候補を探索する探索ステップと、を含む探索方法。 - 請求項1に記載の情報処理装置としてコンピュータを機能させるための探索プログラムであって、前記予測分布算出部および前記探索部としてコンピュータを機能させるための探索プログラム。
Applications Claiming Priority (2)
| Application Number | Priority Date | Filing Date | Title |
|---|---|---|---|
| JP2022126606A JP2024023054A (ja) | 2022-08-08 | 2022-08-08 | 情報処理装置、制御システム、探索方法、および探索プログラム |
| JP2022-126606 | 2022-08-08 |
Publications (1)
| Publication Number | Publication Date |
|---|---|
| WO2024034243A1 true WO2024034243A1 (ja) | 2024-02-15 |
Family
ID=89851332
Family Applications (1)
| Application Number | Title | Priority Date | Filing Date |
|---|---|---|---|
| PCT/JP2023/020964 Ceased WO2024034243A1 (ja) | 2022-08-08 | 2023-06-06 | 情報処理装置、制御システム、探索方法、および探索プログラム |
Country Status (3)
| Country | Link |
|---|---|
| JP (1) | JP2024023054A (ja) |
| TW (1) | TW202422249A (ja) |
| WO (1) | WO2024034243A1 (ja) |
Citations (3)
| Publication number | Priority date | Publication date | Assignee | Title |
|---|---|---|---|---|
| JP2004038428A (ja) * | 2002-07-02 | 2004-02-05 | Yamatake Corp | 制御対象モデル生成方法、制御パラメータ調整方法、制御対象モデル生成プログラムおよび制御パラメータ調整プログラム |
| JP2009116515A (ja) * | 2007-11-05 | 2009-05-28 | Fuji Electric Systems Co Ltd | Pidパラメータ調節支援装置 |
| JP2021135940A (ja) * | 2020-02-28 | 2021-09-13 | 日立造船株式会社 | 情報処理装置、制御システム、制御変数決定方法、および制御変数決定プログラム |
-
2022
- 2022-08-08 JP JP2022126606A patent/JP2024023054A/ja active Pending
-
2023
- 2023-06-06 WO PCT/JP2023/020964 patent/WO2024034243A1/ja not_active Ceased
- 2023-06-16 TW TW112122620A patent/TW202422249A/zh unknown
Patent Citations (3)
| Publication number | Priority date | Publication date | Assignee | Title |
|---|---|---|---|---|
| JP2004038428A (ja) * | 2002-07-02 | 2004-02-05 | Yamatake Corp | 制御対象モデル生成方法、制御パラメータ調整方法、制御対象モデル生成プログラムおよび制御パラメータ調整プログラム |
| JP2009116515A (ja) * | 2007-11-05 | 2009-05-28 | Fuji Electric Systems Co Ltd | Pidパラメータ調節支援装置 |
| JP2021135940A (ja) * | 2020-02-28 | 2021-09-13 | 日立造船株式会社 | 情報処理装置、制御システム、制御変数決定方法、および制御変数決定プログラム |
Also Published As
| Publication number | Publication date |
|---|---|
| JP2024023054A (ja) | 2024-02-21 |
| TW202422249A (zh) | 2024-06-01 |
Similar Documents
| Publication | Publication Date | Title |
|---|---|---|
| CN115983114B (zh) | 一种窑炉温度预测方法、系统、设备及介质 | |
| US8002871B2 (en) | Methods and apparatus for an oxygen furnace quality control system | |
| US6381554B1 (en) | Method of prediction time-series continuous data and a control method using the prediction method | |
| CN120425130B (zh) | 球墨铸铁管连续式退火炉温度分布优化控制系统及方法 | |
| CN115591493A (zh) | 一种反应釜温度控制方法 | |
| KR20220092795A (ko) | 정보 처리 장치, 정보 처리 시스템 및 부품 발주 방법 | |
| JP6897723B2 (ja) | 学習モデル生成方法、学習モデル生成装置、高炉の溶銑温度制御方法、高炉の溶銑温度制御ガイダンス方法、及び溶銑の製造方法 | |
| JP4061008B2 (ja) | 結果予測装置、方法、及びコンピュータ読み取り可能な記憶媒体 | |
| JP2016170753A (ja) | プラント制御用のデータ処理装置、プラント制御用のデータ処理装置を備えるプラント、およびプラントの制御パラメータの自動調整方法 | |
| WO2024034243A1 (ja) | 情報処理装置、制御システム、探索方法、および探索プログラム | |
| CN114217592A (zh) | 一种用于铜顶吹生产过程的控制系统及方法 | |
| CN120740307B (zh) | 一种基于人工智能的陶粒回转窑温度监测方法及系统 | |
| CN120598473A (zh) | 智能化仓储管理系统及管理方法 | |
| Zhang et al. | Steel Scrap Yield Prediction in Basic Oxygen Steelmaking Based on Random Forest and Neural Networks | |
| CN119847244A (zh) | 一种用于空气预热器的温度控制方法及系统 | |
| CN119446312A (zh) | 一种高炉布袋除尘灰碳铁锌分离全周期的在线监测管理方法及系统 | |
| JP2000129319A (ja) | 高炉炉熱制御方法及び装置 | |
| CN116339403A (zh) | 湿法脱硫pH值控制方法、装置、存储介质及电子设备 | |
| CN116449788A (zh) | 一种钢厂铸坯生产过程故障检测与产能优化的方法 | |
| CN115198047A (zh) | 基于大数据分析的热风炉燃烧监测系统及方法 | |
| JP4381628B2 (ja) | 濃縮設備の濃縮度制御装置及び濃縮度制御方法 | |
| CN119759140B (zh) | 半导体量测检测机台的温度控制方法以及相关设备 | |
| CN120740336B (zh) | 用于挥发窑燃料供给的控制方法及系统 | |
| JP2001355010A (ja) | 操業支援装置、操業支援方法および記録媒体 | |
| JP2724364B2 (ja) | 高炉の操業方法 |
Legal Events
| Date | Code | Title | Description |
|---|---|---|---|
| 121 | Ep: the epo has been informed by wipo that ep was designated in this application |
Ref document number: 23852227 Country of ref document: EP Kind code of ref document: A1 |
|
| NENP | Non-entry into the national phase |
Ref country code: DE |
|
| 122 | Ep: pct application non-entry in european phase |
Ref document number: 23852227 Country of ref document: EP Kind code of ref document: A1 |