WO2024029224A1 - 画像処理方法、画像処理装置、プログラムおよび画像処理システム - Google Patents
画像処理方法、画像処理装置、プログラムおよび画像処理システム Download PDFInfo
- Publication number
- WO2024029224A1 WO2024029224A1 PCT/JP2023/023284 JP2023023284W WO2024029224A1 WO 2024029224 A1 WO2024029224 A1 WO 2024029224A1 JP 2023023284 W JP2023023284 W JP 2023023284W WO 2024029224 A1 WO2024029224 A1 WO 2024029224A1
- Authority
- WO
- WIPO (PCT)
- Prior art keywords
- map
- image
- image processing
- captured image
- blur
- Prior art date
- Legal status (The legal status is an assumption and is not a legal conclusion. Google has not performed a legal analysis and makes no representation as to the accuracy of the status listed.)
- Ceased
Links
Images


Classifications
-
- G—PHYSICS
- G06—COMPUTING OR CALCULATING; COUNTING
- G06T—IMAGE DATA PROCESSING OR GENERATION, IN GENERAL
- G06T5/00—Image enhancement or restoration
-
- G—PHYSICS
- G06—COMPUTING OR CALCULATING; COUNTING
- G06T—IMAGE DATA PROCESSING OR GENERATION, IN GENERAL
- G06T7/00—Image analysis
-
- G—PHYSICS
- G06—COMPUTING OR CALCULATING; COUNTING
- G06T—IMAGE DATA PROCESSING OR GENERATION, IN GENERAL
- G06T7/00—Image analysis
- G06T7/50—Depth or shape recovery
-
- G—PHYSICS
- G06—COMPUTING OR CALCULATING; COUNTING
- G06V—IMAGE OR VIDEO RECOGNITION OR UNDERSTANDING
- G06V10/00—Arrangements for image or video recognition or understanding
- G06V10/70—Arrangements for image or video recognition or understanding using pattern recognition or machine learning
-
- H—ELECTRICITY
- H04—ELECTRIC COMMUNICATION TECHNIQUE
- H04N—PICTORIAL COMMUNICATION, e.g. TELEVISION
- H04N23/00—Cameras or camera modules comprising electronic image sensors; Control thereof
- H04N23/60—Control of cameras or camera modules
Definitions
- the present invention relates to an image processing method that performs a recognition or regression task using a machine learning model on a captured image in which blur has occurred.
- Non-Patent Document 1 discloses a method of sharpening the blur of a captured image using a convolutional neural network (CNN), which is one of the machine learning models.
- CNN convolutional neural network
- a training data set is generated by blurring images with signal values greater than the brightness saturation value of the captured image, and by training a CNN with this training data set, the negative effects are suppressed even around the brightness saturation region, and the blur is sharpened. can be converted into
- artifacts may occur in the subject at positions unrelated to brightness saturation.
- the artifact is a local decrease or increase in signal value that differs from the actual structure of the object. Note that details of the artifact and the reason for its occurrence will be described later. Even in tasks for images with blur other than sharpened blur, the accuracy of the task similarly decreases due to the influence of brightness saturation.
- an object of the present invention is to provide an image processing method that can suppress a decrease in task accuracy due to brightness saturation in a recognition or regression task using machine learning for a captured image in which blur has occurred.
- An image processing method as one aspect of the present invention includes a step of acquiring a first map generated by inputting a captured image obtained by imaging into a first machine learning model, and a step of obtaining a first map generated by inputting a captured image obtained by imaging into a first machine learning model, and a step of obtaining a first map generated by inputting a captured image obtained by imaging into a first machine learning model, and a step of obtaining a first map generated by inputting a captured image obtained by imaging into a first machine learning model, generating a second map by modifying the first map based on information regarding the position of the region, and the first map is configured such that the object in the brightness saturated region occurs in the imaging.
- the information is characterized in that it is information representing an area expanded by the blurred image and a signal value in the area.
- an image processing method that can suppress a decrease in task accuracy due to brightness saturation in a recognition or regression task using machine learning for a captured image in which blur has occurred.
- FIG. 3 is a diagram illustrating a model output generation process in Example 1.
- FIG. FIG. 3 is an explanatory diagram of a relationship between a subject and a captured image and a first map in Examples 1 to 3.
- FIG. 3 is an explanatory diagram of a captured image, a first map, and a model output in Example 1.
- FIG. 1 is a block diagram of an image processing system in Example 1.
- FIG. 1 is an external view of an image processing system in Example 1.
- FIG. FIG. 3 is an explanatory diagram of artifacts in Example 1.
- 3 is a flowchart of training of first and second machine learning models in Examples 1 to 3.
- FIG. FIG. 3 is a diagram illustrating the process of training first and second machine learning models in Example 1.
- FIG. 3 is an explanatory diagram regarding a training data set in Example 1.
- FIG. 3 is a flowchart of estimation of first and second machine learning models in Example 1 or 2.
- FIG. 3 is a block diagram of an image processing system in Example 2.
- FIG. 3 is an external view of an image processing system in Example 2.
- FIG. 6 is an explanatory diagram of modification to the first map in Example 2;
- 3 is a block diagram of an image processing system in Example 3.
- FIG. 3 is an external view of an image processing system in Example 3.
- FIG. 7 is a flowchart of estimation of first and second machine learning models in Example 3.
- the above-mentioned factor includes brightness saturation (also called overexposure) of the captured image.
- brightness saturation also called overexposure
- a theory-based method such as a Wiener filter
- a method using machine learning can sharpen the blur even if brightness saturation exists, as in Non-Patent Document 1.
- the method disclosed in Non-Patent Document 1 has a problem in that artifacts occur in the corrected image.
- An object of the present invention is to suppress the decrease in task accuracy (artifacts mentioned above) that occurs due to brightness saturation when a machine learning model performs a recognition or regression task on a captured image in which blur has occurred.
- blur refers to blur caused by aberration, diffraction, or defocus of the optical system used to capture the captured image, blur caused by an optical low-pass filter, blur caused by the pixel aperture of the image sensor, or blur caused by camera shake or subject blur during image capture. Refers to either blur, etc. Or, it refers to a combination of multiple of these.
- the recognition task is a task for determining a class corresponding to an input image.
- recognition tasks include tasks that recognize the nature and meaning in images, such as classifying objects in images as people, dogs, cars, etc., and classifying facial images into facial expressions such as smiling faces and crying faces. It will be done.
- Classes are generally discrete variables.
- a class is a signal sequence in which recognition labels such as scalar values or recognition labels such as a segmentation map are spatially arranged.
- a regression task refers to a task of obtaining a signal sequence in which continuous variables corresponding to an input image are spatially arranged. Examples of regression tasks include a task of estimating a sharpened image from a blurred image, a task of estimating a depth map of a subject space from an image, and the like.
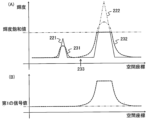
- FIG. 2A is a diagram showing the relationship between the brightness distribution of a subject and a captured image.
- the horizontal axis represents spatial coordinates
- the vertical axis represents luminance.
- the solid line is a captured image without blur
- the broken line is an actual captured image with blur.
- the dashed line represents the luminance distribution before being clipped at luminance saturation. Even if the subject 221 is blurred during the imaging process, it only has a luminance that is less than the luminance saturation value.
- the subject 221 becomes a non-saturated blurred image 231.
- the object 222 since the object 222 has a brightness higher than the brightness saturation value as a result of being blurred during the imaging process, clipping occurs due to the brightness saturation value, and the object 222 becomes a saturated blurred image 232.
- object information is attenuated due to blurring.
- subject information is attenuated not only due to blurring but also due to signal value clipping due to brightness saturation. Therefore, the manner in which subject information attenuates differs depending on the presence or absence of brightness saturation. This is the first factor that causes the characteristics to differ between the surrounding area including the brightness saturated area and the other areas.
- the saturated blurred image 232 originally has a brightness distribution represented by a dashed-dotted line in an area equal to or higher than the brightness saturation value, so it has a smooth distribution, but discontinuous edges are formed due to clipping of the brightness saturation value.
- the third element with different properties is that in the surrounding area including the brightness saturated area, it is not possible to separate the signal value of the subject from the signal value leaked due to blur (even if the shape of the blur is known). be.
- the surrounding area including the brightness saturated area has different properties from the other areas, so a highly accurate task cannot be achieved unless different processing is performed for each area.
- a machine learning model can perform processing with different effects depending on the characteristics of the image, rather than processing with a uniform effect on the input image. Therefore, for example, when considering an example of sharpening the blur of a captured image, the machine learning model determines whether the focused area is a blurred image that includes luminance saturation (saturated blurred image) or a blurred image that does not include brightness saturation (unsaturated blurred image). internally and performs different sharpening processes. As a result, both blurred images can be sharpened. However, there are cases where the machine learning model makes incorrect decisions. For example, in the saturated blurred image 232 in FIG.
- the machine learning model will determine that the area of interest is affected by the effect of saturated brightness because there is a saturated area of brightness near the area of interest. It can be determined that this is the area that has been affected. However, if the region of interest is a position 233 that is far from the brightness saturated area, it is not easy to determine whether the position 233 is affected by brightness saturation, and ambiguity increases. As a result, the machine learning model may make an erroneous determination at a position 233 far from the brightness saturation region. As a result, when the task is to sharpen a blur, the sharpening process corresponding to a saturated blur image is executed on a non-saturated blur image. At this time, artifacts occur in the sharpened image, reducing the accuracy of the task. This artifact will be explained in detail in Example 1.
- a first machine learning model is used to generate a first map from a captured image that has been blurred during the imaging process.
- the first map is a map that expresses the relationship between the range of an area where the subject in the brightness saturated area of the captured image has expanded due to blur generated by imaging, and the magnitude of the signal value corresponding to the area.
- the first map is a map (a spatially arranged signal). It can also be said that In other words, the first map is a map that represents the spread of brightness values in high brightness areas including brightness saturated areas of the captured image (a subject whose brightness is so high that it reaches brightness saturation spreads due to blurring caused during the imaging process). (This is a map representing the distribution).
- the first map for the captured image in FIG. 2(A) is shown by a broken line in FIG. 2(B).
- subsequent tasks such as sharpening blur
- the processing that should be executed in the area can be executed in each appropriate area. Therefore, by having the first machine learning model generate the first map, the accuracy of the task is improved.
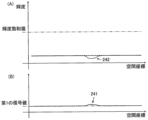
- FIG. 3 is an explanatory diagram of a captured image, a first map, and a model output.
- the model output in FIG. 3 is a sharpened blur image in which the blur of the captured image is sharpened.
- the first map shown by the broken line in FIG. 3(B) may be estimated for the captured image shown by the broken line in FIG. 3(A). Since FIG. 3A shows an object with a flat signal distribution below the luminance saturation value, it is correct that all the first maps have the same value (first signal value) representing a non-saturated blurred image.
- first signal value representing a non-saturated blurred image.
- region 241 having a value representing the influence of brightness saturation may be generated. This is an erroneous estimation that occurs due to the learning method of the machine learning model. The principle by which this erroneous estimation occurs will be described in detail in the description of the first embodiment. Since region 241 exists in the first map, when sharpening the blur is performed based on the first map, as shown by the solid line in FIG. 3(A), the sharpened blur image (model output) An artifact region 242 occurs that does not exist in the actual subject.
- the second map is further generated by modifying the first map based on information regarding the position of the brightness saturated region of the captured image.
- the first map should not have values representing the influence of brightness saturation at positions unrelated to the brightness saturated region of the captured image. Therefore, it is possible to generate a second map that corrects the erroneous estimation of the first map based on the information regarding the position of the saturated region. This allows the accuracy of the task to be further improved.
- Machine learning models include, for example, neural networks, genetic programming, Bayesian networks, and the like.
- Neural networks include CNN (Convolutional Neural Network), GAN (Generative Adversarial Network), RNN (Recurrent Neural Network), Transformer, and the like.
- Example 1 An image processing system 100 according to a first embodiment of the present invention will be described. In this embodiment, the task executed after generating the second map is to sharpen the blur of a captured image that includes brightness saturation.
- Sharpening blur refers to aberrations and diffraction generated in the optical system, and blur caused by optical low-pass filters.
- the effects of the invention can be similarly obtained when blurring due to pixel aperture, defocus, or blurring is sharpened.
- the invention can be implemented in the same manner and the effects can be obtained for tasks other than blur sharpening.
- FIG. 4 is a block diagram of the image processing system 100 in this embodiment.
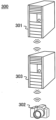
- FIG. 5 is an external view of the image processing system 100.
- the image processing system 100 includes a training device 101 and an image processing device 103 that are connected via a wired or wireless network.
- the training device 101 includes a storage section 101a, an acquisition section 101b, a calculation section 101c, and an update section 101d.
- the image processing device 103 includes a storage section 103a, an acquisition section 103b, and a calculation section 103c.
- An imaging device 102, a display device 104, a recording medium 105, and an output device 106 are connected to the image processing device 103 by wire or wirelessly.
- the imaging device 102 includes an optical system 102a and an image sensor 102b.
- a captured image of the subject space using the imaging device 102 is input to the image processing device 103.
- blurring occurs due to aberrations and diffraction caused by the optical system 102a in the imaging device 102 and the optical low-pass filter of the imaging element 102b, and information about the subject is attenuated.
- the image processing device 103 estimates a first map from the captured image using the first machine learning model. Furthermore, the image processing device 103 generates a second map by modifying the first map based on information regarding the position of the saturated region of the captured image, and uses the second machine learning model to A sharpened blur image (model output) is generated from the map No. 2.
- the first and second machine learning models are trained by the training device 101, and the image processing device 103 acquires information regarding the first and second machine learning models from the training device 101 in advance and stores it in the storage unit 103a. I remember. Furthermore, the image processing device 103 has a function of adjusting the intensity of blur sharpening. Note that details of training and estimation of the first and second machine learning models and adjustment of intensity of blur sharpening will be described later.
- the user can adjust the intensity of the sharpened blur while checking the sharpened blur image displayed on the display device 104.
- the sharpened blurred image subjected to intensity adjustment is stored in the storage unit 103a or the recording medium 105, and is outputted to an output device 106 such as a printer as necessary.
- each of the training device 101 and the image processing device 103 has processing means suitable for parallel calculation, such as a GPU (Graphics Processing Unit), which can process machine learning models at high speed.
- the captured image may be grayscale or may have a plurality of color components. Further, the captured image may be an undeveloped RAW image or a developed image.
- FIGS. 6A to 6C are explanatory diagrams of artifacts, in which the horizontal axis indicates spatial coordinates and the vertical axis indicates signal values.
- FIGS. 6A to 6C show spatial changes in image signal values, which correspond to R, G, and B (Red, Green, and Blue) color components, respectively.
- the image is an image developed to 8 bits, and the brightness saturation value is 255.
- the dashed-dotted line is the captured image (blurred image), and the thin solid line is the correct image without blur. Since none of the pixels has reached the brightness saturation value, there is no effect of brightness saturation.
- the dotted line is a sharpened blur image in which the blur of the captured image is sharpened using a conventional machine learning model to which this embodiment is not applied.
- the edge blur is sharpened, but a decrease in signal value occurs near the center that is not present in the correct image. This reduction is a problem different from undershoot because it occurs not adjacent to the edge but at a distant position, and the area in which it occurs is wide. This is an artifact that occurs when sharpening the blur.
- the degree of decrease in signal value differs depending on the color component.
- the degree of decrease in signal value increases in the order of G, R, and B. A similar tendency is observed even in undeveloped RAW images. Therefore, although the correct image has a flat area, in the conventional blurred and sharpened image represented by the dotted line, a green-colored dark area occurs as an artifact. Note that although FIGS. 6A to 6C show an example in which the signal decreases from the correct image, there are cases in which the signal value increases conversely.
- the reason why this artifact occurs is that the machine learning model incorrectly determines areas affected by brightness saturation and other areas, and sharpens the blur that should be applied to saturated blurred images instead of applying sharpening to unsaturated blurred images. This is because it was executed incorrectly.
- the greater the brightness of the subject the greater the absolute value of the residual component of sharpening the blur (the difference between the captured image and the captured image without blur). Therefore, if the blur sharpening that should be applied to a saturated blurred image is performed on a non-saturated blurred image, the signal value will change excessively. As a result, areas where the signal value is smaller than the correct image (solid line) are generated, as shown by the dotted lines in FIGS. 6(A) to 6(C).
- optical systems targeting visible light are often designed so that the performance of G among RGB is the best.
- the spread of blur PSF: point spread intensity distribution
- the edges of a saturated blurred image of a high-brightness subject tend to be colored in R and B (purple fringing is caused by this). (applicable).
- the residual component of blur sharpening in R and B becomes larger than in G. Therefore, if a non-saturated blurred image is incorrectly determined to be a saturated blurred image, the decrease in R and B signal values will be greater than that of G, and as shown in FIGS. 6(A) to (C), a green-colored dark Artifacts occur as areas.
- FIGS. 6A to 6C are the results of sharpening the blur using this embodiment. It can be seen that the occurrence of artifacts is suppressed and the blur is sharpened. This is because the first map and the second map that corrects the misestimation make it difficult for the second machine learning model that sharpens the blur to misjudge areas affected by brightness saturation and other areas. This is to become. It can be seen from FIGS. 6A to 6C that the present example suppresses a decrease in task accuracy.
- FIG. 7 is a flowchart of training the first and second machine learning models. Each step in FIG. 7 is executed by the storage unit 101a, the acquisition unit 101b, the calculation unit 101c, or the update unit 101d of the training device 101.
- the acquisition unit 101b acquires one or more original images from the storage unit 101a.
- the original image is an image that has a signal value greater than the second signal value.
- the second signal value is a signal value corresponding to the brightness saturation value of the captured image.
- the signal value may be normalized when inputting to the first and second machine learning models, the second signal value and the brightness saturation value of the captured image do not necessarily have to match. Since the first and second machine learning models are trained based on the original image, it is desirable that the original image has various frequency components (edges with different directions and strengths, gradations, flat areas, etc.) .
- the original image may be a real image or may be CG (Computer Graphics).
- step S102 the calculation unit 101c adds blur to the original image to generate a blurred image.
- the blurred image is an image input to the first and second machine learning models during training, and corresponds to a captured image during estimation.
- the added blur is the blur to be sharpened.
- blur caused by the aberration and diffraction of the optical system 102a and the optical low-pass filter of the image sensor 102b is imparted.
- the shape of the blur caused by the aberration and diffraction of the optical system 102a changes depending on the image plane coordinates (image height and azimuth). It also changes depending on the zooming, aperture, and focus states of the optical system 102a.
- the calculation unit 101c sets the first region based on the image based on the original image and the signal value threshold.
- a blurred image is used as the image based on the original image, but the original image itself may also be used.
- the first region is set by comparing the signal value of the blurred image and the signal value threshold. More specifically, the area where the signal value of the blurred image is equal to or greater than the signal value threshold is defined as the first area.
- the signal value threshold is the second signal value. Therefore, the first region represents the brightness saturated region of the blurred image.
- the signal value threshold and the second signal value do not necessarily have to match.
- the signal value threshold may be set to a value slightly smaller than the second signal value (for example, 0.9 times).
- step S104 the calculation unit 101c generates a first image having the signal value of the original image in the first region.
- the first image has different signal values from the original image in areas other than the first area. More preferably, the first image has the first signal value in a region other than the first region. In this embodiment, the first signal value is 0, but is not limited to this. That is, in this embodiment, in the first image, the blurred image has the signal value of the original image only in the brightness saturated area, and the signal value in the other area is 0.
- step S105 the calculation unit 101c adds blur to the first image and generates a first correct map.
- the added blur is the same as the blur added to the blurred image.
- a first correct map is generated, which is a map (a spatially arranged signal sequence) representing the magnitude and range of signal values leaked from the subject in the brightness saturated region of the blurred image to the surrounding area due to blurring. Ru.
- the first correct map is clipped with the second signal value as in the case of a blurred image, but it is not necessary to clip the first correct map with the second signal value.
- step S106 the acquisition unit 101b acquires the correct model output.
- the correct model output is an image with less blur than the blurred image.
- the correct model output is generated by clipping the original image with the second signal value. If the original image lacks high frequency components, an image obtained by reducing the original image may be used as the correct model output. In this case, reduction is similarly performed when generating a blurred image in step S102.
- step S106 may be executed at any time after step S101 and before step S107. Up to step S106, the training data (or training data set if there is a plurality of blurred images) used for training the first and second machine learning models is prepared.
- step S107 the calculation unit 101c uses the first and second machine learning models to generate a first map and model output based on the blurred image.
- FIG. 8 is a diagram showing the training process of the first and second machine learning models. In this embodiment, the configuration shown in FIG. 8 is used in training the first and second machine learning models, but the configuration is not limited to this.
- a blurred image 251 and a brightness saturation map 252 are input to the first machine learning model 211.
- the blurred image 251 and the brightness saturation map 252 have a spatially two-dimensional signal distribution, in FIG. 8, for ease of explanation, they are drawn as a one-dimensional signal distribution in a certain cross section.
- the brightness saturation map 252 is a map showing areas of the blurred image 251 where the brightness is saturated (the signal value is greater than or equal to the second signal value).
- the brightness saturation map 252 can be generated by binarizing the blurred image 251 with a second signal value.
- a brightness saturation map 252 is generated by normalizing a blurred image 251 using a second signal value and binarizing it using 1 as a threshold.
- the method of generating the brightness saturation map 252 is not limited to this.
- the brightness saturation map 252 is not necessarily essential.
- the blurred image 251 and the brightness saturation map 252 are connected in the channel direction and input to the first machine learning model 211.
- this embodiment is not limited to this.
- the blurred image 251 and the brightness saturation map 252 may each be converted into feature maps, and these feature maps may be connected in the channel direction.
- information other than the brightness saturation map 252 may be added to the input.
- the first machine learning model 211 and the second machine learning model 212 have multiple layers, and in each layer, a linear sum of the input and weight of the layer is taken.
- the initial value of the weight can be determined using random numbers or the like.
- This example uses a CNN that uses convolution of an input and a filter as a linear sum (the value of each element of the filter corresponds to a weight, and may also include a sum with a bias), and uses the first and second machine learning methods.
- models 211 and 212 the present invention is not limited thereto.
- nonlinear transformation is performed using an activation function such as a ReLU (Rectified Linear Unit) or a sigmoid function, as necessary.
- the first and second machine learning models 211 and 212 may have a residual block or a Skip Connection (also referred to as a Shortcut Connection) as necessary.
- the first machine learning model 211 generates a first map 253.
- the first correct map 254 and the blurred image 251 are connected in the channel direction and input to the second machine learning model 212 to generate a model output 255.
- the first map 253 or a second map obtained by modifying the first map 253 based on information regarding the position of the saturated region of the blurred image 251 is used as the second machine learning model.
- 212 may be entered. Note that the training of the first and second machine learning models 211 and 212 does not need to be performed simultaneously, and may be performed separately.
- the updating unit 101d updates the weights of the first machine learning model 211 and the second machine learning model 212 based on the loss function.
- the loss function of the first machine learning model 211 is based on the first map 253 and the first ground truth map 254.
- the loss function of the second machine learning model 212 is based on the model output 255 and the ground truth model output.
- MSE Mel Squared Error
- step S109 the update unit 101d determines whether training of the first machine learning model 211 and the second machine learning model 212 is completed. Completion of training can be determined based on whether the number of repetitions of weight updates has reached a predetermined number, or whether the loss function at the time of update or the amount of change in the weights at the time of update is smaller than a predetermined value. If it is determined in step S109 that the training has not been completed, the process returns to step S101, and the acquisition unit 101b acquires one or more new original images. On the other hand, if it is determined that the training has been completed, the updating unit 101d ends the training and stores information on the configurations and weights of the first and second machine learning models 211 and 212 in the storage unit 101a.
- the first machine learning model 211 generates a first map 253 that represents the magnitude and range of signal values spread by blurring of a subject in a brightness saturated area of the blurred image 251 (captured image at the time of estimation). It can be estimated. However, as shown in FIG. 8, an erroneous estimation region 260 due to the learning method may occur in the first map 253.
- FIGS. 9(A) and 9(B) are explanatory diagrams regarding the training data set in this example.
- the horizontal axis represents spatial coordinates
- the vertical axis represents brightness, respectively.
- the broken line represents the blurred image 251
- the solid line represents the correct model output 256.
- the dashed line represents the signal value before being clipped at the brightness saturation value.
- the left side of the blurred image 251 is a non-saturated blurred image because there is no clipping due to the brightness saturation value, and the right side of the blurred image 251 is a saturated blurred image.
- the broken line is the first correct map 254 corresponding to FIG. 9(A).
- the first machine learning model 211 is trained using the region 261 shown in FIGS. 9(A) and 9(B). At this time, the first machine learning model 211 needs to estimate the first correct map 254 from the input blurred image 251. However, since there is no luminance saturated area within the area 261, it is impossible to determine that the left side of the blurred image 251 is a non-saturated blurred image and that the right side of the blurred image 251 is a saturated blurred image.
- the trained first machine learning model 211 cannot estimate the first correct map 254 from the blurred image 251, and estimates the solution that minimizes the loss function, for example, as shown by the solid line in FIG. 9(B).
- a first map 253 is estimated. This first map 253 has an erroneous estimation area at a position corresponding to a non-saturated blurred image of the blurred image 251. Due to this principle, the erroneous estimation region 260 shown in FIG. 8 occurs.
- a method in which a blurred image 251 (region 261 indicated by a broken line in FIG. 9A) is input to the first machine learning model 211 and only the region 262 of the estimated first map 253 excluding the surrounding area is used. be.
- the weights of the first machine learning model 211 are updated using the loss functions of the first map 253 and the first correct map 254 in the region 262.
- the erroneous estimation region is suppressed by correcting the first map during estimation after training.
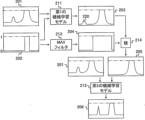
- FIG. 1 is a diagram showing the process of generating model output.
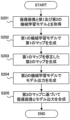
- FIG. 10 is a flowchart of estimation of the first and second machine learning models. Each step in FIG. 10 is executed by the storage unit 103a, the acquisition unit 103b, or the calculation unit 103c of the image processing device 103.
- step S201 the acquisition unit (acquisition means) 103b acquires the captured image 201, the first machine learning model 211, and the second machine learning model 212. Information on the configurations and weights of the first and second machine learning models 211 and 212 is acquired from the storage unit 103a.
- the calculation unit (generation means) 103c uses the first machine learning model 211 to generate a first map 203 from the captured image 201 and the brightness saturation map 202 corresponding to the captured image 201.
- the configuration of the first machine learning model 211 is the same as that during training.
- the first map 203 is a map that represents the magnitude and range of signal values in an area where the subject in the brightness saturated area of the captured image 201 has expanded due to blurring that occurs during the imaging process of the captured image 201.
- the first map 203 may have an erroneous estimation area 220 at a position unrelated to the saturated blurred image. Note that, in general, the saturation signal value of each pixel of the image sensor 102b does not have a constant value due to manufacturing variations.
- the design value of brightness saturation in the image sensor 102b is multiplied by a coefficient of 1 or less (such as 0.9; the value can be determined depending on the size of manufacturing variation).
- the value may be a brightness saturation value for all pixels of the captured image 201.
- step S203 the calculation unit 103c generates a second map 205 in which the incorrect estimation area 220 of the first map 203 is corrected based on information regarding the position of the brightness saturated area of the captured image 201.
- the first map 203 is corrected by the method shown in FIG. 1, but the invention is not limited to this.
- a third map 204 is generated.
- the third map 204 represents an area within a predetermined range from each saturated pixel of the captured image 201 and other areas.
- the size of the predetermined range is determined by the filter size of the MAX filter 213 in this embodiment.
- the filter size of the MAX filter 213 may be determined based on the spread of blur that occurs in the captured image 201.
- the filter to be convolved may be other than the MAX filter 213.
- the third map 204 may be generated by convolving a filter in which all elements are 1 and binarizing it as zero or non-zero.
- the third map 204 is a map that distinguishes between areas surrounding the brightness saturated area including the brightness saturated area and other areas in the captured image 201. 1, and has a value of 0 in other areas.
- a second map 205 is generated using an element-by-element product operation 214 of the first map 203 and the third map 204.
- the method for correcting the first map 203 shown in this embodiment is composed of convolution and product operations, and therefore can be easily executed by parallel computing means such as a GPU. Therefore, when the estimation of the first and second machine learning models 211 and 212 is executed by parallel calculation means, steps S202 to S204 can be executed continuously by the same parallel calculation means, and high-speed processing is possible. It is. Note that the third map 204 may be generated before step S203.
- threshold processing may be performed on the first map 203 or the second map 205.
- threshold processing is effective in a case where a very weak misestimation component exists over a wide area of the first map 203 or the second map 205.
- the threshold processing is soft thresholding processing so that the values of the first map 203 or the second map 205 do not become discontinuous with the threshold as a boundary.
- the first map 203 or the second map 205 may be rescaled by a coefficient so that the maximum value of the first map 203 or the second map 205 does not change.
- FIG. 1 depicts the case where the captured image 201 has a single color component, but if the captured image 201 has a plurality of color components, step S203 is executed for each color component.
- step S204 the calculation unit 103c uses the second machine learning model 212 to generate a model output 206, which is an image in which the blur of the captured image 201 is sharpened, from the captured image 201 and the second map 205. .
- the second machine learning model 212 can discriminate between a non-saturated blurred image and a saturated blurred image with high accuracy. Therefore, the second machine learning model 212 can suppress the occurrence of artifacts and sharpen the blur.
- methods other than machine learning may be used to sharpen the blur.
- the second map 205 allows highly accurate discrimination between regions of unsaturated blurred images and saturated blurred images, it is preferable to sharpen the regions using methods suitable for each.
- the unsaturated blurred image area may be sharpened using a Wiener filter, only the saturated blurred image area may be sharpened using the second machine learning model 212, and the results of both may be combined.
- step S205 the calculation unit 103c combines the captured image 201 and the model output 206, which is an image corresponding to the captured image 201, based on the second map 205.
- the surrounding area including the brightness saturated area of the captured image 201 object information is attenuated due to brightness saturation compared to other areas, so it is difficult to sharpen the blur (estimating the attenuated object information). . Therefore, in the surrounding area including the luminance saturated area, problems (ringing, undershoot, etc.) associated with the sharpening of the blur are likely to occur.
- the model output 206 and the captured image 201 are combined.
- the weight of the captured image 201 is applied only to the surrounding area including the luminance saturated area where harmful effects are likely to occur. can be made stronger.
- synthesis is performed using the following method.
- the second map 205 is normalized by the second signal value, and this is used as a weight map of the captured image 201 and weighted averaged with the model output 206.
- a weight map obtained by subtracting the weight map of the captured image 201 from the all-1 map is used.
- a synthesis method may be used in which the model output 206 is replaced with the captured image 201 only in areas where the second map 205 has a value greater than or equal to a predetermined signal value.
- step S107 it is desirable to input the first correct answer map 254 to the second machine learning model 212. If the second machine learning model 212 is trained by inputting the generated first map 253 instead of the first ground truth map 254, artifacts may occur in the model output 255. This principle will be explained using FIGS. 9(A) and 9(B).
- the second machine learning model 212 must estimate the correct model output 256 in the region 261 from the blurred image 251 in the region 261. Although the blurred image 251 has similar signal distributions on the left and right sides, the signal distribution of the correct model output 256 is significantly different between the left and right sides.
- the second machine learning model 212 estimates a model output 255 close to the correct model output 256 by changing the sharpening performed on the blurred image 251 based on the value of the first correct map 254. I can do it.
- the values of the first map 253 in FIG. 9(B) do not correspond to the difference in the correct model output 256. Therefore, when the first map 253 is input to the second machine learning model 212 instead of the first correct map 254, the second machine learning model 212 can distinguish between the unsaturated blurred image and the saturated blurred image in the blurred image 251.
- Example 2 An image processing system in Example 2 will be explained.
- the task to be executed after generating the second map is to transform the blur of a captured image that includes brightness saturation.
- the conversion of blur is a task of converting a blur due to defocus acting on a captured image into a blur with a shape different from the blur. For example, when two-line blur or vignetting occurs in defocused blur, this is converted to a circular disc (shape with flat intensity) or Gaussian blur. In the blur conversion, the defocus blur is made larger, and the blur is not sharpened (estimated attenuated subject information).
- the method described in this embodiment can be similarly effective for tasks other than blur conversion.
- FIG. 11 is a block diagram of the image processing system 300 in this embodiment.
- FIG. 12 is an external view of the image processing system 300.
- the image processing system 300 includes a training device 301, an imaging device 302, and an image processing device 303.
- the training device 301 includes a storage section 311, an acquisition section 312, a calculation section 313, and an update section 314.
- the image processing device 303 includes a storage section 331, a communication section 332, an acquisition section 333, and a calculation section 334.
- the imaging device 302 includes an optical system 321, an image sensor 322, a storage section 323, a communication section 324, and a display section 325.
- the training device 301 and the image processing device 303, and the image processing device 303 and the imaging device 302 are each connected via a wired or wireless network.
- the captured image captured by the imaging device 302 is affected by defocus blur in a shape corresponding to the optical system 321 .
- the captured image is transmitted to the image processing device 303 via the communication unit 324.
- the image processing device 303 receives the captured image via the communication unit 332 and converts the blur using the configuration and weight information of the first and second machine learning models stored in the storage unit 331. .
- the configuration and weight information of the first and second machine learning models are trained by the training device 301, and are obtained from the training device 301 in advance and stored in the storage unit 331.
- a blur-converted image (model output) obtained by converting the blur of the captured image is transmitted to the imaging device 302, stored in the storage unit 323, and displayed on the display unit 325.
- each step in FIG. 7 is executed by the storage unit 311, acquisition unit 312, calculation unit 313, or update unit 314 of the training device 301.
- step S101 the acquisition unit 312 acquires one or more original images from the storage unit 311.
- step S102 the calculation unit 313 sets a defocus amount for the original image, and generates a blurred image in which a defocus blur corresponding to the defocus amount is added to the original image.
- the shape of defocus blur changes depending on the magnification and aperture of the optical system 321. Further, the defocus blur also changes depending on the focus distance of the optical system 321 and the amount of defocus of the subject at that time. Furthermore, defocus blur changes depending on the image height and azimuth. If it is desired to simultaneously train a second machine learning model capable of converting all of these defocus blurs, a plurality of defocus blurs generated in the optical system 321 may be used to generate a plurality of blur images.
- a blurred image with a defocus amount of 0 may not be blurred, or may be blurred due to aberration or diffraction on the focus plane of the optical system 321.
- step S103 the calculation unit 313 sets the first region based on the blurred image and the signal value threshold.
- step S104 the calculation unit 313 generates a first image having the signal value of the original image in the first region.
- step S105 the calculation unit 313 gives the first image the same defocus blur as the blurred image, and generates the first correct map.
- step S106 the acquisition unit 312 acquires the correct model output.
- the second machine learning model is trained so that defocused blur is converted to disk blur (blur that is circular and has a flat intensity distribution). Therefore, a correct model output is generated by adding disk blur to the original image.
- the shape of the blur to be applied is not limited to this.
- the applied disk blur is larger than the defocus blur applied when generating the blurred image.
- the disc blur has a lower MTF (modulation transfer function) than the defocused blur imparted during generation of the blurred image.
- the process is similar to the generation of a blurred image.
- step S107 the calculation unit 313 uses the first machine learning model to generate a first map from the blurred image, and uses the second machine learning model to generate a first map from the blurred image and the first correct map. Generate model output.
- step S108 the updating unit 314 updates the weights of the first and second machine learning models from the loss function.
- step S109 the update unit 314 determines whether training of the first and second machine learning models is completed. Information on the configurations and weights of the trained first and second machine learning models is stored in the storage unit 311.
- Each step in FIG. 10 is executed by the storage unit 331, communication unit 332, acquisition unit 333, or calculation unit 334 of the image processing device 303.
- step S201 the acquisition unit 333 acquires a captured image, a first machine learning model, and a second machine learning model.
- step S202 the calculation unit 334 generates a first map from the captured image using the first machine learning model.
- step S203 the calculation unit 334 generates a second map by modifying the first map based on information on the position of the brightness saturated region of the captured image.
- the second map is modified by modifying the first map based on whether a closed space that satisfies a predetermined condition of the first map includes the position of the brightness saturated region of the captured image. generate.
- FIG. 13(A) represents a map obtained by binarizing the first map. Binarization is performed using values representing a non-saturated blurred image, where the shaded area represents the non-saturated blurred image and the white area represents a saturated blurred image affected by brightness saturation or an area of erroneous estimation.
- FIG. 13(B) represents a brightness saturation map corresponding to the captured image.
- White areas represent saturated areas of the captured image, and shaded areas represent non-saturated areas.
- FIG. 13A there are a closed space 401 and a closed space 402 that satisfy a predetermined condition (estimated to be not a non-saturated blurred image) in the first map. If the saturated region of the captured image is not included in the closed space, it can be immediately determined that the closed space is an erroneously estimated region. Since the closed space 402 does not include a saturated region of the captured image, the first map is corrected using the closed space 402 as an erroneously estimated region, and a second map is generated.
- step S204 the calculation unit 334 uses the second machine learning model to generate a model output from the captured image and the second map.
- the model output is a blurred image in which the defocused blur of the captured image is converted to a different shape of blur.
- step S205 the calculation unit 334 combines the captured image and the model output based on the second map.
- Example 3 An image processing system in Example 3 will be explained.
- the task executed after generating the second map is estimating the depth map for the captured image. Since the shape of the blur in the optical system changes depending on the amount of defocus, it is possible to associate the shape of the blur with the depth (the amount of defocus).
- a machine learning model can generate a depth map of a subject space by estimating (explicitly or implicitly) the shape of blur in each region of an input captured image within the model. Note that the method described in this embodiment can be similarly effective for tasks other than depth map estimation.
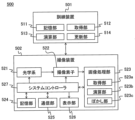
- FIG. 14 is a block diagram of the image processing system 500 in this embodiment.
- FIG. 15 is an external view of the image processing system 500.
- the image processing system 500 includes a training device 501 and an imaging device 502 that are connected by wire or wirelessly.
- the training device 501 includes a storage section 511, an acquisition section 512, a calculation section 513, and an update section 514.
- the imaging device 502 includes an optical system 521, an image sensor 522, an image processing section 523, a storage section 524, a communication section 525, a display section 526, and a system controller 527.
- the image processing unit 523 includes an acquisition unit 523a, a calculation unit 523b, and a blurring unit 523c. In FIG.
- the imaging device 502 forms an image of the subject space via the optical system 521, and acquires the image as a captured image with the imaging element 522.
- the captured image has blurring due to aberrations and defocus of the optical system 521.
- the image processing unit 523 generates a depth map of the subject space from the captured image using the first and second machine learning models.
- the first and second machine learning models are trained by the training device 501, and information on their configurations and weights is obtained in advance from the training device 501 via the communication unit 525 and stored in the storage unit 524. There is.
- the captured image and the estimated depth map are stored in the storage unit 524 and displayed on the display unit 526 as necessary.
- the depth map is used to add blur to a captured image, to cut out a subject, and so on.
- a series of controls are performed by the system controller 527.
- each step in FIG. 7 is executed by the storage unit 511, the acquisition unit 512, the calculation unit 513, or the update unit 514 of the training device 501.
- step S101 the acquisition unit 512 acquires one or more original images.
- step S102 the calculation unit 513 adds blur to the original image to generate a blurred image.
- the calculation unit 513 sets a depth map (which may also be a defocus map) corresponding to the original image and a focus distance of the optical system 521, and gives a blur corresponding to the focus distance of the optical system 521 and the amount of defocus from there. .
- a depth map which may also be a defocus map
- the greater the absolute value of the defocus amount the greater the blur caused by defocus.
- the shape of the blur changes before and after the focus plane due to the influence of spherical aberration.
- step S103 the calculation unit 513 sets the first region based on the blurred image and the signal threshold.
- step S104 the calculation unit 513 generates a first image having the signal value of the original image in the first region.
- step S105 the calculation unit 513 adds blur to the first image and generates a first correct map.
- the first correct map is not clipped with the second signal value.
- the first machine learning model is trained to also estimate the brightness before clipping of the brightness saturated region when generating the first map.
- step S106 the acquisition unit 512 acquires the correct model output.
- the correct model output is the depth map set in step S102.
- step S107 the calculation unit 513 uses the first machine learning model to generate a first map from the blurred image, and uses the second machine learning model to generate a first map from the blurred image and the first correct map. Generate model output.
- step S108 the updating unit 514 updates the weights of the first and second machine learning models using the loss function.
- step S109 the update unit 514 determines whether training of the first and second machine learning models is completed.
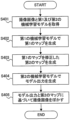
- FIG. 16 is a flowchart of estimation of the first and second machine learning models. Each step in FIG. 16 is executed by the acquisition unit 523a, the calculation unit 523b, or the blurring unit 523c of the image processing unit 523.
- step S401 the acquisition unit 523a acquires a captured image, a first machine learning model, and a second machine learning model. Information on the configurations and weights of the first and second machine learning models is acquired from the storage unit 524.
- step S402 the calculation unit 523b generates a first map from the captured image using the first machine learning model.
- step S403 the calculation unit 523b generates a second map by modifying the first map based on information regarding the position of the brightness saturated region of the captured image. Corrections are made in the same manner as in Example 1.
- step S404 the calculation unit 523b uses the second machine learning model to generate a model output from the captured image and the second map.
- the model output is a depth map corresponding to the captured image.
- step S405 the blurring unit 523c adds blur to the captured image based on the model output and the second map, and generates a blurred image (with a shallower depth of field).
- the depth map that is the model output blur is set for each region of the captured image according to the amount of defocus. No blur is applied to the focus area, and larger blur is applied to areas with larger defocus amounts.
- the second map includes an estimated brightness before clipping of a brightness saturated region of the captured image. After replacing the signal value in the brightness saturated region of the captured image with this brightness, blurring is applied.
- sunlight filtering through the trees, reflected light from the water surface, lights in a night view, etc. do not become dark due to blurring, and it is possible to generate an image with natural blurring.
- the present invention provides a system or device with a program that implements one or more of the functions of the above-described embodiments via a network or storage medium, and one or more processors in the computer of the system or device reads and executes the program. This can also be achieved by processing. It can also be realized by a circuit (for example, ASIC) that realizes one or more functions.
- a circuit for example, ASIC
- an image processing method capable of suppressing a decrease in accuracy due to brightness saturation in a recognition or regression task using a machine learning model for a captured image in which a blur has occurred.
- a processing program can be provided.
- the imaging device (first device) of each embodiment and the device on the cloud (second device) are configured to be able to communicate with each other, and the second device is configured to communicate with each other based on a request from the first device.
- the apparatus may be an image processing system that executes the processing shown in FIG. 10 or 16.
- the first device has a transmission means for transmitting the captured image and a request regarding execution of the process to the second device.
- the second device includes a receiving unit that receives the captured image and the request from the first device, and generates a first map based on the captured image using the first machine learning model in response to the received request. It has a generating means.
- the generating means generates the second map by modifying the first map based on the information regarding the position of the brightness saturated region of the captured image. Further, the generation means uses the second machine learning model to generate a model output based on the captured image and the second map.
Landscapes
- Engineering & Computer Science (AREA)
- Theoretical Computer Science (AREA)
- General Physics & Mathematics (AREA)
- Physics & Mathematics (AREA)
- Computer Vision & Pattern Recognition (AREA)
- Multimedia (AREA)
- Health & Medical Sciences (AREA)
- Artificial Intelligence (AREA)
- Signal Processing (AREA)
- Computing Systems (AREA)
- Databases & Information Systems (AREA)
- Evolutionary Computation (AREA)
- General Health & Medical Sciences (AREA)
- Medical Informatics (AREA)
- Software Systems (AREA)
- Image Processing (AREA)
- Studio Devices (AREA)
- Image Analysis (AREA)
Applications Claiming Priority (2)
| Application Number | Priority Date | Filing Date | Title |
|---|---|---|---|
| JP2022124335A JP2024021485A (ja) | 2022-08-03 | 2022-08-03 | 画像処理方法、画像処理装置、プログラムおよび画像処理システム |
| JP2022-124335 | 2022-08-03 |
Publications (1)
| Publication Number | Publication Date |
|---|---|
| WO2024029224A1 true WO2024029224A1 (ja) | 2024-02-08 |
Family
ID=89848835
Family Applications (1)
| Application Number | Title | Priority Date | Filing Date |
|---|---|---|---|
| PCT/JP2023/023284 Ceased WO2024029224A1 (ja) | 2022-08-03 | 2023-06-23 | 画像処理方法、画像処理装置、プログラムおよび画像処理システム |
Country Status (2)
| Country | Link |
|---|---|
| JP (1) | JP2024021485A (https=) |
| WO (1) | WO2024029224A1 (https=) |
Families Citing this family (1)
| Publication number | Priority date | Publication date | Assignee | Title |
|---|---|---|---|---|
| WO2025205058A1 (ja) * | 2024-03-29 | 2025-10-02 | ソニーグループ株式会社 | 情報処理装置、情報処理方法およびプログラム |
Citations (3)
| Publication number | Priority date | Publication date | Assignee | Title |
|---|---|---|---|---|
| JP2020166628A (ja) * | 2019-03-29 | 2020-10-08 | キヤノン株式会社 | 画像処理方法、画像処理装置、プログラム、画像処理システム、および、学習済みモデルの製造方法 |
| JP2021168048A (ja) * | 2020-04-10 | 2021-10-21 | キヤノン株式会社 | 画像処理方法、画像処理装置、画像処理システム、およびプログラム |
| JP2021189929A (ja) * | 2020-06-03 | 2021-12-13 | キヤノン株式会社 | 画像処理方法、プログラム、画像処理装置、および、画像処理システム |
-
2022
- 2022-08-03 JP JP2022124335A patent/JP2024021485A/ja active Pending
-
2023
- 2023-06-23 WO PCT/JP2023/023284 patent/WO2024029224A1/ja not_active Ceased
Patent Citations (3)
| Publication number | Priority date | Publication date | Assignee | Title |
|---|---|---|---|---|
| JP2020166628A (ja) * | 2019-03-29 | 2020-10-08 | キヤノン株式会社 | 画像処理方法、画像処理装置、プログラム、画像処理システム、および、学習済みモデルの製造方法 |
| JP2021168048A (ja) * | 2020-04-10 | 2021-10-21 | キヤノン株式会社 | 画像処理方法、画像処理装置、画像処理システム、およびプログラム |
| JP2021189929A (ja) * | 2020-06-03 | 2021-12-13 | キヤノン株式会社 | 画像処理方法、プログラム、画像処理装置、および、画像処理システム |
Also Published As
| Publication number | Publication date |
|---|---|
| JP2024021485A (ja) | 2024-02-16 |
Similar Documents
| Publication | Publication Date | Title |
|---|---|---|
| US20250117898A1 (en) | Image processing method, image processing apparatus, image processing system, and memory medium | |
| US11188777B2 (en) | Image processing method, image processing apparatus, learnt model manufacturing method, and image processing system | |
| JP7781931B2 (ja) | 画像処理方法および装置、並びにプログラム | |
| JP7353803B2 (ja) | 画像処理装置、画像処理方法、及びプログラム | |
| US12293495B2 (en) | Image processing method, image processing apparatus, image processing system, and memory medium | |
| US20250173843A1 (en) | Image processing method, image processing apparatus, image processing system, and memory medium | |
| WO2024029224A1 (ja) | 画像処理方法、画像処理装置、プログラムおよび画像処理システム | |
| CN115512118A (zh) | 图像处理方法及装置 | |
| JP7818966B2 (ja) | 画像処理方法、画像処理装置、画像処理システム、およびプログラム | |
| KR20220013290A (ko) | 오토포커스를 보상하는 방법 및 오토포커스를 보상하는 전자 장치 | |
| US20250245792A1 (en) | Image processing method and storage medium | |
| Hassoon | Low-Light Image Enhancement Techniques: A Review | |
| JP2025015313A (ja) | 画像処理方法、画像処理装置、画像処理システム、およびプログラム | |
| JP2025115956A (ja) | 画像処理方法、プログラム、及び記憶媒体 |
Legal Events
| Date | Code | Title | Description |
|---|---|---|---|
| 121 | Ep: the epo has been informed by wipo that ep was designated in this application |
Ref document number: 23849784 Country of ref document: EP Kind code of ref document: A1 |
|
| NENP | Non-entry into the national phase |
Ref country code: DE |
|
| 122 | Ep: pct application non-entry in european phase |
Ref document number: 23849784 Country of ref document: EP Kind code of ref document: A1 |