WO2023218593A1 - 推定装置、推定方法、及び、推定プログラム - Google Patents
推定装置、推定方法、及び、推定プログラム Download PDFInfo
- Publication number
- WO2023218593A1 WO2023218593A1 PCT/JP2022/020048 JP2022020048W WO2023218593A1 WO 2023218593 A1 WO2023218593 A1 WO 2023218593A1 JP 2022020048 W JP2022020048 W JP 2022020048W WO 2023218593 A1 WO2023218593 A1 WO 2023218593A1
- Authority
- WO
- WIPO (PCT)
- Prior art keywords
- polynomial
- time
- degree
- panel data
- polynomials
- Prior art date
- Legal status (The legal status is an assumption and is not a legal conclusion. Google has not performed a legal analysis and makes no representation as to the accuracy of the status listed.)
- Ceased
Links
Images





Classifications
-
- G—PHYSICS
- G06—COMPUTING OR CALCULATING; COUNTING
- G06Q—INFORMATION AND COMMUNICATION TECHNOLOGY [ICT] SPECIALLY ADAPTED FOR ADMINISTRATIVE, COMMERCIAL, FINANCIAL, MANAGERIAL OR SUPERVISORY PURPOSES; SYSTEMS OR METHODS SPECIALLY ADAPTED FOR ADMINISTRATIVE, COMMERCIAL, FINANCIAL, MANAGERIAL OR SUPERVISORY PURPOSES, NOT OTHERWISE PROVIDED FOR
- G06Q10/00—Administration; Management
- G06Q10/04—Forecasting or optimisation specially adapted for administrative or management purposes, e.g. linear programming or "cutting stock problem"
Definitions
- the present invention relates to an estimation device, an estimation method, and an estimation program.
- Patent Document 1 is a technology that collects event information in association with location information, uses the event information to determine areas where there is a possibility of an increase in communication volume, and prioritizes communication in areas where there is a possibility of an increase in communication volume. .
- Non-Patent Document 1 is a technique for evaluating the degree of influence of an event by factor analysis. As a prerequisite, it is defined that only observational data is targeted, that the occurrence of an event is a binary value of 0 or 1, that data exists before and after the occurrence of the event, and that the number of processing units affected by the event is extremely small. Events are evaluated using evaluation methods such as Difference-in-Differences, Latent Factor Models, Synthetic Control-Type Approaches, and Causal Impact. Assess the degree of impact. With the differential method, the impact of an event is evaluated based on the difference between data before and after the event occurs.
- Patent Document 1 is merely a technology for predicting areas where congestion is likely to occur based on location information where an event occurs.
- Non-Patent Document 1 is merely a technique for considering the case where the number of events is one and evaluating the degree of influence due to a single event. Although there are a large number of events that affect panel data, there is a problem in that it is not possible to properly estimate the degree of influence of multiple events. In particular, in Non-Patent Document 1, it is necessary to use different evaluation methods depending on the characteristics of the panel data, so there is a problem that the usable panel data is limited depending on the number and type of events.
- the present invention has been made in view of the above circumstances, and an object of the present invention is to provide a technique that can appropriately estimate the degree of influence of an event on panel data.
- An estimation device estimates the degree of influence of an event on panel data, and adds the degree of influence of each event from time t-1 to time t to the panel data at time t-1.
- a generation unit that generates a polynomial whose value is the panel data at time t; and a first polynomial obtained by retracing the polynomial at regular intervals, the data trends of which are similar to the panel data at time t within a certain range. From a second polynomial representing another panel data, or from the first polynomial and the second polynomial, extract polynomials for the number of events including the polynomial of the panel data at the time t. and a calculation unit that calculates the degree of influence of each of the events using polynomials for the number of events.
- An estimation method is an estimation method for estimating the degree of influence of an event on panel data, in which the estimation measure is based on the influence of each event from time t-1 to time t on panel data at time t-1. generating a polynomial whose panel data at time t is the value obtained by adding the polynomial, and from a first polynomial obtained by retracing the polynomial at regular intervals, the panel data at time t and the data trend are within a certain range. From among the second polynomials representing another similar panel data, or from the first polynomial and the second polynomial, select polynomials for the number of events including the polynomial of the panel data at the time t. and calculating the degree of influence of each event using polynomials corresponding to the number of extracted events.
- An estimation program causes a computer to function as the estimation device.
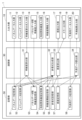
- FIG. 1 is a diagram showing an example of the functional configuration of an information processing device.
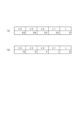
- FIG. 2 is a diagram showing an example of panel data.
- FIG. 3 is a diagram showing the concept of each degree of deviation.
- FIG. 4 is a diagram illustrating an example of calculating the degree of deviation in sensitivity between panel data.
- FIG. 5 is a diagram illustrating an example of calculating the degree of deviation in sensitivity between times (first calculation method).
- FIG. 6 is a diagram illustrating an example of calculating the degree of deviation in sensitivity between times (second calculation method).
- FIG. 7 is a diagram showing an example of panel data, an example of event information, and an example of the degree of deviation.
- FIG. 8 is a diagram showing an example of panel data, an example of event information, and another example of the degree of deviation.
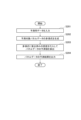
- FIG. 9 is a diagram showing a process flow for estimating the degree of event influence.
- FIG. 10 is a diagram showing a process flow for predicting changes in panel data.
- FIG. 11 is
- the present invention expresses the relationship between events and panel data using a formula, and calculates the degree of influence (sensitivity) of each event.
- Panel data refers to time-series data obtained by continuously observing and recording the same object, and is naturally recognized and obvious in the technical field of the present invention.
- the sensitivity of an event approximates the sensitivity of past data of panel data or the sensitivity of another panel data with a similar trend, and the polynomial is extracted for the number of events and calculated for each event.
- Estimate sensitivity This makes it possible to grasp the degree of influence of each of a plurality of events, and provides a technology that can appropriately estimate the degree of influence of events on panel data.
- FIG. 1 is a diagram showing an example of the functional configuration of an information processing device 1 according to the present embodiment.
- the information processing device 1 includes an estimation device that estimates the degree of influence (sensitivity) of an event on panel data, and a prediction device that predicts changes in the panel data.
- the information processing device 1 includes an input/output section 10, a calculation section 30, and a storage section 50.
- the input/output unit 10 includes a panel data input unit 11 for inputting panel data, an event data input unit 12 for inputting event data, a deviation degree calculation formula input unit 13 for inputting a deviation degree calculation formula, and a deviation calculation formula input unit 13 for inputting a deviation degree calculation formula.
- a panel data deviation degree input section 14 for inputting the degree of deviation
- a time deviation degree input section 15 for inputting the degree of time deviation
- a deviation degree threshold input section 16 for inputting the deviation degree threshold
- a sensitivity output for outputting the sensitivity.
- an error output section 18 that outputs an error
- a prediction data input section 19 that inputs prediction data
- a prediction result output section 20 that outputs a prediction result.
- the calculation unit 30 includes a deviation degree calculation unit 31 that calculates a deviation degree, a polynomial generation unit (generation unit) 32 that generates a polynomial, a sensitivity calculation unit (calculation unit) 33 that calculates sensitivity, and calculates predicted data.
- a prediction data calculation unit 34 is provided.
- the polynomial generation unit 32 has a function of generating a polynomial that makes the panel data at time t a value obtained by adding the degree of influence of each event from time t-1 to time t to the panel data at time t-1.
- the sensitivity calculation unit 33 selects a second polynomial representing another panel data whose data tendency is similar within a certain range to the panel data at time t from among the first polynomial obtained by retracing the polynomial at fixed time intervals. or from the first polynomial and the second polynomial, extract the polynomials for the number of events including the polynomial of the panel data at time t, and calculate the influence of each event using the polynomials for the number of extracted events. Equipped with a function to calculate.
- the sensitivity calculation unit 33 further extracts the polynomials and selects the polynomial candidates for each event from among a plurality of polynomial candidates obtained by adding the further extracted polynomials. It has a function to determine the combination of polynomials for the number of events for which the degree of influence can be calculated.
- the sensitivity calculation unit 33 also performs a process of determining combinations of polynomials for the number of events for which the degree of influence of each event can be calculated, while increasing the number of polynomial candidates one by one until the degree of influence of each event can be calculated. Equipped with a function to repeatedly perform
- the storage unit 50 includes a panel data storage unit 51 that stores panel data, an event data storage unit 52 that stores event data, a panel data discrepancy storage unit 53 that stores panel data discrepancies, and a time discrepancy. a time-to-time discrepancy storage unit 54 that stores the degree of deviation, a discrepancy threshold storage unit 55 that stores the deviation threshold, a polynomial storage unit 56 that stores the polynomial, a sensitivity storage unit 57 that stores the sensitivity, and prediction data. and a prediction data storage unit 58 that stores the prediction data.
- y is, for example, a price index, and is data (value) of panel data at a specific point in time.
- x is an event flag set by the user, and is set to ⁇ 0'' indicating no event or ⁇ 1'' indicating an event.
- i is, for example, an expense item, a name of panel data, an item, etc., and is assumed to be n items.
- t is time.
- e is an event, and there are m events.
- a is the sensitivity (degree of influence) of the event, is an unknown quantity, and is a calculation target.
- the polynomial generation unit 32 sets each event flag x of events 1 to 3 to '1' and generates the price index y cucumber t at time t.
- the polynomial generation unit 32 sets the event flag x of event 2 to '0'. .
- the sensitivity calculation unit 33 is a functional unit that calculates each of the sensitivities a ie1 to a iem of m events e that can occur in the expense item i as unknown quantities. Specifically, the sensitivity calculation unit 33 increases the polynomial generated by the polynomial generation unit 32 by going back in time by an unknown number (by the number of m events) at regular intervals, and calculates m events. Each sensitivity a is calculated using a polynomial.
- the sensitivity calculation unit 33 transforms equation (1) into equation (2).
- the sensitivity calculation unit 33 traces back Equation (2) at each time t and extracts m polynomials shown in Equation (3).
- Equation (3) is expressed by the determinant of Equation (4).
- expense item i is omitted.
- the sensitivity a of events of the same type takes the same value or an approximate value even if the times are different.
- the sensitivity a which is the solution, is determined by the pattern of the x and y matrices that constitute Equation (4).
- the sensitivity calculation unit 33 calculates each sensitivity a in equation (4) using a sweep method.
- the sensitivity calculation unit 33 calculates each sensitivity a because one solution is determined. Specifically, as shown in equation (5), if an inverse matrix exists and can be transformed into a unit matrix, only one solution will be determined.
- the solution is indefinite. Specifically, as shown in equation (7), if part of the matrix is an identity matrix due to transformation and the subsequent rows are '0', and q corresponding to the subsequent row is '0', then The solution becomes indeterminate.
- the sensitivity calculation unit 33 increases the number of polynomials by one, recalculates the rank rank of the matrix, and re-determines, or outputs an error.
- Methods for extracting the polynomial include a method for extracting a polynomial by going back at time t at regular intervals, and a method for extracting a polynomial representing another panel data whose data tendency is similar within a certain range to the panel data at time t. There is a method that combines the two methods.
- the sensitivity calculation unit 33 refers to the "degree of sensitivity deviation between times" and “the degree of sensitivity deviation between panel data” (FIG. 3), and calculates the values in order from the one with the lowest degree of deviation with the panel data at time t. Extract the polynomial. These degrees of deviation are set in advance or calculated from given panel data.
- the sensitivity calculation unit 33 sequentially extracts m polynomials that are close to "the expression of the most recent time t of a cucumber.” At this time, which one to extract, the "formula for time t-1 for cucumbers" or the “formula for time t for eggplants,” depends on the "degree of sensitivity deviation between times” and “the degree of sensitivity deviation between panel data.” It depends on which of them is smaller.
- the degree of deviation between the "formula for time t for cucumbers” and the “formula for time t-1 for eggplant” for example, the "degree of difference in sensitivity between times” and “the degree of difference in sensitivity between panel data” It is a sum, product, square root of the sum of squares, or a combination of calculated values.
- the deviation degree calculation unit 31 is a functional unit that calculates “the degree of sensitivity deviation between times” and “the degree of sensitivity deviation between panel data”. The degree of deviation in sensitivity between panel data and between times may be set by the user.
- the distance as a multidimensional vector with differences for each panel data is defined as the degree of deviation.
- the deviation degree calculation unit 31 calculates the difference or rate of change at each time in a specific period, uses it as a multidimensional vector of each panel data, measures the distance between the panel data, and uses it as the deviation degree.
- the deviation degree calculation unit 31 calculates the differences at each time for the cucumber panel data, and creates a multidimensional vector (2, -2, 3, 3) using these as elements. generate.
- the deviation degree calculation unit 31 similarly generates multidimensional vectors for each panel data of eggplant and watermelon.
- the deviation degree calculation unit 31 calculates each multidimensional vector of cucumber (2, -2, 3, 3), eggplant (0, -2, 5, 6), and watermelon (2, -2, 6, -2). , the distance between the two multidimensional vectors is calculated, and the distance is defined as the degree of sensitivity deviation between the panel data.
- the first calculation method sets a predetermined formula and increases the degree of deviation each time the time goes back, and the second calculation method uses the distance between multidimensional vectors with differences for each panel data at each time as the degree of deviation. There is a method.
- the first calculation method will be explained.
- the discrepancy calculation unit 31 calculates the distance between each time using, for example, equation (8) in which the distance increases by 0.20 as the time is separated by one, and calculates the distance as the discrepancy in sensitivity between the times. do.
- the distance (degree of deviation) from time t is as shown in FIG. 5(a).
- the deviation degree calculation unit 31 calculates the distance between each time using, for example, equation (9) in which the distance increases in proportion to the square of the difference in time as the time is separated by one, and calculates the distance. Let it be the degree of deviation in sensitivity between times.
- the distance (degree of deviation) from time t is as shown in FIG. 5(b).
- the deviation degree calculation unit 31 calculates the difference or rate of change at each time in a specific period for some panel data, uses it as a multidimensional vector at each time, and calculates the distance between the multidimensional vectors as the deviation degree. shall be.
- the deviation degree calculation unit 31 calculates the difference at each time for each panel data of cucumber, eggplant, and watermelon, and creates a multidimensional vector whose elements are the differences at each time of each panel data. Generate t(3,6,-2), t-1(3,5,6), t-2(-2,-2,-2), and t-3(2,0,2), respectively. Then, the deviation degree calculation unit 31 calculates the distance between the two multidimensional vectors for each of these multidimensional vectors, and uses the distance as the degree of deviation in sensitivity between the panel data.
- Example 1 A case will be explained in which one solution is determined from the first polynomial.
- the sensitivity of the cucumber price index at time t+1 is predicted.
- eggplant and watermelon are price indexes that follow a trend similar to that of cucumber, and that the panel data is for five months.
- An example of panel data is shown in FIG. 7(a).
- the degree of deviation is a value shown in FIG. 7(c).
- the deviation degree threshold is set to 0.50.
- the sensitivity calculation unit 33 calculates the polynomial of the time t of the cucumber and the time t of the cucumber in descending order of the degree of deviation from the deviation table of FIG. 7(c).
- the polynomial of -1 and the polynomial of eggplant at time t are extracted in order.
- the sensitivity calculation unit 33 refers to the panel data in FIG. 7A and the event flag information in FIG. Assign event flag.
- Example 2 We will explain how to increase the number of polynomial candidates and search for a combination of polynomials that yields only one solution, since the solution is not determined from the first polynomial extracted. This is a method of considering combinations of m polynomials with one solution determined from m+1 polynomials as candidates.
- the conditions here are the same as those in Example 1. However, as shown in FIG. 8, some of the panel data in (a) and the event flag information in (b) (dot hatched fields) have been changed.
- the sensitivity calculation unit 33 performs the same processing as in the first embodiment to obtain equation (12).
- Equation (12) is expressed by the determinant of Equation (13).
- the sensitivity calculation unit 33 calculates rank[X] and rank[Xq] using equation (14).
- the sensitivity calculation unit 33 increases the number of polynomials by one. Specifically, the sensitivity calculation unit 33 refers to the deviation degree table in FIG. 8(c) and extracts the polynomial at time t-1 of the eggplant with the next lowest deviation degree. At this time, if the degree of deviation of the polynomial to be extracted exceeds the degree of deviation threshold, the sensitivity calculation unit 33 outputs an error indicating that the degree of event influence could not be estimated.
- the sensitivity calculation unit 33 selects as candidates the polynomial at time t for cucumber, the polynomial at time t-1 for cucumber, the polynomial at time t for eggplant, and the polynomial at time t-1 for eggplant. Three polynomials are extracted from the three polynomial candidates, and it is determined whether one solution is determined based on the calculation results of rank[X] and rank[Xq].
- Pattern 1 Two polynomials at time t and t-1 for cucumber, and a polynomial at time t for eggplant
- Pattern 2 Two polynomials at time t and t-1 for cucumber, and a polynomial at time t-1 for eggplant
- Pattern 3 Cucumber A polynomial at time t for eggplant, two polynomials at time t-1 for eggplant, and two polynomials at time t-1 for cucumber, and two polynomials at time t and t-1 for eggplant.
- pattern 1 Two polynomials at time t and t-1 for cucumber, and a polynomial at time t-1 for eggplant
- Pattern 3 Cucumber A polynomial at time t for eggplant, two polynomials at time t-1 for eggplant, and two polynomials at time t-1 for cucumber, and two polynomials at time t and t-1 for eggplant.
- the sensitivity calculation unit 33 obtains the determinant of equation (15).
- FIG. 9 is a diagram showing a process flow for estimating the degree of event influence.
- Step S101 The information processing device 1 inputs sensitivity calculation target panel data, another panel data having a similar tendency to the sensitivity calculation target panel data, event flag information, a deviation degree calculation formula, and a deviation degree threshold value.
- Step S102 the information processing device 1 (deviation degree calculation unit 31) uses the deviation degree calculation formula to determine the degree of deviation in sensitivity between panel data and time between the panel data subject to sensitivity calculation and another panel data, and the sensitivity The degree of deviation in sensitivity between times of the panel data to be calculated is calculated. If the degree of sensitivity deviation between panel data and between times has been input in step S101, the information processing device 1 skips step S102.
- Step S103 the information processing device 1 (polynomial generation unit 32) generates a polynomial representing the panel data for sensitivity calculation and generates a further polynomial by going back in time, and similarly calculates the time for other panel data.
- a plurality of backward polynomials are generated, and all the generated polynomials are stored in a polynomial list in order of decreasing degree of deviation.
- Step S104 Next, the information processing device 1 (sensitivity calculation unit 33) extracts polynomials for the number of m events from the polynomial list in descending order of deviation degree.
- Step S107 Next, the information processing device 1 (sensitivity calculation unit 33) determines whether there is another polynomial in the polynomial list that is equal to or less than the deviation degree threshold. If there is no other polynomial, the process advances to step S109. If there is another polynomial, the process advances to step S108.
- Step S108 The information processing device 1 (sensitivity calculation unit 33) extracts one polynomial with the next lowest degree of deviation from among other polynomials that are equal to or less than the deviation degree threshold, and returns to step S105.
- the information processing device 1 increases the number of polynomial candidates by one more and selects a solution from among the m+2 polynomial candidates. Determine a combination of m polynomials such that one value is determined.
- Step S109 The information processing device 1 outputs an error indicating that the degree of influence of the event could not be calculated.
- Step S110 The information processing device 1 outputs the calculated sensitivity of each event as the degree of influence of each event. At this time, the information processing device 1 also outputs the time of the polynomial used in the calculation, the panel data name, etc.
- the information processing device 1 may increase the number of polynomial candidates one by one and determine a combination of m polynomials that yields one solution.
- FIG. 10 is a diagram showing a process flow for predicting changes in panel data.
- Step S201 The information processing device 1 inputs prediction target panel data immediately before the desired time t+1 and event flag information of the desired time.
- Step S202 Next, the information processing device 1 (prediction data calculation unit 34) generates a polynomial representing the prediction target panel data using the immediately preceding prediction target panel data.
- Step S203 Next, the information processing device 1 (prediction data calculation unit 34) substitutes '0' or '1' in the event flag information for x in equation (17), substitutes the calculated sensitivity for a, Panel data y it+1 at time t+1 is calculated.
- Step S204 Finally, the information processing device 1 outputs the panel data y it+1 at the calculated time t+1.
- the degree of influence of each event from time t-1 to time t is applied to panel data at time t-1.
- a polynomial generator 32 generates a polynomial that makes the panel data at time t the value obtained by adding . From among the second polynomials representing another panel data similar within the range, or from among the first polynomial and the second polynomial, the number of events including the polynomial of the panel data at the time t is selected.
- a sensitivity calculation unit 33 extracts a polynomial and calculates the degree of influence of each event using the polynomial for the number of events extracted, so that the degree of influence of each of a plurality of events can be grasped, and the degree of influence of each event can be grasped. It is possible to provide a technology that can appropriately estimate the degree of influence of
- the information processing device 1 of this embodiment described above includes, for example, a CPU 901, a memory 902, a storage 903, a communication device 904, an input device 905, and an output device 906, as shown in FIG. It can be realized using a general-purpose computer system.
- Memory 902 and storage 903 are storage devices.
- each function of the information processing device 1 is realized by the CPU 901 executing a predetermined program loaded onto the memory 902.
- the information processing device 1 may be implemented by one computer.
- the information processing device 1 may be implemented with multiple computers.
- the information processing device 1 may be a virtual machine implemented in a computer.
- a program for the information processing device 1 can be stored in a computer-readable recording medium such as an HDD, SSD, USB memory, CD, or DVD.
- the program for the information processing device 1 can also be distributed via a communication network.
Landscapes
- Engineering & Computer Science (AREA)
- Business, Economics & Management (AREA)
- Human Resources & Organizations (AREA)
- Economics (AREA)
- Strategic Management (AREA)
- Marketing (AREA)
- Game Theory and Decision Science (AREA)
- Entrepreneurship & Innovation (AREA)
- Development Economics (AREA)
- Operations Research (AREA)
- Quality & Reliability (AREA)
- Tourism & Hospitality (AREA)
- Physics & Mathematics (AREA)
- General Business, Economics & Management (AREA)
- General Physics & Mathematics (AREA)
- Theoretical Computer Science (AREA)
- Management, Administration, Business Operations System, And Electronic Commerce (AREA)
Abstract
パネルデータに与えるイベントの影響度を推定する情報処理装置1(推定装置)において、時刻t-1のパネルデータに時刻t-1から時刻tまでの各イベントの影響度を加えた値を時刻tのパネルデータとする多項式を生成する多項式生成部32と、前記多項式を一定時間毎に遡った第1の多項式の中から、前記時刻tのパネルデータとデータ傾向が一定範囲内で類似する別のパネルデータを表す第2の多項式の中から、又は、前記第1の多項式及び前記第2の多項式の中から、前記時刻tのパネルデータの多項式を含むイベント数分の多項式を取り出し、取り出した前記イベント数分の多項式を用いて前記各イベントの影響度を算出する感度算出部33と、を備える。
Description
本発明は、推定装置、推定方法、及び、推定プログラムに関する。
従来、パネルデータ(同一の対象を継続的に観察し記録した時系列データ)の変化を予測するため、パネルデータに与えるイベントの影響度を推定する技術が求められている。例えば、キュウリの物価指数に対して寒波到来や梅雨入りがもたらす影響度を把握する技術である。
イベントの影響度に関する技術に特許文献1及び非特許文献1がある。特許文献1は、位置情報に紐付けてイベント情報を収集し、そのイベント情報を用いて通信量増加の可能性のある地域を判定し、その可能性のある地域の通信を優先する技術である。
非特許文献1は、因子分析によりイベントの影響度を評価する技術である。前提条件として、観察的なデータのみを対象とし、イベントの発生を0又は1のバイナリとし、イベントの発生前後でデータが存在し、イベントの影響を受けた処理ユニットは極少数とすることを定義し、Difference-in-Differences(差分の差分法)、Latent Factor Models(潜在因子モデル)、Synthetic Control-Type Approaches(合成制御法)、Causal Impact(因果的影響法)、といった評価方法を用いてイベントの影響度を評価する。差分の差分法であれば、イベント発生前後のデータの差分よりイベントの影響度を評価する。
Pantelis Samartsidis、外4名、"Assessing the Causal Effect of Binary Interventions from Observational Panel Data with Few Treated Units"、Institute of Mathematical Statistics、Vol. 34、No. 3、2019年、p.486-p.503、<URL : https://projecteuclid.org/journals/statistical-science/volume-34/issue-3/Assessing-the-Causal-Effect-of-Binary-Interventions-from-Observational-Panel/10.1214/19-STS713.full>、<URL : https://www.mrc-bsu.cam.ac.uk/wp-content/uploads/2019/11/Thursday_PSamartsidis.pdf>
しかしながら、特許文献1は、イベントの発生する位置情報に基づいて輻輳が起こりうる地域を予測する技術にすぎない。非特許文献1は、イベント数が1つである場合を検討し、単一のイベントによる影響度を評価する技術にすぎない。パネルデータに影響を及ぼすイベントは大量にあるが、複数のイベントの影響度を適切に推定できないという課題があった。特に非特許文献1では、パネルデータの特徴に合わせて評価方法を使い分ける必要があるため、イベント数や種類に対して使用可能なパネルデータが限られるという課題もあった。
本発明は、上記事情に鑑みてなされたものであり、本発明の目的は、パネルデータに与えるイベントの影響度を適切に推定可能な技術を提供することである。
本発明の一態様の推定装置は、パネルデータに与えるイベントの影響度を推定する推定装置において、時刻t-1のパネルデータに時刻t-1から時刻tまでの各イベントの影響度を加えた値を時刻tのパネルデータとする多項式を生成する生成部と、前記多項式を一定時間毎に遡った第1の多項式の中から、前記時刻tのパネルデータとデータ傾向が一定範囲内で類似する別のパネルデータを表す第2の多項式の中から、又は、前記第1の多項式及び前記第2の多項式の中から、前記時刻tのパネルデータの多項式を含むイベント数分の多項式を取り出し、取り出した前記イベント数分の多項式を用いて前記各イベントの影響度を算出する算出部と、を備える。
本発明の一態様の推定方法は、パネルデータに与えるイベントの影響度を推定する推定方法において、推定措置が、時刻t-1のパネルデータに時刻t-1から時刻tまでの各イベントの影響度を加えた値を時刻tのパネルデータとする多項式を生成するステップと、前記多項式を一定時間毎に遡った第1の多項式の中から、前記時刻tのパネルデータとデータ傾向が一定範囲内で類似する別のパネルデータを表す第2の多項式の中から、又は、前記第1の多項式及び前記第2の多項式の中から、前記時刻tのパネルデータの多項式を含むイベント数分の多項式を取り出し、取り出した前記イベント数分の多項式を用いて前記各イベントの影響度を算出するステップと、を行う。
本発明の一態様の推定プログラムは、上記推定装置としてコンピュータを機能させる。
本発明によれば、パネルデータに与えるイベントの影響度を適切に推定可能な技術を提供できる。
以下、図面を参照して、本発明の実施形態を説明する。図面の記載において同一部分には同一符号を付し説明を省略する。
[発明の概要]
本発明は、イベントとパネルデータとの関係性を式で表し、各イベントの影響度(感度)を算出する。パネルデータとは、同一の対象を継続的に観察し記録した時系列データを指し、本発明の技術分野において当然に認識され自明である。
本発明は、イベントとパネルデータとの関係性を式で表し、各イベントの影響度(感度)を算出する。パネルデータとは、同一の対象を継続的に観察し記録した時系列データを指し、本発明の技術分野において当然に認識され自明である。
具体的には、上記関係性を表す多項式において、イベントの感度はパネルデータの過去データの感度や傾向の似た別のパネルデータの感度に近似するとみなし、多項式をイベント数分取り出して各イベントの感度を推定する。これにより、複数のイベントの各影響度を把握可能となり、パネルデータに与えるイベントの影響度を適切に推定可能な技術を提供可能となる。
[情報処理装置の構成]
図1は、本実施形態に係る情報処理装置1の機能構成例を示す図である。情報処理装置1は、パネルデータに与えるイベントの影響度(感度)を推定する推定装置と、パネルデータの変化を予測する予測装置と、を含む。
図1は、本実施形態に係る情報処理装置1の機能構成例を示す図である。情報処理装置1は、パネルデータに与えるイベントの影響度(感度)を推定する推定装置と、パネルデータの変化を予測する予測装置と、を含む。
情報処理装置1は、入出力部10と、演算部30と、記憶部50と、を備える。
入出力部10は、パネルデータを入力するパネルデータ入力部11と、イベントデータを入力するイベントデータ入力部12と、乖離度算出式を入力する乖離度算出式入力部13と、パネルデータ間乖離度を入力するパネルデータ間乖離度入力部14と、時刻間乖離度を入力する時刻間乖離度入力部15と、乖離度閾値を入力する乖離度閾値入力部16と、感度を出力する感度出力部17と、エラーを出力するエラー出力部18と、予測用データを入力する予測用データ入力部19と、予測結果を出力する予測結果出力部20と、を備える。
演算部30は、乖離度を算出する乖離度算出部31と、多項式を生成する多項式生成部(生成部)32と、感度を算出する感度算出部(算出部)33と、予測データを算出する予測データ算出部34と、を備える。
多項式生成部32は、時刻t-1のパネルデータに時刻t-1から時刻tまでの各イベントの影響度を加えた値を時刻tのパネルデータとする多項式を生成する機能を備える。
感度算出部33は、上記多項式を一定時間毎に遡った第1の多項式の中から、時刻tのパネルデータとデータ傾向が一定範囲内で類似する別のパネルデータを表す第2の多項式の中から、又は、第1の多項式及び第2の多項式の中から、時刻tのパネルデータの多項式を含むイベント数分の多項式を取り出し、取り出したイベント数分の多項式を用いて各イベントの影響度を算出する機能を備える。
また、感度算出部33は、イベント数分の多項式を用いて各イベントの影響度を算出できない場合、多項式を更に取り出し、取り出した更なる多項式を加えた複数の多項式の候補の中から各イベントの影響度を算出可能なイベント数分の多項式の組み合わせを決定する機能を備える。
また、感度算出部33は、各イベントの影響度を算出可能になるまで、多項式の候補を1つずつ増やしながら、各イベントの影響度を算出可能なイベント数分の多項式の組み合わせを判定する処理を繰り返し行う機能を備える。
記憶部50は、パネルデータを記憶するパネルデータ記憶部51と、イベントデータを記憶するイベントデータ記憶部52と、パネルデータ間乖離度を記憶するパネルデータ間乖離度記憶部53と、時刻間乖離度を記憶する時刻間乖離度記憶部54と、乖離度閾値を記憶する乖離度閾値記憶部55と、多項式を記憶する多項式記憶部56と、感度を記憶する感度記憶部57と、予測用データを記憶する予測用データ記憶部58と、を備える。
[多項式生成部32の機能]
多項式生成部32は、イベントとパネルデータとの関係性を表す多項式を生成する機能部である。パネルデータには、イベントの発生に応じて上昇又は下降する特徴がある。そこで、パネルデータが例えば費目iの物価指数である場合、多項式生成部32は、費目iについて「時刻tの物価指数=時刻t-1の物価指数+時刻t-1から時刻tまでの各イベントの影響度」を表す式(1)を生成する。
多項式生成部32は、イベントとパネルデータとの関係性を表す多項式を生成する機能部である。パネルデータには、イベントの発生に応じて上昇又は下降する特徴がある。そこで、パネルデータが例えば費目iの物価指数である場合、多項式生成部32は、費目iについて「時刻tの物価指数=時刻t-1の物価指数+時刻t-1から時刻tまでの各イベントの影響度」を表す式(1)を生成する。

yは、例えば物価指数であり、パネルデータの特定時点のデータ(数値)である。xは、ユーザにより設定されるイベントフラグであり、イベントなしを示す‘0’又はイベントありを示す‘1’が設定される。iは、例えば費目であり、パネルデータやアイテム等の名称であり、n個とする。tは、時刻である。eは、イベントであり、m個とする。aは、イベントの感度(影響度)であり、未知数であり、算出対象である。
例えば、yを物価指数とし、iを当該物価指数の費目として、図2に示すキュウリの物価指数(i=キュウリ)の場合、時刻t-1から時刻tまでの間に3つのイベント1~イベント3が発生しているので、多項式生成部32は、イベント1~イベント3の各イベントフラグxに‘1’を設定して時刻tの物価指数yキュウリtを生成する。時刻tから時刻t+1の間のように、イベント1、3は発生するが、イベント2が発生していない場合には、多項式生成部32は、イベント2のイベントフラグxに‘0’を設定する。
[感度算出部33の機能]
感度算出部33は、例えばiが費目である場合、費目iに起こりうるm個のイベントeの各感度aie1~aiemを未知数として算出する機能部である。具体的には、感度算出部33は、多項式生成部32により生成された多項式を、一定時間毎に未知数分(m個のイベント数分)時刻を遡る等により、多項式を増加させ、m個の多項式を用いて各感度aをそれぞれ算出する。
感度算出部33は、例えばiが費目である場合、費目iに起こりうるm個のイベントeの各感度aie1~aiemを未知数として算出する機能部である。具体的には、感度算出部33は、多項式生成部32により生成された多項式を、一定時間毎に未知数分(m個のイベント数分)時刻を遡る等により、多項式を増加させ、m個の多項式を用いて各感度aをそれぞれ算出する。
(多項式の解き方)
多項式の解き方を説明する。ここでは、一定時間毎に時刻を遡る場合を例に説明する。
多項式の解き方を説明する。ここでは、一定時間毎に時刻を遡る場合を例に説明する。
まず、感度算出部33は、式(1)を式(2)のように変形する。

次に、感度算出部33は、式(2)を時刻t毎に遡り、式(3)に示すm個の多項式を取り出す。
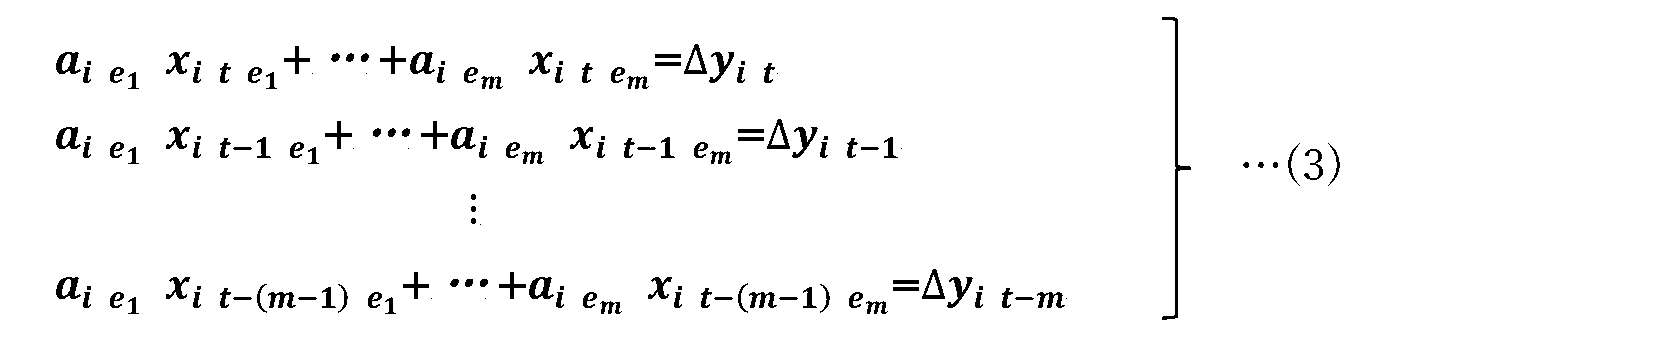
式(3)は、式(4)の行列式で表される。式(4)では、費目iを省略している。また、同じ種類のイベントの感度aは、時刻が異なる場合でも同じ値又は近似値を取るとみなしている。

式(4)を構成するx及びyの行列のパターンによって、解である感度aが決定される。感度算出部33は、式(4)の各感度aを掃き出し法で算出する。
具体的には、式(4)をXa=qと表現すると、感度算出部33は、行列Xを簡略化する変形を行い、変形後の行列Xの階数rank[X](零ベクトルでない行の個数)と、変形後の行列Xと行列qとを左右に並べ合わせた行列Xqの階数rank[Xq]と、を計算する。
そして、感度算出部33は、rank[X]=rank[Xq]=mの場合には、解が1つに定まるので、各感度aを算出する。具体的には、式(5)に示すように、逆行列が存在し単位行列に変形できる場合には、解が1つに定まることになる。

一方、rank[X]<rank[Xq]の場合には、解はなしとなる。具体的には、式(6)に示すように、変形によって一部が単位行列で以降の行が‘0’であり、当該以降の行に対応するqが‘0’でない場合には、解はなしとなる。

また、rank[X]=rank[Xq]<mの場合には、解は不定となる。具体的には、式(7)に示すように、変形によって一部が単位行列で以降の行が‘0’であり、当該以降の行に対応するqが‘0’である場合には、解は不定となる。

このように解がない場合又は解が不定になる場合には、感度算出部33は、多項式を1つ増やし、行列の階数rankを再計算して再判定を行うか、エラーを出力する。
(多項式の取り出し方法)
多項式の取り出し方法を説明する。多項式の取り出し方法には、一定時間毎に時刻tを遡ることにより多項式を取り出す方法と、時刻tのパネルデータとデータ傾向が一定範囲内で類似する別のパネルデータを表す多項式を取り出す方法と、その2つの方法を併せた方法と、がある。
多項式の取り出し方法を説明する。多項式の取り出し方法には、一定時間毎に時刻tを遡ることにより多項式を取り出す方法と、時刻tのパネルデータとデータ傾向が一定範囲内で類似する別のパネルデータを表す多項式を取り出す方法と、その2つの方法を併せた方法と、がある。
感度算出部33は、「時刻間の感度の乖離度」及び「パネルデータ間の感度の乖離度」(図3)を参照し、時刻tのパネルデータとの間で乖離度の低い方から順に多項式を取り出す。これらの乖離度は、予め設定するか、与えられたパネルデータより算出する。
感度算出部33は、乖離度が低い順にm個の多項式を取り出し、取り出したm個の多項式を用いて解である感度aを算出する。m個の多項式を取り出しても解が1つに定まらない場合(解がない場合又は解が不定になる場合)には、感度算出部33は、次に乖離度の低い多項式を1つ取り出し、m+1個の多項式を候補に解が1つに定まるm個の多項式の組み合わせ、つまり、m+1個の多項式の候補の中から「rank[X]=rank[X q]=m」を満たすm個の多項式を求める。感度算出部33は、解が1つに定まるまで候補の多項式を増やすことを繰り返す。
例えば、キュウリの感度を算出したい場合、感度算出部33は、「キュウリの直近の時刻tの式」に近いm個の多項式を順に取り出す。このとき、「キュウリの時刻t-1の式」と「ナスの時刻tの式」のどちらを取り出すかは、「時刻間の感度の乖離度」と「パネルデータ間の感度の乖離度」のうちどちらが小さいかにより決まる。
なお、「キュウリの時刻tの式」と「ナスの時刻t-1の式」の乖離度については、例えば、「時刻間の感度の乖離度」と「パネルデータ間の感度の乖離度」の和、積、二乗和の平方根のうちいずれかの値、又は組み合わせた演算値とする。
[乖離度算出部31の機能]
乖離度算出部31は、「時刻間の感度の乖離度」及び「パネルデータ間の感度の乖離度」を算出する機能部である。パネルデータ間・時刻間の感度の乖離度は、ユーザが設定してもよい。
乖離度算出部31は、「時刻間の感度の乖離度」及び「パネルデータ間の感度の乖離度」を算出する機能部である。パネルデータ間・時刻間の感度の乖離度は、ユーザが設定してもよい。
(パネルデータ間の感度の乖離度の算出方法)
パネルデータ毎に差分を持った多次元ベクトルとしての距離を乖離度とする。具体的には、乖離度算出部31は、特定の期間の各時刻の差分又は変化率を算出し、それを各パネルデータの多次元ベクトルとしてパネルデータ間の距離を計測し乖離度とする。
パネルデータ毎に差分を持った多次元ベクトルとしての距離を乖離度とする。具体的には、乖離度算出部31は、特定の期間の各時刻の差分又は変化率を算出し、それを各パネルデータの多次元ベクトルとしてパネルデータ間の距離を計測し乖離度とする。
例えば、図4に示すように、乖離度算出部31は、キュウリのパネルデータについて、各時刻の差分をそれぞれ算出し、それらを要素とした多次元ベクトル(2,-2,3,3)を生成する。乖離度算出部31は、ナスやスイカの各パネルデータについても同様に多次元ベクトルをそれぞれ生成する。そして、乖離度算出部31は、キュウリ(2,-2,3,3)、ナス(0,-2,5,6)、スイカ(2,-2,6,-2)の各多次元ベクトルについて、2つの多次元ベクトル間の距離をそれぞれ算出し、その距離をパネルデータ間の感度の乖離度とする。
(時刻間の感度の乖離度の算出方法)
所定の数式を設定して時刻を遡る毎に乖離度を大きくする第1の算出方法と、時刻毎のパネルデータ毎の差分を持った多次元ベクトル間の距離を乖離度とする第2の算出方法と、がある。
所定の数式を設定して時刻を遡る毎に乖離度を大きくする第1の算出方法と、時刻毎のパネルデータ毎の差分を持った多次元ベクトル間の距離を乖離度とする第2の算出方法と、がある。
第1の算出方法を説明する。
乖離度算出部31は、例えば、時刻が1つ離れるほど距離が0.20大きくなる式(8)を用いて各時刻間の距離をそれぞれ算出し、その距離を時刻間の感度の乖離度とする。

この場合、時刻tからの距離(乖離度)は、図5(a)に示すようになる。
その他、乖離度算出部31は、例えば、時刻が1つ離れるほど距離が時刻の差の二乗に比例して大きくなる式(9)を用いて各時刻間の距離をそれぞれ算出し、その距離を時刻間の感度の乖離度とする。

この場合、時刻tからの距離(乖離度)は、図5(b)に示すようになる。
第2の算出方法を説明する。
乖離度算出部31は、いくつかのパネルデータに対して、特定の期間の各時刻の差分又は変化率を算出し、それを各時刻の多次元ベクトルとし、多次元ベクトル間の距離を乖離度とする。
例えば、図6に示すように、乖離度算出部31は、キュウリ、ナス、スイカの各パネルデータについて各時刻の差分をそれぞれ算出し、各パネルデータの各時刻の差分を要素とした多次元ベクトルt(3,6,-2)、t-1(3,5,6)、t-2(-2,-2,-2)、t-3(2,0,2)をそれぞれ生成する。そして、乖離度算出部31は、それらの各多次元ベクトルについて、2つの多次元ベクトル間の距離をそれぞれ算出し、その距離をパネルデータ間の感度の乖離度とする。
[実施例]
イベントの感度を推定する実施例を説明する。
イベントの感度を推定する実施例を説明する。
(実施例1)
最初に取り出した多項式より解が1つに定まる場合を説明する。
最初に取り出した多項式より解が1つに定まる場合を説明する。
ここでは、キュウリの物価指数について時刻t+1の感度を予測する。キュウリに似た傾向を取る物価指数としてナスとスイカがあるものとし、パネルデータは5カ月分とする。パネルデータの例を図7(a)に示す。イベントは、図7(b)に示すように3つとする。乖離度は、図7(c)に示す値とする。乖離度閾値は、0.50とする。
イベントを3つ(m=3)とするので、感度算出部33は、図7(c)の乖離度表より乖離度が低い順に、キュウリ(cucumber)の時刻tの多項式と、キュウリの時刻t-1の多項式と、ナス(eggplant)の時刻tの多項式と、を順に取り出す。

次に、感度算出部33は、図7(a)のパネルデータと図7(b)のイベントフラグ情報を参照し、式(10)に示した各多項式の物価指数yとイベントxに該当のイベントフラグを代入する。

感度算出部33は、式(11)をXa=qと表現すると、行列Xの階数rank[X]と、行列Xqの階数rank[Xq]と、を計算する。式(11)の場合、「rank[X]=rank[Xq]=m」を満たすことになるので、感度算出部33は、解である各感度acue1~acue3をそれぞれ算出する。この場合、acue1=5、acue2=-3、acue3=1と算出される。なお、同じ種類のイベントの感度aは、時刻が異なる場合でも同じ値又は近似値を取ると仮定しているので、aege3=acue3としている。
(実施例2)
最初に取り出した多項式より解が1つに定まらず、多項式の候補を増やして解が1つに定まる多項式の組み合わせを探す方法を説明する。m+1個の多項式を候補に解が1つに定まるm個の多項式の組み合わせを考える方法である。
最初に取り出した多項式より解が1つに定まらず、多項式の候補を増やして解が1つに定まる多項式の組み合わせを探す方法を説明する。m+1個の多項式を候補に解が1つに定まるm個の多項式の組み合わせを考える方法である。
ここでの条件は、実施例1の条件と同じとする。但し、図8に示すように、(a)のパネルデータと(b)のイベントフラグ情報の各一部(点ハッチの付与欄)を変更している。感度算出部33は、実施例1と同様に処理して式(12)を得る。

式(12)は、式(13)の行列式で表される。

感度算出部33は、式(13)をXa=qと表現すると、[Xq]を簡略化する変形を行い式(14)を得る。

感度算出部33は、式(14)を用いてrank[X]及びrank[Xq]を計算する。変形後の行列Xにおいて、零ベクトルでない行は1行目のみであるから、rank[X]=1となる。行列Xと行列qとを左右に並べ合わせた行列Xqにおいても、零ベクトルでない行は1行目のみであるから、rank[Xq]=1となる。m=3なので、「rank[X]=rank[Xq]<m」を満たすことになり、解は不定となる。
そこで、感度算出部33は、多項式を1つ増やす。具体的には、感度算出部33は、図8(c)の乖離度表を参照し、乖離度が次に低いナスの時刻t-1の多項式を取り出す。このとき、取り出そうとする多項式の乖離度が乖離度閾値を超える場合には、感度算出部33は、イベント影響度が推定できなかった旨のエラーを出力する。
その後、感度算出部33は、キュウリの時刻tの多項式と、キュウリの時刻t-1の多項式と、ナスの時刻tの多項式と、ナスの時刻t-1の多項式と、を候補とし、その4つの多項式の候補の中から3つの多項式を取り出し、rank[X]及びrank[Xq]の算出結果を基に解が1つに定まるかを判定する。
取り出す3つの多項式の組み合わせは、下記4つのパターンがある。
パターン1;キュウリの時刻t、t-1の2つの多項式、ナスの時刻tの多項式
パターン2;キュウリの時刻t、t-1の2つの多項式、ナスの時刻t-1の多項式
パターン3;キュウリの時刻tの多項式、ナスの時刻t、t-1の2つの多項式
パターン4;キュウリの時刻t-1の多項式、ナスの時刻t、t-1の2つの多項式
パターン1の場合は、上述の通り解は不定となる。パターン2の場合も解は不定となる。以降、パターン3の場合を説明する。パターン4の場合はパターン3と同様になるので、その説明は省略する。
パターン2;キュウリの時刻t、t-1の2つの多項式、ナスの時刻t-1の多項式
パターン3;キュウリの時刻tの多項式、ナスの時刻t、t-1の2つの多項式
パターン4;キュウリの時刻t-1の多項式、ナスの時刻t、t-1の2つの多項式
パターン1の場合は、上述の通り解は不定となる。パターン2の場合も解は不定となる。以降、パターン3の場合を説明する。パターン4の場合はパターン3と同様になるので、その説明は省略する。
パターン3の場合、感度算出部33は、式(15)の行列式を得る。

感度算出部33は、式(15)をXa=qと表現すると、行列Xを簡略化する変形を行い式(16)を得る。

感度算出部33は、式(16)を用いてrank[X]及びrank[Xq]を計算する。rank[X]=3、rank[Xq]=3となり、m=3であるから、「rank[X]=rank[Xq]=m」を満たすことになり、解は1つに定まることになる。そこで、感度算出部33は、解である各感度acue1~acue3をそれぞれ算出する。この場合、acue1=5、acue2=-3、acue3=1と算出される。
[イベント影響度の推定動作]
イベントの影響度を推定する処理の流れを説明する。図9は、イベント影響度の推定処理フローを示す図である。
イベントの影響度を推定する処理の流れを説明する。図9は、イベント影響度の推定処理フローを示す図である。
ステップS101;
情報処理装置1は、感度算出対象パネルデータ、その感度算出対象パネルデータに傾向の似た別のパネルデータ、イベントフラグ情報、乖離度算出式、乖離度閾値を入力する。
情報処理装置1は、感度算出対象パネルデータ、その感度算出対象パネルデータに傾向の似た別のパネルデータ、イベントフラグ情報、乖離度算出式、乖離度閾値を入力する。
ステップS102;
次に、情報処理装置1(乖離度算出部31)は、乖離度算出式を用いて、感度算出対象パネルデータと別のパネルデータとのパネルデータ間・時刻間の感度の乖離度と、感度算出対象パネルデータの時刻間の感度の乖離度と、を算出する。ステップS101でパネルデータ間・時刻間の感度の乖離度が入力されていた場合、情報処理装置1は、ステップS102をスキップする。
次に、情報処理装置1(乖離度算出部31)は、乖離度算出式を用いて、感度算出対象パネルデータと別のパネルデータとのパネルデータ間・時刻間の感度の乖離度と、感度算出対象パネルデータの時刻間の感度の乖離度と、を算出する。ステップS101でパネルデータ間・時刻間の感度の乖離度が入力されていた場合、情報処理装置1は、ステップS102をスキップする。
ステップS103;
次に、情報処理装置1(多項式生成部32)は、感度算出対象パネルデータを表す多項式を生成して時刻を遡ることにより更なる多項式を生成するとともに、別のパネルデータについても同様に時刻を遡る複数の多項式を生成し、生成した全ての多項式を乖離度の低い順に多項式リストに格納する。
次に、情報処理装置1(多項式生成部32)は、感度算出対象パネルデータを表す多項式を生成して時刻を遡ることにより更なる多項式を生成するとともに、別のパネルデータについても同様に時刻を遡る複数の多項式を生成し、生成した全ての多項式を乖離度の低い順に多項式リストに格納する。
ステップS104;
次に、情報処理装置1(感度算出部33)は、多項式リストからm個のイベント数分の多項式を乖離度の低い順に取り出す。
次に、情報処理装置1(感度算出部33)は、多項式リストからm個のイベント数分の多項式を乖離度の低い順に取り出す。
ステップS105、S106;
次に、情報処理装置1(感度算出部33)は、取り出したm個のイベント数分の多項式を用いてrank[X]及びrank[Xq]を計算し、「rank[X]=rank[Xq]=m」を満たすか否かを判定する。「rank[X]=rank[Xq]=m」を満たす場合には、解が1つに定まるので、各イベントの感度を算出し、ステップS110へ進む。一方、「rank[X]<rank[Xq]」又は「rank[X]=rank[Xq]<m」の場合には、解が1つに定まらないので、ステップS107へ進む。
次に、情報処理装置1(感度算出部33)は、取り出したm個のイベント数分の多項式を用いてrank[X]及びrank[Xq]を計算し、「rank[X]=rank[Xq]=m」を満たすか否かを判定する。「rank[X]=rank[Xq]=m」を満たす場合には、解が1つに定まるので、各イベントの感度を算出し、ステップS110へ進む。一方、「rank[X]<rank[Xq]」又は「rank[X]=rank[Xq]<m」の場合には、解が1つに定まらないので、ステップS107へ進む。
ステップS107;
次に、情報処理装置1(感度算出部33)は、多項式リストに乖離度閾値以下で別の多項式があるか否かを判定する。別の多項式がない場合には、ステップS109へ進む。別の多項式がある場合には、ステップS108へ進む。
次に、情報処理装置1(感度算出部33)は、多項式リストに乖離度閾値以下で別の多項式があるか否かを判定する。別の多項式がない場合には、ステップS109へ進む。別の多項式がある場合には、ステップS108へ進む。
ステップS108;
情報処理装置1(感度算出部33)は、乖離度閾値以下で別の多項式の中から次に乖離度の低い多項式を1つ取り出し、ステップS105へ戻る。
情報処理装置1(感度算出部33)は、乖離度閾値以下で別の多項式の中から次に乖離度の低い多項式を1つ取り出し、ステップS105へ戻る。
その後、情報処理装置1(感度算出部33)は、m+1個の多項式の候補の中からm個の多項式を用いて「rank[X]=rank[Xq]=m」を満たすか否か(解が1つに定まるか)を判定し、定まらない場合には別の組み合わせのm個の多項式を用いて判定する。
m+1個の多項式の候補の中からでも解が1つに定まらない場合、情報処理装置1(感度算出部33)は、多項式の候補を更に1つ増やし、m+2個の多項式の候補の中から解が1つに定まるm個の多項式の組み合わせを判定する。
ステップS109;
情報処理装置1は、イベントの影響度を算出できなかった旨のエラーを出力する。
情報処理装置1は、イベントの影響度を算出できなかった旨のエラーを出力する。
ステップS110;
情報処理装置1は、算出した各イベントの感度を各イベントの影響度として出力する。このとき、情報処理装置1は、算出に用いた多項式の時刻、パネルデータ名等も併せて出力する。
情報処理装置1は、算出した各イベントの感度を各イベントの影響度として出力する。このとき、情報処理装置1は、算出に用いた多項式の時刻、パネルデータ名等も併せて出力する。
(変形例)
情報処理装置1は、多項式の候補を1つずつ増やすのに代えて、多項式の候補を一度に複数増やして解が1つに定まるm個の多項式の組み合わせを判定してもよい。
情報処理装置1は、多項式の候補を1つずつ増やすのに代えて、多項式の候補を一度に複数増やして解が1つに定まるm個の多項式の組み合わせを判定してもよい。
[パネルデータ変化予測処理]
パネルデータ変化を予測する処理の流れを説明する。図10は、パネルデータ変化の予測処理フローを示す図である。
パネルデータ変化を予測する処理の流れを説明する。図10は、パネルデータ変化の予測処理フローを示す図である。
ステップS201;
情報処理装置1は、予測したい時刻t+1の直前の予測対象パネルデータ、予測したい時刻のイベントフラグ情報を入力する。
情報処理装置1は、予測したい時刻t+1の直前の予測対象パネルデータ、予測したい時刻のイベントフラグ情報を入力する。
ステップS202;
次に、情報処理装置1(予測データ算出部34)は、直前の予測対象パネルデータを用いて予測対象パネルデータを表す多項式を生成する。
次に、情報処理装置1(予測データ算出部34)は、直前の予測対象パネルデータを用いて予測対象パネルデータを表す多項式を生成する。

ステップS203;
次に、情報処理装置1(予測データ算出部34)は、式(17)のxにイベントフラグ情報内の‘0’又は‘1’を代入し、aに算出済みの感度を代入して、時刻t+1のパネルデータyit+1を算出する。
次に、情報処理装置1(予測データ算出部34)は、式(17)のxにイベントフラグ情報内の‘0’又は‘1’を代入し、aに算出済みの感度を代入して、時刻t+1のパネルデータyit+1を算出する。
ステップS204;
最後に、情報処理装置1は、算出した時刻t+1のパネルデータyit+1を出力する。
最後に、情報処理装置1は、算出した時刻t+1のパネルデータyit+1を出力する。
[効果]
本実施形態によれば、パネルデータに与えるイベントの影響度を推定する情報処理装置1(推定装置)において、時刻t-1のパネルデータに時刻t-1から時刻tまでの各イベントの影響度を加えた値を時刻tのパネルデータとする多項式を生成する多項式生成部32と、前記多項式を一定時間毎に遡った第1の多項式の中から、前記時刻tのパネルデータとデータ傾向が一定範囲内で類似する別のパネルデータを表す第2の多項式の中から、又は、前記第1の多項式及び前記第2の多項式の中から、前記時刻tのパネルデータの多項式を含むイベント数分の多項式を取り出し、取り出した前記イベント数分の多項式を用いて前記各イベントの影響度を算出する感度算出部33と、を備えるので、複数のイベントの各影響度を把握でき、パネルデータに与えるイベントの影響度を適切に推定可能な技術を提供できる。
本実施形態によれば、パネルデータに与えるイベントの影響度を推定する情報処理装置1(推定装置)において、時刻t-1のパネルデータに時刻t-1から時刻tまでの各イベントの影響度を加えた値を時刻tのパネルデータとする多項式を生成する多項式生成部32と、前記多項式を一定時間毎に遡った第1の多項式の中から、前記時刻tのパネルデータとデータ傾向が一定範囲内で類似する別のパネルデータを表す第2の多項式の中から、又は、前記第1の多項式及び前記第2の多項式の中から、前記時刻tのパネルデータの多項式を含むイベント数分の多項式を取り出し、取り出した前記イベント数分の多項式を用いて前記各イベントの影響度を算出する感度算出部33と、を備えるので、複数のイベントの各影響度を把握でき、パネルデータに与えるイベントの影響度を適切に推定可能な技術を提供できる。
[その他]
本発明は、上記実施形態に限定されない。本発明は、本発明の要旨の範囲内で数々の変形が可能である。
本発明は、上記実施形態に限定されない。本発明は、本発明の要旨の範囲内で数々の変形が可能である。
上記説明した本実施形態の情報処理装置1は、例えば、図11に示すように、CPU901と、メモリ902と、ストレージ903と、通信装置904と、入力装置905と、出力装置906と、を備えた汎用的なコンピュータシステムを用いて実現できる。メモリ902及びストレージ903は、記憶装置である。当該コンピュータシステムにおいて、CPU901がメモリ902上にロードされた所定のプログラムを実行することにより、情報処理装置1の各機能が実現される。
情報処理装置1は、1つのコンピュータで実装されてもよい。情報処理装置1は、複数のコンピュータで実装されてもよい。情報処理装置1は、コンピュータに実装される仮想マシンであってもよい。情報処理装置1用のプログラムは、HDD、SSD、USBメモリ、CD、DVD等のコンピュータ読取り可能な記録媒体に記憶できる。情報処理装置1用のプログラムは、通信ネットワークを介して配信することもできる。
1:情報処理装置(推定装置、予測装置)
10:入出力部
11:パネルデータ入力部
12:イベントデータ入力部
13:乖離度算出式入力部
14:パネルデータ間乖離度入力部
15:時刻間乖離度入力部
16:乖離度閾値入力部
17:感度出力部
18:エラー出力部
19:予測用データ入力部
20:予測結果出力部
30:演算部
31:乖離度算出部
32:多項式生成部
33:感度算出部
34:予測データ算出部
50:記憶部
51:パネルデータ記憶部
52:イベントデータ記憶部
53:パネルデータ間乖離度記憶部
54:時刻間乖離度記憶部
55:乖離度閾値記憶部
56:多項式記憶部
57:感度記憶部
58:予測用データ記憶部
901:CPU
902:メモリ
903:ストレージ
904:通信装置
905:入力装置
906:出力装置
10:入出力部
11:パネルデータ入力部
12:イベントデータ入力部
13:乖離度算出式入力部
14:パネルデータ間乖離度入力部
15:時刻間乖離度入力部
16:乖離度閾値入力部
17:感度出力部
18:エラー出力部
19:予測用データ入力部
20:予測結果出力部
30:演算部
31:乖離度算出部
32:多項式生成部
33:感度算出部
34:予測データ算出部
50:記憶部
51:パネルデータ記憶部
52:イベントデータ記憶部
53:パネルデータ間乖離度記憶部
54:時刻間乖離度記憶部
55:乖離度閾値記憶部
56:多項式記憶部
57:感度記憶部
58:予測用データ記憶部
901:CPU
902:メモリ
903:ストレージ
904:通信装置
905:入力装置
906:出力装置
Claims (6)
- パネルデータに与えるイベントの影響度を推定する推定装置において、
時刻t-1のパネルデータに時刻t-1から時刻tまでの各イベントの影響度を加えた値を時刻tのパネルデータとする多項式を生成する生成部と、
前記多項式を一定時間毎に遡った第1の多項式の中から、前記時刻tのパネルデータとデータ傾向が一定範囲内で類似する別のパネルデータを表す第2の多項式の中から、又は、前記第1の多項式及び前記第2の多項式の中から、前記時刻tのパネルデータの多項式を含むイベント数分の多項式を取り出し、取り出した前記イベント数分の多項式を用いて前記各イベントの影響度を算出する算出部と、
を備える推定装置。 - 前記算出部は、
前記時刻tのパネルデータと乖離度の低い順に多項式を取り出す請求項1に記載の推定装置。 - 前記算出部は、
前記イベント数分の多項式を用いて前記各イベントの影響度を算出できない場合、多項式を更に取り出し、取り出した更なる多項式を加えた複数の多項式の候補の中から前記各イベントの影響度を算出可能な前記イベント数分の多項式の組み合わせを決定する請求項1又は2に記載の推定装置。 - 前記算出部は、
前記各イベントの影響度を算出可能になるまで、多項式の候補を1つずつ増やしながら、前記各イベントの影響度を算出可能な前記イベント数分の多項式の組み合わせを判定する処理を繰り返し行う請求項3に記載の推定装置。 - パネルデータに与えるイベントの影響度を推定する推定方法において、
推定措置が、
時刻t-1のパネルデータに時刻t-1から時刻tまでの各イベントの影響度を加えた値を時刻tのパネルデータとする多項式を生成するステップと、
前記多項式を一定時間毎に遡った第1の多項式の中から、前記時刻tのパネルデータとデータ傾向が一定範囲内で類似する別のパネルデータを表す第2の多項式の中から、又は、前記第1の多項式及び前記第2の多項式の中から、前記時刻tのパネルデータの多項式を含むイベント数分の多項式を取り出し、取り出した前記イベント数分の多項式を用いて前記各イベントの影響度を算出するステップと、
を行う推定方法。 - 請求項1に記載の推定装置としてコンピュータを機能させる推定プログラム。
Priority Applications (2)
| Application Number | Priority Date | Filing Date | Title |
|---|---|---|---|
| JP2024520172A JP7769267B2 (ja) | 2022-05-12 | 2022-05-12 | 推定装置、推定方法、及び、推定プログラム |
| PCT/JP2022/020048 WO2023218593A1 (ja) | 2022-05-12 | 2022-05-12 | 推定装置、推定方法、及び、推定プログラム |
Applications Claiming Priority (1)
| Application Number | Priority Date | Filing Date | Title |
|---|---|---|---|
| PCT/JP2022/020048 WO2023218593A1 (ja) | 2022-05-12 | 2022-05-12 | 推定装置、推定方法、及び、推定プログラム |
Publications (1)
| Publication Number | Publication Date |
|---|---|
| WO2023218593A1 true WO2023218593A1 (ja) | 2023-11-16 |
Family
ID=88730024
Family Applications (1)
| Application Number | Title | Priority Date | Filing Date |
|---|---|---|---|
| PCT/JP2022/020048 Ceased WO2023218593A1 (ja) | 2022-05-12 | 2022-05-12 | 推定装置、推定方法、及び、推定プログラム |
Country Status (2)
| Country | Link |
|---|---|
| JP (1) | JP7769267B2 (ja) |
| WO (1) | WO2023218593A1 (ja) |
Citations (3)
| Publication number | Priority date | Publication date | Assignee | Title |
|---|---|---|---|---|
| JPH04372046A (ja) * | 1991-06-20 | 1992-12-25 | Hitachi Ltd | 需要量予測方法及び装置 |
| WO2016079972A1 (ja) * | 2014-11-19 | 2016-05-26 | 日本電気株式会社 | 要因分析装置、要因分析方法と記録媒体、及び、要因分析システム |
| JP2018124727A (ja) * | 2017-01-31 | 2018-08-09 | 株式会社東芝 | 電力需要予測装置 |
-
2022
- 2022-05-12 WO PCT/JP2022/020048 patent/WO2023218593A1/ja not_active Ceased
- 2022-05-12 JP JP2024520172A patent/JP7769267B2/ja active Active
Patent Citations (3)
| Publication number | Priority date | Publication date | Assignee | Title |
|---|---|---|---|---|
| JPH04372046A (ja) * | 1991-06-20 | 1992-12-25 | Hitachi Ltd | 需要量予測方法及び装置 |
| WO2016079972A1 (ja) * | 2014-11-19 | 2016-05-26 | 日本電気株式会社 | 要因分析装置、要因分析方法と記録媒体、及び、要因分析システム |
| JP2018124727A (ja) * | 2017-01-31 | 2018-08-09 | 株式会社東芝 | 電力需要予測装置 |
Also Published As
| Publication number | Publication date |
|---|---|
| JPWO2023218593A1 (ja) | 2023-11-16 |
| JP7769267B2 (ja) | 2025-11-13 |
Similar Documents
| Publication | Publication Date | Title |
|---|---|---|
| Schroeter et al. | Estimating the domain of applicability for machine learning QSAR models: a study on aqueous solubility of drug discovery molecules | |
| JP7067234B2 (ja) | データ判別プログラム、データ判別装置およびデータ判別方法 | |
| JP7339924B2 (ja) | 材料の特性値を推定するシステム | |
| WO2020091865A1 (en) | Finite rank deep kernel learning for robust time series forecasting and regression | |
| EP3871157A1 (en) | Extending finite rank deep kernel learning to forecasting over long time horizons | |
| JP5745388B2 (ja) | コンテンツ推薦装置及び方法及びプログラム | |
| EP3871152A1 (en) | Finite rank deep kernel learning with linear computational complexity | |
| Yau et al. | Estimation of multiple-regime threshold autoregressive models with structural breaks | |
| JP4265296B2 (ja) | 変化点検出装置,変化点検出方法および変化点検出用プログラム | |
| Cholewa et al. | Estimation of the number of states for gesture recognition with Hidden Markov Models based on the number of critical points in time sequence | |
| JP2009265730A (ja) | 情報処理装置および方法、並びにプログラム | |
| JP2022167093A (ja) | 情報処理装置、情報処理方法及びプログラム | |
| WO2010027046A1 (ja) | 情報処理装置、情報処理方法、情報記憶媒体及びプログラム | |
| JP2012194741A (ja) | 行列形データの欠損値予測装置、欠損値予測計算方法および欠損値予測プログラム | |
| Nahshan et al. | Linear log-normal attention with unbiased concentration | |
| Kronvall et al. | Hyperparameter selection for group-sparse regression: A probabilistic approach | |
| JP2022167097A (ja) | 情報処理装置、情報処理方法及びプログラム | |
| WO2015146100A1 (ja) | 負荷推定システム、情報処理装置、負荷推定方法、及び、プログラムを記憶する記憶媒体 | |
| WO2022097230A1 (ja) | 予測方法、予測装置及びプログラム | |
| Satapathy et al. | Empirical assessment of machine learning models for effort estimation of web-based applications | |
| JP4591793B2 (ja) | 推定装置および方法、並びにプログラム | |
| JP7769267B2 (ja) | 推定装置、推定方法、及び、推定プログラム | |
| JP2015187773A (ja) | データ解析装置、データ解析プログラム及びデータ解析方法 | |
| JP7452648B2 (ja) | 学習方法、学習装置及びプログラム | |
| JP6740193B2 (ja) | パラメータ推定装置、パラメータ推定方法及びパラメータ推定プログラム |
Legal Events
| Date | Code | Title | Description |
|---|---|---|---|
| 121 | Ep: the epo has been informed by wipo that ep was designated in this application |
Ref document number: 22941673 Country of ref document: EP Kind code of ref document: A1 |
|
| WWE | Wipo information: entry into national phase |
Ref document number: 2024520172 Country of ref document: JP |
|
| NENP | Non-entry into the national phase |
Ref country code: DE |
|
| 122 | Ep: pct application non-entry in european phase |
Ref document number: 22941673 Country of ref document: EP Kind code of ref document: A1 |