WO2023190974A1 - 遺伝子導入率予測方法 - Google Patents
遺伝子導入率予測方法 Download PDFInfo
- Publication number
- WO2023190974A1 WO2023190974A1 PCT/JP2023/013374 JP2023013374W WO2023190974A1 WO 2023190974 A1 WO2023190974 A1 WO 2023190974A1 JP 2023013374 W JP2023013374 W JP 2023013374W WO 2023190974 A1 WO2023190974 A1 WO 2023190974A1
- Authority
- WO
- WIPO (PCT)
- Prior art keywords
- cell
- cells
- complexity
- gene
- car
- Prior art date
- Legal status (The legal status is an assumption and is not a legal conclusion. Google has not performed a legal analysis and makes no representation as to the accuracy of the status listed.)
- Ceased
Links
Images











Classifications
-
- G—PHYSICS
- G01—MEASURING; TESTING
- G01N—INVESTIGATING OR ANALYSING MATERIALS BY DETERMINING THEIR CHEMICAL OR PHYSICAL PROPERTIES
- G01N21/00—Investigating or analysing materials by the use of optical means, i.e. using sub-millimetre waves, infrared, visible or ultraviolet light
- G01N21/62—Systems in which the material investigated is excited whereby it emits light or causes a change in wavelength of the incident light
- G01N21/63—Systems in which the material investigated is excited whereby it emits light or causes a change in wavelength of the incident light optically excited
- G01N21/64—Fluorescence; Phosphorescence
- G01N21/6486—Measuring fluorescence of biological material, e.g. DNA, RNA, cells
-
- C—CHEMISTRY; METALLURGY
- C12—BIOCHEMISTRY; BEER; SPIRITS; WINE; VINEGAR; MICROBIOLOGY; ENZYMOLOGY; MUTATION OR GENETIC ENGINEERING
- C12N—MICROORGANISMS OR ENZYMES; COMPOSITIONS THEREOF; PROPAGATING, PRESERVING, OR MAINTAINING MICROORGANISMS; MUTATION OR GENETIC ENGINEERING; CULTURE MEDIA
- C12N15/00—Mutation or genetic engineering; DNA or RNA concerning genetic engineering, vectors, e.g. plasmids, or their isolation, preparation or purification; Use of hosts therefor
- C12N15/09—Recombinant DNA-technology
- C12N15/63—Introduction of foreign genetic material using vectors; Vectors; Use of hosts therefor; Regulation of expression
- C12N15/64—General methods for preparing the vector, for introducing it into the cell or for selecting the vector-containing host
-
- A—HUMAN NECESSITIES
- A61—MEDICAL OR VETERINARY SCIENCE; HYGIENE
- A61K—PREPARATIONS FOR MEDICAL, DENTAL OR TOILETRY PURPOSES
- A61K40/00—Cellular immunotherapy
- A61K40/10—Cellular immunotherapy characterised by the cell type used
- A61K40/11—T-cells, e.g. tumour infiltrating lymphocytes [TIL] or regulatory T [Treg] cells; Lymphokine-activated killer [LAK] cells
-
- A—HUMAN NECESSITIES
- A61—MEDICAL OR VETERINARY SCIENCE; HYGIENE
- A61K—PREPARATIONS FOR MEDICAL, DENTAL OR TOILETRY PURPOSES
- A61K40/00—Cellular immunotherapy
- A61K40/30—Cellular immunotherapy characterised by the recombinant expression of specific molecules in the cells of the immune system
- A61K40/31—Chimeric antigen receptors [CAR]
-
- A—HUMAN NECESSITIES
- A61—MEDICAL OR VETERINARY SCIENCE; HYGIENE
- A61K—PREPARATIONS FOR MEDICAL, DENTAL OR TOILETRY PURPOSES
- A61K40/00—Cellular immunotherapy
- A61K40/40—Cellular immunotherapy characterised by antigens that are targeted or presented by cells of the immune system
- A61K40/41—Vertebrate antigens
- A61K40/42—Cancer antigens
-
- C—CHEMISTRY; METALLURGY
- C12—BIOCHEMISTRY; BEER; SPIRITS; WINE; VINEGAR; MICROBIOLOGY; ENZYMOLOGY; MUTATION OR GENETIC ENGINEERING
- C12N—MICROORGANISMS OR ENZYMES; COMPOSITIONS THEREOF; PROPAGATING, PRESERVING, OR MAINTAINING MICROORGANISMS; MUTATION OR GENETIC ENGINEERING; CULTURE MEDIA
- C12N15/00—Mutation or genetic engineering; DNA or RNA concerning genetic engineering, vectors, e.g. plasmids, or their isolation, preparation or purification; Use of hosts therefor
- C12N15/09—Recombinant DNA-technology
- C12N15/87—Introduction of foreign genetic material using processes not otherwise provided for, e.g. co-transformation
-
- G—PHYSICS
- G01—MEASURING; TESTING
- G01N—INVESTIGATING OR ANALYSING MATERIALS BY DETERMINING THEIR CHEMICAL OR PHYSICAL PROPERTIES
- G01N15/00—Investigating characteristics of particles; Investigating permeability, pore-volume or surface-area of porous materials
- G01N15/10—Investigating individual particles
- G01N15/14—Optical investigation techniques, e.g. flow cytometry
-
- G—PHYSICS
- G01—MEASURING; TESTING
- G01N—INVESTIGATING OR ANALYSING MATERIALS BY DETERMINING THEIR CHEMICAL OR PHYSICAL PROPERTIES
- G01N15/00—Investigating characteristics of particles; Investigating permeability, pore-volume or surface-area of porous materials
- G01N15/10—Investigating individual particles
- G01N15/14—Optical investigation techniques, e.g. flow cytometry
- G01N15/1429—Signal processing
- G01N15/1433—Signal processing using image recognition
-
- G—PHYSICS
- G01—MEASURING; TESTING
- G01N—INVESTIGATING OR ANALYSING MATERIALS BY DETERMINING THEIR CHEMICAL OR PHYSICAL PROPERTIES
- G01N15/00—Investigating characteristics of particles; Investigating permeability, pore-volume or surface-area of porous materials
- G01N15/10—Investigating individual particles
- G01N15/14—Optical investigation techniques, e.g. flow cytometry
- G01N15/1468—Optical investigation techniques, e.g. flow cytometry with spatial resolution of the texture or inner structure of the particle
- G01N15/147—Optical investigation techniques, e.g. flow cytometry with spatial resolution of the texture or inner structure of the particle the analysis being performed on a sample stream
-
- G—PHYSICS
- G01—MEASURING; TESTING
- G01N—INVESTIGATING OR ANALYSING MATERIALS BY DETERMINING THEIR CHEMICAL OR PHYSICAL PROPERTIES
- G01N33/00—Investigating or analysing materials by specific methods not covered by groups G01N1/00 - G01N31/00
- G01N33/48—Biological material, e.g. blood, urine; Haemocytometers
- G01N33/483—Physical analysis of biological material
-
- G—PHYSICS
- G01—MEASURING; TESTING
- G01N—INVESTIGATING OR ANALYSING MATERIALS BY DETERMINING THEIR CHEMICAL OR PHYSICAL PROPERTIES
- G01N33/00—Investigating or analysing materials by specific methods not covered by groups G01N1/00 - G01N31/00
- G01N33/48—Biological material, e.g. blood, urine; Haemocytometers
- G01N33/483—Physical analysis of biological material
- G01N33/4833—Physical analysis of biological material of solid biological material, e.g. tissue samples, cell cultures
-
- G—PHYSICS
- G01—MEASURING; TESTING
- G01N—INVESTIGATING OR ANALYSING MATERIALS BY DETERMINING THEIR CHEMICAL OR PHYSICAL PROPERTIES
- G01N15/00—Investigating characteristics of particles; Investigating permeability, pore-volume or surface-area of porous materials
- G01N15/10—Investigating individual particles
- G01N2015/1006—Investigating individual particles for cytology
-
- G—PHYSICS
- G01—MEASURING; TESTING
- G01N—INVESTIGATING OR ANALYSING MATERIALS BY DETERMINING THEIR CHEMICAL OR PHYSICAL PROPERTIES
- G01N15/00—Investigating characteristics of particles; Investigating permeability, pore-volume or surface-area of porous materials
- G01N15/10—Investigating individual particles
- G01N2015/1029—Particle size
-
- G—PHYSICS
- G01—MEASURING; TESTING
- G01N—INVESTIGATING OR ANALYSING MATERIALS BY DETERMINING THEIR CHEMICAL OR PHYSICAL PROPERTIES
- G01N15/00—Investigating characteristics of particles; Investigating permeability, pore-volume or surface-area of porous materials
- G01N15/10—Investigating individual particles
- G01N2015/103—Particle shape
-
- G—PHYSICS
- G01—MEASURING; TESTING
- G01N—INVESTIGATING OR ANALYSING MATERIALS BY DETERMINING THEIR CHEMICAL OR PHYSICAL PROPERTIES
- G01N15/00—Investigating characteristics of particles; Investigating permeability, pore-volume or surface-area of porous materials
- G01N15/10—Investigating individual particles
- G01N15/14—Optical investigation techniques, e.g. flow cytometry
- G01N2015/1497—Particle shape
Definitions
- the present invention relates to a method for predicting gene transfer rate. (Background of the invention)
- Non-Patent Document 1 reports that CAR-T cells were measured using flow cytometry.
- Cytometry Part B Clinical Cytometry, Volume 100, Issue 2, p. 218-224
- An object of the present invention is to provide a method for predicting the gene transfer rate, etc., which makes it possible to measure the gene transfer rate of cells more easily and efficiently than conventional methods.
- the present invention was completed based on these findings and further studies, and provides the following method for predicting the gene transfer rate of animal cells.
- a method for predicting the gene transfer rate of animal cells comprising: A method comprising: (1) measuring cell complexity in animal cells into which the gene has been introduced; and (2) predicting the gene introduction rate based on the value measured in step (1).
- a method comprising: (1) measuring cell complexity in animal cells into which the gene has been introduced; and (2) predicting the gene introduction rate based on the value measured in step (1).
- the distribution of cell complexity is used to predict the gene transfer rate of the cell population.
- the parameters of the cell complexity distribution are determined from the mean, median, mode, variance, kurtosis, skewness, maximum, minimum, quartile, peak height, and half-width.
- the parameter of cell complexity distribution is at least one selected from the group consisting of mean, median, mode, variance, kurtosis, and skewness, according to [4].
- Method. [7] The method according to [3], wherein in step (2), the gene transfer rate of the cell population is predicted by determining the complexity distribution of the animal cells into which the gene has been introduced from the cell complexity distribution.
- step (1) Any of [1] to [7], wherein the measurement of cell complexity in step (1) is performed by measuring side scattered light (SSC) or side fluorescence (SFL) with a flow cytometer. Method described in Crab.
- Measurement of cell complexity in step (1) is performed by measuring SSC or SFL using a flow cytometer, and in step (2), the pulse height, width, and area of SSC or SFL are measured for the cell population.
- step (2) The method according to [1], [2], [8] or [9], wherein in step (2), the cell size value is further used to predict the gene transfer rate of the cell population.
- Measurement of cell complexity in step (1) can be performed by measuring intracellular organelles, cell surface sugar chains, cell membranes, cell lipids, intracellular metabolites, cell lipid droplets, or the shape of the cell surface.
- a method for producing a gene-introduced cell preparation comprising: (I) Step of measuring the complexity of animal cells into which the gene has been introduced and measuring the gene introduction rate based on the measured value method including.
- the method for predicting the gene transfer rate of the present invention compared to conventional methods, there is no need for complicated steps and simple operations (for example, the only necessary operation is automatic measurement using a measuring device), the gene transfer rate of cells is achieved. can be measured. Furthermore, according to the method for predicting gene transfer rate of the present invention, it is possible to efficiently (for example, in a short period of less than 5 minutes) measure the gene transfer rate of cells.
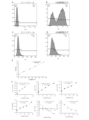
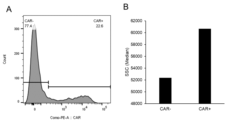
- FIG. 3 is a diagram showing the results of Example 1.
- D Graph showing SSC in CAR-T cells into which the CAR gene has been introduced
- E CAR positive rate
- SSC high portions with visually high SSC are cut out from the control histogram and gating is applied.
- FIG. 3 is a diagram showing the results of Example 2.
- FIG. 7 is a diagram showing the results of Example 3.
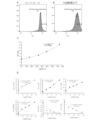
- A Graph showing SFL in control T cells without gene introduction and (B) CAR-T cells into which CAR gene was introduced.
- C Correlation between CAR positive rate (%) and SFL high.
- FIG. 4 is a diagram showing the results of Example 4.
- the CAR positive rate predicted by flow cytometry was 66.8%, and the CAR positive rate calculated from a mixed lognormal distribution model was 67.5%.
- FIG. 7 is a diagram showing the results of Example 5.
- FIG. 7 is a diagram showing the results of Example 6.
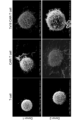
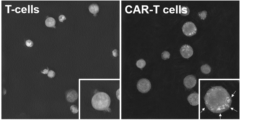
- FIG. 7 is a diagram showing the morphology of T cells and CAR-T cells in Example 7.
- A Image taken with a transmission electron microscope.
- FIG. 7 is a diagram showing the morphology of T cells and CAR-T cells in Example 7.
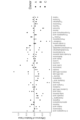
- FIG. 3 is a graph showing the results of metabolome/lipidome analysis of T cells and CAR-T cells in Example 8.
- the horizontal axis shows each component, and the vertical axis shows the difference in amount between T cells and CAR-T cells.
- a t-test was conducted for each component.
- 3 is a graph showing the results of metabolome/lipidome analysis of T cells and CAR-T cells in Example 8.
- the horizontal axis shows each component, and the vertical axis shows the difference in amount between T cells and CAR-T cells. A t-test was conducted for each component.
- p ⁇ 0.05, **: p ⁇ 0.01, ***: p ⁇ 0.001 3 is a graph showing the results of metabolome/lipidome analysis of T cells and CAR-T cells in Example 8.
- the horizontal axis shows each component, and the vertical axis shows the difference in amount between T cells and CAR-T cells.
- a t-test was conducted for each component.
- *: p ⁇ 0.05, **: p ⁇ 0.01, ***: p ⁇ 0.001 3 is a graph showing the results of metabolome/lipidome analysis of T cells and CAR-T cells in Example 8.
- the horizontal axis shows each component, and the vertical axis shows the difference in amount between T cells and CAR-T cells. A t-test was conducted for each component.
- p ⁇ 0.05, **: p ⁇ 0.01, ***: p ⁇ 0.001 3 is a graph showing the results of metabolome/lipidome analysis of T cells and CAR-T cells in Example 8.
- the horizontal axis shows each component, and the vertical axis shows the difference in amount between T cells and CAR-T cells.
- a t-test was conducted for each component.
- *: p ⁇ 0.05, **: p ⁇ 0.01, ***: p ⁇ 0.001 3 is a graph showing the results of metabolome/lipidome analysis of T cells and CAR-T cells in Example 8.
- the horizontal axis shows each component, and the vertical axis shows the difference in amount between T cells and CAR-T cells. A t-test was conducted for each component.
- 3 is a graph showing the results of metabolome/lipidome analysis of T cells and CAR-T cells over time in Example 8.
- a two-way analysis of variance was performed for each component based on culture days and cell type, and changes in the amount of each component over time were plotted for the top 50 components with the lowest p values.
- 3 is a graph showing the results of metabolome/lipidome analysis of T cells and CAR-T cells over time in Example 8.
- a two-way analysis of variance was performed for each component based on culture days and cell type, and changes in the amount of each component over time were plotted for the top 50 components with the lowest p values.
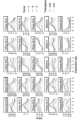
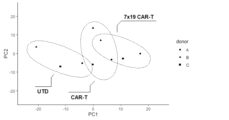
- FIG. 12 is a graph showing the results of principal component analysis of metabolome/lipidome analysis of T cells and CAR-T cells in Example 8. Principal component analysis was performed for each component, and a scatter diagram was plotted with the first principal component as the horizontal axis and the second principal component as the vertical axis. Samples from UTD (T cells), CAR-T, and 7x19 CAR-T donors are plotted close to each other, and can be distinguished by the presence or absence and type of CAR gene.
- 7 is a graph showing the results of metabolome lipidome enrichment analysis in Example 9.
- FIG. 9 is a diagram showing the results of quantitative analysis of mitochondria in T cells and CAR-T cells in Example 9.
- 3 is a graph showing the difference in autofluorescence between T cells and CAR-T cells in Example 9.
- FIG. 7 is a diagram showing an image taken by a holographic microscope in Example 10.
- FIG. 7 is a diagram showing the results of Example 11.
- A Fractionation of mCherry gene-transfected ⁇ T cells by flow cytometry
- B Histogram of SSC of mCherry-negative cells and mCherry-positive cells
- FIG. 7 is a diagram showing the results of Example 12.
- FIG. 7 is a diagram showing the results of Example 13.
- A Fractionation of CAR gene-transfected NK92 cells by flow cytometry
- FIG. 7 is a diagram showing the results of total glycomics analysis of T cells and CAR-T cells in Example 14.
- A Results of principal component analysis
- B Results of heat map analysis. In the heat map analysis, classes indicate the fractions of CAR-T cells and T cells (UTD), and each column indicates the amount of sugar chain expression in each cell by color.
- “Comprise(s) or comprising” means including, but not limited to, the element following the phrase. Thus, the inclusion of the element following the phrase is implied, but the exclusion of any other element is not implied.
- “consist(s) of” or “consisting of” means to include and be limited to all elements following the phrase. Thus, the phrase “consisting of” indicates that the listed element is required or essential and substantially no other elements are present.
- “consist(s) essentially of or consisting essentially of” includes any element that follows that phrase and affects the activity or effect identified in this disclosure for that element. means that it is limited to other elements that do not. Thus, the phrase “consisting essentially of” means that the listed element is required or essential, but that other elements are optional and that they affect the activity or action of the listed element. Indicates that it may or may not exist, depending on whether or not it has an effect.
- pluripotent stem cell refers to embryonic stem cells (ES cells) and similar pluripotent cells, that is, cells with various tissues in the body (endoderm, mesoderm, ectoderm). refers to cells that potentially have the ability to differentiate into all germ layers).
- Examples of cells having pluripotency similar to ES cells include "induced pluripotent stem cells” (sometimes referred to herein as "iPS cells”).
- iPS cells induced pluripotent stem cells
- the cell may be a cell produced by destroying an embryo or a cell produced without destroying an embryo. Preferably, the cells are produced without destroying the embryo.
- cell population means two or more cells of the same type or different types.
- Cell population also means a mass of cells of the same type or of different types.
- the method for predicting the gene transfer rate of animal cells of the present invention is as follows: The method is characterized by comprising the steps of (1) measuring the cell complexity of animal cells into which the gene has been introduced, and (2) predicting the gene introduction rate based on the value measured in step (1).
- the "gene introduction rate" in the present invention refers to the rate of introduction of nucleic acid into cells, such as the proportion of cells into which nucleic acid has been introduced in all cells, the amount of nucleic acid taken up in a cell population, or the introduction rate in all cell populations. It is the expression rate of the gene. If the introduced gene is a CAR, it may also be described as the CAR positivity rate.
- step (1) the cell complexity of the animal cells into which the gene has been introduced is measured.
- animal cell is not particularly limited, and a wide variety of animal cells can be used.
- animal cell types include tile cells, nerve cells, glial cells, pancreatic ⁇ cells, bone marrow cells, mesangial cells, Langerhans cells, epidermal cells, epithelial cells, endothelial cells, fibroblasts, fiber cells, and muscle cells ( Examples: skeletal muscle cells, cardiomyocytes, myoblasts, muscle satellite cells), adipocytes, immune cells (e.g.
- NK cells natural killer cells
- mast cells neutrophils, basocytes, eosinophils, monocytes, megakaryocytes
- synovial cells chondrocytes, osteocytes, osteoblasts, osteoclasts, mammary gland cells, hepatocytes, stromal cells, egg cells and sperm cells
- pluripotent stem cells such as neural stem cells, hematopoietic stem cells, mesenchymal stem cells, dental pulp stem cells, iPS cells, and ES cells
- progenitor cells blood cells, oocytes, and fertilized eggs can be mentioned.
- T cells include ⁇ T cells, ⁇ T cells, helper T cells, cytotoxic T cells, regulatory T cells, suppressor T cells, tumor-infiltrating T cells, memory T cells, naive T cells, NKT cells, and TCR-T cells. , STAR receptor T cells, CAR-T cells, and the like.
- animal cells also include the above-mentioned cells produced by inducing differentiation of primary cells, the above-mentioned stem cells (eg, iPS cells), etc. in vitro.
- animal cells include various cancer cells. The animal cells may contain only one type or two or more types.
- animal cells are not particularly limited, and examples of such organisms include mammals such as humans, mice, rats, cows, horses, pigs, rabbits, dogs, cats, goats, monkeys, and chimpanzees. be done. Among these, humans are preferred.
- Animal cells are animal cells into which a foreign gene has been introduced.
- a “foreign gene” is a gene or monomer nucleotide that is introduced from the outside to cause animal cells to express a desired protein, and can be appropriately selected depending on the intended use of the animal cells.
- the term "animal cell into which a gene has been introduced” in the present invention includes both an animal cell into which a gene has actually been introduced after attempting to introduce the gene, and an animal cell into which a gene has not been introduced.
- the term "(animal) cell into which a gene has been introduced” means an (animal) cell into which a gene has actually been introduced.
- “Gene-introduced cells” and “gene-introduced cells” may be used interchangeably depending on the context.
- the foreign gene can be, for example, a gene for expressing CAR (chimeric antigen receptor).
- the foreign genes can be, for example, genes for expressing CAR and genes for expressing cytokines and/or chemokines.
- CARs expressed by animal cells basically have the following characteristics as general or known CARs: (i) an antigen recognition site (e.g., single chain antibody, ligand, peptide, etc.) that recognizes the cell surface antigen of cancer cells; , (ii) a cell membrane-spanning region, and (iii) a signal transduction region that induces activation of T cells.
- the peptides are linked via spacers as necessary.
- TCR T cell receptor
- STAR synthetic T cell receptor and antigen receptor
- chimeric TAC T cell antigen coupler
- suicide genes iCas9, HSV-TK, etc.
- cytokines interactive leukin, chemokine, etc.
- the means for introducing foreign genes into animal cells is not particularly limited, and various known or common methods can be employed.
- the foreign gene is introduced into animal cells using an expression vector and expressed.
- the expression vector may be linear or circular, and may be a non-viral vector such as a plasmid, a viral vector, or a transposon-based vector.
- expression vectors can be introduced into animal cells by known methods such as virus infection, calcium phosphate, lipofection, microinjection, and electroporation.
- Expression vectors can be prepared in a form suitable for use in each technique by known means or using an appropriate commercially available kit (according to its instructions).
- the expression vector can be introduced into animal cells by a virus infection method.
- viral vectors include retrovirus vectors, lentivirus vectors, adenovirus vectors, and adeno-associated virus vectors.
- retrovirus vectors include retrovirus vectors, lentivirus vectors, adenovirus vectors, and adeno-associated virus vectors.
- retrovirus vectors include retrovirus vectors, lentivirus vectors, adenovirus vectors, and adeno-associated virus vectors.
- plasmid packaging vector
- the obtained recombinant virus may be used to infect animal cells.
- all the foreign genes may be contained in one expression vector, all the foreign genes may be contained in separate expression vectors, or all the foreign genes may be contained in separate expression vectors. Some of them may be contained in one expression vector, and the rest may be contained in separate expression vectors.
- a single expression vector contains a plurality of foreign genes, there are no particular limitations on the order in which the foreign genes are arranged from the upstream side to the downstream side.
- a foreign gene can be constructed from a nucleic acid (polynucleotide) having a base sequence encoding the desired protein or polypeptide.
- a nucleic acid polynucleotide
- Those skilled in the art can design and produce an expression vector that can express a desired protein (polypeptide) in animal cells.
- the nucleic acid contained in the expression vector may be produced by a chemical DNA synthesis reaction or may be produced (cloned) as cDNA.
- the expression vector contains sequences such as a promoter, terminator, enhancer, start codon, stop codon, polyadenylation signal, nuclear localization signal (NLS), multiple cloning site (MCS), etc. as necessary. May contain.
- the expression vector may further contain reporter genes (e.g., genes encoding fluorescent proteins of each color), drug selection genes (e.g., kanamycin resistance gene, ampicillin resistance gene, puromycin resistance gene), suicide genes (e.g., diphtheria A toxin, simplex Herpes thymidine kinase (HSV-TK), carboxypeptidase G2 (CPG2), carboxylesterase (CA), cytosine deaminase (CD), cytochrome P450 (cyt-450), deoxycytidine kinase (dCK), nitroreductase (NR), purine Genes encoding nucleoside phosphorylase (PNP), thymidine phosphorylase (TP), varicella-zoster virus thymidine kinase (VZV-TK), xanthine-guanine phosphoribosyltransferase (XGPRT), inducible caspase 9, etc.) It
- Nucleic acid can be any molecule as long as it is a monomer nucleotide or a polymer of a nucleotide and a molecule having the same function as the nucleotide.
- RNA is a polymer of ribonucleotides, or a polymer of deoxyribonucleotides. Examples include a certain DNA, a mixed polymer of ribonucleotides and deoxyribonucleotides, and a nucleotide polymer containing nucleotide analogs, and may also be a nucleotide polymer containing a nucleic acid derivative.
- Nucleic acids may be single-stranded or double-stranded. Double-stranded nucleic acids also include double-stranded nucleic acids in which one strand hybridizes to the other strand under stringent conditions.
- Nucleotide analogs can be used to improve or stabilize nuclease resistance compared to RNA or DNA, to increase affinity with complementary strand nucleic acids, to increase cell permeability, or to improve visualization. Any molecule may be used as long as it is a modified nucleotide, deoxyribonucleotide, RNA or DNA.
- Nucleotide analogs can be naturally occurring or non-natural molecules, such as sugar-modified nucleotide analogs (e.g., nucleotide analogs substituted with 2'-O-methyl ribose, 2'-O- Nucleotide analogs substituted with propyl ribose, nucleotide analogs substituted with 2'-methoxyethoxyribose, nucleotide analogs substituted with 2'-O-methoxyethyl ribose, 2'-O-[2-(guanidium ) ethyl]ribose-substituted nucleotide analogs, 2'-fluoro-ribose-substituted nucleotide analogs, bridged nucleic acid (BNA), locked nucleic acid (LNA), ethylene Ethylene bridged nucleic acid (ENA), peptide nucleic acid (PNA), oxypeptide nucleic acid (OPNA),
- Nucleic acid derivatives can be used to add other chemicals to the nucleic acid in order to improve nuclease resistance, to stabilize it, to increase affinity with complementary strand nucleic acids, to increase cell permeability, or to make it visible. Any molecule may be used as long as it has a substance added thereto, and specific examples include 5'-polyamine addition derivatives, cholesterol addition derivatives, steroid addition derivatives, bile acid addition derivatives, vitamin addition derivatives, Cy5 addition derivatives, Cy3 addition derivatives. , 6-FAM-added derivatives, biotin-added derivatives, and the like.
- proteins, siRNAs, shRNAs, dsRNAs, miRNAs, antisense nucleic acids, etc. may be introduced into animal cells in place of foreign genes. Even after gene introduction, it is possible to measure the rate of gene introduction into cells by measuring the complexity of the cells.
- Cell complexity is not particularly limited as long as it can represent the complexity of the cell, and includes, for example, intracellular complexity, cell surface complexity, etc., and is preferably intracellular complexity. It's complexity.
- Intracellular complexity is not particularly limited as long as it can express intracellular complexity. Intracellular complexity includes, for example, intracellular granularity, nuclear lobulation, nucleus, intracellular organelles (e.g., mitochondria), membrane structure, chromosomes, chromatin, nucleosomes, and internal cellular structures such as oil droplets.
- the complexity of Other factors include the complexity of cellular lipids, intracellular metabolites, and intracellular sugar chains.
- the index used to indicate the "complexity of the cell surface” is not particularly limited as long as it can express the complexity of the cell surface.
- Indices used to indicate the complexity of cell surfaces include, for example, cell circumference, area envelopment, unevenness, arithmetic mean roughness, maximum height, 10-point average roughness, mean spacing between concave and convex peaks, and local peaks. Examples include average spacing, load length ratio, fractal dimension, aspect ratio, circularity, roundness, and compactness.
- the complexity of the cell surface includes, for example, the shape of the cell surface, the complexity of sugar chains on the cell surface, and the like.
- ⁇ Area envelopment degree Area wrapped around the actual perimeter / Area wrapped around the envelope perimeter
- ⁇ Roughness Degree of unevenness on the cell surface
- ⁇ Fractal dimension In fractal geometry, a statistical quantity that indicates how completely a fractal appears to fill space as it expands to a finer scale.
- ⁇ Curularity A geometric tolerance that indicates the roundness of a circle, and is defined by JIS as the amount of deviation from a geometrically correct circle for a circular shape.
- ⁇ Compactness (perimeter) 2 / area
- the method for measuring intracellular complexity is not particularly limited as long as it can measure intracellular complexity, such as measuring using various commercially available measurement devices, visual observation using a microscope, etc. Measuring methods using a microscope, image analysis using a microscope, etc. Examples of devices for measuring such intracellular complexity include flow cytometers, holographic microscopes, high DNA content measuring devices, spectrophotometers, electrophoresis devices, and the like.
- SSC side scatter
- SSC side scatter
- SSC side scatter
- SSC side scatter
- SSC side scatter
- SSC side scatter
- SSC side scatter
- SSC side scatter
- SSC side scatter
- SSC side scatter
- SSC side scatter
- SSC side fluorescence light
- SFL side fluorescence light
- SFL in cells stained with fluorescent substances can be obtained from SFL. It can be used as an indicator of intracellular complexity. Measurement of SFL is performed after cells are stained with a fluorescent substance that stains nucleic acids (eg, polymethine dyes, actinomycin dyes such as DAPI, PI, 7-AAD, and Hoechst dyes such as Hoechest 33342). Measurement of SFL may be performed after staining cells with various known fluorescent substances that stain cytoplasm, organelles, cell membranes, and the like.
- nucleic acids eg, polymethine dyes, actinomycin dyes such as DAPI, PI, 7-AAD, and Hoechst dyes such as Hoechest 33342.
- intracellular organelles can be specifically quantified using a holographic microscope, and by quantifying the amount of DNA using a high DNA amount measuring device, a spectrophotometer, an electrophoresis device, etc., the amount of DNA inside the cell can be determined. can be used as an indicator of complexity.
- Examples of flow cytometers include Beckman Coulter (e.g., Gallios, Navios, Navios EX, CytoFLEX, CytoFLEX S, CytoFLEX LX, Cytomics FC 500, DxH500), BD Biosciences (e.g., BD FACCalibur TM flow cytometer) , BD FACSCanto TM II Flow Cytometer, BD FACSVerse TM Flow Cytometer, BD FACSLyric TM Flow Cytometer, BD LSRFortessa TM Flow Cytometer, BD LSRFortessa TM X-20 Flow Cytometer, BD FACSymphony TM Flow Cytometer), Thermo Fisher Scientific (e.g., Attune flow cytometer), Agilent Technologies (e.g., Novocyte flow cytometer), Sartorius (e.g., flow cytometer iQue3), Sony (e.g., SA3800
- intracellular complexity can be measured based on SSC, and cell size can be measured based on forward scatter (FSC).
- FSC forward scatter
- Measurement of cell complexity and size with a flow cytometer can be performed according to known methods, for example, according to the flow cytometer manufacturer's manual.
- the method for measuring the complexity of the cell surface is not particularly limited as long as it can measure the complexity of the cell surface, and examples include methods using various commercially available measurement devices, visual observation using a microscope Examples include methods of measuring with a measuring device, image analysis of images acquired with a measuring device, etc.
- the complexity of cells can be measured by measuring, for example, intracellular organelles, sugar chains on the cell surface, cell membranes, cell lipids, intracellular metabolites, cell lipid droplets, and the shape of the cell surface. It can be carried out. It can also be carried out by measuring cell-derived autofluorescence (for example, using a flow cytometer, microscope, or microplate reader).
- autofluorescence refers to the spontaneous emission of light (photoluminescence) that occurs when biological structures such as mitochondria and lysosomes absorb light, and is derived from artificially added fluorescent markers (fluorophores). used to distinguish it from light.
- - Cellular organelles refer to membrane-compartmentalized structures present within eukaryotic cells (e.g., mitochondria, endoplasmic reticulum, Golgi apparatus, lysosomes, vacuoles, endosomes, peroxisomes). Gene transfer increases the amount of mitochondria, for example.
- ⁇ Glycans on the cell surface include N-linked sugar chains, O-linked sugar chains, glycolipid sugar chains, glycosaminoglycan sugar chains, and free sugar chains. Basically, it can be any sugar chain inside or outside the cell.
- Gene introduction increases, for example, glycolipid sugar chains, glycosaminoglycan sugar chains, and free sugar chains, and decreases N-linked sugar chains and O-linked sugar chains.
- ⁇ Cell membrane refers to the biological membrane that separates cells from the outside world. Gene introduction changes the components that make up the cell membrane, increasing the amount of the cell membrane.
- ⁇ Cellular lipids refer to lipid components contained in cells, particularly lipids contained in cell membranes.
- gene introduction changes the lipid components of cells, increasing phosphatidic acid, phosphatidylcholine, phosphatidylethanolamine, phosphatidylglycerol, sphingomyelin, triacylglycerol, hexosylceramide, dihexosylceramide, lysophosphatidylethanolamine, etc. do.
- ⁇ Intracellular metabolites refer to metabolic intermediates that exist within cells.
- Gene transfer changes, for example, the metabolic components of a cell.
- -Cellular lipid droplets are intracellular organelles that exist in cells and store lipids. Gene transfer increases the amount of lipid droplets, for example.
- the shape of the cell surface can be expressed by the degree of unevenness. For example, gene introduction changes the shape of the cell surface, making it more uneven and complex (the circumference becomes longer and the degree of area envelopment becomes smaller).
- step (2) the gene introduction rate is predicted based on the value measured in step (1).
- the distribution of cell complexity can be used to predict the gene transfer rate of the cell population.
- the percentage of regions of high cell complexity compared to the complexity distribution of non-transfected control cells is used to predict the transgenic rate of a cell population.
- parameters of cellular complexity distribution are used to predict the transgenic rate of a cell population.
- the mean, median, mode, variance (standard deviation), skewness, and peak of the distribution measured in step (1) can be used. degree, maximum value, minimum value, quartile, peak height, half-value width, etc. (in particular, mean value, median value, mode, variance (standard deviation), skewness, and kurtosis).
- the mean, median, mode, and variance (standard deviation) are positively correlated with the gene transfer rate, and skewness and kurtosis are negatively correlated with the gene transfer rate.
- a method for using the cell complexity distribution parameter to predict the gene transfer rate of a cell population is, for example, based on the gene transfer rate in cells with a known gene transfer rate and the cell complexity distribution parameter.
- An example of this method is to create a calibration curve and determine the gene transfer rate from the parameters obtained from the values measured in step (1) using the calibration curve.
- the calibration curve can be created using software or the like according to a conventional method such as the least squares method.
- the gene transfer rate of the cell population is predicted by determining the complexity distribution of gene-transfected animal cells from the cell complexity distribution. For example, by using a mixed log-normal distribution model, we can predict the gene transfer rate of a cell population by determining the ratio of two populations, the transgenic cell population and the non-transfected cell population, to the total cell population. conduct. Specifically, by applying a mixed normal distribution using the maximum likelihood method to the logarithmically transformed data of the values measured in step (1), each parameter of the mixed lognormal distribution model is estimated, and the gene transfer of the cell population is performed. Find the ratio (see Examples below for details). Such calculation processing can be performed using known software such as R, SAS, SPSS, and JMP.
- the measurement of cell complexity in step (1) is carried out by measuring SSC or SFL using a flow cytometer;
- the SFL pulse height, width, and area are used to predict the gene transfer rate of the cell population to predict the gene transfer rate of the cell population. That is, the gene transfer rate is predicted using the pulse height, width, and area of SSC or SFL measured in individual cells.
- cell size values e.g., FSC measured with a flow cytometer, especially FSC pulse height, width, and area
- Prediction of the gene transfer rate of a cell population can be performed using, for example, a machine learning model.
- a trained prediction model is created by giving training data with a known gene transfer rate to the prediction model and letting it learn.Then, the complexity value of the animal cell is input to the trained prediction model to predict the gene transfer rate. conduct.
- the complexity value of the animal cell is input to the trained prediction model to predict the gene transfer rate. conduct.
- After creating a trained prediction model using the data that determines the presence or absence of gene transfer in individual cells as the correct label and the measured values of pulse height, width, and area of SSC or SFL as learning data The measured values of the pulse height, width, and area of the SSC or SFL of the cell are input into the trained prediction model to predict the gene transfer rate.
- parameters of the distribution of the SSC or SFL of a cell population may be used as learning data. Since the probability of being classified as a gene-introduced cell is obtained by prediction, the gene-introduction rate of the cell population may be determined by determining the presence or absence of gene introduction in individual cells using a certain threshold (for example, 50%). Alternatively, the average probability of each individual cell being classified as a gene-transferred cell may be taken as the gene-transfer rate of the cell population.
- the machine learning model may be one that can perform regression analysis, such as lasso regression, ridge regression, elastic net regression, principal component regression, partial least squares regression, random forest, gradient boosting decision tree, neural network, Examples include deep learning and support vector machines.
- step (2) in addition to the values measured in step (1), values measured at at least one stage before and after gene transfer are used to predict the gene transfer rate of the cell population. and predict the gene transfer rate of the cell population. That is, we measure the complexity of animal cells in multiple steps to produce transgenic animal cells, and use the animal cell complexity values at multiple time points, not just one time point, to determine the transfection rate. make predictions. This use of cellular complexity at multiple time points allows for robust analysis. When predicting the gene transfer rate using animal cell complexity values at multiple time points, the multiple numbers may be, for example, 2, 3, 4, 5, 6, 7, 8, 9, 10, etc. Specific examples of multiple time points include after activation of raw materials and cells, after gene introduction into cells, and after expansion culture after gene introduction.
- the animal cell complexity value used here the above-mentioned cell complexity distribution parameters are preferable.
- cell size values eg, FSC measured with a flow cytometer
- Prediction of the gene transfer rate of a cell population can be performed using, for example, a machine learning model. That is, after creating a trained predictive model by giving training data with a known gene introduction rate to the predictive model and letting it learn, input the complexity values of animal cells measured at multiple time points into the trained predictive model, Predict the gene transfer rate.
- the machine learning model may be one that can perform regression analysis, such as lasso regression, ridge regression, elastic net regression, principal component regression, partial least squares regression, random forest, gradient boosting decision tree, neural network, Examples include deep learning and support vector machines.
- the complexity of the difference between transgenic cells (animal cells into which a gene has actually been introduced) and non-transgenic cells (animal cells into which no gene has been introduced) (especially diameter, SSC or SFL measurements by flow cytometer).
- the difference is that one or more of the mean, median, and mode (among others, the median) among the complexity distribution parameters of the gene-transferred cell population and the gene-untransfected cell population, for example, 5 % or more, 6% or more, 7% or more, 8% or more, 9% or more, and 10% or more.
- the complexity of transgenic cells is greater than that of non-transgenic cells.
- the method for producing a gene-introduced cell preparation of the present invention includes: (I) The method is characterized by including a step of measuring the complexity of the animal cell into which the gene has been introduced and measuring the gene introduction rate based on the measured value.
- the manufacturing method of the present invention includes: (II) The method may further include a step of introducing a gene into animal cells.
- Steps (I) and (II) of the production method of the present invention can be carried out by the method described above.
- the cell preparation produced by the production method of the present invention (hereinafter sometimes referred to as the cell preparation of the present invention) is prepared by introducing an effective amount of the gene into the cell preparation according to known means (for example, the method described in the Japanese Pharmacopoeia, etc.). It is preferable to produce a parenteral preparation by mixing animal cells with a pharmaceutically acceptable carrier.
- the cell preparation of the present invention is preferably produced as a parenteral preparation such as an injection, a suspension, or an infusion.
- Parenteral administration methods include intravenous, intraarterial, intramuscular, intraperitoneal, and subcutaneous administration.
- Pharmaceutically acceptable carriers include, for example, solvents, bases, diluents, excipients, soothing agents, buffers, preservatives, stabilizers, suspending agents, tonicity agents, surfactants, Examples include solubilizing agents.
- the dosage of the cell preparation of the present invention can be appropriately determined depending on various conditions such as the patient's weight, age, sex, and symptoms. Moreover, it may be administered once or multiple times.
- the cell preparation of the present invention can be in a known form suitable for parenteral administration, such as an injection or an infusion.
- the cell preparation of the present invention may contain physiological saline, phosphate buffered saline (PBS), a medium, etc. in order to stably maintain the cells. Examples of the medium include, but are not limited to, RPMI, AIM-V, and X-VIVO10.
- a pharmaceutically acceptable carrier eg, human serum albumin
- preservative, etc. may be added to the cell preparation for the purpose of stabilization.
- the cell preparation of the present invention is applicable to mammals including humans.
- the method for predicting the gene transfer rate of the present invention when measuring the gene transfer rate using conventional flow cytometry, manual labor is required to stain the introduced gene with an antibody, which is complicated. On the other hand, there is no need for such complicated processes; for example, the simple operation of simply loading the sample into a medical device such as a flow cytometer, especially a blood cell analyzer, and the only necessary operation is automatic measurement using a measuring device. It is possible to measure the gene transfer rate of cells. Furthermore, according to the method for predicting the gene transfer rate of the present invention, it is possible to efficiently measure the gene transfer rate of cells in a short time, for example, less than 5 minutes, whereas the conventional method takes 6 to 7 hours. Become. Further, the method of the present invention and the type of cells are not particularly limited and can be applied to various cells. The method of the present invention is expected to be applied to gene therapy such as CAR-T cell therapy.
- SK-HEP-1 cell culture medium MEM, L-Gln (+) (Thermo Fisher Scientific) with 10% FBS (Biosera), 1% Non-essential amino acids (Fujifilm Wako Pure Chemical Industries, Ltd.), 1% It was prepared by adding Penicillin-Streptomycin solution (Fujifilm Wako Pure Chemical Industries, Ltd.) and 1 mM Sodium pyruvate (Fuji Film Wako Pure Chemical Industries, Ltd.).
- NK92 cell culture medium Prepared by adding 20% FBS (Biosera) to RPMI 1640 Media (Thermo Fisher Scientific) and adding MACS GMP IL-2 (Miltenyi Biotec) to 200 IU/mL.
- the activated cells were diluted with culture medium using the LOVO Cell processing system (Fresenius Kabi) or a centrifuge, and then treated with RetroNectin (trademark) (Takara Bio Inc.), CAR gene, CAR gene, IL-7 gene, and CCL19.
- the cells were seeded at 6.07x10 5 cells/cm 2 or less in a culture bag coated in advance with a retrovirus into which the gene or mCherry gene had been introduced, and cultured until the next day (gene introduction step).
- the cells were seeded at 2.2x10 6 cells/cm 2 or less in a culture bottle (G-REX, Wilson Wolf) and cultured for 3-7 days to produce CAR-T cells (final product).
- the CAR gene used has the nucleotide sequence shown in SEQ ID NO: 1
- the CAR gene, IL-7 gene and CCL19 gene have the nucleotide sequence shown in SEQ ID NO: 2
- the mCherry gene has the nucleotide sequence shown in SEQ ID NO: 3. (The same applies to the case of SK-HEP-1 cells below).
- SK-HEP-1 cells Dilute SK-HEP-1 cells (ATCC) with SK-HEP-1 cell culture medium to 2.0x10 6 cells/mL or less, and pre-incubate with RetroNectin (Takara Bio Inc.) and a retrovirus containing the CAR gene.
- the CAR gene was introduced into SK-HEP-1 cells by seeding them at 6.07x10 5 cells/cm 2 or less on a coated culture plate and culturing for 4 days.
- NK-92 a cell line of NK cells
- the cells were cultured in NK92 cell culture medium. After culturing, the cell suspension was seeded at 6.07x10 5 cells/cm 2 or less into a culture bag pre-coated with RetroNectin (trademark) (Takara Bio Inc.) and a retrovirus into which the CAR gene had been introduced, and CAR- NK cells were produced.
- RetroNectin trademark
- Intracellular complexity was quantified by SFL using a multi-item hematology analyzer XN-330 (Sysmex Corporation).
- each parameter of the mixed log-normal distribution model was estimated by fitting a mixed normal distribution using the maximum likelihood method to data obtained by logarithmically transforming the SSC of individual cells measured by flow cytometry.
- Log-likelihood function of probability density function p(x) Each parameter was estimated using the EM algorithm using maximum likelihood. Since the ratios of the two populations to the total cell population are ⁇ 1 and ⁇ 2 , respectively, the weighting coefficient ⁇ of the larger population of ⁇ 1 and ⁇ 2 was estimated as the ratio of the target gene-introduced cells.
- the probability that each cell is classified as CAR positive is obtained by prediction, but the average value of the CAR positive probability of all the measured cells is used as the predicted value of the CAR positive rate in that measurement, and the probability of classifying each cell as CAR positive is obtained.
- the SSC measurement values were used as test data to fit the model, and the CAR positive rate of each sample was predicted.
- a prediction model was constructed from one sample using all the measured values of FSC and SSC, which are parameters obtained without staining in flow cytometry, and the CAR positive rate of 16 samples other than those used for prediction was predicted. .
- ⁇ Metabolome/lipidome analysis> The cell pellet was lysed with 1 mL methanol per 10 6 cells and homogenized by vortexing. After homogenization, analysis was performed by hydrophilic interaction chromatography/tandem mass spectrometry (HILIC/MS/MS), lipidomics, and gas chromatography/tandem mass spectrometry (GC/MS/MS). As samples, three lots of T cells and CAR-T cells into which genes had been introduced from each T cell were used, and samples were taken 1, 2, 3, and 4 days after gene introduction.
- HILIC/MS/MS hydrophilic interaction chromatography/tandem mass spectrometry
- lipidomics lipidomics
- GC/MS/MS gas chromatography/tandem mass spectrometry
- LC/MS/MS liquid chromatography/tandem mass spectrometry
- a ZIC-cHILIC column (2.1 ⁇ 100 mm, 3 ⁇ m, Merck Millipore) was used.
- Selected reaction monitoring (SRM) was used to detect metabolites, and the abundance of each metabolite was evaluated as the peak area on the SRM chromatogram.
- ⁇ Total Glycomics> After pretreatment of cells, the desired N-linked sugar chains were cleaved with trypsin/PNGaseF (Fujifilm Wako Pure Chemical Industries, Ltd.), and the sugar chains were captured using the Glycoblotting method, aoWR(H) (Sumitomo Bakelite Co., Ltd.) was labeled and measured using MALDI-TOF MS.
- Glycolipid (GSL) sugar chains and free sugar chains (FOS) were measured by cutting the target sugar chains with EGCaseI (New England Biolabs), capturing the sugar chains using the Glycoblotting method, labeling them with aoWR(H), and using MALDI-TOF MS. .
- Glycosaminoglycans were degraded to ⁇ 2 sugars using Chondroitinase ABC (Sigma-Aldrich) or Heparinase I, II, III (Sigma-Aldrich), and the ⁇ 2 sugars were captured on beads using the Glycoblotting method and labeled with 2AB. were measured by UPLC.
- O-linked sugar chains are labeled using the BEP method, which adds 3-methyl-1-phenyl-5-pyrazolone through a pyrazolone-coexisting ⁇ -elimination reaction that simultaneously performs Michael addition to the sugar chain binding site of the deglycosylated peptide. , measured by MALDI-TOF MS.
- Example 2 Prediction of gene transfer rate using SK-Hep-1 cells
- the liver cancer cell line SK-Hep-1 was used in Example 1 regardless of the cells introduced (i.e., other than T cells).
- the results are shown in Figure 2.
- SSC was increased by introducing the CAR gene (FIGS. 2A to 2D).
- Example 3 Correlation between CAR gene introduction rate of CAR-T cells and SFL of cells
- SSC was used to measure the complexity of cells, but the amount of nucleic acids stained with polymethine dyes
- Example 4 Prediction of gene transfer rate from SSC distribution
- the CAR transfer rate of CAR-T cells and SSC were measured by flow cytometry, and a mixed lognormal distribution model consisting of two large and small populations was applied to the SSC distribution using maximum likelihood. The proportions of each population were calculated by estimation. The results are shown in Figure 4. The percentage of the cell population with high SSC (67.5%) calculated by the mixed log-normal distribution model was very close to the CAR gene transfer rate (66.8%) measured by flow cytometry.
- Example 5 Prediction of gene transfer rate using machine learning model CAR-T cells and CAR-T cells co-expressing IL-7 and CCL19 (T cells into which the above CAR gene, IL-7 gene and CCL19 gene were introduced) SSC and FSC of cells) were measured using flow cytometry, and the measured values of height, width, and area of SSC and FSC (SSC-H, SSC-W, SSC-A, FSC-H, FSC-W, FSC - From A), the CAR gene introduction rate was predicted using a machine learning algorithm. The results are shown in Figure 5.
- Example 6 Comparison of structure of cell membranes of CAR-T cells and T cells to which no gene has been introduced Antibody staining of CAR-T cells to which the CAR gene has been introduced and control T cells to which no gene has been introduced ( Figures 6A-B ) and an electron microscope (Fig. 6C-D) to analyze the structure of each cell membrane. As a result, it was confirmed that the cell membrane structure of CAR-T cells was more complex than that of controls (arrow shown in FIG. 6). Furthermore, the complexity of the cell membrane was quantified by image analysis in terms of area, diameter, circumference, and degree of area envelopment (Fig. 6E). Image analysis also confirmed that, compared to controls, CAR-T cells had longer circumferences and smaller area envelopes, making the cell membranes more uneven and complex.
- Example 7 Comparison of complexity of cell membrane structure between T cells and CAR-T cells To examine the complexity of cell membranes, the morphology of cell membranes was observed using a transmission electron microscope and a scanning electron microscope. After producing CAR-T cells or CAR-T cells expressing IL-7 and CCL19, only CAR-expressing cells were concentrated using MACS. Thereafter, images were taken using a transmission electron microscope (FIG. 7A) or a scanning electron microscope (FIG. 7B). As a result, CAR-T cells or CAR-T cells expressing IL-7 and CCL19 had more protrusion structures and a more complex cell membrane structure than T cells.
- Example 8 Changes in lipid components of cell membranes in T cells and CAR-T cells
- metabolome lipidome analysis was performed to quantify membrane components.
- three lots of T cells and CAR-T cells into which genes had been introduced from each T cell were sampled on days 1, 2, 3, and 4, respectively.
- the results are shown in Figure 8-10.
- the abbreviations of lipid components in the figure are as follows.
- PA phosphatidic acid
- PC phosphatidylcholine
- LPC lysophosphatidylcholine
- PE phosphatidylethanolamine
- LPE lysophosphatidylethanolamine
- PG phosphatidylglycerol
- PI phosphatidylinositol
- PS phosphatidylserine
- SM sphingomyelin
- MG mono Acylglycerol
- TG triacylglycerol
- Cer ceramide
- CL cardiolipin
- DHSM dihydrosphingomyelin
- FFA free fatty acid
- GM3 ganglioside M3
- Hex-Cer hexosylceramide
- Hex2-Cer dihexosylceramide .
- a bond between glycerol and a fatty acid that is an ester bond is expressed as a
- an ether bond is expressed as e
- the numbers a and e indicate the number of fatty acid residues bonded to the glycerol moiety.
- the total number of carbon atoms (x) and the number of double bonds (y) of the fatty acid residues bonded are expressed as x:y.
- PC aa-34:1
- two fatty acids are bonded to the glycerol moiety of phosphatidylcholine through ester bonds, and the total number of carbon atoms in the fatty acid residues is 34, and there is one double bond among them. This shows that there are several.
- Each target molecule was calculated as a relative value to the average of QC samples that were a mixture of all samples.
- a t-test was performed on the values of each component on the 4th day of expansion culture, and components with significant differences were extracted (FIG. 8).
- a two-way analysis of variance was performed based on the number of culture days and cell type, and components with significant differences were extracted ( Figure 9 ).
- principal component analysis was performed on the values of each component on the fourth day of expansion culture, and a scatter diagram was plotted with the first principal component as the horizontal axis and the second principal component as the vertical axis (FIG. 10). This analysis revealed that the composition of membrane components changes between T cells and CAR-T cells. Furthermore, since the amount of components per cell increased in CAR-T cells, it was found that the amount of cell membrane per cell increased.
- Example 9 Quantification of gene transfer rate using differences in mitochondria Using the metabolome/lipidome results obtained in Example 8, enrichment analysis (FIG. 11) and network analysis were performed.
- TAG is triacylglycerol
- O-PC is ether phosphatidylcholine.
- Enrichment analysis revealed that PG and PE lipid subclasses were particularly highly expressed in CAR-T cells.
- network analysis revealed changes in pathways related to Glycerophospholipid metabolism, Glycesylphosphatidylinositol (GPI)-anchor biosynthesis, and Glycerolipid metabolism.
- Example 10 Comparison of the complexity of the intracellular structure of T cells and CAR-T cells The intracellular structure of CAR-T cells into which the CAR gene was introduced and control T cells without the gene into which the gene was introduced was measured using a holographic microscope. Compare complexity. The results are shown in FIG. As a result, more vacuoles and oil droplet-like structures were observed in CAR-T cells than in T cells. This made CAR-T cells more complex.
- Example 11 Change in complexity in ⁇ T cells introduced with mCherry gene After producing ⁇ T cells introduced with mCherry gene, SSC was compared between mCherry-negative cells and mCherry-positive cells (FIG. 15A). As a result, SSC was high in mCherry-positive cells, and ⁇ T cells were complicated by mCherry introduction (FIGS. 15B and 15C).
- Example 12 Change in complexity in ⁇ T cells into which the CAR gene has been introduced After producing ⁇ T cells into which the CAR gene has been introduced, the SSCs of CAR-negative cells and CAR-positive cells were compared (FIG. 16A). As a result, SSC was high in CAR-positive cells, and ⁇ T cells were complicated by CAR gene introduction (FIG. 16B).
- Example 13 Change in complexity in CAR-NK cells After producing CAR-NK cells into which the CAR gene had been introduced from NK92 cells, SSCs were compared between CAR-negative cells and CAR-positive cells (FIG. 17A). As a result, SSC was high in CAR-positive cells, and NK92 cells were complicated by CAR gene introduction (FIG. 17B).
- Example 14 Total glycomic analysis in T cells and CAR-T cells
- Sugar chains exist inside and outside cells. N-linked sugar chains, O-linked sugar chains, and glycolipid (GSL) sugar chains in CAR-T cells with the CAR gene introduced and control T cells without the gene introduced to examine cell complexity.
- GAG glycosaminoglycan
- FOS free sugar chains
Landscapes
- Health & Medical Sciences (AREA)
- Life Sciences & Earth Sciences (AREA)
- Chemical & Material Sciences (AREA)
- Engineering & Computer Science (AREA)
- Physics & Mathematics (AREA)
- General Health & Medical Sciences (AREA)
- Biomedical Technology (AREA)
- Biochemistry (AREA)
- Genetics & Genomics (AREA)
- General Physics & Mathematics (AREA)
- Pathology (AREA)
- Immunology (AREA)
- Analytical Chemistry (AREA)
- Molecular Biology (AREA)
- Biophysics (AREA)
- Biotechnology (AREA)
- General Engineering & Computer Science (AREA)
- Organic Chemistry (AREA)
- Zoology (AREA)
- Wood Science & Technology (AREA)
- Bioinformatics & Cheminformatics (AREA)
- Dispersion Chemistry (AREA)
- Epidemiology (AREA)
- Animal Behavior & Ethology (AREA)
- Public Health (AREA)
- Veterinary Medicine (AREA)
- Urology & Nephrology (AREA)
- Hematology (AREA)
- Medicinal Chemistry (AREA)
- Food Science & Technology (AREA)
- Plant Pathology (AREA)
- Microbiology (AREA)
- Nuclear Medicine, Radiotherapy & Molecular Imaging (AREA)
- Signal Processing (AREA)
- Optics & Photonics (AREA)
- Cell Biology (AREA)
- Measuring Or Testing Involving Enzymes Or Micro-Organisms (AREA)
Priority Applications (4)
| Application Number | Priority Date | Filing Date | Title |
|---|---|---|---|
| CN202380043740.0A CN119301267A (zh) | 2022-03-31 | 2023-03-30 | 基因导入率的预测方法 |
| JP2024512845A JPWO2023190974A1 (https=) | 2022-03-31 | 2023-03-30 | |
| US18/851,967 US20250208046A1 (en) | 2022-03-31 | 2023-03-30 | Method for predicting gene transfer rate |
| EP23780982.7A EP4502172A1 (en) | 2022-03-31 | 2023-03-30 | Method for predicting gene transfer rate |
Applications Claiming Priority (4)
| Application Number | Priority Date | Filing Date | Title |
|---|---|---|---|
| JP2022059600 | 2022-03-31 | ||
| JP2022-059600 | 2022-03-31 | ||
| JP2022158218 | 2022-09-30 | ||
| JP2022-158218 | 2022-09-30 |
Publications (1)
| Publication Number | Publication Date |
|---|---|
| WO2023190974A1 true WO2023190974A1 (ja) | 2023-10-05 |
Family
ID=88202266
Family Applications (1)
| Application Number | Title | Priority Date | Filing Date |
|---|---|---|---|
| PCT/JP2023/013374 Ceased WO2023190974A1 (ja) | 2022-03-31 | 2023-03-30 | 遺伝子導入率予測方法 |
Country Status (5)
| Country | Link |
|---|---|
| US (1) | US20250208046A1 (https=) |
| EP (1) | EP4502172A1 (https=) |
| JP (1) | JPWO2023190974A1 (https=) |
| CN (1) | CN119301267A (https=) |
| WO (1) | WO2023190974A1 (https=) |
Citations (4)
| Publication number | Priority date | Publication date | Assignee | Title |
|---|---|---|---|---|
| US20190226994A1 (en) * | 2016-07-04 | 2019-07-25 | Celltool Gmbh | Device and Method for the Determination of Transfection |
| WO2022045334A1 (ja) * | 2020-08-31 | 2022-03-03 | 武田薬品工業株式会社 | 推論装置、推論方法、推論プログラム、モデル生成方法、推論サービス提供システム、推論サービス提供方法及び推論サービス提供プログラム |
| JP2022059600A (ja) | 2020-10-01 | 2022-04-13 | エヌエイチエヌ コーポレーション | ゲーム制御方法 |
| JP2022158218A (ja) | 2021-04-01 | 2022-10-17 | 鹿島建設株式会社 | 目地部形成方法及び型枠構造 |
-
2023
- 2023-03-30 JP JP2024512845A patent/JPWO2023190974A1/ja active Pending
- 2023-03-30 EP EP23780982.7A patent/EP4502172A1/en not_active Withdrawn
- 2023-03-30 US US18/851,967 patent/US20250208046A1/en not_active Abandoned
- 2023-03-30 WO PCT/JP2023/013374 patent/WO2023190974A1/ja not_active Ceased
- 2023-03-30 CN CN202380043740.0A patent/CN119301267A/zh active Pending
Patent Citations (4)
| Publication number | Priority date | Publication date | Assignee | Title |
|---|---|---|---|---|
| US20190226994A1 (en) * | 2016-07-04 | 2019-07-25 | Celltool Gmbh | Device and Method for the Determination of Transfection |
| WO2022045334A1 (ja) * | 2020-08-31 | 2022-03-03 | 武田薬品工業株式会社 | 推論装置、推論方法、推論プログラム、モデル生成方法、推論サービス提供システム、推論サービス提供方法及び推論サービス提供プログラム |
| JP2022059600A (ja) | 2020-10-01 | 2022-04-13 | エヌエイチエヌ コーポレーション | ゲーム制御方法 |
| JP2022158218A (ja) | 2021-04-01 | 2022-10-17 | 鹿島建設株式会社 | 目地部形成方法及び型枠構造 |
Non-Patent Citations (7)
| Title |
|---|
| BIOCHEMISTRY, vol. 81, 2016, pages 636 - 650 |
| BIOCHIMICA ET BIOPHYSICA ACTA, vol. 1859, 2017, pages 1558 - 1572 |
| CYTOMETRY PART B: CLINICAL CYTOMETRY, vol. 100, pages 218 - 224 |
| JOURNAL OF JAPANESE BIOCHEMICAL SOCIETY, vol. 83, no. 6, 2011, pages 462 - 474 |
| JOURNAL OF LIPID RESEARCH, vol. 54, 2013, pages 2665 - 2677 |
| KOTARO HIRAMATSU, IDEGUCHI TAKURO, YONAMINE YUSUKE, LEE SANGWOOK, LUO YIZHI, HASHIMOTO KAZUKI, ITO TAKURO, HASE MISA, PARK JEE-WOO: "High-throughput label-free molecular fingerprinting flow cytometry", SCIENCE ADVANCES, vol. 5, 16 January 2019 (2019-01-16), pages eaau0241, XP055748321, DOI: 10.1126/sciadv.aau0241 * |
| WANG YONGTAO, YANG YINGJUN, YOSHITOMI TORU, KAWAZOE NAOKI, YANG YINGNAN, CHEN GUOPING: "Regulation of gene transfection by cell size, shape and elongation on micropatterned surfaces", JOURNAL OF MATERIALS CHEMISTRY. B, ROYAL SOCIETY OF CHEMISTRY, GB, vol. 9, no. 21, 3 June 2021 (2021-06-03), GB , pages 4329 - 4339, XP093073562, ISSN: 2050-750X, DOI: 10.1039/D1TB00815C * |
Also Published As
| Publication number | Publication date |
|---|---|
| US20250208046A1 (en) | 2025-06-26 |
| CN119301267A (zh) | 2025-01-10 |
| JPWO2023190974A1 (https=) | 2023-10-05 |
| EP4502172A1 (en) | 2025-02-05 |
Similar Documents
| Publication | Publication Date | Title |
|---|---|---|
| Meng et al. | Mechanosensing through YAP controls T cell activation and metabolism | |
| Salomon et al. | Extracellular vesicles and their emerging roles as cellular messengers in endocrinology: an endocrine society scientific statement | |
| Jayabalan et al. | Cross talk between adipose tissue and placenta in obese and gestational diabetes mellitus pregnancies via exosomes | |
| Evans et al. | Human endometrial extracellular vesicles functionally prepare human trophectoderm model for implantation: Understanding bidirectional maternal‐embryo communication | |
| Greening et al. | Human endometrial exosomes contain hormone-specific cargo modulating trophoblast adhesive capacity: insights into endometrial-embryo interactions | |
| Ambrosio et al. | Mechanism of platelet dense granule biogenesis: study of cargo transport and function of Rab32 and Rab38 in a model system | |
| Dewulf et al. | Dystrophy-associated caveolin-3 mutations reveal that caveolae couple IL6/STAT3 signaling with mechanosensing in human muscle cells | |
| Adinolfi et al. | Basal activation of the P2X7 ATP receptor elevates mitochondrial calcium and potential, increases cellular ATP levels, and promotes serum-independent growth | |
| US11156616B2 (en) | Methods of detecting therapeutic exosomes | |
| Hood et al. | A systematic approach to exosome‐based translational nanomedicine | |
| Schmidt et al. | Siglec-6 mediates the uptake of extracellular vesicles through a noncanonical glycolipid binding pocket | |
| Griess et al. | Sphingolipid subtypes differentially control proinsulin processing and systemic glucose homeostasis | |
| Ghebosu et al. | Extracellular vesicle and lipoprotein interactions | |
| JP2016514950A (ja) | 標的細胞の選択的富化のための方法、組成物、キット、及びシステム | |
| Amrithraj et al. | Gestational diabetes alters functions in offspring’s umbilical cord cells with implications for cardiovascular health | |
| Chennupati et al. | Ribonuclease inhibitor 1 regulates erythropoiesis by controlling GATA1 translation | |
| Kon et al. | Smap1 deficiency perturbs receptor trafficking and predisposes mice to myelodysplasia | |
| Di et al. | Connexin interaction patterns in keratinocytes revealed morphologically and by FRET analysis | |
| Shtam et al. | Functional properties of circulating exosomes mediated by surface-attached plasma proteins | |
| Jiménez-Rojo et al. | Optical control of membrane fluidity modulates protein secretion | |
| Tian et al. | Cell-based glycoengineering of extracellular vesicles through precise genome editing | |
| Martins Freire et al. | Complete absence of GLUT1 does not impair human terminal erythroid differentiation | |
| Andronico et al. | Plasma membrane order maps functional diversity in immune cells | |
| Deshmukh et al. | SETD3 is a mechanosensitive enzyme that methylates actin on His73 to regulate mitochondrial dynamics and function | |
| Butler et al. | Integral protein linkage and the bilayer-skeletal separation energy in red blood cells |
Legal Events
| Date | Code | Title | Description |
|---|---|---|---|
| 121 | Ep: the epo has been informed by wipo that ep was designated in this application |
Ref document number: 23780982 Country of ref document: EP Kind code of ref document: A1 |
|
| ENP | Entry into the national phase |
Ref document number: 2024512845 Country of ref document: JP Kind code of ref document: A |
|
| WWE | Wipo information: entry into national phase |
Ref document number: 18851967 Country of ref document: US |
|
| WWE | Wipo information: entry into national phase |
Ref document number: 2023780982 Country of ref document: EP |
|
| ENP | Entry into the national phase |
Ref document number: 2023780982 Country of ref document: EP Effective date: 20241031 |
|
| NENP | Non-entry into the national phase |
Ref country code: DE |
|
| WWE | Wipo information: entry into national phase |
Ref document number: 202380043740.0 Country of ref document: CN |
|
| WWP | Wipo information: published in national office |
Ref document number: 202380043740.0 Country of ref document: CN |
|
| WWP | Wipo information: published in national office |
Ref document number: 18851967 Country of ref document: US |
|
| WWW | Wipo information: withdrawn in national office |
Ref document number: 2023780982 Country of ref document: EP |